
.2
© 2026 AAR CORP. All rights reserved worldwide. 1 Second Quarter Fiscal Year 2026 Earnings Call January 6, 2026
© 2026 AAR CORP. All rights reserved worldwide. 2 Note : All results and expectations in the presentation reflect continuing operations unless otherwise noted . This presentation contains certain statements relating to future results, which are forward - looking statements as that term is defined in the Private Securities Litigation Reform Act of 1995 , which reflect management’s expectations about future conditions, including, but not limited to, continued demand in the commercial and government aviation markets, anticipated activities and benefits under extended, expanded and new services, supply and distribution agreements, contributions from our acquisitions, production efficiencies in our hangars and progress on hangar expansions, continued sales growth, margin expansion, debt management, capital allocation and expenses . These forward - looking statements are based on the beliefs of Company management, as well as assumptions and estimates based on information available to the Company as of the dates such assumptions and estimates are made, and are subject to certain risks and uncertainties that could cause actual results to differ materially from historical results or those anticipated, depending on a variety of factors, including : ( i ) factors that adversely affect the commercial aviation industry ; (ii) adverse events and negative publicity in the aviation industry ; (iii) a reduction in sales to the U . S . government and its contractors ; (iv) cost overruns and losses on fixed - price contracts ; (v) nonperformance by subcontractors or suppliers ; (vi) our ability to manage our operational footprint ; (vii) a reduction in outsourcing of maintenance activity by airlines ; (viii) a shortage of skilled personnel or work stoppages ; (ix) competition from other companies ; (x) financial, operational and legal risks arising as a result of operating internationally ; (xi) inability to integrate acquisitions effectively and execute operational and financial plans related to the acquisitions ; (xii) failure to realize the anticipated benefits of acquisitions ; (xiii) circumstances associated with divestitures ; (xiv) inability to recover costs due to fluctuations in market values for aviation products and equipment ; (xv) cyber or other security threats or disruptions ; (xvi) a need to make significant capital expenditures to keep pace with technological developments in our industry ; (xvii) restrictions on use of intellectual property and tooling important to our business ; (xviii) inability to fully execute our stock repurchase program and return capital to stockholders ; (xix) limitations on our ability to access the debt and equity capital markets or to draw down funds under loan agreements ; (xx) our ability to manage our debt ; (xxi) non - compliance with restrictive and financial covenants contained in our debt and loan agreements ; (xxii) changes in or non - compliance with laws and regulations related to federal contractors, the aviation industry, international operations, safety, and environmental matters, and the costs of complying with such laws and regulations ; and (xxiii) exposure to product liability and property claims that may be in excess of our liability insurance coverage . Should one or more of those risks or uncertainties materialize adversely, or should underlying assumptions or estimates prove incorrect, actual results may vary materially from those described . For a discussion of these and other risks and uncertainties, refer to our Annual Report on Form 10 - K, Part I, “Item 1 A, Risk Factors” and our other filings filed from time to time with the U . S . Securities and Exchange Commission . We assume no obligation to update any forward - looking statements to reflect events or circumstances after the date of such statements or to reflect the occurrence of anticipated or unanticipated events, except as required by law . Non - GAAP Financial Measures : This presentation includes certain non - GAAP financial measures . Please refer to the Appendix for additional information on these non - GAAP financial measures and reconciliations to the most directly comparable GAAP financial measures . Unless otherwise noted, the statements made and the information provided in this presentation are as of January 6 , 2026 . Forward - looking Statements
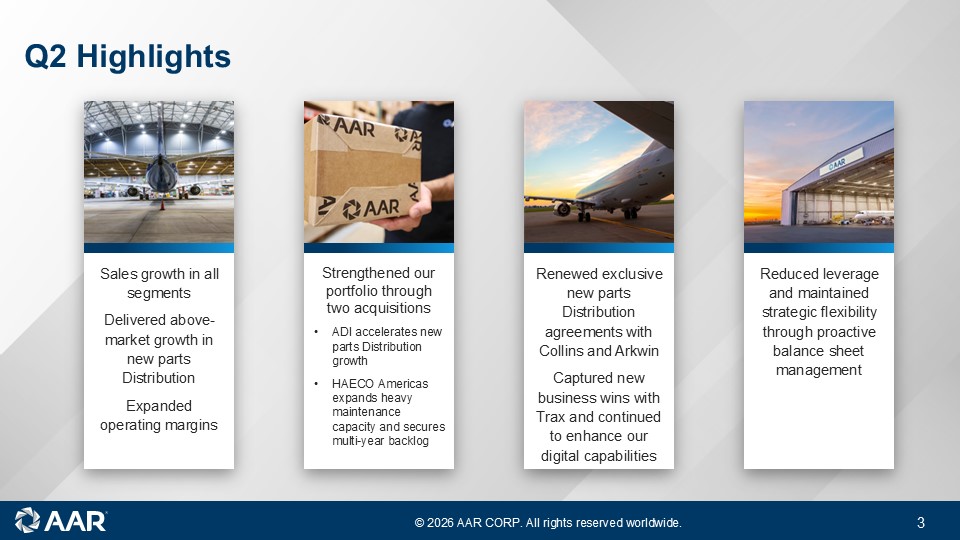
© 2026 AAR CORP. All rights reserved worldwide. 3 Q2 Highlights © 2026 AAR CORP. All rights reserved worldwide. 3 Strengthened our portfolio through two acquisitions • ADI accelerates new parts Distribution growth • HAECO Americas expands heavy maintenance capacity and secures multi - year backlog Sales growth in all segments Delivered above - market growth in new parts Distribution Expanded operating margins Renewed exclusive new parts Distribution agreements with Collins and Arkwin Captured new business wins with Trax and continued to enhance our digital capabilities Reduced leverage and maintained strategic flexibility through proactive balance sheet management
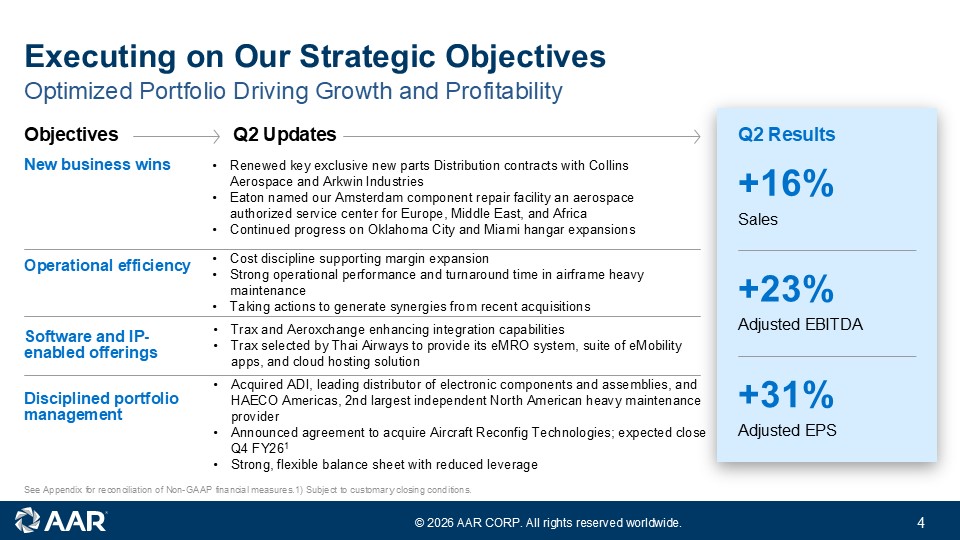
© 2026 AAR CORP. All rights reserved worldwide. 4 Optimized Portfolio Driving Growth and Profitability Executing on Our Strategic Objectives See Appendix for reconciliation of Non - GAAP financial measures.1) Subject to customary closing conditions. Objectives New business wins • Renewed key exclusive new parts Distribution contracts with Collins Aerospace and Arkwin Industries • Eaton named Amsterdam component repair facility an aerospace authorized service center for Europe, Middle East, and Africa • Continued progress on Oklahoma City and Miami hangar expansions Operational efficiency • Cost discipline supporting margin expansion • Strong operational performance and turnaround time in Airframe MRO • Taking actions to generate synergies from recent acquisitions Software and IP - enabled offerings • Trax and Aeroxchange enhancing integration capabilities • Trax selected by Thai Airways to provide its eMRO system, suite of eMobility apps, and cloud hosting solution Disciplined portfolio management • Acquired ADI, leading distributor of electronic components and assemblies, and HAECO Americas, 2nd largest independent North American heavy maintenance provider • Announced agreement to acquire Aircraft Reconfig Technologies; expected close Q4 FY26 1 • Strong, flexible balance sheet with reduced leverage Q2 Updates Q2 Results +16% Sales +23% Adjusted EBITDA +31% Adjusted EPS
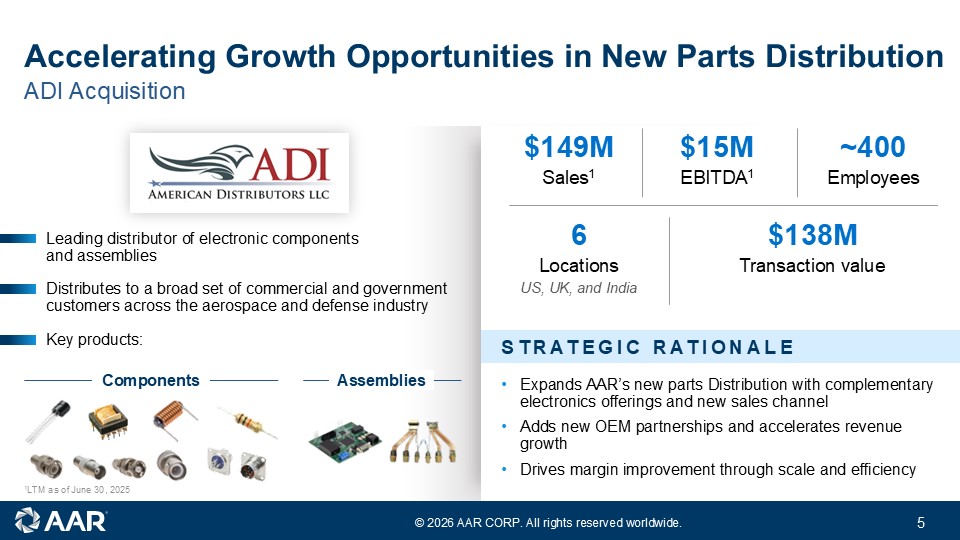
© 2026 AAR CORP. All rights reserved worldwide. 5 Accelerating Growth Opportunities in New Parts Distribution STRATEGIC RATIONALE • Expands AAR’s new parts Distribution with complementary electronics offerings and new sales channel • Adds new OEM partnerships and accelerates revenue growth • Drives margin improvement through scale and efficiency Leading distributor of electronic components and assemblies Distributes to a broad set of commercial and government customers across the aerospace and defense industry Key products: $149M Sales 1 $15M EBITDA 1 ~400 Employees $138M Transaction value 6 Locations US, UK, and India Components Assemblies 1 LTM as of June 30, 2025 ADI Acquisition
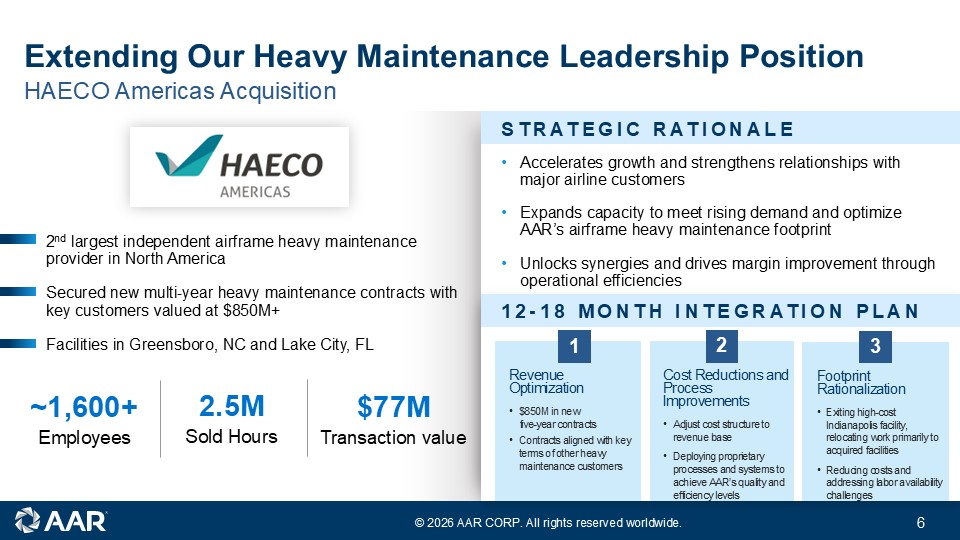
© 2026 AAR CORP. All rights reserved worldwide. 6 Extending Our Heavy Maintenance Leadership Position STRATEGIC RATIONALE • Accelerates growth and strengthens relationships with major airline customers • Expands capacity to meet rising demand and optimize AAR’s MRO footprint • Unlocks synergies and drives margin improvement through operational efficiencies 2 nd largest independent heavy maintenance provider in North America Secured new multi - year heavy maintenance contracts with key customers valued at $850M+ Facilities in Greensboro, NC and Lake City, FL HAECO Americas Acquisition ~1,600+ Employees $77M Transaction value 2.5M Sold Hours 1 2 3 Revenue Optimization • $850M in new five - year contracts • Contracts aligned with key terms of other heavy maintenance customers Cost Reductions and Process Improvements • Adjust cost structure to revenue base • Deploying proprietary processes and systems to achieve AAR’s quality and efficiency levels Footprint Rationalization • Exiting high - cost Indianapolis facility, relocating work primarily to acquired facilities • Reducing costs and addressing labor availability challenges 12 - 18 MONTH INTEGRATION PLAN
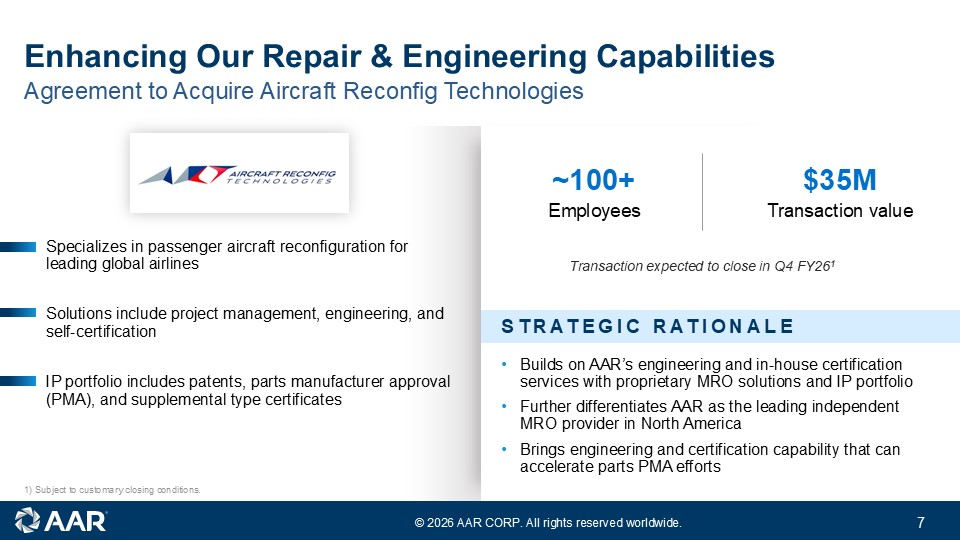
© 2026 AAR CORP. All rights reserved worldwide. 7 Enhancing Our Repair & Engineering Capabilities STRATEGIC RATIONALE • Builds on AAR’s engineering and in - house certification services with proprietary MRO solutions and IP portfolio • Further differentiates AAR as the leading independent MRO provider in North America • Brings engineering and certification capability that can accelerate parts PMA efforts Specializes in passenger aircraft reconfiguration for leading global airlines Solutions include project management, engineering, and certification IP portfolio includes patents, parts manufacturer approval (PMA), and supplemental type certificates ~100+ Employees $35M Transaction value Transaction expected to close in Q4 FY26 1 Agreement to Acquire Aircraft Reconfig Technologies 1) Subject to customary closing conditions.
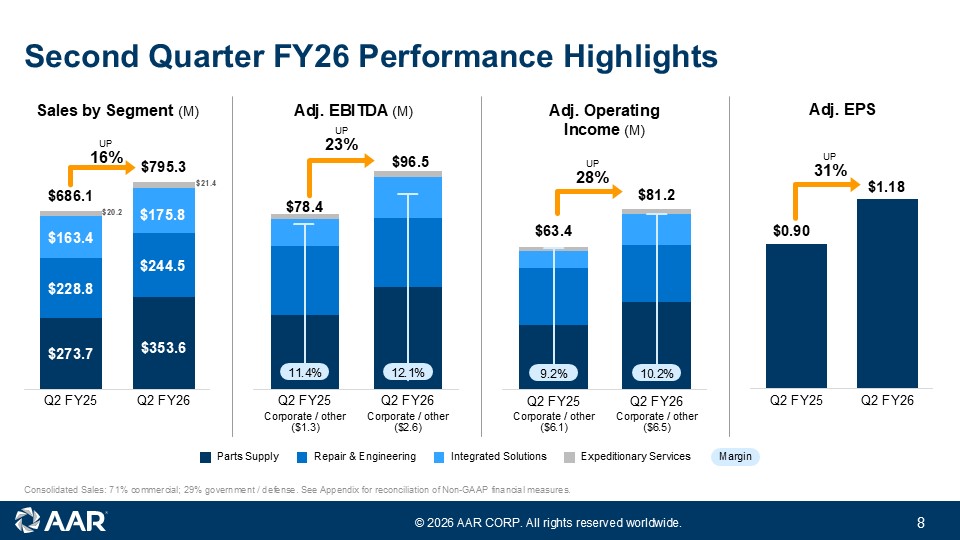
© 2026 AAR CORP. All rights reserved worldwide. 8 Second Quarter FY26 Performance Highlights Consolidated Sales: 71% commercial; 29% government / defense. See Appendix for reconciliation of Non - GAAP financial measures. Q2 FY25 Q2 FY26 Adj. EPS $0.90 $1.18 Parts Supply Integrated Solutions Repair & Engineering Expeditionary Services Margin Q2 FY25 Q2 FY26 $686.1 $795.3 Sales by Segment (M) $163.4 $175.8 $228.8 $244.5 $273.7 $353.6 $20.2 $21.4 Q2 FY25 Q2 FY26 Adj. Operating Income (M) Corporate / other ($6 .1 ) Corporate / other ($6 .5 ) $63.4 $81.2 10.2% 9.2% Q2 FY25 Q2 FY26 Corporate / other ($1.3) Corporate / other ($ 2.6 ) Adj. EBITDA (M) 12.1% 11.4% $78.4 $96.5 UP 16% UP 23% UP 28% UP 31%
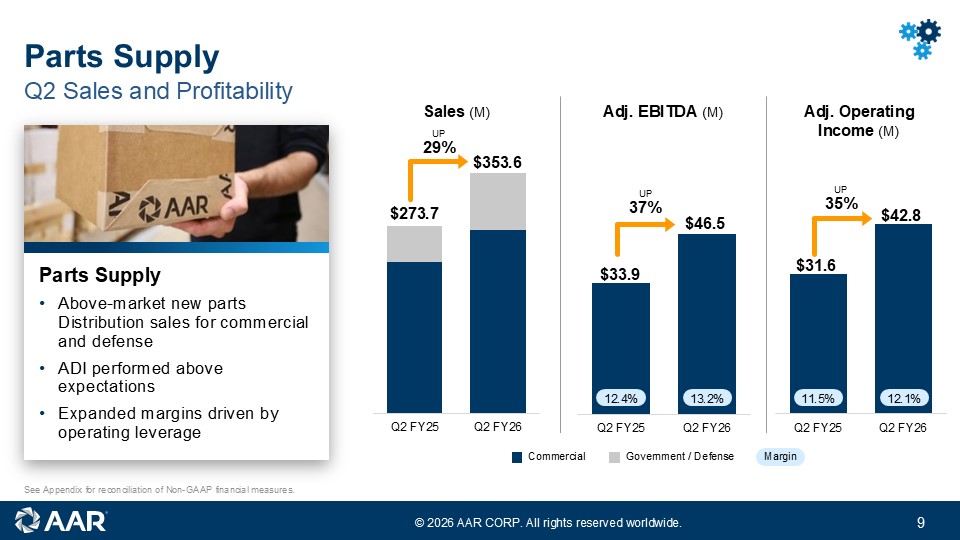
© 2026 AAR CORP. All rights reserved worldwide. 9 Q2 Sales and Profitability Parts Supply See Appendix for reconciliation of Non - GAAP financial measures. Sales (M) Adj. EBITDA (M) Commercial Government / Defense Margin Q2 FY25 Q2 FY26 $33.9 $46.5 Q2 FY25 Q2 FY26 $31.6 $42.8 Q2 FY25 Q2 FY26 $273.7 $353.6 12.4% 13.2% 11.5% 12.1% Parts Supply • Strong new parts Distribution sales for commercial and defense • ADI performed above expectations • Expanded margins driven by operating leverage Adj. Operating Income (M) UP 29% UP 37% UP 35%
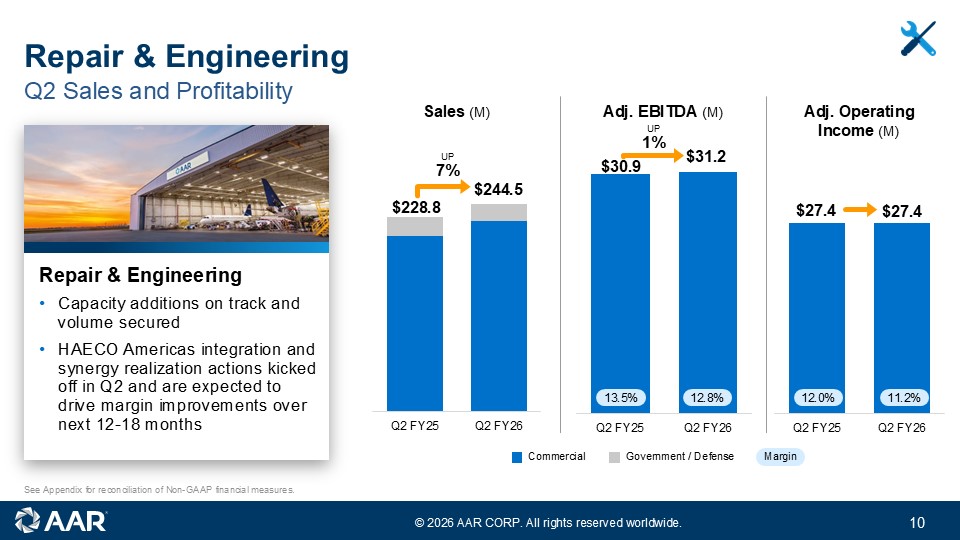
© 2026 AAR CORP. All rights reserved worldwide. 10 Q2 FY25 Q2 FY26 Q2 Sales and Profitability Repair & Engineering $228.8 $244.5 Sales (M) Adj. EBITDA (M) Commercial Government / Defense Margin Q2 FY25 Q2 FY26 $30.9 $31.2 Q2 FY25 Q2 FY26 $27.4 $27.4 13.5% 12.8% 12.0% 11.2% See Appendix for reconciliation of Non - GAAP financial measures. Adj. Operating Income (M) UP 1% FLAT UP 7% Repair & Engineering • Capacity additions on track and volume secured • HAECO Integration and synergy realization actions kicked off in Q2 and are expected to drive margin improvements over next 12 - 18 months
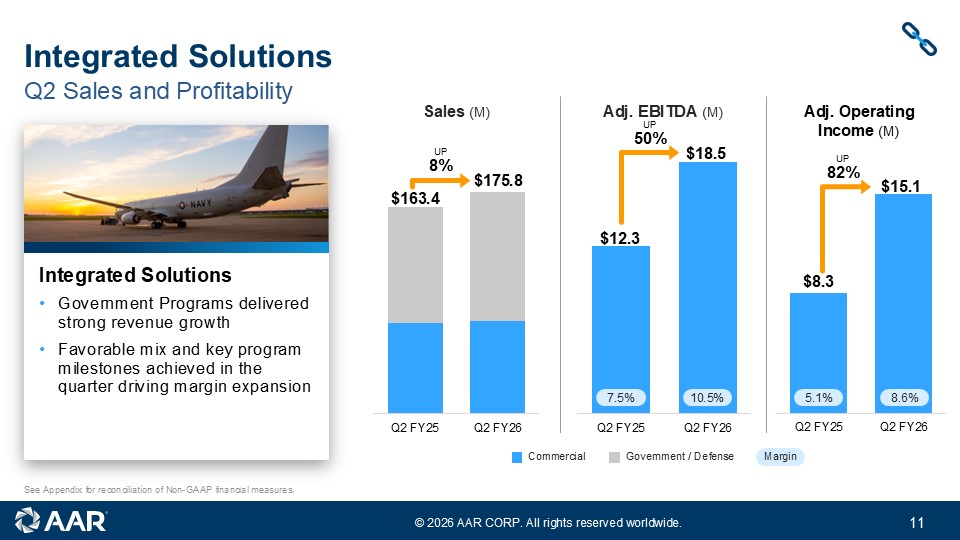
© 2026 AAR CORP. All rights reserved worldwide. 11 Sales (M) Adj. EBITDA (M) Q2 Sales and Profitability Integrated Solutions See Appendix for reconciliation of Non - GAAP financial measures. Q2 FY25 Q2 FY26 $8.3 $15.1 Q2 FY25 Q2 FY26 $12.3 $18.5 Q2 FY25 Q2 FY26 $163.4 $175.8 7.5% 10.5% 5.1% 8.6% Integrated Solutions • Government Programs delivered strong revenue growth • Favorable mix and key program milestones achieved in the quarter driving margin expansion Commercial Government / Defense Margin Adj. Operating Income (M) UP 8% UP 50% UP 82%
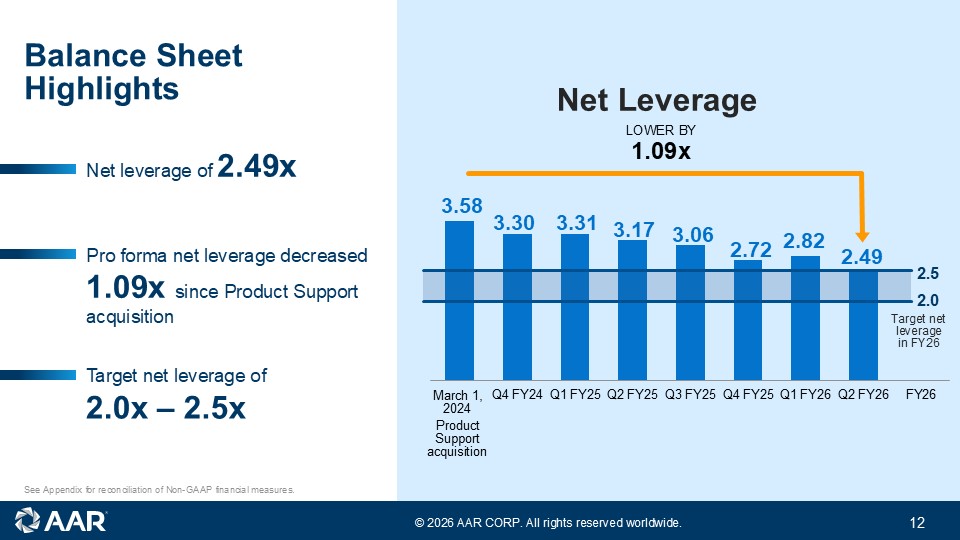
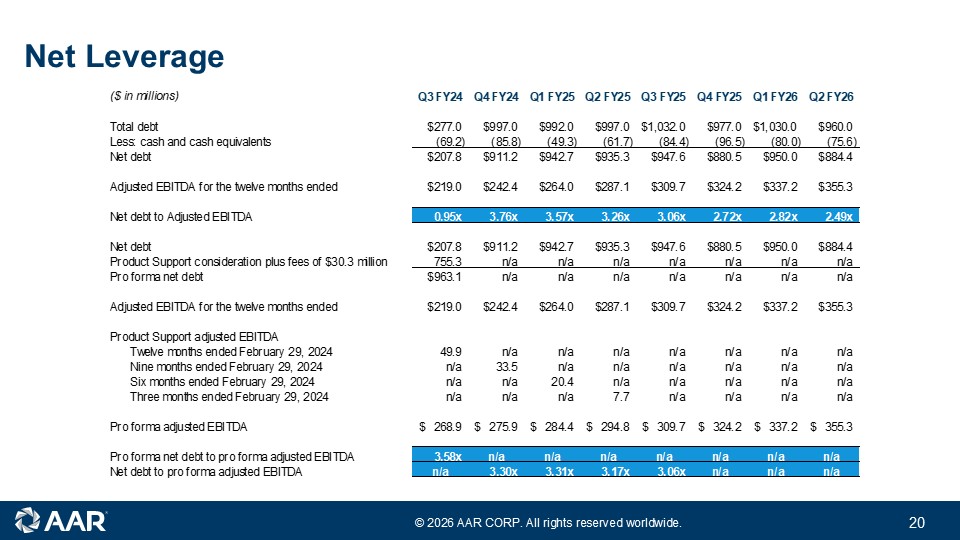
© 2026 AAR CORP. All rights reserved worldwide. 12 Balance Sheet Highlights See Appendix for reconciliation of Non - GAAP financial measures. Net Leverage Net leverage of 2.49x Pro forma net leverage decreased 1.09x since Product Support acquisition Target net leverage of 2.0x – 2.5x Q4 FY24 Q1 FY25 Q2 FY25 Q3 FY25 Q4 FY25 Q1 FY26 Q2 FY26 FY26 3.17 3.31 3.30 3.58 March 1, 2024 Product Support acquisition 3.06 2.72 Target net leverage in FY26 2.0 2.5 LOWER BY 1.09x 2.82 2.49
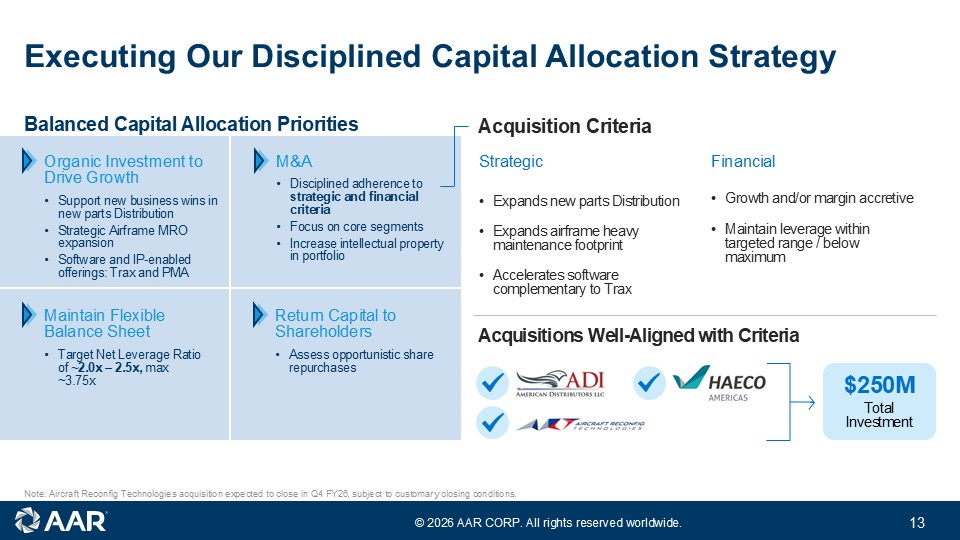
© 2026 AAR CORP. All rights reserved worldwide. 13 Executing Our Disciplined Capital Allocation Strategy Note: Aircraft Reconfig Technologies acquisition expected to close in Q4 FY26 , subject to customary closing conditions. Balanced Capital Allocation Priorities Organic Investment to Drive Growth • Support new business wins in new parts Distribution • Strategic Airframe MRO expansion • Software and IP - enabled offerings: Trax and PMA Acquisition Criteria Strategic • Expands new parts Distribution • Expands MRO footprint • Accelerates software complementary to Trax Financial • Growth and/or margin accretive • Maintain leverage within targeted range / below maximum Acquisitions Well - Aligned with Criteria $250M Total Investment Maintain Flexible Balance Sheet • Target Net Leverage Ratio of ~2.0x – 2.5x, max ~3.75x M&A • Disciplined adherence to strategic and financial criteria • Focus on core segments • Increase intellectual property in portfolio Return Capital to Shareholders • Assess opportunistic share repurchases
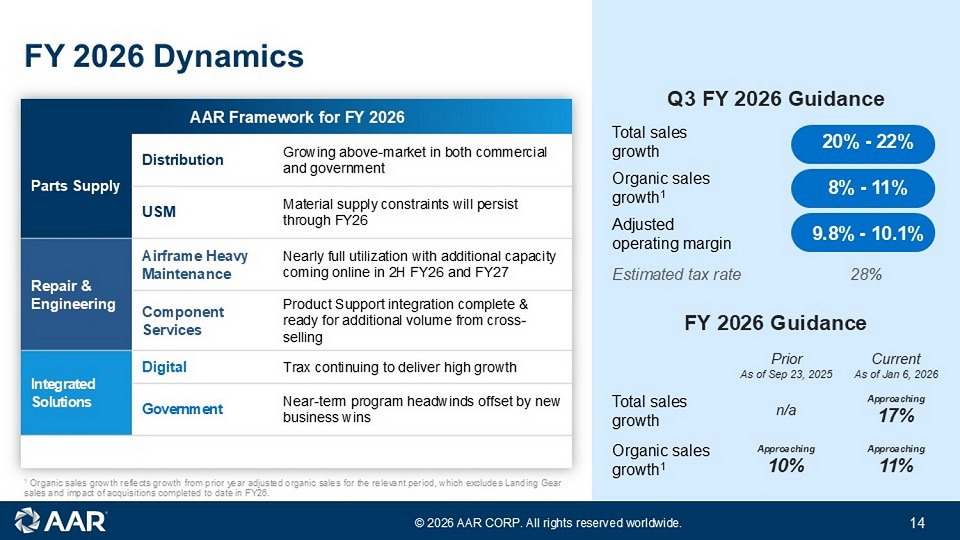
© 2026 AAR CORP. All rights reserved worldwide. 14 FY 2026 Dynamics AAR Framework for FY 2026 Growing above - market in both commercial and government Distribution Parts Supply Material supply constraints will persist through FY26 USM Full utilization with additional capacity coming online in 2H FY26 and FY27 Airframe MRO Repair & Engineering Product Support integration complete & ready for additional volume from cross - selling Component Services Trax continuing to deliver high growth Digital Integrated Solutions Near - term program headwinds offset by new business wins Government Q3 FY 2026 Guidance 1 Organic sales growth reflects growth from prior year adjusted organic sales for the relevant period, which excludes Landing G ea r sales and impact of acquisitions completed to date in FY26. FY 2026 Guidance 20% - 22% Total sales growth 8% - 11% Organic sales growth 1 9.8% - 10.1% Adjusted operating margin Estimated tax rate 28% Current As of Jan 6, 2026 Prior As of Sep 23, 2025 Approaching 11% Approaching 10% Organic sales growth 1

© 2026 AAR CORP. All rights reserved worldwide. 15 Appendix
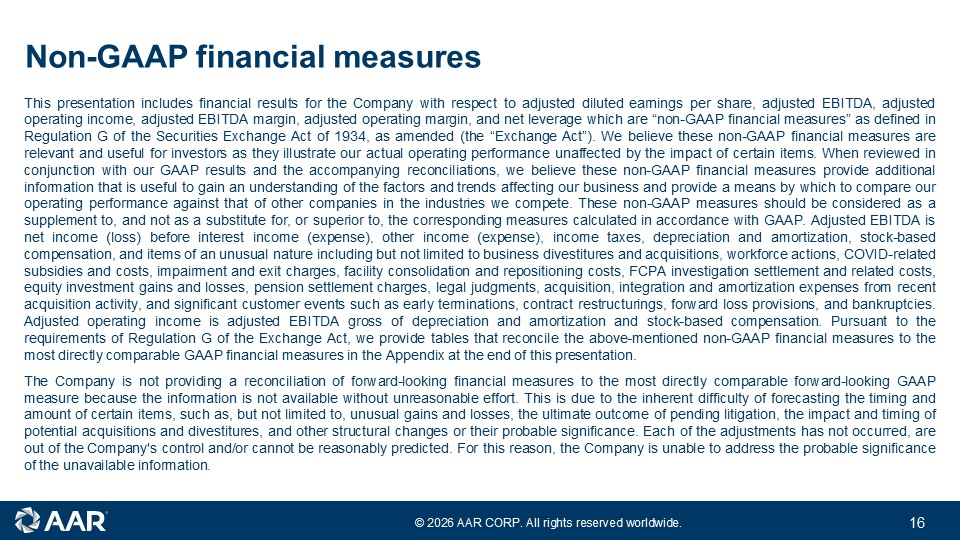
© 2026 AAR CORP. All rights reserved worldwide. 16 Non - GAAP financial measures This presentation includes financial results for the Company with respect to adjusted diluted earnings per share, adjusted EBITDA , adjusted operating income, adjusted EBITDA margin, adjusted operating margin, and net leverage which are “non - GAAP financial measures” as defined in Regulation G of the Securities Exchange Act of 1934 , as amended (the “Exchange Act”) . We believe these non - GAAP financial measures are relevant and useful for investors as they illustrate our actual operating performance unaffected by the impact of certain items . When reviewed in conjunction with our GAAP results and the accompanying reconciliations, we believe these non - GAAP financial measures provide additional information that is useful to gain an understanding of the factors and trends affecting our business and provide a means by which to compare our operating performance against that of other companies in the industries we compete . These non - GAAP measures should be considered as a supplement to, and not as a substitute for, or superior to, the corresponding measures calculated in accordance with GAAP . Adjusted EBITDA is net income (loss) before interest income (expense), other income (expense), income taxes, depreciation and amortization, stock - based compensation, and items of an unusual nature including but not limited to business divestitures and acquisitions, workforce actions, COVID - related subsidies and costs, impairment and exit charges, facility consolidation and repositioning costs, FCPA investigation settlement and related costs, equity investment gains and losses, pension settlement charges, legal judgments, acquisition, integration and amortization expenses from recent acquisition activity, and significant customer events such as early terminations, contract restructurings, forward loss provisions, and bankruptcies . Adjusted operating income is adjusted EBITDA gross of depreciation and amortization and stock - based compensation . Pursuant to the requirements of Regulation G of the Exchange Act, we provide tables that reconcile the above - mentioned non - GAAP financial measures to the most directly comparable GAAP financial measures in the Appendix at the end of this presentation . The Company is not providing a reconciliation of forward - looking financial measures to the most directly comparable forward - looking GAAP measure because the information is not available without unreasonable effort . This is due to the inherent difficulty of forecasting the timing and amount of certain items, such as, but not limited to, unusual gains and losses, the ultimate outcome of pending litigation, the impact and timing of potential acquisitions and divestitures, and other structural changes or their probable significance . Each of the adjustments has not occurred, are out of the Company's control and/or cannot be reasonably predicted . For this reason, the Company is unable to address the probable significance of the unavailable information .
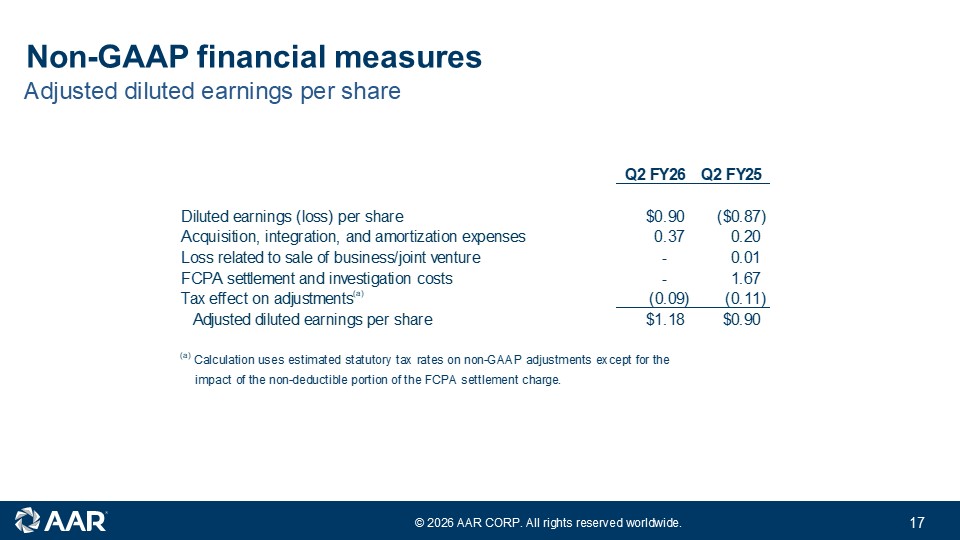
© 2026 AAR CORP. All rights reserved worldwide. 17 Adjusted diluted earnings per share Non - GAAP financial measures Q2 FY26 Q2 FY25 Diluted earnings (loss) per share $0.90 ($0.87) Acquisition, integration, and amortization expenses 0.37 0.20 Loss related to sale of business/joint venture - 0.01 FCPA settlement and investigation costs - 1.67 Tax effect on adjustments (a) (0.09) (0.11) Adjusted diluted earnings per share $1.18 $0.90 (a) Calculation uses estimated statutory tax rates on non-GAAP adjustments except for the impact of the non-deductible portion of the FCPA settlement charge.
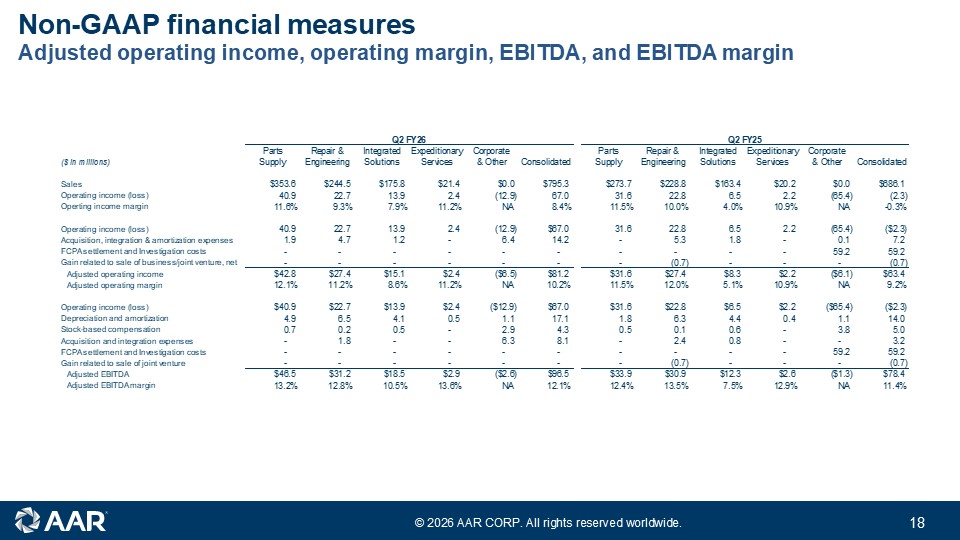
© 2026 AAR CORP. All rights reserved worldwide. 18 Non - GAAP financial measures A djusted operating income, operating margin, EBITDA, and EBITDA margin © 2024 AAR CORP. All rights reserved worldwide. Q2 FY26 Q2 FY25 Parts Repair & Integrated Expeditionary Corporate Parts Repair & Integrated Expeditionary Corporate ($ in millions) Supply Engineering Solutions Services & Other Consolidated Supply Engineering Solutions Services & Other Consolidated Sales $353.6 $244.5 $175.8 $21.4 $0.0 $795.3 $273.7 $228.8 $163.4 $20.2 $0.0 $686.1 Operating income (loss) 40.9 22.7 13.9 2.4 (12.9) 67.0 31.6 22.8 6.5 2.2 (65.4) (2.3) Operting income margin 11.6% 9.3% 7.9% 11.2% NA 8.4% 11.5% 10.0% 4.0% 10.9% NA -0.3% Operating income (loss) 40.9 22.7 13.9 2.4 (12.9) $67.0 31.6 22.8 6.5 2.2 (65.4) ($2.3) Acquisition, integration & amortization expenses 1.9 4.7 1.2 - 6.4 14.2 - 5.3 1.8 - 0.1 7.2 FCPA settlement and Investigation costs - - - - - - - - - - 59.2 59.2 Gain related to sale of business/joint venture, net - - - - - - - (0.7) - - - (0.7) Adjusted operating income $42.8 $27.4 $15.1 $2.4 ($6.5) $81.2 $31.6 $27.4 $8.3 $2.2 ($6.1) $63.4 Adjusted operating margin 12.1% 11.2% 8.6% 11.2% NA 10.2% 11.5% 12.0% 5.1% 10.9% NA 9.2% Operating income (loss) $40.9 $22.7 $13.9 $2.4 ($12.9) $67.0 $31.6 $22.8 $6.5 $2.2 ($65.4) ($2.3) Depreciation and amortization 4.9 6.5 4.1 0.5 1.1 17.1 1.8 6.3 4.4 0.4 1.1 14.0 Stock-based compensation 0.7 0.2 0.5 - 2.9 4.3 0.5 0.1 0.6 - 3.8 5.0 Acquisition and integration expenses - 1.8 - - 6.3 8.1 - 2.4 0.8 - - 3.2 FCPA settlement and Investigation costs - - - - - - - - - - 59.2 59.2 Gain related to sale of joint venture - - - - - - - (0.7) - - - (0.7) Adjusted EBITDA $46.5 $31.2 $18.5 $2.9 ($2.6) $96.5 $33.9 $30.9 $12.3 $2.6 ($1.3) $78.4 Adjusted EBITDA margin 13.2% 12.8% 10.5% 13.6% NA 12.1% 12.4% 13.5% 7.5% 12.9% NA 11.4%
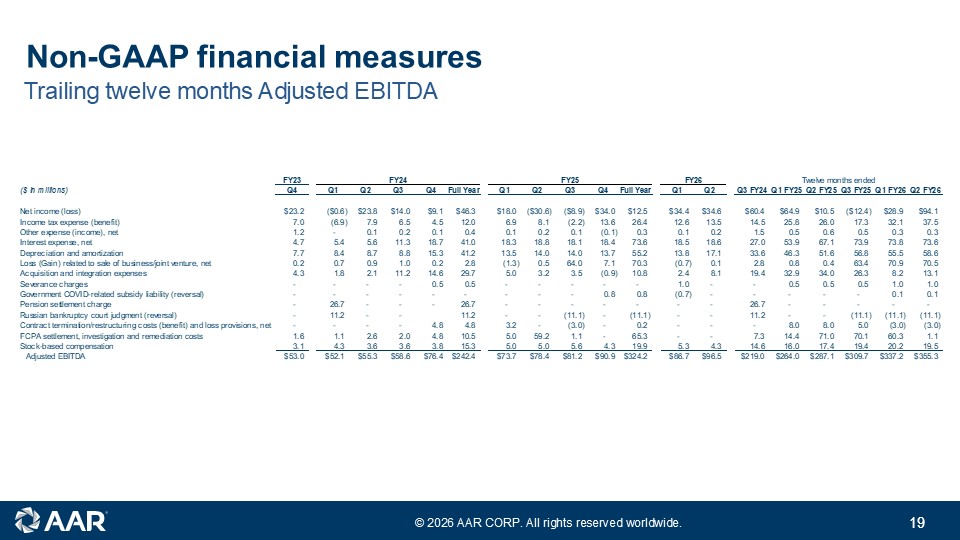
© 2026 AAR CORP. All rights reserved worldwide. 19 Trailing twelve months Adjusted EBITDA Non - GAAP financial measures 19 FY23 ($ in millions) Q4 Q1 Q2 Q3 Q4 Full Year Q1 Q2 Q3 Q4 Full Year Q1 Q2 Q3 FY24Q1 FY25Q2 FY25Q3 FY25Q1 FY26Q2 FY26 Net income (loss) $23.2 ($0.6) $23.8 $14.0 $9.1 $46.3 $18.0 ($30.6) ($8.9) $34.0 $12.5 $34.4 $34.6 $60.4 $64.9 $10.5 ($12.4) $28.9 $94.1 Income tax expense (benefit) 7.0 (6.9) 7.9 6.5 4.5 12.0 6.9 8.1 (2.2) 13.6 26.4 12.6 13.5 14.5 25.8 26.0 17.3 32.1 37.5 Other expense (income), net 1.2 - 0.1 0.2 0.1 0.4 0.1 0.2 0.1 (0.1) 0.3 0.1 0.2 1.5 0.5 0.6 0.5 0.3 0.3 Interest expense, net 4.7 5.4 5.6 11.3 18.7 41.0 18.3 18.8 18.1 18.4 73.6 18.5 18.6 27.0 53.9 67.1 73.9 73.8 73.6 Depreciation and amortization 7.7 8.4 8.7 8.8 15.3 41.2 13.5 14.0 14.0 13.7 55.2 13.8 17.1 33.6 46.3 51.6 56.8 55.5 58.6 Loss (Gain) related to sale of business/joint venture, net 0.2 0.7 0.9 1.0 0.2 2.8 (1.3) 0.5 64.0 7.1 70.3 (0.7) 0.1 2.8 0.8 0.4 63.4 70.9 70.5 Acquisition and integration expenses 4.3 1.8 2.1 11.2 14.6 29.7 5.0 3.2 3.5 (0.9) 10.8 2.4 8.1 19.4 32.9 34.0 26.3 8.2 13.1 Severance charges - - - - 0.5 0.5 - - - - - 1.0 - - 0.5 0.5 0.5 1.0 1.0 Government COVID-related subsidy liability (reversal) - - - - - - - - - 0.8 0.8 (0.7) - - - - - 0.1 0.1 Pension settlement charge - 26.7 - - - 26.7 - - - - - - - 26.7 - - - - - Russian bankruptcy court judgment (reversal) - 11.2 - - 11.2 - - (11.1) - (11.1) - - 11.2 - - (11.1) (11.1) (11.1) Contract termination/restructuring costs (benefit) and loss provisions, net - - - - 4.8 4.8 3.2 - (3.0) - 0.2 - - - 8.0 8.0 5.0 (3.0) (3.0) FCPA settlement, investigation and remediation costs 1.6 1.1 2.6 2.0 4.8 10.5 5.0 59.2 1.1 - 65.3 - - 7.3 14.4 71.0 70.1 60.3 1.1 Stock-based compensation 3.1 4.3 3.6 3.6 3.8 15.3 5.0 5.0 5.6 4.3 19.9 5.3 4.3 14.6 16.0 17.4 19.4 20.2 19.5 Adjusted EBITDA $53.0 $52.1 $55.3 $58.6 $76.4 $242.4 $73.7 $78.4 $81.2 $90.9 $324.2 $86.7 $96.5 $219.0 $264.0 $287.1 $309.7 $337.2 $355.3 FY24 FY25 FY26 Twelve months ended
© 2026 AAR CORP. All rights reserved worldwide. 20 Net Leverage ($ in millions) Q3 FY24 Q4 FY24 Q1 FY25 Q2 FY25 Q3 FY25 Q4 FY25 Q1 FY26 Q2 FY26 Total debt $277.0 $997.0 $992.0 $997.0 $1,032.0 $977.0 $1,030.0 $960.0 Less: cash and cash equivalents (69.2) (85.8) (49.3) (61.7) (84.4) (96.5) (80.0) (75.6) Net debt $207.8 $911.2 $942.7 $935.3 $947.6 $880.5 $950.0 $884.4 Adjusted EBITDA for the twelve months ended $219.0 $242.4 $264.0 $287.1 $309.7 $324.2 $337.2 $355.3 Net debt to Adjusted EBITDA 0.95x 3.76x 3.57x 3.26x 3.06x 2.72x 2.82x 2.49x Net debt $207.8 $911.2 $942.7 $935.3 $947.6 $880.5 $950.0 $884.4 Product Support consideration plus fees of $30.3 million 755.3 n/a n/a n/a n/a n/a n/a n/a Pro forma net debt $963.1 n/a n/a n/a n/a n/a n/a n/a Adjusted EBITDA for the twelve months ended $219.0 $242.4 $264.0 $287.1 $309.7 $324.2 $337.2 $355.3 Product Support adjusted EBITDA Twelve months ended February 29, 2024 49.9 n/a n/a n/a n/a n/a n/a n/a Nine months ended February 29, 2024 n/a 33.5 n/a n/a n/a n/a n/a n/a Six months ended February 29, 2024 n/a n/a 20.4 n/a n/a n/a n/a n/a Three months ended February 29, 2024 n/a n/a n/a 7.7 n/a n/a n/a n/a Pro forma adjusted EBITDA 268.9$ 275.9$ 284.4$ 294.8$ 309.7$ 324.2$ 337.2$ 355.3$ Pro forma net debt to pro forma adjusted EBITDA 3.58x n/a n/a n/a n/a n/a n/a n/a Net debt to pro forma adjusted EBITDA n/a 3.30x 3.31x 3.17x 3.06x n/a n/a n/a