
.2
© 2026 AAR CORP. All rights reserved worldwide Acquisition of Controlling Interest in MRO Holdings & First Quarter Fiscal Year 2027 Earnings September 29, 2026
Disclaimer Note : All results and expectations in the presentation reflect continuing operations unless otherwise noted . The information contained herein has been prepared solely for informational purposes and is not to be construed as a solicitation or an offer to buy or sell any securities and should not be treated as giving investment advice . It is not targeted to the specific investment objectives, financial situation or particular needs of any recipient . No representations or warranties, express or implied, are given in, or in respect of, this presentation . To the fullest extent permitted by law, in no circumstances with AAR CORP . , MRO Holdings or any of their respective subsidiaries, equity holders, affiliates, representatives, partners, directors, officers, employees, advisors or agents be responsible or liable for any direct, indirect or consequential loss or loss of profit arising from the use of this presentation, its contents, its omissions, reliance on the information contained within it, or on opinions communicated in relation thereto or otherwise arising in connection therewith . Forward - Looking Statements This presentation contains certain forward - looking statements as that term is defined in the Private Securities Litigation Reform Act of 1995 . Forward - looking statements often address our expected future operating and financial performance and financial condition, or targets, goals, commitments, and other business plans, and often may also be identified because they contain words such as “anticipate,” “continue,” “estimate,” “expect,” “project,” “plan,” “potential,” “predict,” “intend,” “believe,” “may,” “might,” “will,” “would,” “should,” “seek,” “could,” “positions,” “likely,” “target,” “goal,” “strategy” or similar expressions and the negatives of those terms . These forward - looking statements are subject to certain risks and uncertainties that may cause actual results to differ materially from historical results or those anticipated, depending on a variety of factors, including : factors that adversely affect the commercial aviation industry ; adverse events and negative publicity in the aviation industry ; a reduction in sales to the U . S . government and its contractors ; cost overruns and losses on fixed - price contracts ; nonperformance by subcontractors or suppliers ; our ability to manage our operational footprint ; a reduction in outsourcing of maintenance and repair activity by airlines ; a shortage of skilled personnel or work stoppages ; competition from other companies ; financial, operational and legal risks arising as a result of operating internationally ; the failure to complete, integrate and realize the anticipated benefits of acquisitions, including execution of related operational and financial plans ; circumstances associated with divestitures ; the inability to recover costs due to fluctuations in market values for aviation products and equipment ; cyber or other security threats or disruptions ; the need to make significant capital expenditures to keep pace with technological developments in our industry ; restrictions on the use of intellectual property and tooling important to our business ; the inability to protect the value of our intellectual property ; our ability to manage our debt and fund our other liquidity needs ; limitations on our ability to access the debt and equity capital markets or to draw down funds under loan agreements ; non - compliance with restrictive and financial covenants contained in our debt and loan agreements ; changes in or non - compliance with laws and regulations related to federal contractors, the aviation industry, international operations, safety and environmental matters, and the costs of complying with such laws and regulations ; exposure to product liability and property claims that may be in excess of our liability insurance coverage ; the risk that the acquisition may not be completed in a timely manner or at all ; the failure to satisfy the closing conditions to the acquisition, including the receipt of required regulatory approvals ; the occurrence of any event, change or other circumstance or condition that could give rise to the termination of the Share Purchase Agreement governing the acquisition, including in certain circumstances requiring the Company to pay a termination fee ; the ability of the Company to obtain the necessary financing arrangements ; the effect of the announcement or pendency of the acquisition on the Company’s business relationships, operating results and business generally ; risks that the acquisition may disrupt the Company’s current business plans and operations ; the Company’s ability to retain and hire key personnel in light of the acquisition ; risks related to diverting management’s attention from the Company’s ongoing business operations ; unexpected costs, charges or expenses resulting from the acquisition ; potential litigation relating to the acquisition ; the ability of the Company to successfully integrate MRO Holdings and its subsidiaries following the Closing and to achieve the anticipated benefits of the acquisition, including estimated cost and operational synergies, and the timeline to realize such benefits ; the effects of the acquisition on the Company’s earnings, financial condition, net leverage ratio and credit ratings ; the risk that the conditions to the closing of the PIPE transaction are not satisfied ; the fact that the PIPE transaction may cause dilution to the Company’s existing stockholders ; the impact of the acquisition on the Company’s business and future financial condition and operating results, including the ability of the Company or MRO Holdings to repay or prepay indebtedness incurred in connection with the transaction or otherwise ; and other factors disclosed in the section entitled “Risk Factors” of the Company’s Annual Report on Form 10 - K for the fiscal year ended May 31 , 2026 , as may be updated or supplemented by any subsequent filings with the SEC . In particular, forward - looking statements in this presentation include statements regarding our second quarter and FY 2027 guidance, the expected achievement of run - rate cost synergies, anticipated accretion to Adj . EPS, expected expansion of Adj . EBITDA margins, expected leverage at, and following, the closing of the transaction, expected financial results of MRO Holdings for fiscal year 2026 , ending December 31 , 2026 , estimated $ 150 million tax benefits and anticipated accretion to AAR CORP . 's Adj . EBITDA margin targets . There can be no assurance that any of these outcomes will occur or will be achieved within the expected timeframes or at the levels anticipated . Should one or more of these risks or uncertainties materialize adversely, or should underlying assumptions or estimates prove incorrect, actual results may vary materially from those described . The Company derives many of its forward - looking statements from its operating budgets and forecasts, which are based on many detailed assumptions . While the Company believes that its assumptions are reasonable, it cautions that it is very difficult to predict the impact of known factors, and it is impossible to anticipate all factors that could affect actual results . These events and uncertainties are difficult or impossible to predict accurately and many are beyond the Company’s control . The risks described in these reports are not the only risks the Company faces, as additional risks and uncertainties not currently known or foreseeable or deemed immaterial may materially adversely affect the Company’s business, financial condition or results of operations in future periods . All forward - looking statements attributable to the Company, or persons acting on its behalf, are expressly qualified in their entirety by the foregoing cautionary statements . The forward - looking statements included in this presentation are made only as of the date hereof . The Company assumes no obligation to update or revise any forward - looking statement, whether as a result of new information, future events or otherwise, except as required by law . Presentation Materials : The statements included and the information provided in this presentation are made as of the date of this presentation unless otherwise noted . MRO Holdings Financial Information : This presentation contains certain adjusted financial information of MRO Holdings as of fiscal year 2025 . Such financial information is based on management’s estimates and has not been audited or reviewed by independent accountants . Non - GAAP Financial Measures : This presentation includes certain non - GAAP financial measures . Please refer to the Appendix for additional information on these non - GAAP financial measures and reconciliations to the comparable GAAP measures . AAR CORP . is not providing a reconciliation of forward - looking non - GAAP financial measures to the most directly comparable forward - looking GAAP measure because the information is not available without unreasonable effort . This is due to the inherent difficulty of forecasting the timing and amount of certain items, such as, but not limited to, unusual gains and losses, the ultimate outcome of pending litigation, the impact and timing of potential acquisitions and divestitures, and other structural changes or their probable significance . Each of the adjustments has not occurred, are out of AAR CORP . ’s control, and/or cannot be reasonably predicted . For this reason, AAR CORP . is unable to address the probable significance of the unavailable information . Intellectual Property : This presentation may contain trademarks, service marks, trade names and copyrights of other companies, which are the property of their respective owners, and the use herein does not imply an affiliation with or endorsement by the owners of these trademarks, service marks, tradenames and copyrights . Solely for convenience, some of the trademarks, service marks, trade names and copyrights referred to in this presentation may be listed without the TM, SM, ©, or ® symbols, but AAR CORP . will assert, to the fullest extent under applicable law, the rights of the applicable owners, if any, to these trademarks, service marks, trade names, and copyrights . Third - party logos included herein may represent past customers, present customers, competitors, or may be provided simply for illustrative purposes only . Inclusion of such logos does not necessarily imply affiliation with or endorsement by such firms or businesses . There is no guarantee that AAR CORP . will work, or continue to work, with any of the firms or businesses whose logos are included herein . © 2026 AAR CORP. All rights reserved worldwide 2
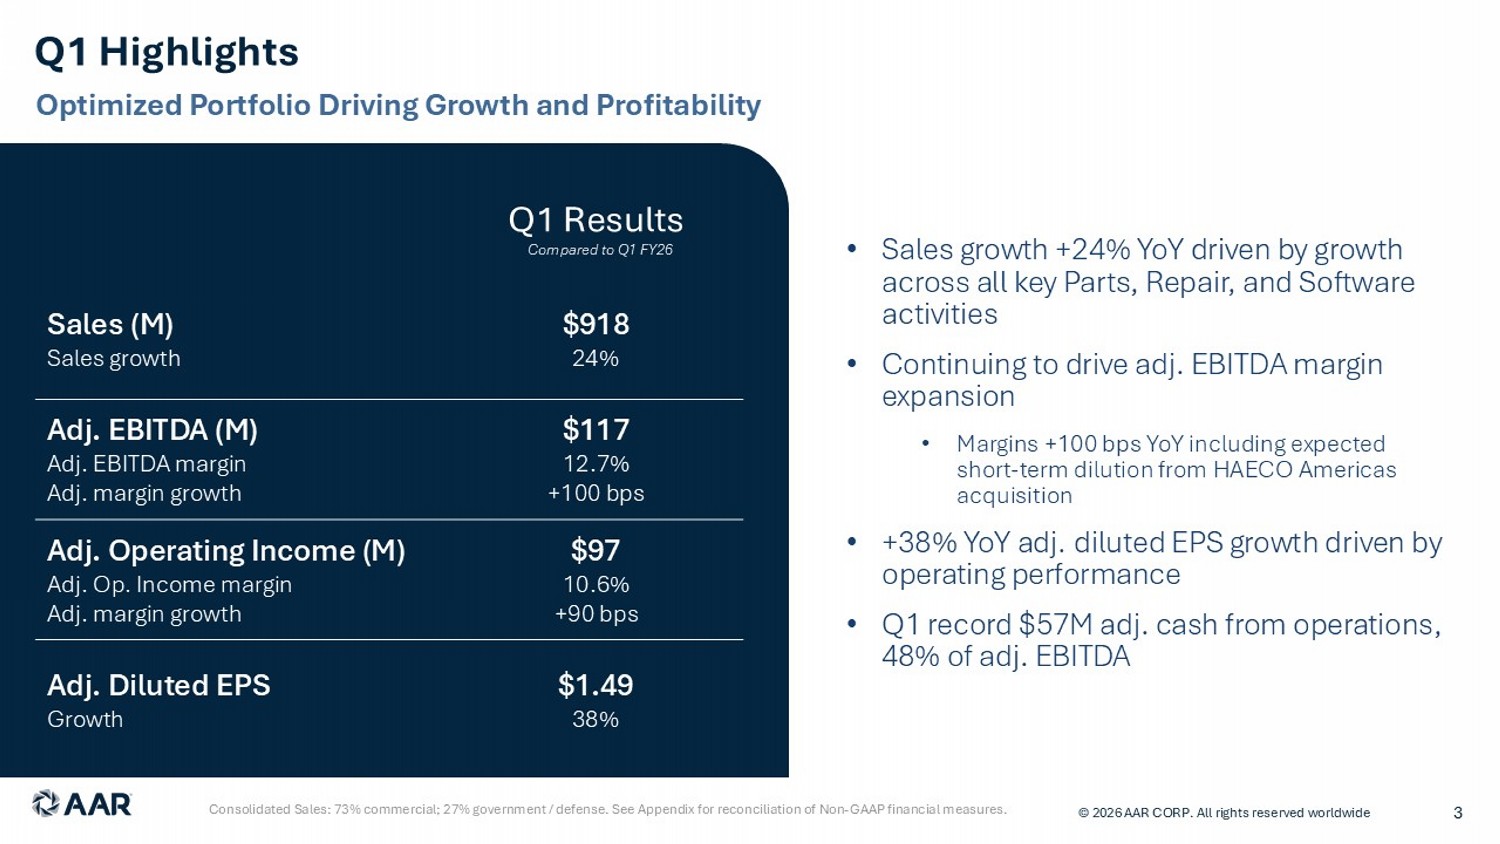
Q1 Highlights © 2026 AAR CORP. All rights reserved worldwide 3 Consolidated Sales: 73% commercial; 27% government / defense. See Appendix for reconciliation of Non - GAAP financial measures. Optimized Portfolio Driving Growth and Profitability Q1 Results $918 24% Sales (M) Sales growth $117 12.7% +100 bps Adj. EBITDA (M) Adj. EBITDA margin Adj. margin growth $97 10.6% +90 bps Adj. Operating Income (M) Adj. Op. Income margin Adj. margin growth $1.49 38% Adj. Diluted EPS Growth • Sales growth +24% YoY driven by growth across all key Parts, Repair, and Software activities • Continuing to drive adj. EBITDA margin expansion • Margins +100 bps YoY including expected short - term dilution from HAECO Americas acquisition • +38% YoY adj. diluted EPS growth driven by operating performance • Q1 record $57M adj. cash from operations , 48% of adj. EBITDA Compared to Q1 FY26
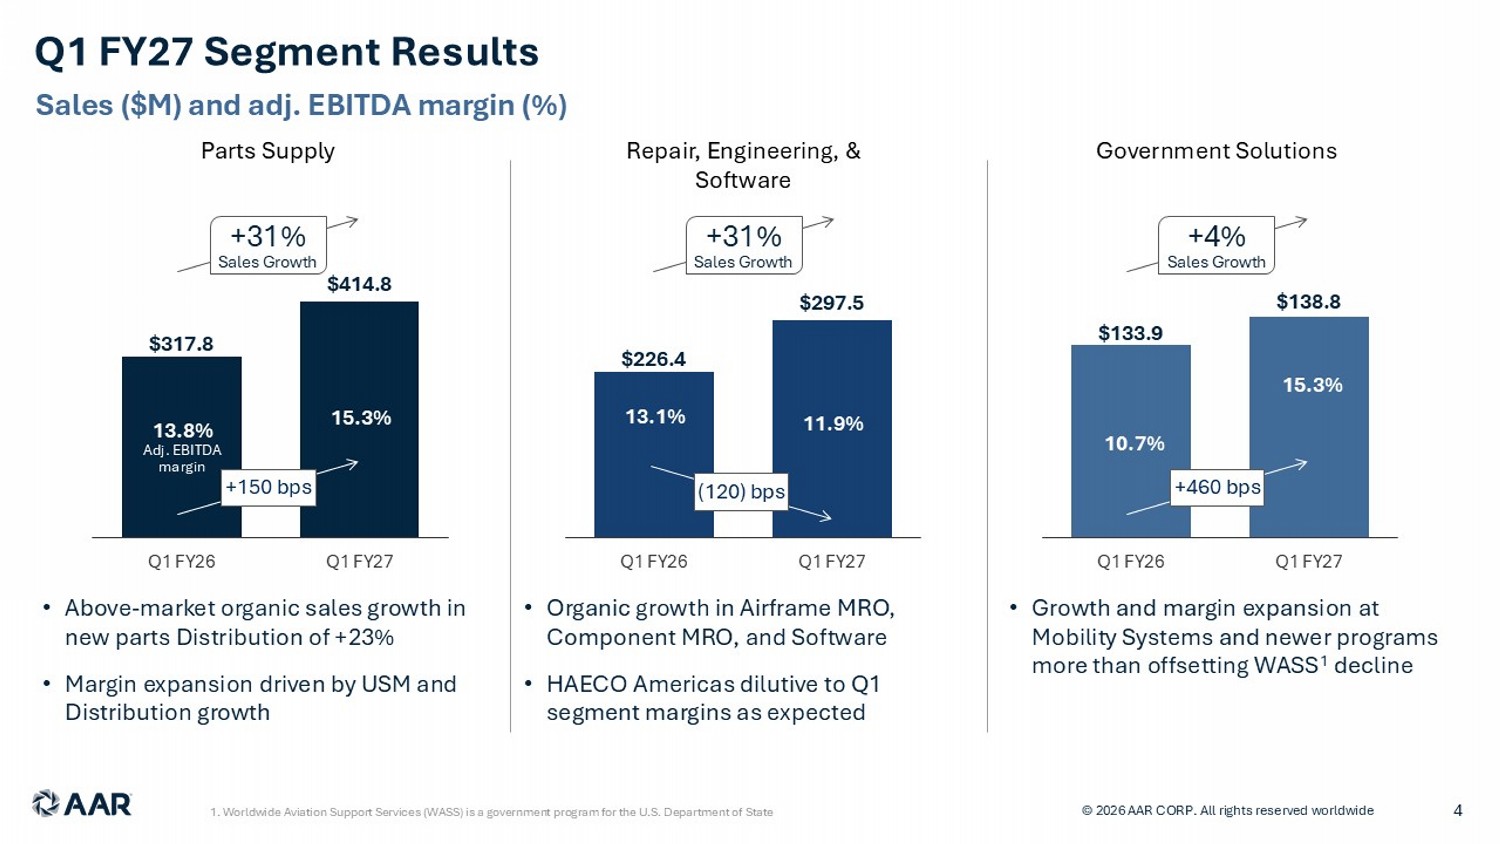
Q1 FY27 Segment Results © 2026 AAR CORP. All rights reserved worldwide 4 $317.8 $414.8 Q1 FY26 Q1 FY27 Parts Supply +31% Sales Growth Repair, Engineering, & Software +31% Sales Growth Government Solutions +4% Sales Growth • Above - market organic sales growth in new parts Distribution of +23% • Margin expansion driven by USM and Distribution growth • Organic growth in Airframe MRO, Component MRO, and Software • HAECO Americas dilutive to Q1 segment margins as expected • Growth and margin expansion at Mobility Systems and newer programs more than offsetting WASS 1 decline $226.4 $297.5 Q1 FY26 Q1 FY27 $133.9 $138.8 Q1 FY26 Q1 FY27 Sales ($M) and adj. EBITDA margin (%) 1. Worldwide Aviation Support Services (WASS) is a government program for the U.S. Department of State 13.8% Adj. EBITDA margin 15.3% 13.1% 11.9% 10.7% 15.3% +150 bps (120) bps +460 bps
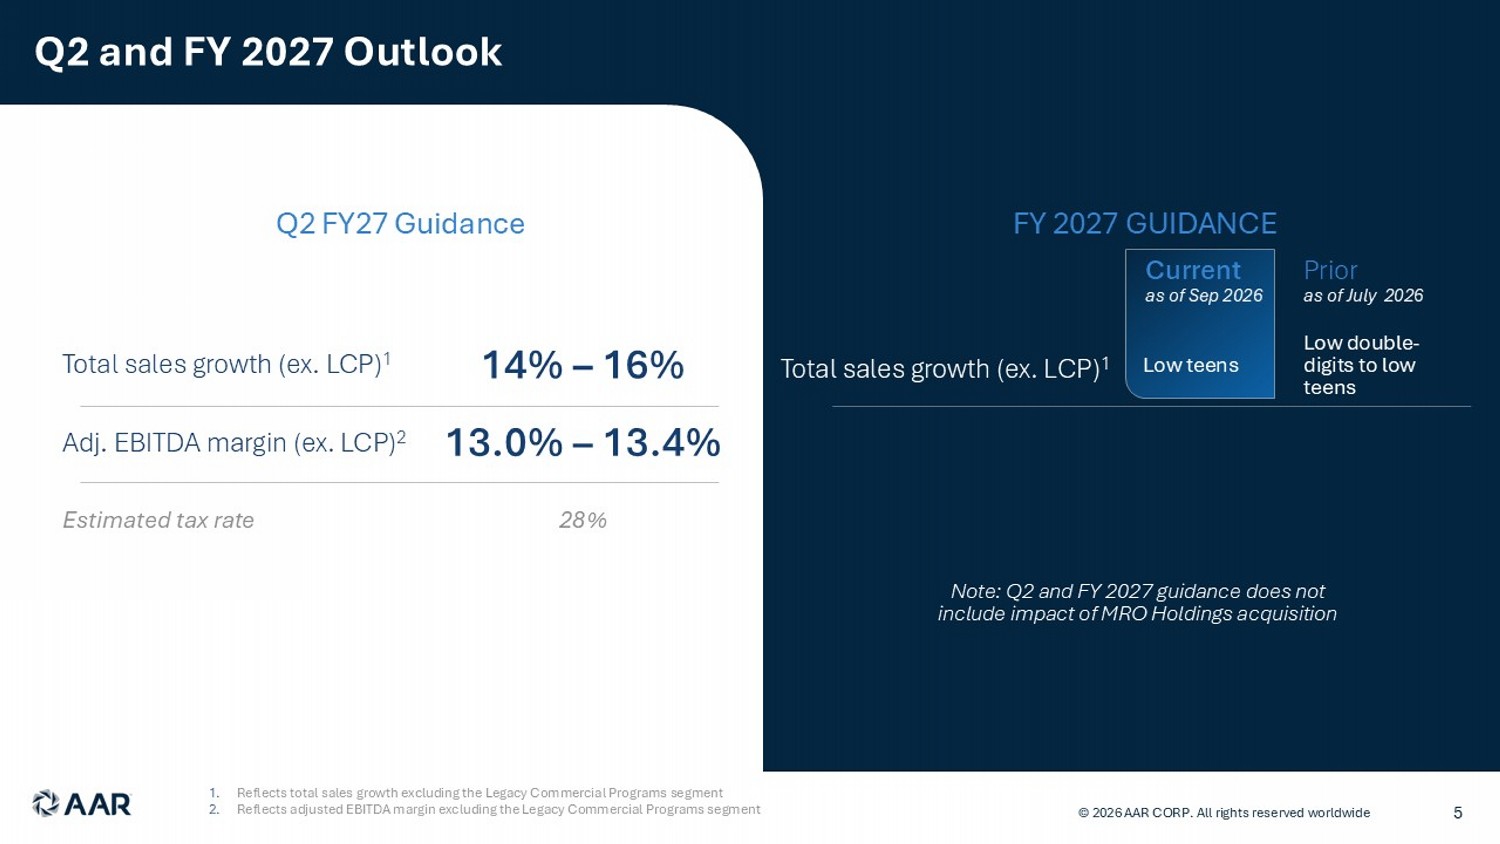
Q2 and FY 2027 Outlook Total sales growth (ex. LCP) 1 14% – 16% Adj. EBITDA margin (ex. LCP) 2 13.0 % – 13.4% Q2 FY27 Guidance © 2026 AAR CORP. All rights reserved worldwide 5 Estimated tax rate 28% 1. Reflects total sales growth excluding the Legacy Commercial Programs segment 2. Reflects adjusted EBITDA margin excluding the Legacy Commercial Programs segment FY 2027 GUIDANCE Prior as of July 2026 Total sales g rowth (ex. LCP) 1 Low double - digits to low teens Note: Q2 and FY 2027 guidance does not include impact of MRO Holdings acquisition Current as of Sep 2026 Low teens
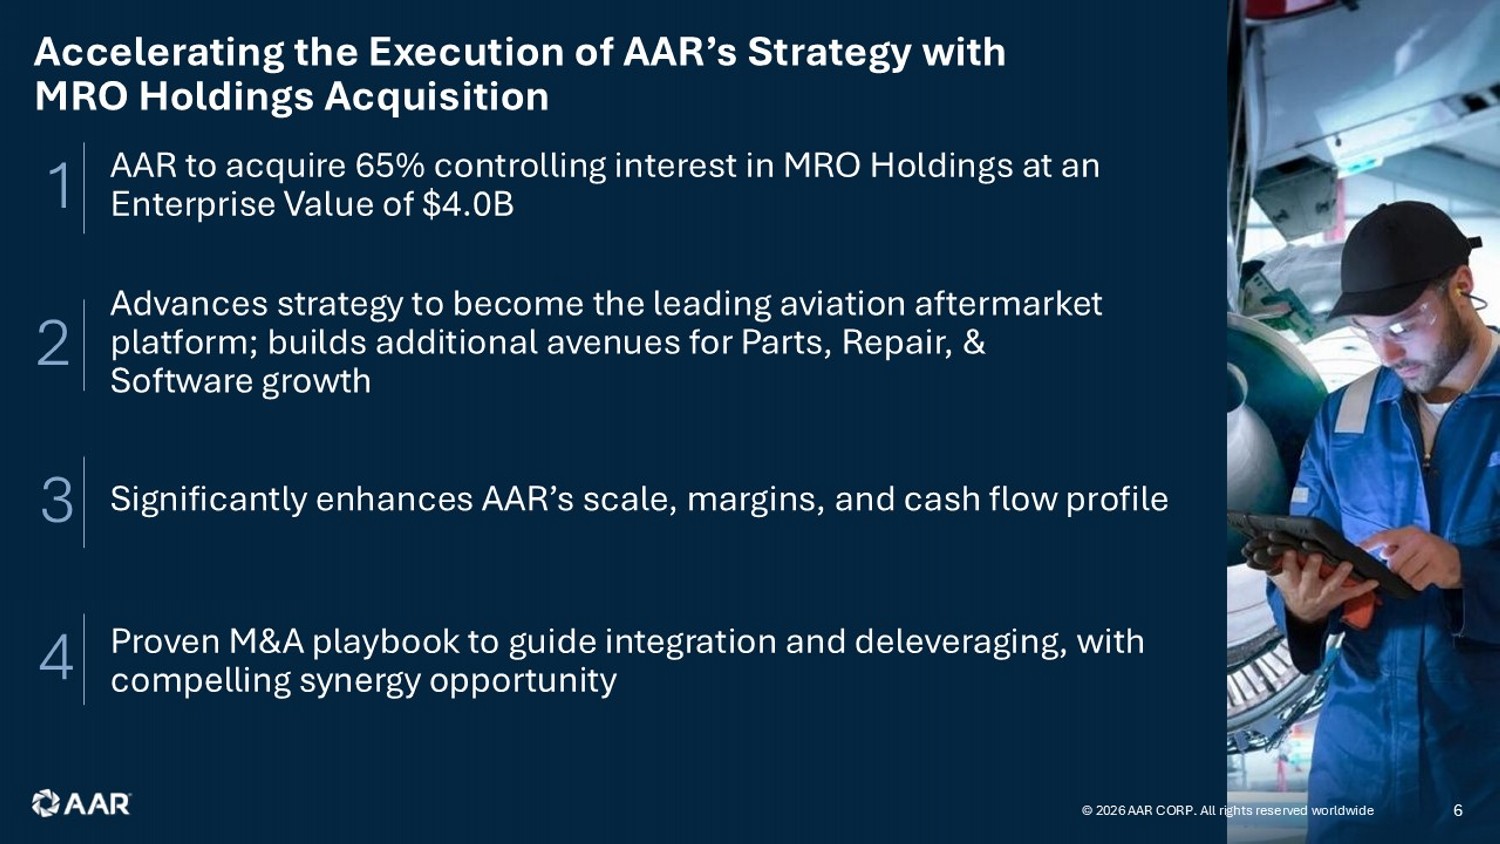
Accelerating the Execution of AAR’s Strategy with MRO Holdings Acquisition 1 AAR to acquire 65% controlling interest in MRO Holdings at an Enterprise Value of $4.0B Proven M&A playbook to guide integration and deleveraging, with compelling synergy opportunity 4 © 2026 AAR CORP. All rights reserved worldwide 6 2 Advances strategy to become the leading aviation aftermarket platform; builds additional avenues for Parts, Repair, & Software growth 3 Significantly enhances AAR’s scale, margins, and cash flow profile
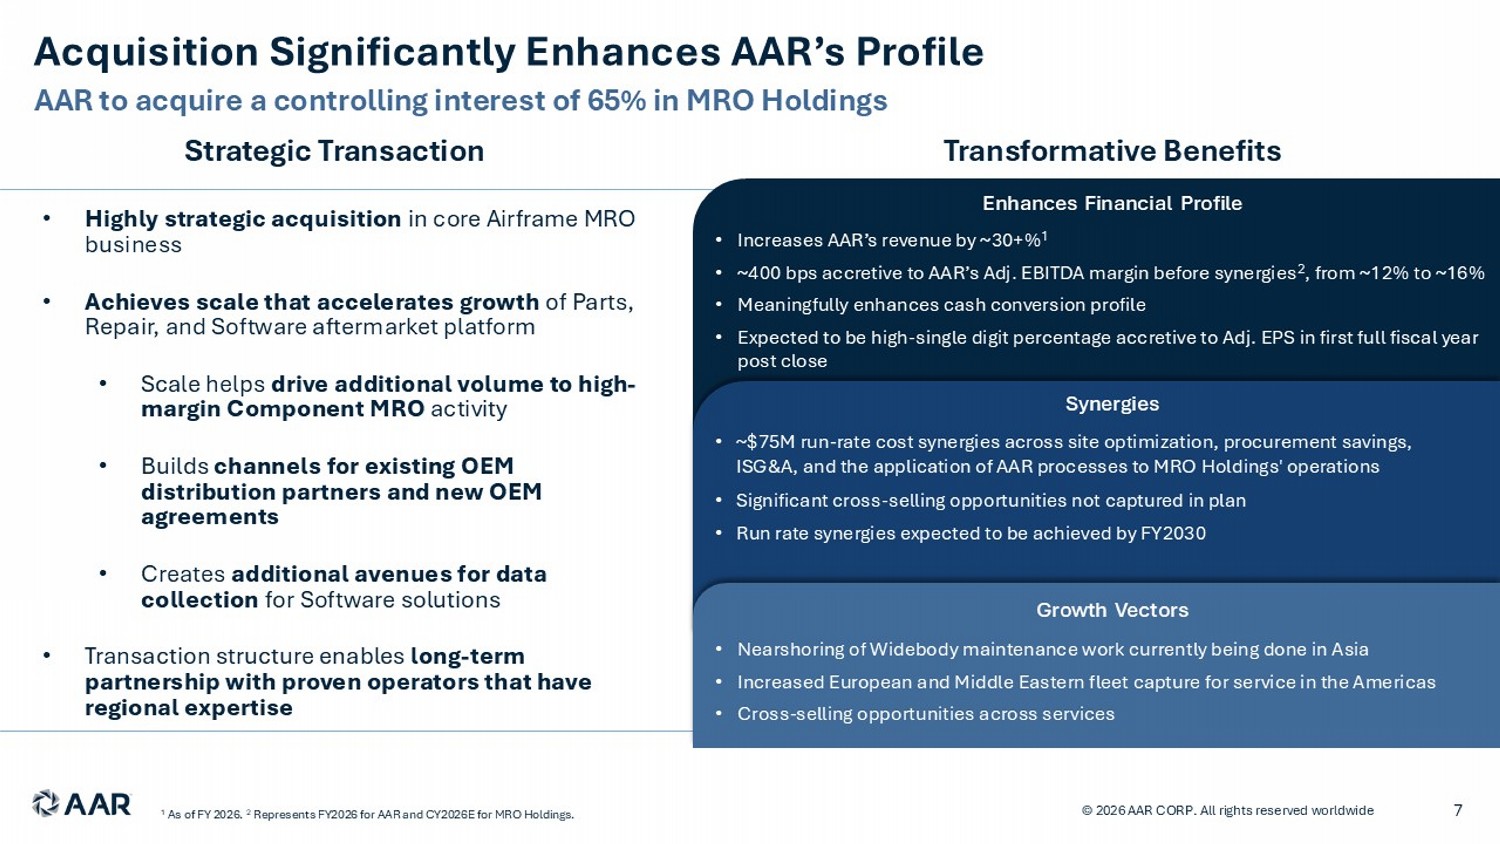
AAR to acquire a controlling interest of 65% in MRO Holdings Acquisition Significantly Enhances AAR’s Profile © 2026 AAR CORP. All rights reserved worldwide 7 1 As of FY 2026. 2 Represents FY2026 for AAR and CY2026E for MRO Holdings. • Highly strategic acquisition in core Airframe MRO business • Achieves scale that accelerates growth of Parts, Repair, and Software aftermarket platform • Scale helps drive additional volume to high - margin Component MRO activity • Builds channels for existing OEM distribution partners and new OEM agreements • Creates additional avenues for data collection for Software solutions • Transaction structure enables long - term partnership with proven operators that have regional expertise Enhances Financial Profile • Increases AAR’s revenue by ~30+% 1 • ~400 bps accretive to AAR’s Adj. EBITDA margin before synergies 2 , from ~12% to ~16% • Meaningfully enhances cash conversion profile • Expected to be high - single digit percentage accretive to Adj. EPS in first full fiscal year post close • ~$75M run - rate cost synergies across site optimization, procurement savings, ISG&A, and the application of AAR processes to MRO Holdings' operations • Significant cross - selling opportunities not captured in plan • Run rate synergies expected to be achieved by FY2030 Strategic Transaction Transformative Benefits • Nearshoring of Widebody maintenance work currently being done in Asia • Increased European and Middle Eastern fleet capture for service in the Americas • Cross - selling opportunities across services Growth Vectors Synergies
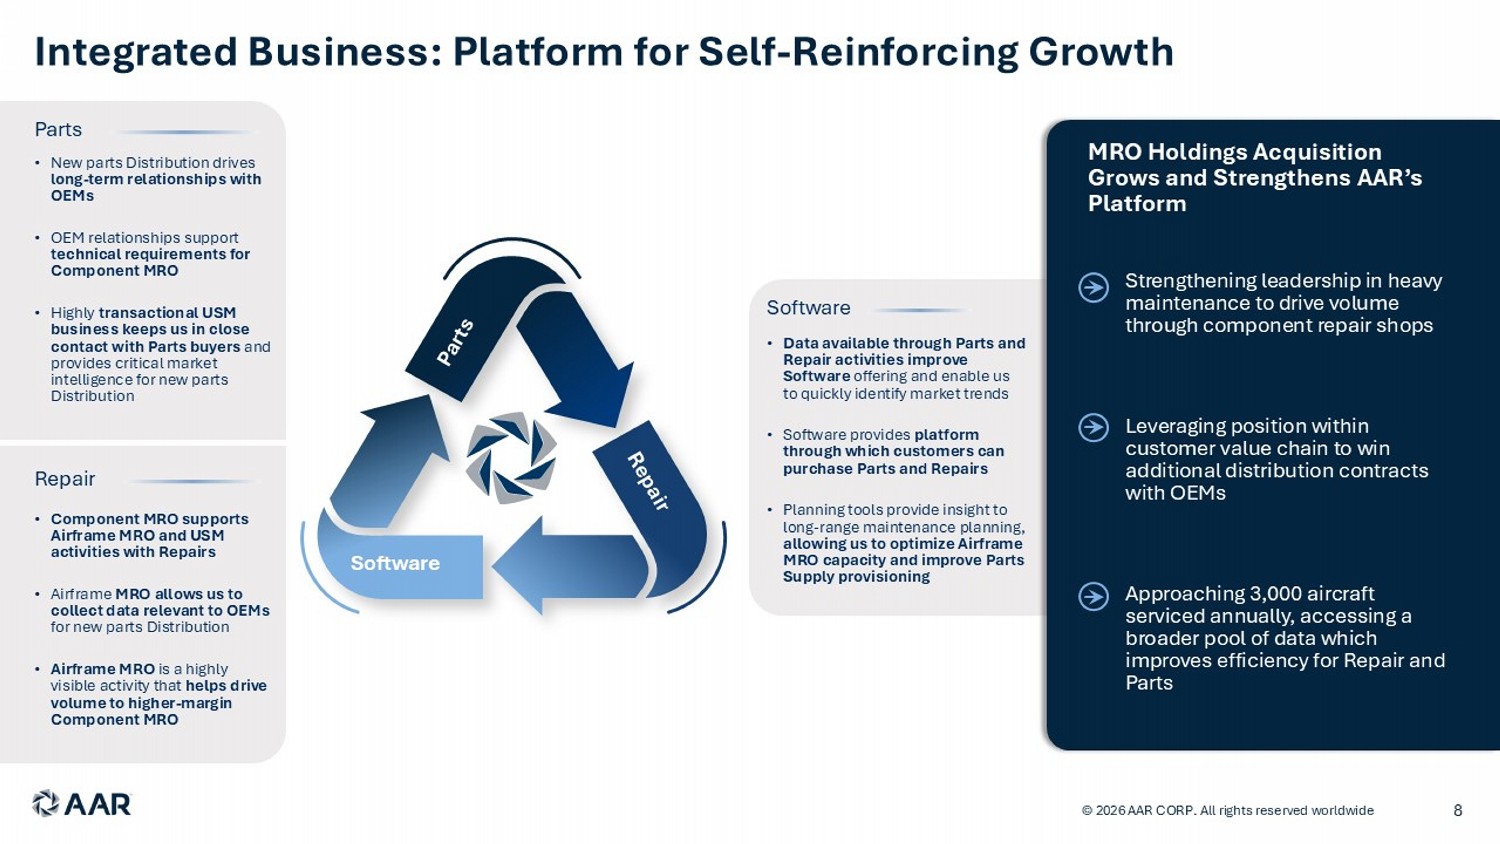
Integrated Business: Platform for Self - Reinforcing Growth © 2026 AAR CORP. All rights reserved worldwide 8 • New parts Distribution drives long - term relationships with OEMs • OEM relationships support technical requirements for Component MRO • Highly transactional USM business keeps us in close contact with Parts buyers and provides critical market intelligence for new parts Distribution • Component MRO supports Airframe MRO and USM activities with Repairs • Airframe MRO allows us to collect data relevant to OEMs for new parts Distribution • Airframe MRO is a highly visible activity that helps drive volume to higher - margin Component MRO Parts Repair • Data available through Parts and Repair activities improve Software offering and enable us to quickly identify market trends • Software provides platform through which customers can purchase Parts and Repairs • Planning tools provide insight to long - range maintenance planning, allowing us to optimize Airframe MRO capacity and improve Parts Supply provisioning Software Software Strengthening leadership in heavy maintenance to drive volume through component repair shops Leveraging position within customer value chain to win additional distribution contracts with OEMs Approaching 3,000 aircraft serviced annually, accessing a broader pool of data which improves efficiency for Repair and Parts MRO Holdings Acquisition Grows and Strengthens AAR’s Platform
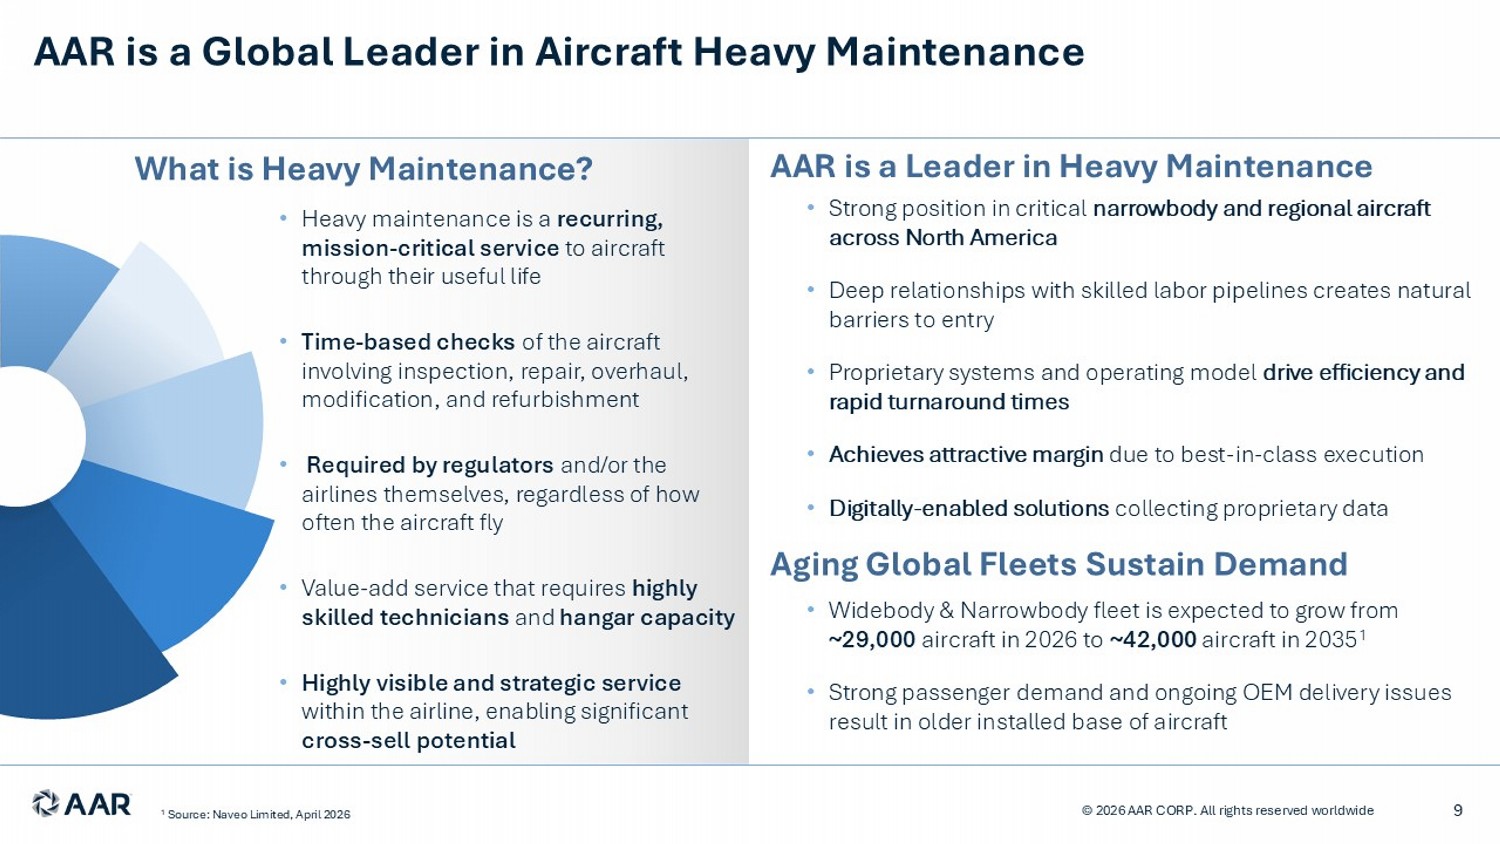
AAR is a Global Leader in Aircraft Heavy Maintenance © 2026 AAR CORP. All rights reserved worldwide 9 AAR is a Leader in Heavy Maintenance • Widebody & Narrowbody fleet is expected to grow from ~29,000 aircraft in 2026 to ~42,000 aircraft in 2035 1 • Strong passenger deman d and ongoing OEM delivery issues result in older installed base of aircraft • Strong position in critical narrowbody and regional aircraft across North America • Deep relationships with skilled labor pipelines creates natural barriers to entry • Proprietary systems and operating model drive efficiency and rapid turnaround times • Achieves attractive margin due to best - in - class execution • Digitally - enabled solutions collecting proprietary data Aging Global Fleets Sustain Demand 1 Source: Naveo Limited, April 2026 What is Heavy Maintenance? • Heavy maintenance is a recurring, mission - critical service to aircraft through their useful life • Time - based checks of the aircraft involving inspection, repair, overhaul, modification, and refurbishment • Required by regulators and/or the airlines themselves, regardless of how often the aircraft fly • Value - add service that requires highly skilled technicians and hangar capacity • Highly visible and strategic service within the airline, enabling significant cross - sell potential
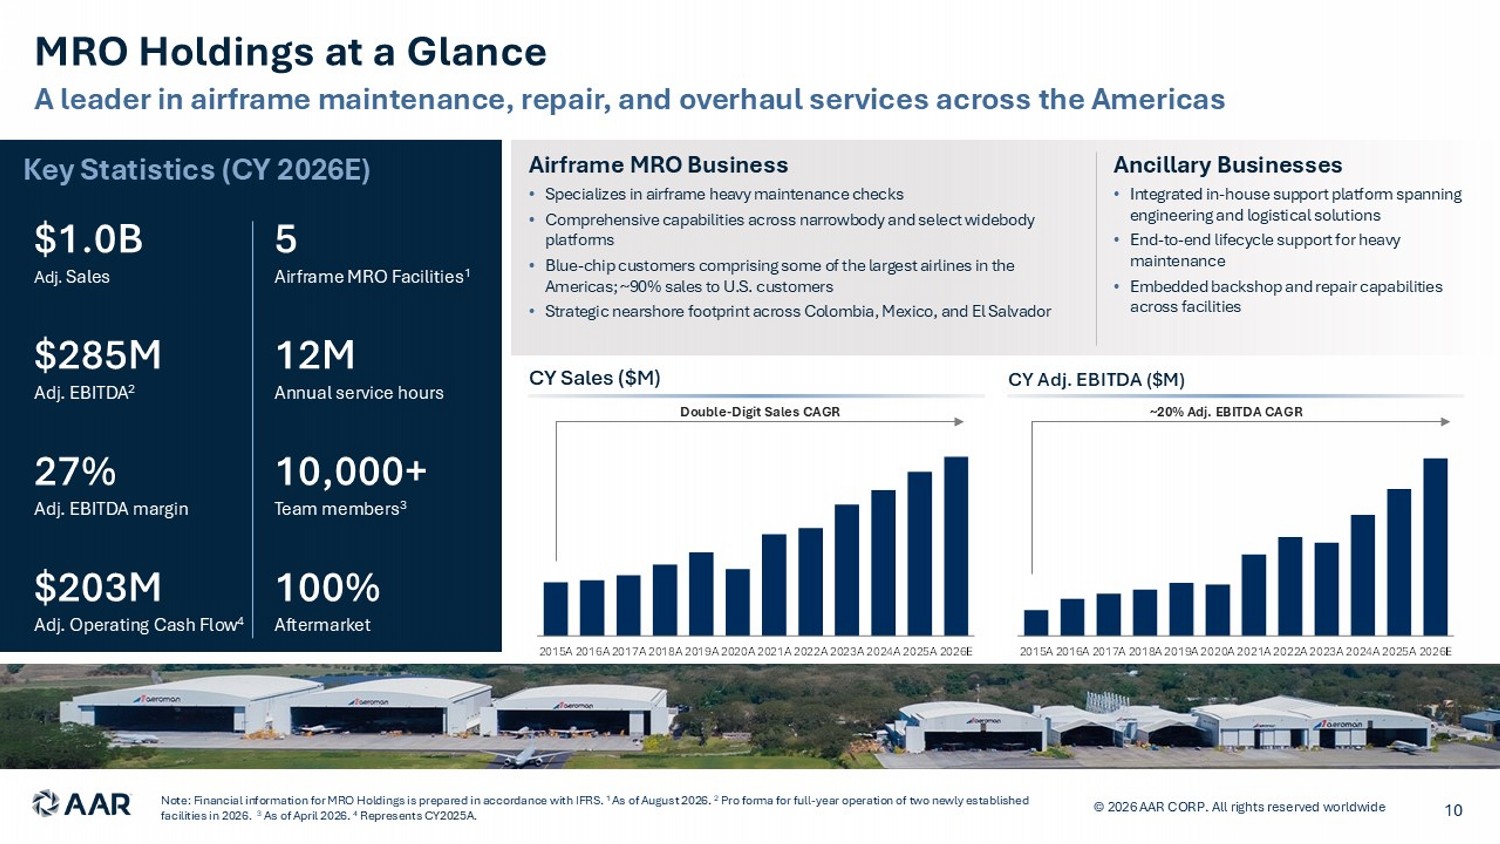
A leader in airframe maintenance, repair, and overhaul services across the Americas MRO Holdings at a Glance © 2026 AAR CORP. All rights reserved worldwide Note: Financial information for MRO Holdings is prepared in accordance with IFRS. 1 As of August 2026. 2 Pro forma for full - year operation of two newly established facilities in 2026. 3 As of April 2026. 4 Represents CY2025A. 10 Key Statistics (CY 2026E) $1.0B Adj. Sales $2 85 M Adj. EBITDA 2 27% Adj. EBITDA margin $203M Adj. Operating Cash Flow 4 5 Airframe MRO Facilities 1 12M Annual service hours 10,000+ Team members 3 100% Aftermarket Airframe MRO Business • Specializes in airframe heavy maintenance checks • Comprehensive capabilities across narrowbody and select widebody platforms • Blue - chip customers comprising some of the largest airlines in the Americas; ~90% sales to U.S. customers • Strategic nearshore footprint across Colombia, Mexico, and El Salvador Ancillary Businesses • Integrated in - house support platform spanning engineering and logistical solutions • End - to - end lifecycle support for heavy maintenance • Embedded backshop and repair capabilities across facilities Double - Digit Sales CAGR CY Sales ($M) CY Adj. EBITDA ($M) ~20% Adj. EBITDA CAGR 2015A 2016A 2017A 2018A 2019A 2020A 2021A 2022A 2023A 2024A 2025A 2026E
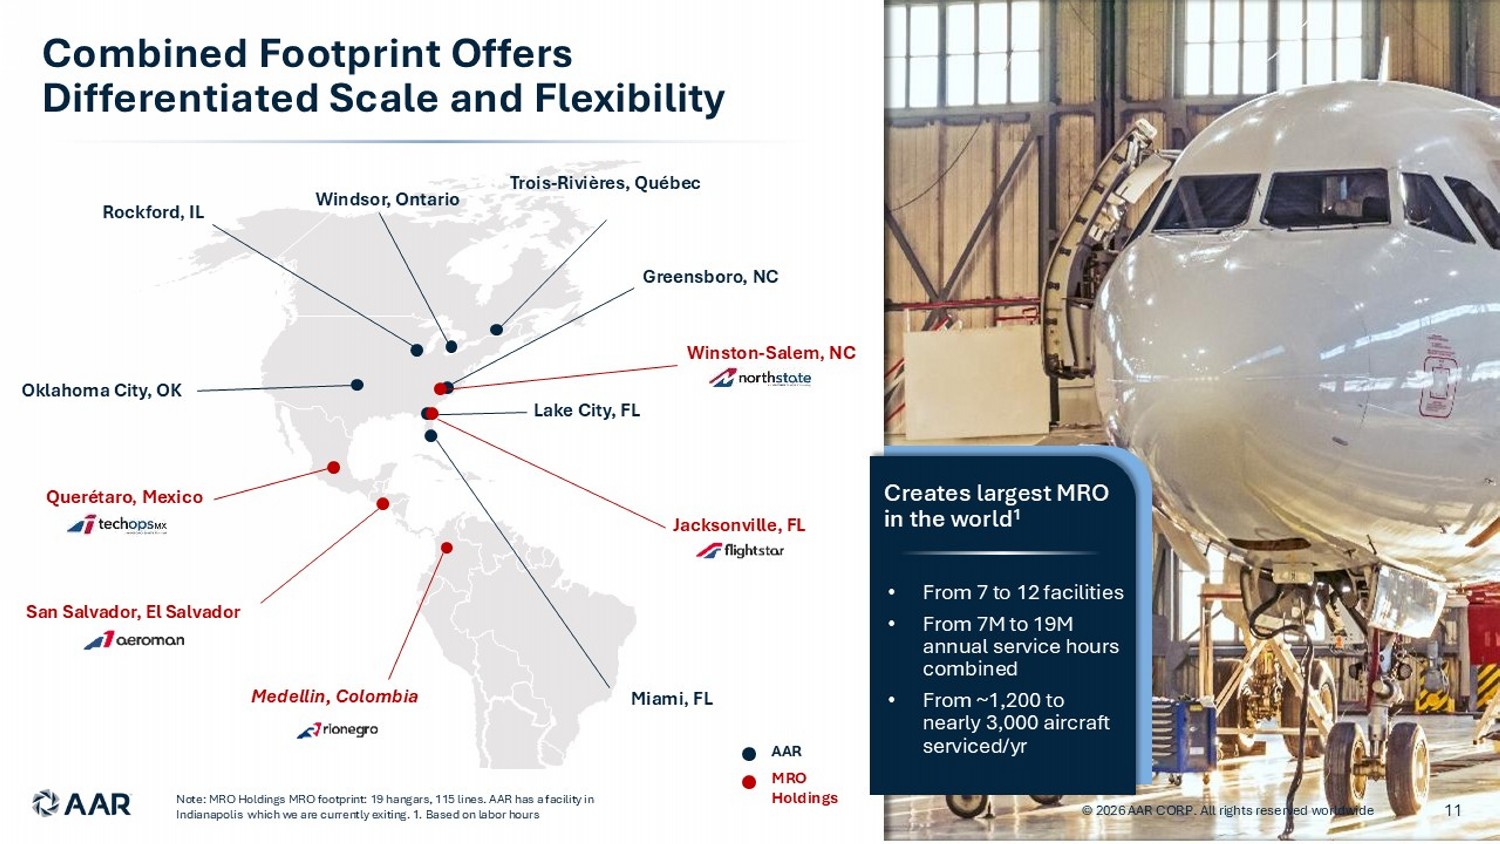
AAR MRO Holdings Combined Footprint Offers Differentiated Scale and Flexibility © 2026 AAR CORP. All rights reserved worldwide 11 Note: MRO Holdings MRO footprint: 19 hangars, 115 lines. AAR has a facility in Indianapolis which we are currently exiting. 1. Based on labor hours Greensboro, NC Lake City, FL Windsor, Ontario Trois - Rivières, Québec Rockford, IL Miami, FL Oklahoma City, OK Medellin, Colombia Winston - Salem, NC Jacksonville, FL Querétaro, Mexico San Salvador, El Salvador • From 7 to 12 facilities • From 7M to 19M annual service hours combined • From ~1,200 to nearly 3,000 aircraft serviced/yr Creates largest MRO in the world 1
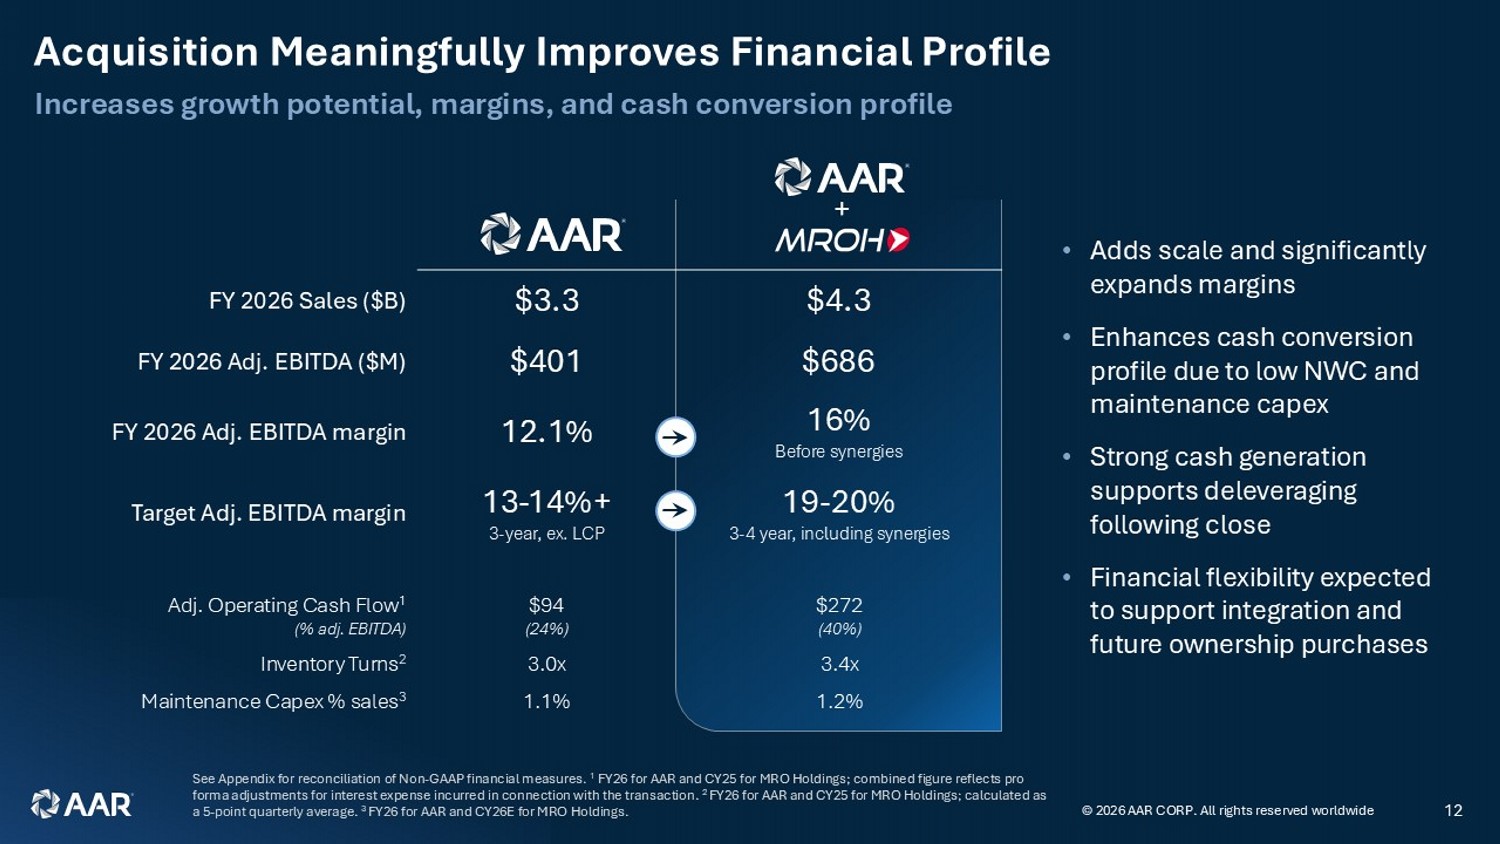
Acquisition Meaningfully Improves Financial Profile Increases growth potential, margins, and cash conversion profile © 2026 AAR CORP. All rights reserved worldwide 12 See Appendix for reconciliation of Non - GAAP financial measures. 1 FY26 for AAR and CY25 for MRO Holdings; combined figure reflects pro forma adjustments for interest expense incurred in connection with the transaction. 2 FY26 for AAR and CY25 for MRO Holdings; calculated as a 5 - point quarterly average. 3 FY26 for AAR and CY26E for MRO Holdings. $4.3 $3.3 FY 2026 Sales ($B) $686 $401 FY 2026 Adj. EBITDA ($M) 16% Before synergies 12.1% FY 2026 Adj. EBITDA margin 19 - 20% 3 - 4 year, including synergies 13 - 14%+ 3 - year, ex. LCP Target Adj. EBITDA margin + $272 (40%) $94 (24%) Adj. Operating Cash Flow 1 (% adj. EBITDA) 3.4x 3.0x Inventory Turns 2 1.2% 1.1% Maintenance Capex % sales 3 • Adds sca le and significantly expands margins • Enhances cash conversion profile due to low NWC and maintenance capex • Strong cash generation supports deleveraging following close • Financial flexibility expected to support integration and future ownership purchases
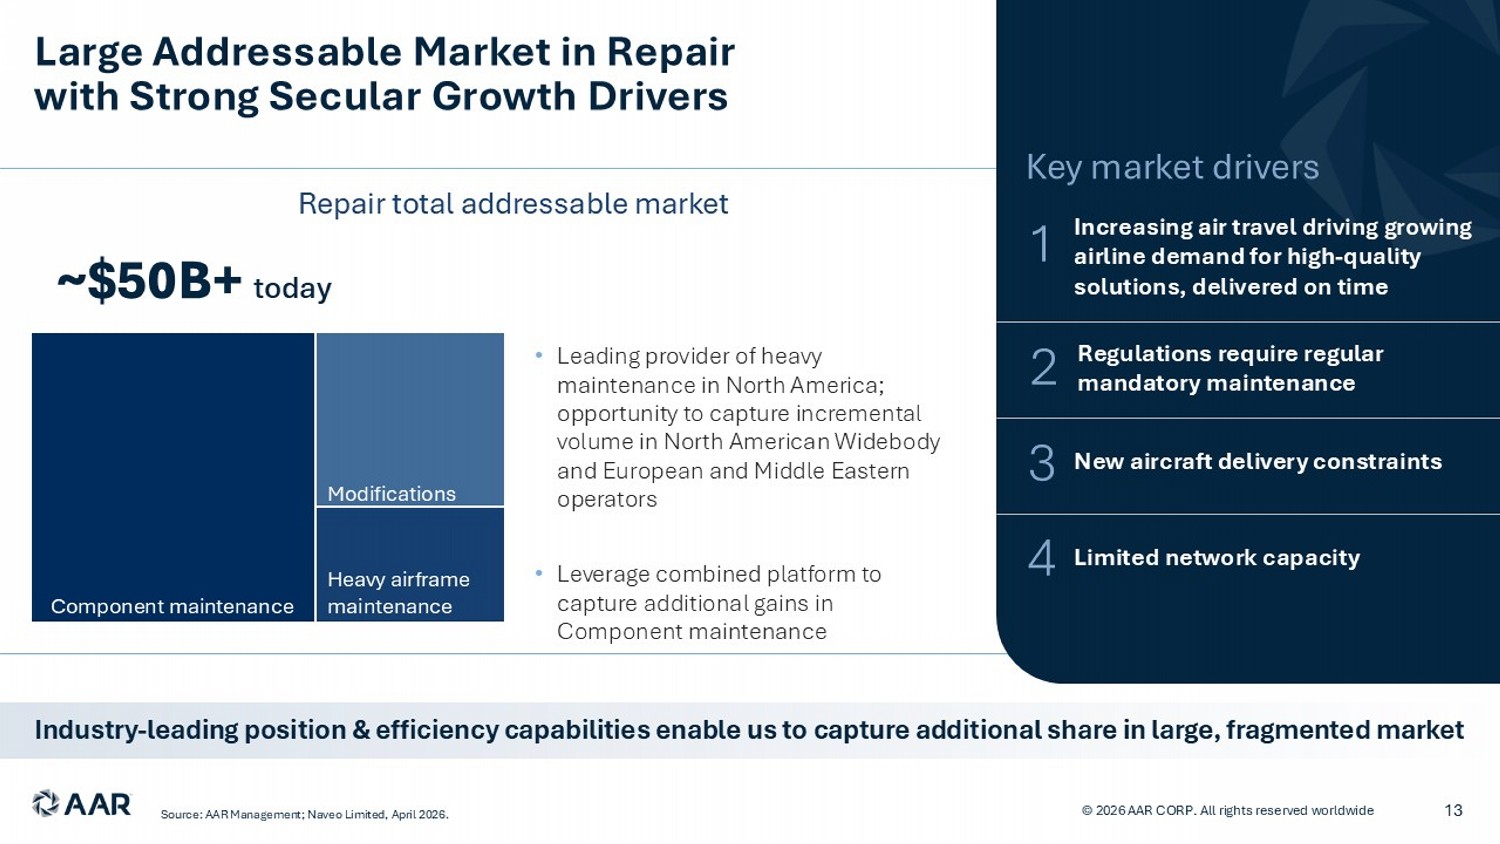
Large Addressable Market in Repair with Strong Secular Growth Drivers Industry - leading position & efficiency capabilities enable us to capture additional share in large, fragmented market © 2026 AAR CORP. All rights reserved worldwide 13 Key market drivers 1 Increasing air travel driving growing airline demand for high - quality solutions, delivered on time 2 Regulations require regular mandatory maintenance 3 New aircraft delivery constraints 4 Limited network capacity Component maintenance Heavy airframe maintenance t oday Repair total addressable market Modifications • Leading provider of heavy maintenance in North America; opportunity to capture incremental volume in North American Widebody and European and Middle Eastern operators • Leverage combined platform to capture additional gains in Component maintenance Source: AAR Management; Naveo Limited, April 2026.
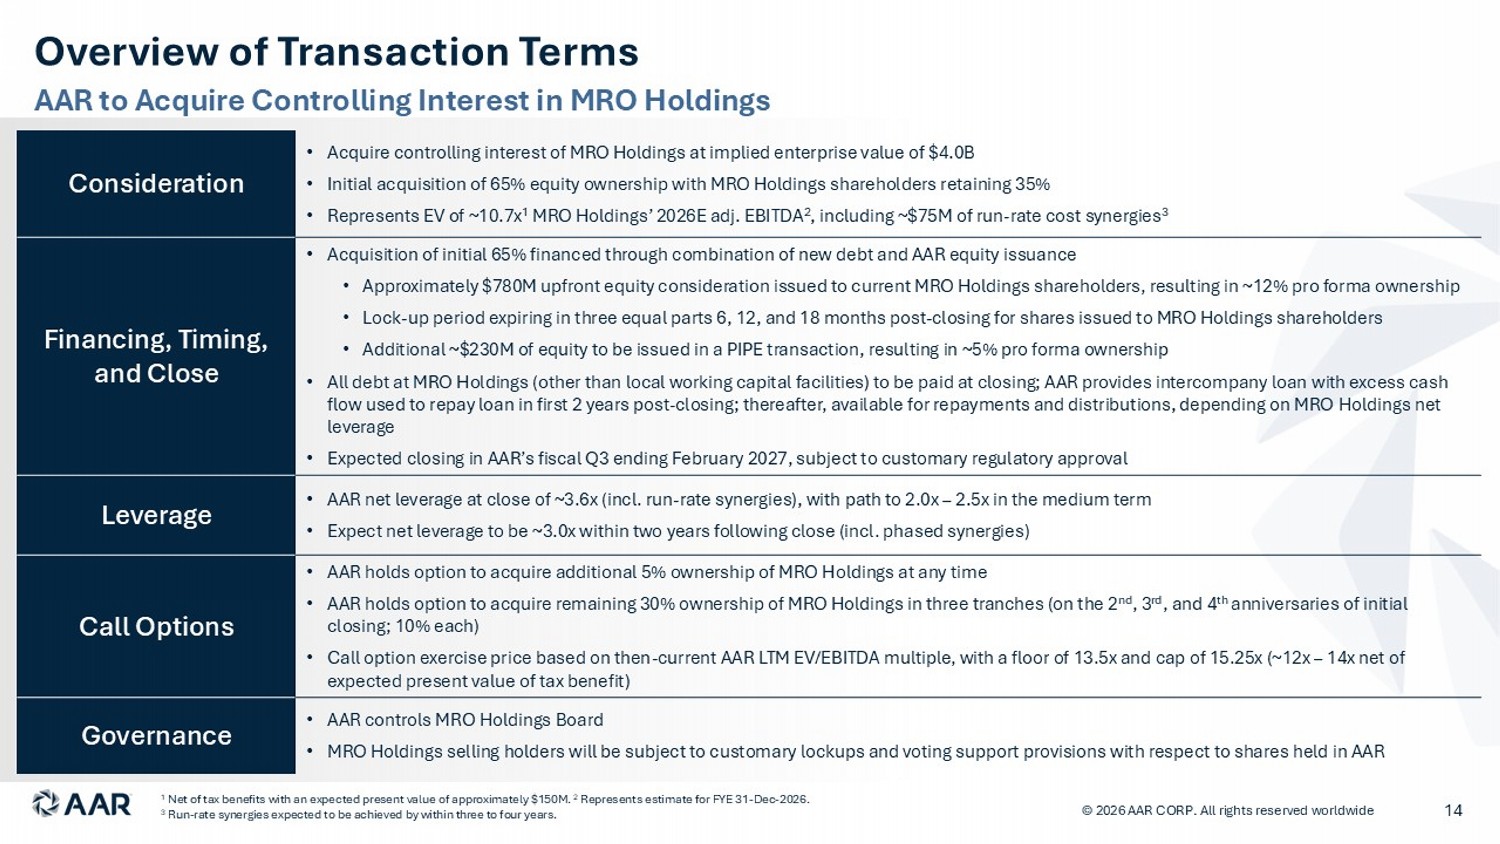
AAR to Acquire Controlling Interest in MRO Holdings Overview of Transaction Terms © 2026 AAR CORP. All rights reserved worldwide 14 • Acquire controlling interest of MRO Holdings at implied enterprise value of $4.0B • Initial acquisition of 65% equity ownership with MRO Holdings shareholders retaining 35% • Represents EV of ~10.7x 1 MRO Holdings’ 2026E adj. EBITDA 2 , including ~$75M of run - rate cost synergies 3 Consideration • Acquisition of initial 65% financed through combination of new debt and AAR equity issuance • Approximately $780M upfront equity consideration issued to current MRO Holdings shareholders, resulting in ~12% pro forma own ers hip • Lock - up period expiring in three equal parts 6, 12, and 18 months post - closing for shares issued to MRO Holdings shareholders • Additional ~$230M of equity to be issued in a PIPE transaction, resulting in ~5% pro forma ownership • All debt at MRO Holdings (other than local working capital facilities) to be paid at closing; AAR provides intercompany loan wit h excess cash flow used to repay loan in first 2 years post - closing; thereafter, available for repayments and distributions, depending on MRO Holdings net leverage • Expected closing in AAR’s fiscal Q3 ending February 2027, subject to customary regulatory approval Financing, Timing, and Close • AAR net leverage at close of ~3.6x (incl. run - rate synergies), with path to 2.0x – 2.5x in the medium term • Expect net leverage to be ~3.0x within two years following close (incl. phased synergies) Leverage • AAR holds option to acquire additional 5% ownership of MRO Holdings at any time • AAR holds option to acquire remaining 30% ownership of MRO Holdings in three tranches (on the 2 nd , 3 rd , and 4 th anniversaries of initial closing; 10% each) • Call option exercise price based on then - current AAR LTM EV/EBITDA multiple, with a floor of 13.5x and cap of 15.25x (~12x – 14x net of expected present value of tax benefit) Call Options • AAR controls MRO Holdings Board • MRO Holdings selling holders will be subject to customary lockups and voting support provisions with respect to shares held i n A AR Governance 1 Net of tax benefits with an expected present value of approximately $150M. 2 Represents estimate for FYE 31 - Dec - 2026. 3 Run - rate synergies expected to be achieved by within three to four years.
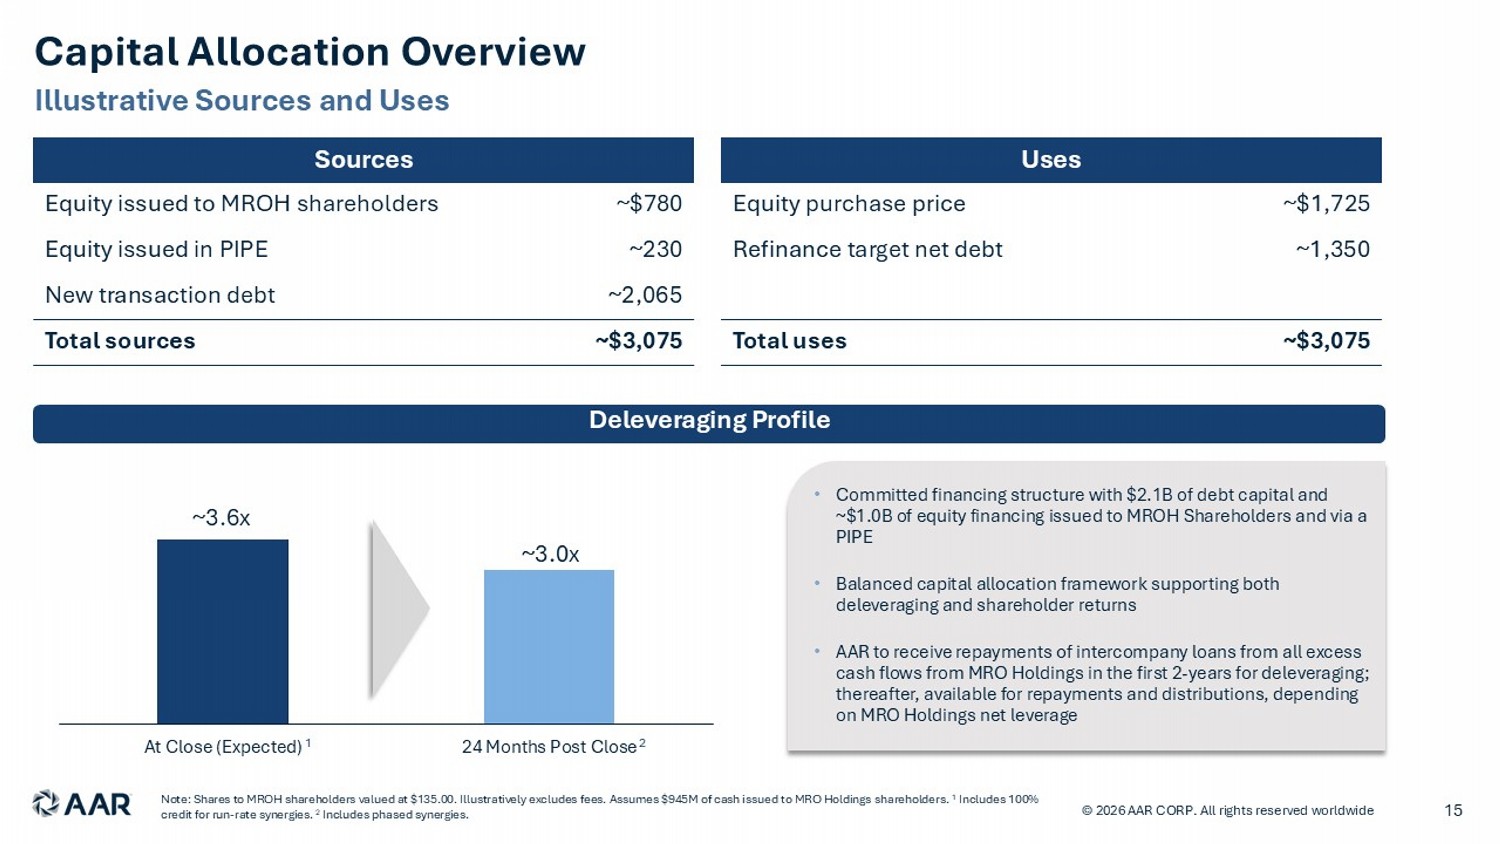
Illustrative Sources and Uses Capital Allocation Overview © 2026 AAR CORP. All rights reserved worldwide 15 Deleveraging Profile • C ommitted financing structure with $2.1B of debt capital and ~$1.0B of equity financing issued to MROH Shareholders and via a PIPE • Balanced capital allocation framework supporting both deleveraging and shareholder returns • AAR to receive repayments of intercompany loans from all excess cash flows from MRO Holdings in the first 2 - years for deleveraging; thereafter, available for repayments and distributions, depending on MRO Holdings net leverage Note: Shares to MROH shareholders valued at $135.00. Illustratively excludes fees. Assumes $945M of cash issued to MRO Holdin gs shareholders. 1 Includes 100% credit for run - rate synergies. 2 Includes phased synergies. ~3.6x ~3.0x At Close (Expected) 24 Months Post Close 1 2 Sources ~$780 Equity issued to MROH shareholders ~230 Equity issued in PIPE ~2,065 New transaction debt ~$3,075 Total sources Uses ~$1,725 Equity purchase price ~1,350 Refinance target net debt ~$3,075 Total uses
© 2026 AAR CORP. All rights reserved worldwide 16

APPENDIX © 2026 AAR CORP. All rights reserved worldwide 17
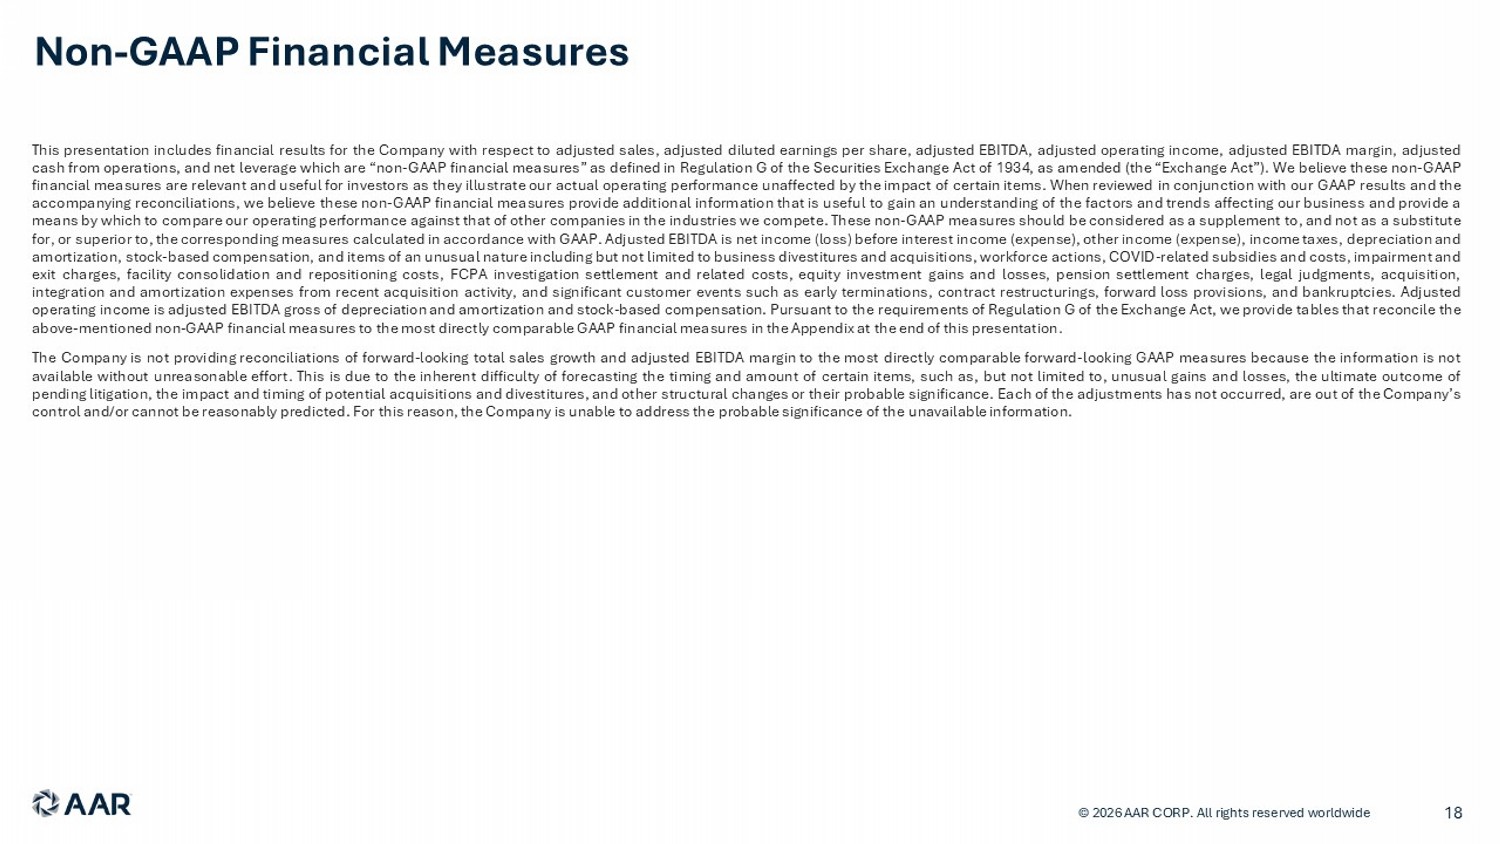
© 2026 AAR CORP. All rights reserved worldwide 18 This presentation includes financial results for the Company with respect to adjusted sales, adjusted diluted earnings per share, adjusted EBITDA , adjusted operating income, adjusted EBITDA margin, adjusted cash from operations, and net leverage which are “non - GAAP financial measures” as defined in Regulation G of the Securities Exchange Act of 1934 , as amended (the “Exchange Act”) . We believe these non - GAAP financial measures are relevant and useful for investors as they illustrate our actual operating performance unaffected by the impact of certain items . When reviewed in conjunction with our GAAP results and the accompanying reconciliations, we believe these non - GAAP financial measures provide additional information that is useful to gain an understanding of the factors and trends affecting our business and provide a means by which to compare our operating performance against that of other companies in the industries we compete . These non - GAAP measures should be considered as a supplement to, and not as a substitute for, or superior to, the corresponding measures calculated in accordance with GAAP . Adjusted EBITDA is net income (loss) before interest income (expense), other income (expense), income taxes, depreciation and amortization, stock - based compensation, and items of an unusual nature including but not limited to business divestitures and acquisitions, workforce actions, COVID - related subsidies and costs, impairment and exit charges, facility consolidation and repositioning costs, FCPA investigation settlement and related costs, equity investment gains and losses, pension settlement charges, legal judgments, acquisition, integration and amortization expenses from recent acquisition activity, and significant customer events such as early terminations, contract restructurings, forward loss provisions, and bankruptcies . Adjusted operating income is adjusted EBITDA gross of depreciation and amortization and stock - based compensation . Pursuant to the requirements of Regulation G of the Exchange Act, we provide tables that reconcile the above - mentioned non - GAAP financial measures to the most directly comparable GAAP financial measures in the Appendix at the end of this presentation . The Company is not providing reconciliations of forward - looking total sales growth and adjusted EBITDA margin to the most directly comparable forward - looking GAAP measures because the information is not available without unreasonable effort . This is due to the inherent difficulty of forecasting the timing and amount of certain items, such as, but not limited to, unusual gains and losses, the ultimate outcome of pending litigation, the impact and timing of potential acquisitions and divestitures, and other structural changes or their probable significance . Each of the adjustments has not occurred, are out of the Company’s control and/or cannot be reasonably predicted . For this reason, the Company is unable to address the probable significance of the unavailable information . Non - GAAP Financial Measures
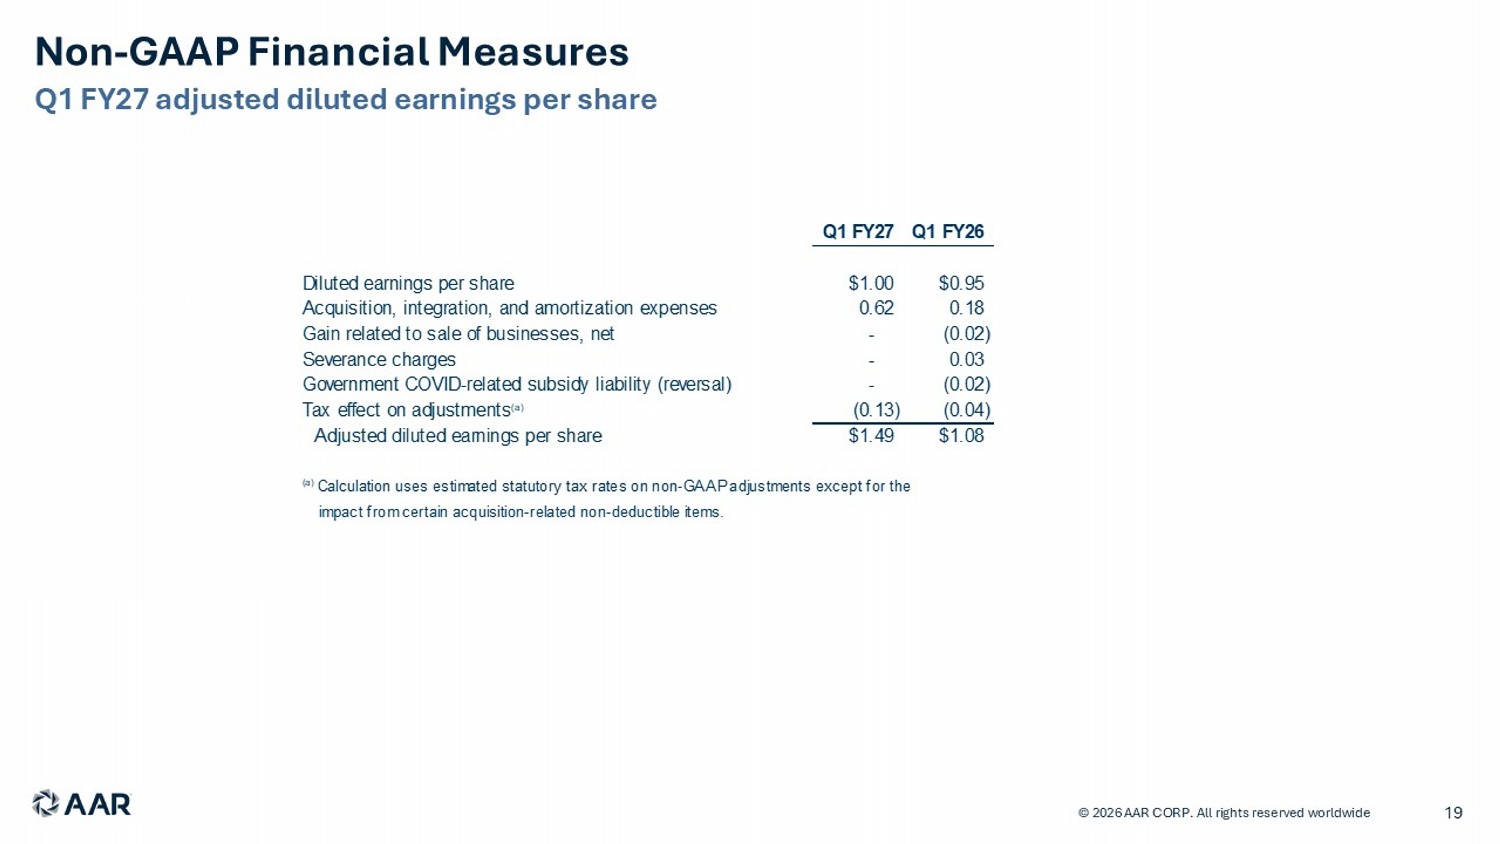
Q1 FY27 adjusted diluted earnings per share © 2026 AAR CORP. All rights reserved worldwide 19 Non - GAAP Financial Measures Q1 FY27 Q1 FY26 Diluted earnings per share $1.00 $0.95 Acquisition, integration, and amortization expenses 0.62 0.18 Gain related to sale of businesses, net - (0.02) Severance charges - 0.03 Government COVID-related subsidy liability (reversal) - (0.02) Tax effect on adjustments (a) (0.13) (0.04) Adjusted diluted earnings per share $1.49 $1.08 (a) Calculation uses estimated statutory tax rates on non-GAAP adjustments except for the impact from certain acquisition-related non-deductible items.
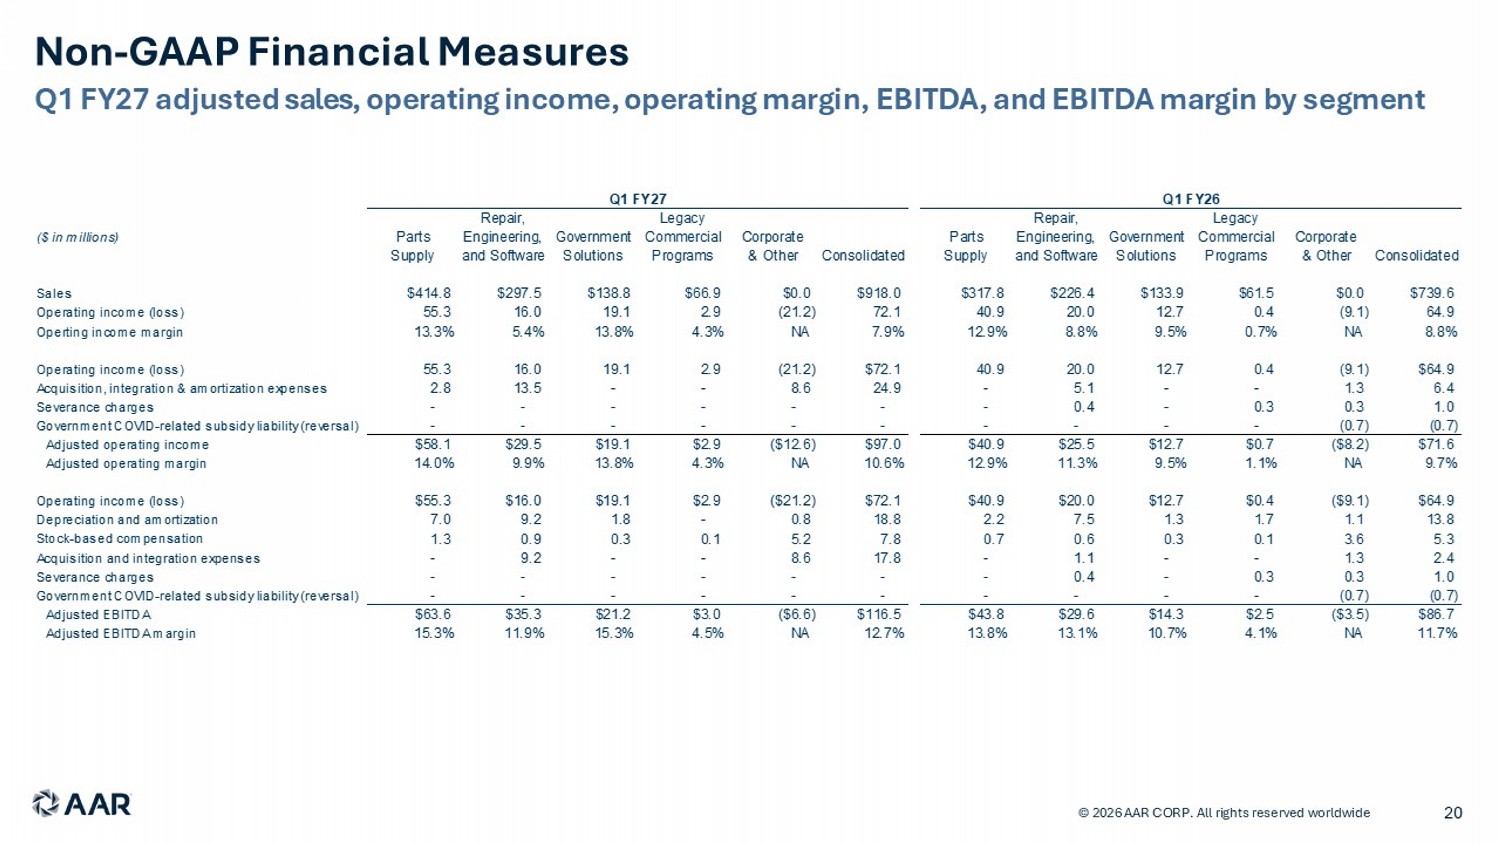
Q1 FY27 adjusted sales, operating income, operating margin, EBITDA, and EBITDA margin by segment © 2024 AAR CORP. All rights reserved worldwide. 20 © 2026 AAR CORP. All rights reserved worldwide Non - GAAP Financial Measures Q1 FY27 Q1 FY26 Repair, Legacy Repair, Legacy ($ in millions) Parts Engineering, Government Commercial Corporate Parts Engineering, Government Commercial Corporate Supply and Software Solutions Programs & Other Consolidated Supply and Software Solutions Programs & Other Consolidated Sales $414.8 $297.5 $138.8 $66.9 $0.0 $918.0 $317.8 $226.4 $133.9 $61.5 $0.0 $739.6 Operating income (loss) 55.3 16.0 19.1 2.9 (21.2) 72.1 40.9 20.0 12.7 0.4 (9.1) 64.9 Operting income margin 13.3% 5.4% 13.8% 4.3% NA 7.9% 12.9% 8.8% 9.5% 0.7% NA 8.8% Operating income (loss) 55.3 16.0 19.1 2.9 (21.2) $72.1 40.9 20.0 12.7 0.4 (9.1) $64.9 Acquisition, integration & amortization expenses 2.8 13.5 - - 8.6 24.9 - 5.1 - - 1.3 6.4 Severance charges - - - - - - - 0.4 - 0.3 0.3 1.0 Government COVID-related subsidy liability (reversal) - - - - - - - - - - (0.7) (0.7) Adjusted operating income $58.1 $29.5 $19.1 $2.9 ($12.6) $97.0 $40.9 $25.5 $12.7 $0.7 ($8.2) $71.6 Adjusted operating margin 14.0% 9.9% 13.8% 4.3% NA 10.6% 12.9% 11.3% 9.5% 1.1% NA 9.7% Operating income (loss) $55.3 $16.0 $19.1 $2.9 ($21.2) $72.1 $40.9 $20.0 $12.7 $0.4 ($9.1) $64.9 Depreciation and amortization 7.0 9.2 1.8 - 0.8 18.8 2.2 7.5 1.3 1.7 1.1 13.8 Stock-based compensation 1.3 0.9 0.3 0.1 5.2 7.8 0.7 0.6 0.3 0.1 3.6 5.3 Acquisition and integration expenses - 9.2 - - 8.6 17.8 - 1.1 - - 1.3 2.4 Severance charges - - - - - - - 0.4 - 0.3 0.3 1.0 Government COVID-related subsidy liability (reversal) - - - - - - - - - - (0.7) (0.7) Adjusted EBITDA $63.6 $35.3 $21.2 $3.0 ($6.6) $116.5 $43.8 $29.6 $14.3 $2.5 ($3.5) $86.7 Adjusted EBITDA margin 15.3% 11.9% 15.3% 4.5% NA 12.7% 13.8% 13.1% 10.7% 4.1% NA 11.7%
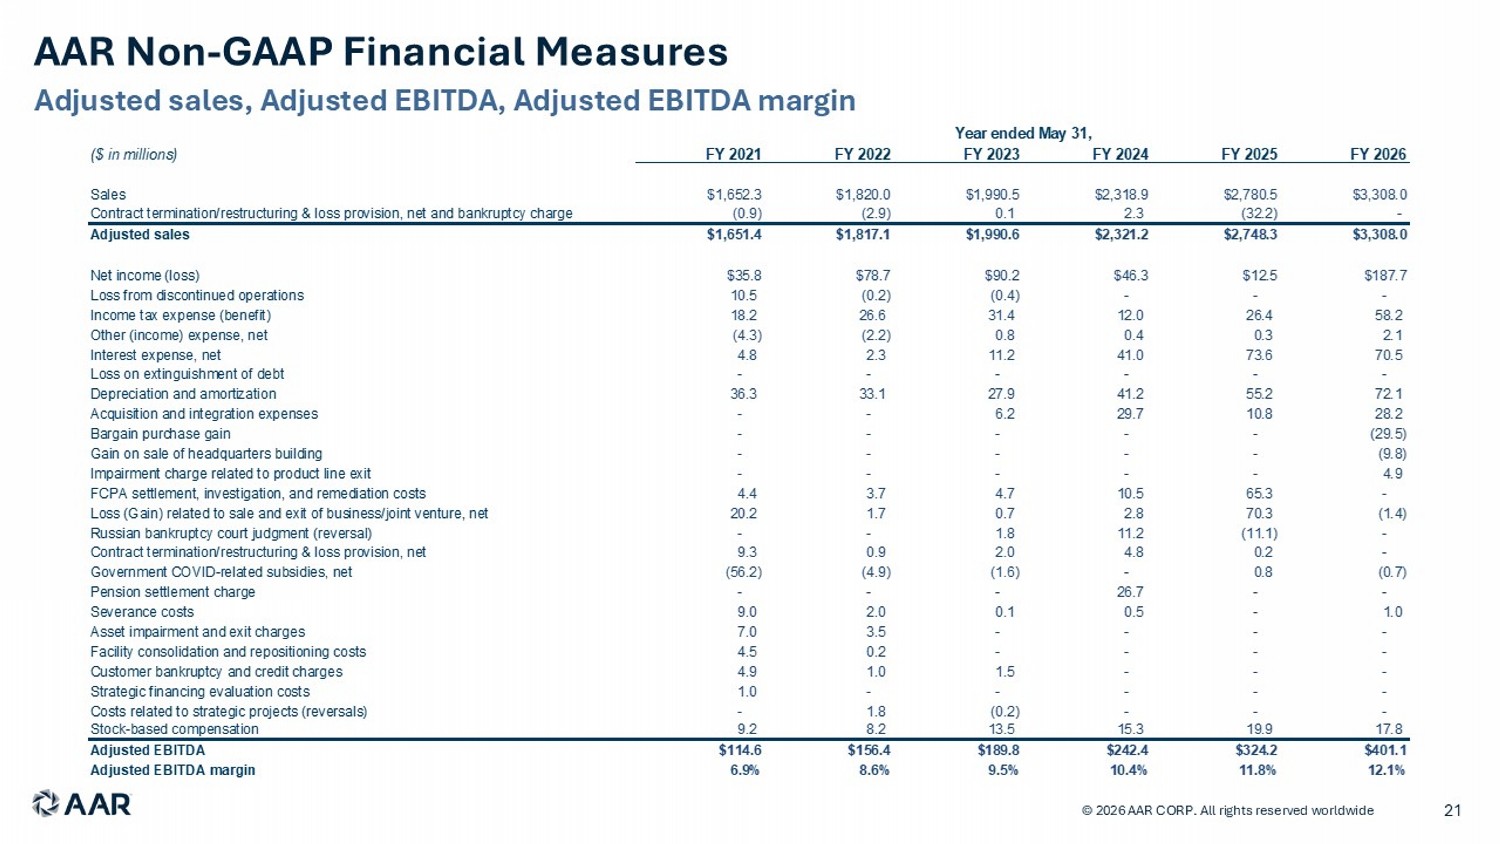
AAR Non - GAAP Financial Measures © 2026 AAR CORP. All rights reserved worldwide 21 Adjusted sales, Adjusted EBITDA, Adjusted EBITDA margin ($ in millions) FY 2021 FY 2022 FY 2023 FY 2024 FY 2025 FY 2026 Sales $1,652.3 $1,820.0 $1,990.5 $2,318.9 $2,780.5 $3,308.0 Contract termination/restructuring & loss provision, net and bankruptcy charge (0.9) (2.9) 0.1 2.3 (32.2) - Adjusted sales $1,651.4 $1,817.1 $1,990.6 $2,321.2 $2,748.3 $3,308.0 Net income (loss) $35.8 $78.7 $90.2 $46.3 $12.5 $187.7 Loss from discontinued operations 10.5 (0.2) (0.4) - - - Income tax expense (benefit) 18.2 26.6 31.4 12.0 26.4 58.2 Other (income) expense, net (4.3) (2.2) 0.8 0.4 0.3 2.1 Interest expense, net 4.8 2.3 11.2 41.0 73.6 70.5 Loss on extinguishment of debt - - - - - - Depreciation and amortization 36.3 33.1 27.9 41.2 55.2 72.1 Acquisition and integration expenses - - 6.2 29.7 10.8 28.2 Bargain purchase gain - - - - - (29.5) Gain on sale of headquarters building - - - - - (9.8) Impairment charge related to product line exit - - - - - 4.9 FCPA settlement, investigation, and remediation costs 4.4 3.7 4.7 10.5 65.3 - Loss (Gain) related to sale and exit of business/joint venture, net 20.2 1.7 0.7 2.8 70.3 (1.4) Russian bankruptcy court judgment (reversal) - - 1.8 11.2 (11.1) - Contract termination/restructuring & loss provision, net 9.3 0.9 2.0 4.8 0.2 - Government COVID-related subsidies, net (56.2) (4.9) (1.6) - 0.8 (0.7) Pension settlement charge - - - 26.7 - - Severance costs 9.0 2.0 0.1 0.5 - 1.0 Asset impairment and exit charges 7.0 3.5 - - - - Facility consolidation and repositioning costs 4.5 0.2 - - - - Customer bankruptcy and credit charges 4.9 1.0 1.5 - - - Strategic financing evaluation costs 1.0 - - - - - Costs related to strategic projects (reversals) - 1.8 (0.2) - - - Stock-based compensation 9.2 8.2 13.5 15.3 19.9 17.8 Adjusted EBITDA $114.6 $156.4 $189.8 $242.4 $324.2 $401.1 Adjusted EBITDA margin 6.9% 8.6% 9.5% 10.4% 11.8% 12.1% Year ended May 31,
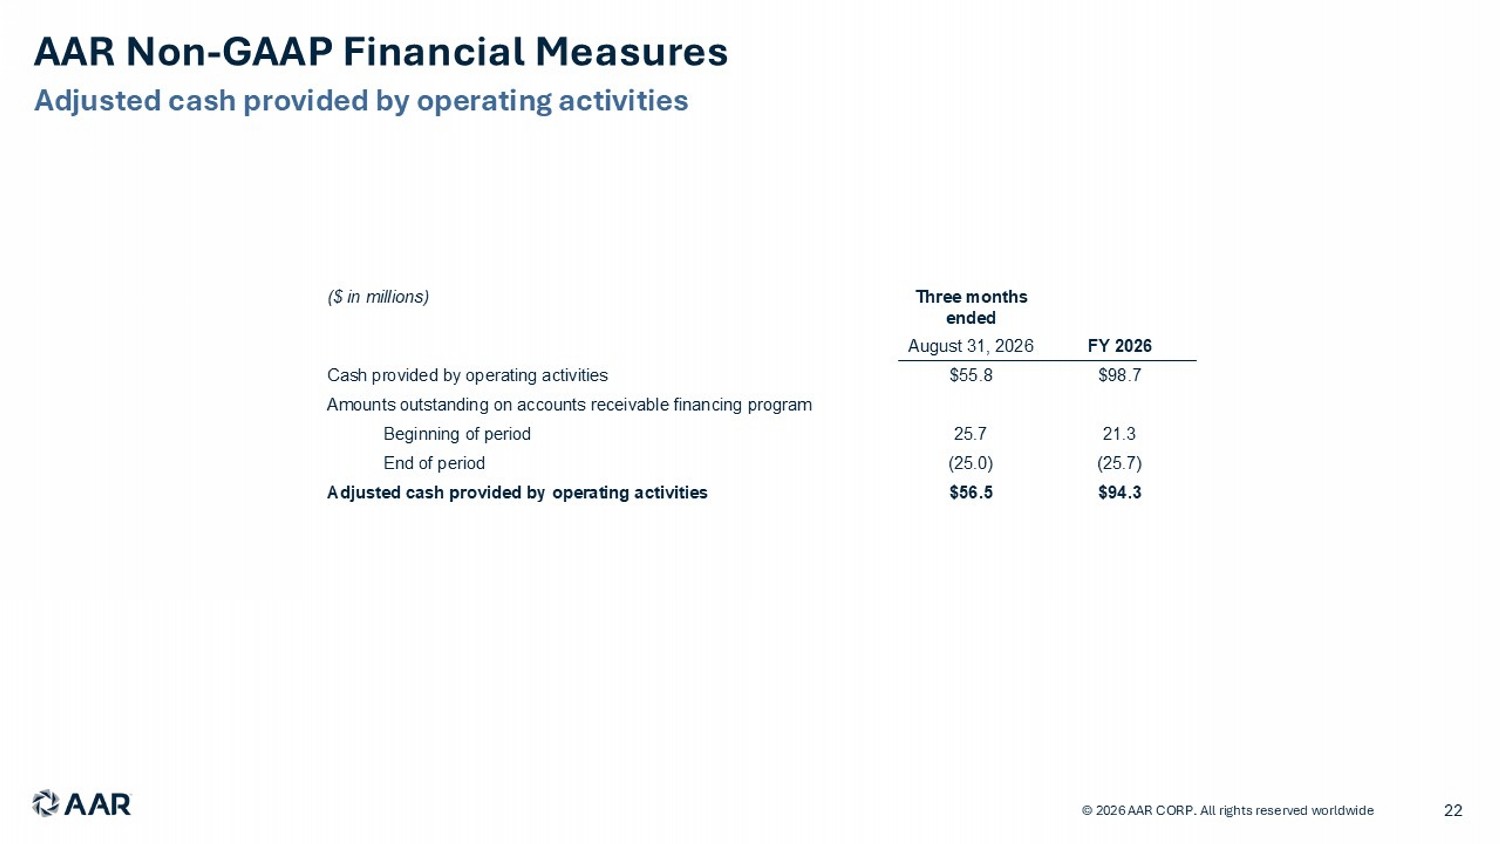
AAR Non - GAAP Financial Measures © 2026 AAR CORP. All rights reserved worldwide 22 Adjusted cash provided by operating activities Three months ended ($ in millions) FY 2026 August 31, 2026 $98.7 $55.8 Cash provided by operating activities Amounts outstanding on accounts receivable financing program 21.3 25.7 Beginning of period (25.7) (25.0) End of period $94.3 $56.5 Adjusted cash provided by operating activities