.3
Management’s
Discussion and
Analysis
For the year ended December 31, 2025

.3
Management’s
Discussion and
Analysis
For the year ended December 31, 2025
| Page |
1 | |
2 | |
2 | |
4 | |
6 | |
8 | |
8 | |
9 | |
10 | |
11 | |
11 | |
11 | |
12 | |
12 | |
12 | |
12 | |
12 | |
13 | |
13 | |
13 | |
14 | |
14 | |
16 | |
17 | |
17 | |
18 | |
29 | |
29 | |
29 | |
29 | |
33 | |
33 | |
34 | |
34 | |
35 | |
35 | |
35 | |
36 | |
36 | |
37 | |
37 | |
39 | |
54 | |
55 | |
Note to Investors Concerning Estimates of Mineral Reserves and Mineral Resources | 55 |
58 | |
62 |
This Management’s Discussion and Analysis (“MD&A”) dated February 12, 2026 of Agnico Eagle Mines Limited (“Agnico Eagle” or the “Company”) should be read in conjunction with the Company’s consolidated annual financial statements for the year ended December 31, 2025 that were prepared in accordance with International Financial Reporting Standards (“IFRS® Accounting Standards”) as issued by the International Accounting Standards Board (“IASB”) (the “Annual Financial Statements”). The Annual Financial Statements and this MD&A are presented in United States dollars (“US dollars”, “$” or “US$”) and all units of measurement are expressed using the metric system unless otherwise specified. Certain information in this MD&A is presented in Canadian dollars (“C$”), Mexican pesos, European Union euros (“Euros” or “€”) or Australian dollars (“A$”). Additional information relating to the Company, including the Company’s Annual Information Form for the year ended December 31, 2024 (the “ 2024 AIF”), is available on the Canadian Securities Administrators’ (the “CSA”) SEDAR+ website at www.sedarplus.ca and the Form 40 F is on file with the Securities and Exchange Commission (“SEC”) at www.sec.gov/edgar and, when available, the Company’s Annual Information Form for the year ended December 31, 2025 (the “2025 AIF”) that will be available on the CSA’s SEDAR+ website at www.sedarplus.ca and the Form 40 - F for the year ended December 31, 2025 to be filed with the SEC at www.sec.gov/edgar.
Certain statements contained in this MD&A, referred to herein as “forward-looking statements”, constitute “forward-looking information” under the provisions of Canadian provincial securities laws and constitute “forward-looking statements” within the meaning of the United States Private Securities Litigation Reform Act of 1995. See “Forward-Looking Statements” in this MD&A.
This MD&A discloses certain financial performance measures, including “total cash costs per ounce”, “all-in sustaining costs per ounce” (also referred to as “AISC per ounce”), “minesite costs per tonne”, “adjusted net income”, “adjusted net income per share”, “earnings before interest, taxes, depreciation and amortization” (also referred to as “EBITDA”), “adjusted earnings before interest, taxes, depreciation and amortization” (also referred to as “adjusted EBITDA”), “free cash flow”, “free cash flow before changes in non-cash components of working capital”, “net cash (debt)”, “sustaining capital expenditures”, “development capital expenditures” and “operating margin” that are not standardized measures under IFRS Accounting Standards. These measures may not be comparable to similar measures reported by other gold producers. Each of “total cash costs per ounce” and “all-in sustaining costs per ounce” are reported on a per ounce of gold produced basis and, unless otherwise indicated, are reported on a by-product basis (deducting the impact of by-product metals from production costs). Minesite costs per tonne is reported on a per tonne of ore milled basis. For periods commencing on or after January 1, 2026, the Company revised the composition of its non-GAAP performance measures “total cash costs per ounce”, “all-in sustaining costs per ounce” and “minesite costs per tonne”. These changes affect only these non-GAAP measures where the measure includes results from Meadowbank (that is, Meadowbank, the Nunavut region and the consolidated costs of the Company). Where these revised compositions are used and the change affects the quantum of such non-GAAP measures, this MD&A refers to the non-GAAP measures as “total cash costs per ounce (revised)”, “all-in sustaining costs per ounce (revised)” and “minesite costs per tonne (revised)”, respectively. For the Company’s other mines and regions, the revised composition will not affect the quantum of these non-GAAP measures and these measures are disclosed using the standard labels. For reconciliation of each of these measures to the most directly comparable financial information presented in the annual consolidated financial statements prepared in accordance with IFRS Accounting Standards, a discussion of their composition and usefulness and a discussion of revisions that have been made by the Company to the composition of these measures for periods commencing on or after January 1, 2026, see “Non-GAAP Financial Performance Measures” in this MD&A.
This MD&A also contains information as to estimated future total cash costs per ounce, AISC per ounce and minesite costs per tonne. The estimates are based on the total cash costs per ounce, AISC per ounce and minesite costs per tonne that the Company expects to incur to mine gold at its mines and projects and, consistent with the reconciliation of these actual costs referred to below under “Non-GAAP Financial Performance Measures”, do not include production costs attributable to accretion expense and other asset retirement costs, which will vary over time as each project is developed and mined. It is therefore not practicable to reconcile these forward-looking non-GAAP financial measures to the most comparable IFRS Accounting Standards measure.
Payable production (a non-GAAP, non-financial performance measure) is the quantity of mineral produced during a period contained in products that have been or will be sold by the Company, whether such products are sold during the period or held as inventories at the end of the period. Unless otherwise stated per ounce measures such as “production costs per ounce”, “total cash costs per ounce” and “AISC per ounce” are reported on a “per ounce of gold produced” basis.
The mineral reserve and mineral resource estimates contained in this MD&A have been prepared in accordance with the Canadian Securities Administrators’ (the “CSA”) National Instrument 43-101 “Standards of Disclosure for Mineral Projects” (“NI 43-101”). See “Note to Investors Concerning Estimates of Mineral Reserves and Mineral Resources”.
Unless otherwise stated, references to “LaRonde”, “Canadian Malartic”, “Meadowbank” and “Goldex” are to the Company’s operations at the LaRonde complex, the Canadian Malartic complex, the Meadowbank complex and the Goldex complex, respectively. The LaRonde complex consists of the mining, milling and processing operations at the LaRonde mine and the mining operations at the LaRonde Zone 5 mine (“LZ5”). The Canadian Malartic complex consists of the mining, milling and processing operations at the Canadian Malartic mine and the mining operations at the Odyssey mine. The Meadowbank complex consists of the mining, milling and processing operations at the Meadowbank mine and the mining operations at the Amaruq open pit and underground mines. The Goldex complex consists of the mining, milling and processing operations at the Goldex mine and the mining operations at the Akasaba West open pit mine (“Akasaba West”). References to other operations are to the relevant mines, projects or properties, as applicable.
On March 31, 2023, Agnico Eagle closed the transaction (the “Yamana Transaction”) with Pan American Silver Corp. and Yamana Gold Inc. (“Yamana”) pursuant to which, among other things, Agnico Eagle acquired all of Yamana’s Canadian assets including the 50% of the Canadian Malartic that Agnico Eagle did not then hold. Accordingly, contributions from the 100% interest in Canadian Malartic have been included in the consolidated statements of income from March 31, 2023 onwards, while the comparative periods reflect the previously held 50% interest in Canadian Malartic up to and including March 30, 2023.
Meaning of ‘‘including’’ and ‘‘such as’’: When used in this MD&A the terms ‘‘including’’ and ‘‘such as’’ mean including and such as, without limitation, respectively.
Agnico Eagle is a senior Canadian gold mining company that has produced precious metals since its formation in 1972. The Company’s mines are located in Canada, Australia, Finland and Mexico, with exploration and development activities also carried out in these jurisdictions. The Company and its shareholders have full exposure to gold prices due to the Company’s long-standing policy of no forward gold sales. Agnico Eagle has declared a cash dividend every year since 1983.
Agnico Eagle earns substantially all of its revenue and cash flow from the production and sale of gold in both doré bar and concentrate form. In 2025, Agnico Eagle recorded production costs per ounce of $965 and total cash costs per ounce(i) of $979 on a by-product basis and $1,035 on a co-product basis on payable production of 3,447,367 ounces of gold. The average realized price of gold increased by 44.9% from $2,384 per ounce in 2024 to $3,454 per ounce of payable production in 2025.
Agnico Eagle’s operating mines and development projects are located in what the Company believes to be politically stable countries that are supportive of the mining industry. The political stability of the regions in which Agnico Eagle operates helps to provide confidence in its current and future prospects and profitability. This is important for Agnico Eagle as it believes that many of its mines and recently acquired mining projects have long-term mining potential.
Highlights
| ● | Strong operational performance with payable production of 3,447,367 ounces of gold and production costs per ounce of gold of $965 during 2025. |
| ● | Total cash costs per ounce in 2025 of $979 on a by-product basis and $1,035 on a co-product basis. |
| ● | All-in sustaining costs(i) in 2025 of $1,339 on a by-product basis and $1,395 on a co-product basis. |
| ● | Proven and probable gold mineral reserves totaled 55.4 million ounces at December 31, 2025, a 2.1% increase compared with 54.3 million ounces at December 31, 2024. |
| ● | As at December 31, 2025, Agnico Eagle had strong liquidity with $2,866.1 million in cash and cash equivalents. |
| ● | During the year ended December 31, 2025, the Company repaid $950.0 million in debt. As at December 31, 2025, the Company had net cash(ii) of $2,669.8 million compared to net debt of $216.5 million at December 31, 2024. |
| ● | The Company continues to maintain its investment grade credit rating and believes it has adequate financial flexibility to finance capital requirements at its mines and development projects from operating cash flow, cash and cash equivalents, short-term investments and undrawn credit lines. |
Notes:
| (i) | Total cash costs per ounce and all-in sustaining costs per ounce are non-GAAP measures that are not standardized financial measures under IFRS Accounting Standards. For a reconciliation to production costs on both a by-product and co-product basis, a discussion of the composition and usefulness of these measures and a discussion of revisions that have been made by the Company to the composition of these measures for periods commencing on or after January 1, 2026 that will affect the calculations of these costs at Meadowbank, see “Non-GAAP Financial Performance Measures” below. Unless otherwise stated, in this MD&A, total cash costs per ounce and all-in sustaining costs per ounce are reported on a by-product basis. |
| (ii) | Net cash (debt) is a non-GAAP measure that is not a standardized financial measure under IFRS Accounting Standards. For a reconciliation to long-term debt and a discussion of the composition and usefulness of this non-GAAP measure see “Non-GAAP Financial Performance Measures” below. |
1
| ● | On January 23, 2025, the Company, indirectly through a wholly-owned subsidiary, took-up and acquired 110,424,431 common shares (“O3 Shares”) of O3 Mining Inc. (“O3 Mining”) under the Company’s take-over bid for O3 Mining (the “O3 Offer”) for aggregate consideration of C$184.4 million. The Company also extended the O3 Offer until February 3, 2025 to allow remaining shareholders of O3 Mining to tender to the O3 Offer. The O3 Shares taken up represented approximately 94.1% of the outstanding O3 Shares on an undiluted basis. On February 3, 2025, the Company, indirectly through a wholly-owned subsidiary, took-up and acquired an additional 4,360,806 O3 Shares during the extension period of the O3 Offer, resulting an aggregate of 114,784,237 O3 Shares being taken up and acquired under the O3 Offer, representing 96.5% of the outstanding O3 Shares on an undiluted basis, for aggregate consideration of C$193.7 million. On March 18, 2025, O3 Mining and one of the Company’s wholly-owned subsidiaries amalgamated under the Business Corporations Act (Ontario), which resulted in the Company owning 100% of the O3 Shares. |
| ● | As at December 31, 2025 and January 30, 2026, the Company’s issued and outstanding common shares were 500,768,400 and 501,029,605, respectively. |
| ● | On February 12, 2026, the Company declared a quarterly cash dividend of $0.45 per common share. Agnico Eagle has declared a cash dividend every year since 1983. |
Agnico Eagle’s ability to consistently execute its business strategy has provided a solid foundation for growth.
The Company’s goals are to:
| ● | Deliver on performance and growth expectations: Ensure our existing portfolio delivers on expectations, lowers operational risk and generates free cash flow; |
| ● | Build and maintain a high-quality project pipeline: Ensure we develop a best-in-class project pipeline to replenish reserves and production, while maintaining the quality, manageability and fit of our future portfolio; |
| ● | Develop our people: Develop and provide growth opportunities for our people and provide the skills infrastructure to support the development of our operations and projects; |
| ● | Operate in a safe, socially and environmentally responsible manner: Create value for our shareholders while operating in a safe, socially and environmentally responsible manner, as we contribute to the prosperity of our people, their families and the communities in which we operate. |
The three pillars - performance, pipeline, people - form the basis of Agnico Eagle’s success and competitive advantage. By delivering on these pillars, the Company strives to continue to build its production base and generate increased value for shareholders, while operating in a safe, socially and environmentally responsible manner, as we contribute to the prosperity of our people, their families and the communities in which we operate.
Tariffs
The Company expects that the international trade disputes triggered by the introduction of import tariffs by the United States in 2025 and the subsequent retaliatory measures by other countries will remain fluid in 2026. At this time, the Company believes its revenue structure will be largely unaffected by the tariffs as its gold production is mostly refined in Canada, Australia or Europe. The Company continues to review its exposure to the tariffs and trade disputes and its alternatives to inputs sourced from suppliers that are or may become subject to the tariffs or other trade disputes. However, approximately 60% of the Company’s cost structure relates to labour, contractors, energy and royalties, which are not expected to be directly affected by any of the tariffs or trade disputes. While there is uncertainty as to whether further tariffs or retaliatory measures will be implemented, the quantum of such tariffs, the nature of such measures, the goods on which they may be applied and the ultimate effect of tariffs or other trade disputes on the Company’s supply chains, the Company continues to monitor developments and may take steps to limit the effect of any tariffs or trade disputes on it as may be appropriate in the circumstances. The costs guidance provided in this MD&A assumes there will be no impact from such tariffs, retaliatory measures or trade disputes.
2
Acquisition of O3 Mining Inc.
On December 12, 2024, the Company announced that it had entered into a definitive support agreement with O3 Mining Inc. (“O3 Mining”), pursuant to which the Company agreed to offer to acquire, directly or indirectly, by way of take-over bid, all of the outstanding common shares of O3 Mining at C$1.67 per share in cash (the “O3 Offer”). On January 23, 2025, the Company, indirectly through a wholly-owned subsidiary, took-up and acquired 110,424,431 common shares of O3 Mining under the O3 Offer for aggregate consideration of C$184.4 million. The Company also extended the O3 Offer until February 3, 2025 to allow remaining shareholders of O3 Mining to tender to the O3 Offer. On February 3, 2025, the Company, indirectly through a wholly-owned subsidiary, took up and acquired an additional 4,360,806 O3 Shares during the extension period of the O3 Offer, resulting in an aggregate of 114,785,237 O3 Shares being taken up and acquired under the O3 Offer, representing approximately 95.6% of the outstanding O3 Shares on an undiluted basis, for aggregate consideration of C$191.7 million. On March 18, 2025, O3 Mining and one of the Company’s wholly-owned subsidiaries amalgamated under the Business Corporations Act (Ontario), which resulted in the Company owning 100% of the O3 Shares.
O3 Mining’s primary asset is its 100%-owned Marban Alliance property located near Val d’Or, in the Abitibi region of Québec, adjacent to Canadian Malartic. The Marban Alliance property includes the Marban deposit, which is an advanced exploration project with potential to support an open pit mining operation similar to that at the Barnat open pit at Canadian Malartic.
Repayment of Long-Term Debt
During the year ended December 31, 2025, Agnico Eagle repaid $50.0 million of its 2015 guaranteed senior unsecured 4.15% notes at maturity and $40.0 million of the 2017 Series A 4.42% notes at maturity.
The Company also elected to repay in full the remaining outstanding principal of the 2016, 2017 and 2018 Notes prior to their respective maturity dates during the year ended December 31, 2025. The repayments totaled $860.0 million, consisting of $250.0 million related to the 2016 Notes, $260.0 million related to the 2017 Notes and $350.0 million related to the 2018 Notes.
The Company incurred debt extinguishment costs of $8.2 million relating to the repayment of the 2016, 2017 and 2018 Notes prior to their respective maturity dates.
Normal Course Issuer Bid
On May 1, 2025, the Company received approval from the Toronto Stock Exchange (“TSX”) to renew its normal course issuer bid (the “NCIB”) pursuant to which the Company may purchase up to a maximum of 5% of its issued and outstanding common shares. The Company is authorized to acquire an aggregate of $1.0 billion of its common shares under the NCIB. Under the NCIB, the Company may purchase its common shares for cancellation during the period commencing May 4, 2025 and ending on May 3, 2026. The Company intends to repurchase its common shares through the facilities of the TSX, the New York Stock Exchange or other designated exchanges and alternative trading systems in Canada and the United States in accordance with applicable regulatory requirements. All common shares purchased under the NCIB will be cancelled. Under the Company’s prior NCIB, which commenced on May 4, 2024 and ended on May 3, 2025, the Company obtained approval to purchase up to a total of 24,961,914 common shares of which 1,862,133 were purchased through the facilities of the TSX and NYSE at a weighted average price of approximately $80.5585 per common share.
Disposition of interest in Orla Mining Ltd.
During the third quarter of 2025, the Company sold 38,002,589 common shares of Orla Mining Ltd. (“Orla”) at a price of C$14.75 per common share for total consideration of C$560.5 million ($404.8 million). An after tax gain of $230.4 million was recognized through other comprehensive income, while a loss on the sale of shares resulting from the discount to market price of $34.1 million was recognized in net income.
3
Canada - LaRonde
LaRonde is 100% owned by the Company and located in the Abitibi region of northwestern Quebec, approximately halfway between cities of Val-d’Or and Rouyn-Noranda. LaRonde consists of the mining, milling and processing operations at the LaRonde mine and the mining and processing operations at LZ5. The LaRonde mine achieved commercial production in 1988. LZ5, which lies adjacent to and west of the LaRonde mine, achieved commercial production in June 2018.
The risk of more frequent and larger seismic events has increased as the Company mines deeper at the LaRonde mine. The Company continues to adjust its mining methods, ground support and protocols to address seismic activity in the deeper portions of the mine.
LaRonde’s proven and probable mineral reserves at December 31, 2025 were approximately 2.8 million ounces, including approximately 0.9 million ounces at LZ5. Under current mine plans, the LaRonde mine and LZ5 are expected to be in production through 2034 and 2036, respectively.
Canada - Canadian Malartic
Canadian Malartic is 100% owned by the Company and located in the Abitibi region of northwestern Quebec in the town of Malartic, approximately 25 kilometres west of Val-d’Or and 80 kilometres east of Rouyn-Noranda. Canadian Malartic consists of the mining, milling and processing operations at the Canadian Malartic mine and the mining operations at the Odyssey mine
The Canadian Malartic pit was depleted in 2023 and open pit operations continue at the Barnat pit. Mining at the Odyssey mine uses underground methods. The mine design at the Odyssey mine includes a 1,800 metre deep production-services shaft with an expected capacity of approximately 20,000 tonnes of ore per day once commissioned.
Canadian Malartic’s proven and probable mineral reserves at December 31, 2025 were approximately 9.1 million ounces, including 5.7 million ounces at the East Gouldie deposit, which will be accessed from the infrastructure at the Odyssey mine. Under current mine plans, Canadian Malartic is expected to be in production through 2042.
Canada - Goldex
Goldex is 100% owned by the Company and is located in the Abitibi region of northwestern Quebec at Val-d’Or, approximately 60 kilometres and 25 kilometres east of LaRonde and Canadian Malartic, respectively. Goldex consists of the mining, milling and processing facilities at the Goldex mine and the open pit operations at Akasaba West, located approximately 30 kilometres from the Goldex minesite. Ore from Akasaba West is processed at the Goldex mill. Goldex achieved commercial production from the M and E satellite zones in October 2013 and from the Deep 1 Zone in July 2017. Akasaba West achieved commercial production in February 2024.
Goldex’s proven and probable mineral reserves were approximately 0.9 million ounces at December 31, 2025, including approximately 0.1 million ounces at Akasaba West. Under current mine plans, Goldex is expected to be in production through 2032.
Canada - Meliadine
Meliadine is 100% owned by the Company and located near the western shore of Hudson Bay in the Kivalliq region of Nunavut, approximately 25 kilometres north of Rankin Inlet and 290 kilometres southeast of Meadowbank. Commercial production was achieved at Meliadine in May 2019.
Meliadine’s proven and probable mineral reserves were approximately 3.6 million ounces at December 31, 2025. Under current mine plans, Meliadine is expected to be in production through 2036.
Canada - Meadowbank
Meadowbank is 100% owned by the Company and consists of the mining, milling and processing operations at the Meadowbank minesite and the mining operations at the Amaruq open pit and underground mines. The Meadowbank minesite is located in Nunavut Territory, approximately 70 kilometres north of Baker Lake and Amaruq is located 50 kilometres northwest of Meadowbank. Commercial production was achieved at the Meadowbank mine in March 2010, at Amaruq open pit in September 2019 and at Amaruq underground in August 2022. Mining operations at the Meadowbank minesite ceased in 2019 but the Meadowbank mill and other infrastructure remain active in support of operations at Amaruq.
4
Meadowbank’s proven and probable mineral reserves were approximately 1.5 million ounces at December 31, 2025. Under current mine plans, Meadowbank is expected to be in production through 2030.
Canada - Hope Bay
Hope Bay is 100% owned by the Company and is located in the Kitikmeot region of Nunavut.
The Company suspended mining activities at the Hope Bay project in February 2022 following its acquisition and since that time the Company’s primary focus at the project is the evaluation of larger production scenarios, with study completion targeted for the first half of 2026.
Hope Bay’s proven and probable mineral reserves were approximately 3.4 million ounces at December 31, 2025.
Canada - Detour Lake
Detour Lake is 100% owned by the Company and is located in northeastern Ontario, approximately 300 kilometres northeast of Timmins and 185 kilometres by road northeast of Cochrane, Ontario.
In 2024, the Company approved expenditure of $100.0 million at its Detour Lake Underground project to further study the project over approximately three years. Approximately $45 million was spent in 2024 and 2025 to advance technical studies and drilling, key surface infrastructure, and to develop an exploration ramp to collect a bulk sample and to facilitate infill and expansion drilling of the current underground mineral resource. In 2025, the Company approved an additional $200.0 million, supplementing the $100 million previously approved in June 2024, to continue advancing and expand the Detour Lake underground project through to a potential approval decision in 2027.
Detour Lake’s proven and probable mineral reserves were approximately 18.6 million ounces at December 31, 2025. Under current mine plans, Detour Lake is expected to be in production through 2052.
Canada - Macassa
Macassa is 100% owned by the Company and is located in the historic gold mining region of Kirkland Lake, Ontario. Production under previous owners at Macassa first commenced in 1933, but was suspended between 1999 and 2002.
Macassa’s proven and probable mineral reserves were approximately 2.2 million ounces at December 31, 2025. Under current mine plans, Macassa is expected to be in production through 2032.
Finland - Kittila
Kittila is 100% owned by the Company and is located in the Lapland region of northern Finland, approximately 900 kilometres north of Helsinki and 150 kilometres north of the Arctic Circle. Commercial production was achieved at Kittila in May 2009.
Proven and probable mineral reserves at Kittila were approximately 3.3 million ounces at December 31, 2025. Under current mine plans, Kittila is expected to be in production through 2037.
Australia - Fosterville
Fosterville is 100% owned by the Company and located approximately 20 kilometres northeast of the city of Bendigo and 130 kilometres north of the city of Melbourne in Victoria, Australia. Commercial production was achieved at Fosterville in April 2005.
Fosterville’s proven and probable mineral reserves were approximately 1.7 million ounces at December 31, 2025. Under current mine plans, Fosterville is expected to be in production through 2037.
Mexico - Pinos Altos
Pinos Altos is 100% owned by the Company and is located in northern Mexico, approximately 220 kilometres west of the city of Chihuahua. Commercial production was achieved at Pinos Altos in November 2009.
5
Pinos Altos’ proven and probable mineral reserves were approximately 0.3 million ounces at December 31, 2025. Under current mine plans, the mine is expected to be in production through 2028.
Mexico - San Nicolás
The San Nicolás copper-zinc project is an advanced exploration project located in central Mexico, approximately 60 kilometres southeast of the city of Zacatecas.
Agnico Eagle is earning into a 50% interest in the project in April 2023 from Teck Resources Limited and the two companies have formed a joint venture to advance permitting and development of San Nicolás.
San Nicolás’ proven and probable mineral reserves, on a 50% basis representing the Company’s interest were approximately 52.6 million tonnes at average grades of 1.12% copper, 1.48% zinc, 0.40 g/t gold and 22 g/t silver at December 31, 2025.
The key drivers of financial performance for Agnico Eagle for the year ended December 31, 2025 include:
| ● | the spot price of gold; |
| ● | production volumes; |
| ● | production costs; and |
| ● | US dollar/Canadian dollar, US dollar/Australian dollar, US dollar/Euro and US dollar/Mexican peso exchange rates. |
Details on future drivers of financial performance are discussed in the Outlook section of this MD&A.
Spot Price of Gold
GOLD ($ per ounce)
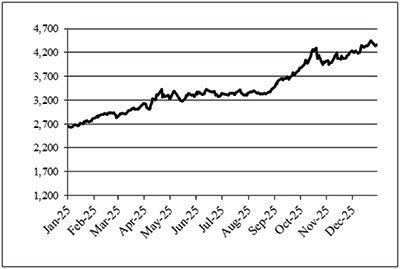
| | 2025 | | 2024 | | % Change |
| ||
High price | | $ | 4,449 | | $ | 2,778 |
| 60.2 | % |
Low price | | $ | 2,633 | | $ | 1,985 |
| 32.6 | % |
Average market price | | $ | 3,432 | | $ | 2,386 |
| 43.8 | % |
Average realized price | | $ | 3,454 | | $ | 2,384 |
| 44.9 | % |
6
Gold prices remained a primary driver of the Company’s financial performance in 2025. The average market price per ounce of gold in 2025 was 43.8% higher than in 2024, reflecting a strong and sustained improvement in global pricing conditions. The Company achieved an average realized gold price that was 44.9% higher than in the prior year, benefiting from the favourable commodity environment and the Company’s ability to consistently secure realized prices that closely track underlying market movements. The significant increase in gold price supported higher revenue generation across the Company’s operating portfolio.
Production Volumes and Costs
Changes in production volumes remain a critical driver of the Company’s operating and financial performance, given its direct influence on revenue generation. In 2025, payable gold production totaled 3,447,367 ounces, representing a 0.9% decrease from 3,485,336 ounces in 2024. The slight decline in production in 2025 is mainly due to a decrease in gold production from Fosterville and Canadian Malartic, consistent with their expected grade and sequencing profiles, as well as the planned closure of the La India mine at the end of 2024. The impacts of these declines were partially mitigated by increased production at LaRonde, Macassa and Detour Lake.
Production costs are discussed in detail in the Results of Operations section below.
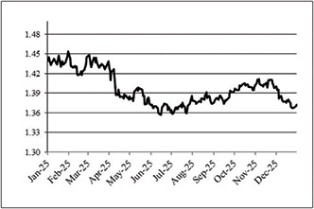
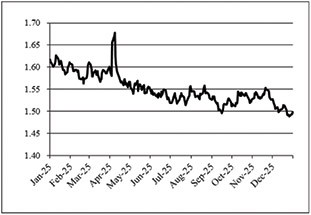
Foreign Exchange Rates (ratio to US dollars)
The exchange rate of the Canadian dollar, Australian dollar, Euro and Mexican peso relative to the US dollar is an important financial driver for the Company due to the Company’s multi‑jurisdictional operating footprint and that all revenues are denominated in US dollars. A significant portion of operating costs at LaRonde, Canadian Malartic, Goldex, Meliadine, Meadowbank, Detour Lake and Macassa are incurred in Canadian dollars; at Fosterville in Australian dollars; at Kittila in Euros; and at Pinos Altos in Mexican pesos. As a result, fluctuations in these currencies relative to the US dollar directly influence reported production costs.
The Company partially mitigates this foreign currency exposure through its established currency hedging strategies.
CANADIAN DOLLAR | | AUSTRALIAN DOLLAR |
| |
|
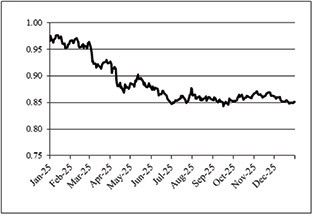
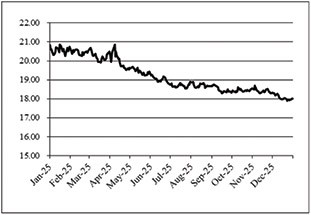
EURO | | MEXICAN PESO |
| |
|
7
On average in 2025 compared with 2024, the Canadian dollar, Australian dollar and Mexican Peso weakened, while the Euro strengthened relative to the US dollar. These currency movements generally reduced the US dollar equivalent of costs incurred in currencies that depreciated, providing a favourable impact on operating costs, while the stronger Euro resulted in higher reported costs at Kittila.
Agnico Eagle reported net income of $4,461.5 million, or $8.89 per share, in 2025 compared with net income of $1,895.6 million, or $3.79 per share in 2024 and net income of $1,941.3 million, or $3.97 per share in 2023. Agnico Eagle reported adjusted net income(i) of $4,169.2 million, or $8.31 per share(i), in 2025 compared with adjusted net income of $2,117.8 million, or $4.24 per share, in 2024 and adjusted net income of $1,095.9 million, or $2.24 per share in 2023.
EBITDA(i) totaled $8,440.4 million in the year ended December 31, 2025 compared with $4,462.4 million in 2024 and $3,980.9 million in 2023. Adjusted EBITDA(i) totaled $8,089.8 million in the year ended December 31, 2025 compared with $4,693.7 million in 2024 and $3,236.5 million in 2023. In 2025, operating margin(i) increased to $8,567.2 million from $5,199.7 million in 2024. In 2023, operating margin was $3,693.6 million.
Agnico Eagle reported free cash flow(i) of $4,398.9 million in 2025, compared with free cash flow of $2,142.9 million in 2024 and $947.4 million in 2023. Free cash flow before changes in non-cash components of working capital(i) totaled $3,594.6 million in 2025 compared with $2,062.9 million in 2024 and $1,093.8 million in 2023.
Revenues from Mining Operations
Revenues from mining operations, net of selling costs, increased by $3,622.1 million, or 43.7%, to $11,907.9 million in 2025 from $8,285.8 million in 2024 primarily due to a 44.9% increase in realized gold prices, partially offset by a 1.0% decrease in the sales volume of gold. The lower sales volume of gold from Fosterville, La India and Canadian Malartic, was partially offset by higher sales volume of gold from LaRonde, Macassa and Detour Lake. Revenues from mining operations were $6,626.9 million in 2023.
Sales of precious metals (gold and silver) accounted for 99.5% of revenues from mining operations in 2025, consistent with the contribution levels in 2024 and 2023.
Note:
| (i) | Adjusted net income, adjusted net income per share, EBITDA, adjusted EBITDA, free cash flow, free cash flow before changes in non-cash components of working capital and operating margin are non-GAAP measures that are not standardized financial measures under IFRS Accounting Standards. For a reconciliation to net income, net income per share and cash provided by operating activities and discussion of the composition and usefulness of these non-GAAP measures see “Non-GAAP Financial Performance Measures”. |
8
The table below sets out revenues from mining operations, payable production volumes and sales volumes by metal:
| | 2025 | | 2024 | | 2023 | |||
Revenues from mining operations: | | (thousands of United States dollars) | |||||||
Gold | | $ | 11,741,876 | | $ | 8,174,102 | | $ | 6,540,077 |
Silver | |
| 105,265 | |
| 79,270 | |
| 63,544 |
Zinc | |
| 8,674 | |
| 4,008 | |
| 4,736 |
Copper | |
| 52,036 | |
| 28,373 | |
| 18,552 |
Total revenues from mining operations | | $ | 11,907,851 | | $ | 8,285,753 | | $ | 6,626,909 |
Payable production: | |
| | |
| | |
| |
Gold (ounces) | |
| 3,447,367 | |
| 3,485,336 | |
| 3,439,654 |
Silver (thousands of ounces) | |
| 2,501 | |
| 2,485 | |
| 2,408 |
Zinc (tonnes) | |
| 8,446 | |
| 6,339 | |
| 7,702 |
Copper (tonnes) | |
| 5,393 | |
| 3,951 | |
| 2,617 |
Payable metal sold(i): | |
| | |
| | |
| |
Gold (ounces) | |
| 3,400,919 | |
| 3,434,094 | |
| 3,364,132 |
Silver (thousands of ounces) | |
| 2,376 | |
| 2,483 | |
| 2,354 |
Zinc (tonnes) | |
| 8,799 | |
| 6,209 | |
| 8,526 |
Copper (tonnes) | |
| 5,337 | |
| 3,952 | |
| 2,630 |
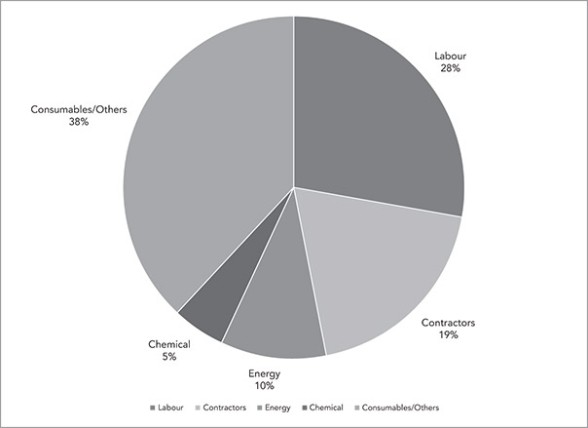
Production costs increased to $3,340.7 million in 2025 compared with $3,086.1 million in 2024 due to higher production costs mainly at Meadowbank, Detour Lake, Meliadine and Pinos Altos, partially offset by lower production costs at La India and Canadian Malartic. Production costs were $2,933.3 million in 2023 which included fair value adjustments to inventory at Canadian Malartic.
Production costs increased in 2025 when compared to the prior-year period primarily due to higher royalties arising from higher gold prices combined with increased contractor and labour costs related to underground mining operations, partially offset by the benefit of the weaker Canadian dollar during the period. A detailed discussion of production costs and cost metrics by mine is provided in the “Minesite Discussion” section below.
Note:
| (i) | Payable metals sold at Canadian Malartic, Detour Lake and Macassa exclude the in-kind royalties of 5.0%, 2.0% and 1.5%, respectively, paid in respect of gold production at such mines. For the year ended December 31, 2025, it excludes 2,500 payable gold ounces sold at La India. |
9
The table below sets out production costs by mine:
| | 2025 | | 2024 | | 2023 | |||
| | (thousands of United States dollars) | |||||||
LaRonde | | $ | 360,025 | | $ | 319,495 | | $ | 299,644 |
Canadian Malartic(i) | |
| 488,160 | |
| 532,037 | |
| 465,814 |
Goldex | |
| 148,952 | |
| 129,977 | |
| 112,022 |
Quebec | |
| 997,137 | |
| 981,509 | |
| 877,480 |
Detour Lake | |
| 565,439 | |
| 497,079 | |
| 453,498 |
Macassa | |
| 221,718 | |
| 201,371 | |
| 155,046 |
Ontario | |
| 787,157 | |
| 698,450 | |
| 608,544 |
Meliadine | |
| 402,385 | |
| 350,280 | |
| 343,650 |
Meadowbank | |
| 552,470 | |
| 463,464 | |
| 524,008 |
Nunavut | |
| 954,855 | |
| 813,744 | |
| 867,658 |
Fosterville | |
| 146,382 | |
| 147,045 | |
| 131,298 |
Australia | |
| 146,382 | |
| 147,045 | |
| 131,298 |
Kittila | |
| 236,238 | |
| 227,334 | |
| 205,857 |
Europe | |
| 236,238 | |
| 227,334 | |
| 205,857 |
Pinos Altos | |
| 205,808 | |
| 168,231 | |
| 145,936 |
La India | |
| — | |
| 49,767 | |
| 96,490 |
Mexico | |
| 205,808 | |
| 217,998 | |
| 242,426 |
Corporate and Other | |
| 13,107 | |
| — | |
| — |
Total production costs | | $ | 3,340,684 | | $ | 3,086,080 | | $ | 2,933,263 |
The chart below sets out the major components of production costs:
Total Production Costs by Category 2025
Note:
| (i) | The information set out in this table reflects the Company’s 50% interest in Canadian Malartic up to and including March 30, 2023 and 100% interest thereafter following the closing of the Yamana Transaction. |
Exploration and Corporate Development Expense
Exploration and corporate development expense decreased by 5.9% to $206.7 million in 2025 from $219.6 million in 2024. Exploration and corporate development expense was $215.8 million in 2023.
10
A summary of the Company’s significant 2025 exploration and corporate development activities is set out below:
| ● | Exploration expenses at various mine sites increased by 48% to $57.7 million in 2025 compared with $39.0 million in 2024 primarily due to higher expensed exploration at Canadian Malartic and Fosterville. |
| ● | Exploration expenses in Canada decreased by 35% to $65.1 million in 2025 compared with $100.5 million in 2024 primarily due to lower expensed exploration drilling at regional targets at Canadian Malartic and Hope Bay. |
| ● | Increased exploration expenses in regional targets located in Europe and Latin America were offset by decreased exploration expenses in the United States. |
The table below sets out exploration expense by region and total corporate development expense:
| | 2025 | | 2024 | | 2023 | |||
| | (thousands of United States dollars) | |||||||
Minesites | | $ | 57,747 | | $ | 39,003 | | $ | 56,475 |
Canada | |
| 65,147 | |
| 100,484 | |
| 79,509 |
Latin America | |
| 12,037 | |
| 10,221 | |
| 13,585 |
United States | |
| 1,567 | |
| 4,670 | |
| 4,177 |
Europe | |
| 9,145 | |
| 6,167 | |
| 4,986 |
Australia | |
| 5,282 | |
| 5,088 | |
| 4,033 |
Corporate development and project evaluation expenses | |
| 55,759 | |
| 53,977 | |
| 53,016 |
Total exploration and corporate development expense | | $ | 206,684 | | $ | 219,610 | | $ | 215,781 |
Amortization of Property, Plant and Mine Development
Amortization of property, plant and mine development expense increased to $1,645.3 million in 2025 compared with $1,514.1 million in 2024 and $1,491.8 million in 2023. The increase in amortization of property, plant and mine development between 2025 and 2024 was primarily due to higher amortization at Meliadine, Canadian Malartic and Detour Lake, partially offset by a decrease at Macassa.
General and Administrative Expense
General and administrative expenses were $235.9 million in 2025, an increase of $28.5 million compared to $207.5 million in 2024. The increase in general and administrative expenses was primarily due to higher stock-based compensation driven by an increase in the Company’s share price between periods. General and administrative expenses were $208.5 million in 2023.
Finance costs were $91.1 million in 2025 compared with $126.7 million in 2024 and $130.1 million in 2023. The decrease between 2025 and 2024 was primarily due to a decrease in interest expense on the Company’s guaranteed senior unsecured notes as a result of $950.0 million in note repayments during 2025.
The table below sets out the components of finance costs:
| | 2025 | | 2024 | | 2023 | |||
Interest on Notes | | $ | 32,070 | | $ | 53,229 | | $ | 57,192 |
Interest on Term Loan Facility | |
| — | |
| 32,712 | |
| 26,273 |
Interest on Credit Facility | |
| — | |
| 3,350 | |
| 10,928 |
Credit Facility fees | |
| 6,731 | |
| 6,167 | |
| 6,374 |
Amortization of credit and term loan financing and note issuance costs | |
| 4,490 | |
| 3,845 | |
| 3,290 |
Debt extinguishment costs | |
| 8,245 | |
| — | |
| — |
Accretion expense on reclamation provisions | |
| 38,237 | |
| 33,815 | |
| 32,906 |
Interest on lease obligations and other interest expense (income) | |
| 5,552 | |
| (3,566) | |
| (3,699) |
Interest capitalized to assets under construction | |
| (4,180) | |
| (2,814) | |
| (3,177) |
Total finance costs | | $ | 91,145 | | $ | 126,738 | | $ | 130,087 |
11
See Note 14 in the consolidated financial statements for additional details on the Company’s Credit Facility, the Term Loan Facility and Notes referenced above.
Derivative Financial Instruments
Gain on derivative financial instruments was $224.0 million in 2025 compared to a loss on derivative financial instruments of $155.8 million in 2024 and a gain of $68.4 million in 2023. The change between 2025 and 2024 was primarily due to more favourable market conditions that generated $127.6 million in unrealized gains on currency and commodity derivatives in 2025 compared to $142.4 million in unrealized losses in 2024. Unrealized gains on warrants also totalled $111.2 million in 2025 compared to unrealized gains of $20.4 million in 2024.
In 2025, the Company identified indicators of impairment reversal at Macassa driven by the effect of the significant and sustained increase in the gold price which supported higher long-term gold price assumptions, and accordingly performed a reversal assessment of Macassa. As the estimated recoverable amount exceeded the carrying amount (adjusted for amortization that would have been recognized absent the previous impairment), the Company recorded an impairment reversal of $229.0 million ($156.0 million net of tax) in the consolidated statements of income.
See Note 24 in the consolidated financial statements for further details on impairment reversals.
Foreign Currency Translation (Gain) Loss
The Company’s operating results and cash flow are significantly affected by changes in the exchange rate between the US dollar and each of the Canadian dollar, Australian dollar, Euro and Mexican peso as all of the Company’s revenues are earned in US dollars while a significant portion of its operating and capital costs are incurred in such other currencies. During the period from January 1, 2025 through December 31, 2025, the daily US dollar closing exchange rate per US$1.00 fluctuated between C$1.36 and C$1.46 as reported by the Bank of Canada, A$1.53 and A$1.67 as reported by the Reserve Bank of Australia, €0.84 and €0.98 as reported by the European Central Bank and 17.90 and 20.85 Mexican pesos as reported by the Central Bank of Mexico.
A foreign currency translation gain of $25.7 million was recorded in 2025 compared with a $9.4 million loss in 2024 and a $0.3 million gain in 2023. On average in 2025, the US dollar strengthened relative to the Canadian dollar, the Australian dollar, and the Mexican peso. As at December 31, 2025, the US dollar weakened relative to the Canadian dollar, the Australian dollar, the Euro and the Mexican peso as compared to December 31, 2024. The net foreign currency translation gain in 2025 was primarily due to the translation impact on the Company’s net monetary assets denominated in foreign currencies between periods.
Other income and expenses increased to $93.0 million in the year ended December 31, 2025 compared with $84.5 million in the year ended December 31, 2024, primarily due to the loss on the sale of equity securities in the current period, partially offset by higher levels of interest income on cash balances. Other income and expenses amounted to $66.3 million in the year ended December 31, 2023.
Income and Mining Taxes Expense
In 2025, the Company recorded income and mining taxes expense of $2,242.5 million on income before income and mining taxes of $6,703.9 million yielding an effective tax rate of 33.4%. In 2024, the Company recorded income and mining taxes expense of $926.0 million on income before income and mining taxes of $2,821.6 million yielding an effective tax rate of 32.8%. The Company’s 2025 and 2024 effective tax rate is higher than the applicable statutory tax rate of 26.0% due to the impact of mining taxes. In 2023, the Company recorded income and mining taxes expense of $417.8 million on income before income and mining taxes of $2,359.1 million at an effective tax rate of 17.7%.
Net deferred income and mining tax liabilities increased by $222.1 million between December 31, 2025 and December 31, 2024 primarily due to the origination and reversal of net taxable temporary differences.
Net income taxes payable increased by $871.1 million between December 31, 2025 and December 31, 2024 as a result of the Company’s current tax expense exceeding payments to tax authorities during the year.
12
(thousands of United States dollars) | | As at December 31, 2025 | | As at December 31, 2024 | | As at December 31, 2023 | |||
Current assets | | $ | 4,993,942 | | $ | 2,805,281 | | $ | 2,191,152 |
Non-current assets | |
| 29,477,349 | |
| 27,181,737 | |
| 26,493,797 |
Total assets | | $ | 34,471,291 | | $ | 29,987,018 | | $ | 28,684,949 |
Current liabilities | | $ | 2,472,206 | | $ | 1,511,965 | | $ | 1,048,026 |
Non-current liabilities | |
| 7,256,621 | |
| 7,642,153 | |
| 8,214,008 |
Total liabilities | | $ | 9,728,827 | | $ | 9,154,118 | | $ | 9,262,034 |
Total assets at December 31, 2025 of $34.5 billion increased by 15.0%, or $4.5 billion compared with total assets of $30.0 billion at December 31, 2024. The Company’s total assets are primarily comprised of non-current assets such as property, plant and mine development and goodwill.
Total liabilities at December 31, 2025 of $9.7 billion increased by 6.3%, or $0.6 billion compared with total liabilities of $9.2 billion at December 31, 2024. The Company’s total liabilities are primarily comprised of non-current liabilities such as deferred income and mining tax liabilities and reclamation provisions.
The increase in total assets between December 31, 2025 and December 31, 2024 was primarily due to an increase in cash and cash equivalents, property, plant and mine development and investments. The increase in total liabilities between December 31, 2025 and December 31, 2024 was primarily due to an increase in income taxes payable and reclamation provisions, partially offset by a decrease in long-term debt due to repayments of Notes.
The increase in total assets between December 31, 2024 and December 31, 2023 was primarily due to an increase in cash and cash equivalents and increases in current and non-current inventory balances. The decrease in total liabilities between December 31, 2024 and December 31, 2023 was primarily due to the repayment of the $600.0 million Term Loan Facility in 2024.
Liquidity and Capital Resources
As at December 31, 2025, the Company’s cash and cash equivalents totaled $2,866.1 million compared with $926.4 million as at December 31, 2024. The Company’s policy is to invest excess cash in what the Company believes to be highly liquid investments of high credit quality to attempt to reduce risks associated with these investments. Investments with remaining maturities of less than three months at the time of purchase are classified as cash equivalents. The Company’s decisions regarding the length of maturities it holds are based on anticipated cash flow requirements, rates of return and other factors.
Working capital (current assets less current liabilities) increased to $2,521.7 million as at December 31, 2025, compared with $1,293.3 million as at December 31, 2024, primarily due to a $1,939.6 million increase in cash and cash equivalents as a result of higher operating margins, partially offset by an increase in income taxes payable.
In August 2025, Moody’s revised its rating outlook for the Company to stable from positive and upgraded the Company’s long-term issuer rating to A3 from Baa1, reflecting the Company’s strengthening credit profile and financial position.
Subject to various risks and uncertainties, including those set out in this MD&A, and in the Company’s 2025 AIF, the Company believes it will generate sufficient cash flow from operations and has adequate cash and debt facilities available to finance its current operations, working capital requirements, contractual obligations, debt maturities, planned capital expenditure and exploration programs. While the Company believes its capital resources will be sufficient to satisfy all its mandatory and discretionary commitments, the Company may choose to decrease its discretionary expenditure commitments, which include certain capital expenditures and exploration and corporate development expenses, should unexpected financial circumstances arise in the future. See “Risk Profile” in this MD&A for further details.
Cash provided by operating activities increased by $2,856.2 million to $6,817.1 million in 2025 compared with $3,960.9 million in 2024. The increase in cash provided by operating activities was primarily due to higher operating margin and favourable working capital movements. Cash provided by operating activities was $2,601.6 million in 2023.
13
Cash used in investing activities increased to $2,598.3 million in 2025 compared to $2,007.1 million in 2024. The increase in cash used in investing activities was primarily due to higher capital expenditures between periods, increased purchases of equity securities and the purchase of O3 Mining in the first quarter of 2025. Cash used in investing activities was $2,760.8 million in 2023, which included $1,000.6 million in net cash consideration paid by the Company in the Yamana Transaction.
In 2025, additions to property, plant and mine development totaled $2,418.2 million compared with $1,817.9 million in 2024. The $600.3 million increase in additions to property, plant and mine development between 2025 and 2024 was primarily due to an increase in capital expenditures at Canadian Malartic and Hope Bay.
In 2025, the Company purchased $447.5 million of equity securities and other investments compared with $183.0 million in 2024 and $104.7 million in 2023. The Company’s investments in equity securities consist primarily of investments in common shares of entities in the mining industry. In 2025, the Company received $402.7 million in proceeds from the sale of equity securities and other investments primarily from the sale of the Company’s investment in Orla.
Cash used in financing activities increased to $2,287.1 million in 2025 compared with $1,356.3 million in 2024 primarily due to the $950.0 million repayment of the guaranteed senior notes during the current year and an increase in the repurchase of common shares between periods under the NCIB. Cash used in financing activities was $164.0 million in 2023.
The Company issued common shares for net proceeds of $118.1 million in 2025 compared to $235.5 million in 2024, attributable to employee stock option plan exercises, issuances under the incentive share purchase plan and the dividend reinvestment plan. Net proceeds from the issuance of common shares were $70.3 million in 2023.
On May 1, 2025, the Company received approval from the TSX to renew its NCIB pursuant to which the Company may purchase up to a maximum of 5% of its issued and outstanding common shares. The Company is authorized to acquire an aggregate of $1.0 billion of its common shares under the NCIB. Under the NCIB, the Company may purchase its common shares for cancellation during the period commencing May 4, 2025 and ending on May 3, 2026. The Company intends to repurchase its common shares through the facilities of the TSX, the New York Stock Exchange or other designated exchanges and alternative trading systems in Canada and the United States in accordance with applicable regulatory requirements. All common shares purchased under the NCIB will be cancelled.
During the year ended December 31, 2025, the Company repurchased 4,114,150 common shares for $599.7 million at an average price of $145.76 under the NCIB. During the year ended December 31, 2024, the Company repurchased 1,749,086 common shares for $119.9 million at an average price of $68.54 under the NCIB. During the year ended December 31, 2023, the Company repurchased 100,000 common shares for $4.8 million at an average price of $47.74 under the NCIB.
In 2025, the Company declared dividends of $1.60 per share and paid cash dividends totaling $728.1 million compared with dividends declared of $1.60 per share and cash dividends paid of $671.7 million in 2024. In 2023, the Company declared dividends of $1.60 per share and paid cash dividends totaling $638.6 million. Agnico Eagle has declared a cash dividend every year since 1983. Although the Company expects to continue paying dividends, future dividends will be at the discretion of the Board and will be subject to factors such as income, financial condition and capital requirements.
During the year ended December 31, 2025, Agnico Eagle repaid $50.0 million of its 2015 guaranteed senior unsecured 4.15% notes at maturity and $40.0 million of the 2017 Series A 4.42% notes at maturity. Agnico Eagle also elected to repay in full the remaining outstanding principal of the 2016, 2017 and 2018 Notes prior to their respective maturity dates during the year ended December 31, 2025. The repayment totaled $860.0 million, consisting of $250.0 million related to the 2016 Notes, $260.0 million related to the 2017 Notes and $350.0 million related to the 2018 Notes. The Company incurred debt extinguishment costs of $8.2 million relating to the repayment of the 2016, 2017 and 2018 Notes prior to their respective maturity dates.
On February 12, 2024, the Company terminated its previous credit facility and entered into the Credit Facility. The Credit Facility matures and all indebtedness thereunder is due and payable on February 12, 2029. The Credit Facility is available in US dollars through Secured Overnight Financing Rate (“SOFR”) and base rate advances, or in Canadian dollars through Canadian Overnight Repo Rate Average (“CORRA”) and prime rate advances, priced at the applicable rate plus a margin that ranges from 0.00% to 2.00%. The Credit Facility also provides for the issuance of letters of credit, priced at the applicable rate plus a margin that varies from 0.60% to 2.00%.
14
The lenders under the Credit Facility are each paid a standby fee at a rate that ranges from 0.09% to 0.25% of the undrawn portion of the Credit Facility. In each case, the applicable margin or standby fees vary depending on the Company’s credit rating. The Company’s payment and performance of its obligations under the Credit Facility are not guaranteed by any of its subsidiaries, however the Company must provide guarantees from certain of its subsidiaries (i) if any existing material indebtedness of the Company benefits from guarantees and the Company no longer maintains an investment grade credit rating, (ii) or if the Company incurs new material indebtedness for borrowed money, or refinances existing material indebtedness (including material alterations to the terms of such indebtedness, but excluding maturity date extensions), and provides guarantees of such new or refinanced indebtedness from any of its subsidiaries.
As at December 31, 2025, the Company’s outstanding balance under the Credit Facility was nil. Credit Facility availability is reduced by outstanding letters of credit which were $24.2 million as of December 31, 2025, resulting in $1,975.8 million available for future drawdown.
Effective September 20, 2022, the Company amended its credit agreement with a financial institution relating to an uncommitted letter of credit facility (as amended, the “First LC Facility”) to increase the amount available to C$400.0 million. The First LC Facility may be used to support the reclamation obligations or non-financial or performance obligations of the Company or its subsidiaries. As at December 31, 2025, the aggregate undrawn face amount of letters of credit under the First LC Facility is $291.9 million.
Effective September 16, 2021, the Company amended its uncommitted standby letter of credit facility (as amended, the “Second LC Facility”) to increase the amount available to C$200.0 million. Payment and performance of the Company’s obligations under the Second LC Facility are supported by an account performance security guarantee issued by Export Development Canada in favour of the lender. The Second LC Facility may be used by the Company to support the reclamation obligations of the Company, its subsidiaries or any entity in which the Company has a direct or indirect interest or the performance obligations (other than with respect to indebtedness for borrowed money) of the Company, its subsidiaries or any entity in which the Company has a direct or indirect interest that are not directly related to reclamation obligations. As at December 31, 2025, the aggregate undrawn face amount of letters of credit under the Second LC Facility is nil.
Effective May 25, 2023, the Company amended its uncommitted standby letter of credit facility with a financial institution (the “Third LC Facility”) to increase the amount available to C$200.0 million. Letters of credit issued under the Third LC Facility may be used to support the reclamation obligations or non-financial or performance obligations of the Company or its subsidiaries; however the subsidiary guarantees were released in connection with the entry into the Credit Facility. As at December 31, 2025, the aggregate undrawn face amount of letters of credit under the Third LC Facility was $120.7 million.
In October 2021, the Company entered into a $75.0 million uncommitted standby letter of credit facility (the “Fourth LC Facility”) with a financial institution. Letters of credit issued under the Fourth LC Facility may be used to support the reclamation obligations or non-financial or performance obligations of the Company or its subsidiaries. In October 2024, the Fourth LC Facility was amended to increase the amount available to $150.0 million. As at December 31, 2025, the aggregate undrawn face amount of letters of credit under the Fourth LC Facility was $145.4 million.
In January 2022, the Company entered into a C$100.0 million uncommitted standby letter of credit facility (the “Fifth LC Facility”) with a financial institution. Upon the acquisition of Kirkland in February 2022, the Company acquired a standby letter of credit facility with the same financial institution providing for an additional C$120.0 million uncommitted letter of credit facility for the Kirkland subsidiary. Effective September 2022, an amended and restated standby letter of facility combined these facilities and the amount available under the amended and restated facility was increased to C$320.0 million. Letters of credit issued under the Fifth LC Facility may be used to support the reclamation obligations or non-financial or performance obligations of the Company or its subsidiaries. As at December 31, 2025, the aggregate undrawn face amount of letters of credit under the Fifth LC Facility was $204.3 million.
The obligations of the Company under each of the LC Facilities other than then Second LC Facility were guaranteed by certain of its subsidiaries, however in connection with the Company’s entry into the Credit Facility on February 12, 2024, these subsidiary guarantees were released.
In February 2022, upon the acquisition of Kirkland, the Company acquired a standby letter of guarantee facility (the “Guarantee Facility”) with a financial institution providing for a $25.0 million uncommitted letter of guarantee facility. Guarantees issued under the Guarantee Facility may be used to support the reclamation obligations or non-financial or performance obligations of certain subsidiaries of the Company. The obligations of the Company under this Guarantee Facility were guaranteed by certain of its subsidiaries; however, the subsidiary guarantees were released in connection with the entry into the Credit Facility. In October 2024, the Company entered into a $200.0 million uncommitted standby letter of credit facility (the “Sixth LC Facility” and, together with the First LC Facility, the
15
Second LC Facility, the Third LC Facility, the Fourth LC Facility and the Fifth LC Facility, the “LC Facilities”) with a financial institution, which superseded and canceled the Guarantee Facility. As at December 31, 2025, the aggregate undrawn face amount of letters of credit under the Sixth LC Facility was $42.0 million.
As at December 31, 2025, the Company has indemnity agreements with four companies for the issuance of surety bonds of which $506.1 million of such surety bonds have been issued under these agreements.
The Company was in compliance with all covenants contained in the Credit Facility, the LC Facilities, and the Notes as at December 31, 2025.
Off-Balance Sheet Arrangements
The Company’s off-balance sheet arrangements as at December 31, 2025 include outstanding letters of credit for environmental and site restoration costs, custom credits, government grants and other general corporate purposes of $1,338.5 million under the Credit Facility and the LC Facilities (see Note 27 to the consolidated financial statements). If the Company were to terminate these off-balance sheet arrangements, the Company’s liquidity position (as outlined in the table below) is sufficient to satisfy any related penalties or obligations.
16
Agnico Eagle’s contractual obligations as at December 31, 2025 are set out below:
| | Total | | 2026 | | 2027-2028 | | 2029-2030 | | Thereafter | |||||
|
| (millions of United States dollars) | |||||||||||||
Reclamation provisions(i) | | $ | 1,535.1 | | $ | 149.5 | | $ | 287.4 | | $ | 244.5 | | $ | 853.7 |
Contractual commitments(ii) | |
| 728.9 | |
| 596.3 | |
| 45.5 | |
| 41.5 | |
| 45.6 |
Pension obligations(iii) | |
| 105.4 | |
| 5.6 | |
| 36.4 | |
| 7.6 | |
| 55.8 |
Lease obligations | |
| 133.7 | |
| 33.7 | |
| 34.9 | |
| 23.1 | |
| 42.0 |
Long-term debt - principal(iv) | |
| 200.0 | |
| — | |
| — | |
| 100.0 | |
| 100.0 |
Long-term debt - interest(iv) | |
| 35.7 | |
| 5.7 | |
| 11.4 | |
| 11.4 | |
| 7.2 |
Total(v) | | $ | 2,738.8 | | $ | 790.8 | | $ | 415.6 | | $ | 428.1 | | $ | 1,104.3 |
Notes:
| (i) | Mining operations are subject to environmental regulations that require companies to reclaim and remediate land disturbed by mining operations. The Company has submitted closure plans to the appropriate governmental agencies which estimate the nature, extent and costs of reclamation for each of its mining properties. Expected reclamation cash flows are presented above on an undiscounted basis. Reclamation provisions recorded in the Company’s consolidated financial statements are measured at the expected value of future cash flows discounted to their present value using a risk-free interest rate. |
| (ii) | Purchase commitments include contractual commitments for the acquisition of property, plant and mine development. In addition to the above, the Company has $290.0 million of committed subscription proceeds related to the San Nicolás project. |
| (iii) | Agnico Eagle provides defined benefit plans for certain current and former senior officers and certain employees. The benefits are generally based on the employee’s years of service, age and level of compensation. The data included in this table have been actuarially determined. |
| (iv) | The Company has assumed that repayment of its long-term debt obligations will occur on each instrument’s respective maturity date. |
| (v) | The Company’s future operating cash flows are expected to be sufficient to satisfy its contractual obligations. |
2026 Liquidity and Capital Resources Analysis
The Company believes that it has sufficient capital resources to satisfy its 2026 mandatory expenditure commitments (including the contractual obligations set out above) and discretionary expenditure commitments. The following table sets out expected capital requirements and resources for 2026:
| | Amount | |
| | (millions of United States dollars) | |
2026 Mandatory Commitments: | | | |
Contractual obligations, including capital expenditures (see table above) | | $ | 790.8 |
Accounts payable and accrued liabilities (as at December 31, 2025) | |
| 1,033.4 |
Total 2026 mandatory expenditure commitments | | $ | 1,824.2 |
2026 Discretionary Commitments: | |
| |
Expected capital expenditures | | $ | 2,575.0 |
Expected exploration and corporate development expenses | |
| 290.0 |
Total 2026 discretionary expenditure commitments | |
| 2,865.0 |
Total 2026 mandatory and discretionary expenditure commitments | | $ | 4,689.2 |
As of December 31, 2025, the Company believes it had adequate capital resources available to satisfy its commitments, which include cash and cash equivalents of $2,866.1 million and approximately $2.0 billion of available credit under the Credit Facility. In addition, the Company anticipates funding its commitments through cash provided by operating activities.
While the Company believes its capital resources will be sufficient to satisfy all 2026 commitments (mandatory and discretionary), the Company may choose to decrease certain of its discretionary expenditure commitments, which include certain capital expenditures and exploration and corporate development expenses, should unexpected financial circumstances arise in the future. The Company believes that it will continue to have sufficient capital resources available to satisfy its planned development and growth activities.
17
Minesite Discussion
LaRonde
LaRonde – Operating Statistics | | Three Months Ended | | Year Ended | ||||||||
| | December 31, | | December 31, | | December 31, | | December 31, | ||||
| | 2025 | | 2024 | | 2025 | | 2024 | ||||
Tonnes of ore milled (thousands of tonnes) | | | 692 | | | 802 | | | 2,805 | | | 2,849 |
Tonnes of ore milled per day |
| | 7,522 |
| | 8,717 |
| | 7,685 |
| | 7,784 |
Gold grade (g/t) |
| | 3.85 |
| | 3.78 |
| | 4.08 |
| | 3.62 |
Gold production (ounces) |
| | 80,290 |
| | 90,447 |
| | 344,555 |
| | 306,750 |
Production costs per tonne (C$) |
| C$ | 239 |
| C$ | 118 |
| C$ | 179 |
| C$ | 153 |
Minesite costs per tonne (C$) |
| C$ | 177 |
| C$ | 146 |
| C$ | 166 |
| C$ | 154 |
Production costs per ounce | | $ | 1,480 | | $ | 751 | | $ | 1,045 | | $ | 1,042 |
Total cash costs per ounce | | $ | 851 | | $ | 834 | | $ | 829 | | $ | 945 |
Gold production
Fourth Quarter of 2025 – Gold production at LaRonde decreased by 11.2% to 80,290 ounces in the fourth quarter of 2025 compared with 90,447 ounces in the fourth quarter of 2024, primarily due to lower throughput levels combined with lower gold grades, consistent with the planned mining sequence.
Full Year 2025 – Gold production at LaRonde increased by 12.3% to 344,555 ounces in 2025 compared with 306,750 ounces in 2024, due to higher gold grades as per the mining sequence and positive grade reconciliation, partially offset by lower throughput levels.
Production costs
Fourth Quarter of 2025 – Production costs at LaRonde increased by 74.9% in the fourth quarter of 2025 when compared with the fourth quarter of 2024, primarily due to the timing of inventory sales, combined with higher milling and royalty costs when compared to the prior year period.
Production costs per tonne increased when compared to the prior-year period due to the lower volume of ore milled in the current period and higher production costs as discussed above. Production costs per ounce increased when compared to the prior year due to higher production costs, combined with fewer ounces of gold being produced in the current period.
Full Year 2025 – Production costs at LaRonde increased by 12.7% in 2025 compared with 2024 primarily due to the timing of inventory sales, higher milling and royalty costs, partially offset by a build-up of stockpiles.
Production costs per tonne increased when compared to the prior year due to the same reasons outlined above for higher production costs. Production costs per ounce increased when compared to the prior year primarily due to higher production costs as described above, partially offset by more ounces of gold being produced in the current year.
Minesite costs per tonne and total cash costs per ounce
Fourth Quarter of 2025 – Minesite costs per tonne increased when compared to the prior-year period due to the lower volume of ore milled, combined with higher milling and royalty costs when compared to the prior-year period. Total cash costs per ounce increased when compared to the prior year primarily due to higher minesite costs, combined with fewer ounces of gold being produced in the current period.
Full Year 2025 – Minesite costs per tonne increased when compared to the prior year primarily due to higher milling and royalty costs, and the lower volume of ore milled, partially offset by a build-up of stockpiles. Total cash costs per ounce decreased when compared to the prior year primarily due to the higher impact of by-product metals and more ounces of gold being produced in the current year.
18
Canadian Malartic
Canadian Malartic – Operating Statistics | | Three Months Ended | | Year Ended | ||||||||
| | December 31, | | December 31, | | December 31, | | December 31, | ||||
| | 2025 | | 2024 | | 2025 | | 2024 | ||||
Tonnes of ore milled (thousands of tonnes) | | | 5,204 |
| | 5,100 |
| | 20,123 |
| | 20,317 |
Tonnes of ore milled per day |
| | 56,565 |
| | 55,446 |
| | 55,132 |
| | 55,511 |
Gold grade (g/t) |
| | 1.01 |
| | 0.97 |
| | 1.08 |
| | 1.09 |
Gold production (ounces) |
| | 153,433 |
| | 146,485 |
| | 642,612 |
| | 655,654 |
Production costs per tonne (C$) |
| C$ | 34 |
| C$ | 36 |
| C$ | 34 |
| C$ | 36 |
Minesite costs per tonne (C$) |
| C$ | 43 |
| C$ | 41 |
| C$ | 43 |
| C$ | 41 |
Production costs per ounce | | $ | 842 | | $ | 902 | | $ | 760 | | $ | 811 |
Total cash costs per ounce | | $ | 1,033 | | $ | 1,014 | | $ | 946 | | $ | 930 |
Gold production
Fourth Quarter of 2025 – At Canadian Malartic, gold production increased by 4.7% to 153,433 ounces in the fourth quarter of 2025 compared with gold production of 146,485 ounces in the fourth quarter of 2024, due to higher grades from the Barnat pit combined with higher throughput levels, partially offset by lower recovery rates.
Full Year 2025 – At Canadian Malartic, gold production decreased by 2.0% to 642,612 ounces in 2025 compared with gold production of 655,654 ounces in 2024, due to lower throughput levels, slightly lower gold grades and lower recovery resulting from an increased volume of ore being sourced from the low-grade stockpiles.
Production costs
Fourth Quarter of 2025 – Production costs at Canadian Malartic were $129.1 million in the fourth quarter of 2025, a decrease of 2.3% compared with production costs of $132.1 million in the fourth quarter of 2024, primarily due to lower open pit mining costs and the timing of inventory sales, partially offset by higher royalty costs.
Production costs per tonne decreased when compared to the prior-year period for the same reasons outlined above for lower production costs, combined with the increase in throughput. Production costs per ounce decreased when compared to the prior-year period due to the same reasons outlined above for production costs and more ounces of gold produced in the current period.
Full Year 2025 – Production costs at Canadian Malartic were $488.2 million in 2025, a decrease of 8.2% compared with production costs of $532.0 million in 2024, due to lower open pit costs and the timing of inventory sales, partially offset by higher royalty costs in the current year.
Production costs per tonne decreased when compared to the prior year for the same reasons outlined above for lower production costs, partially offset by the decrease in throughput. Production costs per ounce decreased when compared to the prior year due to the same reasons outlined above for production costs, partially offset by fewer ounces of gold produced in the current year.
Minesite costs per tonne and total cash costs per ounce
Fourth Quarter of 2025 – Minesite costs per tonne increased when compared to the prior-year period due to higher royalty costs during the quarter, partially offset by lower open pit costs and the increase in throughput in the current period. Total cash costs per ounce increased when compared to the prior-year period due to higher royalty costs during the quarter, partially offset by lower open pit mining costs and more ounces of gold produced in the current period.
Full Year 2025 – Minesite costs per tonne increased when compared to the prior year due to higher royalty costs and the lower throughput in the current year, partially offset by lower open pit mining costs. Total cash costs per ounce increased when compared to the prior year due to higher royalty costs and fewer ounces of gold produced, partially offset by lower open pit mining costs in the current year.
19
Goldex
Goldex – Operating Statistics | | Three Months Ended | | Year Ended | ||||||||
| | December 31, | | December 31, | | December 31, | | December 31, | ||||
| | 2025 | | 2024 | | 2025 | | 2024 | ||||
Tonnes of ore milled (thousands of tonnes) |
| | 847 |
| | 812 |
| | 3,301 |
| | 3,076 |
Tonnes of ore milled per day |
| | 9,207 |
| | 8,826 |
| | 9,044 |
| | 8,404 |
Gold grade (g/t) |
| | 1.44 |
| | 1.45 |
| | 1.40 |
| | 1.55 |
Gold production (ounces) |
| | 32,992 |
| | 32,341 |
| | 125,501 |
| | 130,813 |
Production costs per tonne (C$) |
| C$ | 67 |
| C$ | 51 |
| C$ | 63 |
| C$ | 58 |
Minesite costs per tonne (C$) |
| C$ | 67 |
| C$ | 56 |
| C$ | 64 |
| C$ | 59 |
Production costs per ounce | | $ | 1,232 | | $ | 910 | | $ | 1,187 | | $ | 994 |
Total cash costs per ounce | | $ | 1,015 | | $ | 859 | | $ | 1,002 | | $ | 923 |
Commercial production was achieved at Akasaba West in February 2024 and the comparative information set out herein for the year ended December 31, 2024 only includes ten months of production from Akasaba West.
Gold production
Fourth Quarter of 2025 – Gold production at Goldex increased by 2.0% to 32,992 ounces in the fourth quarter of 2025, compared with 32,341 ounces in the fourth quarter of 2024, primarily due to higher throughput levels from additional ore sourced from Akasaba West.
Full Year 2025 – Gold production decreased by 4.1% to 125,501 ounces in 2025, compared with 130,813 ounces in 2024 at Goldex due to lower gold grades resulting from increased ore sourced from Akasaba West, partially offset by a higher throughput levels.
Production costs
Fourth Quarter of 2025 – Production costs at Goldex were $40.6 million in the fourth quarter of 2025, an increase of 38.0% compared with production costs of $29.4 million in the fourth quarter of 2024, primarily due to higher underground production costs, the timing of inventory sales and higher royalty costs.
Production costs per tonne increased when compared to the prior-year period due to the same reasons outlined above for production costs, partially offset by the higher volume of ore milled in the period. Production costs per ounce increased when compared to the prior-year period due to the same reasons outlined above for production costs.
Full Year 2025 - Production costs at Goldex were $149.0 million in 2025, an increase of 14.6% compared with production costs of $130.0 million in 2024, primarily due to the consumption of stockpiles, including associated re - handling costs and higher open pit mining costs, as the comparative period only includes ten months of production costs for Akasaba West.
Production costs per tonne increased when compared to the prior year for the same reasons described above for production costs, partially offset by higher volume of ore milled in the current year. Production costs per ounce increased when compared to the prior year due to the same reasons outlined above for production costs and fewer ounces of gold produced in the current year.
Minesite costs per tonne and total cash costs per ounce
Fourth Quarter of 2025 – Minesite costs per tonne increased when compared to the prior-year period mainly due to higher underground production costs and higher royalty costs, partially offset by higher volume of ore milled. Total cash costs per ounce increased when compared to the prior-year period due to the same reasons outlined above for higher underground production costs and higher royalty costs.
Full Year 2025 – Minesite costs per tonne increased when compared to the prior year primarily due to the same reasons outlined above for the higher production costs per tonne. Total cash costs per ounce increased when compared to the prior year due to the same reasons outlined above for the higher production costs per ounce.
20
Detour Lake
Detour Lake – Operating Statistics | | Three Months Ended | | Year Ended | ||||||||
| | December 31, | | December 31, | | December 31, | | December 31, | ||||
| | 2025 | | 2024 | | 2025 | | 2024 | ||||
Tonnes of ore milled (thousands of tonnes) |
| | 7,052 |
| | 7,086 |
| | 27,869 |
| | 27,462 |
Tonnes of ore milled per day |
| | 76,652 |
| | 77,022 |
| | 76,353 |
| | 75,033 |
Gold grade (g/t) |
| | 0.96 |
| | 0.87 |
| | 0.86 |
| | 0.85 |
Gold production (ounces) |
| | 195,026 |
| | 179,061 |
| | 692,675 |
| | 671,950 |
Production costs per tonne (C$) |
| C$ | 27 |
| C$ | 23 |
| C$ | 28 |
| C$ | 25 |
Minesite costs per tonne (C$) |
| C$ | 32 |
| C$ | 26 |
| C$ | 30 |
| C$ | 26 |
Production costs per ounce | | $ | 707 | | $ | 657 | | $ | 816 | | $ | 740 |
Total cash costs per ounce | | $ | 838 | | $ | 755 | | $ | 879 | | $ | 796 |
Gold production
Fourth Quarter of 2025 – At Detour Lake, gold production increased by 8.9% to 195,026 ounces in the fourth quarter of 2025 compared with 179,061 ounces in the fourth quarter of 2024, primarily due to higher gold grades as a result of mine sequencing.
Full Year 2025 - Gold production at Detour Lake increased by 3.1% to 692,675 ounces in 2025 compared with 671,950 ounces in 2024, primarily due to higher throughput levels from a higher mill run - time and optimized mill equipment, higher gold grades and mill recovery.
Production costs
Fourth Quarter of 2025 – Production costs at Detour Lake were $138.0 million in the fourth quarter of 2025, an increase of 17.2% compared with production costs of $117.7 million in the fourth quarter of 2024, primarily due to higher royalty and milling costs, partially offset by lower mining costs and the timing of inventory sales.
Production costs per tonne increased when compared to the prior-year period mainly due to the same reasons outlined above for higher production costs and slightly lower volume of ore milled. Production costs per ounce increased when compared to the prior-year period mainly due to the same reasons outlined above for higher production costs, partially offset by more ounces of gold produced in the current period.
Full Year 2025 - Production costs at Detour Lake were $565.4 million in 2025, an increase of 13.8% compared to production costs of $497.1 million during 2024, primarily due to higher royalty, milling, open pit maintenance and consumables costs, partially offset by a higher stripping ratio between years.
Production costs per tonne increased when compared to the prior year due to the same reasons outlined above for production costs partially offset by higher volume of ore milled in the current year. Production costs per ounce increased when compared to the prior year due to the same reasons outlined above for production costs, partially offset by more ounces of gold produced in the current year.
Minesite costs per tonne and total cash costs per ounce
Fourth Quarter of 2025 – Minesite costs per tonne increased when compared to the prior period due to the same reasons outlined above for higher production costs per tonne. Total cash costs per ounce increased when compared to the prior-year period due to the same reasons outlined above for higher production costs per ounce.
Full Year 2025 – Minesite costs per tonne increased compared to the prior year due to the same reasons outlined above for higher production costs per tonne. Total cash cost per ounce increased when compared to the prior year due to the same reasons outlined above for the higher production costs per ounce.
21
Macassa
Macassa – Operating Statistics | | Three Months Ended | | Year Ended | ||||||||
| | December 31, | | December 31, | | December 31, | | December 31, | ||||
| | 2025 | | 2024 | | 2025 | | 2024 | ||||
Tonnes of ore milled (thousands of tonnes) |
| | 149 |
| | 154 |
| | 573 |
| | 574 |
Tonnes of ore milled per day |
| | 1,620 |
| | 1,674 |
| | 1,570 |
| | 1,568 |
Gold grade (g/t) |
| | 12.99 |
| | 15.87 |
| | 17.42 |
| | 15.55 |
Gold production (ounces) |
| | 60,505 |
| | 76,336 |
| | 312,729 |
| | 279,384 |
Production costs per tonne (C$) |
| C$ | 699 |
| C$ | 498 |
| C$ | 540 |
| C$ | 482 |
Minesite costs per tonne (C$) |
| C$ | 797 |
| C$ | 489 |
| C$ | 604 |
| C$ | 498 |
Production costs per ounce | | $ | 1,239 | | $ | 715 | | $ | 709 | | $ | 721 |
Total cash costs per ounce | | $ | 1,417 | | $ | 708 | | $ | 793 | | $ | 748 |
Gold production
Fourth Quarter of 2025 – At Macassa, gold production decreased by 20.7% to 60,505 ounces, compared with 76,336 ounces in the fourth quarter of 2024, primarily due to lower gold grades gold grades associated with the mine sequence and lower throughput.
Full Year 2025 - Gold production at Macassa increased by 11.9% to 312,729 ounces in 2025 compared to 279,384 ounces in 2024, primarily due to higher gold grades associated with the mining sequence.
Production costs
Fourth Quarter of 2025 – Production costs were $75.0 million in the fourth quarter of 2025, an increase of 37.3% compared with production costs of $54.6 million in the fourth quarter of 2024, primarily due to higher royalty, mining and milling costs, partially offset by the timing of inventory sales.
Production costs per tonne increased when compared to the prior-year period due to the same reasons outlined above for higher production costs. Production costs per ounce increased when compared to the prior-year period due to the same reasons outlined above for higher production costs along with fewer ounces of gold production in the current period.
Full Year 2025 - Production costs were $221.7 million in 2025, an increase of 10.1% compared to production costs of $201.4 million during 2024, primarily due to higher royalty, mining and milling costs, partially offset by the timing of inventory sales.
Production costs per tonne increased when compared to the prior year due to the same reasons outlined above for higher production costs. Production costs per ounce decreased when compared to the prior year due to more ounces of gold produced in the current year, partially offset by higher royalty, mining and milling cost.
Minesite costs per tonne and total cash costs per ounce
Fourth Quarter of 2025 – Minesite costs per tonne increased when compared to the prior-year period due to higher royalty, mining and milling costs and slightly lower volume of ore milled. Total cash costs per ounce increased when compared to the prior-year period due to fewer ounces of gold produced and higher royalty, mining and milling costs in the current period.
Full Year 2025 – Minesite costs per tonne increased when compared to the prior year due to higher royalty, mining and milling costs. Total cash costs per ounce increased when compared to the prior year due to higher royalty, mining and milling costs and a higher in-kind royalties in the current year, partially offset by more ounces of gold produced in the current year.
22
Meliadine
Meliadine – Operating Statistics | | Three Months Ended | | Year Ended | ||||||||
| | December 31, | | December 31, | | December 31, | | December 31, | ||||
| | 2025 | | 2024 | | 2025 | | 2024 | ||||
Tonnes of ore milled (thousands of tonnes) |
| | 621 |
| | 516 |
| | 2,351 |
| | 1,966 |
Tonnes of ore milled per day |
| | 6,750 |
| | 5,620 |
| | 6,441 |
| | 5,372 |
Gold grade (g/t) |
| | 4.82 |
| | 5.89 |
| | 5.14 |
| | 6.22 |
Gold production (ounces) |
| | 93,735 |
| | 94,648 |
| | 376,346 |
| | 378,886 |
Production costs per tonne (C$) |
| C$ | 267 |
| C$ | 257 |
| C$ | 238 |
| C$ | 243 |
Minesite costs per tonne (C$) |
| C$ | 234 |
| C$ | 263 |
| C$ | 237 |
| C$ | 247 |
Production costs per ounce | | $ | 1,278 | | $ | 1,012 | | $ | 1,069 | | $ | 924 |
Total cash costs per ounce | | $ | 1,117 | | $ | 1,037 | | $ | 1,067 | | $ | 940 |
Gold production
Fourth Quarter of 2025 – At Meliadine, gold production decreased by 1.0% to 93,735 ounces, compared with 94,648 ounces in the fourth quarter of 2024, primarily due to lower gold grades under the mining sequence, partially offset by higher throughput levels.
Full Year 2025 - Gold production decreased by 0.7% to 376,346 ounces in 2025 compared with 378,886 ounces in 2024, primarily due to lower gold grades under the mining sequence, partially offset by higher throughput levels.
Production costs
Fourth Quarter of 2025 – Production costs at Meliadine were $119.8 million in the fourth quarter of 2025, an increase of 25.0% compared with production costs of $95.8 million in the fourth quarter of 2024, primarily due to the timing of inventory sales combined with higher mining and royalty costs.
Production costs per tonne increased when compared to the prior-year period due to the same reasons outlined above for higher production costs, partially offset by a higher volume of ore milled in the current period. Production costs per ounce increased when compared to the prior-year period due to the same reasons outlined above for higher production costs.
Full Year 2025 - Production costs at Meliadine were $402.4 million during 2025, an increase of 14.9% compared to production costs of $350.3 million during 2024, primarily due to the consumption of stockpiles, including associated re - handling costs, combined with higher mining, royalty and underground maintenance costs.
Production costs per tonne decreased when compared to the prior year due to a higher volume of ore tonnes milled in the current year, partially offset by higher production costs as outlined above for the current year. Production costs per ounce increased in the current year due to the same reasons outlined above for higher production costs.
Minesite costs per tonne and total cash costs per ounce
Fourth Quarter of 2025 – Minesite costs per tonne decreased when compared to the prior-year period due to the higher volume of ore milled offsetting the impact of increased mining and royalty costs. Total cash costs per ounce increased when compared to the prior-year period primarily due to the higher mining and royalty costs, combined with lower ounces produced in the period.
Full Year 2025 – Minesite costs per tonne decreased when compared to the prior year primarily due to the higher volume of ore milled offsetting the impact of increased mining, royalty and underground maintenance costs. Total cash costs per ounce increased when compared to the prior year primarily due to the higher mining, royalty and underground maintenance costs, combined with fewer ounces produced in the year.
23
Meadowbank
Meadowbank – Operating Statistics | | Three Months Ended | | Year Ended | ||||||||
| | December 31, | | December 31, | | December 31, | | December 31, | ||||
| | 2025 | | 2024 | | 2025 | | 2024 | ||||
Tonnes of ore milled (thousands of tonnes) |
| | 1,035 |
| | 999 |
| | 3,941 |
| | 4,143 |
Tonnes of ore milled per day(i) |
| | 11,250 |
| | 10,848 |
| | 11,660 |
| | 11,320 |
Gold grade (g/t) |
| | 3.85 |
| | 4.07 |
| | 4.29 |
| | 4.18 |
Gold production (ounces) |
| | 115,101 |
| | 117,024 |
| | 493,314 |
| | 504,719 |
Production costs per tonne (C$) |
| C$ | 210 |
| C$ | 154 |
| C$ | 195 |
| C$ | 153 |
Minesite costs per tonne (C$)(ii) |
| C$ | 211 |
| C$ | 161 |
| C$ | 194 |
| C$ | 156 |
Production costs per ounce | | $ | 1,356 | | $ | 945 | | $ | 1,120 | | $ | 918 |
Total cash costs per ounce(ii) | | $ | 1,351 | | $ | 988 | | $ | 1,110 | | $ | 938 |
Note:
| (i) | The daily milling rate for the year ended December 31, 2025 excludes 27 days in which the mill was not operating as a result of Caribou migration patterns during the second quarter of 2025 that prevented the transport of ore from Amaruq to the mill. |
| (ii) | Minesite costs per tonne and total cash costs per ounce in this table are calculated using the composition of such measure for periods ending on or prior to December 31, 2025. See “Non-GAAP Financial Performance Measures” below. |
Gold production
Fourth Quarter of 2025 – At Meadowbank, gold production decreased by 1.6% to 115,101 ounces in the fourth quarter of 2025, compared with 117,024 ounces in the fourth quarter of 2024, primarily due to lower gold grades as expected under the mining sequence, partially offset by higher throughput.
Full Year 2025 - Gold production decreased by 2.3% to 493,314 ounces in 2025 compared with 504,719 ounces in 2024, primarily due to lower throughput, as a result of a longer than expected caribou migration period which forced mill shutdowns during the second quarter of 2025, partially offset by higher gold grades as expected under the mine sequence.
Production costs
Fourth Quarter of 2025 – Production costs at Meadowbank were $156.1 million in the fourth quarter of 2025, an increase of 41.1% compared with production costs of $110.6 million in the fourth quarter of 2024, primarily due to higher royalty and mining costs.
Production costs per tonne increased when compared to the prior-year period due to the same reasons outlined above for higher production costs, partially offset by the higher volume of ore milled. Production costs per ounce increased when compared to the prior-year period due to the same reasons outlined above for lower production costs combined with fewer ounces of gold produced in the current period.
Full Year 2025 - Production costs at Meadowbank were $552.5 million in 2025, an increase of 19.2% compared with production costs of $463.5 million in 2024, primarily due to higher royalty costs combined with a lower rate of stockpile build - up when compared with the prior year.
Production costs per tonne increased when compared to the prior year primarily due to the same reasons outlined above for higher production costs combined with a lower volume of ore milled in the current year. Production costs per ounce increased when compared to the prior year due to the same reasons outlined above for higher production costs combined with fewer ounces of gold produced in the current year.
Minesite costs per tonne and total cash costs per ounce
Fourth Quarter of 2025 – Minesite costs per tonne increased when compared to the prior-year period due to the same reasons as for the higher production costs per tonne. Total cash costs per ounce increased when compared to the prior-year period due to the same reasons outlined above for the higher production costs per ounce.
24
Full Year 2025 – Minesite costs per tonne increased when compared to the prior year due to the same reasons as for the higher production costs per tonne. Total cash costs per ounce increased when compared to the prior year due to the same reasons outlined above for the higher production costs per ounce.
Fosterville
Fosterville – Operating Statistics | | Three Months Ended | | Year Ended | ||||||||
| | December 31, | | December 31, | | December 31, | | December 31, | ||||
| | 2025 | | 2024 | | 2025 | | 2024 | ||||
Tonnes of ore milled (thousands of tonnes) | | | 177 | | | 158 | | | 726 | | | 810 |
Tonnes of ore milled per day |
| | 1,924 |
| | 1,717 |
| | 1,989 |
| | 2,213 |
Gold grade (g/t) |
| | 6.08 |
| | 7.65 |
| | 7.20 |
| | 8.96 |
Gold production (ounces) |
| | 32,367 |
| | 37,139 |
| | 160,522 |
| | 225,203 |
Production costs per tonne (A$) |
| A$ | 321 |
| A$ | 319 |
| A$ | 310 |
| A$ | 277 |
Minesite costs per tonne (A$) |
| A$ | 335 |
| A$ | 325 |
| A$ | 320 |
| A$ | 276 |
Production costs per ounce | | $ | 1,152 | | $ | 868 | | $ | 912 | | $ | 653 |
Total cash costs per ounce | | $ | 1,202 | | $ | 878 | | $ | 937 | | $ | 647 |
Gold production
Fourth Quarter of 2025 – At Fosterville, gold production decreased by 12.8% to 32,367 ounces in the fourth quarter of 2025 compared with 37,139 ounces in the fourth quarter of 2024, primarily due to lower gold grades as expected under the mine plan, partially offset by higher throughput levels.
Full Year 2025 - Gold production at Fosterville decreased by 28.7% to 160,522 ounces in 2025, compared with 225,203 ounces in 2024, primarily due to lower gold grades in line with the mine plan and lower throughput levels.
Production costs
Fourth Quarter of 2025 – Production costs were $37.3 million in the fourth quarter of 2025, an increase of 15.7% compared with production costs of $32.2 million in the fourth quarter of 2024, primarily due to higher underground development and royalty costs.
Production costs per tonne increased when compared to the prior-year period due to the same factors driving higher overall production costs, partially offset by the benefit of higher ore throughput. Production costs per ounce increased year-over-year as a result of these higher costs combined with fewer ounces of gold produced in the period.
Full Year 2025 - Production costs were $146.4 million in 2025, in line with production costs of $147.0 million during 2024, primarily due to lower mining costs, including underground development, offset by higher royalty costs.
Production costs per tonne increased when compared to the prior year due to the lower volume of ore milled in the current year. Production costs per ounce increased when compared to the prior year due to fewer ounces produced in the year.
Minesite costs per tonne and total cash costs per ounce
Fourth Quarter of 2025 – Minesite costs per tonne increased when compared to the prior-year period due to the same reasons as for the higher production costs per tonne. Total cash costs per ounce increased when compared to the prior-year period due to the same reasons outlined above for higher production costs per ounce.
Full Year 2025 – Minesite costs per tonne increased when compared to the prior year due to the same reasons as for the higher production costs per tonne. Total cash costs per ounce increased when compared to the prior year due to the same reasons outlined above for higher production costs per ounce.
25
Kittila
Kittila – Operating Statistics | | Three Months Ended | | Year Ended | ||||||||
| | December 31, | | December 31, | | December 31, | | December 31, | ||||
| | 2025 | | 2024 | | 2025 | | 2024 | ||||
Tonnes of ore milled (thousands of tonnes) | | | 543 | | | 476 | | | 2,105 | | | 2,026 |
Tonnes of ore milled per day |
| | 5,902 |
| | 5,174 |
| | 5,767 |
| | 5,536 |
Gold grade (g/t) |
| | 3.89 |
| | 4.15 |
| | 3.91 |
| | 4.11 |
Gold production (ounces) |
| | 54,964 |
| | 51,893 |
| | 217,379 |
| | 218,860 |
Production costs per tonne (€) | | € | 101 | | € | 100 | | € | 99 | | € | 103 |
Minesite costs per tonne (€) | | € | 102 | | € | 106 | | € | 100 | | € | 103 |
Production costs per ounce | | $ | 1,157 | | $ | 979 | | $ | 1,087 | | $ | 1,039 |
Total cash costs per ounce | | $ | 1,146 | | $ | 1,026 | | $ | 1,081 | | $ | 1,031 |
Gold production
Fourth Quarter of 2025 – At Kittila, gold production increased by 5.9% to 54,964 ounces in the fourth quarter of 2025, compared with 51,893 ounces in the fourth quarter of 2024, primarily due to higher throughput levels, as a planned 10-day shutdown occurred in the prior year period, partially offset by lower gold grades due to a change in the mining sequence.
Full Year 2025 - Gold production decreased by 0.7% to 217,379 ounces in 2025, compared with 218,860 ounces in 2024 due to lower grades due to a change in the mining sequence, partially offset by higher throughput levels.
Production costs
Fourth Quarter of 2025 – Production costs at Kittila totalled $63.6 million in the fourth quarter of 2025, an increase of 25.2% compared with production costs of $50.8 million in the fourth quarter of 2024. The year-over-year increase was driven by higher mining and milling costs, including the impact of a stronger Euro relative to the US dollar. In addition, higher royalty costs from higher gold prices, and the timing of inventory sales contributed to the higher production costs.
Production costs per tonne were in line with the prior-year period, reflecting the same underlying cost drivers of higher operating costs and royalty expenses while excluding the foreign exchange impact which is not applicable in local currency cost per tonne calculations. This was partially offset by a higher volume of ore milled in the current period. Production costs per ounce also increased when compared to the prior-year period primarily due to the same reasons outlined above for higher production costs, partially offset by more ounces produced in the period.
Full Year 2025 - Production costs at Kittila were $236.2 million in 2025, an increase of 3.9% compared with production costs of $227.3 million in 2024, primarily due to higher mining and milling costs, including the impact of a stronger Euro relative to the US dollar and higher royalty costs reflecting higher average gold prices.
Production costs per tonne decreased when compared to the prior year as the higher volume of ore milled more than offset the impact of higher production costs. Production costs per ounce increased when compared to the prior year due to the same reasons outlined above for production costs.
Minesite costs per tonne and total cash costs per ounce
Fourth Quarter of 2025 – Minesite costs per tonne decreased when compared to the prior-year period due the higher volume of ore milled offsetting the higher mining, milling and royalty costs. Total cash costs per ounce increased when compared to the prior-year period due to the same reasons as the higher production costs per ounce, partially offset by more ounces produced in the period.
Full Year 2025 – Minesite costs per tonne decreased when compared to the prior year due to the same reasons as for the lower production costs per tonne. Total cash costs per ounce increased when compared to the prior year due to the same reasons as the higher production costs per ounce.
26
Pinos Altos
Pinos Altos – Operating Statistics | | Three Months Ended | | Year Ended | ||||||||
| | December 31, | | December 31, | | December 31, | | December 31, | ||||
|
| 2025 |
| 2024 |
| 2025 |
| 2024 | ||||
Tonnes of ore milled (thousands of tonnes) | | | 467 | | | 381 | | | 1,720 | | | 1,707 |
Tonnes of ore milled per day |
| | 5,076 |
| | 4,141 |
| | 4,712 |
| | 4,664 |
Gold grade (g/t) |
| | 1.55 |
| | 1.58 |
| | 1.55 |
| | 1.69 |
Gold production (ounces) |
| | 22,195 |
| | 18,583 |
| | 81,734 |
| | 88,433 |
Production costs per tonne | | $ | 122 | | $ | 119 | | $ | 120 | | $ | 99 |
Minesite costs per tonne | | $ | 130 | | $ | 115 | | $ | 122 | | $ | 99 |
Production costs per ounce | | $ | 2,572 | | $ | 2,435 | | $ | 2,518 | | $ | 1,902 |
Total cash costs per ounce | | $ | 1,977 | | $ | 1,921 | | $ | 2,006 | | $ | 1,530 |
Gold production
Fourth Quarter of 2025 – At Pinos Altos, gold production increased by 19.4% to 22,195 ounces in the fourth quarter of 2025, compared with 18,583 ounces in the fourth quarter of 2024, primarily due to higher throughput levels.
Full Year 2025 - Gold production decreased by 7.6% to 81,734 ounces in 2025, compared with 88,433 ounces in 2024 at Pinos Altos, primarily due to lower gold grades expected under the mining sequence.
Production costs
Fourth Quarter of 2025 – Production costs at Pinos Altos were $57.1 million in the fourth quarter of 2025, an increase of 26.2% compared with production costs of $45.3 million in the fourth quarter of 2024, primarily due to higher underground mining and royalty costs.
Production costs per tonne increased when compared to the prior-year period primarily due to the same reasons outlined above for higher production costs in the current period, partially offset by the higher volume of ore tonnes milled. Production costs per ounce increased when compared to the prior-year period due to the same reasons outlined above for higher production costs in the current period, partially offset by more ounces of gold produced in the current period.
Full Year 2025 - Production costs at Pinos Altos were $205.8 million in 2025, an increase of 22.3% compared with production costs of $168.2 million in 2024, primarily due to higher underground mining and royalty costs, partially offset by lower milling costs.
Production costs per tonne increased when compared to the prior year primarily due to the same reasons outlined above for the higher production cost, partially offset by the higher volume of ore tonnes milled. Production costs per ounce increased when compared to the prior year due to the same reasons outlined above for the higher production costs and fewer ounces of gold produced in the year.
Minesite costs per tonne and total cash costs per ounce
Fourth Quarter of 2025 – Minesite costs per tonne increased when compared to the prior-year period due to the same reasons as the higher production costs per tonne. Total cash costs per ounce increased when compared to the prior-year period due to the same reasons as the higher production costs per ounce.
Full Year 2025 – Minesite costs per tonne increased when compared to the prior year due to the same reasons as the higher production costs per tonne. Total cash costs per ounce increased when compared to the prior year due to the same reasons as the higher production costs per ounce.
27
Fourth Quarter 2025 vs. Fourth Quarter 2024
Revenues from mining operations, net of selling costs, increased by $1,340.3 million to $3,564.0 million in the fourth quarter of 2025 compared with $2,223.7 million in the fourth quarter of 2024, primarily due to a 56.5% increase in the average realized price of gold.
Production costs increased by $197.6 million to $944.4 million in the fourth quarter of 2025 compared with production costs of $746.9 million in the fourth quarter of 2024, primarily due to higher royalty costs. A detailed discussion of production costs and cost metrics by mine is provided in the “Minesite Discussion” section above.
Amortization of property, plant and mine development increased by $33.4 million to $421.6 million in the fourth quarter of 2025 compared with $388.2 million in the fourth quarter of 2024, primarily due to higher amortization incurred at Meliadine, Meadowbank, and Kittila, partially offset by lower amortization at Macassa.
Net income of $1,523.1 million was recorded in the fourth quarter of 2025 after income and mining taxes expense of $794.1 million compared with net income of $509.3 million in the fourth quarter of 2024 after income and mining taxes expense of $273.3 million. The increase in net income was primarily due to higher operating margin between periods.
Cash provided by operating activities increased by $979.7 million to $2,111.5 million in the fourth quarter of 2025 compared with $1,131.8 million in the fourth quarter of 2024. The increase in cash provided by operating activities is primarily due to higher operating margins and more favourable movements in working capital between periods.
Fourth Quarter 2025 vs. Third Quarter 2025
Revenues from mining operations, net of selling costs, increased by $504.4 million to $3,564.0 million in the fourth quarter of 2025 compared with $3,059.5 million in the third quarter of 2025, primarily due to a 19.8% increase in the average realized price of gold and an increase in gold sales volume between periods at Meliadine and LaRonde, partially offset by a decrease in gold sales volumes at Macassa, Meadowbank, and Detour Lake.
Production costs increased by $105.1 million to $944.4 million in the fourth quarter of 2025 compared with production costs of $839.3 million in the third quarter of 2025, primarily due to higher production costs at LaRonde, Meliadine, and Macassa and the increase in royalty costs from higher gold prices.
Exploration and corporate development expenses decreased by $6.5 million to $53.1 million in the fourth quarter of 2025 compared with $59.6 million in the third quarter of 2025. The decrease in exploration and corporate development expenses between periods is primarily due to lower expenses at Hope Bay.
Amortization of property, plant and mine development decreased by $8.4 million to $421.6 million in the fourth quarter of 2025 compared with amortization of property, plant and mine development of $429.9 million in the third quarter of 2025, primarily due to lower costs in Meadowbank, Detour Lake, Fosterville and Canadian Malartic, partially offset by higher costs in Meliadine and Macassa.
Net income of $1,523.1 million was recorded in the fourth quarter of 2025 after income and mining taxes expense of $794.1 million compared with net income of $1,055.0 million in the third quarter of 2025 after income and mining taxes expense of $520.6 million. The increase in net income was primarily due to higher operating margin between periods and a reversal, in the current period, of an impairment loss recorded at Macassa in the fourth quarter of 2023.
Cash provided by operating activities increased by $295.6 million to $2,111.5 million in the fourth quarter of 2025 compared with $1,815.9 million in the third quarter of 2025 primarily due to the same reasons for the increase in cash provided by operating activities between the fourth quarter of 2025 and the fourth quarter of 2024.
For the Company’s detailed 2025 and 2024 quarterly financial and operating results see “Summarized Quarterly Data” in this MD&A.
28
The following section contains ”forward-looking statements” and “forward-looking information” within the meaning of applicable securities laws. See “Note to Investors Concerning Forward-Looking Information” in this MD&A for a discussion of assumptions and risks relating to such statements.
2025 Results Comparison to 2025 Outlook
Gold Production and Costs
Payable gold production for the full year 2025 was 3,447,367 ounces, above the midpoint of the year’s guidance range of between 3,300,000 and 3,500,000 ounces. Total cash costs per ounce on a by-product basis for the full year 2025 was $979, above the year’s guidance range of between $915 to $965, mainly due to higher royalty costs from higher gold prices.
Capital Expenditures and All-In Sustaining Costs per Ounce
Total capital expenditures (including sustaining capital, development capital and capitalized exploration) for the full year 2025 were $2,391.4 million, above the higher end of the previous guidance range between $2,040.0 million and $2,260.0 million, mainly due to the acceleration of capital projects expenditures associated with Detour Lake, Hope Bay, Canadian Malartic and Upper Beaver.
All-in sustaining costs per ounce on a by-product basis for the full year 2025 were $1,339, which was above the previous guidance range of between $1,250 and $1,300, the increase in AISC is mainly attributed to the higher royalty costs from higher gold prices and higher sustaining capital expenditures at Detour and Meadowbank.
Exploration and Corporate Development Expense
Previous guidance for exploration and corporate development expense was between $215.0 million and $235.0 million. Exploration and corporate development expense for the full year 2025 was $206.7 million, $8.3 million lower than the previous guidance range, mainly due to lower drilling unit costs and lower expenses in Mexico.
Amortization of Property, Plant and Mine Development
Amortization of property, plant and mine development expense for the full year 2025 was $1,645.3 million, which was close to the midpoint of the previous guidance range of between $1.55 and $1.75 billion.
General and Administrative Expense
General and administrative expenses for the full year 2025 were $235.9 million which was higher than the range in previous guidance of between $190 and $210 million, primarily due to the revaluation of stock-based compensation resulting from an increase in the Company’s share price during 2025.
2026 to 2027 Outlook Production Update
Payable gold production is forecast to be between 3.3 million and 3.5 million ounces in 2026, 2027 and 2028, consistent with gold production in 2025, unchanged from prior production forecast for 2026 and 2027.
LaRonde
In 2025, LaRonde produced 344,555 ounces of gold at total cash costs per ounce of $829. In 2026, the Company expects production at LaRonde to be between 330,000 and 350,000 ounces at total cash costs per ounce of approximately $919.
Mining at the LaRonde mine extends below three kilometres from surface where the in-situ stress contributes to influence the ground conditions surrounding the excavations. Seismicity is a significant aspect of the operation, and a team of rock mechanics experts has
29
been engaged to attempt to manage the seismic related challenges. To help address the seismicity risk, the Company uses mitigation measures including non-entry protocols, dynamic ground support and, increasingly, remote operation from surface.
The Company has also changed the mining sequence to attempt to reduce the stress levels on the secondary stopes, reduce seismic risk and promote sustainability of the operation in the long run. The mine has also transitioned to “pillarless” mining and adjusted development plans to address seismicity issues within the mine. Pillarless mining, combined with adjusted development plans, results in a longer cycle time to extract stopes, resulting in a reduced mining rate.
The Company has integrated new sources of ore to the LaRonde production profile, including the Fringe, Dumagami and 11-3 zones, and has adjusted the mining rate in the deep mine. These new zones enhance mine production flexibility, which helps manage the effects of seismicity at depth.
The Company completed modifications to the LZ5 processing facility at LaRonde to accommodate the Amalgamated Kirkland (“AK”) ore in 2025. An amendment to the processing facility permit to process AK ore is expected to be received in the first quarter of 2026, with trucking and processing at LaRonde now planned to begin in the second quarter of 2026.
LaRonde has planned a shutdown of 10 days in the second quarter of 2026 in order to replace the liners at the SAG mill, overall maintenance of the drystack filtration plant and flotation circuit. LaRonde also has planned four-day shutdowns in the first, third and fourth quarter of 2026 for regular maintenance.
Canadian Malartic
In 2025, Canadian Malartic produced 642,612 ounces of gold at total cash costs per ounce of $946. In 2026, the Company expects production at Canadian Malartic to be between 575,000 and 605,000 ounces at total cash costs per ounce of approximately $1,187.
At Odyssey, mine development continues to progress and the focus remains on preparing East Gouldie for the start of truck‑based production in the first quarter of 2026, development of the production levels for the first mining area has been completed, with workings now accessing East Gouldie mineralization.
Construction of key surface infrastructure is progressing on schedule with delivery of the production hoist expected in the second quarter of 2026. Construction on phase two of the paste plant (designed for a 20,000 tpd capacity) is expected to be completed in 2027.
For 2026, production is expected to be sourced from the Barnat pit and increasingly supplemented by ore from Odyssey and low-grade stockpiles. Odyssey is expected to contribute approximately 120,000 ounces of gold in 2026 as mining activities accelerate.
In 2026, Canadian Malartic has planned four-day quarterly shutdowns for the regular maintenance at the mill.
Goldex
In 2025, Goldex produced 125,501 ounces of gold at cash costs per ounce of $1,002. In 2026, the Company expects to produce between 115,000 and 125,000 ounces at total cash costs per ounce of approximately $1,054.
Akasaba West contributed approximately 2,350 tpd of throughput in 2025 and in 2026 the Company expects Akasaba West to produce approximately 18,000 ounces of gold and 3,000 tonnes of copper.
In 2026, Goldex has planned quarterly shutdowns of two to three days for the regular maintenance at the mill.
Meliadine
In 2025, Meliadine produced 376,346 ounces of gold at total cash costs per ounce of $1,067. In 2026, the Company expects production at Meliadine to be between 380,000 and 400,000 ounces at total cash costs per ounce of approximately $1,047.
The Company continues to advance mill optimization at Meliadine, achieving a throughput of 6,441 tpd in 2025, exceeding the annual 6,250 tpd target.
Meliadine has scheduled quarterly shutdowns lasting four to five days for regular mill maintenance.
30
Meadowbank
In 2025, Meadowbank produced 493,314 ounces of gold at total cash costs per ounce of $1,110 and total cash costs per ounce (revised) of $928. In 2026, the Company expects production at Meadowbank to be between 475,000 and 495,000 ounces at total cash costs per ounce (revised) of approximately $930.
The Company has approved a push-back at the open pit, resulting in the extension of anticipated mine life by two years to 2030.
The Company continues to account for the caribou migration in its production plan as this migration can affect the ability to move materials on the road between Amaruq and the Meadowbank minesite and between the Meadowbank minesite and Baker Lake. Meadowbank has scheduled two major shutdowns in the second and fourth quarters of 2026, each lasting five days, to replace the SAG and ball mill liners and complete other regular mill maintenance.
Kittila
In 2025, Kittila produced 217,379 ounces of gold at cash costs per ounce of $1,081. In 2026, the Company expects to produce between 210,000 and 230,000 ounces at total cash costs per ounce of approximately $1,267.
Kittila has planned major shutdowns in the first and fourth quarter of 2026 lasting 9 days and 15 days, respectively, for regular maintenance on the mill and autoclave and a five-day water treatment plant shutdown in the third quarter of 2026.
Detour Lake
In 2025, Detour Lake produced 692,675 ounces of gold at cash costs per ounce of $879. In 2026, the Company expects production at Detour Lake to be between 700,000 and 730,000 ounces at total cash costs per ounce of approximately $921.
Detour Lake has scheduled three major shutdowns, each lasting seven days, for regular mill maintenance in the first, second and fourth quarters of 2026.
Macassa
In 2025, Macassa produced 312,729 ounces of gold at cash costs per ounce of $793. In 2026, the Company expects production at Macassa to be between 305,000 and 325,000 ounces at total cash costs per ounce of approximately $1,079.
Macassa remains on track to ramp up mill capacity to 2,040 tpd by the end of 2026, compared to a mill throughput of 1,570 tpd in 2025. The Company expects a contribution of approximately 45,000 ounces of gold from the AK deposit in 2026, which will be processed at the LZ5 processing facility at LaRonde. See above discussion under “- LaRonde”.
Macassa has scheduled a major shutdown of five days in the third quarter of 2026, for replacement of the primary grinding mill liner, the annual overhaul of the crusher and other regular mill maintenance.
Fosterville
In 2025, Fosterville produced 160,522 ounces of gold at cash costs per ounce of $937. In 2026, the Company expects production at Fosterville to be between 140,000 and 160,000 ounces at total cash costs per ounce of approximately $1,374.
As gold grades continue to decline with the depletion of the high-grade Swan zone, the Company has advanced a plan to increase the mining and milling rate by approximately 65% to 3,300 tpd and reducing costs per tonne by approximately 20% over the next three years when compared to 2025.
Fosterville has scheduled five-day quarterly shutdowns for regular mill maintenance in 2026.
Pinos Altos
In 2025, Pinos Altos produced 81,734 ounces of gold at total cash costs per ounce of $2,006. In 2026, the Company expects production at Pinos Altos to be between 70,000 and 80,000 ounces at total cash costs per ounce of approximately $2,092.
31
Revenue from Mining Operations and Production Costs
In 2026, the Company expects to continue to generate solid cash flow with payable production between 3,300,000 and 3,500,000 ounces of gold which is comparable with 3,447,367 ounces in 2025.
In 2026, the Company expects total cash costs per ounce on a by-product basis to be between $1,020 and $1,120. As production costs at LaRonde, Canadian Malartic, Goldex, Detour Lake, Macassa, Meliadine and Meadowbank mines are incurred primarily in Canadian dollars, production costs at Fosterville are incurred primarily in Australian dollars, production costs at Kittila are incurred primarily in Euros, and a portion of the production costs at Pinos Altos are incurred in Mexican pesos, the US dollar/Canadian dollar, US dollar/Australian dollar, US dollar/Euro, and US dollar/Mexican peso exchange rates also affect the Company’s expectations for the total cash costs per ounce both on a by-product and co-product basis.
The table below sets out the diesel price and relevant exchange rate assumptions used in deriving the expected 2026 total cash costs per ounce on a by-product basis as well as the actual market average closing prices for each variable for the period of January 1, 2026 through January 31, 2026:
| | | | | Actual | |
| | | | | Market Average | |
| | 2026 | | (January 1, 2026 - | ||
| | Assumptions | | January 31, 2026) | ||
Diesel ($ per litre) | | $ | 0.78 | | $ | 0.77 |
C$/US$ exchange rate (C$) | | $ | 1.36 | | $ | 1.38 |
Exploration and Corporate Development Expenditures
In 2026, Agnico Eagle expects to incur exploration and corporate development expenses of between $275.0 million and $305.0 million compared with $206.7 million in 2025.
The Company’s objective is to build on recent exploration success and identify additional mineral resources and convert mineral resources into mineral reserves. This is part of the strategy to develop the full potential of existing operations and key projects in the Company’s pipeline.
The Company’s exploration focus remains on extending mine life at existing operations, testing near-mine opportunities and advancing key value driver projects. Exploration priorities for 2026 include mineral resource conversion and expansion at Detour Lake’s underground project and the East Gouldie zone of Canadian Malartic, and exploration targets at Hope Bay.
Amortization of Property, Plant and Mine Development
Amortization of property, plant and mine development expense is expected to be between $1.55 billion and $1.75 billion in 2026 compared with $1.65 billion in 2025.
Other Expenses
General and administrative expenses are expected to be between $230.0 million and $260.0 million in 2026 compared with $235.9 million in 2025, including share-based compensation, which is expected to be between $65.0 million and $75.0 million.
The company also expects to incur other costs that can range between $75.0 million and $95.0 million, which includes between $35.0 million to $45.0 million related to site maintenance costs primarily at Hope Bay, and Northern Territory in Australia and between $40.0 million to $50.0 million related to remediation expenses and other miscellaneous costs.
Tax Rates
For 2026, the Company expects its effective tax rates to be between 35% to 40% in Canada, 35% to 40% in Mexico, 30% in Australia and 20% in Finland. The Company’s overall effective tax rate is expected to be approximately 34% to 36% for the full year 2026.
Capital Expenditures
Capital expenditures, including sustaining capital, construction and development costs and capitalized exploration costs, are expected to total approximately $2,595.0 million in 2026. The Company expects to fund its 2026 capital expenditures through operating cash
32
flow from the sale of its gold production. Significant components of the expected 2026 capital expenditures program include the following:
| ● | $992.8 million in sustaining capital expenditures(i) relating to Detour Lake ($304.5 million), Meliadine ($106.2 million), LaRonde ($103.0 million), Canadian Malartic ($92.9 million), Kittila ($84.3 million), Fosterville ($77.0 million), Meadowbank ($69.5 million), Macassa ($57.1 million), Pinos Altos ($44.6 million), Goldex ($36.3 million), and other regional areas ($17.4 million); |
| ● | $1,602.2 million in development capital expenditures(i) relating to Canadian Malartic ($367.0 million), Detour Lake ($322.5 million), Macassa ($170.3 million), Meliadine ($95.2 million), Meadowbank ($87.0 million), LaRonde ($68.6 million), Fosterville ($45.8 million), Goldex ($36.2 million), Pinos Altos ($8.3 million), Kittila ($7.7 million) and other projects, including Detour Lake underground project ($132.5 million), Hope Bay ($123.7 million), Upper Beaver ($118.1 million), San Nicolás ($17.4 million), and other regional areas ($1.9 million); |
| ● | Capitalized exploration expenditures, included in the figures above, are expected to be $310.0 million in 2026. |
The Company continues to examine other possible corporate development opportunities which may result in the acquisition of companies or assets using the Company’s securities, cash or a combination thereof. If cash is used to fund acquisitions, Agnico Eagle may be required to issue debt or securities to satisfy cash payment requirements.
All-in Sustaining Costs per Ounce
Agnico Eagle’s all-in sustaining costs per ounce on a by-product basis are expected to be between $1,400 and $1,550 in 2026 compared with all-in sustaining costs per ounce on a by-product basis (revised) $1,313 in 2025.
The Company is subject to significant risks due to the inherent nature of the business of exploration, development and mining of properties with precious metals. The risks described below are not the only ones facing the Company. The risk factors below may include details of how the Company seeks to mitigate these risks where possible. For a more comprehensive discussion of these inherent risks, see “Risk Factors” in the Company’s most recent AIF on file with the Canadian provincial securities regulatory authorities and included in the Company’s most recent Form 40-F on file with the SEC, respectively.
The Company’s principal financial liabilities are comprised of accounts payable and accrued liabilities, long-term debt and derivative financial instruments. The Company uses these financial instruments to manage its cash flows which are used to support ongoing operations and future growth.
The Company’s principal financial assets are comprised of cash and cash equivalents, trade receivables, equity securities and derivative financial instruments, including share purchase warrants. Cash and cash equivalents and trade receivables are generated by the Company’s operations. Equity securities and share purchase warrants are generally strategic investments made in other mining companies.
Note:
(i) | Sustaining capital expenditures and development capital expenditures are not standardized financial measures under IFRS Accounting Standards. For a reconciliation to total capital expenditures and a discussion of the composition and usefulness of these non-GAAP measures, see “Non-GAAP Financial Performance Measures” below. |
33
Using financial instruments exposes the Company to a variety of financial risks: credit risk, liquidity risk and market risk (including interest rate risk, commodity price risk and foreign currency risk, as discussed below).
Credit risk is the risk that the counterparties to financial contracts will fail to perform on an obligation to the Company. Credit risk is partially mitigated by dealing with what the Company believes to be high quality counterparties such as major banks and limiting concentration risk.
Liquidity risk is the risk that the Company will encounter difficulty in meeting obligations associated with financial liabilities that are settled by delivering cash or another financial asset. The Company attempts to mitigate liquidity risk primarily by monitoring its debt rating and the maturity dates of existing debt and other payables.
Market risk is the risk that changes in market factors, such as interest rates, listed equity prices, commodity prices and foreign exchange rates, will affect the value of Agnico Eagle’s financial instruments.
The following table sets out a summary of the Company’s financial instruments(i) as at December 31, 2025:
Financial Instrument | | Carrying Value | | Associated Risks | |
Cash and cash equivalents | | $ | 2,866,053 |
| Credit, Market |
Short-term investments | | $ | 8,856 |
| Credit, Market |
Loans receivable | | $ | 9,203 |
| Credit, Market |
Equity securities | | $ | 1,423,499 |
| Liquidity, Market |
Share purchase warrants | | $ | 84,753 |
| Liquidity, Market |
Fair value of derivative financial instruments | | $ | 34,428 |
| Credit, Market |
Accounts payable and accrued liabilities | | $ | (1,033,444) |
| Liquidity, Market |
Fair value of derivative financial instruments | | $ | (5,676) |
| Liquidity, Market |
Long-term debt | | $ | (196,271) |
| Liquidity, Market |
Lease obligations | | $ | (125,199) |
| Liquidity, Market |
Note:
| (i) | See Notes 6 and 20 in the consolidated financial statements for details on the Company’s financial instruments, fair value measurements and financial risk management. |
The Company’s current exposure to market risk for changes in interest rates relates primarily to drawdowns on its credit facilities, its cash and cash equivalents and its short-term investments. Drawdowns on the credit facilities are used primarily to fund a portion of the capital expenditures related to the Company’s development projects and working capital requirements. As at December 31, 2025, there were no amounts outstanding on the Company’s credit facility. In addition, the Company invests its cash in investments with short maturities or with frequent interest reset terms and a credit rating of R-1 or better. As a result, the Company’s interest income fluctuates with short-term market conditions. As at December 31, 2025, short-term investments were $8.9 million.
Amounts drawn under the credit facility are subject to floating interest rates based on SOFR and CORRA benchmark rates. In the past, the Company has entered into derivative instruments to hedge against unfavourable changes in interest rates. The Company monitors its interest rate exposure and may enter into such agreements to manage its exposure to fluctuating interest rates.
Commodity Prices and Foreign Currencies
Agnico Eagle’s net income is sensitive to metal prices and the US dollar/Canadian dollar, US dollar/Australian dollar, US dollar/Euro and US dollar/Mexican peso exchange rates.
Changes in the market price of gold may be attributed to numerous factors such as demand, global mine production levels, central bank purchases and sales and investor sentiment. Changes in the market prices of other metals may be attributed to factors such as demand and global mine production levels. Changes in the market price of diesel may be attributed to factors such as supply and demand. Changes in exchange rates may be attributed to factors such as supply and demand for currencies and economic conditions in each country or currency area. In 2025, the ranges of metal prices, diesel prices and exchange rates were as follows:
| ● | Gold: $2,633 – $4,449 per ounce, averaging $3,432 per ounce; |
34
| ● | Silver: $29.41 – $74.84 per ounce, averaging $40.03 per ounce; |
| ● | Diesel: $0.66 – $0.85 per litre, averaging $0.74 per litre; |
| ● | US dollar/Canadian dollar: C$1.36 – C$1.46 per $1.00, averaging C$1.40 per $1.00; |
| ● | US dollar/Australian dollar: A$1.53 – A$1.67 per $1.00, averaging A$1.55 per $1.00; |
| ● | US dollar/Euro: €0.84 - €0.98 per $1.00, averaging €0.89 per $1.00; and |
| ● | US dollar/Mexican peso: 17.90 – 20.85 Mexican pesos per $1.00, averaging 19.23 Mexican pesos per $1.00. |
The Company has a long-standing policy of no forward gold sales. To attempt to mitigate the impact of fluctuating by-product metal prices, the Company may occasionally enters into derivative financial instrument contracts under its Board-approved Risk Management Policies and Procedures. The Company’s policy does not allow speculative trading.
The Company receives payment for all of its metal sales in US dollars and pays most of its operating and capital costs in Canadian dollars, Australian dollars, Euros, or Mexican pesos. This gives rise to significant currency risk exposure. The Company enters into currency hedging transactions under its Board-approved Foreign Exchange Risk Management Policies and Procedures to hedge part of its foreign currency exposure. The policy does not permit the hedging of translation exposure (that is, the gains and losses that arise from the accounting translation into US dollars of assets and liabilities denominated in other currencies), as it does not give rise to cash exposure. The Company’s foreign currency derivative financial instrument strategy includes the use of purchased puts, written calls, collars and forwards that are not held for speculative purposes. As at December 31, 2025, there were foreign exchange derivatives outstanding related to $4,458.4 million of 2026 and 2027 expenditures (December 31, 2024 - $4,006.5 million). During the year ended December 31, 2025 the Company recognized a gain of $112.2 million on foreign exchange derivatives in the gain (loss) on derivative financial instruments line item of the consolidated statements of income (2024 - loss of $174.2 million).
The Company considers, and may enter into, risk management strategies to mitigate price risk on certain consumables, including diesel fuel. These strategies may include longer term purchasing contracts and financial and derivative instruments. As at December 31, 2025, there were derivative financial instruments outstanding relating to 16.0 million gallons of heating oil (December 31, 2024 - 28.0 million). During the year ended December 31, 2025 the Company recognized a loss of $0.4 million on heating oil derivatives in the (gain) loss on derivative financial instruments line item of the consolidated statements of income (2024 - loss of $3.7 million).
Detour Lake, Canadian Malartic and Meadowbank were the Company’s most significant contributors in 2025 to the Company’s payable production of gold at 20%, 19% and 14%, respectively, and are expected to account for a significant portion of the Company’s payable production of gold in the future.
Mining is a complex and unpredictable business and, therefore, actual payable production of gold ounces may differ from expectations. Adverse conditions affecting mining or milling may have a material adverse impact on the Company’s financial performance and results of operations. The Company anticipates using revenue generated by its operations to finance the capital expenditures required at its mine projects.
The Company’s mining and mineral processing operations, exploration activities and properties are subject to the laws and regulations of federal, provincial, state and local governments in the jurisdictions in which the Company operates. These laws and regulations are extensive and govern prospecting, exploration, development, production, exports, taxes, labour standards, occupational health and safety, waste disposal, tailings management, toxic substances, environmental protection, greenhouse gases, mine safety, reporting of payments to governments and other matters. Compliance with such laws and regulations increases the costs of planning, designing, drilling, developing, constructing, operating, managing, closing, reclaiming and rehabilitating mines and other facilities. New laws or regulations, amendments to current laws and regulations governing operations and activities on mining properties or more stringent implementation or interpretation thereof could have a material adverse effect on the Company, increase costs, cause a reduction in levels of production and delay or prevent the development of new mining properties. Regulatory enforcement, in the form of compliance or
35
infraction notices, has occurred at some of the Company’s mines and, while the current risks related to such enforcement are not expected to be material, the risk of material fines or corrective action cannot be ruled out in the future.
The Company’s management is responsible for establishing and maintaining adequate internal control over financial reporting (“ICFR”) and disclosure controls and procedures (“DC&P”).
ICFR is a framework designed to provide reasonable assurance regarding the reliability of financial reporting and the preparation of financial statements for external purposes in accordance with IFRS Accounting Standards. Management has used the Internal Control – Integrated Framework issued by the Committee of Sponsoring Organizations of the Treadway Commission (2013 framework) in order to assess the effectiveness of the Company’s ICFR.
DC&P form a broader framework designed to provide reasonable assurance that information required to be disclosed by the Company in its annual and interim filings and other reports filed under securities legislation is recorded, processed, summarized and reported within the time frame specified in securities legislation and includes controls and procedures designed to ensure that information required to be disclosed by the Company in its annual and interim filings and other reports submitted under securities legislation is accumulated and communicated to the Company’s management to allow timely decisions regarding required disclosure.
Together, the ICFR and DC&P frameworks provide internal control over financial reporting and disclosure. The Company maintains disclosure controls and procedures that are designed to provide reasonable assurance that information which is required to be disclosed in the Company’s annual and interim filings and other reports filed under securities legislation is accumulated and communicated in a timely fashion. Due to their inherent limitations, the Company acknowledges that, no matter how well designed, ICFR and DC&P can provide only reasonable assurance of achieving the desired control objectives and as such may not prevent or detect all misstatements. Further, the effectiveness of ICFR is subject to the risk that controls may become inadequate because of changes in conditions or that the degree of compliance with policies or procedures may change.
There have been no material changes in our internal controls during the year ended December 31, 2025 that have materially affected, or are reasonably likely to materially affect, internal control over financial reporting.
The Company’s management, under the supervision of the Company’s Chief Executive Officer and Chief Financial Officer, has evaluated the effectiveness of its ICFR and DC&P as at December 31, 2025. Based on this evaluation, management concluded that the Company’s ICFR and DC&P were effective as at December 31, 2025.
The following table sets out the maximum number of common shares that would be outstanding if all dilutive instruments outstanding at January 30, 2026 were exercised:
Common shares outstanding | | 501,029,605 |
Employee stock options |
| 1,588,534 |
Common shares held in a trust in connection with the Restricted Share Unit plan, Performance Share Unit plan and Long Term Incentive Plan |
| 809,594 |
Total |
| 503,427,733 |
36
IFRS Accounting Standards Critical Accounting Policies and Accounting Estimates
The Company’s consolidated financial statements are prepared in accordance with International Financial Reporting Standards (“IFRS Accounting Standards”) as issued by the International Accounting Standards Board. Agnico Eagle’s material accounting policies, including a summary of current and future changes in accounting policies, are disclosed in Note 3 in the consolidated financial statements.
The preparation of the consolidated financial statements in accordance with IFRS Accounting Standards requires management to make estimates and judgments that affect the reported amounts of assets, liabilities, revenues and expenses. Critical accounting estimates have a reasonable likelihood that materially different amounts could be reported under different conditions or using different assumptions. In making judgments about the carrying value of assets and liabilities, the Company uses estimates based on historical experience and assumptions that are considered reasonable in the circumstances. Although the Company evaluates its accounting estimates on an ongoing basis using the most current information available, actual results may differ from these estimates. The critical judgments and key sources of estimation uncertainties in the application of accounting policies during the year ended December 31, 2025 are disclosed in Note 4 to the consolidated financial statements.
Management has discussed the development and selection of critical accounting policies and estimates with the Audit Committee which has reviewed the Company’s disclosure included or incorporated by reference in this MD&A.
The scientific and technical information contained in this MD&A relating to Nunavut, Quebec and Finland operations has been approved by Dominique Girard, Eng., Executive Vice-President & Chief Operating Officer – Nunavut, Quebec & Europe; relating to Ontario, Australia and Mexico operations has been approved by Natasha Vaz, P.Eng., Executive Vice-President & Chief Operating Officer – Ontario, Australia & Mexico; relating to exploration has been approved by Guy Gosselin, Eng. and P.Geo., Executive Vice-President, Exploration; and relating to mineral reserves and mineral resources has been approved by Dyane Duquette, P.Geo., Vice-President, Mineral Resources Management, each of whom is a “Qualified Person” for the purposes of NI 43-101.
The assumptions used for the mineral reserve estimates at all mines and advanced projects held by Agnico Eagle on December 31, 2025 are $1,600 per ounce of gold, $24.00 per ounce of silver, $3.80 per pound of copper and $1.20 per pound of zinc, except for $1,500 per ounce of gold used for the Detour Lake open pit, $1,350 per ounce of gold for Hammond Reef project; $1,650 per ounce of gold used for Wasamac and Marban, $2,000 per ounce used for Amaruq; $1,450 per ounce of gold used for Upper Beaver; $2,000 per ounce of gold used for Pinos Altos; and US$1,300 per ounce of gold used for San Nicolás. Foreign exchange rates assumptions of C$1.34 per US$1.00, A$1.52 per US$1.00, €0.91 per US$1.00, and 18.00 Mexican pesos per US$1.00 were used for all mines and projects, except for C$1.30 per US$1.00 used for Detour Lake open pit, Detour Lake underground and Hammond Reef.
37
The following table sets out the proven and probable gold mineral reserves for properties held by Agnico Eagle as of December 31, 2025:
| | | | Gold Grade | | Contained |
| | | | (Grams per | | Gold |
Proven and Probable Mineral Reserves by Property(i)(ii) | | Tonnes | | Tonne) | | (Ounces)(iii) |
|
| (thousands) | | |
| (thousands) |
Proven Mineral Reserves |
| |
| |
| |
LaRonde mine |
| 2,469 |
| 4.65 |
| 369 |
LZ5 |
| 6,405 |
| 2.02 |
| 415 |
LaRonde |
| 8,874 |
| 2.75 |
| 784 |
Canadian Malartic mine | | 36,896 | | 0.50 | | 597 |
Odyssey mine | | 29 | | 2.37 | | 2 |
Canadian Malartic |
| 36,925 |
| 0.50 |
| 599 |
Goldex mine |
| 6,255 |
| 1.48 |
| 298 |
Akasaba West |
| 969 |
| 0.82 |
| 26 |
Goldex |
| 7,225 |
| 1.39 |
| 324 |
Detour Lake |
| 120,371 |
| 0.78 |
| 3,035 |
Macassa |
| 742 |
| 9.36 |
| 223 |
Meadowbank |
| 8,129 |
| 1.29 |
| 338 |
Meliadine |
| 4,104 |
| 5.74 |
| 757 |
Hope Bay |
| 93 |
| 6.77 |
| 20 |
Fosterville |
| 887 |
| 5.41 |
| 154 |
Kittila |
| 931 |
| 4.66 |
| 140 |
Pinos Altos |
| 659 |
| 2.00 |
| 42 |
San Nicolás (50%) |
| 23,858 |
| 0.41 |
| 314 |
Total Proven Mineral Reserves |
| 212,796 |
| 0.98 |
| 6,731 |
Probable Mineral Reserves |
| |
| |
| |
LaRonde mine |
| 8,158 |
| 6.06 |
| 1,590 |
LZ5 |
| 6,800 |
| 2.17 |
| 474 |
LaRonde |
| 14,959 |
| 4.29 |
| 2,064 |
Canadian Malartic mine | | 21,697 | | 1.22 | | 852 |
Marban deposit | | 51,618 | | 0.95 | | 1,577 |
Odyssey mine | | 4,758 | | 2.12 | | 325 |
East Goldie deposit | | 54,943 | | 3.23 | | 5,699 |
Canadian Malartic |
| 133,016 |
| 1.98 |
| 8,453 |
Goldex mine |
| 9,065 |
| 1.68 |
| 488 |
Akasaba West |
| 2,807 |
| 0.96 |
| 86 |
Goldex |
| 11,872 |
| 1.51 |
| 575 |
Detour Lake |
| 677,690 |
| 0.71 |
| 15,540 |
Macassa |
| 8,068 |
| 7.62 |
| 1,976 |
Wasamac |
| 14,757 |
| 2.90 |
| 1,377 |
Upper Beaver |
| 23,181 |
| 3.71 |
| 2,768 |
Hammond Reef |
| 123,473 |
| 0.84 |
| 3,323 |
Meadowbank |
| 9,585 |
| 3.62 |
| 1,116 |
Meliadine |
| 17,971 |
| 4.96 |
| 2,864 |
Hope Bay |
| 16,086 |
| 6.53 |
| 3,376 |
Fosterville |
| 9,516 |
| 4.95 |
| 1,516 |
Kittila |
| 23,818 |
| 4.15 |
| 3,179 |
Pinos Altos |
| 4,003 |
| 1.76 |
| 227 |
San Nicolás (50%) |
| 28,761 |
| 0.39 |
| 358 |
Total Probable Mineral Reserves |
| 1,116,755 |
| 1.36 |
| 48,711 |
Total Proven and Probable Mineral Reserves |
| 1,329,551 |
| 1.30 |
| 55,442 |
Notes:
| (i) | Amounts presented in this table have been rounded to the nearest thousand and therefore totals may differ slightly from the sum of the individual entities. |
38
| (ii) | Complete information on the verification procedures, quality assurance program, quality control procedures, parameters and methods and other factors that may materially affect scientific and technical information presented in this MD&A and definitions of certain terms used herein may be found in: the AIF under the heading “Information on Mineral Reserves and Mineral Resources of the Company”; the Technical Report on the 2022 LaRonde Mineral Resource & Mineral Reserve Estimate filed with Canadian securities regulatory authorities on SEDAR+ on March 23, 2022; the Technical Report on the Mineral Resources and Mineral Reserves at Meadowbank Gold Complex including the Amaruq satellite deposit, Nunavut, Canada as at December 31, 2017 filed with Canadian securities regulatory authorities on SEDAR+ on February 14, 2018; the Updated Technical Report on the Meliadine Gold Project, Nunavut, Canada dated February 11, 2015 filed with Canadian securities regulatory authorities on SEDAR+ on March 12, 2015; the Technical Report on the Mineral Resource and Mineral Reserve Estimates for the Canadian Malartic property in Quebec, Canada with an effective date of December 31, 2020 filed with the Canadian securities regulatory authorities on SEDAR+ on March 25, 2021; the Technical Report on the Mineral Resource and Mineral Reserve Estimates for the LaRonde Complex in Quebec, Canada with an effective date of December 31, 2022 filed with the Canadian securities regulatory authorities on SEDAR+ on March 24, 2023; the Technical Report on the Mineral Resource and Mineral Reserve Estimates for the Detour Lake Operation in Ontario, Canada as at March 31, 2024 filed with Canadian securities regulatory authorities on September 20, 2024; and the Technical Report on the Mineral Resource and Mineral Reserve Estimates for the Fosterville Gold Mine in the State of Victoria, Australia as at December 31, 2018 filed on April 1, 2019. |
| (iii) | Total contained gold ounces does not include equivalent gold ounces for the by-product metals contained in the mineral reserves. |
Non-GAAP Financial Performance Measures
This MD&A discloses certain financial performance measures, including adjusted net income, adjusted net income per share, EBITDA, adjusted EBITDA, free cash flow, free cash flow before changes in working capital, total cash costs per ounce (on both a by-product and co-product basis), minesite costs per tonne, all-in sustaining costs per ounce (on both a by-product and co-product basis), operating margin, sustaining capital expenditures, development capital expenditures, sustaining capitalized exploration, development capitalized exploration, that are not recognized measures under IFRS Accounting Standards. These measures may not be comparable to similar measures reported by other gold producers. Non-GAAP financial performance measures should be considered together with other data prepared in accordance with IFRS Accounting Standards.
Adjusted Net Income and Adjusted Net Income Per Share
Adjusted net income takes the net income as recorded in the consolidated statements of income and adjusts for the effects of certain non-recurring, unusual and other items that the Company believes are not reflective of the Company’s underlying performance for the reporting period. Adjusted net income is calculated by adjusting net income for items such as foreign currency translation gains or losses, realized and unrealized gains or losses on derivative financial instruments, severance and transaction costs related to acquisitions, revaluation gains and losses, environmental remediation charges, gains or losses on the disposal of assets, purchase price allocations to inventory, debt extinguishment costs, impairment loss charges and reversals, gains and losses on the sale of equity securities, retroactive payments, self-insurance losses, sale of non-strategic properties, multi-year donations, and income and mining taxes adjustments. Adjusted net income per share is calculated by dividing adjusted net income by the weighted average number of shares outstanding on a basic and diluted basis.
The Company believes that these generally accepted industry measures are useful to investors in that they allow for the evaluation of the results of continuing operations and in making comparisons between periods. Adjusted net income and adjusted net income per share are intended to provide investors with information about the Company’s continuing income generating capabilities from its core mining business, excluding the above adjustments, which the Company believes are not reflective of operational performance. Management uses this measure to, and believes it is useful to investors so they can, understand and monitor for the operating performance of the Company in conjunction with other data prepared in accordance with IFRS Accounting Standards.
39
The following table sets out the calculation of adjusted net income and adjusted net income per share for the years ended December 31, 2025, December 31, 2024 and December 31, 2023.
| | Year Ended December 31, | |||||||
| | 2025 | | 2024 | | 2023 | |||
(thousands of United States dollars) |
| | | | | | | | |
Net income for the year - basic | | $ | 4,461,461 | | $ | 1,895,581 | | $ | 1,941,307 |
Dilutive impact of cash settling LTIP | |
| — | |
| — | |
| (4,736) |
Net income for the year - diluted | |
| 4,461,461 | |
| 1,895,581 | |
| 1,936,571 |
Foreign currency translation (gain) loss | |
| (25,654) | |
| 9,383 | |
| (328) |
(Gain) loss on derivative financial instruments | |
| (223,960) | |
| 155,819 | |
| (68,432) |
Impairment reversal | |
| (229,000) | |
| — | |
| — |
Impairment loss | |
| 10,554 | |
| — | |
| 787,000 |
Environmental remediation | |
| 43,239 | |
| 14,719 | |
| 2,712 |
Severance and transaction costs related to acquisitions | |
| — | |
| — | |
| 21,503 |
Purchase price allocation to inventory(i) | |
| (9,221) | |
| (5,771) | |
| 26,477 |
Debt extinguishment costs | |
| 8,245 | |
| — | |
| — |
Loss on sale of equity securities | |
| 40,175 | |
| — | |
| — |
Revaluation gain on Yamana Transaction | |
| — | |
| — | |
| (1,543,414) |
Net loss on disposal of property, plant and equipment | |
| 41,219 | |
| 37,669 | |
| 26,759 |
Other(ii) | |
| 2,077 | |
| 19,555 | |
| 3,262 |
Income and mining taxes adjustments(iii) | |
| 50,034 | |
| (9,183) | |
| (100,910) |
Adjusted net income for the year - basic | | $ | 4,169,169 | | $ | 2,117,772 | | $ | 1,095,936 |
Adjusted net income for the year - diluted | | $ | 4,169,169 | | $ | 2,117,772 | | $ | 1,091,200 |
Net income per share - basic | | $ | 8.89 | | $ | 3.79 | | $ | 3.97 |
Net income per share - diluted | | $ | 8.86 | | $ | 3.78 | | $ | 3.95 |
Adjusted net income per share - basic | | $ | 8.31 | | $ | 4.24 | | $ | 2.24 |
Adjusted net income per share - diluted | | $ | 8.28 | | $ | 4.23 | | $ | 2.23 |
Notes:
| (i) | As part of the purchase price allocation in a business combination, the Company is required to determine the fair value of net assets acquired. The fair value of inventory acquired is estimated based on the selling cost less costs to be incurred plus a profit margin on those costs resulting in a fair value adjustment to the carrying value of inventories acquired. These non-cash fair value adjustments which affected the cost of inventory sold during the period and are not representative of ongoing operations, were removed from net income in the calculation of adjusted net income. |
| (ii) | Other adjustments are comprised of retroactive payments, disposals of supplies inventory at non-operating sites and other unusual items that management considers are not reflective of the Company’s underlying performance in the period. |
| (iii) | Income and mining taxes adjustments reflect items such as foreign currency translation recorded to the income and mining taxes expense, the impact of income and mining taxes on adjusted items, recognition of previously unrecognized capital losses, the result of income and mining taxes audits, impact of changes in tax laws and adjustments to prior period tax filings. |
EBITDA and Adjusted EBITDA
EBITDA is calculated by adjusting net income for finance costs, amortization of property, plant and mine development and income and mining tax expense line items as reported in the consolidated statements of income.
Adjusted EBITDA removes the effects of certain non-recurring, unusual and other items that the Company believes are not reflective of the Company’s underlying performance for the reporting period. Adjusted EBITDA is calculated by adjusting the EBITDA calculation for items such as foreign currency translation gains or losses, realized and unrealized gains or losses on derivative financial instruments, impairment loss charges and reversals, severance and transaction costs related to acquisitions, revaluation gains and losses, environmental remediation, gains or losses on the disposal of assets, purchase price allocations to inventory, gains and losses on the sale of equity securities, self-insurance losses, gains on the sale of non-strategic exploration properties, multi-year health care donations, disposals of supplies inventory at non-operating sites and retroactive payments.
40
The Company believes that these generally accepted industry measures are useful in that they allow for the evaluation of the cash generating capability of the Company to fund its working capital, capital expenditure and debt repayments. EBITDA and Adjusted EBITDA are intended to provide investors with information about the Company’s continuing cash generating capability from its core mining business, excluding the above adjustments, which management believes are not reflective of operational performance. Management uses these measures to, and believes it is useful to investors so they can, understand and monitor the cash generating capability of the Company in conjunction with other data prepared in accordance with IFRS Accounting Standards.
The following table sets out the calculation of EBITDA and Adjusted EBITDA for the year ended December 31, 2025, December 31, 2024 and December 31, 2023.
| | Year Ended December 31, | |||||||
| | 2025 | | 2024 | | 2023 | |||
(thousands of United States dollars) |
| | | | | | | | |
Net income for the period | | $ | 4,461,461 | | $ | 1,895,581 | | $ | 1,941,307 |
Finance costs | |
| 91,145 | |
| 126,738 | |
| 130,087 |
Income and mining tax expense | |
| 2,242,450 | |
| 925,974 | |
| 417,762 |
Amortization of property, plant and mine development | |
| 1,645,297 | |
| 1,514,076 | |
| 1,491,771 |
EBITDA | |
| 8,440,353 | |
| 4,462,369 | |
| 3,980,927 |
Foreign currency translation (gain) loss | |
| (25,654) | |
| 9,383 | |
| (328) |
(Gain) loss on derivative financial instruments | |
| (223,960) | |
| 155,819 | |
| (68,432) |
Impairment reversal | |
| (229,000) | |
| — | |
| — |
Impairment loss | |
| 10,554 | |
| — | |
| 787,000 |
Environmental remediation | |
| 43,239 | |
| 14,719 | |
| 2,712 |
Severance and transaction costs related to acquisitions | |
| — | |
| — | |
| 21,503 |
Purchase price allocation to inventory(i) | |
| (9,221) | |
| (5,771) | |
| 26,477 |
Loss on sale of equity securities | |
| 40,175 | |
| — | |
| — |
Revaluation gain on Yamana Transaction | |
| — | |
| — | |
| (1,543,414) |
Net loss on disposal of property. plant and equipment | |
| 41,219 | |
| 37,669 | |
| 26,759 |
Other(ii) | |
| 2,077 | |
| 19,555 | |
| 3,262 |
Adjusted EBITDA | | $ | 8,089,782 | | $ | 4,693,743 | | $ | 3,236,466 |
Notes:
| (i) | As part of the purchase price allocation in a business combination, the Company is required to determine the fair value of net assets acquired. The fair value of inventory acquired is estimated based on the selling cost less costs to be incurred plus a profit margin on those costs resulting in a fair value adjustment to the carrying value of inventories acquired. These non-cash fair value adjustments which affected the cost of inventory sold during the period and are not representative of ongoing operations, were removed from net income in the calculation of adjusted EBITDA. |
| (ii) | Other adjustments are comprised of retroactive payments, disposals of supplies inventory at non-operating sites and other unusual items that management considers are not reflective of the Company’s underlying performance in the period. |
Free Cash Flow and Free Cash Flow before Changes in Non-Cash Components of Working Capital
Free cash flow is calculated by deducting additions to property, plant and mine development from the cash provided by operating activities line item as recorded in the consolidated statements of cash flows.
Free cash flow before changes in non-cash components of working capital is calculated by excluding items such as the effect of changes in non-cash components of working capital from free cash flow, which includes income taxes, inventory, other current assets and accounts payable and accrued liabilities.
The Company believes that these generally accepted industry measures are useful in that they allow for the evaluation of the Company’s ability to repay creditors and return cash to shareholders without relying on external sources of funding. Free cash flow and free cash flow before changes in non-cash components of working capital also provide investors with information about the Company’s financial position and its ability to generate cash to fund operational and capital requirements as well as return cash to shareholders. Management uses these measures in conjunction with other data prepared in accordance with IFRS Accounting Standards to, and believes it is useful to investors so they can, understand and monitor the cash generating ability of the Company.
41
The following table sets out the calculation of free cash flow and free cash flow before changes in non-cash components of working capital for the years ended December 31, 2025, December 31, 2024 and December 31, 2023.
| | 2025 | | 2024 | | 2023 | |||
|
| (thousands of United States dollars) | |||||||
Cash provided by operating activities | | $ | 6,817,113 | | $ | 3,960,892 | | $ | 2,601,562 |
Additions to property, plant and mine development | |
| (2,418,200) | |
| (1,817,949) | |
| (1,654,129) |
Free cash flow | |
| 4,398,913 | |
| 2,142,943 | |
| 947,433 |
Changes in income taxes | | $ | (886,371) | | $ | (259,327) | | $ | (103,850) |
Changes in inventory | |
| 160,744 | |
| 208,300 | |
| 169,168 |
Changes in other current assets | |
| 43,969 | |
| (1,166) | |
| 80,931 |
Changes in accounts payable and accrued liabilities | |
| (122,639) | |
| (27,831) | |
| 147 |
Free cash flow before changes in non-cash components of working capital | | $ | 3,594,616 | | $ | 2,062,919 | | $ | 1,093,829 |
Net Cash (Debt)
Net cash (debt) is calculated by adjusting the total of the current portion of long-term debt and non-current long-term debt as recorded on the consolidated balance sheets for deferred financing costs and cash and cash equivalents. Management believes the measure of net cash (debt) is useful to help investors determine the Company’s overall cash (debt) position and to evaluate the future debt capacity of the Company.
The following table sets out a reconciliation of long-term debt per the consolidated balance sheets to net cash (debt) as at December 31, 2025, December 31, 2024 and December 31, 2023.
| | As at December 31, | |||||||
(thousands of United States dollars) | | 2025 | | 2024 | | 2023 | |||
Current portion of long-term debt | | $ | — | | $ | (90,000) | | $ | (100,000) |
Non-current portion of long-term debt | |
| (196,271) | |
| (1,052,956) | |
| (1,743,086) |
Long-term debt | | | (196,271) | | | (1,142,956) | | | (1,843,086) |
Cash and cash equivalents | | | 2,866,053 | | | 926,431 | | | 338,648 |
Net cash (debt) | | $ | 2,669,782 | | $ | (216,525) | | $ | (1,504,438) |
Total Cash Costs per Ounce of Gold Produced and Minesite Costs per Tonne
Total Cash Costs per Ounce
Total cash costs per ounce is reported on a per ounce of gold produced basis on both a by-product basis (deducting the impact of by-product metals from production costs to isolate the cost of producing an ounce of gold) and co-product basis (without deducting the impact of by-product metals). Total cash costs per ounce of gold produced on a by-product basis for periods ending on or before December 31, 2025 are calculated by adjusting production costs as recorded in the consolidated statements of income for (i) the impact of by-products, (ii) inventory production costs, (iii) the impact of purchase price allocation in connection with mergers and acquisitions on inventory accounting, (iv) realized gains and losses on hedges of production costs, (v) in-kind royalty costs, and (vi) smelting, refining and marketing charges and then dividing by the number of ounces of gold produced. For periods commencing on or after January 1, 2026, the Company will additionally adjust production costs for the NTI Payment (as discussed further below), which adjustment will only affect this non-GAAP measure only insofar as the measure includes costs from Meadowbank (that is, for Meadowbank, the Nunavut region and the consolidated Company). The Company’s calculation of total cash costs per ounce for other mines and regions that do not include Meadowbank are not affected by this change. Where this amended composition is used and the change affects the quantum of total cash costs per ounce, this MD&A indicates this by referring to the non-GAAP measure as “total cash costs per ounce (revised)”.
For periods commencing on or after January 1, 2026, the Company revised the composition of certain of its non-GAAP performance measures, including “total cash costs per ounce”, to adjust for the NTI Payment. The NTI payment is the payment to Nunavut Tunngavik Inc. (“NTI”) under the Company’s mineral production lease in respect of the Amaruq mine at Meadowbank, which is a royalty based on net profits, subject to a minimum profit margin (“NTI Payment”). NTI is the body that represents the Inuit of Nunavut under the Nunavut Land Claims Agreement and holds the subsurface mineral rights on certain parcels of Inuit owned land, including at the Amaruq mine. The royalty payments under the mining leases with NTI are based on net profits at the mine, subject to a cap on allowable costs
42
as a percentage of gross revenue. At mines located on lands in Nunavut where the subsurface mineral rights are not held by NTI (whether or not on Inuit owned lands), the Crown holds the subsurface mineral rights and imposes a net profits royalty (the “Crown royalty”) under the Nunavut Mining Regulations (the “NMR”). The Company does not include the Crown royalty in its calculations of total cash costs per ounce and certain other of its non-GAAP measures as the Company classifies these costs as an income tax for financial statement purposes in accordance with IFRS Accounting Standards and income taxes are generally excluded from the calculation of such non-GAAP measures. The Crown royalty is not applicable where NTI is the holder of the subsurface mineral rights. Where NTI is holder of the subsurface mineral rights, the Company instead is required to make the payment under the mining leases with NTI, which the Company views as having similar characteristics as the payments under the Crown royalty. Accordingly, to ensure comparability across the Company’s mines in Nunavut, the Company revised its calculation of such non-GAAP measures to also adjust for the NTI Payment where applicable.
Investors should note that total cash costs per ounce are not reflective of all cash expenditures, as they do not include income tax payments, interest costs or dividend payments. Total cash costs per ounce on a co-product basis is calculated in the same manner as the total cash costs per ounce on a by-product basis, except that the impact of by-product metals is not deducted. Accordingly, the calculation of total cash costs per ounce on a co-product basis does not reflect a reduction in production costs or smelting, refining and marketing charges associated with the production of by-product metals.
Total cash costs per ounce is intended to provide investors information about the cash-generating capabilities of the Company’s mining operations. Management also uses these measures to, and believes they are helpful to investors so investors can, understand and monitor the performance of the Company’s mining operations. The Company believes that total cash costs per ounce is useful to help investors understand the costs associated with producing gold and the economics of gold mining. As market prices for gold are quoted on a per ounce basis, using the total cash costs per ounce on a by-product basis measure allows management and investors to assess a mine’s cash-generating capabilities at various gold prices. Management is aware, and investors should note, that these per ounce measures of performance can be affected by fluctuations in exchange rates and, in the case of total cash costs per ounce of gold produced on a by-product basis, by-product metal prices. Management compensates for these inherent limitations by using, and investors should also consider using, these measures in conjunction with data prepared in accordance with IFRS Accounting Standards and minesite costs per tonne as these measures are not necessarily indicative of operating costs or cash flow measures prepared in accordance with IFRS Accounting Standards. Management also performs sensitivity analyses in order to quantify the effects of fluctuating metal prices and exchange rates.
Agnico Eagle’s primary business is gold production and the focus of its current operations and future development is on maximizing returns from gold production, with other metal production being incidental to the gold production process. Accordingly, all metals other than gold are considered by-products.
In this MD&A, unless otherwise indicated, total cash costs per ounce is reported on a by-product basis. Total cash costs per ounce is reported on a by-product basis because (i) gold is the Company’s primary product and source of substantially all its revenues, (ii) the Company mines ore, which may contain gold, silver, zinc, copper and other metals, and the company believes that isolating the cost of producing gold is a more meaningful measure of operating performance, (iii) it is a method used by management and the Board to monitor operations, and (iv) many other gold producers disclose similar measures on a by-product rather than a co-product basis.
Minesite Costs per Tonne
Minesite costs per tonne for periods ending on or before December 31, 2025 are calculated by adjusting production costs as recorded in the consolidated statements of income for (i) inventory production costs, (ii) in-kind royalty costs, and (iii) smelting, refining and marketing charges, and then dividing by tonnage of ore processed. For periods commencing on or after January 1, 2026, the Company will additionally adjust production costs for the NTI Payment (as discussed above in “Total Cash Costs per Ounce”), which adjustment will only affect minesite costs per tonne at Meadowbank and for the Nunavut region. The Company’s calculation of minesite costs per tonne for other mines and regions other than the Nunavut region are not affected by this change. Where this amended composition is used and the change affects the quantum of minesite costs per tonne, this MD&A indicates this by referring to the non-GAAP measure as “minesite costs per tonne (revised)”.
As the total cash costs per ounce can be affected by fluctuations in by–product metal prices and foreign exchange rates, management believes that minesite costs per tonne is useful to investors in providing additional information regarding the performance of mining operations, eliminating the impact of varying production levels. Management also uses this measure to determine the economic viability of mining blocks. As each mining block is evaluated based on the net realizable value of each tonne mined, in order to be economically viable the estimated revenue on a per tonne basis must be in excess of the minesite costs per tonne. For the reasons noted above in
43
respect of revisions to the composition of total cash costs per ounce, for the purposes of calculating this non-GAAP measure, the Company now adjusts production costs for the amount of the NTI Payment. The Company believes that this revision is helpful to both management and investors as it better reflects the cost performance at the Amaruq mine at Meadowbank and makes the reported measure more comparable across all of the Company’s mines. Management is aware, and investors should note, that this per tonne measure of performance can be affected by fluctuations in processing levels. This inherent limitation may be partially mitigated by using this measure in conjunction with production costs and other data prepared in accordance with IFRS Accounting Standards.
The following tables set out a reconciliation of total cash costs per ounce (on both a by-product basis and co-product basis) and minesite costs per tonne to production costs, exclusive of amortization, as presented in the consolidated statements of income in accordance with IFRS Accounting Standards.
Reconciliation of Production Costs to Total Cash Costs per Ounce by Mine and Region
Year Ended December 31, 2025
(United States dollars in thousands, except per ounce measures or as otherwise noted)
| | | | | | | | | | | | | | | | | | | | | | | | Total cash |
| | | | | | | | | | | | | | Smelting, | | Total cash | | | | Total cash | | | | costs per |
| | Payable | | | | | | | | Realized | | | | refining | | costs per | | | | costs per | | | | ounce |
| | gold | | | | Production | | | | (gains) and | | In-kind | | and | | ounce (co- | | Impact of | | ounce (by- | | | | (revised) |
| | production | | Production | | costs per | | Inventory | | losses on | | royalty | | marketing | | product | | by-product | | product | | NTI | | (by-product |
Mine | | (ounces)(i) | | costs | | ounce | | adjustments(ii) | | hedges | | costs(iii) | | charges | | basis) | | metals | | basis) | | Payment(iv) | | basis)(v) |
LaRonde | | 344,555 | | 360,025 | | 1,045 | | (6,001) | | 980 | | — | | 14,251 | | 1,072 | | (83,607) | | 829 | | — | | 829 |
Canadian Malartic | | 642,612 | | 488,160 | | 760 | | 19,122 | | 1,461 | | 112,464 | | 1,468 | | 969 | | (14,566) | | 946 | | — | | 946 |
Goldex |
| 125,501 |
| 148,952 |
| 1,187 |
| 2,288 |
| 413 |
| — |
| 4,382 |
| 1,243 |
| (30,280) |
| 1,002 |
| — |
| 1,002 |
Quebec |
| 1,112,668 |
| 997,137 |
| 896 |
| 15,409 |
| 2,854 |
| 112,464 |
| 20,101 |
| 1,032 |
| (128,453) |
| 917 |
| — |
| 917 |
Detour Lake |
| 692,675 |
| 565,439 |
| 816 |
| (1,863) |
| 1,226 |
| 44,714 |
| 5,167 |
| 887 |
| (6,135) |
| 879 |
| — |
| 879 |
Macassa |
| 312,729 |
| 221,718 |
| 709 |
| 11,146 |
| 987 |
| 15,559 |
| 492 |
| 799 |
| (2,016) |
| 793 |
| — |
| 793 |
Ontario |
| 1,005,404 |
| 787,157 |
| 783 |
| 9,283 |
| 2,213 |
| 60,273 |
| 5,659 |
| 860 |
| (8,151) |
| 852 |
| — |
| 852 |
Meliadine |
| 376,346 |
| 402,385 |
| 1,069 |
| (980) |
| 1,038 |
| — |
| 220 |
| 1,070 |
| (1,091) |
| 1,067 |
| — |
| 1,067 |
Meadowbank |
| 493,314 |
| 552,470 |
| 1,120 |
| (586) |
| 1,318 |
| — |
| 539 |
| 1,122 |
| (6,402) |
| 1,110 |
| (90,004) |
| 928 |
Nunavut |
| 869,660 |
| 954,855 |
| 1,098 |
| (1,566) |
| 2,356 |
| — |
| 759 |
| 1,100 |
| (7,493) |
| 1,091 |
| (90,004) |
| 988 |
Fosterville |
| 160,522 |
| 146,382 |
| 912 |
| 4,554 |
| (59) |
| — |
| 124 |
| 941 |
| (567) |
| 937 |
| — |
| 937 |
Australia |
| 160,522 |
| 146,382 |
| 912 |
| 4,554 |
| (59) |
| — |
| 124 |
| 941 |
| (567) |
| 937 |
| — |
| 937 |
Kittila |
| 217,379 |
| 236,238 |
| 1,087 |
| 2,199 |
| (2,624) |
| — |
| (214) |
| 1,084 |
| (703) |
| 1,081 |
| — |
| 1,081 |
Finland |
| 217,379 |
| 236,238 |
| 1,087 |
| 2,199 |
| (2,624) |
| — |
| (214) |
| 1,084 |
| (703) |
| 1,081 |
| — |
| 1,081 |
Pinos Altos |
| 81,734 |
| 205,808 |
| 2,518 |
| 6,058 |
| (1,234) |
| — |
| 1,282 |
| 2,593 |
| (47,945) |
| 2,006 |
| — |
| 2,006 |
Mexico |
| 81,734 |
| 205,808 |
| 2,518 |
| 6,058 |
| (1,234) |
| — |
| 1,282 |
| 2,593 |
| (47,945) |
| 2,006 |
| — |
| 2,006 |
Corporate and Other(vi) |
| — |
| 13,107 |
| — |
| (13,107) |
| — |
| — |
| — |
| — |
| — |
| — |
| — |
| — |
Consolidated |
| 3,447,367 |
| 3,340,684 |
| 965 |
| 22,830 |
| 3,506 |
| 172,737 |
| 27,711 |
| 1,035 |
| (193,312) |
| 979 |
| (90,004) |
| 953 |
Notes:
| (i) | Gold production for the year ended December 31, 2025 excludes 4,539 ounces of payable production of gold at La India and 323 ounces of payable production of gold at Creston Mascota, which were produced from residual leaching as well as 9,468 ounces of gold recovered at Hope Bay. |
| (ii) | Under the Company’s revenue recognition policy, revenue from contracts with customers is recognized upon the transfer of control over metals sold to the customer. As the total cash costs per ounce are calculated on a production basis, an inventory adjustment is made to reflect the portion of production not yet recognized as revenue. Included in inventory adjustments for Canadian Malartic for the year ended December 31, 2025 is $9.2 million associated with the fair value allocated to inventory on Canadian Malartic as part of the purchase price allocation from the acquisition, on March 31, 2023, of the 50% of Canadian Malartic that Agnico Eagle did not then hold. |
| (iii) | In-kind royalty adjustments in respect of Canadian Malartic, Detour Lake and Macassa relate to the in-kind royalties of 5.0%, 2.0% and 1.5%, respectively, paid in respect of gold production at such mines, which are excluded from production costs under IFRS Accounting Standards and added back in the calculation of total cash costs per ounce. |
| (iv) | For periods commencing on or after January 1, 2026, the Company has adjusted the composition of “total cash costs per ounce” to adjust for the NTI Payment. NTI Payments are incurred solely at Meadowbank and are included in production costs under IFRS Accounting Standards and subtracted from production costs in the calculation of total cash costs per ounce. See discussion above under “Total Cash Costs per Ounce”. |
| (v) | For each of the Company’s mines other than Meadowbank and its regions other than Nunavut, “total cash costs per ounce” and “total cash costs per ounce (revised)” are the same when calculated on both a by-product and co-product basis. For the year ended December 31, 2025, total cash costs per ounce (revised) on a co-product basis were $940 at Meadowbank, $997 for the Nunavut region and $1,009 for the consolidated Company. |
| (vi) | Relates to production costs associated with gold sold by non-operating minesites that are excluded from the consolidated cash costs calculation. |
44
Year Ended December 31, 2024
(United States dollars in thousands, except per ounce measures or as otherwise noted)
| | | | | | | | | | | | | | | | | | | | | | | | Total cash |
| | | | | | | | | | | | | | Smelting, | | Total cash | | | | Total cash | | | | costs per |
| | Payable | | | | | | | | Realized | | | | refining | | costs per | | | | costs per | | | | ounce |
| | gold | | | | Production | | | | (gains) and | | In-kind | | and | | ounce (co- | | Impact of | | ounce (by- | | | | (revised) |
| | production | | Production | | costs per | | Inventory | | losses on | | royalty | | marketing | | product | | by-product | | product | | NTI | | (by-product |
Mine | | (ounces) | | costs | | ounce | | adjustments(i) | | hedges | | costs(ii) | | charges | | basis) | | metals | | basis) | | Payment(iii) | | basis)(iv) |
LaRonde | | 306,750 | | 319,495 | | 1,042 | | 10,280 | | 1,840 | | — | | 15,552 | | 1,132 | | (57,287) | | 945 | | — | | 945 |
Canadian Malartic | | 655,654 | | 532,037 | | 811 | | 3,803 | | 4,138 | | 77,504 | | 726 | | 943 | | (8,386) | | 930 | | — | | 930 |
Goldex | | 130,813 | | 129,977 | | 994 | | 2,438 | | 816 | | — | | 3,009 | | 1,041 | | (15,452) | | 923 | | — | | 923 |
Quebec | | 1,093,217 | | 981,509 | | 898 | | 16,521 | | 6,794 | | 77,504 | | 19,287 | | 1,008 | | (81,125) | | 933 | | — | | 933 |
Detour Lake | | 671,950 | | 497,079 | | 740 | | (1,348) | | 4,714 | | 32,072 | | 5,716 | | 801 | | (3,049) | | 796 | | — | | 796 |
Macassa |
| 279,384 |
| 201,371 |
| 721 |
| (3,607) |
| 1,679 |
| 10,082 |
| 482 |
| 752 |
| (1,020) |
| 748 |
| — |
| 748 |
Ontario |
| 951,334 |
| 698,450 |
| 734 |
| (4,955) |
| 6,393 |
| 42,154 |
| 6,198 |
| 787 |
| (4,069) |
| 782 |
| — |
| 782 |
Meliadine |
| 378,886 |
| 350,280 |
| 924 |
| 3,279 |
| 3,165 |
| — |
| 250 |
| 942 |
| (860) |
| 940 |
| — |
| 940 |
Meadowbank |
| 504,719 |
| 463,464 |
| 918 |
| 9,464 |
| 4,624 |
| — |
| (41) |
| 946 |
| (4,138) |
| 938 |
| (21,435) |
| 896 |
Nunavut |
| 883,605 |
| 813,744 |
| 921 |
| 12,743 |
| 7,789 |
| — |
| 209 |
| 944 |
| (4,998) |
| 938 |
| (21,435) |
| 914 |
Fosterville |
| 225,203 |
| 147,045 |
| 653 |
| (1,011) |
| 222 |
| — |
| 70 |
| 650 |
| (565) |
| 647 |
| — |
| 647 |
Australia |
| 225,203 |
| 147,045 |
| 653 |
| (1,011) |
| 222 |
| — |
| 70 |
| 650 |
| (565) |
| 647 |
| — |
| 647 |
Kittila |
| 218,860 |
| 227,334 |
| 1,039 |
| (1,172) |
| 151 |
| — |
| (212) |
| 1,033 |
| (483) |
| 1,031 |
| — |
| 1,031 |
Finland |
| 218,860 |
| 227,334 |
| 1,039 |
| (1,172) |
| 151 |
| — |
| (212) |
| 1,033 |
| (483) |
| 1,031 |
| — |
| 1,031 |
Pinos Altos |
| 88,433 |
| 168,231 |
| 1,902 |
| 678 |
| 68 |
| — |
| 1,287 |
| 1,925 |
| (34,924) |
| 1,530 |
| — |
| 1,530 |
Creston Mascota |
| 104 |
| — |
| — |
| — |
| — |
| — |
| — |
| — |
| — |
| — |
| — |
| — |
La India |
| 24,580 |
| 49,767 |
| 2,025 |
| (1,322) |
| — |
| — |
| 401 |
| 1,987 |
| (1,038) |
| 1,945 |
| — |
| 1,945 |
Mexico |
| 113,117 |
| 217,998 |
| 1,927 |
| (644) |
| 68 |
| — |
| 1,688 |
| 1,937 |
| (35,962) |
| 1,619 |
| — |
| 1,619 |
Consolidated |
| 3,485,336 |
| 3,086,080 |
| 885 |
| 21,482 |
| 21,417 |
| 119,658 |
| 27,240 |
| 940 |
| (127,202) |
| 903 |
| (21,435) |
| 897 |
Notes:
| (i) | Under the Company’s revenue recognition policy, revenue from contracts with customers is recognized upon the transfer of control over metals sold to the customer. As the total cash costs per ounce are calculated on a production basis, an inventory adjustment is made to reflect the portion of production not yet recognized as revenue. Included in inventory adjustments for Canadian Malartic for the year ended December 31, 2024 is $5.8 million associated with the fair value allocated to inventory on Canadian Malartic as part of the purchase price allocation from the acquisition, on March 31, 2023, of the 50% of Canadian Malartic that Agnico Eagle did not then hold. |
| (ii) | In-kind royalty adjustments in respect of Canadian Malartic, Detour Lake and Macassa relate to the in-kind royalties of 5.0%, 2.0% and 1.5%, respectively, paid in respect of gold production at such mines, which are excluded from production costs under IFRS Accounting Standards and added back in the calculation of total cash costs per ounce. |
| (iii) | For periods commencing on or after January 1, 2026, the Company has adjusted the composition of “total cash costs per ounce” to adjust for the NTI Payment. NTI Payments are incurred solely at Meadowbank and are included in production costs under IFRS Accounting Standards and subtracted from production costs in the calculation of total cash costs per ounce. See discussion above under “Total Cash Costs per Ounce”. |
| (iv) | For each of the Company’s mines other than Meadowbank and its regions other than Nunavut, “total cash costs per ounce” and “total cash costs per ounce (revised)” are the same when calculated on both a by-product and co-product basis. For the year ended December 31, 2024, total cash costs per ounce (revised) on a co-product basis were $904 at Meadowbank, $920 for the Nunavut region and $934 for the consolidated Company. |
45
Year Ended December 31, 2023
(United States dollars in thousands, except per ounce measures or as otherwise noted)
| | | | | | | | | | | | | | | | | | | | | | | | Total cash |
| | | | | | | | | | | | | | Smelting, | | Total cash | | | | Total cash | | | | costs per |
| | Payable | | | | | | | | Realized | | | | refining | | costs per | | | | costs per | | | | ounce |
| | gold | | | | Production | | | | (gains) and | | In-kind | | and | | ounce (co- | | Impact of | | ounce (by- | | | | (revised) |
| | production | | Production | | costs per | | Inventory | | losses on | | royalty | | marketing | | product | | by-product | | product | | NTI | | (by-product |
Mine | | (ounces) | | costs | | ounce | | adjustments(i) | | hedges | | costs(ii) | | charges | | basis) | | metals | | basis) | | Payment(iii) | | basis)(iv) |
LaRonde | | 306,648 | | 299,644 | | 977 | | 9,954 | | 3,954 | | — | | 20,183 | | 1,088 | | (54,405) | | 911 | | — | | 911 |
Canadian Malartic(v) | | 603,955 | | 465,814 | | 771 | | (21,709) | | — | | 59,187 | | 962 | | 835 | | (6,732) | | 824 | | — | | 824 |
Goldex | | 140,983 | | 112,022 | | 795 | | 1,650 | | 1,944 | | — | | 336 | | 822 | | (378) | | 820 | | — | | 820 |
Quebec | | 1,051,586 | | 877,480 | | 834 | | (10,105) | | 5,898 | | 59,187 | | 21,481 | | 907 | | (61,515) | | 849 | | — | | 849 |
Detour Lake | | 677,446 | | 453,498 | | 669 | | 8,232 | | 4,867 | | 29,143 | | 4,006 | | 738 | | (2,073) | | 735 | | — | | 735 |
Macassa |
| 228,535 |
| 155,046 |
| 678 |
| 1,382 |
| 3,127 |
| 7,796 |
| 245 |
| 733 |
| (649) |
| 731 |
| — |
| 731 |
Ontario |
| 905,981 |
| 608,544 |
| 672 |
| 9,614 |
| 7,994 |
| 36,939 |
| 4,251 |
| 737 |
| (2,722) |
| 734 |
| — |
| 734 |
Meliadine |
| 364,141 |
| 343,650 |
| 944 |
| 11,898 |
| 1,682 |
| — |
| 128 |
| 981 |
| (630) |
| 980 |
| — |
| 980 |
Meadowbank |
| 431,666 |
| 524,008 |
| 1,214 |
| (12,021) |
| (1,205) |
| — |
| (19) |
| 1,183 |
| (2,958) |
| 1,176 |
| (16,389) |
| 1,138 |
Nunavut |
| 795,807 |
| 867,658 |
| 1,090 |
| (123) |
| 477 |
| — |
| 109 |
| 1,091 |
| (3,588) |
| 1,086 |
| (16,389) |
| 1,065 |
Fosterville |
| 277,694 |
| 131,298 |
| 473 |
| 1,345 |
| 3,097 |
| — |
| 52 |
| 489 |
| (397) |
| 488 |
| — |
| 488 |
Australia |
| 277,694 |
| 131,298 |
| 473 |
| 1,345 |
| 3,097 |
| — |
| 52 |
| 489 |
| (397) |
| 488 |
| — |
| 488 |
Kittila |
| 234,402 |
| 205,857 |
| 878 |
| 2,958 |
| (2,999) |
| — |
| (1,338) |
| 872 |
| (358) |
| 871 |
| — |
| 871 |
Finland |
| 234,402 |
| 205,857 |
| 878 |
| 2,958 |
| (2,999) |
| — |
| (1,338) |
| 872 |
| (358) |
| 871 |
| — |
| 871 |
Pinos Altos |
| 97,642 |
| 145,936 |
| 1,495 |
| 2,979 |
| (2,819) |
| — |
| 1,248 |
| 1,509 |
| (27,339) |
| 1,229 |
| — |
| 1,229 |
Creston Mascota |
| 638 |
| — |
| — |
| — |
| — |
| — |
| — |
| — |
| — |
| — |
| — |
| — |
La India |
| 75,904 |
| 96,490 |
| 1,271 |
| (1,335) |
| — |
| — |
| 584 |
| 1,261 |
| (1,566) |
| 1,241 |
| — |
| 1,241 |
Mexico |
| 174,184 |
| 242,426 |
| 1,392 |
| 1,644 |
| (2,819) |
| — |
| 1,832 |
| 1,396 |
| (28,905) |
| 1,230 |
| — |
| 1,230 |
Consolidated |
| 3,439,654 |
| 2,933,263 |
| 853 |
| 5,333 |
| 11,648 |
| 96,126 |
| 26,387 |
| 893 |
| (97,485) |
| 865 |
| (16,389) |
| 860 |
Notes:
| (i) | Under the Company’s revenue recognition policy, revenue from contracts with customers is recognized upon the transfer of control over metals sold to the customer. As the total cash costs per ounce are calculated on a production basis, an inventory adjustment is made to reflect the portion of production not yet recognized as revenue. Included in inventory adjustments for Canadian Malartic for the year ended December 31, 2023 is $26.4 million associated with the fair value allocated to inventory on Canadian Malartic as part of the purchase price allocation from the acquisition, on March 31, 2023, of the 50% of Canadian Malartic that Agnico Eagle did not then hold. |
| (ii) | In-kind royalty adjustments in respect of Canadian Malartic, Detour Lake and Macassa relate to the in-kind royalties of 5.0%, 2.0% and 1.5%, respectively, paid in respect of gold production at such mines, which are excluded from production costs under IFRS Accounting Standards and added back in the calculation of total cash costs per ounce. |
| (iii) | For periods commencing on or after January 1, 2026, the Company has adjusted the composition of “total cash costs per ounce” to adjust for the NTI Payment. NTI Payments are incurred solely at Meadowbank and are included in production costs under IFRS Accounting Standards and subtracted from production costs in the calculation of total cash costs per ounce. See discussion above under “Total Cash Costs per Ounce”. |
| (iv) | For each of the Company’s mines other than Meadowbank and its regions other than Nunavut, “total cash costs per ounce” and “total cash costs per ounce (revised)” are the same when calculated on both a by-product and co-product basis. For the year ended December 31, 2023, total cash costs per ounce (revised) on a co-product basis were $1,145 at Meadowbank, $1,070 for the Nunavut region and $888 for the consolidated Company. |
| (v) | The information set out in this table reflects the Company’s 50% interest in Canadian Malartic up to and including March 30, 2023 and 100% interest thereafter following the closing of the Yamana Transaction. |
46
Reconciliation of Production Costs to Minesite Costs per Tonne by Mine and Region
Year Ended December 31, 2025
(thousands, except per tonne measures or as otherwise noted)
| | | | | | | | | | | | | | | | | | Smelting, | | Minesite | | | | | | | ||
| | | | | | | | | Production | | Inventory | | In-kind | | refining and | | costs per | | | | | Minesite costs | ||||||
| | Tonnes of | | | | Production | | costs per | | adjustments | | royalty | | marketing | | tonne | | NTI | | per tonne | ||||||||
| | ore milled | | Production | | costs (local | | tonne (local | | (local | | costs (local | | charges (local | | (local | | Payment (local | | (revised) (local | ||||||||
Mine | | (thousands) | | costs ($) | | currency) | | currency) | | currency)(i) | | currency)(ii) | | currency) | | currency) | | currency)(iii) | | currency)(iv) | ||||||||
LaRonde |
| 2,805 |
| 360,025 |
| C$ | 502,885 |
| C$ | 179 |
| C$ | (8,668) | | C$ | — |
| C$ | (28,060) |
| C$ | 166 | | C$ | — |
| C$ | 166 |
Canadian Malartic |
| 20,123 |
| 488,160 |
| C$ | 677,283 |
| C$ | 34 |
| C$ | 26,400 | | C$ | 156,954 | | C$ | — |
| C$ | 43 | | C$ | — |
| C$ | 43 |
Goldex |
| 3,301 |
| 148,952 |
| C$ | 207,895 |
| C$ | 63 |
| C$ | 3,062 | | C$ | — | | C$ | — |
| C$ | 64 | | C$ | — |
| C$ | 64 |
Quebec |
| 26,229 |
| 997,137 |
| C$ | 1,388,063 |
| C$ | 53 |
| C$ | 20,794 | | C$ | 156,954 | | C$ | (28,060) |
| C$ | 59 | | C$ | — |
| C$ | 59 |
Detour Lake |
| 27,869 |
| 565,439 |
| C$ | 788,172 |
| C$ | 28 |
| C$ | (3,108) | | C$ | 62,362 | | C$ | — |
| C$ | 30 | | C$ | — |
| C$ | 30 |
Macassa |
| 573 |
| 221,718 |
| C$ | 309,381 |
| C$ | 540 |
| C$ | 15,225 | | C$ | 21,718 | | C$ | — |
| C$ | 604 | | C$ | — |
| C$ | 604 |
Ontario |
| 28,442 |
| 787,157 |
| C$ | 1,097,553 |
| C$ | 39 |
| C$ | 12,117 | | C$ | 84,080 | | C$ | — |
| C$ | 42 | | C$ | — |
| C$ | 42 |
Meliadine |
| 2,351 |
| 402,385 |
| C$ | 560,026 |
| C$ | 238 |
| C$ | (2,275) | | C$ | — | | C$ | — |
| C$ | 237 | | C$ | — |
| C$ | 237 |
Meadowbank |
| 3,941 |
| 552,470 |
| C$ | 768,109 |
| C$ | 195 |
| C$ | (1,616) | | C$ | — | | C$ | — |
| C$ | 194 | | C$ | (125,132) |
| C$ | 162 |
Nunavut |
| 6,292 |
| 954,855 |
| C$ | 1,328,135 |
| C$ | 211 |
| C$ | (3,891) | | C$ | — | | C$ | — |
| C$ | 210 | | C$ | (125,132) |
| C$ | 190 |
Fosterville |
| 726 |
| 146,382 |
| A$ | 225,362 |
| A$ | 310 |
| A$ | 6,729 | | A$ | — | | A$ | — |
| A$ | 320 | | A$ | — |
| A$ | 320 |
Australia |
| 726 |
| 146,382 |
| A$ | 225,362 |
| A$ | 310 |
| A$ | 6,729 | | A$ | — | | A$ | — |
| A$ | 320 | | A$ | — |
| A$ | 320 |
Kittila |
| 2,105 |
| 236,238 | | € | 209,121 | | € | 99 | | € | 867 | | € | — | | € | — | | € | 100 | | € | — | | € | 100 |
Finland |
| 2,105 |
| 236,238 | | € | 209,121 | | € | 99 | | € | 867 | | € | — | | € | — | | € | 100 | | € | — | | € | 100 |
Pinos Altos |
| 1,720 |
| 205,808 | | $ | 205,808 | | $ | 120 | | $ | 4,824 | | $ | — | | $ | — | | $ | 122 | | $ | — | | $ | 122 |
Mexico |
| 1,720 |
| 205,808 | | $ | 205,808 | | $ | 120 | | $ | 4,824 | | $ | — | | $ | — | | $ | 122 | | $ | — | | $ | 122 |
Notes:
| (i) | This inventory adjustment reflects production costs associated with the portion of production still in inventory. Included in inventory adjustments for Canadian Malartic for the year ended December 31, 2025 is C$12.9 million associated with the fair value allocated to inventory on Canadian Malartic as part of the purchase price allocation from the acquisition, on March 31, 2023, of the 50% of Canadian Malartic that Agnico Eagle did not then hold. |
| (ii) | In-kind royalty adjustments in respect of Canadian Malartic, Detour Lake and Macassa relate to the in-kind royalties of 5.0%, 2.0% and 1.5%, respectively, paid in respect of gold production at such mines, which are excluded from production costs under IFRS Accounting Standards and added back in the calculation of minesite costs per tonne. |
| (iii) | For periods commencing on or after January 1, 2026, the Company has adjusted the composition of “minesite costs per tonne” to adjust for the NTI Payment. NTI Payments are incurred solely at Meadowbank and are included in production costs under IFRS Accounting Standards and subtracted from production costs in the calculation of minesite costs per tonne. See discussion above under “Minesite Cost per Tonne”. |
| (iv) | For each of the Company’s mines other than Meadowbank and its regions other than Nunavut, “minesite costs per tonne” and “minesite costs per tonne (revised)” are the same. See discussion above under “Minesite Costs per Tonne”. |
47
Year Ended December 31, 2024
(thousands, except per tonne measures or as otherwise noted)
| | | | | | | | | | | | | | | Smelting, | | Minesite | | | | | | ||||||
| | | | | | | | | Production | | Inventory | | In-kind | | refining and | | costs per | | | | Minesite costs | |||||||
| | Tonnes of | | | | Production | | costs per | | adjustments | | royalty | | marketing | | tonne | | NTI | | per tonne | ||||||||
| | ore milled | | Production | | costs (local | | tonne (local | | (local | | costs (local | | charges (local | | (local | | Payment (local | | (revised) (local | ||||||||
Mine | | (thousands) | | costs ($) | | currency) | | currency) | | currency)(i) | | currency)(ii) | | currency) | | currency) | | currency)(iii) | | currency)(iv) | ||||||||
LaRonde |
| 2,849 |
| 319,495 |
| C$ | 436,230 |
| C$ | 153 |
| C$ | 15,934 | | C$ | — |
| C$ | (12,150) |
| C$ | 154 | | C$ | — |
| C$ | 154 |
Canadian Malartic |
| 20,317 |
| 532,037 |
| C$ | 726,836 |
| C$ | 36 |
| C$ | 6,048 | | C$ | 106,163 | | C$ | — |
| C$ | 41 | | C$ | — |
| C$ | 41 |
Goldex |
| 3,076 |
| 129,977 |
| C$ | 177,816 |
| C$ | 58 |
| C$ | 3,702 | | C$ | — | | C$ | — |
| C$ | 59 | | C$ | — |
| C$ | 59 |
Quebec |
| 26,242 |
| 981,509 |
| C$ | 1,340,882 |
| C$ | 51 |
| C$ | 25,684 | | C$ | 106,163 | | C$ | (12,150) |
| C$ | 56 | | C$ | — |
| C$ | 56 |
Detour Lake |
| 27,462 |
| 497,079 |
| C$ | 678,877 |
| C$ | 25 |
| C$ | (458) | | C$ | 44,125 | | C$ | — |
| C$ | 26 | | C$ | — |
| C$ | 26 |
Macassa |
| 574 |
| 201,371 |
| C$ | 276,532 |
| C$ | 482 |
| C$ | (4,605) | | C$ | 13,896 | | C$ | — |
| C$ | 498 | | C$ | — |
| C$ | 498 |
Ontario |
| 28,036 |
| 698,450 |
| C$ | 955,409 |
| C$ | 34 |
| C$ | (5,063) | | C$ | 58,021 | | C$ | — |
| C$ | 36 | | C$ | — |
| C$ | 36 |
Meliadine |
| 1,966 |
| 350,280 |
| C$ | 478,335 |
| C$ | 243 |
| C$ | 6,578 | | C$ | — | | C$ | — |
| C$ | 247 | | C$ | — |
| C$ | 247 |
Meadowbank |
| 4,143 |
| 463,464 |
| C$ | 632,661 |
| C$ | 153 |
| C$ | 14,234 | | C$ | — | | C$ | — |
| C$ | 156 | | C$ | (29,261) |
| C$ | 149 |
Nunavut |
| 6,109 |
| 813,744 |
| C$ | 1,110,996 |
| C$ | 182 |
| C$ | 20,812 | | C$ | — | | C$ | — |
| C$ | 185 | | C$ | (29,261) |
| C$ | 180 |
Fosterville |
| 810 |
| 147,045 |
| A$ | 224,121 |
| A$ | 277 |
| A$ | (1,253) | | A$ | — | | A$ | — |
| A$ | 276 | | A$ | — |
| A$ | 276 |
Australia |
| 810 |
| 147,045 |
| A$ | 224,121 |
| A$ | 277 |
| A$ | (1,253) | | A$ | — | | A$ | — |
| A$ | 276 | | A$ | — |
| A$ | 276 |
Kittila |
| 2,026 |
| 227,334 | | € | 210,285 | | € | 103 | | € | (633) | | € | — | | € | — | | € | 103 | | € | — | | € | 103 |
Finland |
| 2,026 |
| 227,334 | | € | 210,285 | | € | 103 | | € | (633) | | € | — | | € | — | | € | 103 | | € | — | | € | 103 |
Pinos Altos |
| 1,707 |
| 168,231 | | $ | 168,231 | | $ | 99 | | $ | 746 | | $ | — | | $ | — | | $ | 99 | | $ | — | | $ | 99 |
La India(v) |
| — |
| 49,767 | | $ | 49,767 | | $ | — | | $ | (49,767) | | $ | — | | $ | — | | $ | — | | $ | — | | $ | — |
Mexico |
| 1,707 |
| 217,998 | | $ | 217,998 | | $ | 128 | | $ | (49,021) | | $ | — | | $ | — | | $ | 99 | | $ | — | | $ | 99 |
Notes:
| (i) | This inventory adjustment reflects production costs associated with the portion of production still in inventory. Included in inventory adjustments for Canadian Malartic for the year ended December 31, 2024 is C$8.1 million associated with the fair value allocated to inventory on Canadian Malartic as part of the purchase price allocation from the acquisition, on March 31, 2023, of the 50% of Canadian Malartic that Agnico Eagle did not then hold. |
| (ii) | In-kind royalty adjustments in respect of Canadian Malartic, Detour Lake and Macassa relate to the in-kind royalties of 5.0%, 2.0% and 1.5%, respectively, paid in respect of gold production at such mines, which are excluded from production costs under IFRS Accounting Standards and added back in the calculation of minesite costs per tonne. |
| (iii) | For periods commencing on or after January 1, 2026, the Company has adjusted the composition of “minesite costs per tonne” to adjust for the NTI Payment. NTI Payments are incurred solely at Meadowbank and are included in production costs under IFRS Accounting Standards and subtracted from production costs in the calculation of minesite costs per tonne. See discussion above under “Minesite Cost per Tonne”. |
| (iv) | For each of the Company’s mines other than Meadowbank and its regions other than Nunavut, “minesite costs per tonne” and “minesite costs per tonne (revised)” are the same. See discussion above under “Minesite Costs per Tonne”. |
| (v) | La India’s cost calculations per tonne for the year ended December 31, 2024 exclude approximately $49.8 million of production costs incurred during the period, following the cessation of mining activities at La India during the fourth quarter of 2023. |
48
Year Ended December 31, 2023
(thousands, except per tonne measures or as otherwise noted)
| | | | | | | | | | | | | | | | | | Smelting, | | Minesite | | | | | | | ||
| | | | | | | | | Production | | Inventory | | In-kind | | refining and | | costs per | | | | | Minesite costs | ||||||
| | Tonnes of | | | | Production | | costs per | | adjustments | | royalty | | marketing | | tonne | | NTI | | per tonne | ||||||||
| | ore milled | | Production | | costs (local | | tonne (local | | (local | | costs (local | | charges (local | | (local | | Payment (local | | (revised) (local | ||||||||
Mine | | (thousands) | | costs ($) | | currency) | | currency) | | currency)(i) | | currency)(ii) | | currency) | | currency) | | currency)(iii) | | currency)(iv) | ||||||||
LaRonde | | 2,658 | | 299,644 | | C$ | 403,618 | | C$ | 152 | | C$ | 15,784 | | C$ | — | | C$ | (12,990) | | C$ | 153 | | C$ | — | | C$ | 153 |
Canadian Malartic(v) | | 17,333 | | 465,814 | | C$ | 627,946 | | C$ | 36 | | C$ | (27,636) | | C$ | 79,962 | | C$ | — | | C$ | 39 | | C$ | — | | C$ | 39 |
Goldex | | 2,887 | | 112,022 | | C$ | 151,185 | | C$ | 52 | | C$ | 2,189 | | C$ | — | | C$ | — | | C$ | 53 | | C$ | — | | C$ | 53 |
Quebec | | 22,878 | | 877,480 | | C$ | 1,182,749 | | C$ | 52 | | C$ | (9,663) | | C$ | 79,962 | | C$ | (12,990) | | C$ | 55 | | C$ | — | | C$ | 55 |
Detour Lake | | 25,435 | | 453,498 | | C$ | 611,244 | | C$ | 24 | | C$ | 11,038 | | C$ | 39,323 | | C$ | — | | C$ | 26 | | C$ | — | | C$ | 26 |
Macassa |
| 442 |
| 155,046 |
| C$ | 209,928 |
| C$ | 475 |
| C$ | 1,836 |
| C$ | 10,517 | | C$ | — |
| C$ | 503 | | C$ | — |
| C$ | 503 |
Ontario |
| 25,877 |
| 608,544 |
| C$ | 821,172 |
| C$ | 32 |
| C$ | 12,874 |
| C$ | 49,840 | | C$ | — |
| C$ | 34 | | C$ | — |
| C$ | 34 |
Meliadine |
| 1,918 |
| 343,650 |
| C$ | 462,052 |
| C$ | 241 |
| C$ | 16,188 | | C$ | — | | C$ | — |
| C$ | 249 | | C$ | — |
| C$ | 249 |
Meadowbank |
| 3,843 |
| 524,008 |
| C$ | 702,879 |
| C$ | 183 |
| C$ | (15,934) | | C$ | — | | C$ | — |
| C$ | 179 | | C$ | (21,984) |
| C$ | 173 |
Nunavut |
| 5,761 |
| 867,658 |
| C$ | 1,164,931 |
| C$ | 202 |
| C$ | 254 | | C$ | — | | C$ | — |
| C$ | 202 | | C$ | (21,984) |
| C$ | 198 |
Fosterville |
| 651 |
| 131,298 |
| A$ | 197,921 |
| A$ | 304 |
| A$ | (2,155) | | A$ | — | | A$ | — |
| A$ | 301 | | A$ | — |
| A$ | 301 |
Australia |
| 651 |
| 131,298 |
| A$ | 197,921 |
| A$ | 304 |
| A$ | (2,155) | | A$ | — | | A$ | — |
| A$ | 301 | | A$ | — |
| A$ | 301 |
Kittila |
| 1,954 |
| 205,857 | | € | 191,023 | | € | 98 | | € | 2,112 | | € | — | | € | — | | € | 99 | | € | — | | € | 99 |
Finland |
| 1,954 |
| 205,857 | | € | 191,023 | | € | 98 | | € | 2,112 | | € | — | | € | — | | € | 99 | | € | — | | € | 99 |
Pinos Altos |
| 1,656 |
| 145,936 | | $ | 145,936 | | $ | 88 | | $ | 160 | | $ | — | | $ | — | | $ | 88 | | $ | — | | $ | 88 |
La India |
| 3,010 |
| 96,490 | | $ | 96,490 | | $ | 32 | | $ | (1,335) | | $ | — | | $ | — | | $ | 32 | | $ | — | | $ | 32 |
Mexico |
| 4,666 |
| 242,426 | | $ | 242,426 | | $ | 52 | | $ | (1,175) | | $ | — | | $ | — | | $ | 52 | | $ | — | | $ | 52 |
Notes:
| (i) | This inventory adjustment reflects production costs associated with the portion of production still in inventory. Included in inventory adjustments for Canadian Malartic for the year ended December 31, 2023 is C$34.6 million associated with the fair value allocated to inventory on Canadian Malartic as part of the purchase price allocation from the acquisition, on March 31, 2023, of the 50% of Canadian Malartic that Agnico Eagle did not then hold. |
| (ii) | In-kind royalty adjustments in respect of Canadian Malartic, Detour Lake and Macassa relate to the in-kind royalties of 5.0%, 2.0% and 1.5%, respectively, paid in respect of gold production at such mines, which are excluded from production costs under IFRS Accounting Standards and added back in the calculation of minesite costs per tonne. |
| (iii) | For periods commencing on or after January 1, 2026, the Company has adjusted the composition of “minesite costs per tonne” to adjust for the NTI Payment. NTI Payments are incurred solely at Meadowbank and are included in production costs under IFRS Accounting Standards and subtracted from production costs in the calculation of minesite costs per tonne. See discussion above under “Minesite Costs per Tonne”. |
| (iv) | For each of the Company’s mines other than Meadowbank and its regions other than Nunavut, “minesite costs per tonne” and “minesite costs per tonne (revised)” are the same. See discussion above under “Minesite Costs per Tonne”. |
| (v) | The information set out in this table reflects the Company’s 50% interest in Canadian Malartic up to and including March 30, 2023 and 100% interest thereafter following the closing of the Yamana Transaction. |
49
All-in Sustaining Costs per Ounce
All-in sustaining costs per ounce (also referred to as “AISC per ounce”) on a by-product basis is calculated as the aggregate of (i) total cash costs on a by-product basis, (ii) sustaining capital expenditures (including capitalized exploration), (iii) general and administrative expenses (including stock option expense), (iv) lease payments related to sustaining assets and (v) reclamation expenses, each as measured on a per ounce of production basis. These additional costs reflect the additional expenditures that are required to be made to maintain current production levels. AISC per ounce on a co-product basis is calculated in the same manner as AISC per ounce on a by-product basis, except that the total cash costs on a co-product basis are used, meaning the impact of by-product metals is not deducted. Investors should note that AISC per ounce is not reflective of all cash expenditures as it does not include income tax payments, interest costs or dividend payments, nor does it include non-cash expenditures, such as depreciation and amortization. In this MD&A, unless otherwise indicated, all-in sustaining costs per ounce is reported on a by-product basis (see “Total cash costs per ounce and Minesite Costs per Tonne – Total cash costs per ounce” for a discussion of regarding the Company’s use of by-product basis reporting). For periods commencing on or after January 1, 2026, the Company revised the composition of certain of its non-GAAP performance measures, including “all-in sustaining costs per ounce”, to adjust for the NTI Payments, that is, payments made to NTI under the Company’s mineral production leases in respect of the Amaruq mine at Meadowbank. This revised composition aligns with changes made to the calculation of “total cash costs per ounce”, discussed above in “Total Cash Costs Per Ounce and Minesite Costs Per Tonne – Total Cash Costs per Ounce”. For the reasons outlined above in respect of the change to the composition of “total cash costs per ounce”, the Company believes that this revision to the composition of AISC per ounce is helpful to both management and investors as it better reflects the cost performance at the Amaruq mine at Meadowbank and conforms the calculations of costs used across all of the Company’s mines. Where this new composition is used, this MD&A will indicate by referring to the non-GAAP measure as “all-in sustaining costs per ounce (revised)”.
Management believes that AISC per ounce is helpful to investors as it reflects total sustaining expenditures of producing and selling an ounce of gold while maintaining current operations and, as such, provides helpful information about operating performance. Management is aware, and investors should note, that these per ounce measures of performance can be affected by fluctuations in foreign exchange rates and, in the case of AISC per ounce on a by-product basis, by-product metal prices. Management compensates for these inherent limitations by using, and investors should also consider using, these measures in conjunction with data prepared in accordance with IFRS Accounting Standards and minesite costs per tonne, as AISC per ounce is not necessarily indicative of operating costs or cash flow measures prepared in accordance with IFRS Accounting Standards.
The Company’s revised composition of AISC per ounce remains consistent with the guidance on AISC per ounce released by the World Gold Council (“WGC”) in 2018, except in respect of its treatment of the NTI Payment at Meadowbank. As discussed above, the Company views the NTI Payments as having similar characteristics to the Crown royalty, which is treated as an income tax under IFRS Accounting Standards and therefore excluded from the Company’s AISC calculations. The WGC is a non-regulatory market development organization for the gold industry that has worked closely with its member companies to develop guidance in respect of relevant non-GAAP measures. Notwithstanding the Company’s adoption of the WGC’s guidance, AISC per ounce reported by the Company may not be comparable to data reported by other gold mining companies.
50
The following tables set out a reconciliation of production costs to all-in sustaining costs per ounce of gold produced for the years ended December 31, 2025, December 31, 2024 and December 31, 2023 on both a by-product basis (deducting the impact of by-product metals from production costs) and co-product basis (deducting the impact of by-product metals from production costs).
Reconciliation of Production Costs to All-in Sustaining Costs per Ounce
| | Year Ended | | Year Ended | | Year Ended | |||
| | December 31, | | December 31, | | December 31, | |||
(United States dollars per ounce of gold produced, except where noted) | | 2025 | | 2024 | | 2023 | |||
Production costs per the consolidated statements of income(thousands of United States dollars) | | $ | 3,340,684 | | $ | 3,086,080 | | $ | 2,933,263 |
Less: Production costs from non-operating minesites (thousands) | |
| (13,107) | |
| — | |
| — |
Adjusted production costs (thousands) | |
| 3,327,577 | |
| 3,086,080 | |
| 2,933,263 |
Gold production (ounces)(i) | |
| 3,447,367 | |
| 3,485,336 | |
| 3,439,654 |
Production costs per ounce of gold production | | $ | 965 | | $ | 885 | | $ | 853 |
Adjustments: | |
| | |
| | |
| |
Inventory adjustments(ii) | |
| 11 | |
| 7 | |
| 1 |
In-kind royalty(iii) | |
| 50 | |
| 34 | |
| 28 |
Realized gains and losses on hedges of production costs | |
| 1 | |
| 6 | |
| 3 |
Smelting, refining, and marketing charges | |
| 8 | |
| 8 | |
| 8 |
Total cash costs per ounce (co-product basis) | | $ | 1,035 | | $ | 940 | | $ | 893 |
Impact of by-product metals | |
| (56) | |
| (37) | |
| (28) |
Total cash costs per ounce (by-product basis) | | $ | 979 | | $ | 903 | | $ | 865 |
Adjustments: | |
| | |
| | |
| |
Sustaining capital expenditures (including capitalized exploration) | |
| 274 | |
| 258 | |
| 235 |
General and administrative expenses (including stock option expense) | |
| 68 | |
| 60 | |
| 61 |
Non-cash reclamation provision and sustaining leases(iv) | |
| 18 | |
| 18 | |
| 18 |
All-in sustaining costs per ounce (by-product basis) | | $ | 1,339 | | $ | 1,239 | | $ | 1,179 |
Impact of by-product metals | |
| 56 | |
| 37 | |
| 28 |
All-in sustaining costs per ounce (co-product basis) | | $ | 1,395 | | $ | 1,276 | | $ | 1,207 |
NTI Payment(v) | |
| (26) | |
| (6) | |
| (5) |
All-in sustaining costs per ounce (revised) (by-product basis)(v) | |
| 1,313 | |
| 1,233 | |
| 1,174 |
All-in sustaining costs per ounce (revised) (co-product basis)(v) | | $ | 1,369 | | $ | 1,270 | | $ | 1,202 |
Notes:
| (i) | Gold production for the year ended December 31, 2025 excludes 4,539 ounces of payable production of gold at La India and 323 ounces of payable production of gold at Creston Mascota, which were produced from residual leaching as well as 9,468 ounces of gold recovered at Hope Bay. |
| (ii) | Under the Company’s revenue recognition policy, revenue from contracts with customers is recognized upon the transfer of control over metals sold to the customer. As the total cash costs per ounce are calculated on a production basis, an inventory adjustment is made to reflect the portion of production not yet recognized as revenue. Included in inventory adjustments for Canadian Malartic for the years ended December 31, 2025, December 31, 2024, and December 31, 2023 are $9.2 million, $5.8 million, and $26.4 million, respectively, in association with the fair value allocated to inventory on Canadian Malartic as part of the purchase price allocation from the acquisition, on March 31, 2023, of 50% of Canadian Malartic that Agnico Eagle did not then hold. |
| (iii) | In-kind royalty adjustments in respect of Canadian Malartic, Detour Lake and Macassa relate to the in-kind royalty of 5.0%, 2.0% and 1.5%, respectively, paid in respect of gold production ounces of payable production of gold at such mines, which are excluded from production costs under IFRS Accounting Standards and added back in the calculation of all-in sustaining costs per ounce. |
| (iv) | Sustaining leases are lease payments related to sustaining assets. |
| (v) | For periods commencing on or after January 1, 2026, the Company has adjusted the composition of “all-in sustaining costs per ounce” on both a by-product and co-product basis to adjust for the NTI Payment. NTI Payments are incurred solely at Meadowbank and are included in production costs under IFRS Accounting Standards and subtracted from production costs in the calculation of all-in sustaining costs per ounce. See discussion above under “All-in Sustaining Costs per Ounce”. |
Operating Margin
Operating margin is calculated by deducting production costs from revenue from mining operations. In order to reconcile operating margin to net income as recorded in the consolidated financial statements, the Company adds the following items to the operating margin: income and mining taxes expense; other expenses (income); care and maintenance expenses; foreign currency translation (gain) loss; environmental remediation costs; gain (loss) on derivative financial instruments; finance costs; general and administrative
51
expenses; amortization of property, plant and mine development; exploration and corporate development expenses; revaluation gain and impairment losses (reversals). The Company believes that operating margin is a useful measure to investors as it reflects the operating performance of its individual mines associated with the ongoing production and sale of gold and by-product metals without allocating Company-wide overhead, such as exploration and corporate development expenses, amortization of property, plant and mine development, general and administrative expenses, finance costs, gain and losses on derivative financial instruments, environmental remediation costs, foreign currency translation gains and losses, other expenses and income and mining tax expenses. Management uses this measure internally to plan and forecast future operating results. Management believes this measure is helpful to investors as it provides them with additional information about the Company’s underlying operating results, though it should be evaluated in conjunction with other data prepared in accordance with IFRS Accounting Standards. For a reconciliation of operating margin to revenue from mining operations, see “Three Year Financial and Operating Summary”, which is incorporated by reference into this section.
Capital Expenditures
Capital expenditures are calculated by deducting working capital adjustments from additions to property, plant and mine development per the consolidated statements of cash flows.
Capital expenditures are classified into sustaining capital expenditures, sustaining capitalized exploration, development capital expenditures and development capitalized exploration. Sustaining capital expenditures and sustaining capitalized exploration are expenditures incurred during the production phase to sustain and maintain existing assets so they can achieve constant expected levels of production from which the Company will derive economic benefits. Sustaining capital expenditures and sustaining capitalized exploration include expenditure for assets to retain their existing productive capacity as well as to enhance performance and reliability of the operations. Development capital expenditures and development capitalized exploration represent the spending at new projects and/or expenditures at existing operations that are undertaken with the intention to increase production levels or mine life above the current plans. Management uses these measures in the capital allocation process and to assess the effectiveness of its investments. Management believes these measures are useful so investors can assess the purpose and effectiveness of the capital expenditures split between sustaining and development in each reporting period. The classification between sustaining and development capital expenditures does not have a standardized definition in accordance with IFRS Accounting Standards and other companies may classify expenditures in a different manner.
The following table sets out a reconciliation of sustaining capital expenditures, sustaining capitalized exploration, development capital expenditures and development capitalized exploration to the additions to property, plant and mine development per the consolidated statements of cash flows for the year ended December 31, 2025, December 31, 2024 and December 31, 2023.
Reconciliation of Sustaining and Development Capital Expenditures to the Statements of Cash Flows
| | Three Months Ended | | Year Ended | ||||||||||||||
| | December 31, | | December 31, | ||||||||||||||
(thousands of United States dollars) | | 2025 | | 2024 | | 2023 | | 2025 | | 2024 | | 2023 | ||||||
Sustaining capital expenditures | | $ | 288,903 | | $ | 256,266 | | $ | 210,678 | | $ | 931,198 | | $ | 890,051 | | $ | 793,818 |
Sustaining capitalized exploration | |
| 7,420 | |
| 3,578 | |
| 4,079 | |
| 23,755 | |
| 18,702 | |
| 13,789 |
Development capital expenditures | |
| 412,830 | |
| 264,442 | |
| 194,968 | |
| 1,141,754 | |
| 767,366 | |
| 681,257 |
Development capitalized exploration | |
| 81,192 | |
| 51,559 | |
| 26,936 | |
| 294,680 | |
| 164,841 | |
| 112,004 |
Total Capital Expenditures | | $ | 790,345 | | $ | 575,845 | | $ | 436,661 | | $ | 2,391,387 | | $ | 1,840,960 | | $ | 1,600,868 |
Working capital adjustments | |
| 10,925 | |
| (13,682) | |
| (10,919) | |
| 26,813 | |
| (23,011) | |
| 53,261 |
Additions to property, plant and mine development per the consolidated statements of cash flows | | $ | 801,270 | | $ | 562,163 | | $ | 425,742 | | $ | 2,418,200 | | $ | 1,817,949 | | $ | 1,654,129 |
52
Sustaining and Development Capital Expenditures
The following table sets out a reconciliation of sustaining capital expenditures and development capital expenditures per minesite to the additions to property, plant and mine development per the consolidated statements of cash flows for the years ended December 31, 2025, December 31, 2024 and December 31, 2023.
| | Three Months Ended | | Year Ended | ||||||||||||||
| | December 31, | | December 31, | ||||||||||||||
(thousands of United States dollars) | | 2025 | | 2024 | | 2023 | | 2025 | | 2024 | | 2023 | ||||||
LaRonde | | $ | 40,029 | | $ | 27,712 | | $ | 25,258 | | $ | 98,239 | | $ | 92,186 | | $ | 83,081 |
Canadian Malartic(i) | | | 42,302 |
| | 35,649 |
| | 18,809 | | | 131,557 |
| | 127,536 |
| | 91,028 |
Goldex | | | 6,730 |
| | 11,138 |
| | 12,267 | | | 45,974 |
| | 53,586 |
| | 27,203 |
Quebec | | | 89,061 |
| | 74,499 |
| | 56,334 | | | 275,770 |
| | 273,308 |
| | 201,312 |
Detour Lake | | | 66,415 |
| | 78,341 |
| | 67,123 | | | 225,487 |
| | 267,588 |
| | 249,765 |
Macassa | | | 24,511 |
| | 16,419 |
| | 15,888 | | | 57,667 |
| | 46,067 |
| | 45,029 |
Ontario | | | 90,926 |
| | 94,760 |
| | 83,011 | | | 283,154 |
| | 313,655 |
| | 294,794 |
Meliadine | | | 20,670 |
| | 19,860 |
| | 21,244 | | | 78,447 |
| | 79,672 |
| | 75,275 |
Meadowbank | | | 34,453 |
| | 20,226 |
| | 21,297 | | | 132,085 |
| | 91,944 |
| | 121,653 |
Nunavut | | | 55,123 |
| | 40,086 |
| | 42,541 | | | 210,532 |
| | 171,616 |
| | 196,928 |
Fosterville | | | 23,871 |
| | 18,015 |
| | 9,322 | | | 68,486 |
| | 40,313 |
| | 34,646 |
Australia | | | 23,871 |
| | 18,015 |
| | 9,322 | | | 68,486 |
| | 40,313 |
| | 34,646 |
Kittila | | | 24,651 |
| | 18,107 |
| | 16,514 | | | 72,355 |
| | 71,101 |
| | 49,539 |
Europe | | | 24,651 |
| | 18,107 |
| | 16,514 | | | 72,355 |
| | 71,101 |
| | 49,539 |
Pinos Altos | | | 10,708 |
| | 11,030 |
| | 7,041 | | | 35,796 |
| | 30,882 |
| | 30,141 |
La India | | | — |
| | — |
| | (6) | | | — |
| | 22 |
| | 100 |
Mexico | | | 10,708 |
| | 11,030 |
| | 7,035 | | | 35,796 |
| | 30,904 |
| | 30,241 |
Other(ii) | | | 1,983 |
| | 3,347 |
| | — | | | 8,860 |
| | 7,856 |
| | 147 |
Sustaining capital expenditures | | $ | 296,323 | | $ | 259,844 | | $ | 214,757 | | $ | 954,953 | | $ | 908,753 | | $ | 807,607 |
LaRonde | | $ | 30,739 | | $ | 22,246 | | $ | 17,637 | | $ | 84,771 | | $ | 83,414 | | $ | 68,930 |
Canadian Malartic(i) | |
| 139,112 | |
| 70,529 | |
| 50,509 | |
| 356,728 | |
| 195,259 | |
| 169,960 |
Goldex | |
| 8,620 | |
| 5,488 | |
| 10,730 | |
| 22,038 | |
| 14,374 | |
| 59,436 |
Quebec | |
| 178,471 | |
| 98,263 | |
| 78,876 | |
| 463,537 | |
| 293,047 | |
| 298,326 |
Detour Lake | |
| 105,720 | |
| 87,745 | |
| 66,671 | |
| 321,204 | |
| 235,168 | |
| 172,903 |
Macassa | |
| 33,842 | |
| 37,483 | |
| 26,120 | |
| 126,850 | |
| 124,716 | |
| 101,230 |
Ontario | |
| 139,562 | |
| 125,228 | |
| 92,791 | |
| 448,054 | |
| 359,884 | |
| 274,133 |
Meliadine | |
| 20,817 | |
| 15,942 | |
| 25,990 | |
| 88,895 | |
| 82,800 | |
| 118,880 |
Meadowbank | |
| 4,846 | |
| 3,286 | |
| (277) | |
| 20,135 | |
| 3,266 | |
| 80 |
Nunavut | |
| 25,663 | |
| 19,228 | |
| 25,713 | |
| 109,030 | |
| 86,066 | |
| 118,960 |
Fosterville | |
| 22,128 | |
| 13,215 | |
| 16,591 | |
| 53,302 | |
| 49,728 | |
| 52,793 |
Australia | |
| 22,128 | |
| 13,215 | |
| 16,591 | |
| 53,302 | |
| 49,728 | |
| 52,793 |
Kittila | |
| 2,998 | |
| 3,144 | |
| 5,177 | |
| 8,120 | |
| 11,845 | |
| 31,463 |
Europe | |
| 2,998 | |
| 3,144 | |
| 5,177 | |
| 8,120 | |
| 11,845 | |
| 31,463 |
Pinos Altos | |
| 2,347 | |
| 1,579 | |
| (635) | |
| 6,296 | |
| 3,399 | |
| 5,297 |
San Nicolás | |
| 4,490 | |
| 3,770 | |
| — | |
| 11,103 | |
| 18,847 | |
| — |
Mexico | |
| 6,837 | |
| 5,349 | |
| (635) | |
| 17,399 | |
| 22,246 | |
| 5,297 |
Other(ii) | |
| 118,363 | |
| 51,574 | |
| 3,391 | |
| 336,992 | |
| 109,391 | |
| 12,289 |
Development capital expenditures | | $ | 494,022 | | $ | 316,001 | | $ | 221,904 | | $ | 1,436,434 | | $ | 932,207 | | $ | 793,261 |
Total capital expenditures | | $ | 790,345 | | $ | 575,845 | | $ | 436,661 | | $ | 2,391,387 | | $ | 1,840,960 | | $ | 1,600,868 |
Working capital adjustments | |
| 10,925 | |
| (13,682) | |
| (10,919) | |
| 26,813 | |
| (23,011) | |
| 53,261 |
Additions to property, plant and mine development per the consolidated statements of cash flows | | $ | 801,270 | | $ | 562,163 | | $ | 425,742 | | $ | 2,418,200 | | $ | 1,817,949 | | $ | 1,654,129 |
Notes:
| (i) | The information set out in this table reflects the Company’s 50% interest in Canadian Malartic up to and including March 30, 2023 and 100% interest thereafter following the closing of the Yamana Transaction. |
| (ii) | Other projects are not segregated by region and can include projects in Canada, Australia, Finland, Mexico and other countries. |
53
NOTE TO INVESTORS CONCERNING FORWARD-LOOKING INFORMATION
Certain statements in this MD&A, referred to herein as “forward-looking statements”, constitute “forward-looking statements” within the meaning of the United States Private Securities Litigation Reform Act of 1995 and constitute “forward-looking information” under the provisions of Canadian provincial securities laws. All statements, other than statements of historical fact, that address circumstances, events, activities or developments that could, may or will occur are forward-looking statements. These statements relate to, among other things, the Company’s plans, objectives, expectations, estimates, beliefs, strategies and intentions and can generally be identified by the use of words such as “anticipate”, “believe”, “budget”, “could”, “estimate”, “expect”, “forecast”, “likely”, “may”, “plan”, “project”, “schedule”, “should”, “target”, “will”, “would” or other variations of these terms or similar words.
Forward-looking statements in this MD&A include the following: the Company’s forward-looking guidance, including metal production, estimated ore grades, recovery rates, project timelines, drilling targets or results, life of mine estimates, total cash costs per ounce, AISC per ounce, minesite costs per tonne, other expenses and cash flows; the potential for additional gold production at the Company’s sites; including the potential to increase annual gold production by 20% to 30% over the next decade, exceeding four million ounces of annual gold production in the early 2030s; the estimated timing and conclusions of the Company’s studies and evaluations; the methods by which ore will be extracted or processed; the Company’s plans at Detour Lake underground , Upper Beaver Odyssey, Hope Bay and San Nicolás including the approval timing, funding, completion and commissioning thereof and the commencement of production therefrom; statements concerning the Company’s “fill-the-mill” strategy at Canadian Malartic; statements concerning other expansion projects, recovery rates, mill throughput, optimization efforts and projected exploration, including costs and other estimates upon which such projections are based; timing and amounts of capital expenditures, other expenditures and other cash needs, and expectations as to the funding thereof; estimates of future mineral reserves, mineral resources, mineral production and sales; the projected development of certain ore deposits, including estimates of exploration, development, production, closure and other capital expenditures and estimates of the timing of such exploration, development, production and closure or decisions with respect to such exploration, development, production and closure; estimates of mineral reserves and mineral resources and the effect of drill results and studies on future mineral reserves and mineral resources; the Company’s ability to obtain the necessary permits and authorizations in connection with its proposed or current exploration, development and mining operations and the anticipated timing or submission or receipt thereof; future exploration; the anticipated timing of events with respect to the Company’s mine sites; the Company’s plans and strategies with respect to sustainability initiatives; the sufficiency of the Company’s cash resources; the Company’s plans with respect to hedging and the effectiveness of its hedging strategies; future activity with respect to the Company’s unsecured revolving bank credit facility and other indebtedness; future dividend amounts, record dates and payment dates; the effect of tariffs and trade restrictions on the Company; plans with respect to activity under the NCIB; the Company’s estimate of the Meadowbank ARO liability; and anticipated trends with respect to the Company’s operations, exploration and the funding thereof. Such statements reflect the Company’s views as at the date of this MD&A and are subject to certain risks, uncertainties and assumptions, and undue reliance should not be placed on such statements.
Forward-looking statements are necessarily based upon a number of factors and assumptions that, while considered reasonable by Agnico Eagle as of the date of such statements, are inherently subject to significant business, economic and competitive uncertainties and contingencies. The material factors and assumptions used in the preparation of the forward-looking statements contained herein, which may prove to be incorrect, include, but are not limited to, the assumptions set forth herein, and in the Company’s 2024 AIF and, when available, the 2025 AIF filed with Canadian securities regulators and the SEC as well as: that there are no significant disruptions affecting operations; that production, permitting, development, expansion and the ramp-up of operations at each of Agnico Eagle’s properties proceeds on a basis consistent with current expectations and plans; that the Company’s plans for its mining operations are not changed or amended in a material way; that the relevant metal prices, foreign exchange rates and prices for key mining and construction inputs (including labour and electricity) will be consistent with Agnico Eagle’s expectations; that the effect of tariffs or trade disputes will not materially affect the price or availability of the inputs the Company uses at its operations; that Agnico Eagle’s current estimates of mineral reserves, mineral resources, mineral grades and metal recovery are accurate; that there are no material delays in the timing for completion of ongoing growth projects; that seismic activity at the Company’s operations at LaRonde, Goldex, Fosterville and other properties is as expected by the Company and that the Company’s efforts to mitigate its effect on mining operations, including with respect to community relations, are successful; that the Company’s current plans to address climate change and reduce greenhouse gas emissions are successful; that the Company’s current plans to optimize production are successful; that there are no material variations in the current tax and regulatory environment; that governments, the Company or others do not take measures in response to pandemics or other health emergencies or otherwise that, individually or in the aggregate, materially affect the Company’s ability to operate its business or its productivity; and that measures taken relating to, or other effects of, pandemics or other health emergencies do not affect the Company’s ability to obtain necessary supplies and deliver them to its mine sites.
54
Many factors, known and unknown, could cause the actual results to be materially different from those expressed or implied by such forward-looking statements. Such risks include, but are not limited to: the volatility of prices of gold and other metals; uncertainty of mineral reserves, mineral resources, mineral grades and mineral recovery estimates; uncertainty of future production, project development, capital expenditures and other costs; foreign exchange rate fluctuations; inflationary pressures; financing of additional capital requirements; cost of exploration and development programs; seismic activity at the Company’s operations, including at LaRonde, Goldex and Fosterville; mining risks; community protests, including by Indigenous groups; risks associated with foreign operations; risks associated with joint ventures; governmental and environmental regulation; the volatility of the Company’s stock price; risks associated with the Company’s currency, fuel and by-product metal derivative strategies; the current interest rate environment; the potential for major economies to encounter a slowdown in economic activity or a recession; the potential for increased conflict or hostilities in various regions, including Europe, South America and the Middle East; and the extent and manner of communicable diseases or outbreaks, and measures taken by governments, the Company or others to attempt to mitigate the spread thereof may directly or indirectly affect the Company.
For a more detailed discussion of such risks and other factors that may affect the Company’s ability to achieve the expectations set forth in the forward-looking statements contained in this MD&A, see the 2024 AIF and, when available, the 2025 AIF, each filed, or to be filed, on SEDAR+ at www.sedarplus.ca and included in the Form 40-F filed on EDGAR at www.sec.gov, as well as the Company’s other filings with the Canadian securities regulators and the SEC. Other than as required by law, the Company does not intend, and does not assume any obligation, to update these forward-looking statements.
SCIENTIFIC AND TECHNICAL INFORMATION
The scientific and technical information set out in this MD&A relating to Nunavut, Quebec and Finland operations has been approved by Dominique Girard, Eng., Executive Vice-President & Chief Operating Officer – Nunavut, Quebec & Europe; relating to Ontario, Australia and Mexico operations has been approved by Natasha Vaz,, P.Eng., Executive Vice-President & Chief Operating Officer – Ontario, Australia & Mexico; relating to exploration has been approved by Guy Gosselin, Eng. and P.Geo., Executive Vice-President, Exploration; and relating to mineral reserves and mineral resources has been approved by Dyane Duquette, P.Geo., Vice-President, Mineral Resources Management, each of whom is a “Qualified Person” for the purposes of NI 43-101.
NOTE TO INVESTORS CONCERNING ESTIMATES OF MINERAL RESERVES AND MINERAL RESOURCES
The mineral reserve and mineral resource estimates contained in this MD&A have been prepared in accordance with the Canadian Security Administrators’ (the “CSA”) National Instrument 43-101 Standards of Disclosure for Mineral Projects (“NI 43-101”).
Effective February 25, 2019, the SEC’s disclosure requirements and policies for mining properties were harmonized with current industry and global regulatory practices and standards, including NI 43-101. However, Canadian issuers that report in the United States using the Multijurisdictional Disclosure System (“MJDS”), such as the Company, may still use NI 43-101 rather than the SEC’s disclosure requirements when using the SEC’s MJDS registration statement and annual report forms. Accordingly, mineral reserve and mineral resource information contained in this MD&A may not be comparable to similar information disclosed by U.S. companies.
Investors are cautioned that while the SEC now recognizes “measured mineral resources”, “indicated mineral resources” and “inferred mineral resources”, investors should not assume that any part or all of the mineral deposits in these categories will ever be converted into a higher category of mineral resources or into mineral reserves. These terms have a great amount of uncertainty as to their economic and legal feasibility. Accordingly, investors are cautioned not to assume that any “measured mineral resources”, “indicated mineral resources”, or “inferred mineral resources” that the Company reports in this MD&A are or will be economically or legally mineable.
Further, “inferred mineral resources” have a great amount of uncertainty as to their existence and as to their economic and legal feasibility. It cannot be assumed that any part or all of an inferred mineral resource will ever be upgraded to a higher category. Under Canadian regulations, estimates of inferred mineral resources may not form the basis of feasibility or pre-feasibility studies, except in limited circumstances. Investors are cautioned not to assume that all or any part of an inferred mineral resource exists, or is or will ever be economically or legally mineable.
The mineral reserve and mineral resource data set out in this MD&A are estimates, and no assurance can be given that the anticipated tonnages and grades will be achieved or that the indicated level of recovery will be realized. The Company does not include equivalent gold ounces for by-product metals contained in mineral reserves in its calculation of contained ounces and mineral reserves are not reported as a subset of mineral resources. See “Mineral Reserves and Mineral Resources” in the 2024 AIF or, when available, the 2025 AIF for additional information.
55
AGNICO EAGLE MINES LIMITED
(thousands of United States dollars, except where noted)
| | Three Months Ended | | | | ||||||||||
| | March 31, | | June 30, | | September 30, | | December 31, | | Total | |||||
Operating margin(i): | | 2025 | | 2025 | | 2025 | | 2025 | | 2025 | |||||
Revenues from mining operations | | $ | 2,468,248 | | $ | 2,816,101 | | $ | 3,059,529 | | $ | 3,563,973 | | $ | 11,907,851 |
Production costs | |
| 767,733 | |
| 789,187 | |
| 839,321 | |
| 944,443 | |
| 3,340,684 |
Total operating margin(i) | |
| 1,700,515 | |
| 2,026,914 | |
| 2,220,208 | |
| 2,619,530 | |
| 8,567,167 |
Impairment reversal | |
| — | |
| — | |
| — | |
| (229,000) | |
| (229,000) |
Amortization of property, plant and mine development | |
| 416,800 | |
| 376,956 | |
| 429,947 | |
| 421,594 | |
| 1,645,297 |
Exploration, corporate and other | |
| 89,144 | |
| 33,339 | |
| 214,693 | |
| 109,783 | |
| 446,959 |
Income before income and mining taxes | |
| 1,194,571 | |
| 1,616,619 | |
| 1,575,568 | |
| 2,317,153 | |
| 6,703,911 |
Income and mining taxes | |
| 379,840 | |
| 547,908 | |
| 520,610 | |
| 794,092 | |
| 2,242,450 |
Net income for the period | | $ | 814,731 | | $ | 1,068,711 | | $ | 1,054,958 | | $ | 1,523,061 | | $ | 4,461,461 |
Net income per share — basic | | $ | 1.62 | | $ | 2.13 | | $ | 2.10 | | $ | 3.04 | | $ | 8.89 |
Net income per share — diluted | | $ | 1.62 | | $ | 2.12 | | $ | 2.10 | | $ | 3.04 | | $ | 8.86 |
Cash flows: | |
| | |
| | |
| | |
| | |
| |
Cash provided by operating activities | | $ | 1,044,246 | | $ | 1,845,488 | | $ | 1,815,875 | | $ | 2,111,504 | | $ | 6,817,113 |
Realized prices: | |
| | |
| | |
| | |
| | |
| |
Gold (per ounce) | | $ | 2,891 | | $ | 3,288 | | $ | 3,476 | | $ | 4,163 | | $ | 3,454 |
Silver (per ounce) | | $ | 33.07 | | $ | 35.72 | | $ | 43.43 | | $ | 60.65 | | $ | 43.80 |
Payable production(ii): | |
| | |
| | |
| | |
| | |
| |
Gold (ounces) | |
| | |
| | |
| | |
| | |
| |
LaRonde | |
| 91,491 | |
| 91,252 | |
| 81,522 | |
| 80,290 | |
| 344,555 |
Canadian Malartic | |
| 159,773 | |
| 172,531 | |
| 156,875 | |
| 153,433 | |
| 642,612 |
Goldex | |
| 30,016 | |
| 33,118 | |
| 29,375 | |
| 32,992 | |
| 125,501 |
Quebec | |
| 281,280 | |
| 296,901 | |
| 267,772 | |
| 266,715 | |
| 1,112,668 |
Detour Lake | |
| 152,838 | |
| 168,272 | |
| 176,539 | |
| 195,026 | |
| 692,675 |
Macassa | |
| 86,028 | |
| 87,364 | |
| 78,832 | |
| 60,505 | |
| 312,729 |
Ontario | |
| 238,866 | |
| 255,636 | |
| 255,371 | |
| 255,531 | |
| 1,005,404 |
Meliadine | |
| 98,512 | |
| 90,263 | |
| 93,836 | |
| 93,735 | |
| 376,346 |
Meadowbank | |
| 140,126 | |
| 101,935 | |
| 136,152 | |
| 115,101 | |
| 493,314 |
Nunavut | |
| 238,638 | |
| 192,198 | |
| 229,988 | |
| 208,836 | |
| 869,660 |
Fosterville | |
| 43,615 | |
| 49,574 | |
| 34,966 | |
| 32,367 | |
| 160,522 |
Australia | |
| 43,615 | |
| 49,574 | |
| 34,966 | |
| 32,367 | |
| 160,522 |
Kittila | |
| 54,104 | |
| 50,357 | |
| 57,954 | |
| 54,964 | |
| 217,379 |
Europe | |
| 54,104 | |
| 50,357 | |
| 57,954 | |
| 54,964 | |
| 217,379 |
Pinos Altos | |
| 17,291 | |
| 21,363 | |
| 20,885 | |
| 22,195 | |
| 81,734 |
Mexico | |
| 17,291 | |
| 21,363 | |
| 20,885 | |
| 22,195 | |
| 81,734 |
Total gold (ounces) | |
| 873,794 | |
| 866,029 | |
| 866,936 | |
| 840,608 | |
| 3,447,367 |
Silver (thousands of ounces) | |
| 602 | |
| 611 | |
| 630 | |
| 658 | |
| 2,501 |
Zinc (tonnes) | |
| 1,742 | |
| 2,384 | |
| 1,925 | |
| 2,395 | |
| 8,446 |
Copper (tonnes) | |
| 1,384 | |
| 1,161 | |
| 1,468 | |
| 1,380 | |
| 5,393 |
58
AGNICO EAGLE MINES LIMITED
SUMMARIZED QUARTERLY DATA
(thousands of United States dollars, except where noted)
| | Three Months Ended | | | ||||||
| | March 31, | | June 30, | | September 30, | | December 31, | | Total |
Payable metal sold(iii): | | 2025 | | 2025 | | 2025 | | 2025 | | 2025 |
Gold (ounces) |
| |
| |
| |
| |
| |
LaRonde |
| 90,509 |
| 88,908 |
| 77,224 |
| 93,892 |
| 350,533 |
Canadian Malartic |
| 144,663 |
| 150,830 |
| 157,228 |
| 146,832 |
| 599,553 |
Goldex |
| 30,693 |
| 33,167 |
| 28,479 |
| 31,961 |
| 124,300 |
Quebec |
| 265,865 |
| 272,905 |
| 262,931 |
| 272,685 |
| 1,074,386 |
Detour Lake |
| 155,480 |
| 166,034 |
| 188,008 |
| 173,144 |
| 682,666 |
Macassa |
| 81,000 |
| 79,145 |
| 81,330 |
| 58,445 |
| 299,920 |
Ontario |
| 236,480 |
| 245,179 |
| 269,338 |
| 231,589 |
| 982,586 |
Meliadine |
| 89,270 |
| 108,188 |
| 76,739 |
| 107,353 |
| 381,550 |
Meadowbank |
| 140,350 |
| 102,224 |
| 136,974 |
| 116,205 |
| 495,753 |
Nunavut |
| 229,620 |
| 210,412 |
| 213,713 |
| 223,558 |
| 877,303 |
Fosterville |
| 38,000 |
| 46,500 |
| 41,300 |
| 31,229 |
| 157,029 |
Australia |
| 38,000 |
| 46,500 |
| 41,300 |
| 31,229 |
| 157,029 |
Kittila |
| 56,000 |
| 51,000 |
| 55,000 |
| 55,060 |
| 217,060 |
Europe |
| 56,000 |
| 51,000 |
| 55,000 |
| 55,060 |
| 217,060 |
Pinos Altos |
| 17,000 |
| 20,839 |
| 21,734 |
| 20,604 |
| 80,177 |
Mexico |
| 17,000 |
| 20,839 |
| 21,734 |
| 20,604 |
| 80,177 |
Corporate and Other |
| — |
| — |
| 4,547 |
| 7,831 |
| 12,378 |
Total gold (ounces) |
| 842,965 |
| 846,835 |
| 868,563 |
| 842,556 |
| 3,400,919 |
Silver (thousands of ounces) |
| 527 |
| 574 |
| 653 |
| 622 |
| 2,376 |
Zinc (tonnes) |
| 1,812 |
| 2,391 |
| 1,977 |
| 2,619 |
| 8,799 |
Copper (tonnes) |
| 1,398 |
| 1,162 |
| 1,438 |
| 1,339 |
| 5,337 |
59
AGNICO EAGLE MINES LIMITED
SUMMARIZED QUARTERLY DATA
(thousands of United States dollars, except where noted)
| | Three Months Ended | | | | ||||||||||
| | March 31, | | June 30, | | September 30, | | December 31, | | Total | |||||
Operating margin(i): | | 2024 | | 2024 | | 2024 | | 2024 | | 2024 | |||||
Revenues from mining operations | | $ | 1,829,823 | | $ | 2,076,621 | | $ | 2,155,609 | | $ | 2,223,700 | | $ | 8,285,753 |
Production costs | |
| 783,585 | |
| 771,984 | |
| 783,653 | |
| 746,858 | |
| 3,086,080 |
Total operating margin(i) | |
| 1,046,238 | |
| 1,304,637 | |
| 1,371,956 | |
| 1,476,842 | |
| 5,199,673 |
Amortization of property, plant and mine development | |
| 357,225 | |
| 378,389 | |
| 390,245 | |
| 388,217 | |
| 1,514,076 |
Exploration, corporate and other | |
| 199,965 | |
| 216,042 | |
| 141,921 | |
| 306,114 | |
| 864,042 |
Income before income and mining taxes | |
| 489,048 | |
| 710,206 | |
| 839,790 | |
| 782,511 | |
| 2,821,555 |
Income and mining taxes | |
| 141,856 | |
| 238,190 | |
| 272,672 | |
| 273,256 | |
| 925,974 |
Net income for the period | | $ | 347,192 | | $ | 472,016 | | $ | 567,118 | | $ | 509,255 | | $ | 1,895,581 |
Net income per share — basic | | $ | 0.70 | | $ | 0.95 | | $ | 1.13 | | $ | 1.02 | | $ | 3.79 |
Net income per share — diluted | | $ | 0.70 | | $ | 0.94 | | $ | 1.13 | | $ | 1.01 | | $ | 3.78 |
Cash flows: | |
| | |
| | |
| | |
| | |
| |
Cash provided by operating activities | | $ | 783,175 | | $ | 961,336 | | $ | 1,084,532 | | $ | 1,131,849 | | $ | 3,960,892 |
Realized prices: | |
| | |
| | |
| | |
| | |
| |
Gold (per ounce) | | $ | 2,062 | | $ | 2,342 | | $ | 2,492 | | $ | 2,660 | | $ | 2,384 |
Silver (per ounce) | | $ | 23.80 | | $ | 30.09 | | $ | 30.69 | | $ | 30.31 | | $ | 28.85 |
Payable production(ii): | |
| | |
| | |
| | |
| | |
| |
Gold (ounces) | |
| | |
| | |
| | |
| | |
| |
LaRonde | |
| 68,364 | |
| 82,334 | |
| 65,605 | |
| 90,447 | |
| 306,750 |
Canadian Malartic | |
| 186,906 | |
| 180,871 | |
| 141,392 | |
| 146,485 | |
| 655,654 |
Goldex | |
| 34,388 | |
| 33,750 | |
| 30,334 | |
| 32,341 | |
| 130,813 |
Quebec | |
| 289,658 | |
| 296,955 | |
| 237,331 | |
| 269,273 | |
| 1,093,217 |
Detour Lake | |
| 150,751 | |
| 168,247 | |
| 173,891 | |
| 179,061 | |
| 671,950 |
Macassa | |
| 68,259 | |
| 64,062 | |
| 70,727 | |
| 76,336 | |
| 279,384 |
Ontario | |
| 219,010 | |
| 232,309 | |
| 244,618 | |
| 255,397 | |
| 951,334 |
Meliadine | |
| 95,725 | |
| 88,675 | |
| 99,838 | |
| 94,648 | |
| 378,886 |
Meadowbank | |
| 127,774 | |
| 126,419 | |
| 133,502 | |
| 117,024 | |
| 504,719 |
Nunavut | |
| 223,499 | |
| 215,094 | |
| 233,340 | |
| 211,672 | |
| 883,605 |
Fosterville | |
| 56,569 | |
| 65,963 | |
| 65,532 | |
| 37,139 | |
| 225,203 |
Australia | |
| 56,569 | |
| 65,963 | |
| 65,532 | |
| 37,139 | |
| 225,203 |
Kittila | |
| 54,581 | |
| 55,671 | |
| 56,715 | |
| 51,893 | |
| 218,860 |
Europe | |
| 54,581 | |
| 55,671 | |
| 56,715 | |
| 51,893 | |
| 218,860 |
Pinos Altos | |
| 24,725 | |
| 23,754 | |
| 21,371 | |
| 18,583 | |
| 88,433 |
Creston Mascota | |
| 28 | |
| 13 | |
| 9 | |
| 54 | |
| 104 |
La India | |
| 10,582 | |
| 6,079 | |
| 4,529 | |
| 3,390 | |
| 24,580 |
Mexico | |
| 35,335 | |
| 29,846 | |
| 25,909 | |
| 22,027 | |
| 113,117 |
Total gold (ounces) | |
| 878,652 | |
| 895,838 | |
| 863,445 | |
| 847,401 | |
| 3,485,336 |
Silver (thousands of ounces) | |
| 615 | |
| 628 | |
| 602 | |
| 640 | |
| 2,485 |
Zinc (tonnes) | |
| 1,682 | |
| 1,883 | |
| 914 | |
| 1,860 | |
| 6,339 |
Copper (tonnes) | |
| 804 | |
| 1,072 | |
| 797 | |
| 1,278 | |
| 3,951 |
60
AGNICO EAGLE MINES LIMITED
SUMMARIZED QUARTERLY DATA
(thousands of United States dollars, except where noted)
| | Three Months Ended | | | ||||||
| | March 31, | | June 30, | | September 30, | | December 31, | | Total |
Payable metal sold(iii): | | 2024 | | 2024 | | 2024 | | 2024 | | 2024 |
Gold (ounces) |
| |
| |
| |
| |
| |
LaRonde |
| 85,415 |
| 67,830 |
| 77,277 |
| 74,172 |
| 304,694 |
Canadian Malartic |
| 159,548 |
| 176,651 |
| 139,694 |
| 148,753 |
| 624,646 |
Goldex |
| 34,442 |
| 33,783 |
| 31,671 |
| 29,501 |
| 129,397 |
Quebec |
| 279,405 |
| 278,264 |
| 248,642 |
| 252,426 |
| 1,058,737 |
Detour Lake |
| 167,008 |
| 153,622 |
| 176,585 |
| 166,057 |
| 663,272 |
Macassa |
| 67,500 |
| 65,340 |
| 65,000 |
| 80,624 |
| 278,464 |
Ontario |
| 234,508 |
| 218,962 |
| 241,585 |
| 246,681 |
| 941,736 |
Meliadine |
| 98,540 |
| 94,438 |
| 83,900 |
| 97,898 |
| 374,776 |
Meadowbank |
| 121,110 |
| 131,003 |
| 126,010 |
| 114,497 |
| 492,620 |
Nunavut |
| 219,650 |
| 225,441 |
| 209,910 |
| 212,395 |
| 867,396 |
Fosterville |
| 58,000 |
| 62,049 |
| 67,198 |
| 41,900 |
| 229,147 |
Australia |
| 58,000 |
| 62,049 |
| 67,198 |
| 41,900 |
| 229,147 |
Kittila |
| 55,000 |
| 56,984 |
| 59,464 |
| 48,100 |
| 219,548 |
Europe |
| 55,000 |
| 56,984 |
| 59,464 |
| 48,100 |
| 219,548 |
Pinos Altos |
| 20,300 |
| 25,510 |
| 23,700 |
| 19,900 |
| 89,410 |
La India |
| 12,200 |
| 7,020 |
| 5,400 |
| 3,500 |
| 28,120 |
Mexico |
| 32,500 |
| 32,530 |
| 29,100 |
| 23,400 |
| 117,530 |
Total gold (ounces) |
| 879,063 |
| 874,230 |
| 855,899 |
| 824,902 |
| 3,434,094 |
Silver (thousands of ounces) |
| 604 |
| 637 |
| 573 |
| 669 |
| 2,483 |
Zinc (tonnes) |
| 1,507 |
| 1,547 |
| 1,748 |
| 1,407 |
| 6,209 |
Copper (tonnes) |
| 762 |
| 1,113 |
| 806 |
| 1,271 |
| 3,952 |
Notes:
| (i) | Operating margin (a non-GAAP measure) is calculated as revenues from mining operations less production costs. Details by minesite are disclosed in the “Three Year Financial and Operating Summary” below. For a discussion of the composition and usefulness of operating margin, see “Non-GAAP Financial Performance Measures”. |
| (ii) | Payable production (a non-GAAP non-financial performance measure) is the quantity of mineral produced during a period contained in products that are or will be sold by the Company, whether such products are sold during the period or held as inventories at the end of the period. For the year ended December 31, 2025, it excludes 4,539 payable gold ounces produced at La India and 323 payable gold ounces produced at Creston Mascota as well as 9,468 ounces of gold recovered at Hope Bay. |
| (iii) | Payable metals sold at Canadian Malartic, Detour Lake and Macassa exclude the in-kind royalties of 5.0%, 2.0% and 1.5%, respectively, paid in respect of gold production at such mines. For the year ended December 31, 2025, it excludes 2,500 payable gold ounces sold at La India. |
61
AGNICO EAGLE MINES LIMITED
THREE YEAR FINANCIAL AND OPERATING SUMMARY
(thousands of United States dollars, except where noted)
| | 2025 | | 2024 | | 2023 | |||
Revenues from mining operations |
| | |
| | |
| | |
LaRonde | | $ | 1,303,218 | | $ | 770,314 | | $ | 613,776 |
Canadian Malartic(i) | |
| 2,078,291 | |
| 1,492,313 | |
| 1,124,480 |
Goldex | |
| 460,907 | |
| 321,346 | |
| 272,801 |
Quebec | |
| 3,842,416 | |
| 2,583,973 | |
| 2,011,057 |
Detour Lake | |
| 2,360,769 | |
| 1,582,974 | |
| 1,262,839 |
Macassa | |
| 1,021,752 | |
| 670,568 | |
| 431,827 |
Ontario | |
| 3,382,521 | |
| 2,253,542 | |
| 1,694,666 |
Meliadine | |
| 1,328,761 | |
| 890,243 | |
| 697,431 |
Meadowbank | |
| 1,700,214 | |
| 1,178,132 | |
| 858,209 |
Nunavut | |
| 3,028,975 | |
| 2,068,375 | |
| 1,555,640 |
Fosterville | |
| 537,795 | |
| 545,152 | |
| 552,468 |
Australia | |
| 537,795 | |
| 545,152 | |
| 552,468 |
Kittila | |
| 748,635 | |
| 523,550 | |
| 448,719 |
Europe | |
| 748,635 | |
| 523,550 | |
| 448,719 |
Pinos Altos | |
| 323,322 | |
| 245,997 | |
| 212,876 |
La India | |
| — | |
| 65,164 | |
| 151,483 |
Mexico | |
| 323,322 | |
| 311,161 | |
| 364,359 |
Corporate and Other | |
| 44,187 | |
| — | |
| — |
Revenues from mining operations | |
| 11,907,851 | |
| 8,285,753 | |
| 6,626,909 |
Production costs | |
| 3,340,684 | |
| 3,086,080 | |
| 2,933,263 |
Operating margin(ii) | |
| 8,567,167 | |
| 5,199,673 | |
| 3,693,646 |
Impairment (reversal) loss | |
| (229,000) | |
| — | |
| 787,000 |
Amortization of property, plant and mine development | |
| 1,645,297 | |
| 1,514,076 | |
| 1,491,771 |
Revaluation gain | |
| — | |
| — | |
| (1,543,414) |
Exploration, corporate and other | |
| 446,959 | |
| 864,042 | |
| 599,220 |
Income before income and mining taxes | |
| 6,703,911 | |
| 2,821,555 | |
| 2,359,069 |
Income and mining taxes | |
| 2,242,450 | |
| 925,974 | |
| 417,762 |
Net income for the year | | $ | 4,461,461 | | $ | 1,895,581 | | $ | 1,941,307 |
Net income per share — basic | | $ | 8.89 | | $ | 3.79 | | $ | 3.97 |
Net income per share — diluted | | $ | 8.86 | | $ | 3.78 | | $ | 3.95 |
Cash provided by operating activities | | $ | 6,817,113 | | $ | 3,960,892 | | $ | 2,601,562 |
Cash used in investing activities | | $ | (2,598,295) | | $ | (2,007,114) | | $ | (2,760,783) |
Cash used in financing activities | | $ | (2,287,143) | | $ | (1,356,331) | | $ | (163,958) |
Dividends declared per share | | $ | 1.60 | | $ | 1.60 | | $ | 1.60 |
Capital expenditures per Consolidated Statements of Cash Flows | | $ | 2,418,200 | | $ | 1,817,949 | | $ | 1,654,129 |
Realized price per ounce of gold | | $ | 3,454 | | $ | 2,384 | | $ | 1,946 |
Realized price per ounce of silver | | $ | 43.80 | | $ | 28.85 | | $ | 23.72 |
Weighted average number of common shares outstanding - basic (thousands) | |
| 501,993 | |
| 499,904 | |
| 488,723 |
Total assets | | $ | 34,471,291 | | $ | 29,987,018 | | $ | 28,684,949 |
Long-term debt | | $ | 196,271 | | $ | 1,052,956 | | $ | 1,743,086 |
Shareholders’ equity | | $ | 24,742,464 | | $ | 20,832,900 | | $ | 19,422,915 |
62
AGNICO EAGLE MINES LIMITED
THREE YEAR FINANCIAL AND OPERATING SUMMARY
(thousands of United States dollars, except where noted)
LaRonde | | 2025 | | 2024 | | 2023 | |||
Revenues from mining operations | | $ | 1,303,218 | | $ | 770,314 | | $ | 613,776 |
Production costs | |
| 360,025 | |
| 319,495 | |
| 299,644 |
Operating margin(ii) | | $ | 943,193 | | $ | 450,819 | | $ | 314,132 |
Amortization of property, plant and mine development | |
| 145,080 | |
| 137,119 | |
| 114,349 |
Tonnes of ore milled | |
| 2,804,903 | |
| 2,849,391 | |
| 2,658,396 |
Gold — grams per tonne | |
| 4.08 | |
| 3.62 | |
| 3.83 |
Gold production — ounces | |
| 344,555 | |
| 306,750 | |
| 306,648 |
Silver production — thousands of ounces | |
| 671 | |
| 589 | |
| 588 |
Zinc production — tonnes | |
| 8,446 | |
| 6,339 | |
| 7,702 |
Copper production — tonnes | |
| 2,431 | |
| 2,290 | |
| 2,578 |
Production costs per ounce ($per ounce basis) | | $ | 1,045 | | $ | 1,042 | | $ | 977 |
Total cash costs per ounce - co-product basis(iii) | | $ | 1,072 | | $ | 1,132 | | $ | 1,088 |
Impact of by-product metals | |
| (243) | |
| (187) | |
| (177) |
Total cash costs per ounce - by-product basis(iii) | | $ | 829 | | $ | 945 | | $ | 911 |
Production costs per tonne | | C$ | 179 | | C$ | 153 | | C$ | 152 |
Minesite costs per tonne(iv) | | C$ | 166 | | C$ | 154 | | C$ | 153 |
Canadian Malartic(iv) | |
| | |
| | |
| |
Revenues from mining operations | | $ | 2,078,291 | | $ | 1,492,313 | | $ | 1,124,480 |
Production costs | |
| 488,160 | |
| 532,037 | |
| 465,814 |
Operating margin(ii) | | $ | 1,590,131 | | $ | 960,276 | | $ | 658,666 |
Amortization of property, plant and mine development | |
| 395,663 | |
| 348,866 | |
| 340,737 |
Tonnes of ore milled | |
| 20,122,738 | |
| 20,317,261 | |
| 17,332,886 |
Gold — grams per tonne | |
| 1.08 | |
| 1.09 | |
| 1.17 |
Gold production — ounces | |
| 642,612 | |
| 655,654 | |
| 603,955 |
Silver production — thousands of ounces | |
| 337 | |
| 306 | |
| 311 |
Production costs per ounce ($per ounce basis) | | $ | 760 | | $ | 811 | | $ | 771 |
Total cash costs per ounce - co-product basis(iii) | | $ | 969 | | $ | 943 | | $ | 835 |
Impact of by-product metals | |
| (23) | |
| (13) | |
| (11) |
Total cash costs per ounce - by-product basis(iii) | | $ | 946 | | $ | 930 | | $ | 824 |
Production costs per tonne | | C$ | 34 | | C$ | 36 | | C$ | 36 |
Minesite costs per tonne(iv) | | C$ | 43 | | C$ | 41 | | C$ | 39 |
63
AGNICO EAGLE MINES LIMITED
THREE YEAR FINANCIAL AND OPERATING SUMMARY
(thousands of United States dollars, except where noted)
Goldex | | 2025 | | 2024 | | 2023 | |||
Revenues from mining operations | | $ | 460,907 | | $ | 321,346 | | $ | 272,801 |
Production costs | |
| 148,952 | |
| 129,977 | |
| 112,022 |
Operating margin(ii) | | $ | 311,955 | | $ | 191,369 | | $ | 160,779 |
Amortization of property, plant and mine development | |
| 53,722 | |
| 43,562 | |
| 39,069 |
Tonnes of ore milled | |
| 3,300,912 | |
| 3,075,697 | |
| 2,886,927 |
Gold — grams per tonne | |
| 1.40 | |
| 1.55 | |
| 1.74 |
Gold production — ounces | |
| 125,501 | |
| 130,813 | |
| 140,983 |
Silver production — thousands of ounces | |
| 3 | |
| 3 | |
| 2 |
Copper production — tonnes | |
| 2,962 | |
| 1,661 | |
| 39 |
Production costs per ounce ($per ounce basis) | | $ | 1,187 | | $ | 994 | | $ | 795 |
Total cash costs per ounce - co-product basis(iii) | | $ | 1,243 | | $ | 1,041 | | $ | 822 |
Impact of by-product metals | |
| (241) | |
| (118) | |
| (2) |
Total cash costs per ounce - by-product basis(iii) | | $ | 1,002 | | $ | 923 | | $ | 820 |
Production costs per tonne | | C$ | 63 | | C$ | 58 | | C$ | 52 |
Minesite costs per tonne(iv) | | C$ | 64 | | C$ | 59 | | C$ | 53 |
Meliadine | |
| | |
| | |
| |
Revenues from mining operations | | $ | 1,328,761 | | $ | 890,243 | | $ | 697,431 |
Production costs | |
| 402,385 | |
| 350,280 | |
| 343,650 |
Operating margin(ii) | | $ | 926,376 | | $ | 539,963 | | $ | 353,781 |
Amortization of property, plant and mine development | |
| 263,954 | |
| 202,834 | |
| 182,530 |
Tonnes of ore milled | |
| 2,351,003 | |
| 1,966,236 | |
| 1,918,143 |
Gold — grams per tonne | |
| 5.14 | |
| 6.22 | |
| 6.11 |
Gold production — ounces | |
| 376,346 | |
| 378,886 | |
| 364,141 |
Silver production — thousands of ounces | |
| 26 | |
| 34 | |
| 27 |
Production costs per ounce ($per ounce basis) | | $ | 1,069 | | $ | 924 | | $ | 944 |
Total cash costs per ounce - co-product basis(iii) | | $ | 1,070 | | $ | 942 | | $ | 981 |
Impact of by-product metals | |
| (3) | |
| (2) | |
| (1) |
Total cash costs per ounce - by-product basis(iii) | | $ | 1,067 | | $ | 940 | | $ | 980 |
Production costs per tonne | | C$ | 238 | | C$ | 243 | | C$ | 241 |
Minesite costs per tonne(iv) | | C$ | 237 | | C$ | 247 | | C$ | 249 |
64
AGNICO EAGLE MINES LIMITED
THREE YEAR FINANCIAL AND OPERATING SUMMARY
(thousands of United States dollars, except where noted)
Meadowbank | | 2025 | | 2024 | | 2023 | |||
Revenues from mining operations | | $ | 1,700,214 | | $ | 1,178,132 | | $ | 858,209 |
Production costs | |
| 552,470 | |
| 463,464 | |
| 524,008 |
Operating margin(ii) | | $ | 1,147,744 | | $ | 714,668 | | $ | 334,201 |
Amortization of property, plant and mine development | |
| 176,675 | |
| 148,414 | |
| 192,509 |
Tonnes of ore milled | |
| 3,940,952 | |
| 4,142,766 | |
| 3,842,649 |
Gold — grams per tonne | |
| 4.29 | |
| 4.18 | |
| 3.86 |
Gold production — ounces | |
| 493,314 | |
| 504,719 | |
| 431,666 |
Silver production — thousands of ounces | |
| 160 | |
| 142 | |
| 125 |
Production costs per ounce ($per ounce basis) | | $ | 1,120 | | $ | 918 | | $ | 1,214 |
Total cash costs per ounce - co-product basis(iii) | | $ | 1,122 | | $ | 946 | | $ | 1,183 |
Impact of by-product metals | |
| (12) | |
| (8) | |
| (7) |
Total cash costs per ounce - by-product basis(iii) | | $ | 1,110 | | $ | 938 | | $ | 1,176 |
Production costs per tonne | | C$ | 195 | | C$ | 153 | | C$ | 183 |
Minesite costs per tonne(iv) | | C$ | 194 | | C$ | 156 | | C$ | 179 |
Kittila | |
| | |
| | |
| |
Revenues from mining operations | | $ | 748,635 | | $ | 523,550 | | $ | 448,719 |
Production costs | |
| 236,238 | |
| 227,334 | |
| 205,857 |
Operating margin(ii) | | $ | 512,397 | | $ | 296,216 | | $ | 242,862 |
Amortization of property, plant and mine development | |
| 121,163 | |
| 117,679 | |
| 102,686 |
Tonnes of ore milled | |
| 2,105,463 | |
| 2,026,251 | |
| 1,954,215 |
Gold — grams per tonne | |
| 3.91 | |
| 4.11 | |
| 4.48 |
Gold production — ounces | |
| 217,379 | |
| 218,860 | |
| 234,402 |
Silver production — thousands of ounces | |
| 19 | |
| 17 | |
| 15 |
Production costs per ounce ($per ounce basis) | | $ | 1,087 | | $ | 1,039 | | $ | 878 |
Total cash costs per ounce - co-product basis(iii) | | $ | 1,084 | | $ | 1,033 | | $ | 872 |
Impact of by-product metals | |
| (3) | |
| (2) | |
| (1) |
Total cash costs per ounce - by-product basis(iii) | | $ | 1,081 | | $ | 1,031 | | $ | 871 |
Production costs per tonne | | € | 99 | | € | 103 | | € | 98 |
Minesite costs per tonne(iv) | | € | 100 | | € | 103 | | € | 99 |
65
AGNICO EAGLE MINES LIMITED
THREE YEAR FINANCIAL AND OPERATING SUMMARY
(thousands of United States dollars, except where noted)
Detour Lake | | 2025 | | 2024 | | 2023 | |||
Revenues from mining operations | | $ | 2,360,769 | | $ | 1,582,974 | | $ | 1,262,839 |
Production costs | |
| 565,439 | |
| 497,079 | |
| 453,498 |
Operating margin(ii) | | $ | 1,795,330 | | $ | 1,085,895 | | $ | 809,341 |
Amortization of property, plant and mine development | |
| 225,463 | |
| 185,972 | |
| 161,819 |
Tonnes of ore milled | |
| 27,868,634 | |
| 27,462,385 | |
| 25,434,854 |
Gold — grams per tonne | |
| 0.86 | |
| 0.85 | |
| 0.91 |
Gold production — ounces | |
| 692,675 | |
| 671,950 | |
| 677,446 |
Silver production — thousands of ounces | |
| 156 | |
| 107 | |
| 79 |
Production costs per ounce ($per ounce basis) | | $ | 816 | | $ | 740 | | $ | 669 |
Total cash costs per ounce - co-product basis(iii) | | $ | 887 | | $ | 801 | | $ | 738 |
Impact of by-product metals | |
| (8) | |
| (5) | |
| (3) |
Total cash costs per ounce - by-product basis(iii) | | $ | 879 | | $ | 796 | | $ | 735 |
Production costs per tonne | | C$ | 28 | | C$ | 25 | | C$ | 24 |
Minesite costs per tonne(iv) | | C$ | 30 | | C$ | 26 | | C$ | 26 |
Macassa | |
| | |
| | |
| |
Revenues from mining operations | | $ | 1,021,752 | | $ | 670,568 | | $ | 431,827 |
Production costs | |
| 221,718 | |
| 201,371 | |
| 155,046 |
Operating margin(ii) | | $ | 800,034 | | $ | 469,197 | | $ | 276,781 |
Amortization of property, plant and mine development | |
| 123,699 | |
| 169,272 | |
| 155,944 |
Tonnes of ore milled | |
| 573,036 | |
| 573,702 | |
| 441,588 |
Gold — grams per tonne | |
| 17.42 | |
| 15.55 | |
| 16.47 |
Gold production — ounces | |
| 312,729 | |
| 279,384 | |
| 228,535 |
Silver production — thousands of ounces | |
| 97 | |
| 38 | |
| 21 |
Production costs per ounce ($per ounce basis) | | $ | 709 | | $ | 721 | | $ | 678 |
Total cash costs per ounce - co-product basis(iii) | | $ | 799 | | $ | 752 | | $ | 733 |
Impact of by-product metals | |
| (6) | |
| (4) | |
| (2) |
Total cash costs per ounce - by-product basis(iii) | | $ | 793 | | $ | 748 | | $ | 731 |
Production costs per tonne | | C$ | 540 | | C$ | 482 | | C$ | 475 |
Minesite costs per tonne(iv) | | C$ | 604 | | C$ | 498 | | C$ | 503 |
66
AGNICO EAGLE MINES LIMITED
THREE YEAR FINANCIAL AND OPERATING SUMMARY
(thousands of United States dollars, except where noted)
Fosterville | | 2025 | | 2024 | | 2023 | |||
Revenues from mining operations | | $ | 537,795 | | $ | 545,152 | | $ | 552,468 |
Production costs | |
| 146,382 | |
| 147,045 | |
| 131,298 |
Operating margin(ii) | | $ | 391,413 | | $ | 398,107 | | $ | 421,170 |
Amortization of property, plant and mine development | |
| 80,250 | |
| 92,424 | |
| 88,044 |
Tonnes of ore milled | |
| 725,726 | |
| 809,475 | |
| 650,666 |
Gold — grams per tonne | |
| 7.20 | |
| 8.96 | |
| 13.61 |
Gold production — ounces | |
| 160,522 | |
| 225,203 | |
| 277,694 |
Silver production — thousands of ounces | |
| 18 | |
| 17 | |
| 20 |
Production costs per ounce ($per ounce basis) | | $ | 912 | | $ | 653 | | $ | 473 |
Total cash costs per ounce - co-product basis(iii) | | $ | 941 | | $ | 650 | | $ | 489 |
Impact of by-product metals | |
| (4) | |
| (3) | |
| (1) |
Total cash costs per ounce - by-product basis(iii) | | $ | 937 | | $ | 647 | | $ | 488 |
Production costs per tonne | | A$ | 310 | | A$ | 277 | | A$ | 304 |
Minesite costs per tonne(iv) | | A$ | 320 | | A$ | 276 | | A$ | 301 |
Pinos Altos | |
| | |
| | |
| |
Revenues from mining operations | | $ | 323,322 | | $ | 245,997 | | $ | 212,876 |
Production costs | |
| 205,808 | |
| 168,231 | |
| 145,936 |
Operating margin(ii) | | $ | 117,514 | | $ | 77,766 | | $ | 66,940 |
Amortization of property, plant and mine development | |
| 43,849 | |
| 45,943 | |
| 63,125 |
Tonnes of ore processed | |
| 1,719,782 | |
| 1,707,216 | |
| 1,656,466 |
Gold — grams per tonne processed at the mill | |
| 1.55 | |
| 1.69 | |
| 1.92 |
Gold production — ounces | |
| 81,734 | |
| 88,433 | |
| 97,642 |
Silver production — thousands of ounces | |
| 1,013 | |
| 1,198 | |
| 1,153 |
Production costs per ounce ($per ounce basis) | | $ | 2,518 | | $ | 1,902 | | $ | 1,495 |
Total cash costs per ounce - co-product basis(iii) | | $ | 2,593 | | $ | 1,925 | | $ | 1,509 |
Impact of by-product metals | |
| (587) | |
| (395) | |
| (280) |
Total cash costs per ounce - by-product basis(iii) | | $ | 2,006 | | $ | 1,530 | | $ | 1,229 |
Production costs per tonne | | $ | 120 | | $ | 99 | | $ | 88 |
Minesite costs per tonne(iv) | | $ | 122 | | $ | 99 | | $ | 88 |
67
AGNICO EAGLE MINES LIMITED
THREE YEAR FINANCIAL AND OPERATING SUMMARY
(thousands of United States dollars, except where noted)
Corporate and Other(v) | | 2025 | | 2024 | | 2023 | |||
Revenues from mining operations | | $ | 44,187 | | $ | 65,164 | | $ | 151,483 |
Production costs | |
| 13,107 | |
| 49,767 | |
| 96,490 |
Operating margin(ii) | | $ | 31,080 | | $ | 15,397 | | $ | 54,993 |
Amortization of property, plant and mine development | |
| 7,833 | |
| 8,590 | |
| 37,140 |
Tonnes of ore processed | |
| — | |
| — | |
| 3,009,922 |
Gold — grams per tonne | |
| — | |
| — | |
| 0.87 |
Gold production — ounces(vi) | |
| 4,862 | |
| 24,684 | |
| 76,542 |
Silver production — thousands of ounces | |
| 1 | |
| 34 | |
| 67 |
Production costs per ounce ($per ounce basis) | | $ | 1,045 | | $ | 2,025 | | $ | 1,271 |
Total cash costs per ounce - co-product basis(iii) | | $ | — | | $ | 1,987 | | $ | 1,261 |
Impact of by-product metals | |
| — | |
| (42) | |
| (20) |
Total cash costs per ounce - by-product basis(iii) | | $ | — | | $ | 1,945 | | $ | 1,241 |
Production costs per tonne | | $ | — | | $ | — | | $ | 32 |
Minesite costs per tonne(iv)(vii) | | $ | — | | $ | — | | $ | 32 |
Notes:
| (i) | The information set out in this table for the year ended December 31, 2023 reflects the Company’s 50% interest in the Canadian Malartic complex up to and including March 30, 2023 and 100% interest thereafter. |
| (ii) | Operating margin is calculated as revenues from mining operations less production costs. Operating margin is not a recognized measure under IFRS Accounting Standards and may not be comparable to data reported by other gold producers. Refer to “Non-GAAP Financial Performance Measures - Operating Margin” in this MD&A for additional details. |
| (iii) | The total cash costs per ounce of gold produced is not a recognized measure under IFRS Accounting Standards and this data may not be comparable to data reported by other gold producers. Refer to “Non-GAAP Financial Performance Measures” and “Non-GAAP Financial Performance Measures - Total Cash Costs Per Ounce and Minesite Costs per Tonne” in this MD&A for additional details. |
| (iv) | Minesite costs per tonne is not a recognized measure under IFRS Accounting Standards and this data may not be comparable to data reported by other gold producers. Refer to “Non-GAAP Financial Performance Measures” and “Non-GAAP Financial Performance Measures - Total Cash Costs Per Ounce and Minesite Costs per Tonne” in this MD&A for additional details. |
| (v) | Corporate and Other sets out data on production and cost for the Company’s non-operating minesites, including for La India (for 2025), Creston Mascota (for 2023, 2024 and 2025) and Hope Bay (for 2025). |
| (vi) | Gold production for the year ended December 31, 2025 excludes 9,468 ounces of gold recovered at Hope Bay. |
| (vii) | Cost data per tonne for the year ended December 31, 2024 exclude approximately $49.8 million of production costs incurred at La India during the period, following the cessation of mining activities at La India during the fourth quarter of 2023. |
68