Please wait

.5

Graphic

Stock Symbol:

AEM (NYSE and TSX)

For further information:

Investor Relations

(416) 947-1212

(All amounts expressed in U.S. dollars unless otherwise noted)

AGNICO EAGLE PROVIDES AN UPDATE ON 2025 EXPLORATION RESULTS AND 2026 EXPLORATION PLANS – YEAR OVER YEAR MINERAL RESERVES INCREASE 2% TO 55.4 MOZ; INDICATED MINERAL RESOURCES INCREASE 10% TO 47.1 MOZ AND INFERRED MINERAL RESOURCES INCREASE 15% TO 41.8 MOZ

Toronto (February 12, 2026) – Agnico Eagle Mines Limited (NYSE:AEM, TSX:AEM) (“Agnico Eagle” or the “Company”) is pleased to provide an update on year-end 2025 mineral reserves and mineral resources, exploration activities at mine sites and select advanced projects in 2025, and the Company’s exploration plans and guidance for 2026. The Company’s exploration focus remains on extending mine life at existing operations, testing near-mine opportunities and advancing key value driver projects.

“I would like to congratulate our exploration team for their performance in 2025 in terms of safety, productivity and cost control with an average of 120 diamond drill rigs in operation drilling 1.4 million metres of core. The exploration program continued to yield exciting results at our mines and key pipeline projects, which drove an increase in our mineral reserves and in our measured, indicated and inferred mineral resources primarily from additions at Detour Lake, Odyssey and Hope Bay,” said Guy Gosselin, Agnico Eagle’s Executive Vice-President, Exploration. “The success of our 2025 exploration program reinforces our view that we have built the strongest project pipeline in the Company’s history, with exceptional exploration upside—arguably the best in the gold mining sector,” added Mr. Gosselin.

Highlights from 2025 include:

Gold mineral reserves increase to record level – Year-end 2025 gold mineral reserves increased by 2.1% to 55.4 million ounces of gold (1,330 million tonnes grading 1.30 grams per tonne (g/t) gold). The year-over-year increase in mineral reserves is due to a combination of mineral reserve replacement from operating mines and the initial declaration of mineral reserves at the Marban deposit in Malartic. At year-end 2025, measured and indicated mineral resources were up 9.6% to 47.1 million ounces (1,200 million tonnes grading 1.22 g/t gold) and inferred mineral resources were up 15.5% to 41.8 million ounces (522 million tonnes grading 2.49 g/t gold)
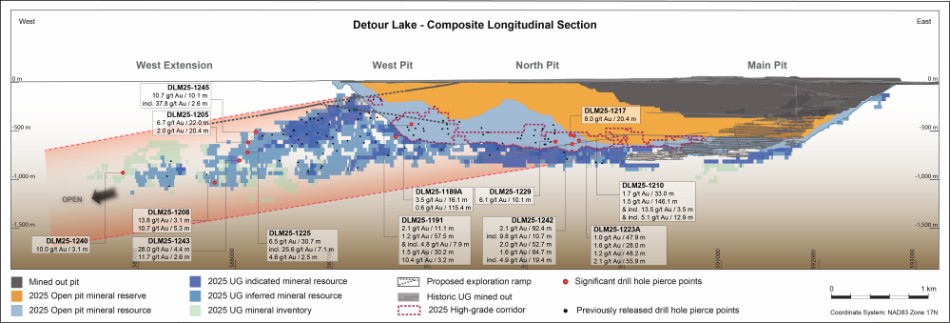
Detour Lake – The Companys exploration program continued to de-risk the Detour Lake underground project in the western plunge of the main orebody hosting the producing open pits. Conversion drilling further increased underground indicated mineral resources below the resources open pit to 3.47 million ounces of gold (52.9 million tonnes grading 2.04 g/t gold) at year-end while exploration drilling below and to the west of the open pit increased underground inferred mineral resources to 3.88 million ounces of gold (59.6 million tonnes grading 2.03 g/t gold) at year-end

1


Odyssey – Inferred mineral resources increased by 62% (2.8 million ounces of gold) year over year at the East Gouldie deposit to 7.4 million ounces of gold (94.3 million tonnes grading 2.43 g/t gold), including the Eclipse zone. The Odyssey mine now hosts a total of 6.03 million ounces of gold in proven and probable mineral reserves (59.7 million tonnes grading 3.14 g/t gold), 3.4 million ounces of gold in measured and indicated mineral resources (57.8 million tonnes grading 1.85 g/t gold) and 12.7 million ounces of gold in inferred mineral resources (177.7 million tonnes grading 2.21 g/t gold)
Marban – As part of the fill-the-mill strategy at Canadian Malartic, a technical evaluation was completed at the Marban deposit during the fourth quarter of 2025 that updated the probable mineral reserves to 1.58 million ounces of gold (51.6 million tonnes grading 0.95 g/t gold) at December 31, 2025. This is the first declaration of mineral reserves by the Company at Marban since the acquisition of O3 Mining Inc., which includes the Marban deposit, in March 2025
Hope Bay – Exploration drilling in 2025 totalled 131,208 metres and focused mainly on mineral resource expansion of the Madrid deposit following the exploration success at the Patch 7 zone during 2024 and 2025. The Patch 7 zone now hosts 1.0 million ounces of gold in indicated mineral resources (4.5 million tonnes grading 6.77 g/t gold) while inferred mineral resources have increased by 123% to 1.7 million ounces of gold (8.0 million tonnes grading 6.57 g/t gold)
Exploration guidance – In 2026, the Companys total exploration expenditures and project expenses are expected to be between $565 million and $635 million, with a mid-point of $600 million. This includes approximately $384 million for capitalized and expensed exploration, and approximately $216 million for advanced exploration project expenses, studies, and other corporate development activities. The Companys exploration focus remains on extending mine life at existing operations, testing near-mine opportunities and advancing key value driver projects. Priorities for 2026 include continued drilling of the Detour Lake underground project, assessing the full potential of the Canadian Malartic property, supporting regional synergies in Abitibi and exploring Hope Bay

2


GOLD MINERAL RESERVES

As at December 31, 2025, the Company’s proven and probable mineral reserve estimate totalled 55.4 million ounces of gold (1,330 million tonnes grading 1.30 g/t gold). This represents a 2.1% (1.16 million ounce) increase in contained ounces of gold compared to the proven and probable mineral reserve estimate of 54.3 million ounces of gold (1,277 million tonnes grading 1.32 g/t gold) at year-end 2024 (see the Company’s news release dated February 13, 2025 for details regarding the Company’s December 31, 2024 proven and probable mineral reserve estimate).

The increase in mineral reserves at December 31, 2025 is the result of the replacement of 3.0 million ounces of gold mined from operating assets, including Odyssey, Meliadine, LaRonde, Goldex, Fosterville and Macassa, combined with the acquisition of the Marban project, where initial mineral reserves were declared at year-end 2025.

A technical evaluation of the Marban deposit completed during the fourth quarter of 2025 resulted in new probable mineral reserves of 1.58 million ounces of gold (51.6 million tonnes grading 0.95 g/t gold) at December 31, 2025. The progress in mineral reserve development at Marban is the result of efforts by the Company to leverage regional synergies following the recent transactions to consolidate the Malartic camp at Canadian Malartic and advance the “fill-the-mill” strategy.

Mineral reserves were calculated using a gold price of $1,600 per ounce for most operating assets, with exceptions that include Detour Lake open pit using $1,500 per ounce; Amaruq and Pinos Altos using $2,000 per ounce; and variable assumptions for some other pipeline projects, including Marban and Wasamac using $1,650 per ounce. For detailed mineral reserves and mineral resources (“MRMR”) data, including the economic parameters used to estimate the mineral reserves and mineral resources and by-product silver, copper and zinc at mines and advanced projects, see “Detailed Mineral Reserves and Mineral Resources Data (as at December 31, 2025)” and “Assumptions used for the December 31, 2025 mineral reserve and mineral resource estimates reported by the Company” below.

The ore extracted from the Company’s mines in 2025 contained 3.74 million ounces of in-situ gold (65.5 million tonnes grading 1.78 g/t gold).

3


The Company’s gold mineral reserves as at December 31, 2025 are set out in the table below, and are compared with the gold mineral reserves as at December 31, 2024. Data in this table and certain other data in this news release have been rounded to the nearest thousand and discrepancies in total amounts are due to rounding.

Proven & Probable

Average Mineral Reserve

Gold Mineral Reserve (000s oz)

Gold Grade (g/t)

Operation / Project

  ​ ​ ​

2025

  ​ ​ ​

2024*

  ​ ​ ​

Change

  ​ ​ ​

2025

  ​ ​ ​

2024*

  ​ ​ ​

Change

LaRonde mine


1,959


2,081


(122)


5.73


6.03


(0.30)

LaRonde Zone 5


889


659


230


2.09


2.21


(0.12)

LaRonde Total


2,848


2,740


(108)


3.72


4.26


(0.54)

Canadian Malartic mine


1,449


1,944


(495)


0.77


0.81


(0.04)

Marban deposit


1,577


n/a


n/a


0.95


n/a


n/a

Odyssey deposit


327


317


10


2.12


2.27


(0.14)

East Gouldie


5,699


5,236


463


3.23


3.37


(0.15)

Canadian Malartic Total


9,052


7,497


1,555


1.66


1.83


(0.17)

Goldex


786


789


(2)


1.60


1.57


0.02

Akasaba West


112


138


(26)


0.92


0.90


0.03

Wasamac


1,377


1,377


2.90


2.90


Detour Lake (at or above 0.5 g/t)


14,954


15,636


(682)


0.93


0.93


Detour Lake (below 0.5 g/t)


3,621


3,415


206


0.38


0.39


(0.01)

Detour Lake Total


18,575


19,051


(476)


0.72


0.75


(0.02)

Macassa


1,883


1,829


54


8.84


10.50


(1.66)

Macassa Near Surface


10


12


(1)


3.84


5.31


(1.47)

AK deposit


306


233


73


4.53


4.71


(0.19)

Macassa Total


2,200


2,074


125


7.77


9.18


(1.42)

Upper Beaver


2,768


2,768


3.71


3.71


Hammond Reef


3,323


3,323


0.84


0.84


Amaruq


1,454


1,609


(155)


2.55


3.36


(0.81)

Meadowbank Total


1,454


1,609


(155)


2.55


3.36


(0.81)

Meliadine


3,622


3,365


257


5.10


5.29


(0.19)

Hope Bay


3,396


3,398


(2)


6.53


6.52


0.01

Fosterville


1,670


1,650


20


4.99


5.37


(0.38)

Kittila


3,319


3,400


(81)


4.17


4.16


0.01

Pinos Altos


269


433


(164)


1.80


1.94


(0.14)

San Nicolás (50%)**


672


672


0.40


0.40


Total Mineral Reserves


55,442


54,284


1,158


1.30


1.32


(0.03)


* See the Company’s news release dated February 13, 2025 for details regarding the metal price and currency assumptions for the Company’s December 31, 2024 proven and probable mineral reserve estimate.

** Agnico Eagle has committed to earn-in to a 50% interest in San Nicolás, which will be contributed as study and development costs are incurred and, accordingly, Agnico Eagle’s share of the reported MRMR at San Nicolás is reported at a 50% level.

The Company estimates that at a gold price 10% higher than the assumed gold price (leaving other assumptions unchanged), there would be an approximate 9.0% increase in the gold contained in proven and probable mineral reserves. Conversely, the Company estimates that at a gold price 10% lower than the assumed gold price (leaving other assumptions unchanged), there would be an approximate 8.7% decrease in the gold contained in proven and probable mineral reserves.

4


GOLD MINERAL RESOURCES

As at December 31, 2025, the Company’s measured and indicated mineral resource estimate totalled a record 47.1 million ounces of gold (1,200 million tonnes grading 1.22 g/t gold). This represents a 9.6% (4.1 million ounce) increase in contained ounces of gold and a 7% increase in grade compared to the measured and indicated mineral resource estimate at year-end 2024 (see the Company’s news release dated February 13, 2025 for details regarding the Company’s December 31, 2024 measured and indicated mineral resource estimate).

The year-over-year increase in measured and indicated mineral resources is primarily due to the conversion of inferred mineral resources into measured and indicated mineral resources at Detour Lake underground, LaRonde Zone 5 (“LZ5”) and Meliadine and to gold price-related revisions, partially offset by the upgrade of mineral resources to mineral reserves at Meliadine, Macassa, LZ5 and Fosterville.

At Detour Lake, the Company continued to convert inferred mineral resources into indicated mineral resources resulting in the addition of 1.9 million ounces of gold in measured and indicated mineral resources, which totalled 17.2 million ounces of gold (675 million tonnes grading 0.79 g/t gold) at year-end.

As at December 31, 2025, the Company’s inferred mineral resource estimate totalled a record 41.8 million ounces of gold (522 million tonnes grading 2.49 g/t gold). This represents a 15.5% (5.6 million ounces of gold) increase in contained ounces of gold compared to the inferred mineral resource estimate a year earlier (see the news release dated February 13, 2025 for details regarding the Company’s December 31, 2024 inferred mineral resource estimate).

The year-over-year increase in inferred mineral resources is primarily due to exploration drilling success at East Gouldie, Hope Bay and Detour Lake underground. The grade of the inferred mineral resources at year-end 2025 remained unchanged at 2.49 g/t gold compared to the prior year.

At the East Gouldie deposit, inferred mineral resources increased by 62% (2.8 million ounces of gold) year over year to 7.4 million ounces of gold (94.3 million tonnes grading 2.43 g/t gold) at year-end. In total, the Odyssey mine hosted 12.7 million ounces of gold in inferred mineral resources (177.7 million tonnes grading 2.21 g/t gold) at December 31, 2025.

At Hope Bay during 2025, continued exploration success in the Patch 7 zone at the Madrid deposit added 0.9 million ounces of gold of inferred mineral resources for a total of 1.7 million ounces of gold (8.0 million tonnes grading 6.57 g/t gold) in inferred mineral resources at the Patch 7 zone at year-end 2025 in addition to 1.0 million ounces of gold in indicated mineral resources (4.5 million tonnes grading 6.77 g/t gold). In total at Hope Bay, there were 3.2 million ounces of gold (16.9 million tonnes grading 5.98 g/t gold) in inferred mineral resources at year-end.

Mineral resources were calculated using a gold price of $2,000 per ounce for most operating assets, with exceptions that include $2,400 per ounce of gold used for Amaruq; $2,400 per ounce of gold and $28.00 per ounce of silver used for Pinos Altos; and variable assumptions for some other sites and pipeline projects. See “Assumptions used for the December 31, 2025 mineral reserve and mineral resource estimates reported by the Company” below for more details.

5


The Company’s gold mineral resources as at December 31, 2025 are set out in the table below.

Measured & Indicated

Inferred

Gold Mineral Resources

Gold Mineral Resources

  ​ ​ ​

Contained Gold

  ​ ​ ​

Gold Grade

  ​ ​ ​

Contained Gold

  ​ ​ ​

Gold Grade

Operation / Project

(000 oz)

(g/t)

(000 oz)

(g/t)

LaRonde mine


746


3.59


265


6.03

LaRonde Zone 5


1,506


1.93


1,127


3.00

LaRonde Total


2,251


2.28


1,392


3.32

Canadian Malartic mine


118


0.73

Marban deposit


63


0.51


376


1.56

Marban regional


614


1.27


410


1.11

Odyssey deposit


236


1.63


1,445


2.23

East Malartic


2,976


1.92


3,835


1.89

East Gouldie


230


1.42


7,372


2.43

Canadian Malartic Total


4,120


1.67


13,556


2.09

Goldex


1,727


1.60


842


1.46

Akasaba West


2


0.38


50


1.60

Akasaba regional


318


3.24

Wasamac


667


2.19


312


2.48

Detour Lake


17,157


0.79


6,168


1.73

Detour Lake Zone 58N


534


5.80


136


4.35

Detour Lake Total


17,691


0.81


6,304


1.75

Macassa


656


6.38


1,226


7.00

Macassa Near Surface


8


4.02


40


3.99

AK deposit


17


2.53


34


3.40

Macassa Total


681


6.10


1,299


6.66

Anoki-McBean


349


2.77


107


3.84

Upper Beaver


495


2.03


391


4.12

Upper Canada


817


2.30


2,211


2.85

Hammond Reef


2,298


0.54


Aquarius


856


2.15


14


3.59

Holt complex


1,699


4.52


1,310


4.48

Amaruq


1,336


3.65


783


4.10

Meliadine


2,244


3.39


2,478


5.23

Hope Bay


2,217


4.61


3,246


5.98

Fosterville


1,377


3.77


1,795


4.19

Northern Territory


1,455


2.15


1,512


2.47

Kittila


2,048


2.83


977


4.62

Barsele (55%)*


176


1.27


1,005


1.98

Pinos Altos


916


2.01


93


1.87

La India


89


0.52


Tarachi


361


0.58


4


0.52

Chipriona


287


0.77


26


0.63

El Barqueño Gold


335


1.24


349


1.12

San Nicolás (50%)**


20


0.19


10


0.13

Santa Gertrudis


563


0.91


1,433


2.36

Total Mineral Resources


47,076


1.22


41,815


2.49


* On January 28, 2026, Agnico Eagle entered into an agreement to sell its 55% interest in the Barsele project to Goldsky Resources Corp., with the closing of the transaction expected on or prior to June 30, 2026 (see the Company’s news release dated January 28, 2026).

6


** Agnico Eagle has committed to earn-in to a 50% interest in San Nicolás, which will be contributed as study and development costs are incurred and, accordingly, Agnico Eagle’s share of the reported MRMR at San Nicolás is reported at a 50% level.

The economic parameters used to estimate mineral reserves and mineral resources for all properties are set out below.

Assumptions used for the December 31, 2025 mineral reserve and mineral resource estimates reported by the Company

Metal Price for Mineral Reserve Estimation*

Gold ($/oz)

  ​ ​ ​

Silver ($/oz)

  ​ ​ ​

Copper ($/lb)

  ​ ​ ​

Zinc ($/lb)

$1,600

$24.00

$3.80

$1.20


* Exceptions: $1,350 per ounce of gold used for Hammond Reef; $1,500 per ounce of gold used for Detour Lake open pit; $1,650 per ounce of gold used for Wasamac and Marban; $2,000 per ounce of gold for Amaruq; $1,450 per ounce of gold and $3.75 per pound of copper used for Upper Beaver; $2,000 per ounce of gold and $27.00 per ounce of silver used for Pinos Altos; and $1,300 per ounce of gold, $20.00 per ounce of silver, $3.00 per pound of copper and $1.10 per pound of zinc used for San Nicolás.

Metal Price for Mineral Resource Estimation*

Gold ($/oz)

  ​ ​ ​

Silver ($/oz)

  ​ ​ ​

Copper ($/lb)

  ​ ​ ​

Zinc ($/lb)

$2,000

$25.00

$4.00

$1.30


* Exceptions: $1,200 per ounce of gold used for Holt complex; $1,300 per ounce of gold used for Detour Lake Zone 58N; $1,500 per ounce of gold used for Northern Territory; $1,533 per ounce of gold used for Barsele; $1,600 per ounce of gold used for Canadian Malartic; $1,650 per ounce of gold used for La India; $1,688 per ounce of gold used for Hammond Reef, Anoki-McBean and Tarachi; $1,750 per ounce of gold used for Upper Beaver, Wasamac and Aquarius; $1,800 per ounce of gold used for Marban; $1,900 per ounce of gold used for Marban Regional and Akasaba Regional; $2,400 per ounce of gold used for Amaruq; $1,688 per ounce of gold and $25.00 per ounce of silver used for Santa Gertrudis; $1,300 per ounce of gold, $20.00 per ounce of silver, $3.00 per pound of copper and $1.10 per pound of zinc used for San Nicolás; $2,400 per ounce of gold and $28.00 per ounce of silver used for Pinos Altos.

Exchange Rates*

C$ per US$1.00

  ​ ​ ​

MXN per US$1.00

  ​ ​ ​

A$ per US$1.00

  ​ ​ ​

€ per US$1.00

C$1.34

MXN18.00

A$1.52

€0.91


* Exceptions: exchange rate of C$1.25 per US$1.00 used for Holt complex and Detour Lake Zone 58N; US$1.15 per €1.00 used for Barsele; C$1.30 per US$1.00 used for Detour Lake open pit, Detour Lake underground, Hammond Reef and Anoki-McBean; and A$1.45 per US$1.00 used for Northern Territory.

The above metal price assumptions are all below the three-year historic averages (from January 1, 2023 to December 31, 2025) of approximately $2,606 per ounce of gold, $30.64 per ounce of silver, $4.32 per pound of copper and $1.26 per pound of zinc.

2026 EXPLORATION GUIDANCE

In 2026, the Company’s total exploration expenditures and project expenses are expected to be between $565 million and $635 million, with a mid-point of $600 million. The total exploration expenditures include estimated capitalized exploration of $310 million and estimated exploration and corporate development expenses of $290 million, which are comprised of $195.8 million for expensed exploration and $94.2 million for project technical evaluations, technical services and other corporate expenses.

The Company’s exploration focus remains on extending mine life at existing operations, testing near-mine opportunities and advancing key value driver projects. Exploration priorities for 2026 include mineral resource conversion and expansion at the Detour Lake underground project and East Gouldie at Canadian Malartic, and advancing Hope Bay.

7


The Company’s exploration and corporate development guidance and plans for individual mines and projects for 2026 are set out below.

2026 Exploration Program and Corporate Development Guidance

Expensed Exploration

Capitalized Exploration*

Sustaining

Development

  ​ ​ ​

($000s)

  ​ ​ ​

(000s m)

  ​ ​ ​

($000s)

  ​ ​ ​

($000s)

  ​ ​ ​

(000s m)

Quebec


  ​

LaRonde

$

12,500


23.8

$

3,800

$


20.9

Canadian Malartic


17,800


69.7


3,800


22,000


166.2

Goldex


2,300


15.8


2,300


4,300


50.0

Quebec regional


11,300


38.4


Ontario


  ​


  ​


  ​


  ​


  ​

Detour Lake


2,900


10.0


31,300


165.0

Detour Lake Underground


7,000


35.8

Macassa


2,500


34,000


202.0

Upper Beaver


4,100


10.5

Ontario regional


24,500


92.3


Nunavut


  ​


  ​


  ​


  ​


  ​

Meliadine


8,100


13,200


98.1

Meadowbank


11,300


26.5


1,300


6.4

Hope Bay


29,000


70.0


14,400


40.0

Nunavut regional


11,200


20.0


Australia


  ​


  ​


  ​


  ​


  ​

Fosterville


18,700


63.0


2,800


12,300


49.3

Northern Territory


8,000


48.6


Europe


  ​


  ​


  ​


  ​


  ​

Kittila


6,900


24.2


6,400


7,700


77.7

Europe regional


8,100


20.8


Mexico


  ​


  ​


  ​


  ​


  ​

Pinos Altos


2,200


9.0


3,100


16.5

Mexico regional


19,300


22.7


3,800


28.5

Other regions, joint ventures and G&A


9,800


Total Exploration Drilling

$

195,800


554.8

$

32,800

$

155,400


966.9

Upper Beaver


52,000


Detour Lake underground


62,000


Hope Bay


7,800


Other project studies


34,700


Total corporate development and technical services


59,500


Total Exploration Drilling and Project Expenses

$

290,000


554.8

$

32,800

$

277,200


966.9


* Capitalized exploration is a subset of capital expenditures which is a non-GAAP measure that is not a standardized financial measure under IFRS. See AEM Fourth Quarter and Full Year 2025 Results News Release dated February 12, 2026 under the caption “Note Regarding Certain Measures of Performance” for a description of the composition and usefulness of this non-GAAP measure and a reconciliation to additions to property, plant and mine development as set out in the consolidated statements of cash flows.

8


ABITIBI REGION – QUEBEC

CANADIAN MALARTIC

MRMR Highlights

Mineral reserves and mineral resources at the Odyssey mine continued to grow significantly in 2025, further demonstrating the high quality nature of the East Gouldie and Odyssey deposits. In total, the Odyssey mine hosted 6.0 million ounces of gold in proven and probable mineral reserves (59.7 million tonnes grading 3.14 g/t gold), 3.4 million ounces of gold in measured and indicated mineral resources (57.8 million tonnes grading 1.85 g/t gold) and 12.7 million ounces of gold in inferred mineral resources (177.7 million tonnes grading 2.21 g/t gold) at December 31, 2025. These substantial mineral reserves and mineral resources continue to support the Company’s vision for Canadian Malartic to potentially expand production in the future in combination with the development of satellite orebodies in the surrounding area.

At the Odyssey deposit’s Odyssey South zone and Odyssey internal zone, positive reconciliation observed in the underground production and improvements to the mineral reserve model contributed to mineral reserves replacement at the Odyssey mine reaching 90%. As a result, the mineral reserves of the Odyssey deposit totalled 0.3 million ounces of gold (4.8 million tonnes grading 2.12 g/t gold) at December 31, 2025, similar to the previous year.

At the Canadian Malartic mine, the continued positive reconciliation observed in the open pit and improvements to the mineral reserve model contributed to the addition of 115,000 ounces of gold to mineral reserves in the open pit during 2025. As a result, the mineral reserve decreased by approximately 495,000 ounces of gold while the gold production accounted for 610,000 in-situ ounces of gold.

Exploration drilling during 2025 continued to extend the limits of the East Gouldie inferred mineral resource laterally to the west and to the east. As a result, inferred mineral resources at the East Gouldie deposit (including the sub-parallel Eclipse zone) increased by 62% (2.8 million ounces of gold) year over year to 7.4 million ounces of gold (94.3 million tonnes grading 2.43 g/t gold) at December 31, 2025.

Drilling targeting the Eclipse zone in 2025 resulted in the declaration at year-end of initial inferred mineral resources of 0.6 million ounces of gold (6.7 million tonnes grading 2.74 g/t gold) for the Eclipse zone within close proximity to the planned underground infrastructure.

At the Marban deposit, located 12 kilometres northeast of the Canadian Malartic mill, a technical evaluation completed during the fourth quarter of 2025 that included pit-design optimization and lateral extension of the deposit resulted in the initial declaration by the Company of open pit probable mineral reserves of 1.58 million ounces of gold (51.6 million tonnes grading 0.95 g/t gold), 63 thousands ounces of gold in indicated mineral resources (3.9 million tonnes grading 0.51 g/t gold) and 0.4 million ounces of gold in inferred mineral resources (7.5 million tonnes grading 1.56 g/t gold) at year-end 2025. The rapid progress in mineral reserve development at Marban since its acquisition in March 2025 is the result of efforts by the Company to leverage regional synergies following the recent transactions to consolidate the Malartic camp at Canadian Malartic and advance the “fill-the-mill” strategy.

2025 Exploration Highlights

At Odyssey in 2025, exploration drilling totalled 233,754 metres supplemented by an additional 34,672 metres of drilling dedicated to regional exploration around Canadian Malartic.

Exploration drilling targeted multiple areas of the Odyssey mine, returning positive results in the eastern extension of the Odyssey South zone, the central, upper eastern, western and deeper areas of the East Gouldie deposit and in the Sheehan zone located west of the shaft.

9


Underground drilling in the upper eastern extension of the East Gouldie deposit was highlighted by hole UGED-071-029 intersecting 3.5 g/t gold over 19.8 metres at 1,010 metres depth, hole UGED-075-057 intersecting 4.9 g/t gold over 11.9 metres at 929 metres depth and hole UGED-095-004 intersecting 6.8 g/t gold over 9.3 metres at 990 metres depth. The results from this area of the deposit contributed to a large portion of the mineral reserves and inferred mineral resources added to East Gouldie at year-end 2025.

Selected recent drill intersections from Odyssey are set out in the composite longitudinal section below and in a table in the Appendix.

Graphic

[Odyssey – Composite Cross and Longitudinal Sections]

2026 Exploration Plan and Guidance

The Company expects to spend approximately $32.6 million for 190,700 metres of drilling at Canadian Malartic in 2026 with up to 20 drill rigs active at surface and underground to further assess the full potential of the Odyssey mine area and throughout the Canadian Malartic property package. The primary exploration targets remain the lateral extensions of the East Gouldie deposit and the Eclipse zone while at the Odyssey South and North zones infill drilling and the investigation of potential lateral extensions will continue. Studies are ongoing at the East Malartic deposit with the objective of converting mineral resources into mineral reserves as part of the Odyssey underground mine.

An additional $11 million for 45,000 metres of drilling will be spent in the Marban area for exploration and condemnation drilling around the Marban deposit under potential mining infrastructure, as well as for the purposes of mineral resource conversion and expansion of the Marban deposit.

LARONDE

MRMR Highlights

The LaRonde mine and LZ5 mine hosted a combined 2.8 million ounces of gold in proven and probable mineral reserves (23.8 million tonnes grading 3.72 g/t gold), 2.3 million ounces of gold in indicated mineral resources (30.7 million tonnes grading 2.28 g/t gold) and 1.4 million ounces of gold in inferred mineral resources (13.0 million tonnes grading 3.32 g/t gold) at December 31, 2025.

During 2025, positive results from conversion drilling and improvement to the mineral reserve models at LZ5 and the LaRonde mine added 110,000 ounces of gold and 296,000 ounces of gold in mineral reserves, respectively, more than replacing the production of 368,000 ounces of in-situ gold at LaRonde in 2025.

Conversion drilling and metal price revisions at LZ5 and the LaRonde mine also resulted in an increase of 48% in indicated mineral resources with the addition of a combined 729,000 ounces of gold while inferred mineral resources at LaRonde increased by 12%.

10


2025 Exploration Highlights

Exploration drilling totalled 43,390 metres at LaRonde in 2025, divided between the LZ5 area, the Bousquet 2-Dumagami area and the main LaRonde orebody at depth. The drilling continues to convert mineral resources below the main LZ5 orebody and into Zone 3-4. East of LaRonde shaft No. 1, conversion drilling in the Dumagami area also returned positive results showing potential lateral extension of mineralization. Previously released results also show growth potential laterally and at depth in the LaRonde 3 West mine and East mine areas, and in the 20N Zinc South zone.

2026 Exploration Plan and Guidance

The Company expects to spend approximately $16.3 million for 44,700 metres of drilling at LaRonde in 2026, including $3.7 million for 23,800 metres of expensed drilling and $3.8 million for 20,900 metres of capitalized drilling. Approximately $8.8 million of expensed exploration is budgeted in 2026 to extend the exploration drifts at levels 9 and 215 by a combined 1,000 metres this year to allow for the development of platforms for future exploration drilling programs.

GOLDEX

MRMR Highlights

Goldex, including Akasaba West, had 0.9 million contained ounces of gold in proven and probable mineral reserves (19.1 million tonnes grading 1.46 g/t gold), 1.7 million ounces of gold in measured and indicated mineral resources (33.7 million tonnes grading 1.59 g/t gold) and 0.9 million ounces of gold in inferred mineral resources (18.9 million tonnes grading 1.47 g/t gold) at December 31, 2025. The Company believes the mineral reserves are sufficient to sustain production until 2032 and provide an opportunity to test new exploration targets along under-explored trends and at depth.

In addition, Akasaba West hosted 19,451 tonnes of copper in proven and probable reserves (3.8 million tonnes grading 0.51% copper), 205 tonnes of copper in indicated mineral resources (0.1 million tonnes grading 0.16% copper) and 8,451 tonnes of copper in inferred mineral resources (1.0 million tonnes grading 0.88% copper) at December 31, 2025.

2026 Exploration Plan and Guidance

The Company expects to spend approximately $8.9 million for 65,800 metres of drilling at Goldex in 2026, including $6.6 million on capitalized drilling that will be mainly focused on the conversion and extension of the South and Deep 2 zones. The remaining $2.3 million is for 15,800 metres of exploration drilling, including testing multiple extensional targets laterally and at depth of the main mining areas.

Additionally, a regional exploration program will drill a total of 20,000 metres on the new Alpha and Akasaba properties, which were acquired as part of the acquisition of O3 Mining. Programs include validation and conversion drilling on the Bulldog deposit, located approximately 12 kilometres east of Goldex, and validation, conversion and expansion drilling at Akasaba and Akasaba West, located 22 kilometres east of Goldex

ABITIBI REGION – ONTARIO

DETOUR LAKE

MRMR Highlights

Detour Lake hosts the Company’s largest mineral reserves with 18.6 million ounces of gold (798 million tonnes grading 0.72 g/t gold) in open pit proven and probable mineral reserves at year-end 2025. A year-over-year decline in mineral reserves of 2% (0.5 million ounces of gold) is primarily due to the open pit production that extracted 771,000 ounces of in-situ gold.

During 2025, the Company continued to convert inferred mineral resources into indicated mineral resources at Detour Lake, resulting in the addition of 1.9 million ounces of gold to the measured and indicated mineral resources which totalled 17.2 million ounces of gold

11


(675 million tonnes grading 0.79 g/t gold) at December 31, 2025. From this total, 13.7 million ounces of gold (622 million tonnes grading 0.68 g/t gold) are located inside the resource pit and 3.5 million ounces of gold (52.9 million tonnes grading 2.04 g/t gold) are at underground depths below and to the west of the resource pit.

Exploration drilling further extended the underground inferred mineral resources to the west to a total of 3.88 million ounces of gold (59.5 million tonnes grading 2.03 g/t gold) at year end, representing a growth of 5% (0.2 million ounces of gold) net of the conversion of 1.6 million ounces of gold from inferred mineral resources to indicated mineral resources.

The drilling program in 2025 continued to delineate a subset of the above mineral resources with a gold cut-off grade of 1.20 g/t gold that is amenable to underground mining within, outside and to the west of the pit plunging towards the west at depth. At year-end, this high-grade mineralized corridor contained 5.5 million ounces of gold (86.0 million tonnes grading 2.00 g/t gold) of indicated mineral resources and 5.8 million ounces of gold (89.8 million tonnes grading 2.02 g/t gold) of inferred mineral resources.

2025 Exploration Highlights

At Detour Lake in 2025, exploration drilling totalled 214,668 metres for the full year. The program continued to expand and infill the mineralization below and to the west of the mineral resource pit.

In 2025, Domain 53 was tested through a high intensity drilling program from surface. It validated the continuity of the mineralization and improved the accuracy of the geological model. The investigation of Domain 54 is continuing with drilling from surface while the exploration ramp development is being advanced.

The development of the Detour Lake underground exploration ramp began in July 2025 and reached a length of 569 metres and a depth of 90 metres by year-end. The ramp will allow for the acceleration of the extraction from underground of the high-grade mineralization currently located to the west and within the mineral resources open pit. The ramp will also provide improved access to drill the mineralization located below and to the west of the open pit that exploration drilling has demonstrated extends laterally several kilometres to the west of the open pit outline and to a depth exceeding 1,200 metres below surface.

In the West Pit zone, recent drilling demonstrated the large thickness of the high-grade mineralized corridor at underground depths, highlighted by hole DLM25-1242 intersecting 2.1 g/t gold over 92.4 metres at 444 metres depth including 9.8 g/t gold over 10.7 metres at 431 metres depth; 2.0 g/t gold over 52.7 metres at 554 metres depth; 1.6 g/t gold over 84.7 metres at 617 metres depth; and 2.1 g/t gold over 92.4 metres at 444 metres depth including 4.9 g/t gold over 19.4 metres at 593 metres depth.

12


Drilling in the West Extension zone approximately 1.5 kilometres west of the resource-pit outline further extended the underground inferred mineral resources to the west with highlights of hole DLM25-1205 intersecting 6.7 g/t gold over 22.0 metres at 539 metres depth and 2.0 g/t gold over 20.4 metres at 605 metres depth and hole DLM25-1245 intersecting 10.7 g/t gold over 10.1 metres at 497 metres depth including 37.8 g/t gold over 2.6 metres at 501 metres depth.

Selected recent drill intersections from Detour Lake are set out in the composite longitudinal section below and in a table in the Appendix.

Graphic

[Detour Lake – Composite Longitudinal Section]

2026 Exploration Plan and Guidance

The Company expects to spend approximately $34.2 million for 175,000 metres of drilling at Detour Lake in 2026, including $31.3 million for 165,000 metres of capitalized drilling to continue converting the inferred mineral resources into indicated mineral resources as well as the mineral potential in the western extension of the orebody into inferred mineral resources.

For the Detour Lake underground project in 2026, an additional $7 million is budgeted for 35,800 metres of capitalized drilling and $62 million is budgeted for advancement of the exploration ramp and related infrastructure.

Surface diamond drilling is expected to continue mineral resource conversion in 2026 and the drill program will be augmented by underground drilling from new underground drill stations as they become available.

Approximately $2.9 million is budgeted for 10,000 metres of regional drilling in 2026 to explore satellite targets on the Company’s large land position on the Detour Lake property.

MACASSA

MRMR Highlights

The Macassa mine’s Main Break and SMC zones and the adjacent Near Surface and AK deposits together achieved 101% replacement of their mining depletion (a combined 321,000 ounces of in-situ gold mined) in mineral reserves in 2025.

The Macassa deposit continues to contain the Company’s highest-grade mineral reserves, with an average grade of 8.84 g/t of gold. Proven and probable mineral reserves at the Macassa mine and the Near Surface and AK deposits totalled 2.2 million ounces of gold (8.8 million tonnes grading 7.77 g/t gold) at year-end 2025.

13


2025 Exploration Highlights

At Macassa in 2025, all exploration drilling was performed from underground and totalled 210,679 metres, mostly testing the SMC and Main Break zones and the AK deposit. The SMC zone, the main source of ore at Macassa, continues to grow to the west towards #3 shaft and at depth in the #2 shaft and #4 shaft areas.

The Main Break mineralization is being extended to the east at approximately 2,000 metres below surface. Main Break remains the dominant gold-bearing structure in the Kirkland Lake camp. The mineral reserves and mineral resources at the AK deposit also increased due to positive drilling results.

2026 Exploration Plan and Guidance

The Company expects to spend approximately $36.5 million for 202,000 metres of capitalized drilling at Macassa in 2026 with the objective of increasing and upgrading mineral resources. The exploration program will continue to build the mineral resource base to the east in the SMC East and Main Break areas, to the west in the Lower/West SMC area and at shallower depths in the AK deposit.

The Company is also initiating a deep exploration program to investigate the potential mineralization down to 3,000 metres depth from a surface exploration drill platform, targeting the Main Break and other potential parallel structures below the former Lake Shore mine located 2,300 metres east of the #4 shaft at Macassa.

UPPER BEAVER

MRMR Highlights

The Upper Beaver project hosted 2.8 million ounces of gold and 54,930 tonnes of copper in probable mineral reserves (23.2 million tonnes grading 3.71 g/t gold and 0.24% copper), 0.5 million ounces of gold and 12,118 tonnes of copper in indicated mineral resources (7.6 million tonnes grading 2.03 g/t gold and 0.16% copper) and 0.4 million ounces of gold and 10,649 tonnes of copper in inferred mineral resources (3.0 million tonnes grading 4.12 g/t gold and 0.36% copper) at December 31, 2025.

2025 Exploration Highlights

The Company continued to accelerate project development at Upper Beaver through a phased approach to project de-risking that includes developing an exploration shaft to a depth of 760 metres and an exploration ramp to a depth of 160 metres that will be used to establish underground drilling platforms.

Development activities during 2025 continued to advance ahead of schedule. The exploration ramp progressed by 507 metres, reaching a depth of 70 metres at year-end, and shaft sinking began with the first blast completed in November to reach a depth of 155 metres by year‑end 2025.

A high‑intensity drilling program from surface began at Upper Beaver in 2025 and is ongoing. The program is similar in design to the high-intensity drilling program recently completed at Detour Lake that has contributed to improved planning for the potential development of underground mineral resources.

The high-intensity drilling program at Upper Beaver is targeting the lower level of the deposit, which is dominated by intrusion-suite host rocks, with the objective of validating the resource model and grade variability at greater depths in the most representative geological zones of the deposit.

Depending on the results, this high-intensity drilling program could replace a planned bulk sample at the 760metre level and has the potential to bring forward initial production to early 2030.

14


2026 Exploration Plan and Guidance

In 2026, the Company expects to spend approximately $56.1 million at Upper Beaver, including approximately $52 million on the exploration ramp, exploration shaft and the first bulk sample, and approximately $4.1 million for 10,500 metres of high-intensity drilling. The bulk sample will be taken from the ramp at a depth of 160 metres from the upper level of the deposit, which is dominated by basaltic host lithologies, and will provide material for testing selective mining assumptions in this area of the deposit.

Exploration results from recent years at Upper Beaver show the potential to increase the mineral resources and to convert inferred mineral resources at depth using underground access via the planned exploration shaft and ramp infrastructure.

Regional exploration will continue to develop and advance the pipeline of targets in the Kirkland Lake area.

HAMMOND REEF

Hammond Reef is a large Archean-age, shear-hosted disseminated gold deposit located in the Thunder Bay Mining District of Northwestern Ontario, with potential for development into an open pit operation with conventional milling. The 100%-owned project has received environmental approvals from both federal and provincial governments. Additional federal and provincial permits would be required to begin construction activities.

MRMR Highlights

Open pit probable mineral reserves at Hammond Reef total 3.3 million ounces of gold (123.5 million tonnes grading 0.84 g/t gold), measured mineral resources are 819,000 ounces of gold (47.1 million tonnes grading 0.54 g/t gold) and indicated mineral resources are 1.5 million ounces of gold (86.3 million tonnes grading 0.53 g/t gold) at December 31, 2025.

2025 Activity Highlights

Studies during 2025 continued to optimize the project and further advance the permits required for construction and operation. During the year, the Melema Lake property located approximately 9 kilometres east of the main Hammond Reef property was acquired by exercising the Company’s option. Exploration activities in 2025 included 6,200 metres of drilling on both the Hammond Reef and Melema Lake properties, complemented by prospecting, mapping and geophysical surveying.

2026 Exploration Plan and Guidance

Exploration work will continue to leverage the extensive database available on the Hammond Reef property to identify potential satellite mineralization in the vicinity of the main deposit. During 2026, $11.2 million is budgeted for project studies at Hammond Reef, to be potentially supplemented by exploration activities.

TIMMINS EAST

The 100%-owned Timmins East land package is a series of properties in northeastern Ontario totalling 53,388 hectares and covering a 100 km strike length. The land package has a complex exploration history dating back to at least the 1930s and hosts past-producing gold mines including Aquarius, Holt, Holloway, Hislop, and Taylor.

The Company maintains an active regional exploration office in Timmins that supports ongoing fieldwork, data integration and geological assessment across its Timmins East properties.

MRMR Highlights

Mineral resources for the Timmins East project are reported for the suspended Holt mine and mill complex and the Aquarius property. At underground depths, the Holt complex hosted 1.7 million ounces of gold in measured and indicated mineral resources (11.7 million tonnes grading 4.52 g/t gold) and 1.3 million ounces of gold in inferred mineral resources (9.1 million tonnes grading 4.48 g/t gold) at December 31, 2025. At open-pit depths, Aquarius hosted 0.9 million ounces of gold in indicated mineral resources (12.3 million tonnes

15


grading 2.15 g/t gold) and 14,000 ounces of gold in inferred mineral resources (0.1 million tonnes grading 3.56 g/t gold) at December 31, 2025.

2026 Exploration Plan and Guidance

Historical mining and exploration data across the property package will continue to be reviewed in 2026, including previously identified high-priority exploration targets at past-producing assets. The review will provide a ranking of exploration targets for potential limited diamond drilling with the objective of unlocking further value from this extensive land position in light of the higher gold price environment.

NUNAVUT

MELIADINE

MRMR Highlights

Meliadine hosted 3.6 million ounces of gold in proven and probable mineral reserves (22.1 million tonnes grading 5.10 g/t gold), 2.2 million ounces of gold in measured and indicated mineral resources (20.6 million tonnes grading 3.39 g/t gold) and 2.5 million ounces of gold in inferred mineral resources (14.7 million tonnes grading 5.23 g/t gold) at December 31, 2025.

Conversion drilling at Meliadine in 2025 added 496,000 ounces of gold to mineral reserves, primarily at the Tiriganiaq, Wesmeg, Wesmeg North and Pump deposits, resulting in an 8% increase in total mineral reserves year over year. This mineral reserve addition and price-related revisions offset the mining of 389,000 ounces of in-situ gold in 2025. Recent exploration results demonstrate that the deposits remain open at depth and laterally, supporting the potential for future growth in mineral resources and mineral reserves at Meliadine.

2025 Exploration Highlights

Exploration drilling totalled 105,144 metres at Meliadine in 2025, with work focused on exploration and infill drilling of inferred mineral resources at depth in the Wesmeg, Wesmeg North, Pump and Tiriganiaq deposits. Drilling also produced positive results beyond existing mineral resources in the eastern plunge and at depth of the main deposits.

2026 Exploration Plan and Guidance

The Company expects to spend approximately $21.3 million for 98,100 metres of capitalized drilling at Meliadine in 2026. The drilling will be focused on expanding and converting near-mine mineralization and testing multiple mineralized plunges at depth that remain open in the main deposits.

MEADOWBANK

MRMR Highlights

The Amaruq deposit at Meadowbank hosted 1.5 million ounces of gold in proven and probable mineral reserves (17.7 million tonnes grading 2.55 g/t gold), 1.3 million ounces of gold in indicated mineral resources (11.4 million tonnes grading 3.65 g/t gold) and 0.8 million ounces of gold in inferred mineral resources (5.9 million tonnes grading 4.10 g/t gold) at December 31, 2025.

The Company continued to extend the life-of-mine at Amaruq in 2025 with the addition of 389,000 ounces of gold in mineral reserves partly replacing the production depletion of 544,000 ounces of in-situ gold extracted in 2025.

16


2025 Exploration Highlights

Exploration drilling totalled 25,895 metres at Amaruq in 2025. The main objective was to de-risk the deep extensions of the Whale Tail deposit and to add mineral resources in support of a potential enhanced life-of-mine scenario. A conversion drilling program was also completed at the IVR deposit to add mineral resources to the potential enhanced life-of-mine scenario.

2026 Exploration Plan and Guidance

The Company expects to spend approximately $11.3 million for 26,500 metres of expensed exploration drilling and $1.3 million for 6,400 metres of capitalized drilling at Amaruq in 2026, focused on expanding mineral resources in the Kangislulik, Whale Tail and IVR areas and converting mineral resources in the Kangislulik and IVR areas.

HOPE BAY

MRMR Highlights

The total mineral reserves and mineral resources at Hope Bay now stand at 3.4 million ounces of gold in proven and probable mineral reserves (16.2 million tonnes grading 6.53 g/t gold), 2.2 million ounces of gold in indicated mineral resources (14.9 million tonnes grading 4.61 g/t gold) and 3.2 million ounces of gold in inferred mineral resources (16.9 million tonnes grading 5.98 g/t gold), as at December 31, 2025. At Hope Bay, the total inferred mineral resources ounces increased year over year by 40% and the gold grade increased by 10%, largely due to exploration success at the Patch 7 zone at the Madrid deposit.

The Patch 7 zone now hosts 1.0 million ounces of gold in indicated mineral resources (4.5 million tonnes grading 6.77 g/t gold) while inferred mineral resources have increased by 123% to 1.7 million ounces of gold (8.0 million tonnes grading 6.57 g/t gold).

2025 Exploration Highlights

Exploration drilling in 2025 at the Madrid deposit and in the regional program at Hope Bay totalled a combined 131,208 metres and focused mainly on mineral resource expansion of the Madrid deposit following the exploration success in the Patch 7 zone during 2024 and early 2025.

The program in 2025 returned multiple positive drill intercepts in the Patch 7 zone, resulting in mineral resource growth and the identification of several mineralized areas remaining open laterally and at depth beyond current mineral resources that will be investigated during follow-up exploration drilling.

Mineralization remains open to the north of the Patch 7 zone towards the Suluk zone, as highlighted by hole HBM25-401 returning 4.3 g/t gold over 7.1 metres at 609 metres depth in the Patch 7 zone and 7.7 g/t gold over 4.3 metres at 719 metres depth in the Suluk zone, and by hole HBM25-387A returning 46.1 g/t gold over 2.3 metres at 653 metres depth in the Suluk zone.

South of the Patch 7 zone beyond a sub-vertical diabase dike, mineralization remains open in an underexplored area that extends southwards by approximately one kilometre towards the Patch 14 zone. Highlight hole HBM25-395 in this area returned 5.2 g/t gold over 12.3 metres at 363 metres depth approximately 200 metres south of the diabase dike.

During the fourth quarter of 2025, excavation of the Naartok East exploration ramp at Madrid advanced by 656 metres and reached a depth of 100 metres at year-end. The 2.1-kilometre exploration ramp is expected to be developed to a depth of 100 metres to facilitate infill and expansion drilling along the Madrid zones. At Patch 7, the excavation of the portal of the dedicated exploration ramp also commenced.

17


Selected recent drill intersections from the Madrid deposit are set out in the composite longitudinal section below and in a table in the Appendix.

Graphic

[Madrid Deposit at Hope Bay – Composite Longitudinal Section]

2026 Exploration Plan and Guidance

The Company expects to spend approximately $43.4 million for 110,000 metres of drilling at Hope Bay in 2026, including $29.0 million for 70,000 metres of expensed drilling and $14.4 million for 40,000 metres of capitalized drilling for mineral resources conversion.

The main objectives in 2026 are to convert inferred mineral resources at Patch 7 into indicated mineral resources and to further test the entire Madrid deposit to expand and upgrade mineral resources. Results will be integrated into the technical evaluation of Hope Bay that is expected to be completed in the second quarter of 2026 and to contribute to a potential construction decision for Hope Bay in May 2026.

An additional $7.8 million of capitalized expenses in 2026 will be used to continue the exploration ramp development at the Madrid deposit and for technical evaluation.

AUSTRALIA

FOSTERVILLE

MRMR Highlights

Fosterville hosted 1.7 million ounces of gold in proven and probable mineral reserves (10.4 million tonnes grading 4.99 g/t gold), 1.4 million ounces of gold in indicated mineral resources (11.4 million tonnes grading 3.77 g/t gold) and 1.8 million ounces of gold in inferred mineral resources (13.3 million tonnes grading 4.19 g/t gold) at December 31, 2025.

Fosterville replaced 101% of mining depletion in 2025 with new mineral reserves. The replacement was achieved mainly through infill drilling in the Robbins Hill and South Phoenix zones. In total 170,000 ounces of gold were added to mineral reserves, offsetting the 168,000 ounces of in-situ gold that were depleted from mineral reserves by 2025 production.

The Company added 171,000 ounces of gold in underground indicated mineral resources at Fosterville, mainly due to exploration drilling and metal price revisions at the Robbins Hill and Phoenix zones and inferred mineral resources increased by 5% at year-end 2025.

18


The open-pit measured and indicated mineral resources and open-pit inferred mineral resources at Fosterville were removed from the “Detailed Mineral Reserves and Mineral Resources Data (as at December 31, 2025)” below, as there are no plans to mine the deposit using open pit methods.

2025 Exploration Highlights

At Fosterville in 2025, exploration drilling totalled 74,369 metres split between programs targeting the Cygnet, Swan, Cardinal and Harrier structures. At Robbins Hill, drilling tested the Curie, Ceruti and Wu zones.

2026 Exploration Plan and Guidance

The Company expects to spend approximately $15.1 million for 49,300 metres of capitalized drilling at Fosterville in 2026, focused on the extensions of mineral reserves and mineral resources at Lower Phoenix and Robbins Hill. An additional $18.7 million is budgeted for 63,000 metres of underground and surface expensed exploration to test new geological targets, including parallel faults and folds to the main Fosterville host structure, exploring for similar geological context to the Swan Zone structure.

The exploration program will include the assessment of the Fosterville tenement acquired from S2 Resources Ltd. on December 22, 2025. This tenement surrounds the Fosterville mine and provides prime exploration ground in the search for additional mineralized structures or the extensions of known gold-bearing structures.

NORTHERN TERRITORY

Agnico Eagle holds interests across 175,064 hectares in the Northern Territory of Australia, including 62,685 hectares under 100% ownership and a further 112,379 hectares through joint ventures, where the Company’s ownership ranges from 85% to 10%. The wholly-owned tenements include the Cosmo underground mine (closed in 2020), the Union Reefs processing facility (operations suspended in 2020) and regional exploration assets within the historic Pine Creek gold district.

MRMR Highlights

At open-pit depths, the Northern Territory assets host measured and indicated mineral resources of 0.8 million ounces of gold (16.5 million tonnes grading 1.45 g/t gold) and inferred mineral resources of 0.7 million ounces of gold (13.3 million tonnes grading 1.75 g/t gold) at December 31, 2025.

At underground depth, the Northern Territory assets host indicated mineral resources of 0.7 million ounces of gold (4.5 million tonnes grading 4.75 g/t gold) and inferred mineral resources of 0.8 million ounces of gold (5.8 million tonnes grading 4.11 g/t gold) at December 31, 2025.

2025 Activity Highlights

Agnico Eagle has continued to advance the proposed Union Reefs North development project at the Union Reefs site, with ongoing studies evaluating the project economics and potential redevelopment scenarios.

For exploration during 2025, the Company spent $4.1 million to complete 11,156 metres of expensed drilling at the Maud Creek, Pine Creek and Burnside projects.

2026 Exploration Plan and Guidance

During 2026, the Company expects to spend $8.0 million on exploration at the Northern Territory assets including 48,600 metres of expensed drilling to follow up on results from 2025 and investigate other targets with potential for mineral resource growth.

The current scenario analysis is focused on developing a decade-long sustainable ore supply from multiple sources to the Union Reefs processing facility with a potential upgrade of the processing facility to treat refractory ores.

19


FINLAND

KITTILA

MRMR Highlights

Kittila hosted 3.3 million ounces of gold in proven and probable mineral reserves (24.7 million tonnes grading 4.17 g/t gold), 2.0 million ounces of gold in measured and indicated mineral resources (22.5 million tonnes grading 2.83 g/t gold) and 1.0 million ounces of gold in inferred mineral resources (6.6 million tonnes grading 4.62 g/t) at December 31, 2025.

Conversion drilling in the Suuri, Roura Deep and Rimpi areas at Kittila resulted in the addition of 181,000 ounces of gold in mineral reserves before depletion to replace 68% of mining depletion by year-end 2025.

Approximately 149,000 ounces of gold, representing an 8% year-over-year increase in gold ounces, were added to the indicated mineral resources mainly due to a revision of cut-off grades.

2025 Exploration Highlights

Exploration and conversion drilling at Kittila totalled 90,025 metres in 2025 and mainly targeted the Main and Sisar zones in the northern and southern portions of the deposit at approximately 1.0 to 1.4 kilometres depth. The Roura area continued to grow at depth, and both the Suuri and Rimpi zones returned positive drill results between approximately 400 and 600 metres below surface, demonstrating the potential for lateral expansion at shallow depths of the Kittila deposit.

2026 Exploration Plan and Guidance

The Company expects to spend approximately $21.0 million for 101,900 metres of drilling at Kittila in 2026, focused on the Main zone in the Roura, Suuri and Rimpi areas as well as the Sisar zone. The drilling includes 77,700 metres of capitalized drilling.

MEXICO

PINOS ALTOS

2025 Exploration Highlights

At Pinos Altos in 2025, exploration drilling totalled 16,365 metres, focused on the Pinos Altos Deep project beneath the current underground mine as well as targeting areas beneath the known mineralization at Cubiro, Oberon de Weber, Cerro Colorado and Sinter.

2026 Exploration Plan and Guidance

The Company expects to spend approximately $5.3 million for 25,500 metres of capitalized and expensed exploration drilling at Pinos Altos in 2026.

About Agnico Eagle

Canadian-based and led, Agnico Eagle is Canada’s largest mining company and the second largest gold producer in the world, operating mines in Canada, Australia, Finland and Mexico. The Company is advancing a pipeline of high-quality development projects in these regions to support sustainable growth over the next decade. Agnico Eagle is a partner of choice within the mining industry, recognized globally for its leading sustainability practices. Agnico Eagle was founded in 1957 and has consistently created value for its shareholders, declaring a cash dividend every year since 1983.

20


About this News Release

Unless otherwise stated, references to “Canadian Malartic”, “Goldex”, “LaRonde” and “Meadowbank” are to the Company’s operations at the Canadian Malartic complex, the Goldex complex, the LaRonde complex and the Meadowbank complex, respectively. The Canadian Malartic complex consists of the mining, milling and processing operations at the Canadian Malartic mine and the mining operations at the Odyssey mine. The Goldex complex consists of the mining, milling and processing operations at the Goldex mine and the mining operations at the Akasaba West open pit mine. The LaRonde complex consists of the mining, milling and processing operations at the LaRonde mine and the mining and processing operations at LZ5. The Meadowbank complex consists of the milling and processing operations at the Meadowbank mine and the mining operations at the Amaruq open pit and underground mines. References to other operations are to the relevant mines, projects or properties, as applicable.

When used in this news release, the terms “including” and “such as” mean including and such as, without limitation.

The information contained on any website linked to or referred to herein (including the Company’s website) is not part of this news release.

Further Information

For further information regarding Agnico Eagle, contact Investor Relations at investor.relations@agnicoeagle.com or call (416) 947-1212.

Forward-Looking Statements

The information in this news release has been prepared as at February 12, 2026. Certain statements contained in this news release constitute “forward-looking statements” within the meaning of the United States Private Securities Litigation Reform Act of 1995 and “forward-looking information” under the provisions of Canadian provincial securities laws and are referred to herein as “forward-looking statements”. All statements, other than statements of historical fact, that address circumstances, events, activities or developments that could, or may or will occur are forward-looking statements. When used in this news release, the words “achieve”, “aim”, “anticipate”, “commit”, “could”, “estimate”, “expect”, “forecast”, “future”, “guide”, “plan”, “potential”, “schedule”, “target”, “track”, “will”, and similar expressions are intended to identify forward-looking statements. Such statements include the Company’s forward-looking guidance, including metal production, estimated ore grades, recovery rates, project timelines, drilling targets or results and life of mine estimates; the potential for additional gold production at the Company’s sites; the estimated timing and conclusions of the Company’s studies and evaluations; the methods by which ore will be extracted or processed; the Company’s expansion plans at Detour Lake, Upper Beaver and Odyssey, including the timing, funding, completion and commissioning thereof and the commencement of production therefrom; the Company’s plans at Hope Bay, Wasamac and San Nicolás; statements concerning other expansion projects, recovery rates, mill throughput, optimization efforts and projected exploration, including costs and other estimates upon which such projections are based; timing and amounts of exploration (including capital expenditures, other expenditures and other cash needs, and expectations as to the funding thereof); estimates of future mineral reserves and mineral resources; the projected development of certain ore deposits, including estimates of exploration, development and production and other capital costs and estimates of the timing of such exploration, development and production or decisions with respect to such exploration, development and production; estimates of mineral reserves and mineral resources and the effect of drill results, studies and evaluations on future mineral reserves and mineral resources; the Company’s ability to obtain the necessary permits and authorizations in connection with its proposed or current exploration, development and mining operations, including at Meliadine, Upper Beaver and San Nicolás, and the anticipated timing thereof; future exploration; the anticipated timing of events with respect to the Company’s mine sites; and anticipated trends with respect to the Company’s operations, exploration and the funding thereof. Such statements reflect the Company’s views as at the date of this news release and are subject to certain risks, uncertainties and assumptions, and undue reliance should not be placed on such statements. Forward-looking statements are necessarily based upon a number of factors and assumptions that, while considered reasonable by Agnico Eagle as of the date of such statements, are inherently subject to significant business, economic and competitive uncertainties and contingencies. The material factors and assumptions used in the preparation of the forward-looking statements contained herein, which may prove to be incorrect, include, but are not limited to, the assumptions set forth herein and in management’s discussion and analysis for the year ended December 31, 2025 (“MD&A”) and the Company’s Annual Information Form (“AIF”) for the year ended December 31, 2024 filed with Canadian securities regulators (and, when available, the Company’s AIF for the year ended December 31, 2025) with the U.S. Securities and Exchange Commission (the “SEC”), the Company’s news release dated February 12, 2026

21


announcing its full year 2025 results, as well as: that there are no significant disruptions affecting operations; that production, permitting, development, expansion and the ramp-up of operations at each of Agnico Eagle’s properties proceeds on a basis consistent with current expectations and plans; that the Company’s plans for its exploration, development and mining operations are not changed or amended in a material way; that the relevant metal prices, foreign exchange rates and prices for key mining and construction inputs (including labour and electricity) will be consistent with Agnico Eagle’s expectations; that the effect of tariffs and trade disputes will not materially affect the price or availability of the inputs the Company uses in its operations; that Agnico Eagle’s current estimates of mineral reserves, mineral resources, mineral grades and metal recovery are accurate; that there are no material delays in the timing for completion of ongoing growth projects; that seismic activity at the Company’s operations at LaRonde, Goldex, Fosterville and other properties is as expected by the Company and that the Company’s efforts to mitigate its effect on mining operations, including with respect to community relations, are successful; that the Company’s current plans to address climate change and reduce greenhouse gas emissions are successful; that the Company’s current plans to optimize production are successful; that there are no material variations in the current tax and regulatory environment; that governments, the Company or others do not take measures in response to pandemics or other health emergencies or otherwise that, individually or in the aggregate, materially affect the Company’s ability to operate its business or its productivity; and that measures taken relating to, or other effects of, pandemics or other health emergencies do not affect the Company’s ability to obtain necessary supplies and deliver them to its mine sites. Many factors, known and unknown, could cause the actual results to be materially different from those expressed or implied by such forward-looking statements. Such risks include, but are not limited to: the volatility of prices of gold and other metals; uncertainty of mineral reserves, mineral resources, mineral grades and mineral recovery estimates; uncertainty of future production, project development, capital expenditures and other costs; foreign exchange rate fluctuations; inflationary pressures; financing of additional capital requirements; cost of exploration and development programs; seismic activity at the Company’s operations, including at LaRonde, Goldex and Fosterville; mining risks; community protests, including by Indigenous groups; risks associated with foreign operations; risks associated with joint ventures; governmental and environmental regulation; the volatility of the Company’s stock price; risks associated with the Company’s currency, fuel and by-product metal derivative strategies; the current interest rate environment; the potential for major economies to encounter a slowdown in economic activity or a recession; the potential for increased conflict or hostilities in various regions, including Europe, South America and the Middle East; and the extent and manner of communicable diseases or outbreaks, and measures taken by governments, the Company or others to attempt to mitigate the spread thereof may directly or indirectly affect the Company. For a more detailed discussion of such risks and other factors that may affect the Company’s ability to achieve the expectations set forth in the forward-looking statements contained in this news release, see the AIF (and, when available, the AIF for the year ended December 31, 2025) and MD&A filed on SEDAR+ at www.sedarplus.ca and on EDGAR at www.sec.gov, as well as the Company’s other filings with the Canadian securities regulators and the SEC. Other than as required by law, the Company does not intend, and does not assume any obligation, to update these forward-looking statements.

Notes to Investors Regarding the Use of Mineral Resources

The mineral reserve and mineral resource estimates contained in this news release have been prepared in accordance with the Canadian Securities Administrators’ (the “CSA”) National Instrument 43-101 – Standards of Disclosure for Mineral Projects (“NI 43-101”).

The SEC’s disclosure requirements and policies for mining properties now more closely align with current industry and global regulatory practices and standards, including NI 43-101; however Canadian issuers that report in the United States using the Multijurisdictional Disclosure System (“MJDS”), such as the Company, may still use NI 43-101 rather than the SEC disclosure requirements when using the SEC’s MJDS registration statement and annual report forms. Accordingly, mineral reserve and mineral resource information contained in this news release may not be comparable to similar information disclosed by U.S. companies.

Investors are cautioned that while the SEC recognizes “measured mineral resources”, “indicated mineral resources” and “inferred mineral resources”, investors should not assume that any part or all of the mineral deposits in these categories will ever be converted into a higher category of mineral resources or into mineral reserves. These terms have a great amount of uncertainty as to their economic and legal feasibility. Accordingly, investors are cautioned not to assume that any “measured mineral resources”, “indicated mineral resources” or “inferred mineral resources” that the Company reports in this news release are or will be economically or legally mineable.

22


Further, “inferred mineral resources” have a great amount of uncertainty as to their existence and as to their economic and legal feasibility. It cannot be assumed that any part or all of an inferred mineral resource will ever be upgraded to a higher category. Under Canadian regulations, estimates of inferred mineral resources may not form the basis of feasibility or pre-feasibility studies, except in limited circumstances. Investors are cautioned not to assume that all or any part of an inferred mineral resource exists, or is or will ever be economically or legally mineable.

The mineral reserve and mineral resource data set out in this news release are estimates, and no assurance can be given that the anticipated tonnages and grades will be achieved or that the indicated level of recovery will be realized. The Company does not include equivalent gold ounces for by-product metals contained in mineral reserves in its calculation of contained ounces. Mineral reserves are not reported as a subset of mineral resources.

Scientific and Technical Information

The scientific and technical information contained in this news release relating to exploration activities has been approved by Guy Gosselin, Eng. and P.Geo., Executive Vice-President, Exploration and Olivier Grondin, P.Geo., Vice-President, Exploration; and relating to mineral reserves and mineral resources has been approved by Dyane Duquette, P.Geo., Vice-President, Mineral Resources Management, each of whom is a “Qualified Person” for the purposes of NI 43-101.

23


Detailed Mineral Reserves and Mineral Resources Data

Variances in down-adding and cross-adding are due to rounding

Mineral Reserves as at December 31, 2025

Operation / Project

Proven

Probable

Proven & Probable

Gold

  ​ ​ ​

Mining Method*

  ​ ​ ​

000 Tonnes

  ​ ​ ​

g/t

  ​ ​ ​

000 Oz Au

  ​ ​ ​

000 Tonnes

  ​ ​ ​

g/t

  ​ ​ ​

000 Oz Au

  ​ ​ ​

000 Tonnes

  ​ ​ ​

g/t

  ​ ​ ​

000 Oz Au

  ​ ​ ​

Recovery %**

LaRonde mine1

U/G

2,469

4.65

369

8,158

6.06

1,590

10,627

5.73

1,959

94.4

LaRonde Zone 52


U/G


6,405


2.02


415


6,800


2.17


474


13,205


2.09


889


94.5

LaRonde Total


8,874


2.75


784


14,959


4.29


2,064


23,832


3.72


2,848


  ​

Canadian Malartic mine3


O/P


36,896


0.50


597


21,697


1.22


852


58,594


0.77


1,449


88.8

Marban deposit4


O/P


51,618


0.95


1,577


51,618


0.95


1,577


90.0

Odyssey deposit5


U/G


29


2.37


2


4,758


2.12


325


4,787


2.12


327


95.0

East Gouldie6


U/G


54,943


3.23


5,699


54,943


3.23


5,699


94.4

Odyssey Mine Total


29


2.37


2


59,701


3.14


6,024


59,730


3.14


6,026


  ​

Canadian Malartic Total


36,925


0.50


599


133,016


1.98


8,453


169,941


1.66


9,052


  ​

Goldex7


U/G


6,255


1.48


298


9,065


1.68


488


15,320


1.60


786


85.9

Akasaba West8


O/P


969


0.82


26


2,807


0.96


86


3,777


0.92


112


77.6

Goldex Total


7,225


1.39


324


11,872


1.51


575


19,097


1.46


898


  ​

Wasamac


U/G


14,757


2.90


1,377


14,757


2.90


1,377


89.7

Quebec Total


53,023


1.00


1,707


174,603


2.22


12,468


227,626


1.94


14,175


  ​

Detour Lake (At or above 0.5 g/t)


O/P


66,690


1.08


2,313


434,448


0.90


12,641


501,138


0.93


14,954


88.4

Detour Lake (Below 0.5 g/t)


O/P


53,681


0.42


722


243,242


0.37


2,899


296,923


0.38


3,621


88.4

Detour Lake Total9


120,371


0.78


3,035


677,690


0.71


15,540


798,061


0.72


18,575


  ​

Macassa10


U/G


612


10.43


205


6,013


8.68


1,678


6,625


8.84


1,883


95.9

Macassa Near Surface11


U/G


3


2.11


80


3.91


10


84


3.84


10


93.5

AK deposit12


U/G


126


4.35


18


1,975


4.54


288


2,101


4.53


306


93.5

Macassa Total


742


9.36


223


8,068


7.62


1,976


8,810


7.77


2,200


  ​

Upper Beaver


O/P


3,235


1.82


189


3,235


1.82


189


95.5

Upper Beaver


U/G


19,946


4.02


2,579


19,946


4.02


2,579


95.5

Upper Beaver Total13


23,181


3.71


2,768


23,181


3.71


2,768


  ​

Hammond Reef14


O/P


123,473


0.84


3,323


123,473


0.84


3,323


89.8

Ontario Total


121,113


0.84


3,258


832,412


0.88


23,607


953,524


0.88


26,865


  ​

Amaruq


O/P


8,048


1.26


327


7,364


3.17


750


15,412


2.17


1,077


90.5

Amaruq


U/G


81


4.22


11


2,221


5.12


366


2,302


5.09


377


90.5

Meadowbank Total15


8,129


1.29


338


9,585


3.62


1,116


17,714


2.55


1,454


  ​

Meliadine


O/P


1,142


4.24


156


4,291


3.64


503


5,433


3.77


658


96.0

Meliadine


U/G


2,962


6.32


602


13,680


5.37


2,362


16,642


5.54


2,964


96.0

Meliadine Total16


4,104


5.74


757


17,971


4.96


2,864


22,075


5.10


3,622


  ​

Hope Bay17


U/G


93


6.77


20


16,086


6.53


3,376


16,178


6.53


3,396


87.5

Nunavut Total


12,325


2.82


1,116


43,642


5.24


7,356


55,967


4.71


8,472


  ​

Fosterville18


U/G


887


5.41


154


9,516


4.95


1,516


10,403


4.99


1,670


92.0

Australia Total


887


5.41


154


9,516


4.95


1,516


10,403


4.99


1,670


  ​

Kittila19


U/G


931


4.66


140


23,818


4.15


3,179


24,749


4.17


3,319


86.0

Europe Total


931


4.66


140


23,818


4.15


3,179


24,749


4.17


3,319


24


Operation / Project

Proven

Probable

Proven & Probable


Mining

  ​ ​ ​

000

  ​ ​ ​

  ​ ​ ​

  ​ ​ ​

  ​ ​ ​

  ​ ​ ​

Oz Au

  ​ ​ ​

000

  ​ ​ ​

  ​ ​ ​

  ​ ​ ​

Recovery


Gold

Method*

Tonnes

g/t

000 Oz Au

000 Tonnes

g/t

000

Tonnes

g/t

000 Oz Au

%**


Pinos Altos


O/P


26


0.60


1


1,629


1.00


53


1,656


1.00


53


93.6

Pinos Altos


U/G


633


2.06


42


2,374


2.29


175


3,007


2.24


216


94.2

Pinos Altos Total20


  ​


659


2.00


42


4,003


1.76


227


4,662


1.80


269


  ​

San Nicolás (50%)21


O/P


23,858


0.41


314


28,761


0.39


358


52,619


0.40


672


17.6

Mexico Total


  ​


24,517


0.45


357


32,764


0.56


585


57,281


0.51


941


  ​

Total Gold


  ​


212,796


0.98


6,731


1,116,755


1.36


48,711


1,329,551


1.30


55,442


  ​

Operation / Project

Proven

Probable

Proven & Probable


Mining


000


Oz Au


000


Recovery

Silver

  ​ ​ ​

Method*

  ​ ​ ​

Tonnes

  ​ ​ ​

g/t

  ​ ​ ​

000 Oz Ag

  ​ ​ ​

000 Tonnes

  ​ ​ ​

g/t

  ​ ​ ​

000

  ​ ​ ​

Tonnes

  ​ ​ ​

g/t

  ​ ​ ​

000 Oz Ag

  ​ ​ ​

%**

LaRonde mine


U/G


2,469


10.46


830


8,158


20.75


5,443


10,627


18.36


6,273


78.1

Pinos Altos


O/P


26


8.57


7


1,629


34.82


1,824


1,656


34.40


1,831


44.5

Pinos Altos


U/G


633


45.29


922


2,374


27.30


2,083


3,007


31.09


3,005


50.0

Pinos Altos Total


  ​


659


43.81


929


4,003


30.36


3,907


4,662


32.26


4,836


  ​

San Nicolás (50%)


O/P


23,858


23.93


18,356


28,761


20.91


19,333


52,619


22.28


37,689


38.6

Total Silver


  ​


26,986


23.18


20,116


40,923


21.80


28,682


67,909


22.35


48,798


  ​

Operation / Project

Proven

Probable

Proven & Probable


Mining


000


  ​


  ​


000


  ​


Recovery

Copper

  ​ ​ ​

Method*

  ​ ​ ​

Tonnes

  ​ ​ ​

%

  ​ ​ ​

Tonnes Cu

  ​ ​ ​

000 Tonnes

  ​ ​ ​

%  

  ​ ​ ​

Tonnes Cu

  ​ ​ ​

Tonnes

  ​ ​ ​

%

  ​ ​ ​

Tonnes Cu

%**

LaRonde mine


U/G


2,469


0.17


4,081


8,158


0.30


24,751


10,627


0.27


28,831


82.8

Akasaba West


O/P


969


0.48


4,640


2,807


0.53


14,810


3,777


0.51


19,451


79.0

Upper Beaver


O/P


3,235


0.14


4,477


3,235


0.14


4,477


79.2

Upper Beaver


U/G


19,946


0.25


50,453


19,946


0.25


50,453


79.2

Upper Beaver Total


  ​


23,181


0.24


54,930


23,181


0.24


54,930


  ​

San Nicolás (50%)


O/P


23,858


1.26


299,809


28,761


1.01


291,721


52,619


1.12


591,530


78.2

Total Copper


  ​


27,296


1.13


308,530


62,908


0.61


386,213


90,204


0.77


694,743


  ​

Operation / Project

Proven

Probable

Proven & Probable


Mining


000


  ​


  ​


000


  ​


Recovery

Zinc

  ​ ​ ​

Method*

  ​ ​ ​

Tonnes

  ​ ​ ​

%  

  ​ ​ ​

Tonnes Zn

  ​ ​ ​

000 Tonnes

  ​ ​ ​

%

  ​ ​ ​

Tonnes Zn

  ​ ​ ​

Tonnes

  ​ ​ ​

%

  ​ ​ ​

Tonnes Zn

  ​ ​ ​

%**

LaRonde mine


U/G


2,469


0.36


8,951


8,158


1.09


88,811


10,627


0.92


97,762


70.2

San Nicolás (50%)


O/P


23,858


1.61


383,313


28,761


1.37


394,115


52,619


1.48


777,428


80.9

Total Zinc


  ​


26,327


1.49


392,263


36,920


1.31


482,926


63,246


1.38


875,190


  ​


* Open Pit (“O/P”), Underground (“U/G”)

** Represents metallurgical recovery percentage

1 LaRonde mine: Net smelter value cut-off varies according to mining type and depth, not less than C$95/t for LP1 (Area 11-3) and not less than C$228/t for LaRonde.

2 LaRonde Zone 5: Gold cut-off grade varies according to stope size and depth, not less than 1.46 g/t.

3 Canadian Malartic: Gold cut-off grade is 0.35 g/t.

4 Marban deposit: Gold cut-off grade is 0.31 g/t.

5 Odyssey deposit: Gold cut-off grade varies according to mining zone and depth, not less than 1.44 g/t.

6 East Gouldie: Gold cut-off grade not less than 1.57 g/t.

7 Goldex: Gold cut-off grade varies according to mining type and depth, not less than 1.00 g/t.

8 Akasaba West: Net smelter value cut-off varies, not less than C$33.28/t.

9 Detour Lake: Gold cut-off grade is 0.27 g/t.

10 Macassa: Gold cut-off grade varies according to mining type, not less than 3.35 g/t for long hole method and 3.78 g/t for cut and fill method.

11 Macassa Near Surface deposit: Gold cut-off grade not less than 2.10 g/t.

12 Amalgamated Kirkland (“AK”) deposit: Gold cut-off grade not less than 2.10 g/t.

13 Upper Beaver: Net smelter value cut-off varies according to mining type, not less than C$118.17/t for underground and C$43.49/t for open pit.

14 Hammond Reef: Gold cut-off grade is 0.41 g/t.

15 Amaruq: Gold cut-off grade varies according to mining type, not less than 0.98 g/t for open pit mineral reserves and 3.05 g/t for underground mineral reserves (gold cut-off grade for marginal underground mineral reserves from development is 1.17 g/t).

25


16 Meliadine: Gold cut-off grade varies according to mining type, not less than 1.50 g/t for open pit mineral reserves and 3.90 g/t for underground mineral reserves (gold cut-off grade for marginal underground mineral reserves from development is 1.50 g/t).

17 Hope Bay: Gold cut-off grade not less than 4.00 g/t.

18 Fosterville: Gold cut-off grade varies according to mining zone and type, not less than 3.00 g/t.

19 Kittila: Gold cut-off grade varies according to haulage distance, not less than 2.63 g/t.

20 Pinos Altos: Net smelter value cut-off varies according to mining zone and type, not less than C$25.44/t for open pit mineral reserves and US$85.97/t for the underground mineral reserves.

21 San Nicolás (50%): Net smelter return cut-off values for low zinc/copper ore of $9.71/t and for high zinc/copper ore of $13.15/t.

Mineral Resources as at December 31, 2025

Operation / Project

Measured

Indicated

Measured & Indicated

Inferred

Gold

  ​ ​ ​

Mining Method

  ​ ​ ​

000 Tonnes

  ​ ​ ​

g/t

  ​ ​ ​

000 Oz Au

  ​ ​ ​

000 Tonnes

  ​ ​ ​

g/t

  ​ ​ ​

000 Oz Au

  ​ ​ ​

000  Tonnes

  ​ ​ ​

g/t

  ​ ​ ​

000  Oz Au

  ​ ​ ​

000  Tonnes

  ​ ​ ​

g/t

  ​ ​ ​

000 Oz Au


LaRonde mine

U/G

6,457

3.59

746

6,457

3.59

746

1,366

6.03

265


LaRonde Zone 5

U/G

24,207

1.93

1,506

24,207

1.93

1,506

11,677

3.00

1,127


LaRonde Total

30,664

2.28

2,251

30,664

2.28

2,251

13,043

3.32

1,392


Canadian Malartic mine


O/P


5,011


0.73


118

Marban deposit


O/P


3,875


0.51


63


3,875


0.51


63


2,956


0.66


63

Marban deposit


U/G


4,544


2.14


313

Marban regional


O/P


14,794


1.22


582


14,794


1.22


582


11,272


1.08


390

Marban regional


U/G


296


3.36


32


296


3.36


32


183


3.37


20

Odyssey deposit


U/G


4,493


1.63


236


4,493


1.63


236


20,176


2.23


1,445

East Malartic


U/G


48,216


1.92


2,976


48,216


1.92


2,976


63,275


1.89


3,835

East Gouldie


U/G


5,048


1.42


230


5,048


1.42


230


94,278


2.43


7,372

Odyssey Mine Total


57,757


1.85


3,442


57,757


1.85


3,442


177,729


2.21


12,652

Canadian Malartic Total


76,723


1.67


4,120


76,723


1.67


4,120


201,694


2.09


13,556

Goldex


U/G


12,360


1.86


739


21,245


1.45


988


33,604


1.60


1,727


17,951


1.46


842

Akasaba West


O/P


130


0.38


2


130


0.38


2


Akasaba West


U/G


966


1.60


50

Goldex Total


12,360


1.86


739


21,374


1.44


989


33,734


1.59


1,728


18,917


1.47


892

Akasaba regional


U/G


3,052


3.24


318

Wasamac


U/G


9,479


2.19


667


9,479


2.19


667


3,911


2.48


312

Quebec Total


12,360


1.86


739


138,241


1.81


8,027


150,601


1.81


8,766


240,618


2.13


16,469

Detour Lake


O/P


35,300


1.16


1,312


587,007


0.66


12,373


622,307


0.68


13,685


51,442


1.38


2,290

Detour Lake


U/G


52,924


2.04


3,472


52,924


2.04


3,472


59,549


2.03


3,878

Detour Lake Zone 58N


U/G


2,868


5.80


534


2,868


5.80


534


973


4.35


136

Detour Lake Total


35,300


1.16


1,312


642,798


0.79


16,379


678,098


0.81


17,691


111,964


1.75


6,304

Macassa


U/G


379


10.30


125


2,818


5.85


530


3,197


6.38


656


5,448


7.00


1,226

Macassa Near Surface


U/G


59


4.02


8


59


4.02


8


309


3.99


40

AK deposit


U/G


212


2.53


17


212


2.53


17


308


3.40


34

Macassa Total


379


10.30


125


3,090


5.59


555


3,469


6.10


681


6,066


6.66


1,299

Aquarius


O/P


12,364


2.15


856


12,364


2.15


856


122


3.59


14

Holt complex


U/G


5,806


4.29


800


5,884


4.75


898


11,690


4.52


1,699


9,097


4.48


1,310

Anoki-McBean


U/G


3,919


2.77


349


3,919


2.77


349


867


3.84


107

Upper Beaver


O/P


54


0.87


2


54


0.87


2


Upper Beaver


U/G


7,510


2.04


493


7,510


2.04


493


2,953


4.12


391

Upper Beaver Total


7,564


2.03


495


7,564


2.03


495


2,953


4.12


391

Upper Canada


O/P


1,477


1.66


79


1,477


1.66


79


1,408


1.47


66

Upper Canada


U/G


9,546


2.40


738


9,546


2.40


738


22,736


2.93


2,145

Upper Canada Total


11,024


2.30


817


11,024


2.30


817


24,143


2.85


2,211

Hammond Reef


O/P


47,063


0.54


819


86,304


0.53


1,478


133,367


0.54


2,298


Ontario Total


88,548


1.07


3,057


772,946


0.88


21,829


861,494


0.90


24,885


155,212


2.33


11,636

26


Operation / Project

  ​ ​ ​

Measured

  ​ ​ ​

Indicated

  ​ ​ ​

Measured & Indicated

  ​ ​ ​

Inferred

Gold

  ​ ​ ​

Mining Method

  ​ ​ ​

000 Tonnes

  ​ ​ ​

g/t

  ​ ​ ​

000 Oz Au

  ​ ​ ​

000 Tonnes

  ​ ​ ​

g/t

  ​ ​ ​

000 Oz Au

  ​ ​ ​

000 Tonnes

  ​ ​ ​

g/t

  ​ ​ ​

000 Oz Au

  ​ ​ ​

000 Tonnes

  ​ ​ ​

g/t

  ​ ​ ​

000 Oz Au

Amaruq

O/P

2,488

3.03

242

2,488

3.03

242

190

2.87

18

Amaruq


U/G


8,887


3.83


1,094

8,887


3.83


1,094

5,750


4.14


765

Meadowbank Total


11,374

3.65


1,336


11,374

3.65


1,336


5,940

4.10


783

Meliadine


O/P

288


2.82


26

5,705


2.72


499

5,994


2.73


525

710


4.22


96

Meliadine


U/G

1,662


3.80


203

12,928


3.65


1,515

14,590


3.66


1,719

14,036


5.28


2,382

Meliadine Total


1,951

3.66


229


18,634

3.36


2,015


20,584

3.39


2,244


14,746

5.23


2,478

Hope Bay


U/G


14,946


4.61


2,217

14,946


4.61


2,217

16,868


5.98


3,246

Nunavut Total


1,951

3.66


229


44,954

3.85


5,567


46,905

3.84


5,797


37,555

5.39


6,507

Fosterville


U/G

651


4.06


85

10,702


3.76


1,293

11,353


3.77


1,377

13,328


4.19


1,795

Northern Territory


O/P

337


3.72


40

16,203


1.41


732

16,539


1.45


772

13,255


1.75


745

Northern Territory


U/G


4,470


4.75


683

4,470


4.75


683

5,807


4.11


767

Northern Territory Total


337

3.72


40


20,672

2.13


1,415


21,009

2.15


1,455


19,062

2.47


1,512

Australia Total


987

3.94


125


31,374

2.68


2,707


32,362

2.72


2,832


32,391

3.18


3,307

Kittila


O/P


373


3.89


47

Kittila


U/G

4,669


2.87


431

17,874


2.81


1,617

22,544


2.83


2,048

6,209


4.66


930

Kittilä Total


4,669

2.87


431


17,874

2.81


1,617


22,544

2.83


2,048


6,582

4.62


977

Barsele (55%)


O/P


3,178


1.08


111

3,178


1.08


111

2,260


1.25


91

Barsele (55%)


U/G


1,158


1.77


66

1,158


1.77


66

13,552


2.10


914

Barsele (55%) Total1


4,335

1.27


176


4,335

1.27


176


15,811

1.98


1,005

Europe Total


4,669

2.87


431


22,210

2.51


1,794


26,879

2.57


2,224


22,393

2.75


1,982

Pinos Altos


O/P


1,530


0.90


44

1,530


0.90


44

154


0.57


3

Pinos Altos


U/G


12,659


2.14


872

12,659


2.14


872

1,378


2.04


90

Pinos Altos Total


14,189

2.01


916


14,189

2.01


916


1,533

1.89


93

La India


O/P

4,478


0.52


74

880


0.53


15

5,358


0.52


89


San Nicolás (50%)


O/P

261


0.08


1

3,037


0.20


19

3,297


0.19


20

2,468


0.13


10

Tarachi


O/P


19,290


0.58


361

19,290


0.58


361

242


0.52


4

Chipriona


O/P


11,652


0.77


287

11,652


0.77


287

1,284


0.63


26

El Barqueño Gold


O/P


8,431


1.24


335

8,431


1.24


335

9,696


1.12


349

Santa Gertrudis


O/P


19,267


0.91


563

19,267


0.91


563

9,819


1.36


429

Santa Gertrudis


U/G


9,079


3.44


1,004

Santa Gertrudis Total


19,267

0.91


563


19,267

0.91


563


18,898

2.36


1,433

Total Mexico


4,739

0.49


75


76,746

1.01


2,496


81,485

0.98


2,571


34,120

1.75


1,915

Total Gold


113,254

1.28


4,656


1,086,470

1.21


42,420


1,199,724

1.22


47,076


522,289

2.49


41,815

Operation / Project

Measured

Indicated

Measured & Indicated

Inferred

Silver


Mining Method

000 Tonnes


g/t


000 Oz Ag

000 Tonnes


g/t


000 Oz Ag

000 Tonnes


g/t


000 Oz Ag

000 Tonnes


g/t


000 Oz Ag

LaRonde mine


U/G


6,457


14.92


3,097

6,457


14.92


3,097

1,366


15.50


680

Pinos Altos


O/P


1,530


20.28


997

1,530


20.28


997

154


13.90


69

Pinos Altos


U/G


12,659


54.77


22,294

12,659


54.77


22,294

1,378


48.42


2,146

Pinos Altos Total


14,189

51.05


23,291


14,189

51.05


23,291


1,533

44.95


2,215

La India


O/P

4,478


2.72


391

880


2.58


73

5,358


2.70


464


San Nicolás (50%)


O/P

261


6.40


54

3,037


11.86


1,158

3,297


11.43


1,211

2,468


9.26


735

Chipriona


O/P


11,652


100.69


37,722

11,652


100.69


37,722

1,284


76.97


3,176

El Barqueño Silver


O/P


4,462


121.28


17,399

El Barqueño Gold


O/P


8,431


5.15


1,396

8,431


5.15


1,396

9,696


16.00


4,989

Santa Gertrudis


O/P


19,267


3.66


2,269

19,267


3.66


2,269

9,819


1.85


585

Santa Gertrudis


U/G


9,079


23.31


6,803

Santa Gertrudis Total


19,267

3.66


2,269


19,267

3.66


2,269


18,898

12.16


7,389

Total Silver


4,739

2.92


445


63,913

33.58


69,005


68,652

31.47


69,450


39,705

28.66


36,582

Operation / Project

Measured

Indicated

Measured & Indicated

Inferred

Copper


Mining Method

000 Tonnes


%  

Tonnes Cu

000 Tonnes


%

Tonnes Cu

000 Tonnes


  ​

%  

Tonnes Cu

000 Tonnes


%

Tonnes Cu

LaRonde mine


U/G


6,457


0.15


9,387

6,457


0.15


9,387

1,366


0.26


3,526

Akasaba West


O/P


130


0.16


205

130


0.16


205


Akasaba West


U/G


966


0.88


8,451

Akasaba West Total


130

0.16


205


130

0.16


205


966

0.88


8,451

Upper Beaver


O/P


54


0.10


56

54


0.10


56


Upper Beaver


U/G


7,510


0.16


12,063

7,510


0.16


12,063

2,953


0.36


10,649

Upper Beaver Total


7,564

0.16


12,118


7,564

0.16


12,118


2,953

0.36


10,649

San Nicolás (50%)


O/P

261


1.35


3,526

3,037


1.17


35,489

3,297


1.18


39,015

2,468


0.94


23,144

Chipriona


O/P


11,652


0.16


18,768

11,652


0.16


18,768

1,284


0.11


1,377

El Barqueño Gold


O/P


8,431


0.21


17,650

8,431


0.21


17,650

9,696


0.22


21,555

El Barqueño Silver


O/P


4,462


0.04


1,852

Total Copper


261

1.35


3,526


37,270

0.25


93,617


37,531

0.26


97,143


23,193

0.30


70,555

Operation / Project

Measured

Indicated

Measured & Indicated

Inferred

Zinc


Mining Method

000 Tonnes


%  

Tonnes Zn

000 Tonnes


%

Tonnes Zn

000 Tonnes


%

Tonnes Zn

000 Tonnes


%

Tonnes Zn

LaRonde mine


U/G


6,457


0.98


63,087

6,457


0.98


63,087

1,366


0.43


5,856

San Nicolás (50%)


O/P

261


0.39


1,012

3,037


0.71


21,618

3,297


0.69


22,630

2,468


0.62


15,355

Chipriona


O/P


11,652


0.87


101,211

11,652


0.87


101,211

1,284


0.72


9,178

Total Zinc


261

0.39


1,012


21,146

0.88


185,916


21,407

0.87


186,928


5,117

0.59


30,389


* Open Pit (“O/P”), Underground (“U/G”)

27


The assumptions for metal prices and currency exchange rates used for the December 31, 2025 mineral reserve and mineral resource estimates reported by the Company are presented in the “Gold Mineral Resources” section earlier in this news release.

Mineral reserves reported are not included in mineral resources. Tonnage amounts and contained metal amounts set out in this table have been rounded to the nearest thousand, so may not aggregate to equal column or row totals. Mineral reserves are in-situ, taking into account all mining recoveries, before mill or heap leach recoveries. Underground mineral reserves and measured and indicated mineral resources are reported within mineable shapes and include internal and external dilution. Inferred mineral resources are reported within mineable shapes and include internal dilution. Mineable shape optimization parameters may differ for mineral reserves and mineral resources.

The mineral reserves and mineral resources tonnages reported for silver, copper and zinc are a subset of the mineral reserves and mineral resources tonnages for gold. The Company’s economic parameters set the maximum price allowed to be no more than the lesser of the three‐year moving average and current spot price, which is a common industry standard. Given the current commodity price environment, Agnico Eagle continues to use more conservative gold and silver prices.

NI 43-101 requires mining companies to disclose mineral reserves and mineral resources using the subcategories of “proven mineral reserves”, “probable mineral reserves”, “measured mineral resources”, “indicated mineral resources” and “inferred mineral resources”. Mineral resources that are not mineral reserves do not have demonstrated economic viability.

A mineral reserve is the economically mineable part of a measured and/or indicated mineral resource. It includes diluting materials and allowances for losses, which may occur when the material is mined or extracted and is defined by studies at prefeasibility or feasibility level as appropriate that include application of modifying factors. Such studies demonstrate that, at the time of reporting, extraction could reasonably be justified. The mineral reserves presented in this news release are separate from and not a portion of the mineral resources.

Modifying factors are considerations used to convert mineral resources to mineral reserves. These include, but are not restricted to, mining, processing, metallurgical, infrastructure, economic, marketing, legal, environmental, social and governmental factors.

A proven mineral reserve is the economically mineable part of a measured mineral resource. A proven mineral reserve implies a high degree of confidence in the modifying factors. A probable mineral reserve is the economically mineable part of an indicated and, in some circumstances, a measured mineral resource. The confidence in the modifying factors applied to a probable mineral reserve is lower than that applied to a proven mineral reserve.

A mineral resource is a concentration or occurrence of solid material of economic interest in or on the Earth’s crust in such form, grade or quality and quantity that there are reasonable prospects for eventual economic extraction. The location, quantity, grade or quality, continuity and other geological characteristics of a mineral resource are known, estimated or interpreted from specific geological evidence and knowledge, including sampling.

A measured mineral resource is that part of a mineral resource for which quantity, grade or quality, densities, shape and physical characteristics are estimated with confidence sufficient to allow the application of modifying factors to support detailed mine planning and final evaluation of the economic viability of the deposit. Geological evidence is derived from detailed and reliable exploration, sampling and testing and is sufficient to confirm geological and grade or quality continuity between points of observation. An indicated mineral resource is that part of a mineral resource for which quantity, grade or quality, densities, shape and physical characteristics are estimated with sufficient confidence to allow the application of modifying factors in sufficient detail to support mine planning and evaluation of the economic viability of the deposit. Geological evidence is derived from adequately detailed and reliable exploration, sampling and testing and is sufficient to assume geological and grade or quality continuity between points of observation. An inferred mineral resource is that part of a mineral resource for which quantity and grade or quality are estimated on the basis of limited geological evidence and sampling. Geological evidence is sufficient to imply but not verify geological and grade or quality continuity.

28


Investors are cautioned not to assume that part or all of an inferred mineral resource exists, or is economically or legally mineable.

A feasibility study is a comprehensive technical and economic study of the selected development option for a mineral project that includes appropriately detailed assessments of applicable modifying factors, together with any other relevant operational factors and detailed financial analysis that are necessary to demonstrate, at the time of reporting, that extraction is reasonably justified (economically mineable). The results of the study may reasonably serve as the basis for a final decision by a proponent or financial institution to proceed with, or finance, the development of the project. The confidence level of the study will be higher than that of a pre-feasibility study.

Additional Information

Additional information about each of the Company’s material mineral projects as at December 31, 2025, including information regarding data verification, key assumptions, parameters and methods used to estimate mineral reserves and mineral resources and the risks that could materially affect the development of the mineral reserves and mineral resources required by sections 3.2 and 3.3 and paragraphs 3.4(a), (c) and (d) of NI 43-101 can be found in the Company’s AIF and 2025 MD&A filed on SEDAR+ and with the SEC on EDGAR and in the following technical reports filed on SEDAR+ in respect of the Company’s material mineral properties: Detour Lake Operation, Ontario, Canada, NI 43-101 Technical Report (September 20, 2024); NI 43-101 Technical Report of the LaRonde complex in Quebec, Canada (March 24, 2023); NI 43-101 Technical Report Canadian Malartic Mine, Quebec, Canada (March 25, 2021); Technical Report on the Mineral Resources and Mineral Reserves at Meadowbank Gold complex including the Amaruq Satellite Mine Development, Nunavut, Canada as at December 31, 2017 (February 14, 2018); and the Updated Technical Report on the Meliadine Gold Project, Nunavut, Canada (February 11, 2015).

29


APPENDIX – EXPLORATION DETAILS

Eclipse zone and East Gouldie, East Malartic and Odyssey deposits at Odyssey

  ​ ​ ​

  ​ ​ ​

  ​ ​ ​

  ​ ​ ​

Depth of 

  ​ ​ ​

  ​ ​ ​

  ​ ​ ​

midpoint 

Estimated 

Gold grade 

Gold grade  

From

To

below surface 

true width

(g/t)

(g/t)

Drill hole

  ​ ​ ​

Deposit / Zone

  ​ ​ ​

(metres)

  ​ ​ ​

(metres)

  ​ ​ ​

(metres)

  ​ ​ ​

(metres)

  ​ ​ ​

(uncapped)

  ​ ​ ​

(capped)*

MEX25-341

Eclipse

1,038.1

1,043.8

769

5.5

5.6

5.6

MEX25-346WZ

Eclipse

1,690.0

1,704.5

1,634

10.4

2.2

2.2

and

Eclipse

1,758.5

1,799.5

1,700

29.5

1.5

1.5

and

East Gouldie

2,084.9

2,096.9

1,956

10.5

2.0

2.0

UGEG-071-029


East Gouldie


650.5


670.5


1,010


19.8


3.5


3.5

including


655.0


661.0


1,008


5.9


6.5


6.5

UGEG-075-057


East Gouldie


560.7


572.7


929


11.9


4.9


4.9

UGEG-095-004


East Gouldie


134.0


143.4


990


9.3


6.8


6.8

MEX24-320WCZ


East Gouldie


1,545.2


1,569.1


1,158


20.7


2.0


2.0

MEX25-350


East Malartic


108.6


113.1


96


4.6**


7.2


7.1

and


East Malartic


222.0


234.0


204


12.0**


2.1


2.1

MEX25-351


East Malartic


415.0


441.4


327


26.4**


2.9


2.9

UGOD-057-001


Odyssey North


591.2


602.1


941


9.3


3.6


3.6

UGOD-075-046


Odyssey North


564.5


583.5


894


17.2


3.1


3.1

MEV25-316


Odyssey South


347.3


361.5


294


12.8


3.1


3.1

UGOD-041-066


Odyssey internal


73.5


83.5


443


10.0


5.0


5.0

UGOD-041-068


Odyssey internal


37.0


48.5


413


11.5


5.9


4.3

and


Odyssey internal


65.0


73.1


416


8.1


8.9


8.1


* Results from Eclipse zone and East Gouldie and Odyssey deposits use a capping factor of 20 g/t gold and results from East Malartic use a capping factor of 40 g/t gold.

** Core length. True width undetermined.

30


West Pit and West Extension zones at Detour Lake

  ​ ​ ​

  ​ ​ ​

  ​ ​ ​

  ​ ​ ​

Depth of 

  ​ ​ ​

  ​ ​ ​

midpoint 

Estimated 

Gold grade 

From

To

below surface 

true width

(g/t)

Drill hole

  ​ ​ ​

Zone

  ​ ​ ​

(metres)

  ​ ​ ​

(metres)

  ​ ​ ​

(metres)

  ​ ​ ​

(metres)

  ​ ​ ​

(uncapped)*

DLM25-1189A

West Pit

567.5

585.0

467

16.1

3.5

and

West Pit

618.2

742.0

542

115.4

0.6

DLM25-1191

West Pit

401.0

412.9

311

11.1

2.1

and

West Pit

430.2

491.9

350

57.5

1.2

including


459.0


467.5


352


7.9


4.8

and


West Pit

535.0


567.1


414


30.2


1.5

and


West Pit


535.0


538.4


404


3.2


10.4

DLM25-1205

West Extension

586.5

613.2

539

22.0

6.7

and

West Extension

663.9

688.6

605

20.4

2.0

DLM25-1208

West Extension

977.7

981.7

912

3.1

13.8

and

West Extension

1,094.1

1,101.0

1,019

5.3

10.7

DLM25-1210

West Pit

426.0

462.9

365

33.0

1.7

and

West Pit

583.0

743.0

532

146.1

1.5

including

623.0

626.8

503

3.5

13.5

including

639.9

654.0

520

12.9

5.1

DLM25-1217

West Pit

621.3

644.0

522

20.4

8.0

DLM25-1223A

West Pit

283.6

338.0

255

47.9

1.0

and

West Pit

460.0

491.0

385

28.0

1.6

and

West Pit

560.0

613.0

470

48.2

1.2

and

West Pit

701.9

763.0

581

55.9

2.1

DLM25-1225

West Extension

713.7

750.5

639

30.7

6.5

including

713.7

722.2

627

7.1

25.6

and

West Extension

815.0

818.0

710

2.5

4.6

DLM25-1229


West Pit


807.0


817.6


592


10.1


6.1

DLM25-1240


West Extension


1,089.0


1,092.5


922


3.1


10.0

DLM25-1242


West Pit


519.0


618.0


444


92.4


2.1

including


544.5


556.0


431


10.7


9.8

and


West Pit


694.7


750.7


554


52.7


2.0

and


West Pit


767.5


857.0


617


84.7


1.6

including


767.5


788.0


593


19.4


4.9

DLM25-1243


West Extension


837.0


842.1


734


4.4


28.0

and


West Extension


910.9


913.9


794


2.6


11.7

DLM25-1245


West Extension


592.5


604.0


497


10.1


10.7

including


601.0


604.0


501


2.6


37.8


* Results from Detour Lake are uncapped.

31


Madrid deposit at Hope Bay

  ​ ​ ​

  ​ ​ ​

  ​ ​ ​

  ​ ​ ​

Depth of 

  ​ ​ ​

  ​ ​ ​

  ​ ​ ​

midpoint 

Estimated 

Gold grade 

Gold grade  

From

To

below surface 

true width

(g/t)

(g/t)

Drill hole

  ​ ​ ​

Zone

  ​ ​ ​

(metres)

  ​ ​ ​

(metres)

  ​ ​ ​

(metres)

  ​ ​ ​

(metres)

  ​ ​ ​

(uncapped)

  ​ ​ ​

(capped)*

HBM25-385

Patch 7

697.6

706.6

491

8.1

9.2

9.2

and

Patch 7

711.6

720.7

500

8.6

6.9

6.9

HBM25-387A

Suluk

824.0

826.7

653

2.3

89.8

46.1

including

825.7

826.7

654

0.9

218.0

100.0

HBM25-388


Patch 7


788.0


805.0


675


15.8


7.7


7.7

including


Patch 7

793.0


797.0


674


3.7


10.1


4.0

HBM25-394


Patch 7


889.2


892.2


587


2.5


48.9


35.4

including


Patch 7


891.2


892.2


588


0.8


144.0


100.0

and


Patch 7


936.0


952.0


614


13.8


7.3


7.3

including


Patch 7


948.0


948.7


616


0.6


45.8


45.8

HBM25-395


Patch 7


479.0


494.0


363


12.3


5.2


5.2

HBM25-396


Patch 7


701.0


705.0


538


3.1


9.7


9.7

HBM25-400


Patch 7


1,041.0


1,050.0


842


8.2


3.2


3.2

HBM25-401


Patch 7


734.0


745.0


609


7.1


4.3


4.3

including


Patch 7


737.0


740.0


609


1.9


8.5


8.5

and


Suluk


896.0


901.0


719


4.3


7.7


7.7

P7GM25-010


Patch 7


553.5


562.0


441


8.4


4.7


4.7

HBM25-384


Patch 14


467.0


472.0


375


4.1


3.5


3.5


* Results from Madrid deposit at Hope Bay use a capping factor of 100 g/t gold.

32


EXPLORATION DRILL COLLAR COORDINATES

Elevation

(metres above

Azimuth

Dip

Length

Drill hole

  ​ ​ ​

UTM East*

  ​ ​ ​

UTM North*

  ​ ​ ​

sea level)

  ​ ​ ​

(degrees)

  ​ ​ ​

(degrees)

  ​ ​ ​

(metres)

Odyssey mine

MEX25-341

719014

5334200

309

172

-58

1203

MEX25-346WZ

717451

5334739

309

143

-78

2183

UGEG-071-029

717760

5333976

-346

148

-37

711

UGEG-075-057

717713

5334081

-340

165

-35

741

UGEG-095-004


717592


5333756


-619


190


-27


342

MEX24-320WCZ


716867

5334696


316


155


-68


1628

MEX25-350


716852


5334693


316


199


-68


875

MEX25-350

716852

5334693

316

199

-68

875

MEX25-351

716867

5334695

317

149

-53

1527

UGOD-057-001

718006

5334110

-261

2

-43

615

UGOD-075-046

718006

5334110

-261

4

-38

615

MEV25-316

719119

5333940

334

346

-66

465

UGOD-041-066

718260

5334377

-99

250

-24

255

UGOD-041-068

718259

5334378

-99

258

-6

245

Detour Lake

DLM25-1189A

587629

5541782

286

172

-60

909

DLM25-1191

587807

5541683

286

176

-54

699

DLM25-1205

586120

5542020

291

184

-67

789

DLM25-1208

585753

5542319

292

186

-68

1239

DLM25-1210

589487

5541609

286

180

-59

740

DLM25-1217

589448

5541517

286

180

-60

819

DLM25-1223A

589528

5541498

286

180

-58

900

DLM25-1225

586119

5542093

293

184

-65

843

DLM25-1229

589309

5541517

286

182

-53

990

DLM25-1240

584832

5542449

296

188

-59

1176

DLM25-1242

589450

5541487

286

177

-57

900

DLM25-1243

586037

5542184

295

187

-66

975

DLM25-1245

586199

5542065

292

181

-58

762

Hope Bay

HBM-25-385

434949

7547679

37

63

-55

873

HBM-25-387A

434310

7549317

50

84

-69

987

HBM-25-388


434949


7547679


37


70


-66


954

HBM-25-394


434333


7548811


53


86


-57


1148

HBM-25-395


435069


7547563


37


83


-57


810

HBM-25-396


434372


7549088


54


72


-61


939

HBM-25-400


434333


7548811


53


80


-66


1155

HBM-25-401


434309


7549316


48


74


-69


1036

P7GM-25-010


434830


7548196


38


87


-60


751

HBM-25-384


7546730


435093


45


75


-64


852


* Coordinate Systems: NAD 83 UTM Zone 17N for Odyssey; NAD 1983 UTM Zone 17N for Detour Lake; and NAD 1983 UTM Zone 13N for Hope Bay.

33