| February 24, 2026 Q4 2025 Earnings Release and CECO Environmental Combination with Thermon Group |

| L E G A L D I S C L O S U R E S Forward-Looking Statements This presentation contains “forward-looking statements” within the meaning of Section 27A of the Securities Act and Section 21E of the Exchange Act. All statements, other than statements of historical fact, included in this presentation that address events, or developments that CECO Environmental Corp. (“CECO”) expects, believes, or anticipates will or may occur in the future are forward-looking statements. The words “intend,” “expect,” and similar expressions are intended to identify forward-looking statements. However, the absence of these words or similar expressions does not mean that a statement is not forward-looking. Forward-looking statements in this presentation include, but are not limited to, statements regarding the proposed combination of CECO and Thermon Group Holdings, Inc. (“Thermon”), pro forma descriptions of the combined company and its operations, integration and transition plans, synergies, opportunities and anticipated future performance. There are a number of risks and uncertainties that could cause actual results to differ materially from the forward-looking statements included in this presentation. These include the expected timing and likelihood of completion of the transaction, including the timing, receipt and terms and conditions of any required governmental and regulatory approvals of the transaction that could reduce anticipated benefits or cause the parties to abandon the transaction, the ability to successfully integrate the businesses, the occurrence of any event, change or other circumstances that could give rise to the termination of the merger agreement between CECO and Thermon, the possibility that stockholders of CECO or Thermon may not approve the transaction, the risk that the parties may not be able to satisfy the conditions to the transaction in a timely manner or at all, risks related to disruption of management time from ongoing business operations due to the transaction, the risk that any announcements relating to the transaction could have adverse effects on the market price of CECO‘s common stock, the risk that the transaction and its announcement could have an adverse effect on the ability of CECO and Thermon to retain customers and retain and hire key personnel and maintain relationships with their suppliers and customers and on their operating results and businesses generally, the risk the pending transaction could distract management of both entities and they will incur substantial costs, the risk that problems may arise in successfully integrating the businesses of the companies, which may result in the combined company not operating as effectively and efficiently as expected, the risk that the combined company may be unable to achieve synergies or it may take longer than expected to achieve those synergies and other important factors that could cause actual results to differ materially from those projected. All such factors are difficult to predict and are beyond CECO’s control, including those detailed in CECO’s annual reports on Form 10-K, quarterly reports on Form 10-Q and current reports on Form 8-K that are available on its website at https://investors.cecoenviro.com and on the SEC’s website at https://www.sec.gov. All forward-looking statements are based on assumptions that CECO believes to be reasonable but that may not prove to be accurate. Such forward-looking statements are based on assumptions and analyses made by CECO in light of their perceptions of current conditions, expected future developments, and other factors that CECO believes are appropriate under the circumstances. These statements are subject to a number of known and unknown risks and uncertainties. Forward-looking statements are not guarantees of future performance and actual events may be materially different from those expressed or implied in the forward-looking statements. The forward-looking statements in this presentation speak as of the date of this presentation. Non-GAAP Financial Measures This presentation includes certain non-GAAP financial measures, including Adjusted EBITDA, Adjusted EBITDA margin, Adjusted EPS, and free cash flow (collectively, the "Non-GAAP Measures"). Management believes these measures provide useful supplemental information regarding the operating performance of CECO , both on a standalone and pro forma combined basis with Thermon. Non-GAAP Measures should not be considered in isolation or as a substitute for any measure of financial performance or liquidity derived in accordance with GAAP. These measures have limitations as analytical tools, and similarly titled measures used by other companies may not be comparable. Reconciliations of each Non-GAAP Measure to its most directly comparable GAAP measure are set forth in the appendix to this presentation. 2 |
| L E G A L D I S C L O S U R E S No Offer or Solicitation This presentation is for informational purposes only and is not intended to and shall not constitute an offer to buy or sell or the solicitation of an offer to buy or sell any securities, or a solicitation of any vote or approval, nor shall there be any sale of securities in any jurisdiction in which such offer, solicitation or sale would be unlawful prior to registration or qualification under the securities laws of any such jurisdiction. No offering of securities shall be made, except by means of a prospectus meeting the requirements of Section 10 of the Securities Act of 1933, as amended. Additional Information and Where to Find It This presentation is being made in respect of the proposed merger transaction involving CECO and Thermon. The issuance of shares of CECO common stock in connection with the proposed merger transaction will be submitted to the stockholders of CECO for their consideration, and the proposed merger transaction will be submitted to the stockholders of Thermon for their consideration. In connection therewith, CECO intends to file with the SEC a registration statement on Form S-4 (the “Registration Statement”) that will include a joint proxy statement/prospectus. Each of CECO and Thermon may also file other relevant documents with the SEC regarding the proposed transaction. This communication is not a substitute for the joint proxy statement/prospectus or registration statement or any other document that CECO or Thermon, as applicable, may file with the SEC in connection with the proposed transaction. After the Registration Statement has been declared effective by the SEC, a definitive joint proxy statement/prospectus will be mailed to the stockholders of CECO and Thermon. BEFORE MAKING ANY VOTING OR INVESTMENT DECISION, INVESTORS AND SECURITY HOLDERS OF CECO AND THERMON ARE URGED TO READ THE REGISTRATION STATEMENT, JOINT PROXY STATEMENT/PROSPECTUS AND ANY OTHER RELEVANT DOCUMENTS THAT MAY BE FILED WITH THE SEC, AS WELL AS ANY AMENDMENTS OR SUPPLEMENTS TO THESE DOCUMENTS, CAREFULLY AND IN THEIR ENTIRETY IF AND WHEN THEY BECOME AVAILABLE BECAUSE THEY CONTAIN OR WILL CONTAIN IMPORTANT INFORMATION ABOUT CECO, THERMON, THE PROPOSED TRANSACTION AND RELATED MATTERS. Investors and security holders will be able to obtain free copies of the registration statement and joint proxy statement/prospectus, as well as other filings containing important information about CECO, Thermon and the proposed transaction, once such documents are filed with the SEC through the website maintained by the SEC at https://www.sec.gov. Copies of the documents filed with the SEC by CECO will be available free of charge on CECO’s website at https://investors.cecoenviro.com/. Copies of the documents filed with the SEC by Thermon will be available free of charge on Thermon's website at https://ir.thermon.com/. The information included on, or accessible through, CECO’s or Thermon’s website is not incorporated by reference into this communication. Participants in the Solicitation CECO, Thermon and certain of their respective directors and executive officers may be deemed to be participants in the solicitation of proxies in respect of the proposed transaction. Information about the directors and executive officers of CECO, including a description of their direct or indirect interests, by security holdings or otherwise, is set forth in (i) CECO’s proxy statement for its 2025 Annual Meeting of Stockholders, which was filed with the SEC on April 10, 2025 (and which is available at https://www.sec.gov/ix?doc=/Archives/edgar/data/3197/000155837025004649/ceco-20250520xdef14a.htm), (ii) a Form 8-K filed by CECO on July 24, 2025 (and which is available at https://www.sec.gov/ix?doc=/Archives/edgar/data/0000003197/000095017025098303/ceco-20250718.htm), (iii) a Form 8-K filed by CECO on September 16, 2025 (and which is available at https://www.sec.gov/ix?doc=/Archives/edgar/data/0000003197/000119312525204657/ceco-20250912.htm) and (iv) to the extent holdings of CECO’s securities by the directors or executive officers of CECO have changed since the amounts set forth in CECO’s proxy statement for its 2025 Annual Meeting of Stockholders, such changes have been or will be reflected on Initial Statement of Beneficial Ownership of Securities on Form 3, Statement of Changes in Beneficial Ownership on Form 4, or Annual Statement of Changes in Beneficial Ownership on Form 5 filed with the SEC, which are available at https://www.sec.gov/cgi-bin/own-disp?action=getissuer&CIK=0000003197. Information about the directors and executive officers of Thermon, including a description of their direct or indirect interests, by security holdings or otherwise, is set forth in (i) Thermon’s proxy statement for its 2025 Annual Meeting of Stockholders, which was filed with the SEC on June 18, 2025 (and which is available at https://www.sec.gov/Archives/edgar/data/1489096/000148909625000097/thr-20250618.htm), (ii) a Form 8-K filed by Thermon on July 1, 2025 (as amended July 15, 2025) (and which is available at https://www.sec.gov/ix?doc=/Archives/edgar/data/0001489096/000148909625000115/thr-20250701.htm) and (iii) to the extent holdings of Thermon’s securities by the directors or executive officers of Thermon have changed since the amounts set forth in Thermon’s proxy statement for its 2025 Annual Meeting of Stockholders, such changes have been or will be reflected on Initial Statement of Beneficial Ownership of Securities on Form 3, Statement of Changes in Beneficial Ownership on Form 4, or Annual Statement of Changes in Beneficial Ownership on Form 5 filed with the SEC, which are available at https://www.sec.gov/cgi-bin/own-disp?action=getissuer&CIK=0001489096. Other information regarding the participants in the proxy solicitations and a description of their direct and indirect interests, by security holdings or otherwise, will be contained in the joint proxy statement/prospectus and other relevant materials to be filed with the SEC regarding the proposed transaction when such materials become available. Investors should read the joint proxy statement/prospectus carefully when it becomes available before making any voting or investment decisions. You may obtain free copies of these documents from CECO and Thermon using the sources indicated above. 3 |
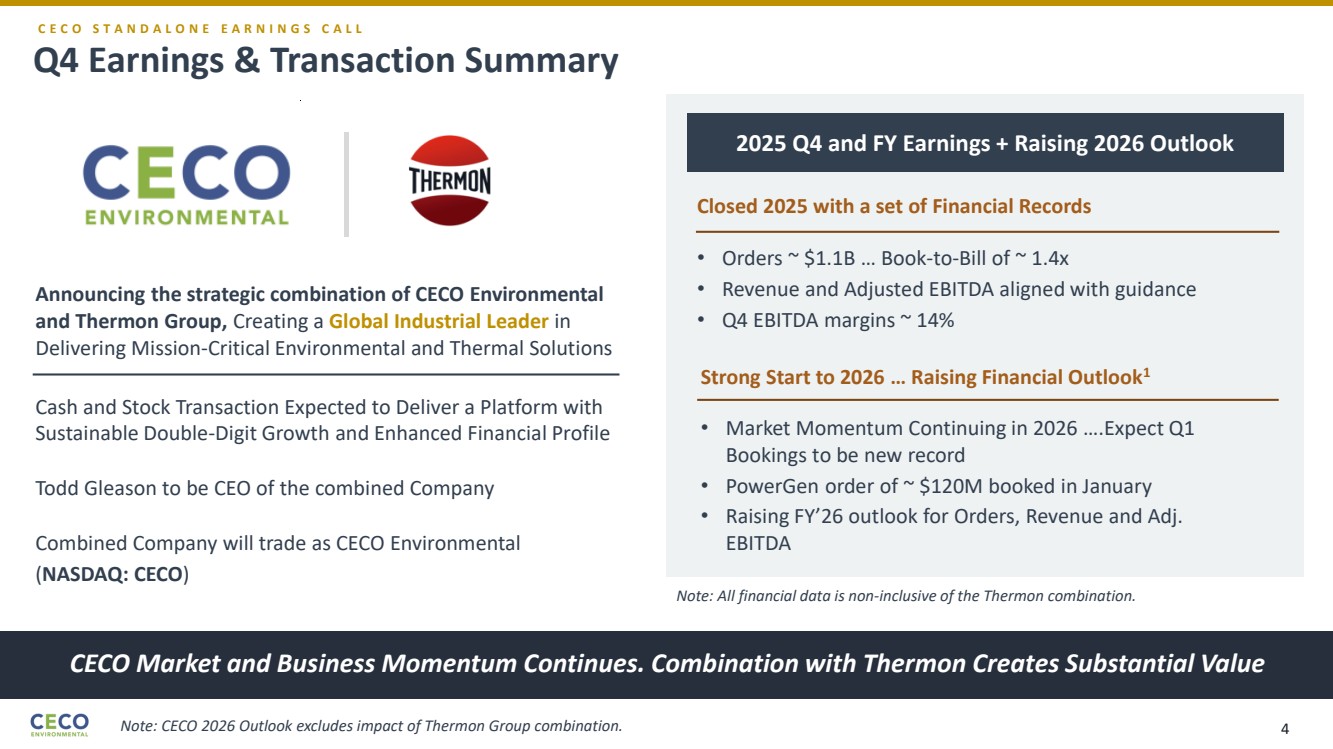
| Q4 Earnings & Transaction Summary CECO Market and Business Momentum Continues. Combination with Thermon Creates Substantial Value C E C O S T A N D A L O N E E A R N I N G S C A L L Announcing the strategic combination of CECO Environmental and Thermon Group, Creating a Global Industrial Leader in Delivering Mission-Critical Environmental and Thermal Solutions Cash and Stock Transaction Expected to Deliver a Platform with Sustainable Double-Digit Growth and Enhanced Financial Profile Todd Gleason to be CEO of the combined Company 2025 Q4 and FY Earnings + Raising 2026 Outlook Closed 2025 with a set of Financial Records • Orders ~ $1.1B … Book-to-Bill of ~ 1.4x • Revenue and Adjusted EBITDA aligned with guidance • Q4 EBITDA margins ~ 14% Combined Company will trade as CECO Environmental (NASDAQ: CECO) Strong Start to 2026 … Raising Financial Outlook1 • Market Momentum Continuing in 2026 ….Expect Q1 Bookings to be new record • PowerGen order of ~ $120M booked in January • Raising FY’26 outlook for Orders, Revenue and Adj. EBITDA Note: All financial data is non-inclusive of the Thermon combination. Note: CECO 2026 Outlook excludes impact of Thermon Group combination. 4 |
| Q4 & FY 2025 EARNINGS and FY 2026 OUTLOOK 5 |
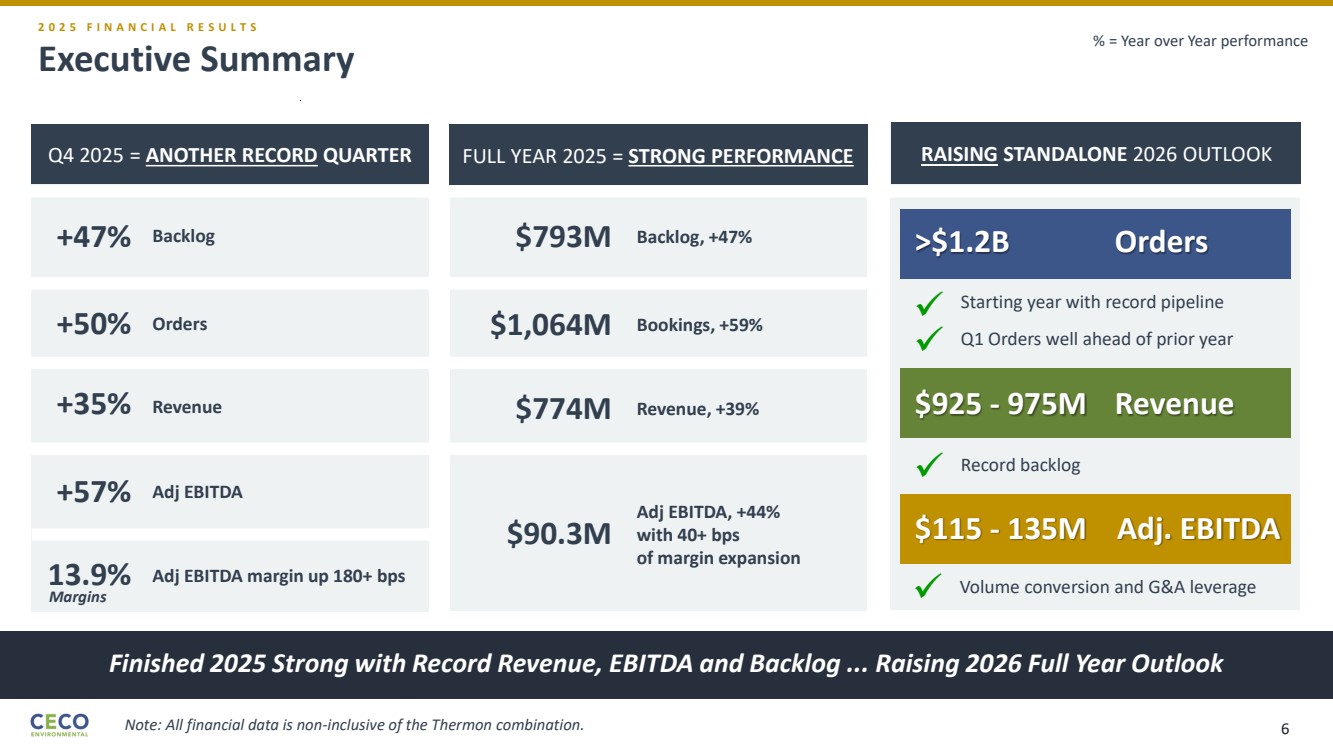
| Executive Summary Finished 2025 Strong with Record Revenue, EBITDA and Backlog ... Raising 2026 Full Year Outlook 2 0 2 5 F I N A N C I A L R E S U L T S Q4 2025 = ANOTHER RECORD QUARTER +47% Backlog +50% Orders +35% Revenue +57% Adj EBITDA 13.9% Adj EBITDA margin up 180+ bps FULL YEAR 2025 = STRONG PERFORMANCE RAISING STANDALONE 2026 OUTLOOK >$1.2B Orders $925 - 975M Revenue $115 - 135M Adj. EBITDA Record backlog Starting year with record pipeline Volume conversion and G&A leverage ✓ ✓ $793M Backlog, +47% $1,064M Bookings, +59% $774M Revenue, +39% $90.3M Adj EBITDA, +44% with 40+ bps of margin expansion ✓ Q1 Orders well ahead of prior year ✓ % = Year over Year performance Margins Note: All financial data is non-inclusive of the Thermon combination. 6 |
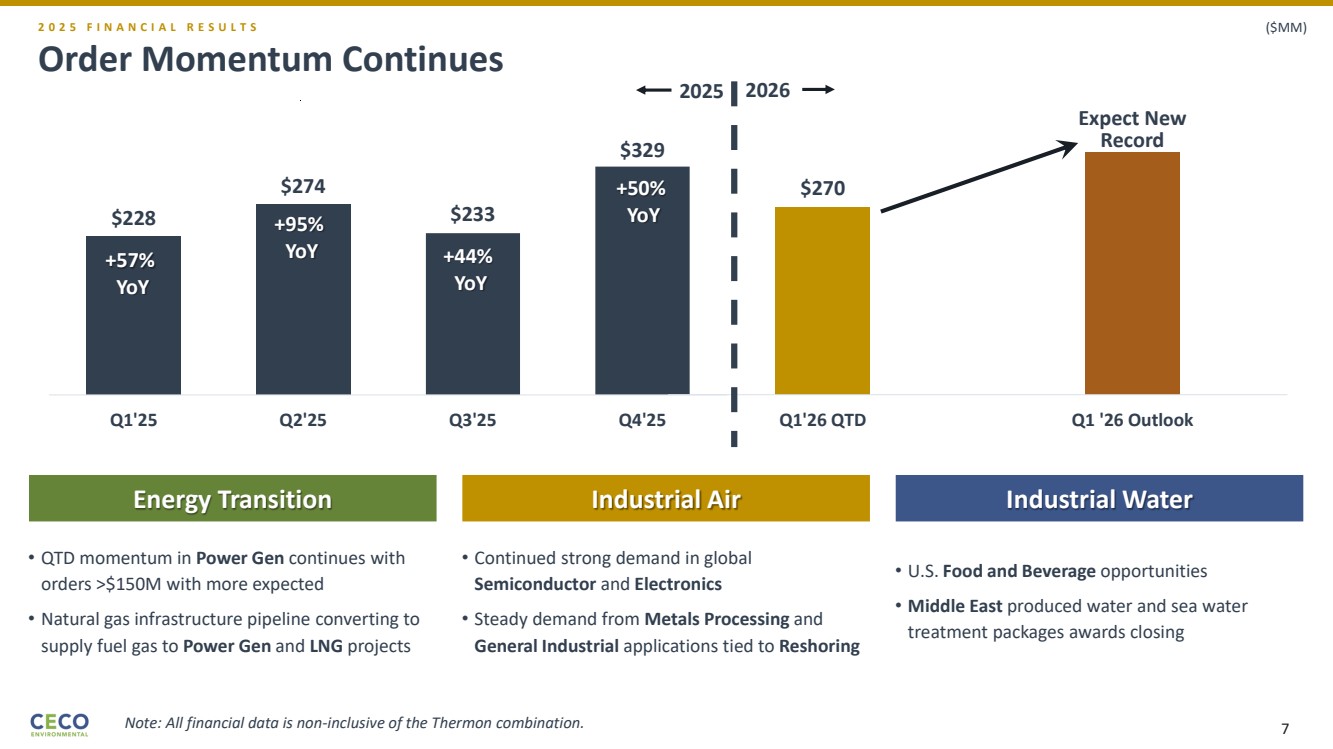
| Order Momentum Continues 2 0 2 5 F I N A N C I A L R E S U L T S $228 $274 $233 $329 Q1'25 Q2'25 Q3'25 Q4'25 $270 Q1'26 QTD Q1 '26 Outlook Expect New Record Energy Transition Industrial Air Industrial Water • QTD momentum in Power Gen continues with orders >$150M with more expected • Natural gas infrastructure pipeline converting to supply fuel gas to Power Gen and LNG projects • Continued strong demand in global Semiconductor and Electronics • Steady demand from Metals Processing and General Industrial applications tied to Reshoring • U.S. Food and Beverage opportunities • Middle East produced water and sea water treatment packages awards closing ($MM) +57% YoY +95% YoY +44% YoY +50% YoY 2025 2026 Note: All financial data is non-inclusive of the Thermon combination. 7 |
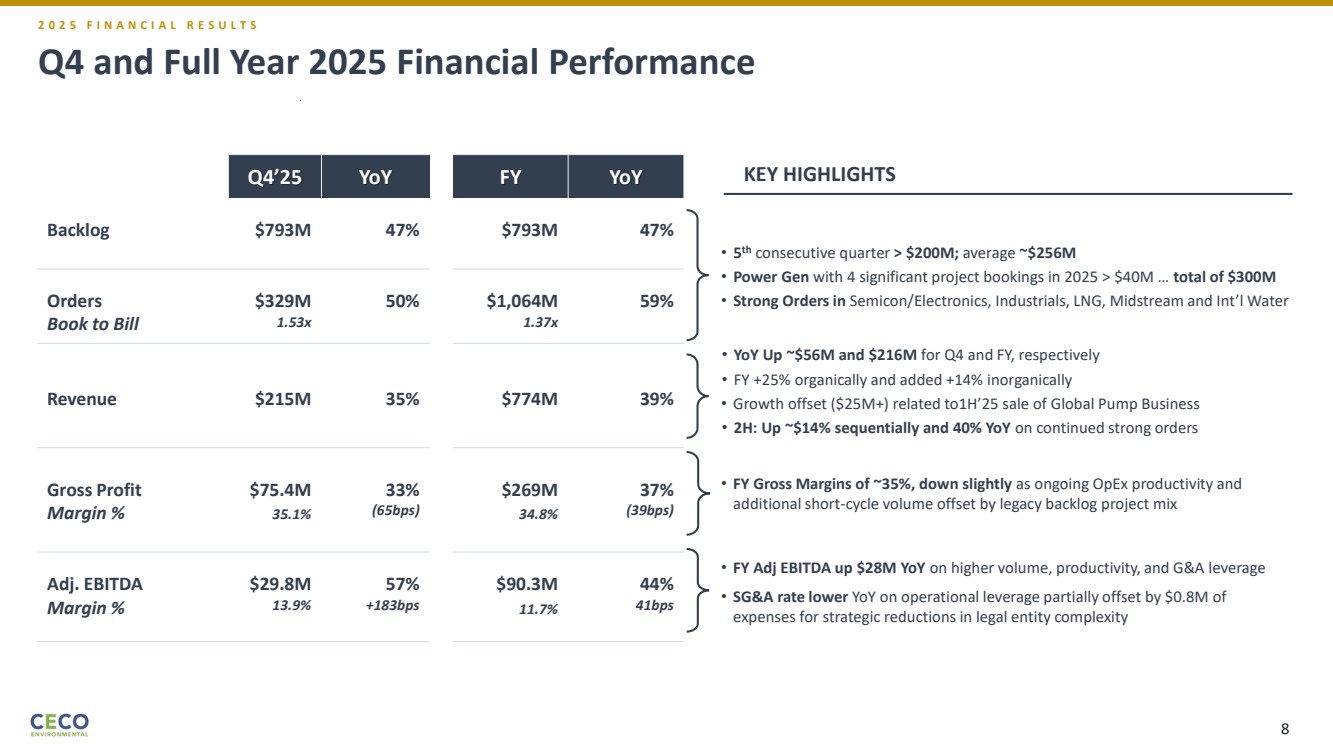
| Q4 and Full Year 2025 Financial Performance Q4’25 YoY FY YoY Backlog $793M 47% $793M 47% Orders Book to Bill $329M 1.53x 50% $1,064M 1.37x 59% Revenue $215M 35% $774M 39% Gross Profit Margin % $75.4M 35.1% 33% (65bps) $269M 34.8% 37% (39bps) Adj. EBITDA Margin % $29.8M 13.9% 57% +183bps $90.3M 11.7% 44% 41bps • 5 th consecutive quarter > $200M; average ~$256M • Power Gen with 4 significant project bookings in 2025 > $40M … total of $300M • Strong Orders in Semicon/Electronics, Industrials, LNG, Midstream and Int’l Water • FY Gross Margins of ~35%, down slightly as ongoing OpEx productivity and additional short-cycle volume offset by legacy backlog project mix • YoY Up ~$56M and $216M for Q4 and FY, respectively • FY +25% organically and added +14% inorganically • Growth offset ($25M+) related to1H’25 sale of Global Pump Business • 2H: Up ~$14% sequentially and 40% YoY on continued strong orders • FY Adj EBITDA up $28M YoY on higher volume, productivity, and G&A leverage • SG&A rate lower YoY on operational leverage partially offset by $0.8M of expenses for strategic reductions in legal entity complexity KEY HIGHLIGHTS 2 0 2 5 F I N A N C I A L R E S U L T S 8 |
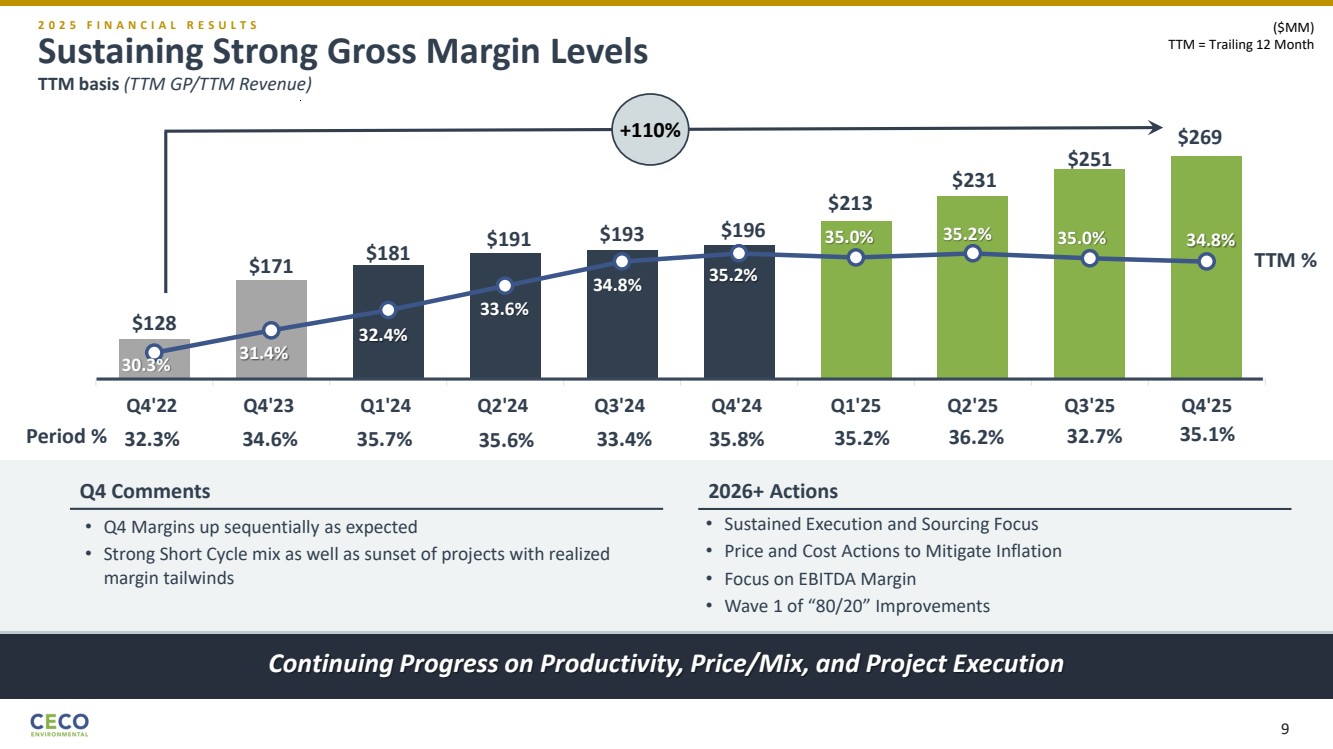
| Sustaining Strong Gross Margin Levels TTM basis (TTM GP/TTM Revenue) Continuing Progress on Productivity, Price/Mix, and Project Execution 2 0 2 5 F I N A N C I A L R E S U L T S $128 $171 $181 $191 $193 $196 $213 $231 $251 30.3% 31.4% 32.4% 33.6% 34.8% 35.2% 35.0% 35.2% 35.0% 34.8% 29. 0% 31. 0% 33. 0% 35. 0% 37. 0% 39. 0% 100 .0 120 .0 140 .0 160 .0 180 .0 200 .0 220 .0 240 .0 260 .0 Q4'22 Q4'23 Q1'24 Q2'24 Q3'24 Q4'24 Q1'25 Q2'25 Q3'25 Q4'25 ($MM) TTM = Trailing 12 Month • Q4 Margins up sequentially as expected • Strong Short Cycle mix as well as sunset of projects with realized margin tailwinds • Sustained Execution and Sourcing Focus • Price and Cost Actions to Mitigate Inflation • Focus on EBITDA Margin • Wave 1 of “80/20” Improvements $269 Period % 32.3% 34.6% 35.7% 35.6% 33.4% 35.8% 35.2% 36.2% 32.7% 35.1% +110% Q4 Comments 2026+ Actions TTM % 9 |
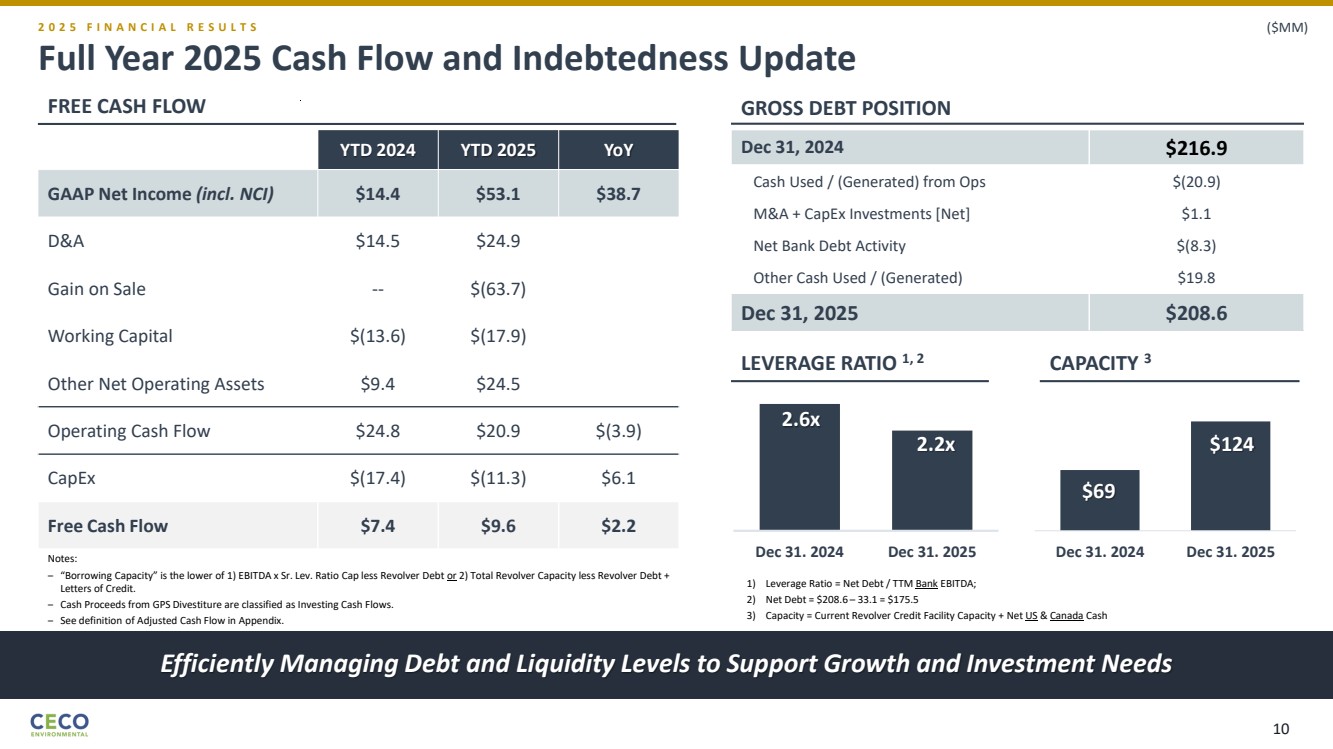
| Full Year 2025 Cash Flow and Indebtedness Update Efficiently Managing Debt and Liquidity Levels to Support Growth and Investment Needs 2 0 2 5 F I N A N C I A L R E S U L T S ($MM) YTD 2024 YTD 2025 YoY GAAP Net Income (incl. NCI) $14.4 $53.1 $38.7 D&A $14.5 $24.9 Gain on Sale -- $(63.7) Working Capital $(13.6) $(17.9) Other Net Operating Assets $9.4 $24.5 Operating Cash Flow $24.8 $20.9 $(3.9) CapEx $(17.4) $(11.3) $6.1 Free Cash Flow $7.4 $9.6 $2.2 Dec 31, 2024 $216.9 Cash Used / (Generated) from Ops $(20.9) M&A + CapEx Investments [Net] $1.1 Net Bank Debt Activity $(8.3) Other Cash Used / (Generated) $19.8 Dec 31, 2025 $208.6 Notes: ‒ “Borrowing Capacity” is the lower of 1) EBITDA x Sr. Lev. Ratio Cap less Revolver Debt or 2) Total Revolver Capacity less Revolver Debt + Letters of Credit. ‒ Cash Proceeds from GPS Divestiture are classified as Investing Cash Flows. ‒ See definition of Adjusted Cash Flow in Appendix. 2.6x 2.2x Dec 31. 2024 Dec 31. 2025 $69 $124 Dec 31. 2024 Dec 31. 2025 1) Leverage Ratio = Net Debt / TTM Bank EBITDA; 2) Net Debt = $208.6 – 33.1 = $175.5 3) Capacity = Current Revolver Credit Facility Capacity + Net US & Canada Cash FREE CASH FLOW GROSS DEBT POSITION LEVERAGE RATIO 1, 2 CAPACITY 3 10 |
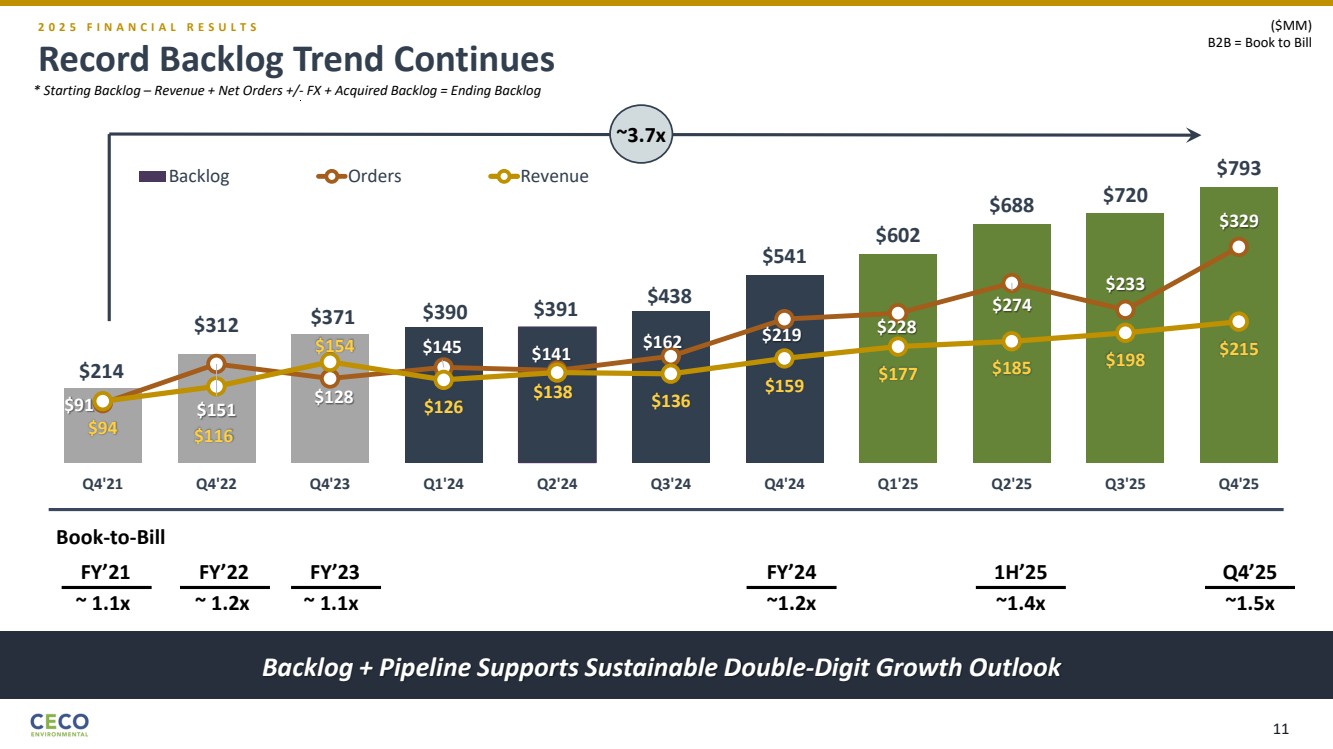
| * Starting Backlog – Revenue + Net Orders +/- FX + Acquired Backlog = Ending Backlog ($MM) B2B = Book to Bill $214 $312 $371 $390 $391 $438 $541 $602 $688 $720 $793 $91 $151 $128 $145 $141 $162 $219 $228 $274 $233 $329 $94 $116 $154 $126 $138 $136 $159 $177 $185 $198 $215 0 40 80 120 160 200 240 280 320 360 400 440 0 40 80 120 160 200 240 280 320 360 400 440 480 520 560 600 640 680 720 760 800 840 Q4'21 Q4'22 Q4'23 Q1'24 Q2'24 Q3'24 Q4'24 Q1'25 Q2'25 Q3'25 Q4'25 Backlog Orders Revenue Book-to-Bill FY’22 FY’23 ~ 1.2x ~ 1.1x ~1.2x FY’21 ~ 1.1x FY’24 ~1.4x 1H’25 ~3.7x ~1.5x Q4’25 Record Backlog Trend Continues Backlog + Pipeline Supports Sustainable Double-Digit Growth Outlook 2 0 2 5 F I N A N C I A L R E S U L T S 11 |
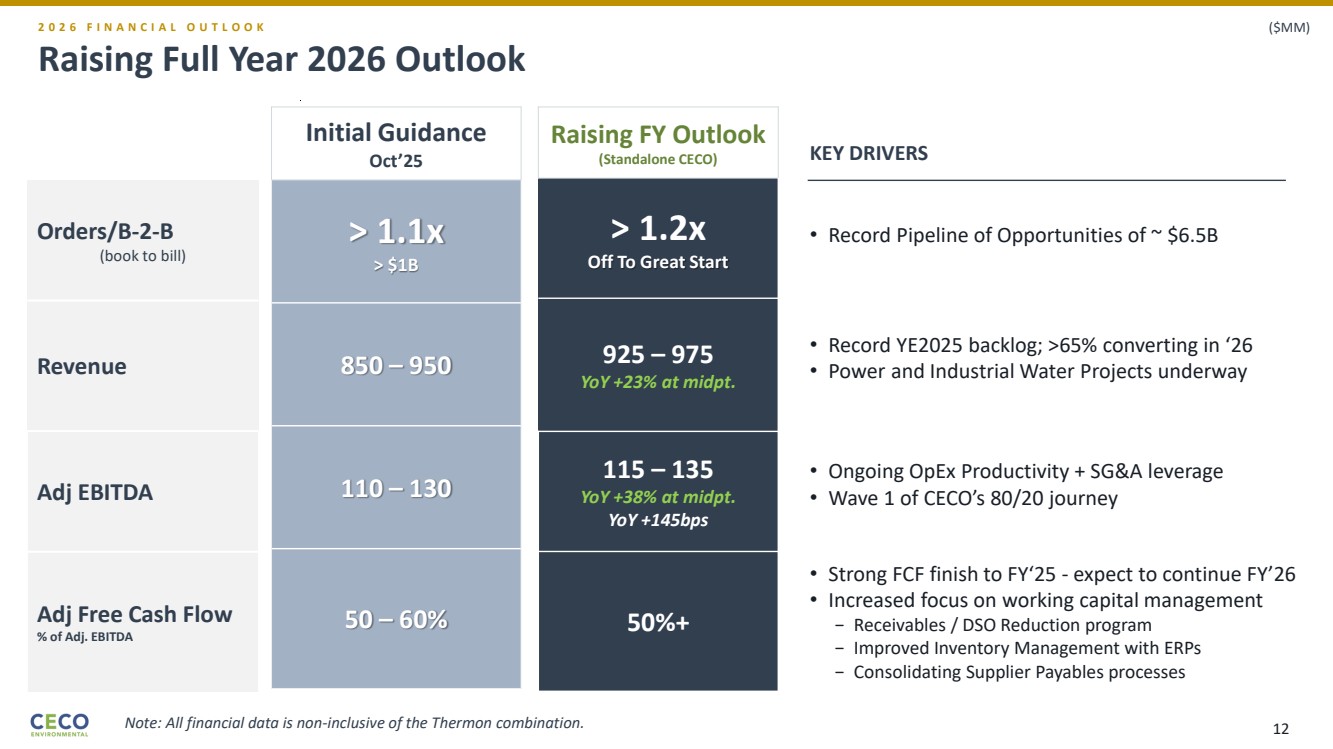
| Raising Full Year 2026 Outlook Initial Guidance Oct’25 > 1.1x > $1B 850 – 950 110 – 130 50 – 60% Raising FY Outlook (Standalone CECO) > 1.2x Off To Great Start 925 – 975 YoY +23% at midpt. 115 – 135 YoY +38% at midpt. YoY +145bps 50%+ • Record YE2025 backlog; >65% converting in ‘26 • Power and Industrial Water Projects underway • Ongoing OpEx Productivity + SG&A leverage • Wave 1 of CECO’s 80/20 journey • Strong FCF finish to FY‘25 - expect to continue FY’26 • Increased focus on working capital management − Receivables / DSO Reduction program − Improved Inventory Management with ERPs − Consolidating Supplier Payables processes Orders/B-2-B (book to bill) Revenue Adj EBITDA Adj Free Cash Flow % of Adj. EBITDA • Record Pipeline of Opportunities of ~ $6.5B 2 0 2 6 F I N A N C I A L O U T L O O K ($MM) KEY DRIVERS Note: All financial data is non-inclusive of the Thermon combination. 12 |
| Protecting people, the environment, and industrial equipment — built for scale, positioned for growth, engineered for resilience. Creating a Global Industrial Leader in Delivering Mission-Critical Environmental and Thermal Solutions C E C O E N V I R O N M E N T A L + T H E R M O N G R O U P 13 |
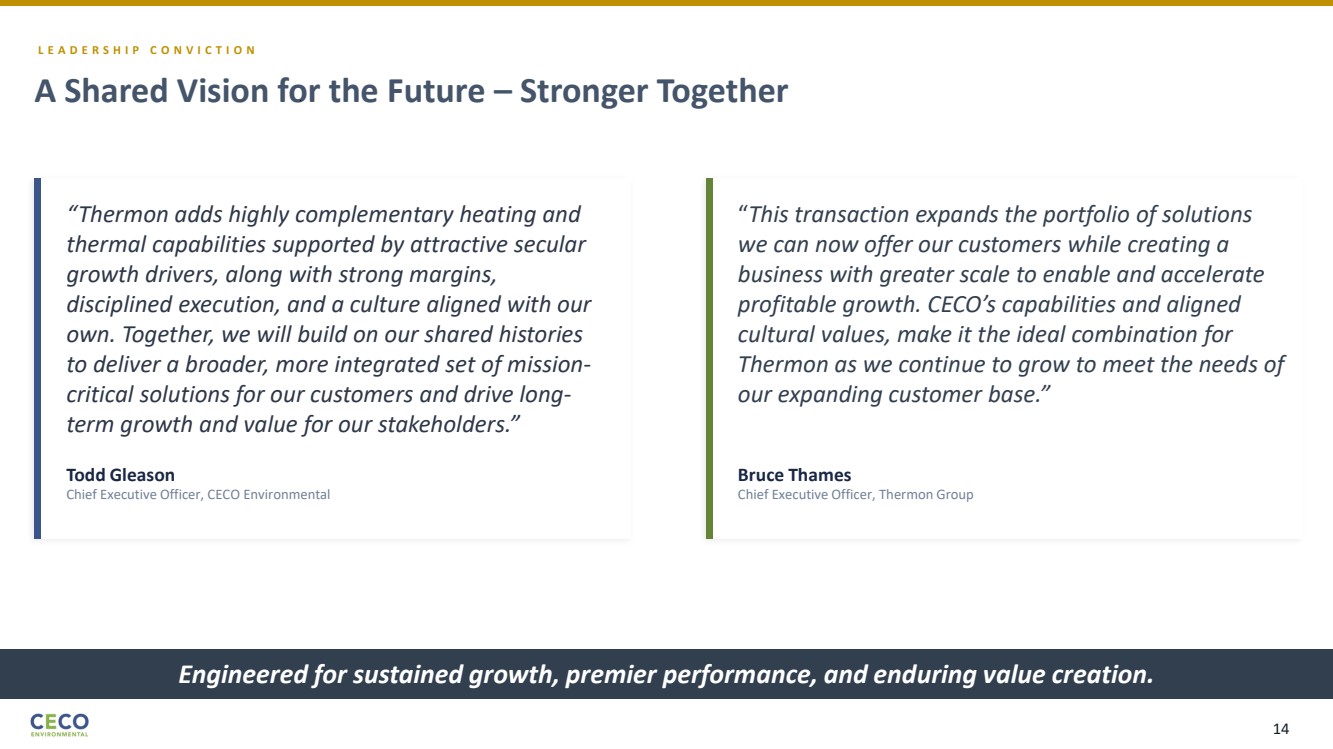
| L E A D E R S H I P C O N V I C T I O N A Shared Vision for the Future – Stronger Together Engineered for sustained growth, premier performance, and enduring value creation. “Thermon adds highly complementary heating and thermal capabilities supported by attractive secular growth drivers, along with strong margins, disciplined execution, and a culture aligned with our own. Together, we will build on our shared histories to deliver a broader, more integrated set of mission-critical solutions for our customers and drive long-term growth and value for our stakeholders.” Todd Gleason Chief Executive Officer, CECO Environmental “This transaction expands the portfolio of solutions we can now offer our customers while creating a business with greater scale to enable and accelerate profitable growth. CECO’s capabilities and aligned cultural values, make it the ideal combination for Thermon as we continue to grow to meet the needs of our expanding customer base.” Bruce Thames Chief Executive Officer, Thermon Group 14 |
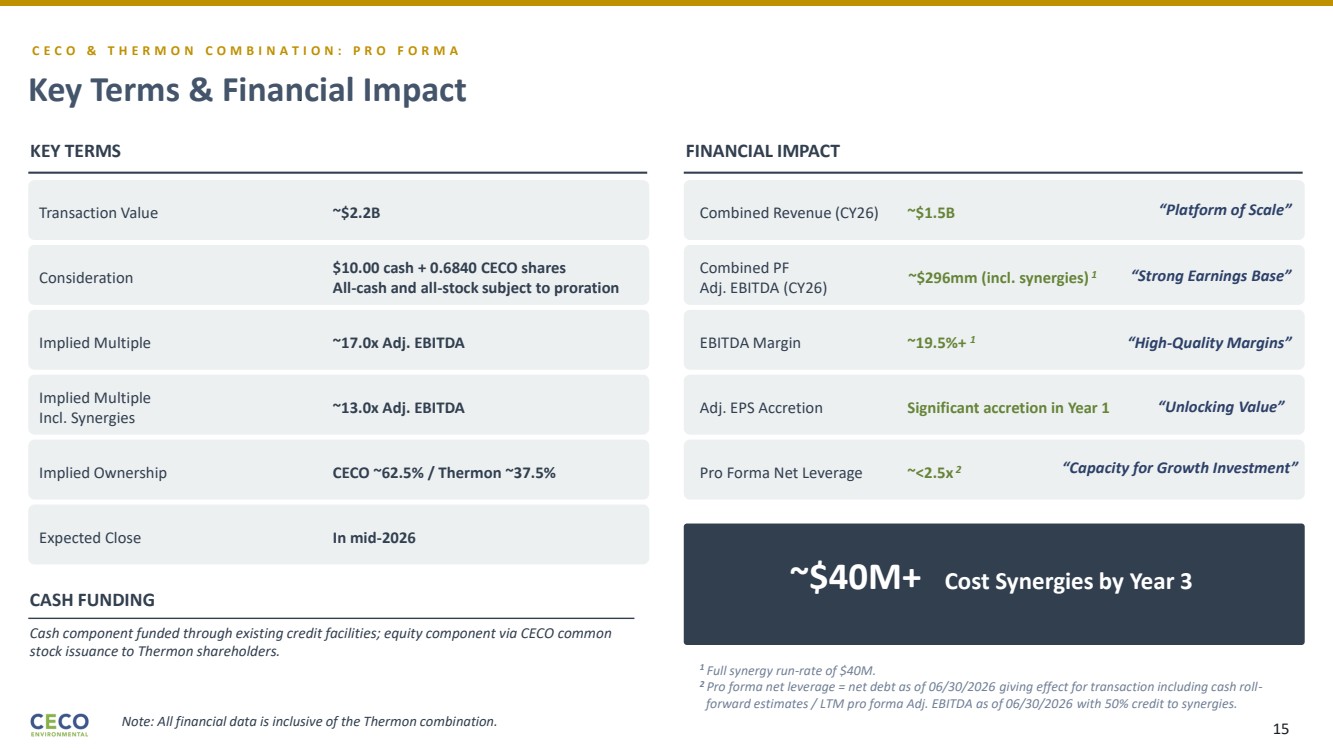
| C E C O & T H E R M O N C O M B I N A T I O N : P R O F O R M A Key Terms & Financial Impact ~$40M+ Cost Synergies by Year 3 Transaction Value ~$2.2B Consideration $10.00 cash + 0.6840 CECO shares All-cash and all-stock subject to proration Implied Multiple ~17.0x Adj. EBITDA Implied Multiple Incl. Synergies ~13.0x Adj. EBITDA Implied Ownership CECO ~62.5% / Thermon ~37.5% Expected Close In mid-2026 KEY TERMS Combined Revenue (CY26) ~$1.5B Combined PF Adj. EBITDA (CY26) ~$296mm (incl. synergies) 1 EBITDA Margin ~19.5%+ 1 Adj. EPS Accretion Significant accretion in Year 1 Pro Forma Net Leverage ~<2.5x 2 FINANCIAL IMPACT CASH FUNDING Cash component funded through existing credit facilities; equity component via CECO common stock issuance to Thermon shareholders. 1 Full synergy run-rate of $40M. 2 Pro forma net leverage = net debt as of 06/30/2026 giving effect for transaction including cash roll-forward estimates / LTM pro forma Adj. EBITDA as of 06/30/2026 with 50% credit to synergies. “Platform of Scale” “Strong Earnings Base” “High-Quality Margins” “Unlocking Value” “Capacity for Growth Investment” Note: All financial data is inclusive of the Thermon combination. 15 |
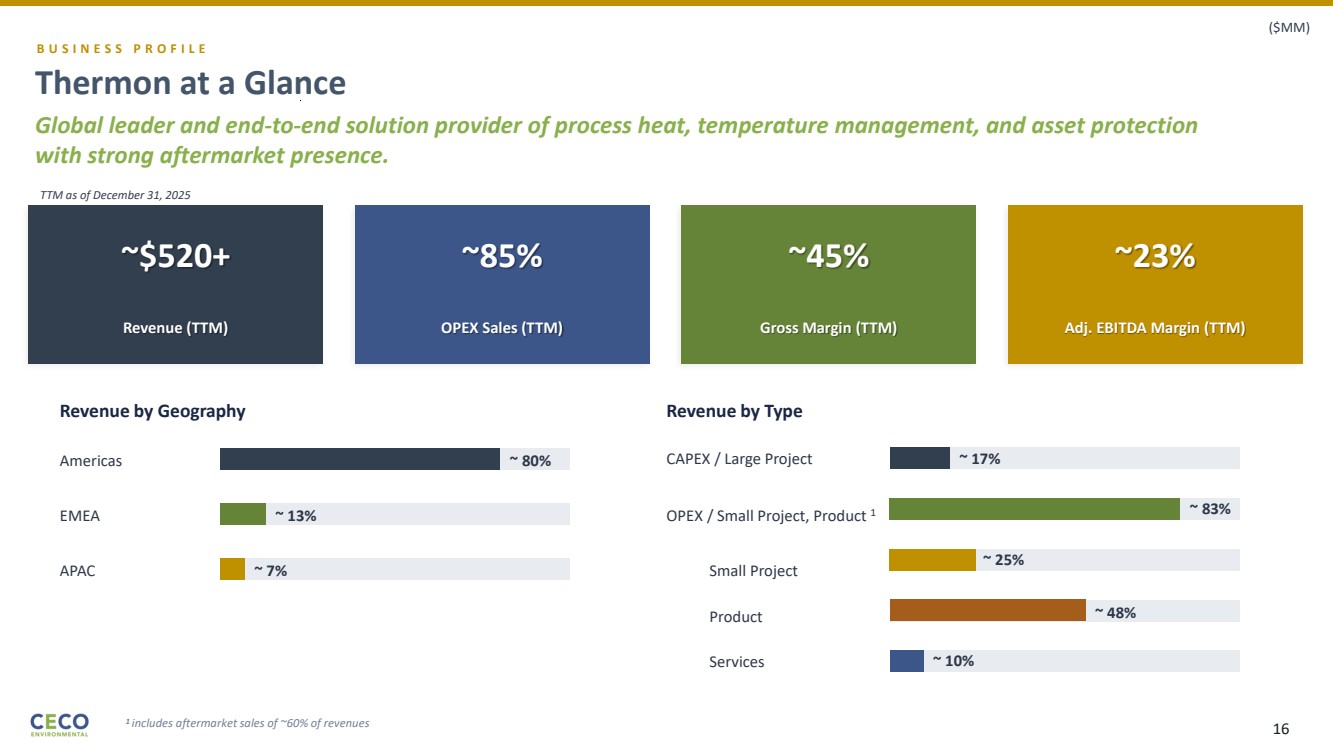
| B U S I N E S S P R O F I L E Thermon at a Glance Global leader and end-to-end solution provider of process heat, temperature management, and asset protection with strong aftermarket presence. Revenue by Geography Americas ~ 80% EMEA ~ 13% APAC ~ 7% Revenue by Type OPEX / Small Project, Product 1 ~ 83% CAPEX / Large Project ~ 17% 1 includes aftermarket sales of ~60% of revenues Small Project ~ 25% Product ~ 48% Services ~ 10% TTM as of December 31, 2025 ~$520+ Revenue (TTM) ~85% OPEX Sales (TTM) ~45% Gross Margin (TTM) ~23% Adj. EBITDA Margin (TTM) ($MM) 16 |
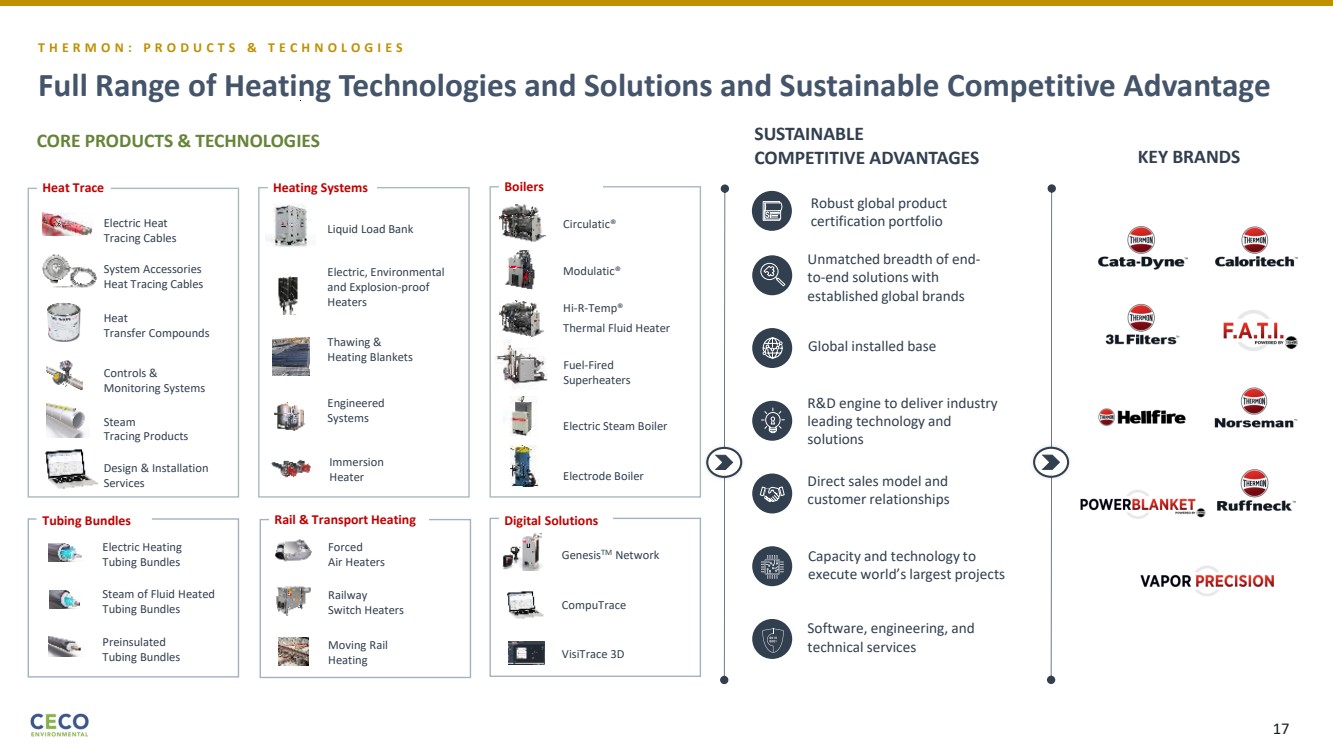
| SUSTAINABLE COMPETITIVE ADVANTAGES Forced Air Heaters Moving Rail Heating Railway Switch Heaters Electric Heating Tubing Bundles Steam of Fluid Heated Tubing Bundles Preinsulated Tubing Bundles GenesisTM Network CompuTrace VisiTrace 3D Full Range of Heating Technologies and Solutions and Sustainable Competitive Advantage Robust global product certification portfolio Capacity and technology to execute world’s largest projects Direct sales model and customer relationships R&D engine to deliver industry leading technology and solutions Global installed base Unmatched breadth of end-to-end solutions with established global brands Software, engineering, and technical services Circulatic® Modulatic® Hi-R-Temp® Thermal Fluid Heater Electrode Boiler Electric Steam Boiler Fuel-Fired Superheaters CORE PRODUCTS & TECHNOLOGIES Electric Heat Tracing Cables Heat Transfer Compounds Steam Tracing Products System Accessories Heat Tracing Cables Controls & Monitoring Systems Design & Installation Services Heat Trace Electric, Environmental and Explosion-proof Heaters Thawing & Heating Blankets Immersion Heater Engineered Systems Liquid Load Bank Heating Systems Boilers Tubing Bundles Rail & Transport Heating Digital Solutions T H E R M O N : P R O D U C T S & T E C H N O L O G I E S KEY BRANDS 17 |
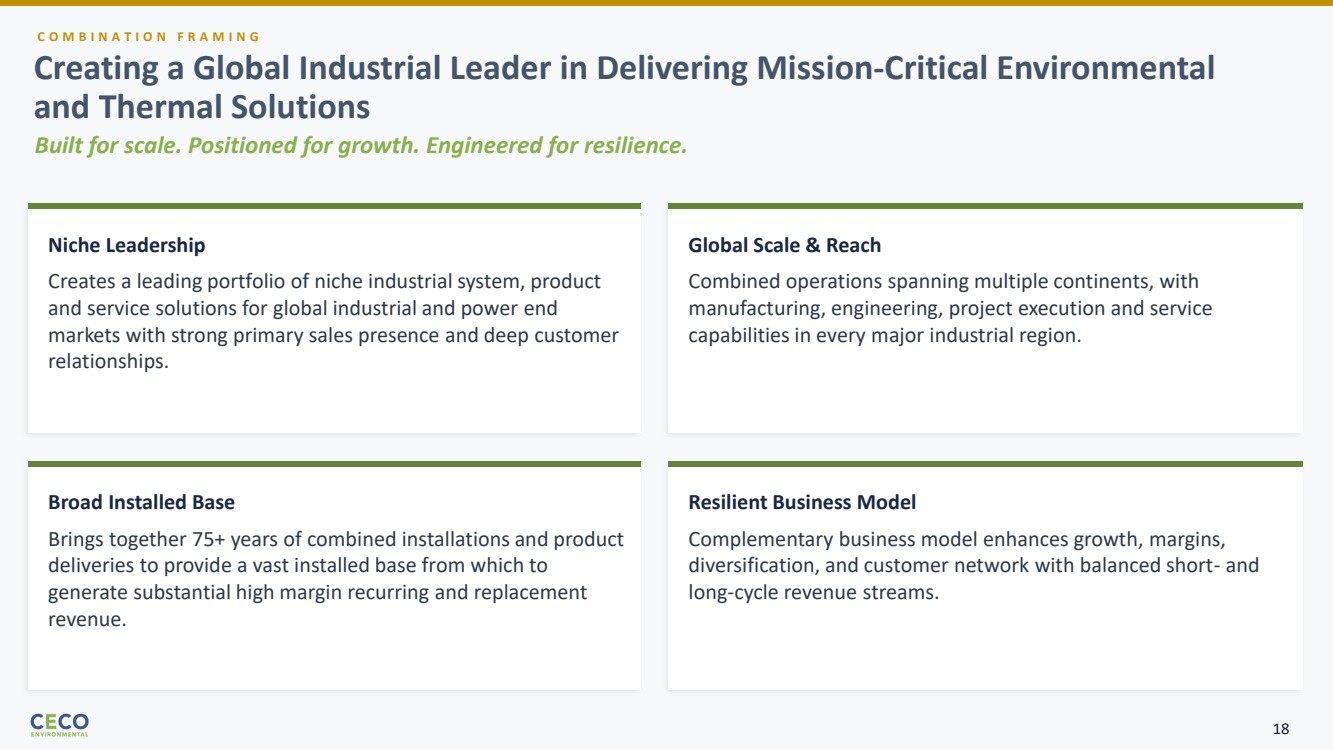
| C O M B I N A T I O N F R A M I N G Built for scale. Positioned for growth. Engineered for resilience. Niche Leadership Creates a leading portfolio of niche industrial system, product and service solutions for global industrial and power end markets with strong primary sales presence and deep customer relationships. Global Scale & Reach Combined operations spanning multiple continents, with manufacturing, engineering, project execution and service capabilities in every major industrial region. Broad Installed Base Brings together 75+ years of combined installations and product deliveries to provide a vast installed base from which to generate substantial high margin recurring and replacement revenue. Resilient Business Model Complementary business model enhances growth, margins, diversification, and customer network with balanced short- and long-cycle revenue streams. Creating a Global Industrial Leader in Delivering Mission-Critical Environmental and Thermal Solutions 18 |
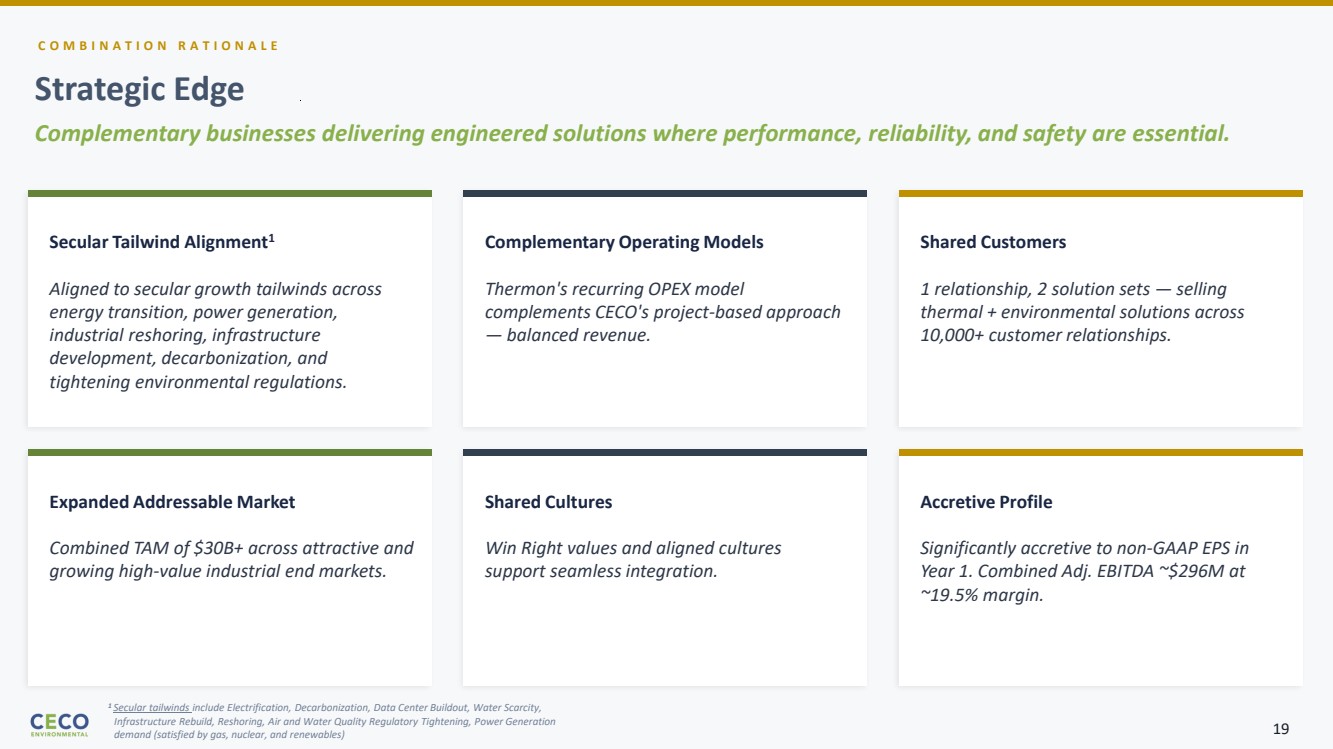
| C O M B I N A T I O N R A T I O N A L E Strategic Edge Complementary businesses delivering engineered solutions where performance, reliability, and safety are essential. Secular Tailwind Alignment1 Aligned to secular growth tailwinds across energy transition, power generation, industrial reshoring, infrastructure development, decarbonization, and tightening environmental regulations. Complementary Operating Models Thermon's recurring OPEX model complements CECO's project-based approach — balanced revenue. Shared Customers 1 relationship, 2 solution sets — selling thermal + environmental solutions across 10,000+ customer relationships. Expanded Addressable Market Combined TAM of $30B+ across attractive and growing high-value industrial end markets. Shared Cultures Win Right values and aligned cultures support seamless integration. Accretive Profile Significantly accretive to non-GAAP EPS in Year 1. Combined Adj. EBITDA ~$296M at ~19.5% margin. 1 Secular tailwinds include Electrification, Decarbonization, Data Center Buildout, Water Scarcity, Infrastructure Rebuild, Reshoring, Air and Water Quality Regulatory Tightening, Power Generation demand (satisfied by gas, nuclear, and renewables) 19 |
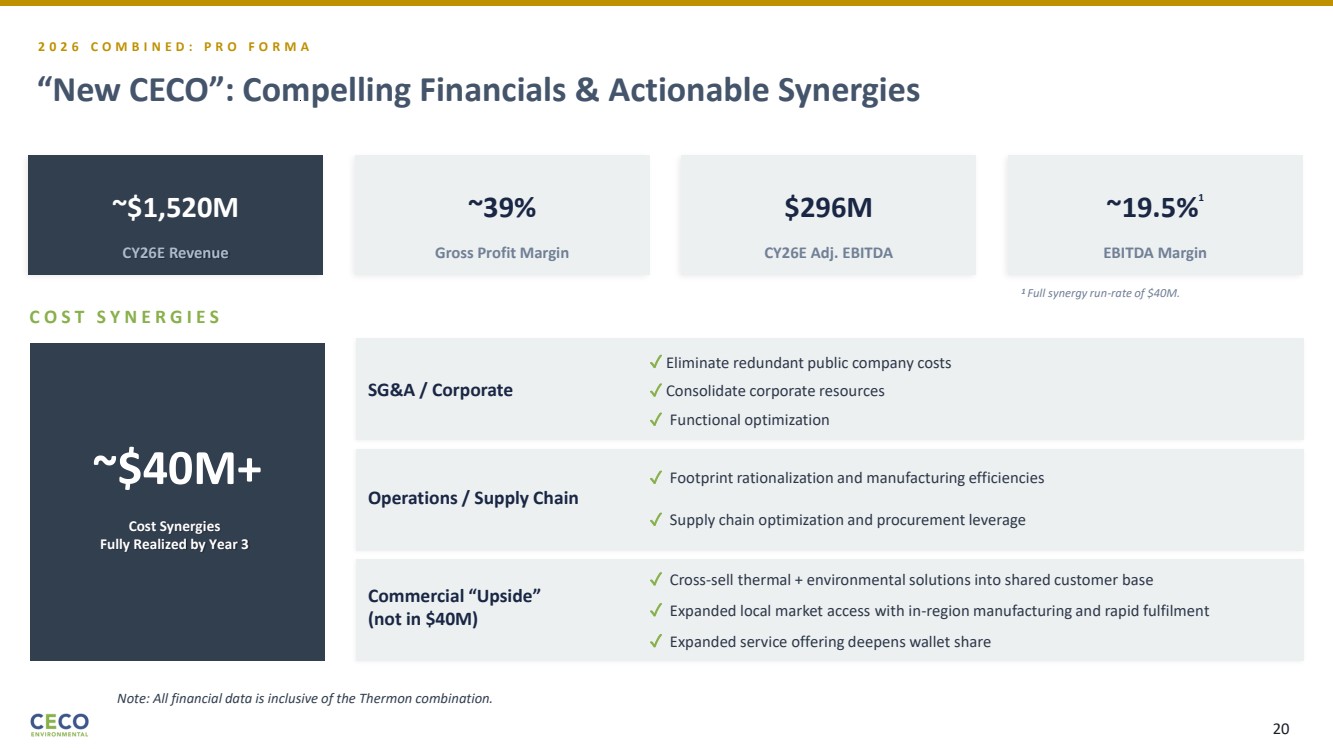
| 2 0 2 6 C O M B I N E D : P R O F O R M A “New CECO”: Compelling Financials & Actionable Synergies ~$1,520M CY26E Revenue ~39% Gross Profit Margin $296M CY26E Adj. EBITDA ~19.5%1 EBITDA Margin C O S T S Y N E R G I E S ~$40M+ Cost Synergies Fully Realized by Year 3 SG&A / Corporate ✓ Eliminate redundant public company costs ✓ Functional optimization Operations / Supply Chain ✓ Footprint rationalization and manufacturing efficiencies ✓ Supply chain optimization and procurement leverage Commercial “Upside” (not in $40M) ✓ Cross-sell thermal + environmental solutions into shared customer base ✓ Expanded service offering deepens wallet share ✓ Consolidate corporate resources ✓ Expanded local market access with in-region manufacturing and rapid fulfilment 1 Full synergy run-rate of $40M. Note: All financial data is inclusive of the Thermon combination. 20 |
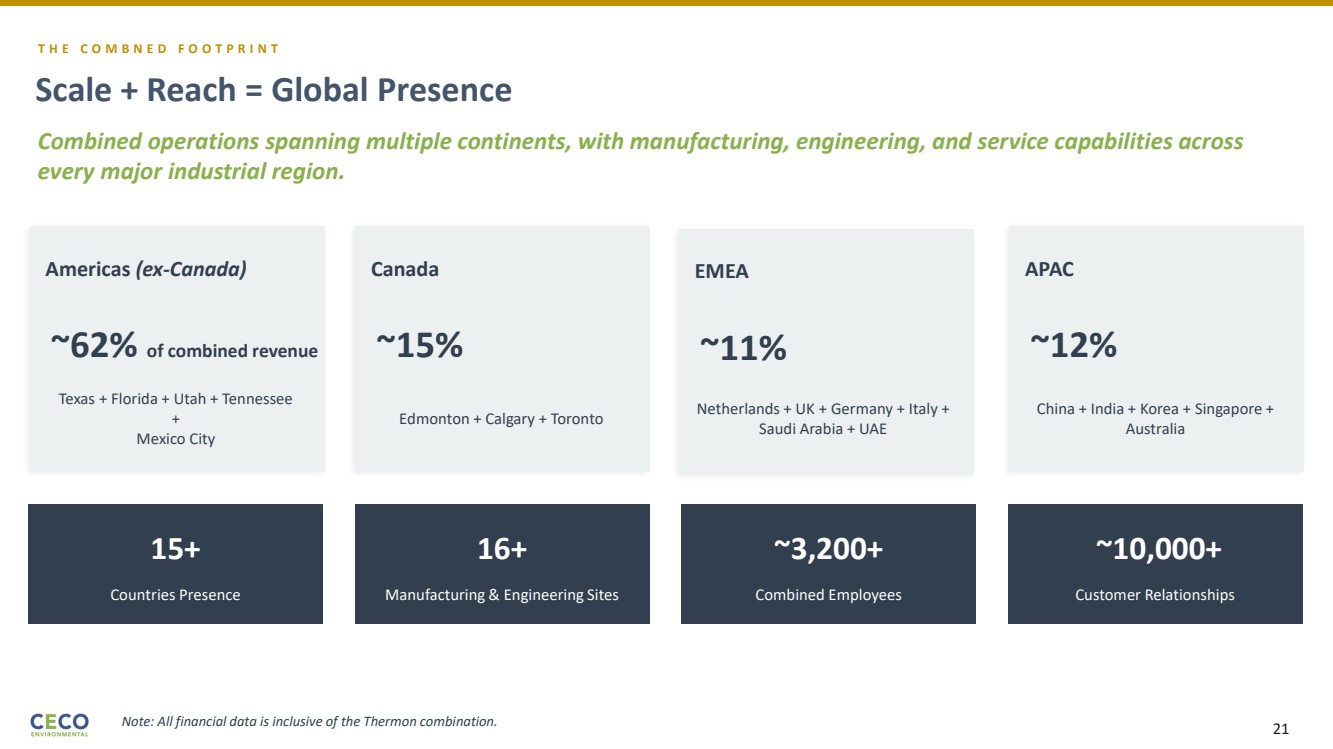
| T H E C O M B N E D F O O T P R I N T Scale + Reach = Global Presence Combined operations spanning multiple continents, with manufacturing, engineering, and service capabilities across every major industrial region. Americas (ex-Canada) ~62% of combined revenue Texas + Florida + Utah + Tennessee + Mexico City EMEA ~11% Netherlands + UK + Germany + Italy + Saudi Arabia + UAE Canada ~15% Edmonton + Calgary + Toronto APAC ~12% China + India + Korea + Singapore + Australia 15+ Countries Presence 16+ Manufacturing & Engineering Sites ~3,200+ Combined Employees ~10,000+ Customer Relationships Note: All financial data is inclusive of the Thermon combination. 21 |
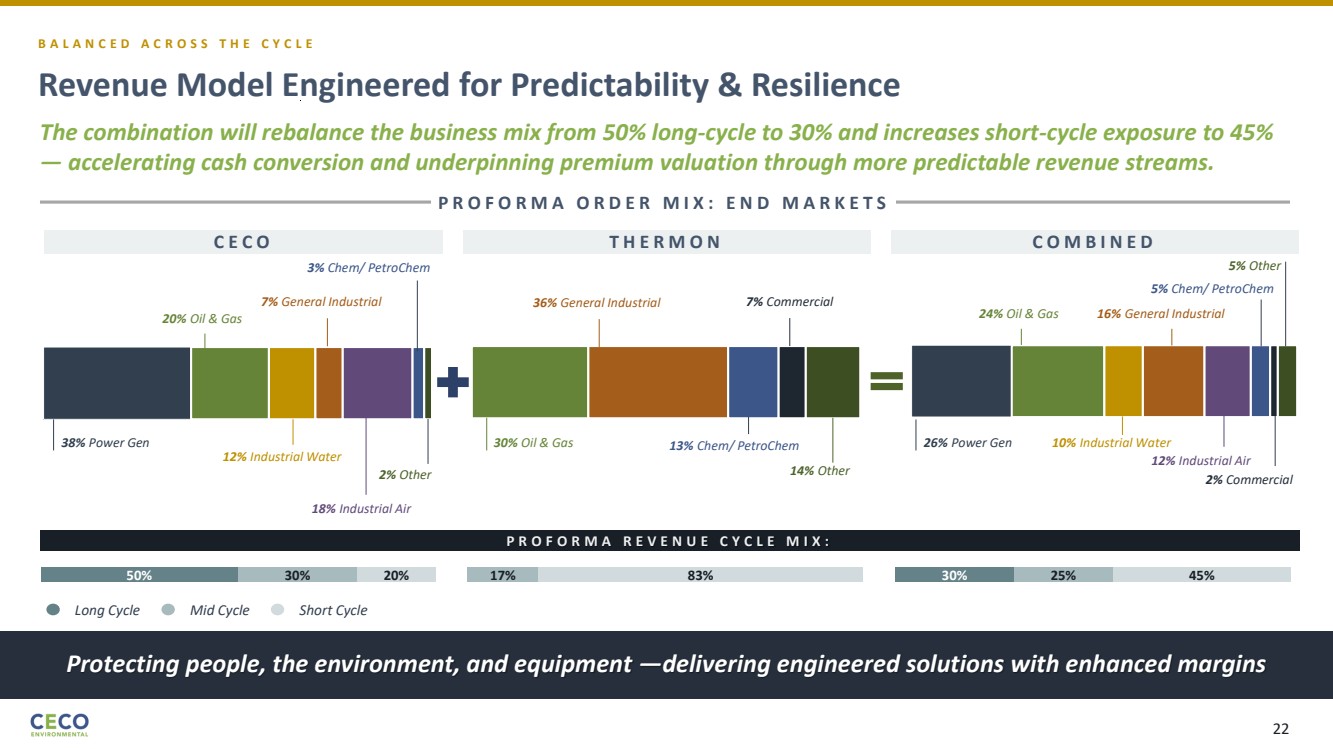
| The combination will rebalance the business mix from 50% long-cycle to 30% and increases short-cycle exposure to 45% — accelerating cash conversion and underpinning premium valuation through more predictable revenue streams. C E C O Revenue Model Engineered for Predictability & Resilience Protecting people, the environment, and equipment —delivering engineered solutions with enhanced margins B A L A N C E D A C R O S S T H E C Y C L E Long Cycle Mid Cycle Short Cycle P R O F O R M A O R D E R M I X : E N D M A R K E T S 38% Power Gen 20% Oil & Gas 12% Industrial Water 7% General Industrial 18% Industrial Air 2% Other 3% Chem/ PetroChem 50% 30% 20% 30% Oil & Gas 36% General Industrial 13% Chem/ PetroChem 7% Commercial 14% Other 17% 83% T H E R M O N C O M B I N E D 30% 25% 45% 26% Power Gen 24% Oil & Gas 10% Industrial Water 16% General Industrial 12% Industrial Air 5% Other 5% Chem/ PetroChem 2% Commercial P R O F O R M A R E V E N U E C Y C L E M I X : 22 |
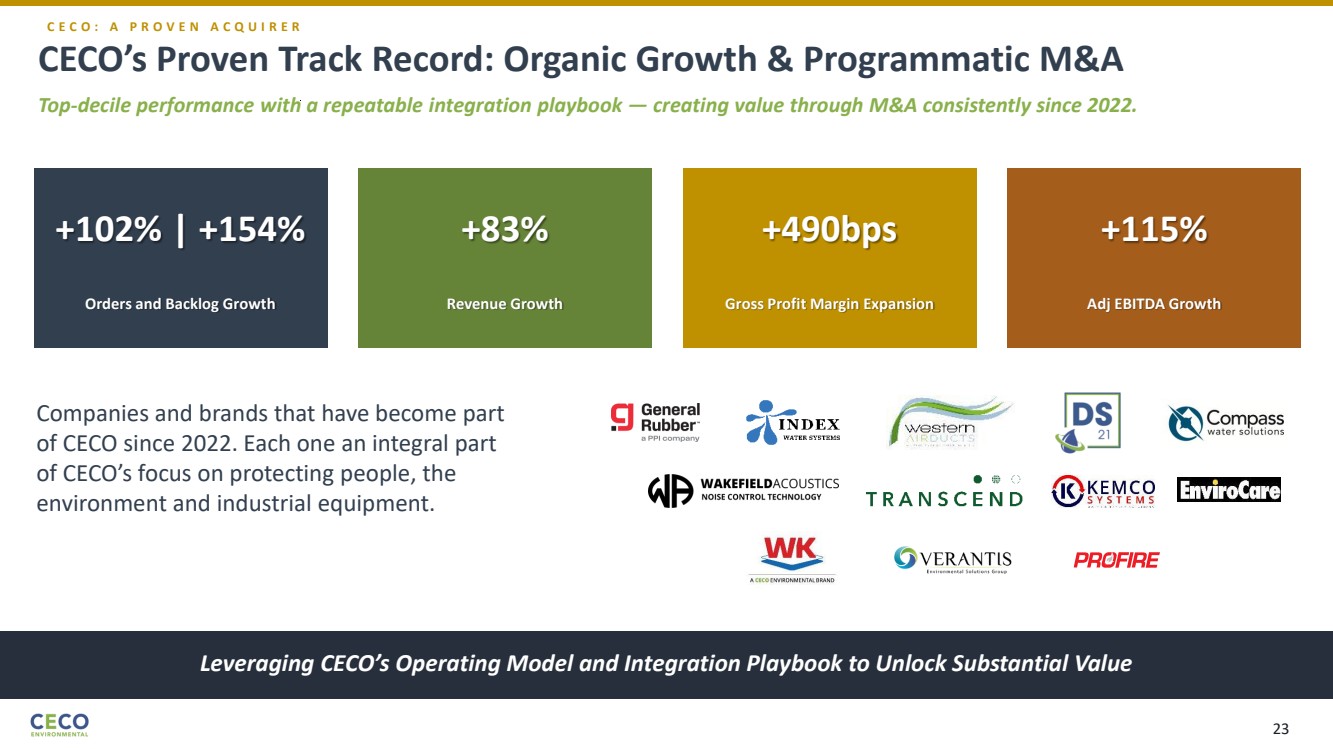
| +102% | +154% Orders and Backlog Growth +83% Revenue Growth +490bps Gross Profit Margin Expansion +115% Adj EBITDA Growth Companies and brands that have become part of CECO since 2022. Each one an integral part of CECO’s focus on protecting people, the environment and industrial equipment. CECO’s Proven Track Record: Organic Growth & Programmatic M&A Top-decile performance with a repeatable integration playbook — creating value through M&A consistently since 2022. Leveraging CECO’s Operating Model and Integration Playbook to Unlock Substantial Value C E C O : A P R O V E N A C Q U I R E R 23 |
| We Are Stronger Together Creating a premier leader in mission-critical engineered solutions — protecting people, the environment, and industrial equipment while delivering superior value to all stakeholders. Growth Platform & Culture Resilient Financial Profile Powerful Value Creation 24 |
| APPENDIX 25 |

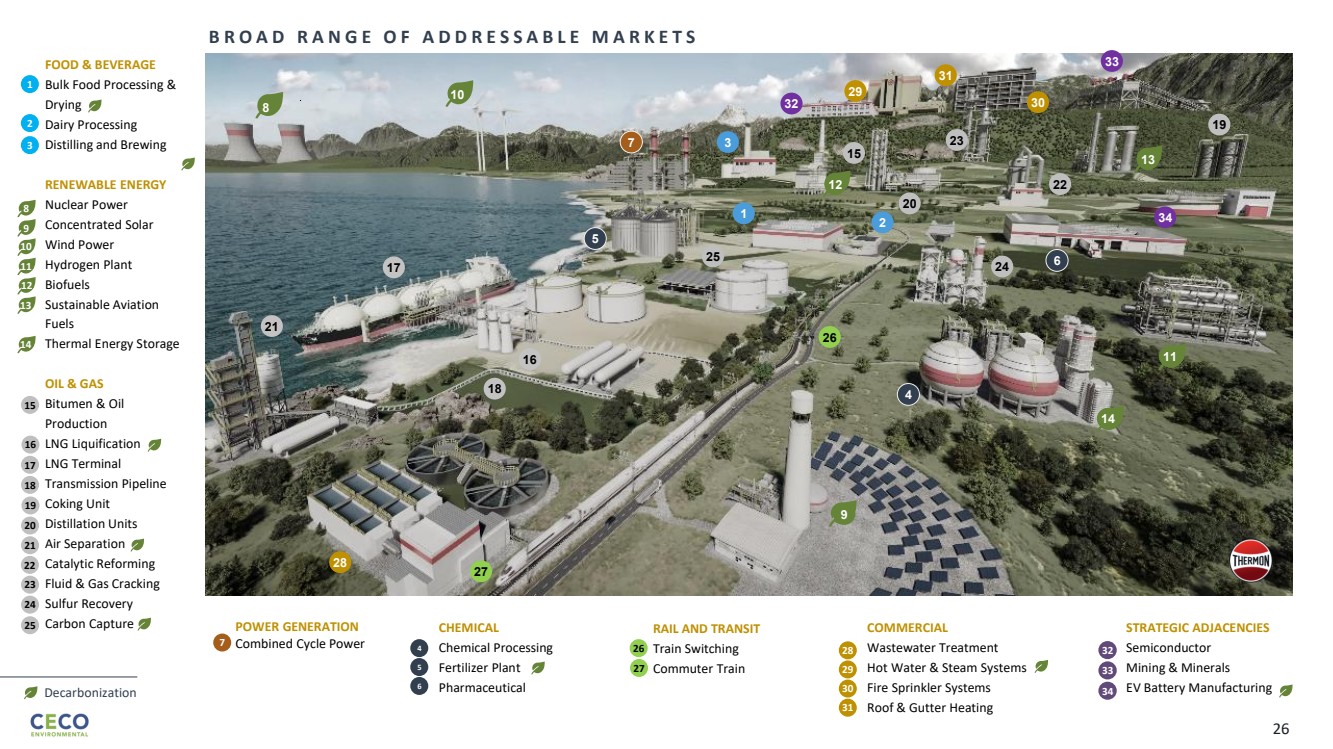
| STRATEGIC ADJACENCIES Semiconductor Mining & Minerals EV Battery Manufacturing FOOD & BEVERAGE Bulk Food Processing & Drying Dairy Processing Distilling and Brewing RENEWABLE ENERGY Nuclear Power Concentrated Solar Wind Power Hydrogen Plant Biofuels Sustainable Aviation Fuels Thermal Energy Storage OIL & GAS Bitumen & Oil Production LNG Liquification LNG Terminal Transmission Pipeline Coking Unit Distillation Units Air Separation Catalytic Reforming Fluid & Gas Cracking Sulfur Recovery Carbon Capture 34 32 33 26 27 4 5 6 7 1 2 3 11 12 13 14 8 9 10 30 31 28 29 15 16 17 18 19 20 21 22 23 24 25 B R O A D R A N G E O F A D D R E S S A B L E M A R K E T S 7 8 3 21 17 16 18 28 27 26 32 34 33 29 5 4 6 19 1 24 15 23 22 30 31 2 20 25 10 13 11 12 14 9 COMMERCIAL Wastewater Treatment Hot Water & Steam Systems Fire Sprinkler Systems Roof & Gutter Heating RAIL AND TRANSIT Train Switching Commuter Train CHEMICAL Chemical Processing Fertilizer Plant Pharmaceutical POWER GENERATION Combined Cycle Power Decarbonization 26 |
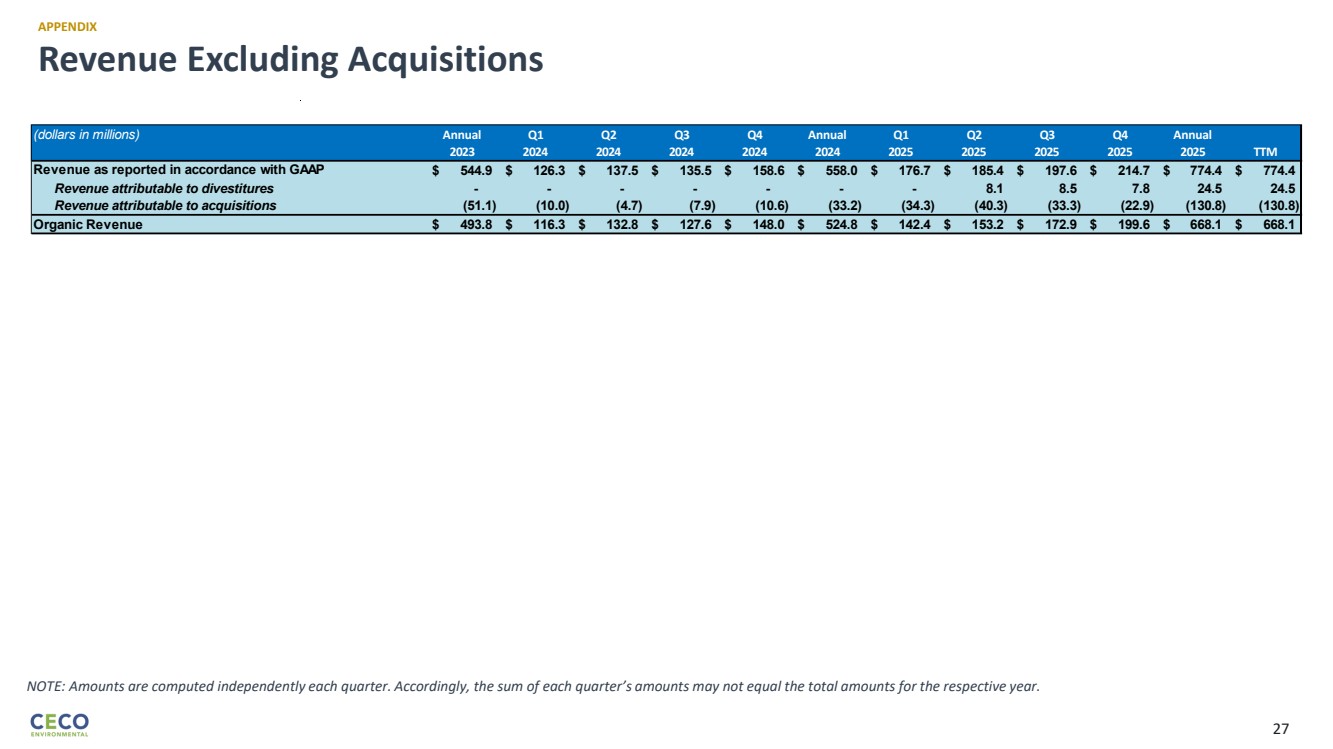
| Revenue Excluding Acquisitions APPENDIX NOTE: Amounts are computed independently each quarter. Accordingly, the sum of each quarter’s amounts may not equal the total amounts for the respective year. (dollars in millions) Annual Q1 Q2 Q3 Q4 Annual Q1 Q2 Q3 Q4 Annual 2023 2024 2024 2024 2024 2024 2025 2025 2025 2025 2025 TTM $ 544.9 $ 126.3 $ 137.5 $ 135.5 $ 158.6 $ 558.0 $ 176.7 $ 185.4 $ 197.6 $ 214.7 $ 774.4 $ 774.4 - - - - - - - 8.1 8.5 7.8 24.5 24.5 (51.1) (10.0) (4.7) (7.9) (10.6) (33.2) (34.3) (40.3) (33.3) (22.9) (130.8) (130.8) Organic Revenue $ 493.8 $ 116.3 $ 132.8 $ 127.6 $ 148.0 $ 524.8 $ 142.4 $ 153.2 $ 172.9 $ 199.6 $ 668.1 $ 668.1 Revenue as reported in accordance with GAAP Revenue attributable to divestitures Revenue attributable to acquisitions 27 |
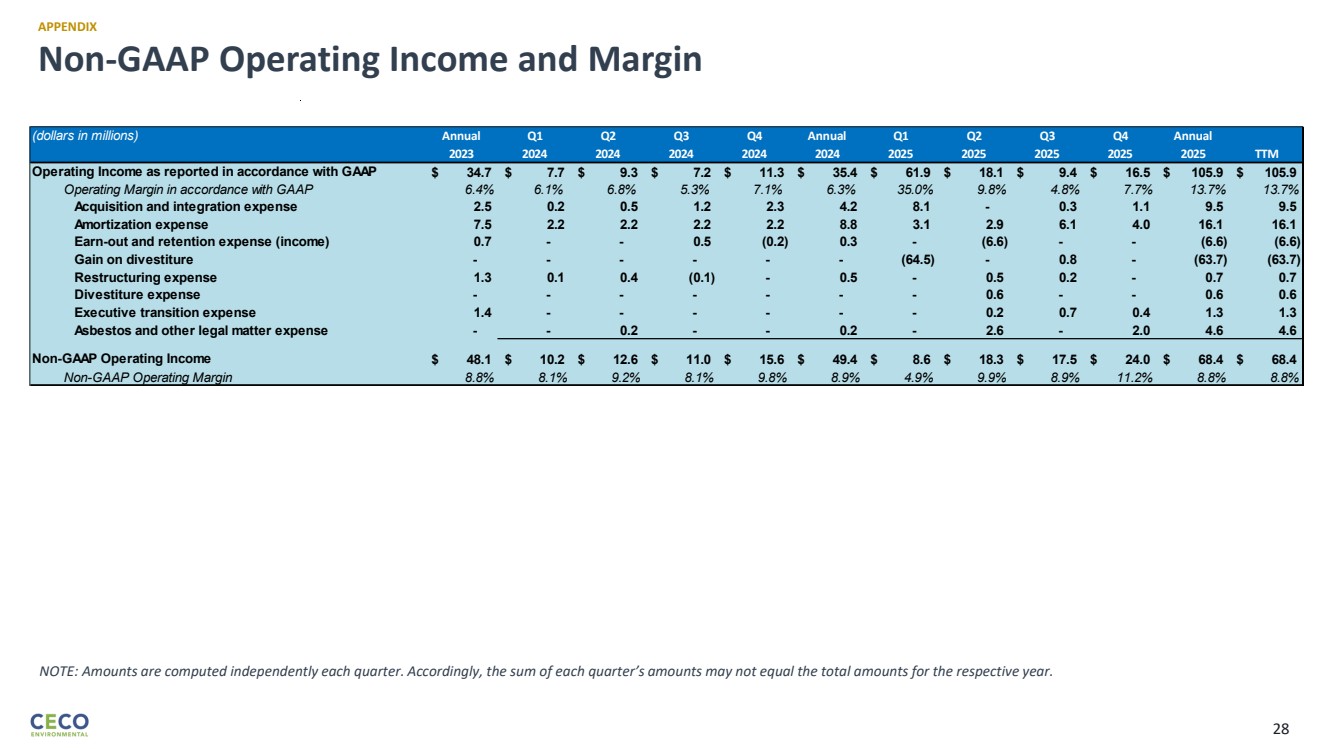
| Non-GAAP Operating Income and Margin APPENDIX NOTE: Amounts are computed independently each quarter. Accordingly, the sum of each quarter’s amounts may not equal the total amounts for the respective year. (dollars in millions) Annual Q1 Q2 Q3 Q4 Annual Q1 Q2 Q3 Q4 Annual 2023 2024 2024 2024 2024 2024 2025 2025 2025 2025 2025 TTM $ 34.7 $ 7.7 $ 9.3 $ 7.2 $ 11.3 $ 35.4 $ 61.9 $ 18.1 $ 9.4 $ 16.5 $ 105.9 $ 105.9 Operating Margin in accordance with GAAP 6.4% 6.1% 6.8% 5.3% 7.1% 6.3% 35.0% 9.8% 4.8% 7.7% 13.7% 13.7% Acquisition and integration expense 2.5 0.2 0.5 1.2 2.3 4.2 8.1 - 0.3 1.1 9.5 9.5 Amortization expense 7.5 2.2 2.2 2.2 2.2 8.8 3.1 2.9 6.1 4.0 16.1 16.1 Earn-out and retention expense (income) 0.7 - - 0.5 (0.2) 0.3 - (6.6) - - (6.6) (6.6) Gain on divestiture - - - - - - (64.5) - 0.8 - (63.7) (63.7) Restructuring expense 1.3 0.1 0.4 (0.1) - 0.5 - 0.5 0.2 - 0.7 0.7 Divestiture expense - - - - - - - 0.6 - - 0.6 0.6 Executive transition expense 1.4 - - - - - - 0.2 0.7 0.4 1.3 1.3 Asbestos and other legal matter expense - - 0.2 - - 0.2 - 2.6 - 2.0 4.6 4.6 $ 48.1 $ 10.2 $ 12.6 $ 11.0 $ 15.6 $ 49.4 $ 8.6 $ 18.3 $ 17.5 $ 24.0 $ 68.4 $ 68.4 Non-GAAP Operating Margin 8.8% 8.1% 9.2% 8.1% 9.8% 8.9% 4.9% 9.9% 8.9% 11.2% 8.8% 8.8% Operating Income as reported in accordance with GAAP Non-GAAP Operating Income 28 |
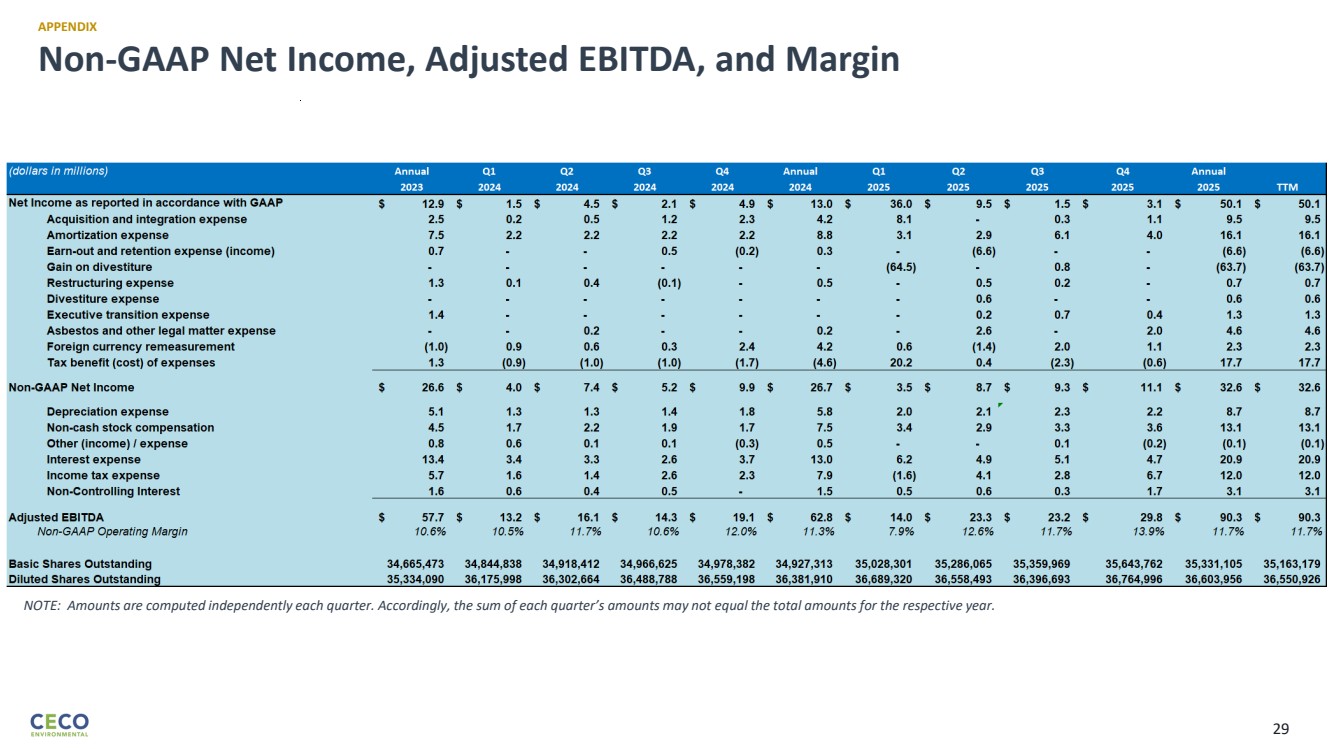
| Non-GAAP Net Income, Adjusted EBITDA, and Margin APPENDIX NOTE: Amounts are computed independently each quarter. Accordingly, the sum of each quarter’s amounts may not equal the total amounts for the respective year. 2) 2) 3) 4) 29 |
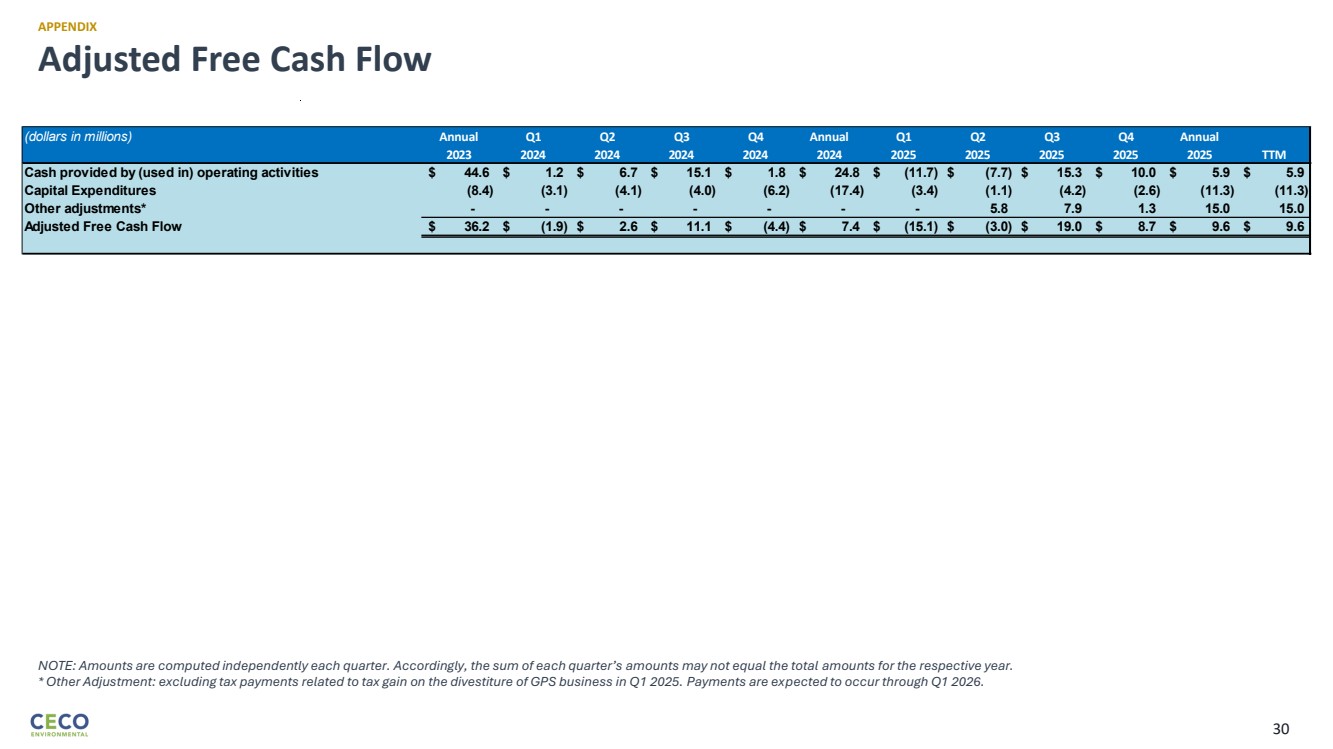
| Adjusted Free Cash Flow APPENDIX NOTE: Amounts are computed independently each quarter. Accordingly, the sum of each quarter’s amounts may not equal the total amounts for the respective year. * Other Adjustment: excluding tax payments related to tax gain on the divestiture of GPS business in Q1 2025. Payments are expected to occur through Q1 2026. (dollars in millions) Annual Q1 Q2 Q3 Q4 Annual Q1 Q2 Q3 Q4 Annual 2023 2024 2024 2024 2024 2024 2025 2025 2025 2025 2025 TTM Cash provided by (used in) operating activities $ 44.6 $ 1.2 $ 6.7 $ 15.1 $ 1.8 $ 24.8 $ (11.7) $ (7.7) $ 15.3 $ 10.0 $ 5.9 $ 5.9 Capital Expenditures (8.4) (3.1) (4.1) (4.0) (6.2) (17.4) (3.4) (1.1) (4.2) (2.6) (11.3) (11.3) Other adjustments* - - - - - - - 5.8 7.9 1.3 15.0 15.0 Adjusted Free Cash Flow $ 36.2 $ (1.9) $ 2.6 $ 11.1 $ (4.4) $ 7.4 $ (15.1) $ (3.0) $ 19.0 $ 8.7 $ 9.6 $ 9.6 30 |