| 4Q 2025 Earnings Conference Call February 24, 2026 |

| 2 Statements made during this presentation that set forth expectations, predictions, projections or are about future events are based on facts and situations that are known to us as of February 24, 2026. We believe that our expectations and assumptions are reasonable. Actual results may differ materially, due to risks and uncertainties, such as those described on pages 28-40 of our Form 10-Q filed on November 5, 2025 and other subsequent filings by Matson with the SEC. Statements made during this presentation are not guarantees of future performance. We do not undertake any obligation to update our forward-looking statements. 4Q 2025 Earnings Conference Call Forward-Looking Statements |
| 3 • Matson had a solid finish to the year with consolidated 4Q25 results that exceeded our expectations • Ocean Transportation ─ 4Q25 operating income approached the level achieved in the prior year period ▪ Primarily due to higher than expected freight rates and volume in our China service driven by strong e-commerce and e-goods demand ─ Our China service benefited from strong freight demand in our key customer segments as well as a more stable trading environment in the Transpacific tradelane ▪ The U.S.-China trade and economic deal announced on October 30, 2025 reduced uncertainty regarding tariffs, port entry fees, global trade and other geopolitical factors ─ Our domestic ocean tradelanes saw higher YoY volumes in Hawaii and Guam and lower YoY volume in Alaska • Logistics 4Q25 operating income decreased YoY primarily due to a lower contribution from supply chain management • Full year 2025 consolidated operating income decreased YoY ─ Primarily due to lower volume and freight rates in our China service over the last three quarters as customers managed freight in a challenging environment marked by uncertainty and volatility arising from tariffs and global trade • For full year 2026, we expect consolidated operating income to approach the level achieved in full year 2025 ─ We also expect to see a more normal operating income seasonality pattern 4Q 2025 Earnings Conference Call Opening Remarks |
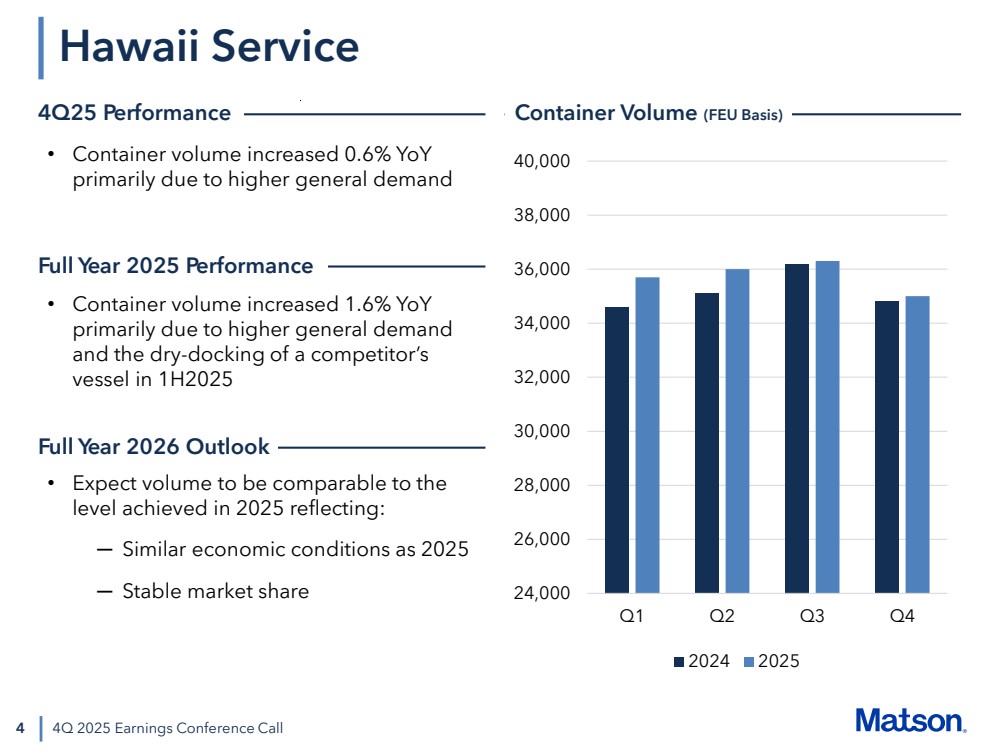
| 4 24,000 26,000 28,000 30,000 32,000 34,000 36,000 38,000 40,000 Q1 Q2 Q3 Q4 2024 2025 4Q 2025 Earnings Conference Call • Container volume increased 0.6% YoY primarily due to higher general demand • Expect volume to be comparable to the level achieved in 2025 reflecting: ─ Similar economic conditions as 2025 ─ Stable market share Hawaii Service 4Q25 Performance Container Volume (FEU Basis) Full Year 2026 Outlook Full Year 2025 Performance • Container volume increased 1.6% YoY primarily due to higher general demand and the dry-docking of a competitor’s vessel in 1H2025 |
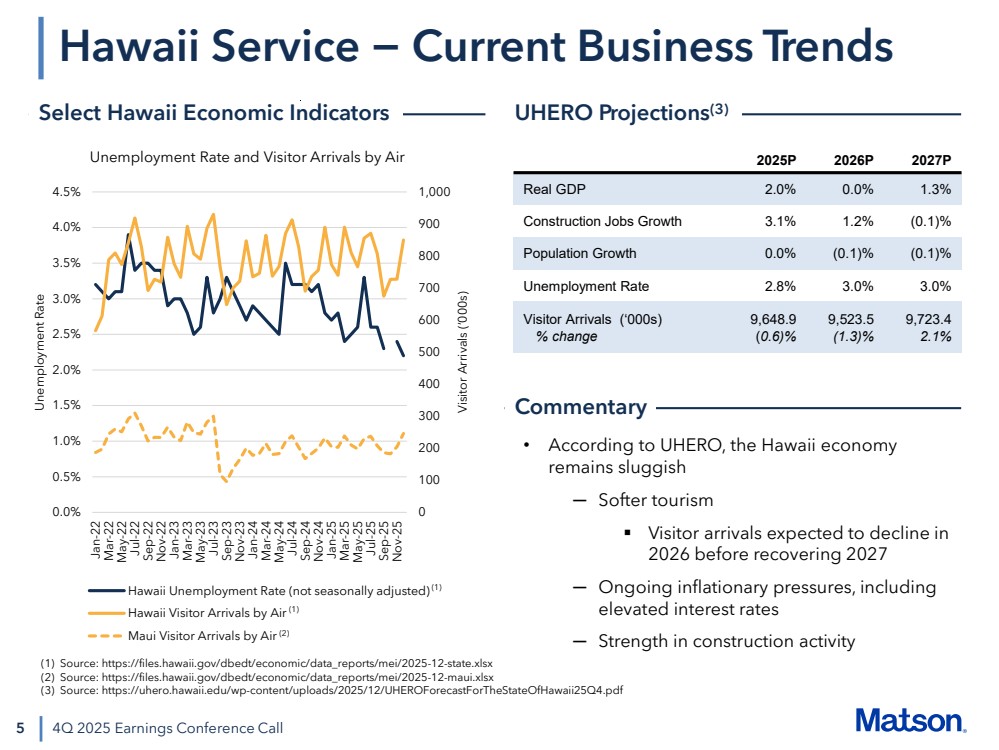
| 0 100 200 300 400 500 600 700 800 900 1,000 0.0% 0.5% 1.0% 1.5% 2.0% 2.5% 3.0% 3.5% 4.0% 4.5% Jan-22 Mar-22 May-22 Jul-22 Sep-22 Nov-22 Jan-23 Mar-23 May-23 Jul-23 Sep-23 Nov-23 Jan-24 Mar-24 May-24 Jul-24 Sep-24 Nov-24 Jan-25 Mar-25 May-25 Jul-25 Sep-25 Nov-25 Unemployment Rate Visitor Arrivals (‘000s) Unemployment Rate and Visitor Arrivals by Air Hawaii Unemployment Rate (not seasonally adjusted) Hawaii Visitor Arrivals by Air Maui Visitor Arrivals by Air 5 Hawaii Service − Current Business Trends 4Q 2025 Earnings Conference Call • According to UHERO, the Hawaii economy remains sluggish ─ Softer tourism ▪ Visitor arrivals expected to decline in 2026 before recovering 2027 ─ Ongoing inflationary pressures, including elevated interest rates ─ Strength in construction activity 2025P 2026P 2027P Real GDP 2.0% 0.0% 1.3% Construction Jobs Growth 3.1% 1.2% (0.1)% Population Growth 0.0% (0.1)% (0.1)% Unemployment Rate 2.8% 3.0% 3.0% Visitor Arrivals (‘000s) % change 9,648.9 (0.6)% 9,523.5 (1.3)% 9,723.4 2.1% Select Hawaii Economic Indicators UHERO Projections(3) Commentary (1) Source: https://files.hawaii.gov/dbedt/economic/data_reports/mei/2025-12-state.xlsx (2) Source: https://files.hawaii.gov/dbedt/economic/data_reports/mei/2025-12-maui.xlsx (3) Source: https://uhero.hawaii.edu/wp-content/uploads/2025/12/UHEROForecastForTheStateOfHawaii25Q4.pdf (1) (1) (2) |
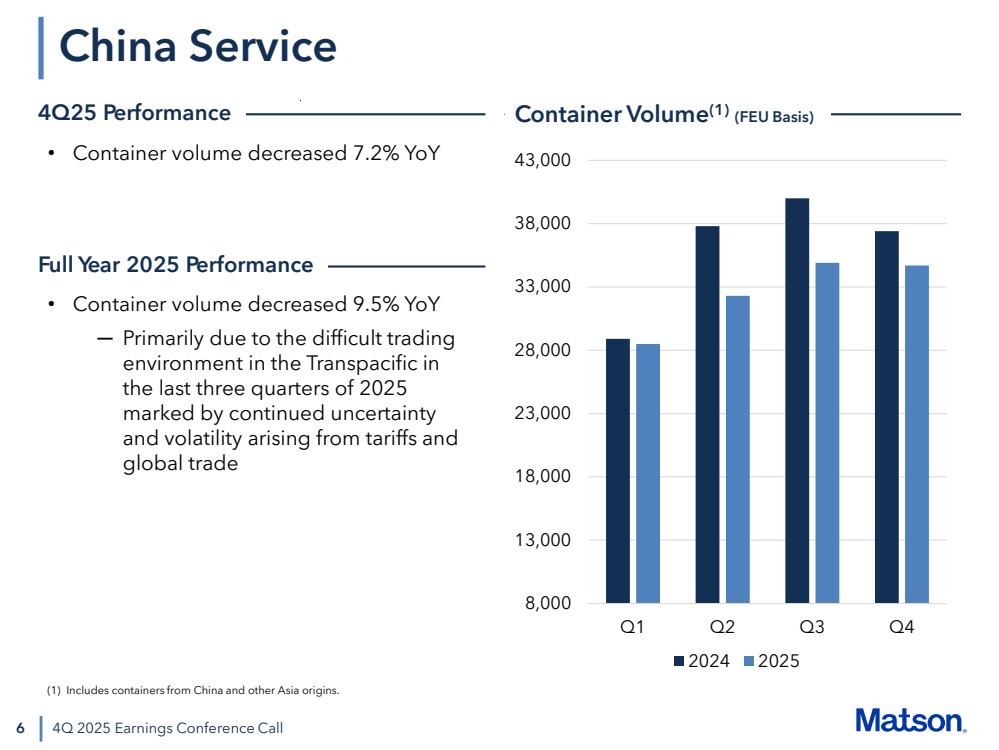
| 6 China Service 4Q 2025 Earnings Conference Call • Container volume decreased 7.2% YoY 4Q25 Performance Container Volume(1) (FEU Basis) 8,000 13,000 18,000 23,000 28,000 33,000 38,000 43,000 Q1 Q2 Q3 Q4 2024 2025 (1) Includes containers from China and other Asia origins. Full Year 2025 Performance • Container volume decreased 9.5% YoY ─ Primarily due to the difficult trading environment in the Transpacific in the last three quarters of 2025 marked by continued uncertainty and volatility arising from tariffs and global trade |
| 7 • In 4Q25, we saw higher than expected freight rates and volume driven by strong e-commerce and e-goods demand ─ Benefited from strong freight demand in our key customer segments as well as a more stable trading environment in the Transpacific tradelane ─ The U.S.-China trade and economic deal announced on October 30, 2025 reduced uncertainty regarding tariffs, port entry fees, global trade and other geopolitical factors • So far in 2026, we have experienced stable freight demand up to the Lunar New Year holiday in mid-February • We did not see a traditional bump in demand prior to Lunar New Year, but we expect freight demand to increase post-holiday as workers return to the factories and production ramps • For 1Q26, we expect lower volume compared to the prior year period as we return to a more traditional Lunar New Year freight cycle 4Q 2025 Earnings Conference Call China Service − Current Business Trends |
| 8 • For the full year 2026, we expect volume to be modestly higher than the level achieved in 2025 based on: ─ Continued solid U.S. consumer demand ─ Stable trading environment in the Transpacific tradelane ─ We expect to see a return to a more normal seasonality pattern with 2Q26 and 3Q26 being the strongest relative to 1Q26 and 4Q26 • The premium rates in our China service are reflective of our unique value proposition relative to air freight and the consistency and reliability of our CLX and MAX services ─ CLX and MAX are the fastest and second-fastest ocean services from Shanghai to Long Beach • We remain focused on expanding our network in Southeast Asia • We continue to believe the maximum tariff uncertainty is behind us with continued cooperation between the U.S. and China 4Q 2025 Earnings Conference Call China Service − Current Business Trends (continued) |
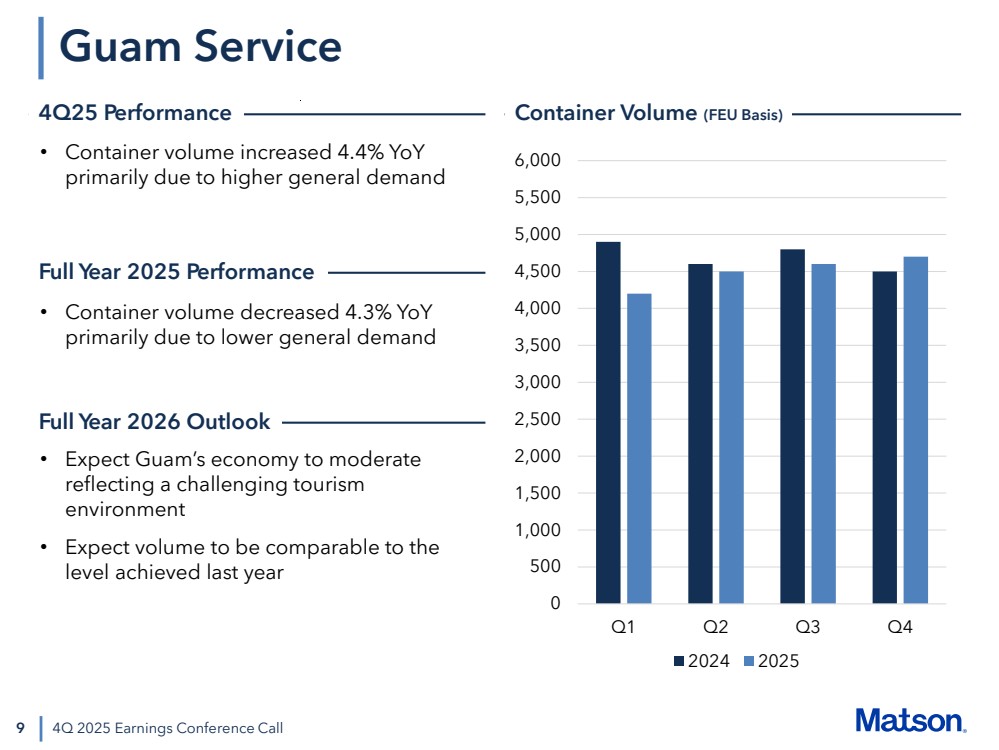
| 9 Guam Service 4Q 2025 Earnings Conference Call • Container volume increased 4.4% YoY primarily due to higher general demand • Expect Guam’s economy to moderate reflecting a challenging tourism environment • Expect volume to be comparable to the level achieved last year 4Q25 Performance Container Volume (FEU Basis) 0 500 1,000 1,500 2,000 2,500 3,000 3,500 4,000 4,500 5,000 5,500 6,000 Q1 Q2 Q3 Q4 2024 2025 Full Year 2026 Outlook Full Year 2025 Performance • Container volume decreased 4.3% YoY primarily due to lower general demand |
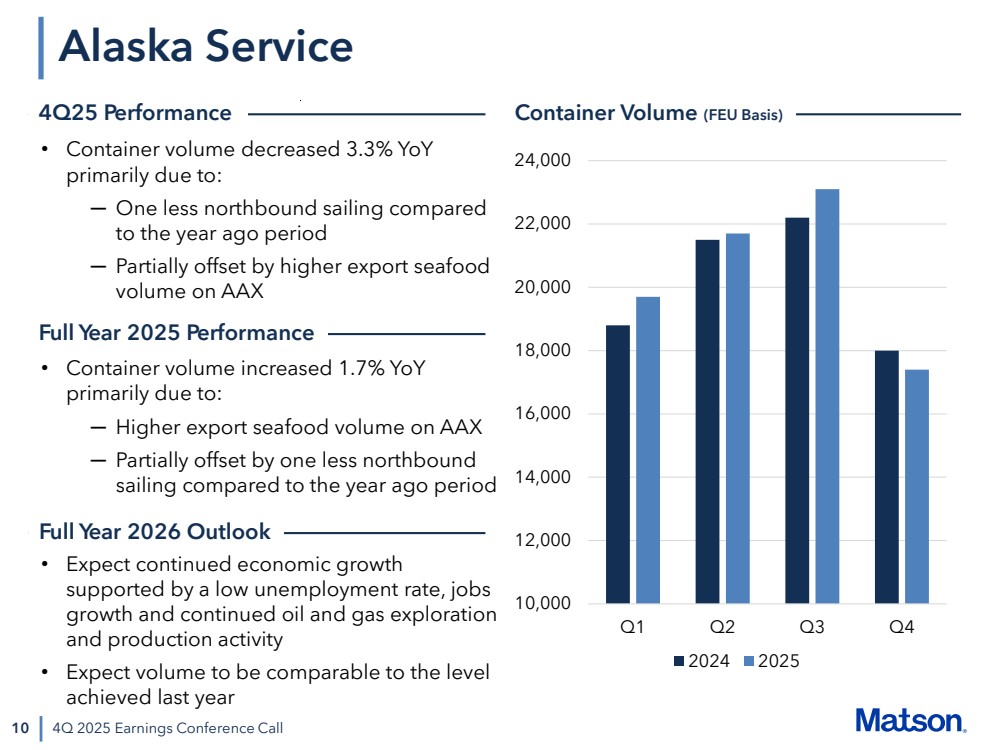
| 10 Alaska Service 4Q 2025 Earnings Conference Call • Container volume decreased 3.3% YoY primarily due to: ─ One less northbound sailing compared to the year ago period ─ Partially offset by higher export seafood volume on AAX 10,000 12,000 14,000 16,000 18,000 20,000 22,000 24,000 Q1 Q2 Q3 Q4 2024 2025 • Expect continued economic growth supported by a low unemployment rate, jobs growth and continued oil and gas exploration and production activity • Expect volume to be comparable to the level achieved last year 4Q25 Performance Container Volume (FEU Basis) Full Year 2026 Outlook Full Year 2025 Performance • Container volume increased 1.7% YoY primarily due to: ─ Higher export seafood volume on AAX ─ Partially offset by one less northbound sailing compared to the year ago period |
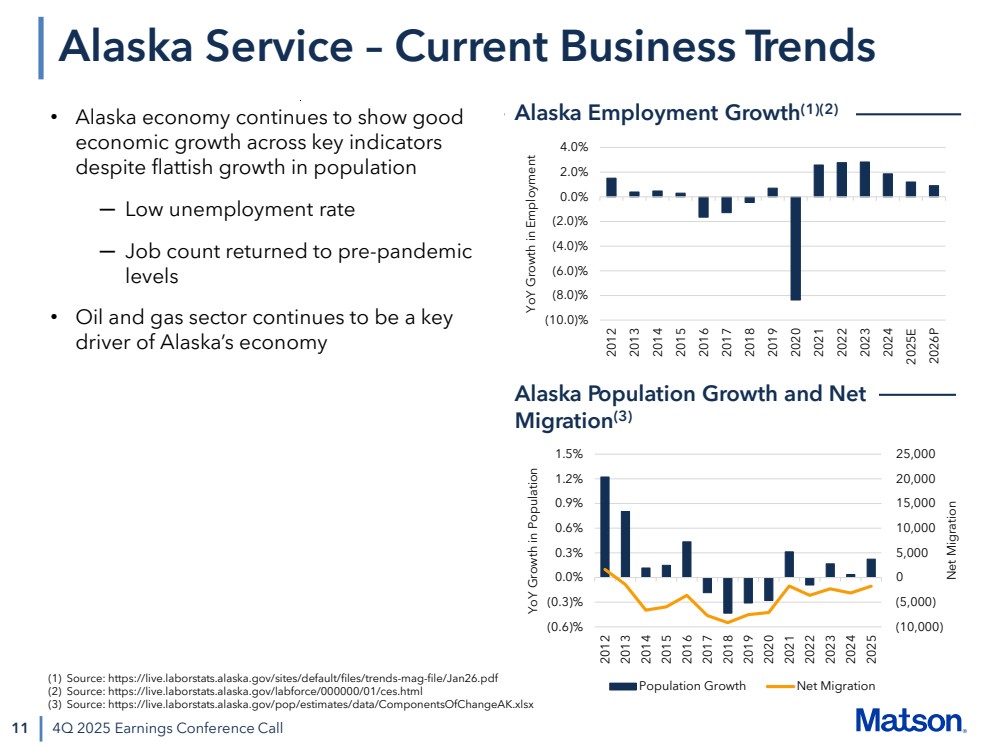
| (10.0)% (8.0)% (6.0)% (4.0)% (2.0)% 0.0% 2.0% 4.0% 2012 2013 2014 2015 2016 2017 2018 2019 2020 2021 2022 2023 2024 2025E 2026P YoY Growth in Employment 11 Alaska Service – Current Business Trends 4Q 2025 Earnings Conference Call • Alaska economy continues to show good economic growth across key indicators despite flattish growth in population ─ Low unemployment rate ─ Job count returned to pre-pandemic levels • Oil and gas sector continues to be a key driver of Alaska’s economy Alaska Employment Growth(1)(2) (10,000) (5,000) 0 5,000 10,000 15,000 20,000 25,000 (0.6)% (0.3)% 0.0% 0.3% 0.6% 0.9% 1.2% 1.5% 2012 2013 2014 2015 2016 2017 2018 2019 2020 2021 2022 2023 2024 2025 Net Migration YoY Growth in Population Population Growth Net Migration Alaska Population Growth and Net Migration(3) (1) Source: https://live.laborstats.alaska.gov/sites/default/files/trends-mag-file/Jan26.pdf (2) Source: https://live.laborstats.alaska.gov/labforce/000000/01/ces.html (3) Source: https://live.laborstats.alaska.gov/pop/estimates/data/ComponentsOfChangeAK.xlsx |
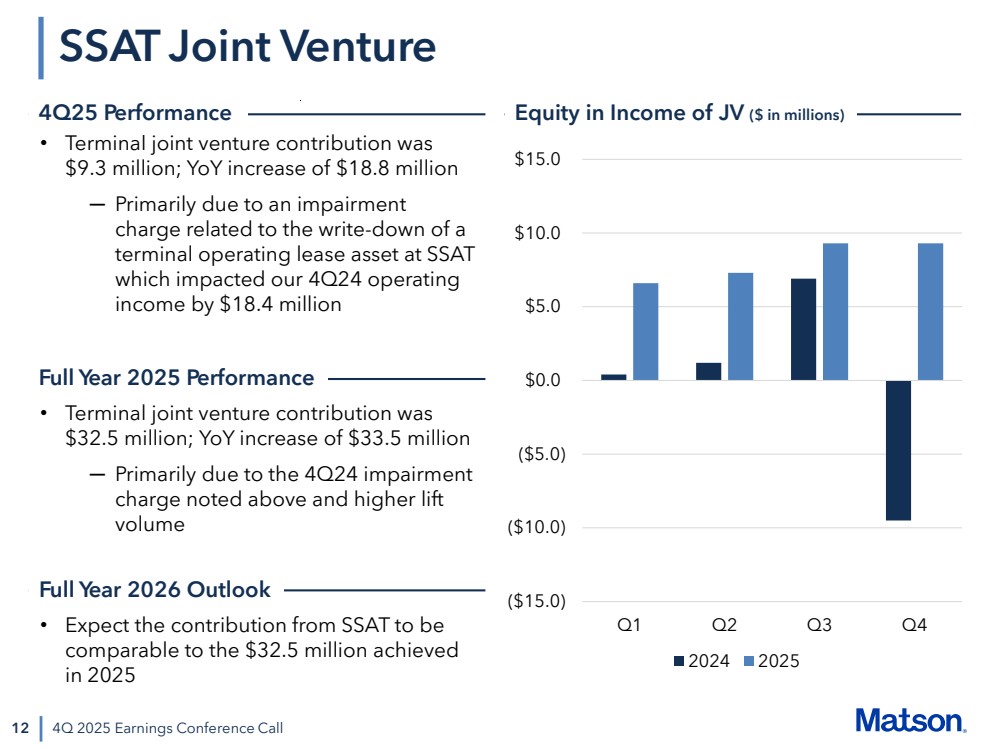
| 12 SSAT Joint Venture 4Q 2025 Earnings Conference Call • Terminal joint venture contribution was $9.3 million; YoY increase of $18.8 million ─ Primarily due to an impairment charge related to the write-down of a terminal operating lease asset at SSAT which impacted our 4Q24 operating income by $18.4 million ($15.0) ($10.0) ($5.0) $0.0 $5.0 $10.0 $15.0 Q1 Q2 Q3 Q4 2024 2025 4Q25 Performance Equity in Income of JV ($ in millions) • Expect the contribution from SSAT to be comparable to the $32.5 million achieved in 2025 Full Year 2026 Outlook Full Year 2025 Performance • Terminal joint venture contribution was $32.5 million; YoY increase of $33.5 million ─ Primarily due to the 4Q24 impairment charge noted above and higher lift volume |
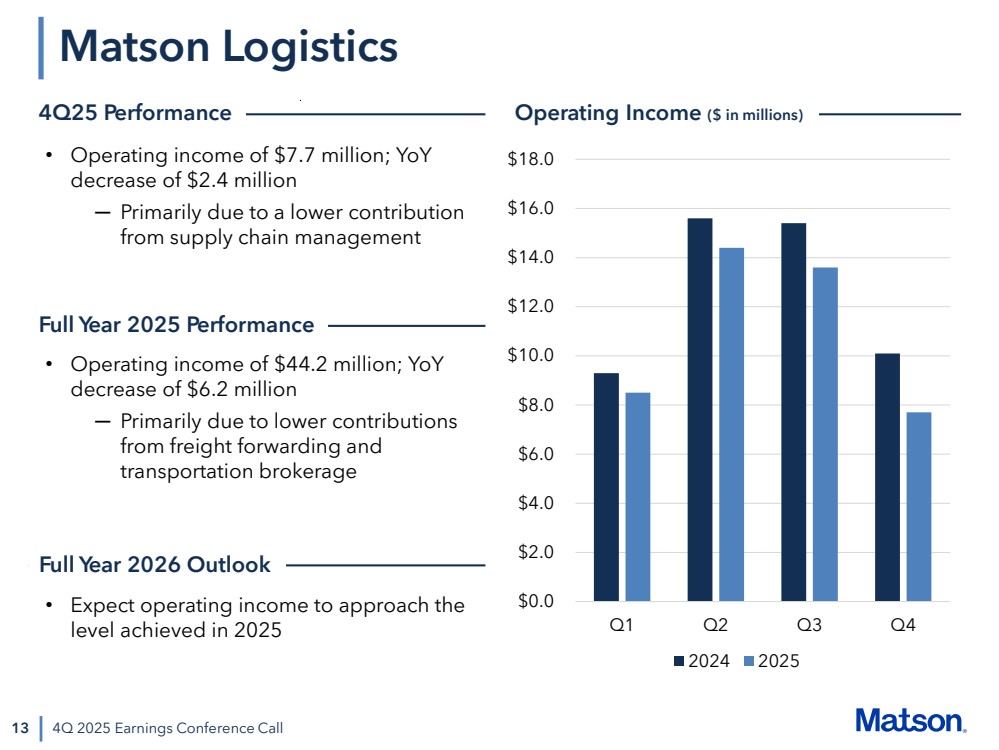
| 13 Matson Logistics 4Q 2025 Earnings Conference Call • Operating income of $7.7 million; YoY decrease of $2.4 million ─ Primarily due to a lower contribution from supply chain management $0.0 $2.0 $4.0 $6.0 $8.0 $10.0 $12.0 $14.0 $16.0 $18.0 Q1 Q2 Q3 Q4 2024 2025 • Expect operating income to approach the level achieved in 2025 4Q25 Performance Operating Income ($ in millions) Full Year 2026 Outlook Full Year 2025 Performance • Operating income of $44.2 million; YoY decrease of $6.2 million ─ Primarily due to lower contributions from freight forwarding and transportation brokerage |
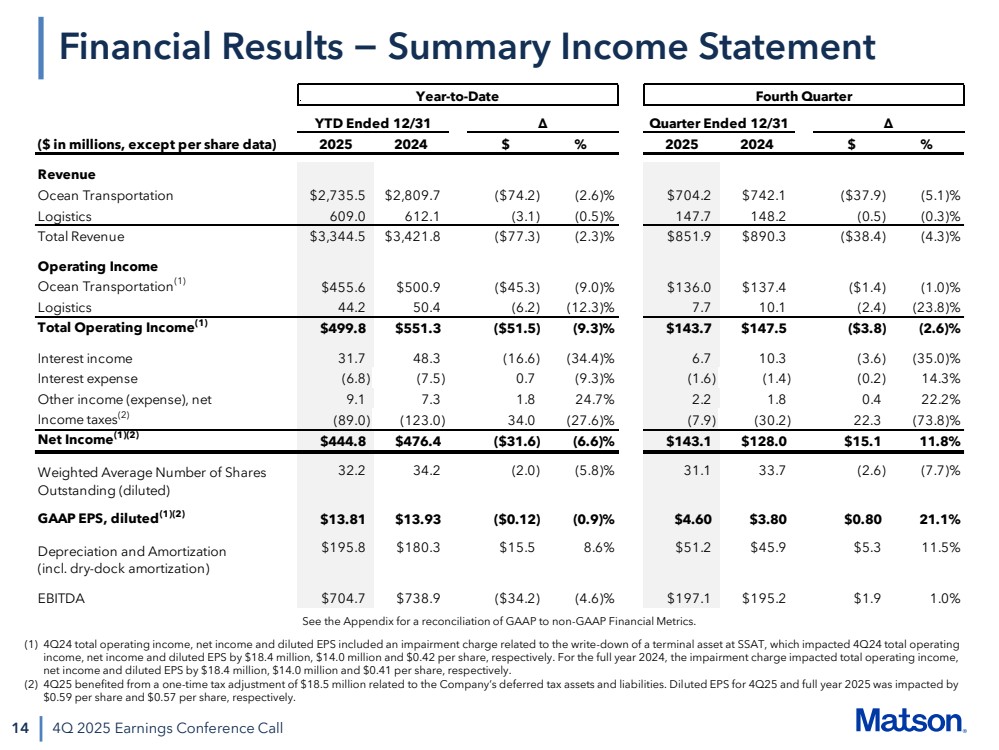
| 14 4Q 2025 Earnings Conference Call Financial Results − Summary Income Statement (1) 4Q24 total operating income, net income and diluted EPS included an impairment charge related to the write-down of a terminal asset at SSAT, which impacted 4Q24 total operating income, net income and diluted EPS by $18.4 million, $14.0 million and $0.42 per share, respectively. For the full year 2024, the impairment charge impacted total operating income, net income and diluted EPS by $18.4 million, $14.0 million and $0.41 per share, respectively. (2) 4Q25 benefited from a one-time tax adjustment of $18.5 million related to the Company’s deferred tax assets and liabilities. Diluted EPS for 4Q25 and full year 2025 was impacted by $0.59 per share and $0.57 per share, respectively. See the Appendix for a reconciliation of GAAP to non-GAAP Financial Metrics. Year-to-Date Fourth Quarter YTD Ended 12/31 Δ Quarter Ended 12/31 Δ ($ in millions, except per share data) 2025 2024 $ % 2025 2024 $ % Revenue Ocean Transportation $2,735.5 $2,809.7 ($74.2) (2.6)% $704.2 $742.1 ($37.9) (5.1)% Logistics 609.0 612.1 (3.1) (0.5)% 147.7 148.2 (0.5) (0.3)% Total Revenue $3,344.5 $3,421.8 ($77.3) (2.3)% $851.9 $890.3 ($38.4) (4.3)% Operating Income Ocean Transportation(1) $455.6 $500.9 ($45.3) (9.0)% $136.0 $137.4 ($1.4) (1.0)% Logistics 44.2 50.4 (6.2) (12.3)% 7.7 10.1 (2.4) (23.8)% Total Operating Income(1) $499.8 $551.3 ($51.5) (9.3)% $143.7 $147.5 ($3.8) (2.6)% Interest income 31.7 48.3 (16.6) (34.4)% 6.7 10.3 (3.6) (35.0)% Interest expense (6.8) (7.5) 0.7 (9.3)% (1.6) (1.4) (0.2) 14.3% Other income (expense), net 9.1 7.3 1.8 24.7% 2.2 1.8 0.4 22.2% Income taxes(2) (89.0) (123.0) 34.0 (27.6)% (7.9) (30.2) 22.3 (73.8)% Net Income(1)(2) $444.8 $476.4 ($31.6) (6.6)% $143.1 $128.0 $15.1 11.8% 32.2 34.2 (2.0) (5.8)% 31.1 33.7 (2.6) (7.7)% GAAP EPS, diluted(1)(2) $13.81 $13.93 ($0.12) (0.9)% $4.60 $3.80 $0.80 21.1% $195.8 $180.3 $15.5 8.6% $51.2 $45.9 $5.3 11.5% EBITDA $704.7 $738.9 ($34.2) (4.6)% $197.1 $195.2 $1.9 1.0% Depreciation and Amortization (incl. dry-dock amortization) Weighted Average Number of Shares Outstanding (diluted) |
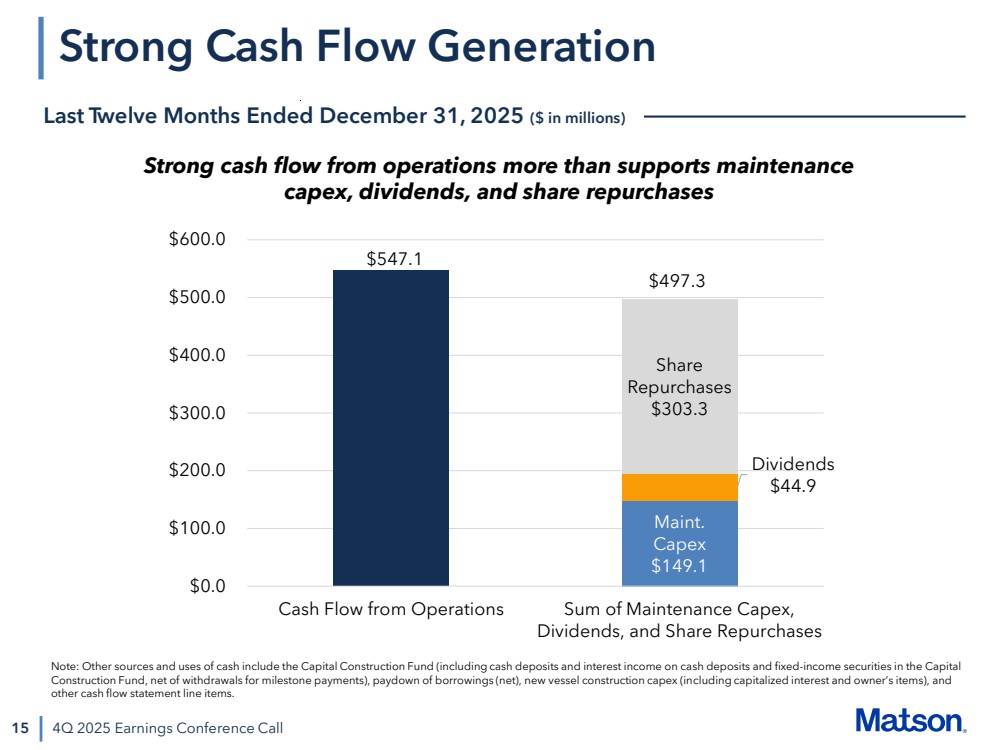
| 15 Strong Cash Flow Generation 4Q 2025 Earnings Conference Call Last Twelve Months Ended December 31, 2025 ($ in millions) $547.1 Maint. Capex $149.1 Dividends $44.9 Share Repurchases $303.3 $0.0 $100.0 $200.0 $300.0 $400.0 $500.0 $600.0 Cash Flow from Operations Sum of Maintenance Capex, Dividends, and Share Repurchases $497.3 Strong cash flow from operations more than supports maintenance capex, dividends, and share repurchases Note: Other sources and uses of cash include the Capital Construction Fund (including cash deposits and interest income on cash deposits and fixed-income securities in the Capital Construction Fund, net of withdrawals for milestone payments), paydown of borrowings (net), new vessel construction capex (including capitalized interest and owner’s items), and other cash flow statement line items. |
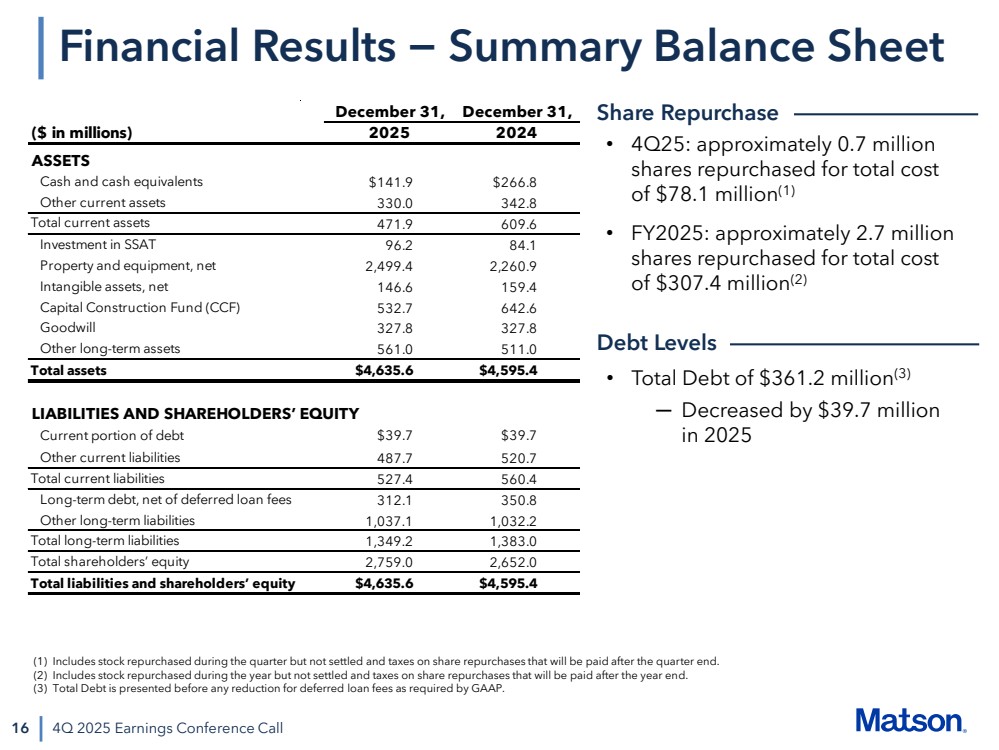
| 16 Financial Results − Summary Balance Sheet 4Q 2025 Earnings Conference Call • 4Q25: approximately 0.7 million shares repurchased for total cost of $78.1 million(1) • FY2025: approximately 2.7 million shares repurchased for total cost of $307.4 million(2) • Total Debt of $361.2 million(3) ─ Decreased by $39.7 million in 2025 Share Repurchase Debt Levels (1) Includes stock repurchased during the quarter but not settled and taxes on share repurchases that will be paid after the quarter end. (2) Includes stock repurchased during the year but not settled and taxes on share repurchases that will be paid after the year end. (3) Total Debt is presented before any reduction for deferred loan fees as required by GAAP. ($ in millions) ASSETS Cash and cash equivalents $141.9 $266.8 Other current assets 330.0 342.8 Total current assets 471.9 609.6 Investment in SSAT 96.2 84.1 Property and equipment, net 2,499.4 2,260.9 Intangible assets, net 146.6 159.4 Capital Construction Fund (CCF) 532.7 642.6 Goodwill 327.8 327.8 Other long-term assets 561.0 511.0 Total assets $4,635.6 $4,595.4 LIABILITIES AND SHAREHOLDERS’ EQUITY Current portion of debt $39.7 $39.7 Other current liabilities 487.7 520.7 Total current liabilities 527.4 560.4 Long-term debt, net of deferred loan fees 312.1 350.8 Other long-term liabilities 1,037.1 1,032.2 Total long-term liabilities 1,349.2 1,383.0 Total shareholders’ equity 2,759.0 2,652.0 Total liabilities and shareholders’ equity $4,635.6 $4,595.4 December 31, December 31, 2025 2024 |
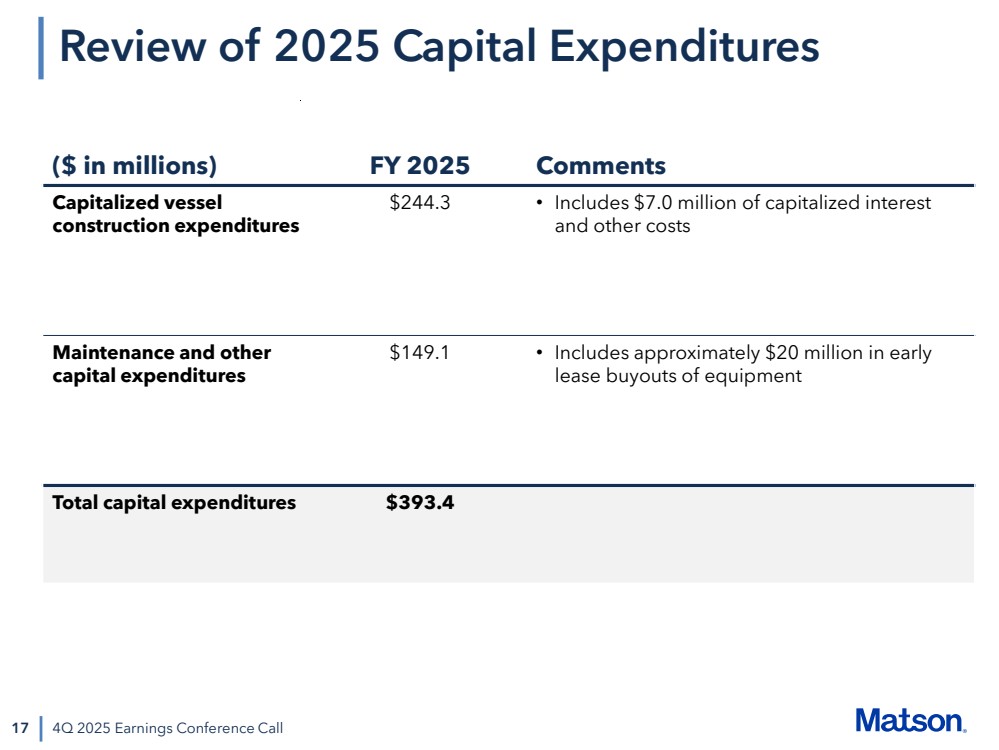
| ($ in millions) FY 2025 Comments Capitalized vessel construction expenditures $244.3 • Includes $7.0 million of capitalized interest and other costs Maintenance and other capital expenditures $149.1 • Includes approximately $20 million in early lease buyouts of equipment Total capital expenditures $393.4 17 4Q 2025 Earnings Conference Call Review of 2025 Capital Expenditures |
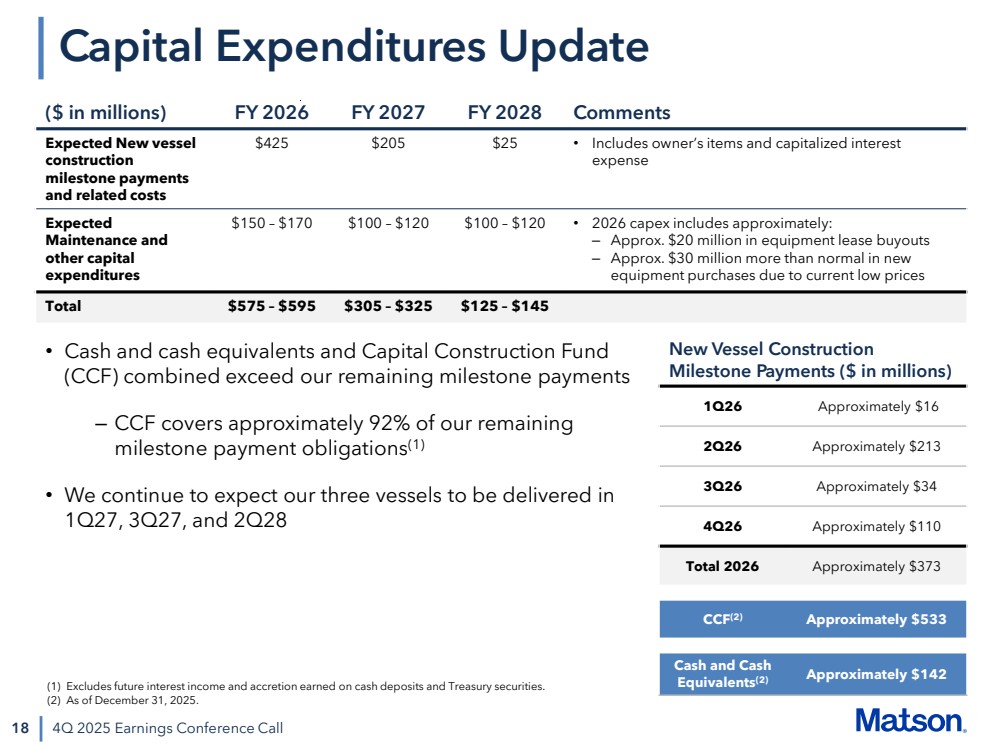
| 18 4Q 2025 Earnings Conference Call Capital Expenditures Update ($ in millions) FY 2026 FY 2027 FY 2028 Comments Expected New vessel construction milestone payments and related costs $425 $205 $25 • Includes owner’s items and capitalized interest expense Expected Maintenance and other capital expenditures $150 – $170 $100 – $120 $100 – $120 • 2026 capex includes approximately: – Approx. $20 million in equipment lease buyouts – Approx. $30 million more than normal in new equipment purchases due to current low prices Total $575 – $595 $305 – $325 $125 – $145 New Vessel Construction Milestone Payments ($ in millions) 1Q26 Approximately $16 2Q26 Approximately $213 3Q26 Approximately $34 4Q26 Approximately $110 Total 2026 Approximately $373 CCF(2) Approximately $533 Cash and Cash Equivalents(2) Approximately $142 • Cash and cash equivalents and Capital Construction Fund (CCF) combined exceed our remaining milestone payments – CCF covers approximately 92% of our remaining milestone payment obligations(1) • We continue to expect our three vessels to be delivered in 1Q27, 3Q27, and 2Q28 (1) Excludes future interest income and accretion earned on cash deposits and Treasury securities. (2) As of December 31, 2025. |
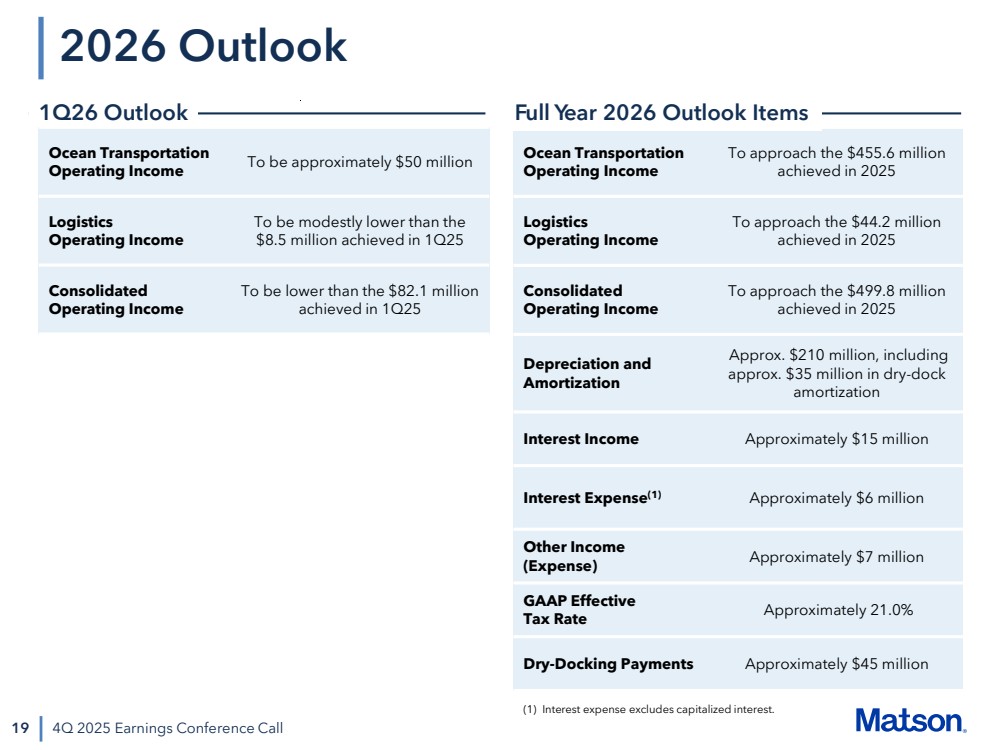
| 19 2026 Outlook 4Q 2025 Earnings Conference Call Ocean Transportation Operating Income To approach the $455.6 million achieved in 2025 Logistics Operating Income To approach the $44.2 million achieved in 2025 Consolidated Operating Income To approach the $499.8 million achieved in 2025 Depreciation and Amortization Approx. $210 million, including approx. $35 million in dry-dock amortization Interest Income Approximately $15 million Interest Expense(1) Approximately $6 million Other Income (Expense) Approximately $7 million GAAP Effective Tax Rate Approximately 21.0% Dry-Docking Payments Approximately $45 million 1Q26 Outlook Full Year 2026 Outlook Items Ocean Transportation Operating Income To be approximately $50 million Logistics Operating Income To be modestly lower than the $8.5 million achieved in 1Q25 Consolidated Operating Income To be lower than the $82.1 million achieved in 1Q25 (1) Interest expense excludes capitalized interest. |
| 20 Closing Thoughts 4Q 2025 Earnings Conference Call • Matson is well-positioned across its business lines • We remain focused on what we can control, including vessel schedule integrity, reliability of our operations, and delivering a high-quality service for our customers • China tradelane: ─ Focused on expanding our network in Southeast Asia ─ Supply chains are becoming more complex, making speed-to-market and schedule integrity paramount ─ Our premium rates reflect our unique value proposition relative to air freight and the consistency and reliability of our CLX and MAX services • We remain committed to looking for ways to grow, either organically or periodically through acquisition • We expect to continue to return capital to shareholders through dividends and our share repurchase program ─ We continue to expect to be steady buyers of our shares |
| Appendix |
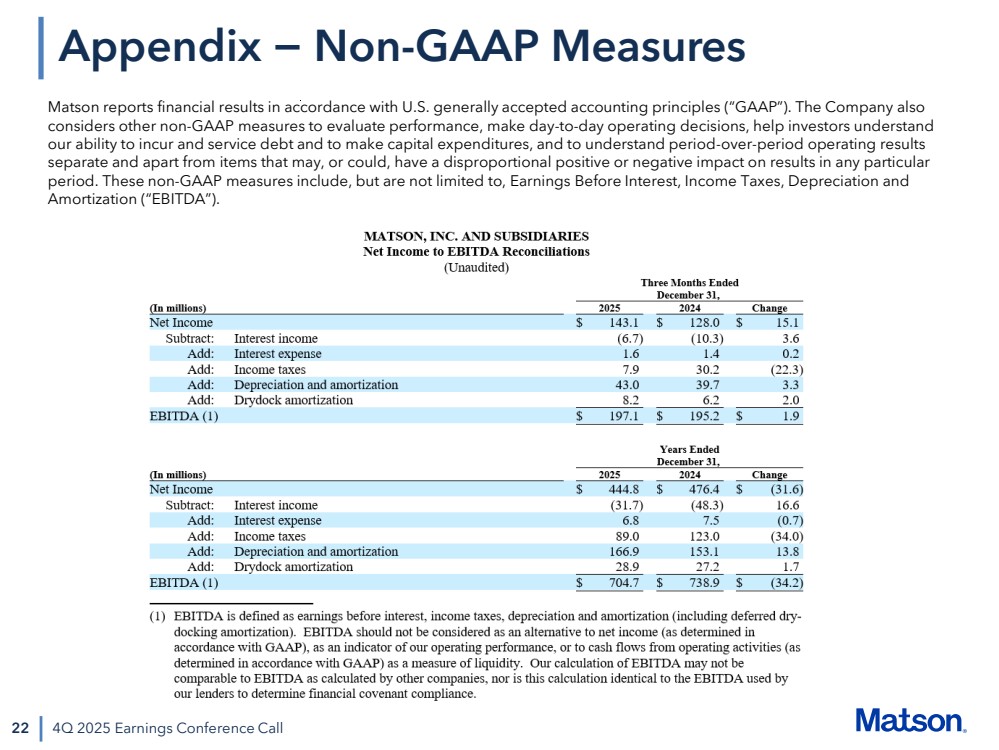
| 22 4Q 2025 Earnings Conference Call Appendix − Non-GAAP Measures Matson reports financial results in accordance with U.S. generally accepted accounting principles (“GAAP”). The Company also considers other non-GAAP measures to evaluate performance, make day-to-day operating decisions, help investors understand our ability to incur and service debt and to make capital expenditures, and to understand period-over-period operating results separate and apart from items that may, or could, have a disproportional positive or negative impact on results in any particular period. These non-GAAP measures include, but are not limited to, Earnings Before Interest, Income Taxes, Depreciation and Amortization (“EBITDA”). |