Investor Day 2026 November 4, 2026 | NYC BUILT FOR MORE
Welcome and Opening Remarks 2 Christian Audi SENIOR DIRECTOR,Investor
relations 2026 INVESTOR DAY |
3 Forward-Looking Statements and Non-GAAP Measures Statements made in this
presentation that are not historical are forward-looking statements made pursuant to the provisions of the Private Securities Litigation Reform Act of 1995 that involve risks and uncertainties. In addition to statements with respect to
guidance, the terms “outlook,” “may,” “should,” “could,” “anticipate,” “believe,” “estimate,” “expect,” “objective,” “plan,” “project” and similar expressions are intended to identify forward-looking statements. Such forward-looking
statements are subject to inherent risks and uncertainties that may cause actual results or events to differ materially from those contemplated by such forward-looking statements. The following is a list of factors, among others, that could
cause actual results to differ materially from the forward-looking statements, general economic uncertainty; the impact of geopolitical activity, including the armed conflicts in the Middle East, including the impact on shipping in the area
and the invasion of Ukraine by Russia and international sanctions imposed in response thereto; market conditions in the industrial, oil & gas, energy, power generation, infrastructure, commercial construction, truck and automotive
industries, including as a result of significant volatility in oil prices resulting from disruptions in the oil markets as a result of geopolitical activity; supply chain risks, including disruptions in deliveries from suppliers due to
political tensions and armed conflicts; impacts from the imposition, or threat of imposition, of tariffs and other trade restrictions; the ability of the Company to achieve its plans or objectives related to its growth strategy; market
acceptance of existing and new products; market acceptance of price increases; successful integration of acquisitions, the impact of dispositions and restructurings; the ability of the Company to continue to achieve or maintain operational
improvements related to restructuring actions; operating margin risk due to competitive pricing and operating efficiencies; risks related to reliance on independent agents and distributors for the distribution and service of products;
material, labor, or overhead cost increases; tax law changes; foreign currency risk; interest rate risk; commodity risk; litigation matters; cybersecurity risk; impairment of goodwill or other intangible assets; the Company’s ability to
access capital markets and other risks and uncertainties that may be referred to or noted in the Company’s reports filed with the Securities and Exchange Commission from time to time, including those described in the Company’s Form 10-K for
the fiscal year ended August 31, 2026. In addition, statements with respect to the post-closing contributions of SFE Group to the Company’s consolidated results are subject to risks and uncertainties that include, but are not limited to: the
ultimate outcome, benefits and synergies of the acquisition of SFE Group and future financial performance, including revenues, cash flows, operating expenses and profitability, involve risks and uncertainties, and are subject to change based
on various important factors, including risks that the acquisition disrupts current plans and operations of Enerpac Tool Group or SFE Group; the risk that disruptions from the transaction may make it more difficult to maintain business and
operational relationships, including retaining and hiring key personnel and maintaining relationships with SFE Group’s customers, distributors, vendors and others with whom it does business; and the impact of changes in relevant national and
regional economies. Enerpac Tool Group disclaims any obligation to publicly update or revise any forward-looking statements as a result of new information, future events or any other reason, except to the extent required by law. This
presentation also contains financial measures that are not measures presented in conformity with GAAP. These non-GAAP measures include organic sales, EBITDA, adjusted EBITDA, adjusted EBITDA margin, adjusted net earnings, adjusted earnings
per share, and net debt. The supplemental financial schedules appended at the end of this presentation include reconciliations of these non-GAAP measures to the most comparable GAAP measure. Enerpac Tool Group acknowledges that there are many
items that impact a company’s reported results, and the adjustments reflected in these non-GAAP measures are not intended to present all items that may have impacted these results. In addition, these non-GAAP measures are not necessarily
comparable to similarly titled measures used by other companies. Adjusted diluted earnings per share for fiscal year 2027 is calculated in a manner consistent with the historical presentation of that measure in the accompanying tables.
Because of the forward-looking nature of this estimate, it is impractical to present a quantitative reconciliation of this non-GAAP measure to the comparable GAAP measure, and accordingly no such GAAP measure for that period is being
presented.
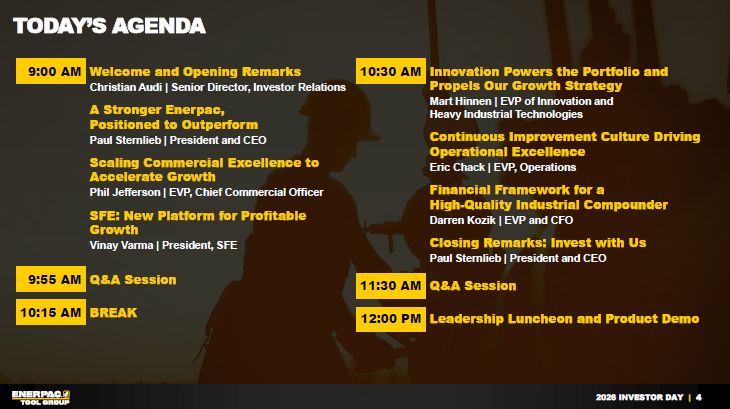
4 Today’s Agenda 9:00 AM Welcome and Opening Remarks Christian Audi | Senior
Director, Investor Relations A Stronger Enerpac, Positioned to Outperform Paul Sternlieb | President and CEO Scaling Commercial Excellence to Accelerate Growth Phil Jefferson | EVP, Chief Commercial Officer SFE: New Platform for
Profitable Growth Vinay Varma | President, SFE 9:55 AM Q&A Session 10:15 AM BREAK 10:30 AM Innovation Powers the Portfolio and Propels Our Growth Strategy Mart Hinnen | EVP of Innovation andHeavy Industrial
Technologies Continuous Improvement Culture Driving Operational Excellence Eric Chack | EVP, Operations Financial Framework for a High-Quality Industrial Compounder Darren Kozik | EVP and CFO Closing Remarks: Invest with Us Paul
Sternlieb | President and CEO 11:30 AM Q&A Session 12:00 PM Leadership Luncheon and Product Demo
5 Enerpac Video
A Stronger Enerpac, Positioned to Outperform 6 Paul Sternlieb President and
CEO 2026 INVESTOR DAY |
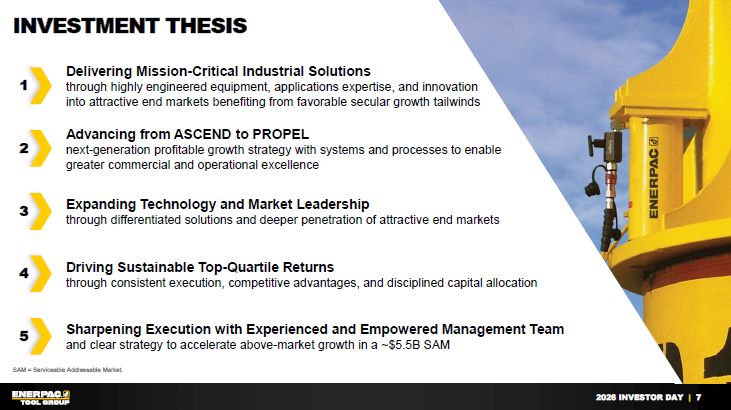
7 Investment Thesis SAM = Serviceable Addressable Market. 1 Delivering
Mission-Critical Industrial Solutions through highly engineered equipment, applications expertise, and innovation into attractive end markets benefiting from favorable secular growth tailwinds 2 Advancing from ASCEND to
PROPEL next-generation profitable growth strategy with systems and processes to enable greater commercial and operational excellence 3 Expanding Technology and Market Leadershipthrough differentiated solutions and deeper penetration of
attractive end markets 4 Driving Sustainable Top-Quartile Returns through consistent execution, competitive advantages, and disciplined capital allocation 5 Sharpening Execution with Experienced and Empowered Management Teamand clear
strategy to accelerate above-market growth in a ~$5.5B SAM
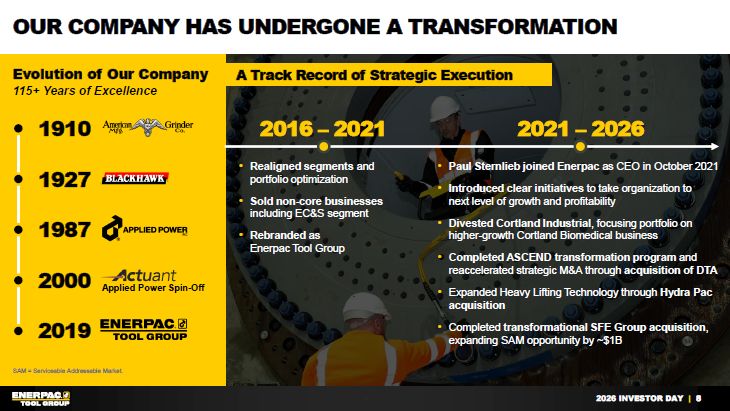
8 Our Company Has Undergone a Transformation Evolution of Our Company115+
Years of Excellence 1910 1927 1987 Applied Power Spin-Off 2000 2019 A Track Record of Strategic Execution 2016 – 2021 2021 – 2026 Realigned segments and portfolio optimization Sold non-core businesses including EC&S segment
Rebranded as Enerpac Tool Group Paul Sternlieb joined Enerpac as CEO in October 2021 Introduced clear initiatives to take organization to next level of growth and profitability Divested Cortland Industrial, focusing portfolio on
higher-growth Cortland Biomedical business Completed ASCEND transformation program and reaccelerated strategic M&A through acquisition of DTA Expanded Heavy Lifting Technology through Hydra Pac acquisition Completed transformational
SFE Group acquisition, expanding SAM opportunity by ~$1B SAM = Serviceable Addressable Market.
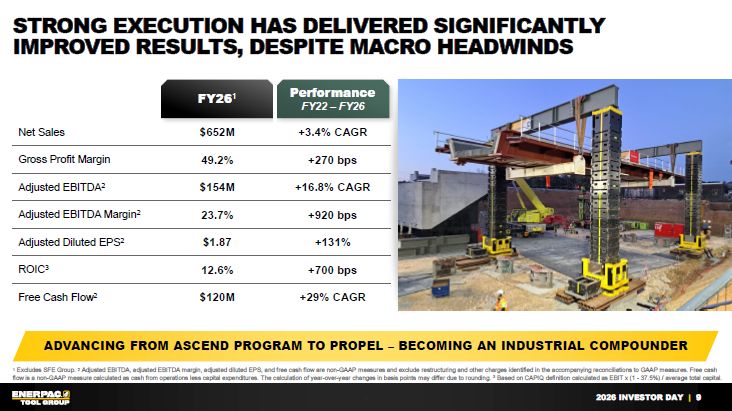
9 Strong execution HAS delivered significantly Improved results, Despite Macro
Headwinds Advancing from ASCEND Program to PROPEL – Becoming an Industrial Compounder FY261 Performance FY22 – FY26 Net Sales $652M +3.4% CAGR Gross Profit Margin 49.2% +270 bps Adjusted EBITDA2 $154M +16.8% CAGR Adjusted EBITDA
Margin2 23.7% +920 bps Adjusted Diluted EPS2 $1.87 +131% ROIC3 12.6% +700 bps Free Cash Flow2 $120M +29% CAGR 1 Excludes SFE Group. 2 Adjusted EBITDA, adjusted EBITDA margin, adjusted diluted EPS, and free cash flow are non-GAAP
measures and exclude restructuring and other charges identified in the accompanying reconciliations to GAAP measures. Free cash flow is a non-GAAP measure calculated as cash from operations less capital expenditures. The calculation of
year-over-year changes in basis points may differ due to rounding. 3 Based on CAPIQ definition calculated as EBIT x (1 - 37.5%) / average total capital.
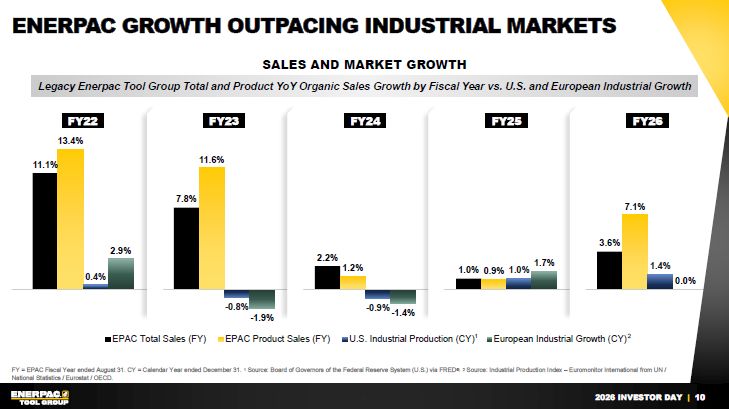
10 Enerpac Growth Outpacing Industrial Markets FY = EPAC Fiscal Year ended
August 31. CY = Calendar Year ended December 31. 1 Source: Board of Governors of the Federal Reserve System (U.S.) via FRED®. 2 Source: Industrial Production Index – Euromonitor International from UN / National Statistics / Eurostat /
OECD. SALES AND MARKET GROWTH Legacy Enerpac Tool Group Total and Product YoY Organic Sales Growth by Fiscal Year vs. U.S. and European Industrial Growth 1 2 FY22 FY23 FY24 FY25 FY26
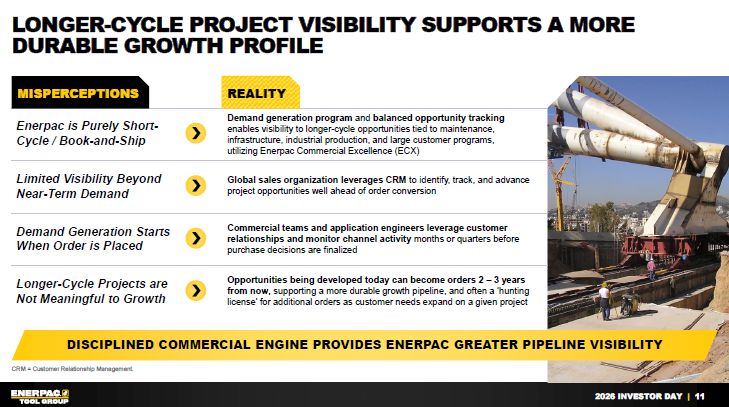
11 Longer-cycle project visibility supports a more durable growth
profile Demand generation program and balanced opportunity tracking enables visibility to longer-cycle opportunities tied to maintenance, infrastructure, industrial production, and large customer programs, utilizing Enerpac Commercial
Excellence (ECX) Global sales organization leverages CRM to identify, track, and advance project opportunities well ahead of order conversion Commercial teams and application engineers leverage customer relationships and monitor channel
activity months or quarters before purchase decisions are finalized Opportunities being developed today can become orders 2 – 3 years from now, supporting a more durable growth pipeline, and often a ‘hunting license’ for additional orders as
customer needs expand on a given project Disciplined Commercial Engine Provides Enerpac greater pipeline visibility Enerpac is Purely Short-Cycle / Book-and-Ship Limited Visibility Beyond Near-Term Demand Demand Generation Starts When
Order is Placed Longer-Cycle Projects areNot Meaningful to Growth CRM = Customer Relationship Management. REALITY MISPERCEPTIONS
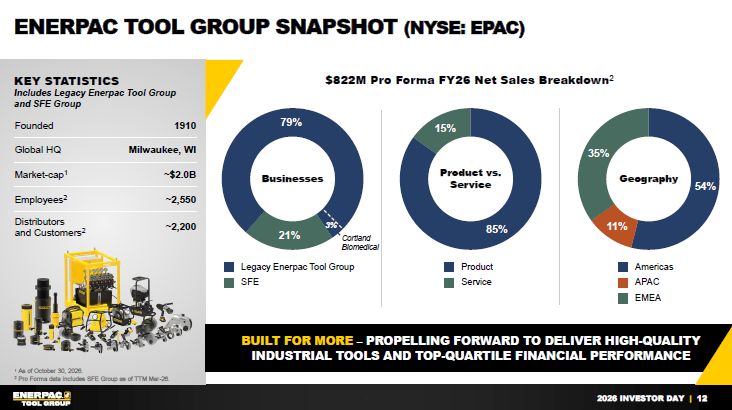
12 Enerpac TOOL GROUP Snapshot (NYSE: EPAC) $822M Pro Forma FY26 Net Sales
Breakdown2 KEY STATISTICS Includes Legacy Enerpac Tool Group and SFE Group Founded 1910 Global HQ Milwaukee, WI Market-cap1 ~$2.0B Employees2 ~2,550 Distributorsand Customers2 ~2,200 BUILT FOR MORE – Propelling forward to deliver
high-quality industrial tools and top-quartile financial performance Legacy Enerpac Tool Group SFE Businesses Product Service Product vs. Service Geography Americas APAC EMEA Cortland Biomedical 3% 1 As of October 30, 2026. 2
Pro Forma data includes SFE Group as of TTM Mar-26.
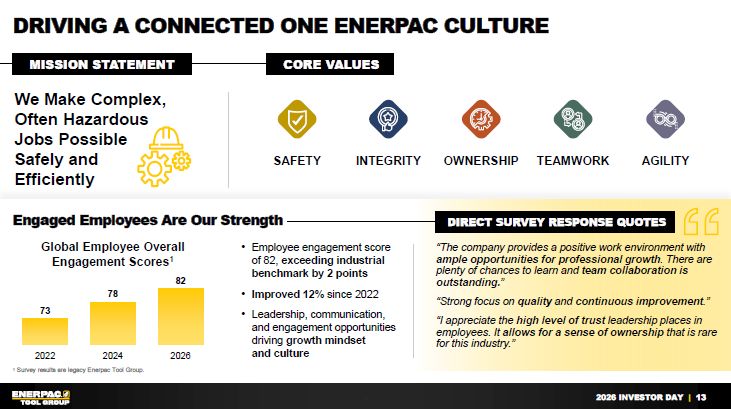
13 Driving a Connected One Enerpac Culture 1 Survey results are legacy Enerpac
Tool Group. MISSION STATEMENT We Make Complex, Often Hazardous Jobs Possible Safely and Efficiently CORE VALUES Employee engagement score of 82, exceeding industrial benchmark by 2 points Improved 12% since 2022 Leadership,
communication, and engagement opportunities driving growth mindset and culture Engaged Employees Are Our Strength DIRECT SURVEY RESPONSE QUOTES “The company provides a positive work environment with ample opportunities for professional
growth. There are plenty of chances to learn and team collaboration is outstanding.” “Strong focus on quality and continuous improvement.” “I appreciate the high level of trust leadership places in employees. It allows for a sense of
ownership that is rare for this industry.” SAFETY INTEGRITY OWNERSHIP TEAMWORK AGILITY Global Employee Overall Engagement Scores1
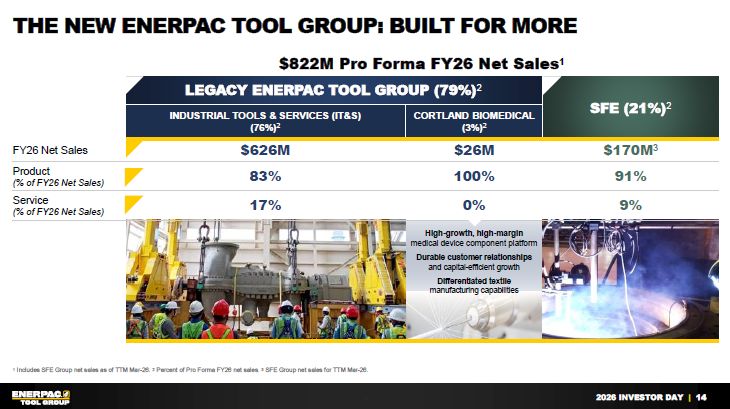
14 The New Enerpac Tool Group: Built for more 1 Includes SFE Group net sales
as of TTM Mar-26. 2 Percent of Pro Forma FY26 net sales. 3 SFE Group net sales for TTM Mar-26. LEGACY ENERPAC TOOL GROUP (79%)2 SFE (21%)2 INDUSTRIAL TOOLS & SERVICES (IT&S)(76%)2 CORTLAND BIOMEDICAL (3%)2 FY26 Net
Sales $626M $26M $170M3 Product(% of FY26 Net Sales) 83% 100% 91% Service (% of FY26 Net Sales) 17% 0% 9% High-growth, high-margin medical device component platform Durable customer relationshipsand capital-efficient
growth Differentiated textilemanufacturing capabilities $822M Pro Forma FY26 Net Sales1
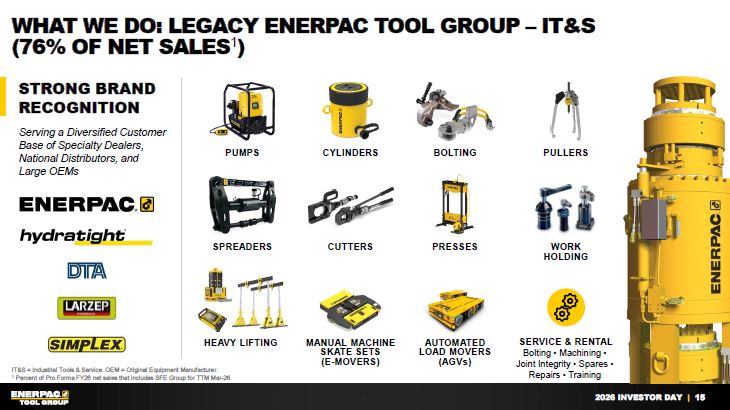
15 What We Do: LEGACY ENERPAC TOOL GROUP – IT&S(76% of net
sales1) IT&S = Industrial Tools & Service. OEM = Original Equipment Manufacturer.1 Percent of Pro Forma FY26 net sales that includes SFE Group for TTM Mar-26. SPREADERS PUMPS CYLINDERS BOLTING PULLERS WORK
HOLDING PRESSES CUTTERS HEAVY LIFTING STRONG BRAND RECOGNITION Serving a Diversified Customer Base of Specialty Dealers, National Distributors, and Large OEMs SERVICE & RENTAL Bolting • Machining • Joint Integrity • Spares •
Repairs • Training MANUAL MACHINE SKATE SETS (E-MOVERS) AUTOMATED LOAD MOVERS (AGVs)
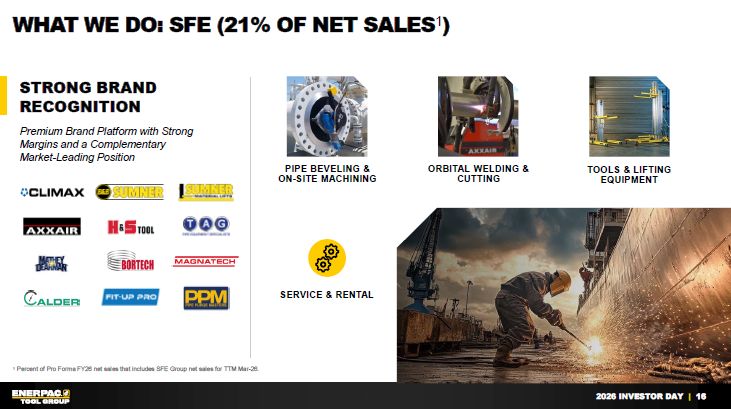
16 What We Do: SFE (21% of net sales1) STRONG BRAND RECOGNITION Premium
Brand Platform with Strong Margins and a Complementary Market-Leading Position SERVICE & RENTAL ORBITAL WELDING & CUTTING TOOLS & LIFTING EQUIPMENT PIPE BEVELING & ON-SITE MACHINING 1 Percent of Pro Forma FY26 net sales
that includes SFE Group net sales for TTM Mar-26.
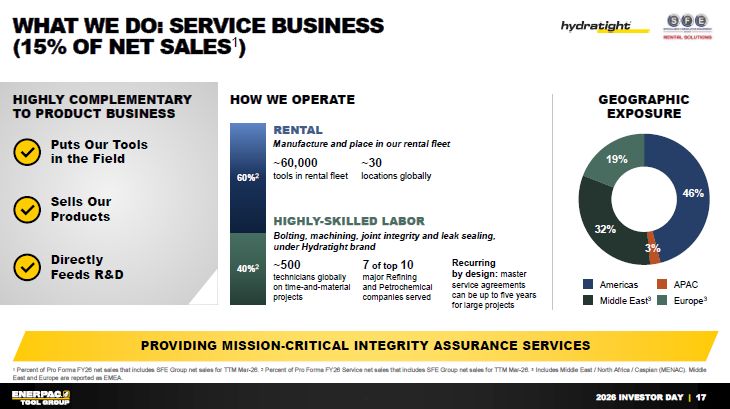
17 What we do: service business(15% of Net Sales1) Providing mission-critical
integrity assurance services HIGHLY-SKILLED LABOR Bolting, machining, joint integrity and leak sealing, under Hydratight brand 1 Percent of Pro Forma FY26 net sales that includes SFE Group net sales for TTM Mar-26. 2 Percent of Pro Forma
FY26 Service net sales that includes SFE Group net sales for TTM Mar-26. 3 Includes Middle East / North Africa / Caspian (MENAC). Middle East and Europe are reported as EMEA. RENTAL Manufacture and place in our rental fleet HOW WE
OPERATE GEOGRAPHIC EXPOSURE Puts Our Tools in the Field Sells Our Products Directly Feeds R&D ~60,000 tools in rental fleet ~30 locations globally ~500 technicians globally on time-and-material projects 7 of top 10 major Refining
and Petrochemical companies served Recurring by design: master service agreements can be up to five years for large projects APAC Europe3 Americas Middle East3 HIGHLY COMPLEMENTARY TO PRODUCT BUSINESS
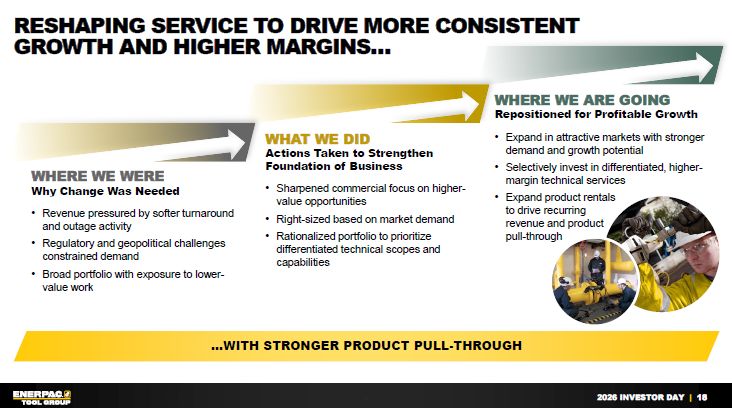
18 Reshaping Service to Drive More Consistentgrowth and higher margins… …With
stronger product pull-through WHERE WE WEREWhy Change Was Needed Revenue pressured by softer turnaround and outage activity Regulatory and geopolitical challenges constrained demand Broad portfolio with exposure to lower-value work WHERE
WE ARE GOINGRepositioned for Profitable Growth Expand in attractive markets with stronger demand and growth potential Selectively invest in differentiated, higher-margin technical services Expand product rentalsto drive recurringrevenue
and productpull-through WHAT WE DIDActions Taken to Strengthen Foundation of Business Sharpened commercial focus on higher-value opportunities Right-sized based on market demand Rationalized portfolio to prioritize differentiated
technical scopes and capabilities
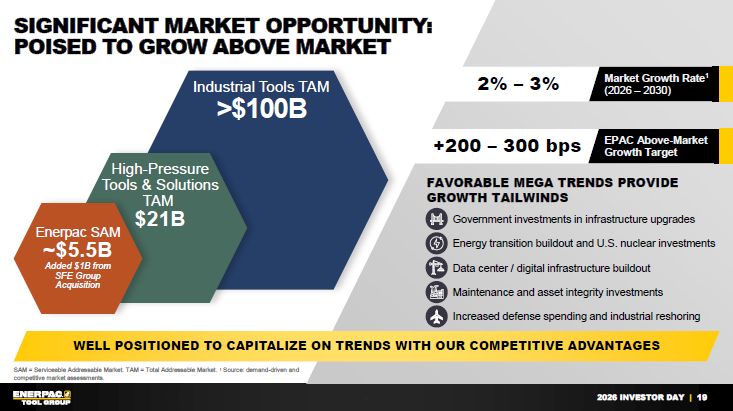
+200 – 300 bps 19 Significant Market Opportunity: Poised to Grow Above
Market Well Positioned to Capitalize on Trends with Our Competitive Advantages SAM = Serviceable Addressable Market. TAM = Total Addressable Market. 1 Source: demand-driven andcompetitive market assessments. Government investments in
infrastructure upgrades Energy transition buildout and U.S. nuclear investments Data center / digital infrastructure buildout Maintenance and asset integrity investments Increased defense spending and industrial reshoring Favorable MEGA
trends provide Growth tailwinds Market Growth Rate1 (2026 – 2030) Industrial Tools TAM >$100B High-Pressure Tools & Solutions TAM $21B Enerpac SAM ~$5.5B Added $1B fromSFE Group Acquisition 2% – 3% EPAC Above-Market Growth
Target
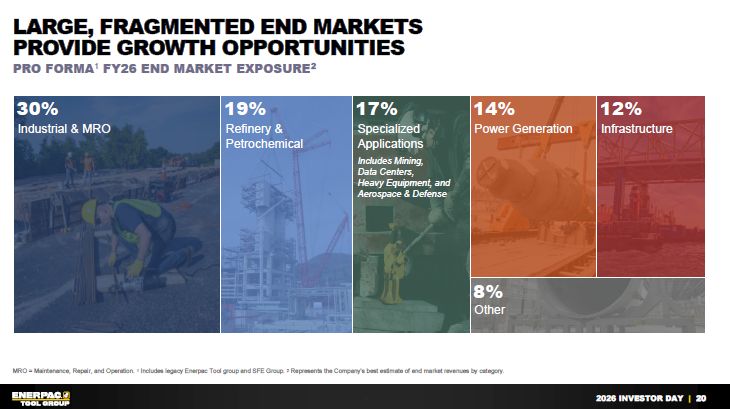
20 Large, Fragmented END MarketsProvide Growth Opportunities PRO FORMA1 FY26
END MARKET EXPOSURE2 MRO = Maintenance, Repair, and Operation. 1 Includes legacy Enerpac Tool group and SFE Group. 2 Represents the Company’s best estimate of end market revenues by category. Industrial & MRO Refinery &
Petrochemical Specialized Applications Includes Mining,Data Centers, Heavy Equipment, and Aerospace & Defense Power Generation Infrastructure Other
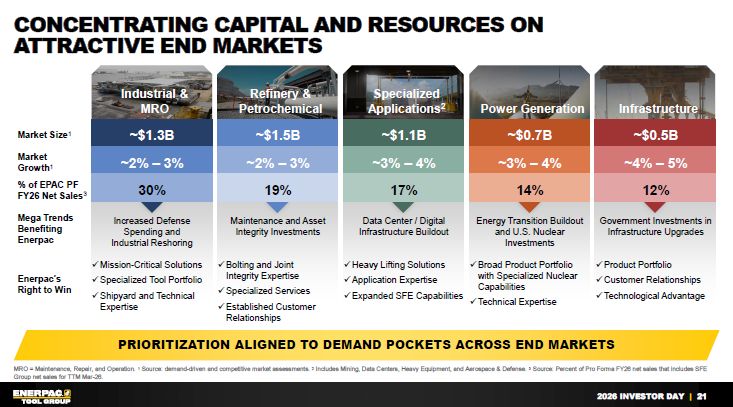
21 Concentrating Capital and Resources OnAttractive End Markets Prioritization
Aligned to Demand Pockets across End Markets MRO = Maintenance, Repair, and Operation. 1 Source: demand-driven and competitive market assessments. 2 Includes Mining, Data Centers, Heavy Equipment, and Aerospace & Defense. 3 Source:
Percent of Pro Forma FY26 net sales that includes SFE Group net sales for TTM Mar-26. Industrial &MRO Refinery & Petrochemical Specialized Applications2 Power Generation Infrastructure Market
Size1 ~$1.3B ~$1.5B ~$1.1B ~$0.7B ~$0.5B Market Growth1 ~2% – 3% ~2% – 3% ~3% – 4% ~3% – 4% ~4% – 5% % of EPAC PF FY26 Net Sales3 30% 19% 17% 14% 12% Mega TrendsBenefiting Enerpac Increased Defense Spending and Industrial
Reshoring Maintenance and Asset Integrity Investments Data Center / Digital Infrastructure Buildout Energy Transition Buildout and U.S. Nuclear Investments Government Investments in Infrastructure Upgrades Enerpac’s Right to
Win Mission-Critical Solutions Specialized Tool Portfolio Shipyard and Technical Expertise Bolting and Joint Integrity Expertise Specialized Services Established Customer Relationships Heavy Lifting Solutions Application
Expertise Expanded SFE Capabilities Broad Product Portfolio with Specialized Nuclear Capabilities Technical Expertise Product Portfolio Customer Relationships Technological Advantage
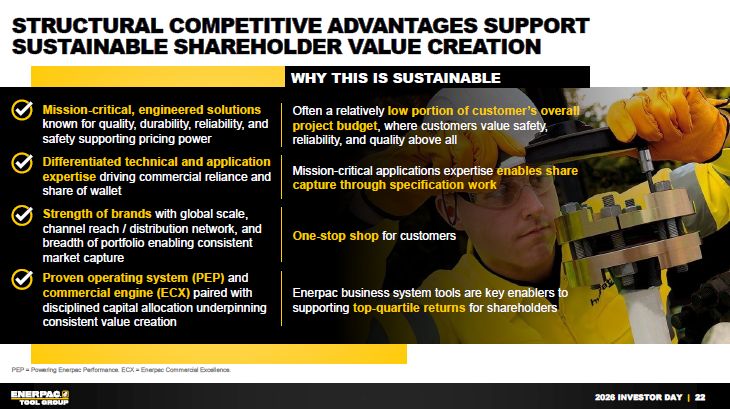
22 Structural competitive advantages support sustainable Shareholder value
creation PEP = Powering Enerpac Performance. ECX = Enerpac Commercial Excellence. Mission-critical, engineered solutions known for quality, durability, reliability, and safety supporting pricing power Often a relatively low portion of
customer’s overall project budget, where customers value safety, reliability, and quality above all Differentiated technical and application expertise driving commercial reliance and share of wallet Mission-critical applications expertise
enables share capture through specification work Strength of brands with global scale, channel reach / distribution network, and breadth of portfolio enabling consistent market capture One-stop shop for customers Proven operating system
(PEP) and commercial engine (ECX) paired with disciplined capital allocation underpinning consistent value creation Enerpac business system tools are key enablers to supporting top-quartile returns for shareholders WHY THIS IS SUSTAINABLE
23 Introducing our next-genGrowth Strategy
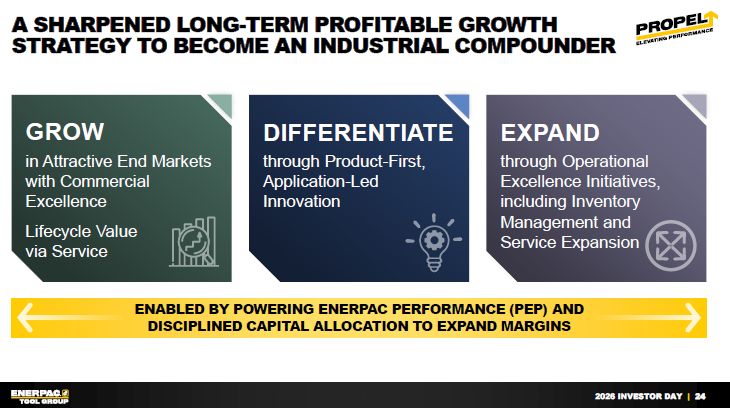
24 A Sharpened Long-term Profitable Growth Strategy to become an industrial
compounder GROW in Attractive End Markets with Commercial Excellence Lifecycle Valuevia Service DIFFERENTIATE through Product-First, Application-LedInnovation EXPAND through Operational Excellence Initiatives, including Inventory
Management andService Expansion ENABLED BY POWERING ENERPAC PERFORMANCE (PEP) ANDDISCIPLINED CAPITAL ALLOCATION TO EXPAND MARGINS
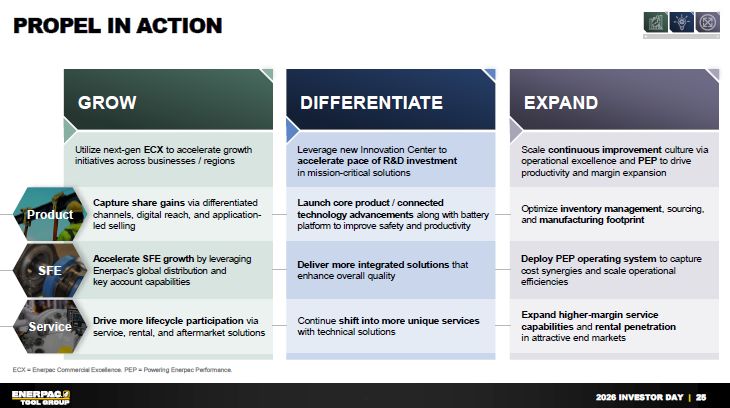
25 Propel in action ECX = Enerpac Commercial Excellence. PEP = Powering
Enerpac Performance. GROW DIFFERENTIATE EXPAND Utilize next-gen ECX to accelerate growth initiatives across businesses / regions Leverage new Innovation Center to accelerate pace of R&D investmentin mission-critical
solutions Product Service Capture share gains via differentiated channels, digital reach, and application-led selling Launch core product / connected technology advancements along with battery platform to improve safety and
productivity Accelerate SFE growth by leveraging Enerpac’s global distribution and key account capabilities Continue shift into more unique services with technical solutions Drive more lifecycle participation via service, rental, and
aftermarket solutions Deliver more integrated solutions that enhance overall quality Scale continuous improvement culture via operational excellence and PEP to drive productivity and margin expansion Optimize inventory management,
sourcing, and manufacturing footprint Expand higher-margin service capabilities and rental penetration in attractive end markets Deploy PEP operating system to capture cost synergies and scale operational efficiencies SFE
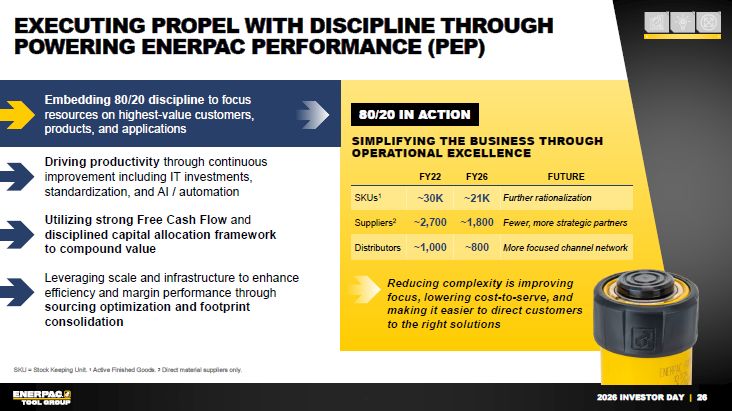
26 Executing Propel With Discipline through Powering Enerpac Performance
(PEP) Embedding 80/20 discipline to focus resources on highest-value customers, products, and applications Driving productivity through continuous improvement including IT investments, standardization, and AI / automation Utilizing strong
Free Cash Flow and disciplined capital allocation framework to compound value Leveraging scale and infrastructure to enhance efficiency and margin performance through sourcing optimization and footprint consolidation Simplifying the
business through OPERATIONAL EXCELLENCE 80/20 IN ACTION FY22 FY26 FUTURE SKUs1 ~30K ~21K Further rationalization Suppliers2 ~2,700 ~1,800 Fewer, more strategic partners Distributors ~1,000 ~800 More focused channel
network Reducing complexity is improving focus, lowering cost-to-serve, and making it easier to direct customers to the right solutions SKU = Stock Keeping Unit. 1 Active Finished Goods. 2 Direct material suppliers only.
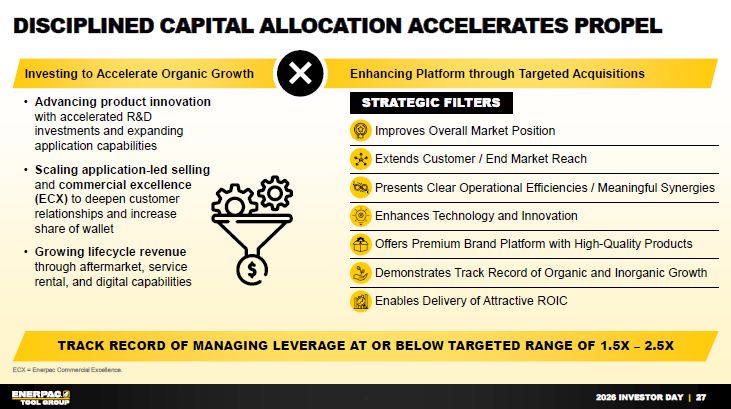
27 Disciplined Capital Allocation Accelerates Propel Track Record of Managing
Leverage at or below Targeted Range of 1.5x – 2.5x ECX = Enerpac Commercial Excellence. Advancing product innovation with accelerated R&D investments and expanding application capabilities Scaling application-led selling and
commercial excellence (ECX) to deepen customer relationships and increase share of wallet Growing lifecycle revenue through aftermarket, service rental, and digital capabilities Improves Overall Market Position Extends Customer / End
Market Reach Presents Clear Operational Efficiencies / Meaningful Synergies Enhances Technology and Innovation Offers Premium Brand Platform with High-Quality Products Demonstrates Track Record of Organic and Inorganic Growth Enables
Delivery of Attractive ROIC STRATEGIC FILTERS Investing to Accelerate Organic Growth Enhancing Platform through Targeted Acquisitions
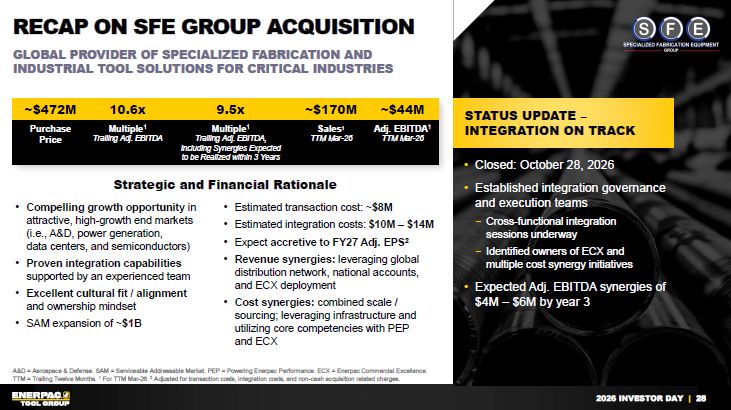
28 recap on SFE Group Acquisition A&D = Aerospace & Defense. SAM =
Serviceable Addressable Market. PEP = Powering Enerpac Performance. ECX = Enerpac Commercial Excellence. TTM = Trailing Twelve Months. 1 For TTM Mar-26. 2 Adjusted for transaction costs, integration costs, and non-cash acquisition related
charges. GLOBAL PROVIDER OF SPECIALIZED FABRICATION AND INDUSTRIAL TOOL SOLUTIONS FOR CRITICAL INDUSTRIES STATUS UPDATE – INTEGRATION ON TRACK ~$472M 10.6x 9.5x ~$170M ~$44M PurchasePrice Multiple1 Trailing Adj.
EBITDA Multiple1 Trailing Adj. EBITDA,Including Synergies Expectedto be Realized within 3 Years Sales1TTM Mar-26 Adj. EBITDA1 TTM Mar-26 Compelling growth opportunity in attractive, high-growth end markets (i.e., A&D, power
generation, data centers, and semiconductors) Proven integration capabilities supported by an experienced team Excellent cultural fit / alignment and ownership mindset SAM expansion of ~$1B Estimated transaction cost: ~$8M Estimated
integration costs: $10M – $14M Expect accretive to FY27 Adj. EPS2 Revenue synergies: leveraging global distribution network, national accounts, and ECX deployment Cost synergies: combined scale / sourcing; leveraging infrastructure and
utilizing core competencies with PEP and ECX Strategic and Financial Rationale Closed: October 28, 2026 Established integration governance and execution teams Cross-functional integration sessions underway Identified owners of ECX and
multiple cost synergy initiatives Expected Adj. EBITDA synergies of $4M – $6M by year 3
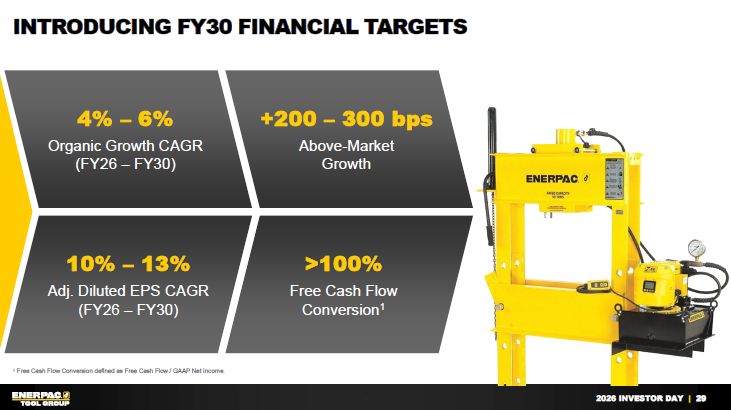
29 Introducing FY30 Financial Targets 1 Free Cash Flow Conversion defined as
Free Cash Flow / GAAP Net Income. 4% – 6% Organic Growth CAGR(FY26 – FY30) +200 – 300 bps Above-MarketGrowth 10% – 13% Adj. Diluted EPS CAGR(FY26 – FY30) >100% Free Cash FlowConversion1
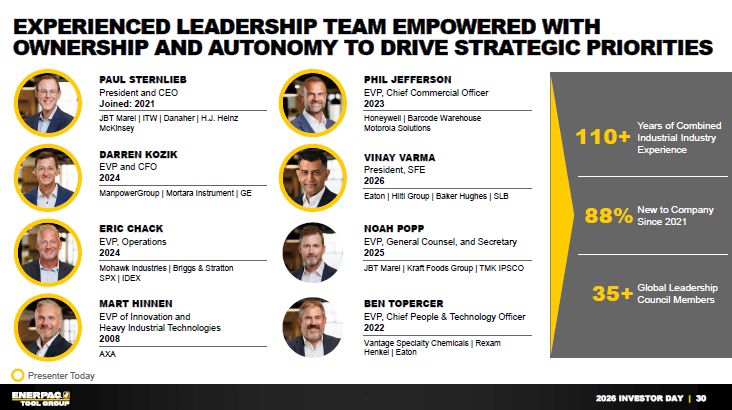
30 Experienced Leadership team empowered with ownership and autonomy to drive
strategic priorities Presenter Today PAUL STERNLIEB President and CEO Joined: 2021 JBT Marel | ITW | Danaher | H.J. Heinz McKinsey PHIL JEFFERSON EVP, Chief Commercial Officer 2023 Honeywell | Barcode Warehouse Motorola
Solutions Years of Combined Industrial Industry Experience 110+ New to Company Since 2021 88% Global Leadership Council Members 35+ DARREN KOZIK EVP and CFO 2024 ManpowerGroup | Mortara Instrument | GE ERIC CHACK EVP,
Operations 2024 Mohawk Industries | Briggs & Stratton SPX | IDEX MART HINNEN EVP of Innovation and Heavy Industrial Technologies2008 AXA NOAH POPP EVP, General Counsel, and Secretary 2025 JBT Marel | Kraft Foods Group | TMK
IPSCO BEN TOPERCER EVP, Chief People & Technology Officer 2022 Vantage Specialty Chemicals | RexamHenkel | Eaton VINAY VARMA President, SFE 2026 Eaton | Hilti Group | Baker Hughes | SLB
Scaling Commercial Excellence to Accelerate Growth 31 Phil Jefferson EVP,
Chief Commercial Officer 2026 INVESTOR DAY |
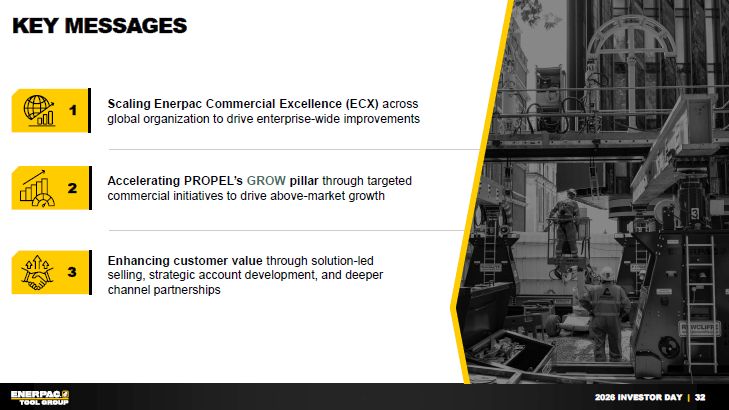
32 Key Messages Scaling Enerpac Commercial Excellence (ECX) across global
organization to drive enterprise-wide improvements Accelerating PROPEL’s GROW pillar through targeted commercial initiatives to drive above-market growth 2 Enhancing customer value through solution-led selling, strategic account
development, and deeper channel partnerships 3 1
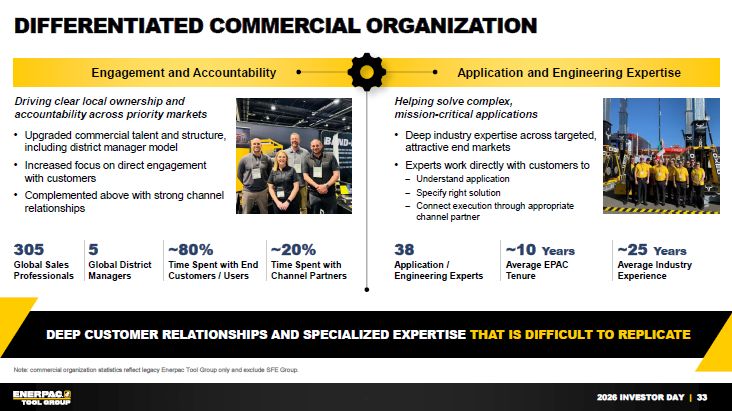
33 Differentiated commercial organization Engagement and
Accountability Application and Engineering Expertise Driving clear local ownership and accountability across priority markets Helping solve complex, mission-critical applications Upgraded commercial talent and structure, including
district manager model Increased focus on direct engagement with customers Complemented above with strong channel relationships Deep industry expertise across targeted, attractive end markets Experts work directly with customers
to Understand application Specify right solution Connect execution through appropriate channel partner Deep Customer Relationships and specialized expertise that is difficult to replicate 305 Global SalesProfessionals 5 Global
District Managers ~80% Time Spent with End Customers / Users ~20% Time Spent with Channel Partners 38 Application / Engineering Experts ~10 Years Average EPAC Tenure ~25 Years Average Industry Experience Note: commercial
organization statistics reflect legacy Enerpac Tool Group only and exclude SFE Group.
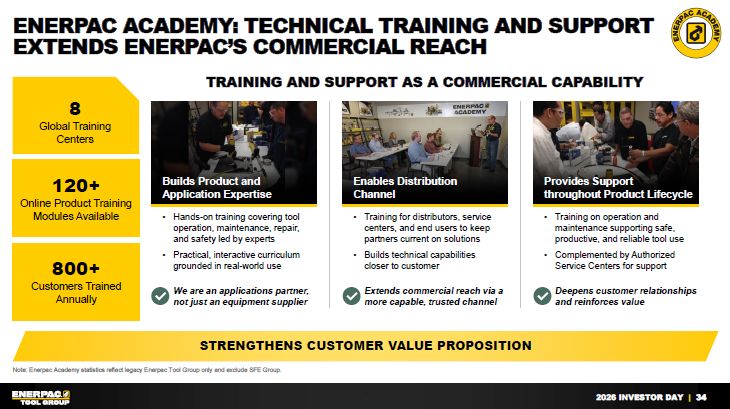
34 Enerpac Academy: Technical training and support extends Enerpac’s commercial
reach Strengthens customer value proposition 8 Global Training Centers 120+ Online Product Training Modules Available 800+ Customers Trained Annually TRAINING AND SUPPORT AS A COMMERCIAL CAPABILITY Builds Product and Application
Expertise Enables DistributionChannel Provides Support throughout Product Lifecycle Hands-on training covering tool operation, maintenance, repair, and safety led by experts Practical, interactive curriculum grounded in real-world
use Training for distributors, service centers, and end users to keep partners current on solutions Builds technical capabilities closer to customer Training on operation and maintenance supporting safe, productive, and reliable tool
use Complemented by Authorized Service Centers for support We are an applications partner, not just an equipment supplier Extends commercial reach via a more capable, trusted channel Deepens customer relationships and reinforces
value Note: Enerpac Academy statistics reflect legacy Enerpac Tool Group only and exclude SFE Group.
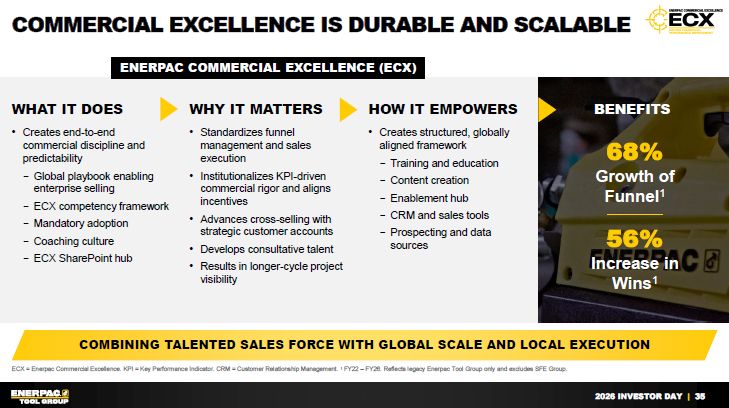
35 Commercial Excellence is Durable and Scalable Combining Talented Sales
force with Global Scale and Local Execution BENEFITS ENERPAC COMMERCIAL EXCELLENCE (ECX) 68%Growth of Funnel1 Standardizes funnel management and sales execution Institutionalizes KPI-driven commercial rigor and aligns
incentives Advances cross-selling with strategic customer accounts Develops consultative talent Results in longer-cycle project visibility WHY IT MATTERS Creates end-to-end commercial discipline and predictability Global playbook
enabling enterprise selling ECX competency framework Mandatory adoption Coaching culture ECX SharePoint hub WHAT IT DOES Creates structured, globally aligned framework Training and education Content creation Enablement hub CRM and
sales tools Prospecting and data sources HOW IT EMPOWERS ECX = Enerpac Commercial Excellence. KPI = Key Performance Indicator. CRM = Customer Relationship Management. 1 FY22 – FY26. Reflects legacy Enerpac Tool Group only and excludes SFE
Group. 56%Increase in Wins1
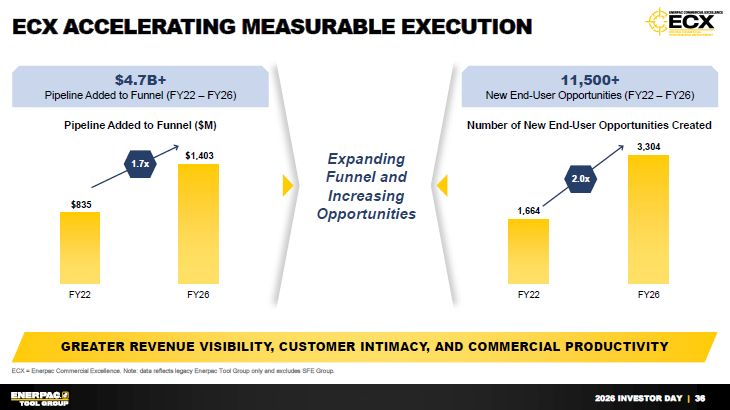
36 ECX Accelerating measurable execution Greater Revenue Visibility, customer
intimacy, and commercial productivity ECX = Enerpac Commercial Excellence. Note: data reflects legacy Enerpac Tool Group only and excludes SFE Group. Pipeline Added to Funnel ($M) $4.7B+ Pipeline Added to Funnel (FY22 –
FY26) 11,500+ New End-User Opportunities (FY22 – FY26) 1.7x Number of New End-User Opportunities Created Expanding Funnel and Increasing Opportunities 2.0x
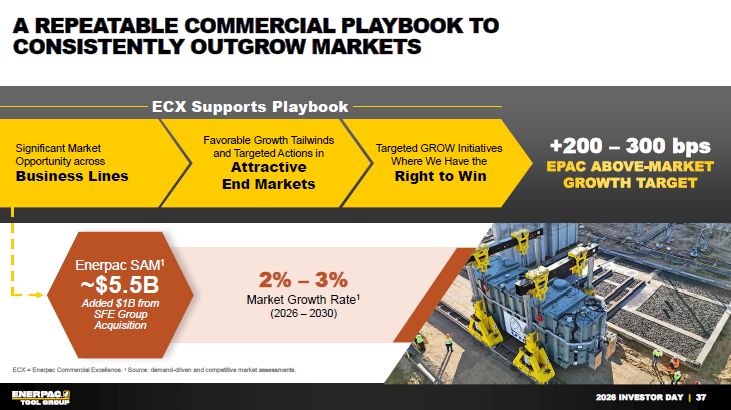
2% – 3% Market Growth Rate1(2026 – 2030) +200 – 300 bps EPAC ABOVE-MARKET
GROWTH TARGET 37 A repeatable Commercial playbook toConsistently outgrow markets ECX = Enerpac Commercial Excellence. 1 Source: demand-driven and competitive market assessments. Targeted GROW Initiatives Where We Have the Right to
Win Significant MarketOpportunity acrossBusiness Lines Favorable Growth Tailwindsand Targeted Actions in AttractiveEnd Markets Enerpac SAM1 ~$5.5B Added $1B from SFE Group Acquisition ECX Supports Playbook
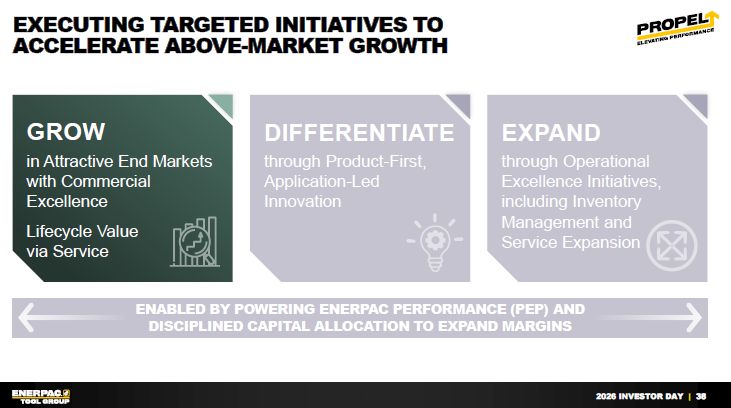
38 Executing targeted initiatives to Accelerate above-market growth GROW in
Attractive End Markets with Commercial Excellence Lifecycle Valuevia Service DIFFERENTIATE through Product-First, Application-LedInnovation EXPAND through Operational Excellence Initiatives, including Inventory Management andService
Expansion ENABLED BY POWERING ENERPAC PERFORMANCE (PEP) ANDDISCIPLINED CAPITAL ALLOCATION TO EXPAND MARGINS
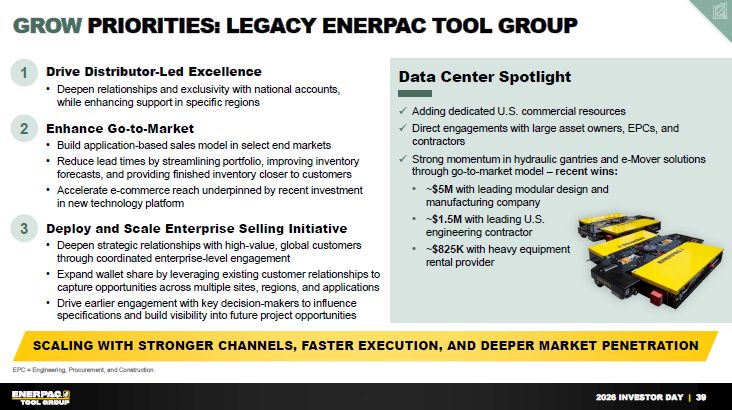
39 GROW Priorities: Legacy Enerpac Tool Group SCALING WITH stronger channels,
faster execution, and DEEPER Market penetration EPC = Engineering, Procurement, and Construction. Data Center Spotlight Adding dedicated U.S. commercial resources Direct engagements with large asset owners, EPCs, and contractors Strong
momentum in hydraulic gantries and e-Mover solutions through go-to-market model – recent wins: ~$5M with leading modular design and manufacturing company ~$1.5M with leading U.S.engineering contractor ~$825K with heavy equipment rental
provider Drive Distributor-Led Excellence Deepen relationships and exclusivity with national accounts, while enhancing support in specific regions 1 Enhance Go-to-Market Build application-based sales model in select end markets Reduce
lead times by streamlining portfolio, improving inventory forecasts, and providing finished inventory closer to customers Accelerate e-commerce reach underpinned by recent investment in new technology platform 2 Deploy and Scale Enterprise
Selling Initiative Deepen strategic relationships with high-value, global customers through coordinated enterprise-level engagement Expand wallet share by leveraging existing customer relationships to capture opportunities across multiple
sites, regions, and applications Drive earlier engagement with key decision-makers to influence specifications and build visibility into future project opportunities 3
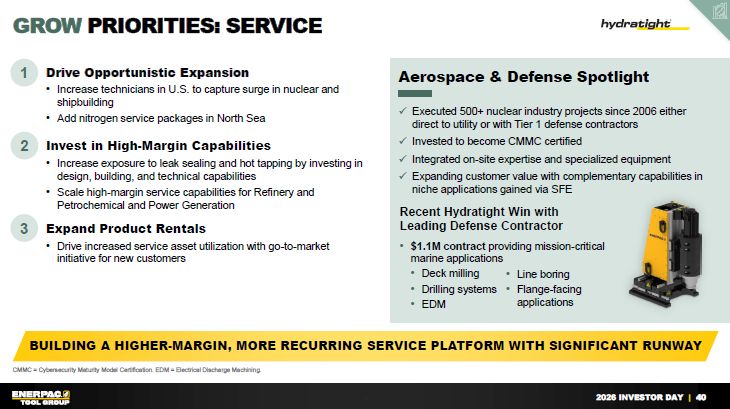
40 GROW Priorities: Service Building a higher-margin, more recurring service
platform with significant runway CMMC = Cybersecurity Maturity Model Certification. EDM = Electrical Discharge Machining. Drive Opportunistic Expansion Increase technicians in U.S. to capture surge in nuclear and shipbuilding Add
nitrogen service packages in North Sea Invest in High-Margin Capabilities Increase exposure to leak sealing and hot tapping by investing in design, building, and technical capabilities Scale high-margin service capabilities for Refinery
and Petrochemical and Power Generation 2 Expand Product Rentals Drive increased service asset utilization with go-to-market initiative for new customers 3 Aerospace & Defense Spotlight Executed 500+ nuclear industry projects since
2006 either direct to utility or with Tier 1 defense contractors Invested to become CMMC certified Integrated on-site expertise and specialized equipment Expanding customer value with complementary capabilities in niche applications
gained via SFE Recent Hydratight Win with Leading Defense Contractor $1.1M contract providing mission-criticalmarine applications Deck milling Drilling systems EDM Line boring Flange-facing applications 1
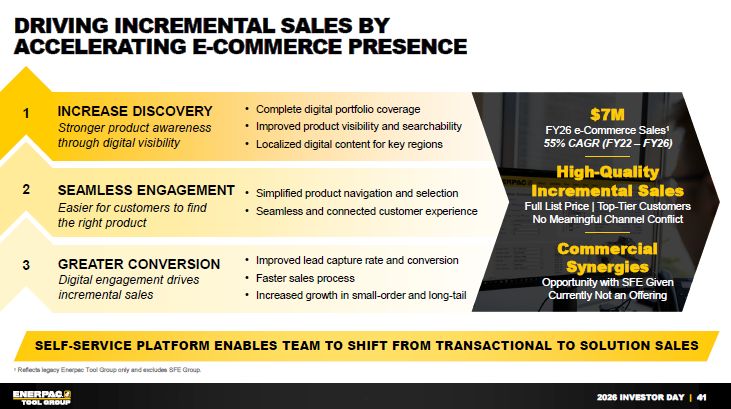
41 Driving Incremental Sales by Accelerating E-commerce Presence Self-service
platform Enables team to Shift from Transactional to solution sales 2 3 1 Improved lead capture rate and conversion Faster sales process Increased growth in small-order and long-tail Complete digital portfolio coverage Improved
product visibility and searchability Localized digital content for key regions Simplified product navigation and selection Seamless and connected customer experience SEAMLESS ENGAGEMENT INCREASE DISCOVERY GREATER CONVERSION Stronger
product awareness through digital visibility Easier for customers to find the right product Digital engagement drives incremental sales $7M FY26 e-Commerce Sales1 55% CAGR (FY22 – FY26) Commercial Synergies Opportunity with SFE
GivenCurrently Not an Offering High-Quality Incremental Sales Full List Price | Top-Tier CustomersNo Meaningful Channel Conflict 1 Reflects legacy Enerpac Tool Group only and excludes SFE Group.
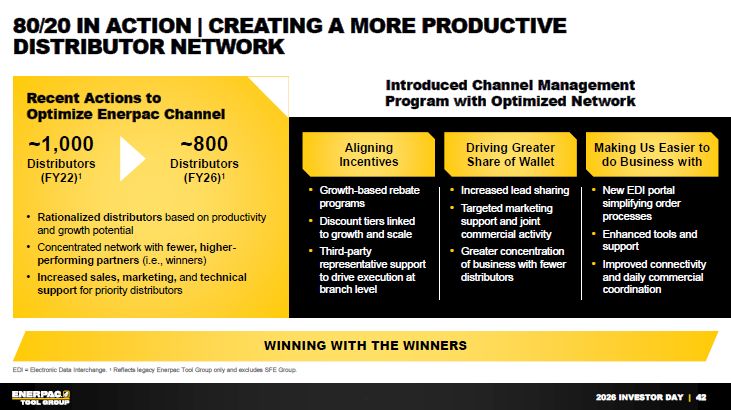
42 80/20 In action | Creating a more productive distributor network Winning
with the winners EDI = Electronic Data Interchange. 1 Reflects legacy Enerpac Tool Group only and excludes SFE Group. ~1,000 Distributors (FY22)1 ~800 Distributors (FY26)1 Recent Actions toOptimize Enerpac Channel Rationalized
distributors based on productivity and growth potential Concentrated network with fewer, higher-performing partners (i.e., winners) Increased sales, marketing, and technical support for priority distributors Introduced Channel Management
Program with Optimized Network Aligning Incentives Driving Greater Share of Wallet Making Us Easier to do Business with Growth-based rebate programs Discount tiers linked to growth and scale Third-party representative support to drive
execution at branch level Increased lead sharing Targeted marketing support and joint commercial activity Greater concentration of business with fewer distributors New EDI portal simplifying order processes Enhanced tools and
support Improved connectivity and daily commercial coordination
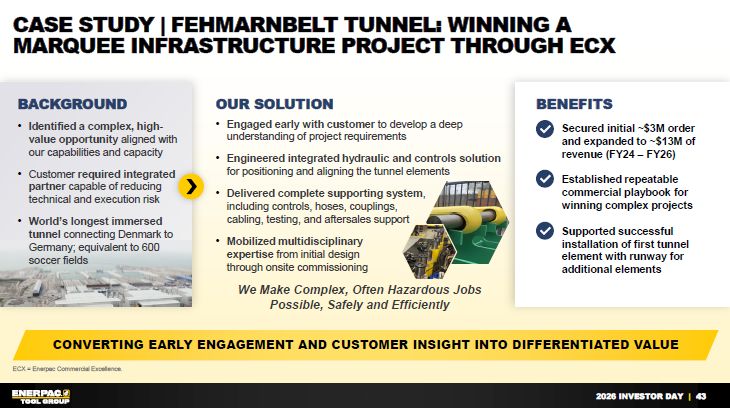
43 Case Study | fehmarnbelt Tunnel: Winning a marquee Infrastructure project
through ecx Converting early engagement and customer insight into differentiated value OUR SOLUTION Engaged early with customer to develop a deep understanding of project requirements Engineered integrated hydraulic and controls solution
for positioning and aligning the tunnel elements Delivered complete supporting system,including controls, hoses, couplings, cabling, testing, and aftersales support Mobilized multidisciplinaryexpertise from initial design through onsite
commissioning We Make Complex, Often Hazardous Jobs Possible, Safely and Efficiently Benefits Secured initial ~$3M order and expanded to ~$13M of revenue (FY24 – FY26) Established repeatable commercial playbook for winning complex
projects Supported successful installation of first tunnel element with runway for additional elements Identified a complex, high-value opportunity aligned with our capabilities and capacity Customer required integrated partner capable of
reducing technical and execution risk World’s longest immersed tunnel connecting Denmark to Germany; equivalent to 600 soccer fields BACKGROUND ECX = Enerpac Commercial Excellence.
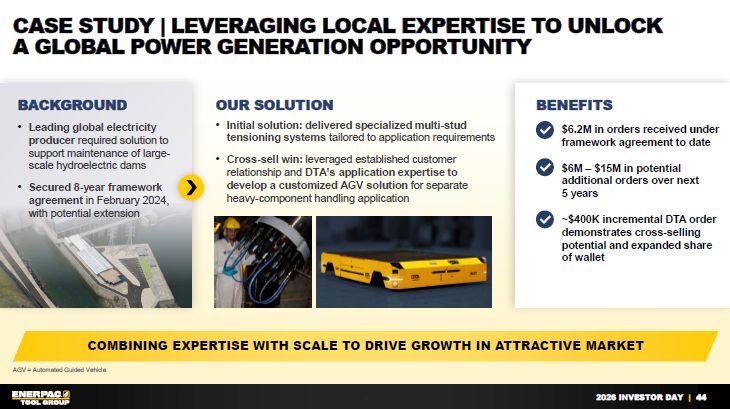
44 Case Study | Leveraging Local expertise to unlock a global power generation
opportunity Combining Expertise with scale to drive growth in attractive market AGV = Automated Guided Vehicle. OUR SOLUTION Initial solution: delivered specialized multi-stud tensioning systems tailored to application
requirements Cross-sell win: leveraged established customer relationship and DTA’s application expertise to develop a customized AGV solution for separate heavy-component handling application Benefits $6.2M in orders received under
framework agreement to date $6M – $15M in potential additional orders over next 5 years ~$400K incremental DTA order demonstrates cross-selling potential and expanded share of wallet BACKGROUND Leading global electricity producer required
solution to support maintenance of large-scale hydroelectric dams Secured 8-year framework agreement in February 2024, with potential extension
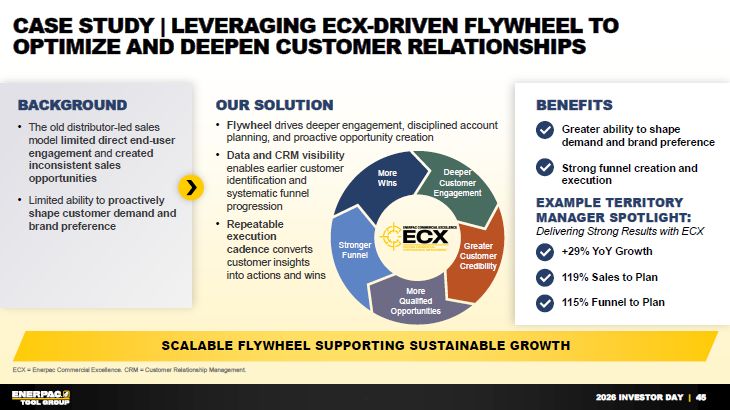
45 Case Study | Leveraging ECX-driven Flywheel to optimize and deepen customer
relationships scalable flywheel supporting sustainable growth ECX = Enerpac Commercial Excellence. CRM = Customer Relationship Management. OUR SOLUTION Flywheel drives deeper engagement, disciplined account planning, and proactive
opportunity creation Data and CRM visibility enables earlier customer identification and systematic funnel progression Repeatable execution cadence converts customer insights into actions and wins Benefits Greater ability to shape demand
and brand preference Strong funnel creation and execution The old distributor-led sales model limited direct end-user engagement and created inconsistent sales opportunities Limited ability to proactively shape customer demand and brand
preference BACKGROUND EXAMPLE TERRITORY MANAGER Spotlight: Delivering Strong Results with ECX +29% YoY Growth 119% Sales to Plan 115% Funnel to Plan MoreWins StrongerFunnel Deeper Customer Engagement Greater Customer
Credibility More Qualified Opportunities
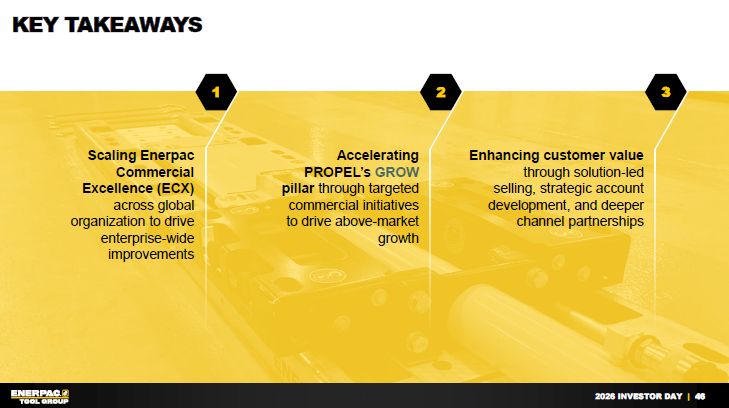
46 Key Takeaways Enhancing customer value through solution-led selling,
strategic account development, and deeper channel partnerships 3 Accelerating PROPEL’s GROW pillar through targeted commercial initiatives to drive above-market growth 2 Scaling Enerpac Commercial Excellence (ECX)across global
organization to drive enterprise-wide improvements 1
SFE: New Platform for Profitable Growth Vinay Varma President, SFE 47 2026
INVESTOR DAY |
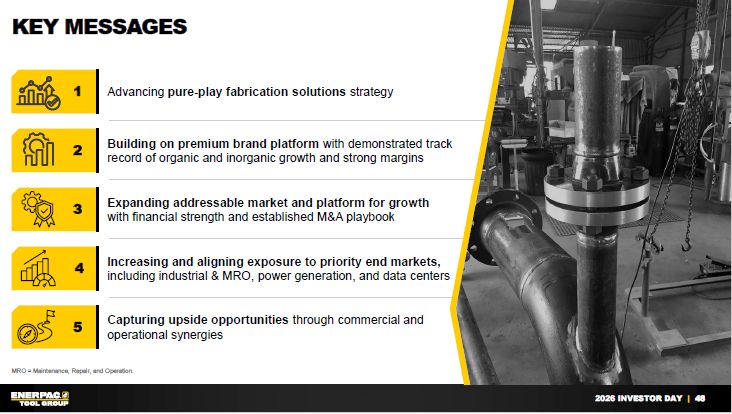
48 Key Messages 01 Advancing pure-play fabrication solutions
strategy 1 Building on premium brand platform with demonstrated track record of organic and inorganic growth and strong margins 2 Expanding addressable market and platform for growth with financial strength and established M&A
playbook Increasing and aligning exposure to priority end markets, including industrial & MRO, power generation, and data centers Capturing upside opportunities through commercial and operational synergies 5 3 4 MRO = Maintenance,
Repair, and Operation.
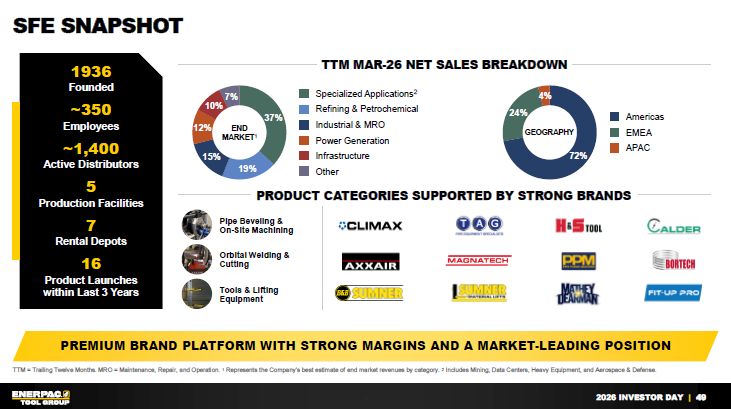
49 SFE Snapshot Premium Brand Platform with strong Margins and A
market-leading position TTM = Trailing Twelve Months. MRO = Maintenance, Repair, and Operation. 1 Represents the Company’s best estimate of end market revenues by category. 2 Includes Mining, Data Centers, Heavy Equipment, and Aerospace
& Defense. 1936 Founded ~350 Employees ~1,400 Active Distributors 5 Production Facilities 7 Rental Depots 16 Product Launches within Last 3 Years Americas EMEA APAC TTM MAR-26 Net Sales BREAKDOWN PRODUCT CATEGORIES
SUPPORTED BY STRONG BRANDS Pipe Beveling & On-Site Machining Orbital Welding & Cutting Tools & Lifting Equipment Specialized Applications2 Refining & Petrochemical Industrial & MRO Power
Generation Infrastructure Other ENDMARKET1 GEOGRAPHY
50 SFE Video
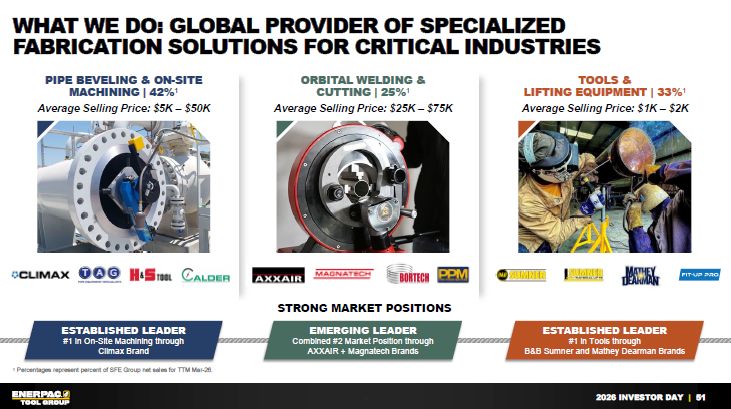
51 What We Do: Global Provider of Specialized Fabrication Solutions for
Critical Industries 1 Percentages represent percent of SFE Group net sales for TTM Mar-26. PIPE BEVELING & ON-SITE MACHINING | 42%1 Average Selling Price: $5K – $50K ORBITAL WELDING &CUTTING | 25%1 Average Selling Price: $25K –
$75K STRONG MARKET POSITIONS TOOLS &LIFTING EQUIPMENT | 33%1 Average Selling Price: $1K – $2K ESTABLISHED LEADER #1 in On-Site Machining throughClimax Brand EMERGING LEADER Combined #2 Market Position throughAXXAIR + Magnatech
Brands ESTABLISHED LEADER #1 in Tools throughB&B Sumner and Mathey Dearman Brands
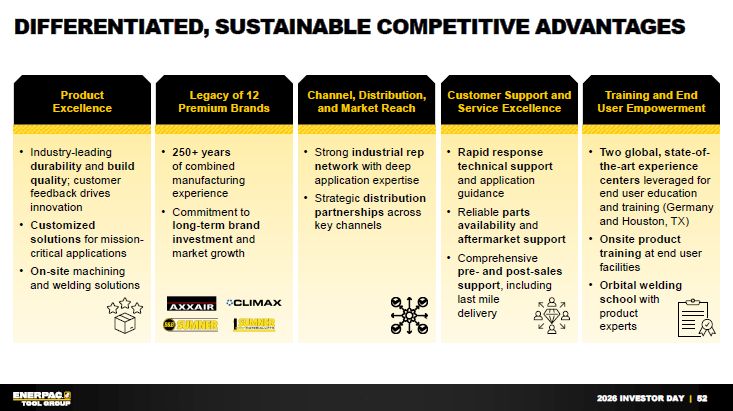
52 Differentiated, Sustainable Competitive Advantages Legacy of 12Premium
Brands 250+ yearsof combined manufacturing experience Commitment to long-term brand investment and market growth Channel, Distribution, and Market Reach Strong industrial rep network with deep application expertise Strategic distribution
partnerships across key channels Product Excellence Industry-leading durability and build quality; customer feedback drives innovation Customized solutions for mission-critical applications On-site machining and welding
solutions Customer Support and Service Excellence Rapid response technical support and application guidance Reliable parts availability and aftermarket support Comprehensive pre- and post-sales support, including last mile
delivery Training and End User Empowerment Two global, state-of-the-art experience centers leveraged for end user education and training (Germany and Houston, TX) Onsite product training at end user facilities Orbital welding school with
product experts
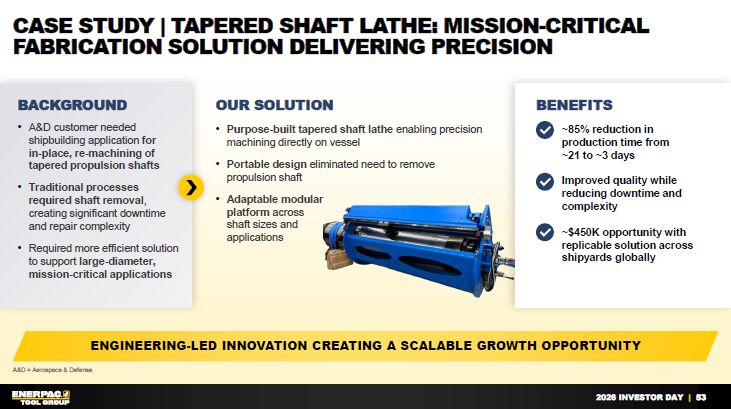
53 Case Study | Tapered shaft lathe: Mission-critical fabrication solution
delivering precision Engineering-led innovation creating a scalable growth opportunity A&D = Aerospace & Defense. OUR SOLUTION Purpose-built tapered shaft lathe enabling precision machining directly on vessel Portable design
eliminated need to remove propulsion shaft Adaptable modularplatform across shaft sizes andapplications A&D customer needed shipbuilding application for in-place, re-machining of tapered propulsion shafts Traditional processes required
shaft removal, creating significant downtime and repair complexity Required more efficient solution to support large-diameter, mission-critical applications BACKGROUND Benefits ~85% reduction in production time from ~21 to ~3
days Improved quality while reducing downtime and complexity ~$450K opportunity with replicable solution across shipyards globally
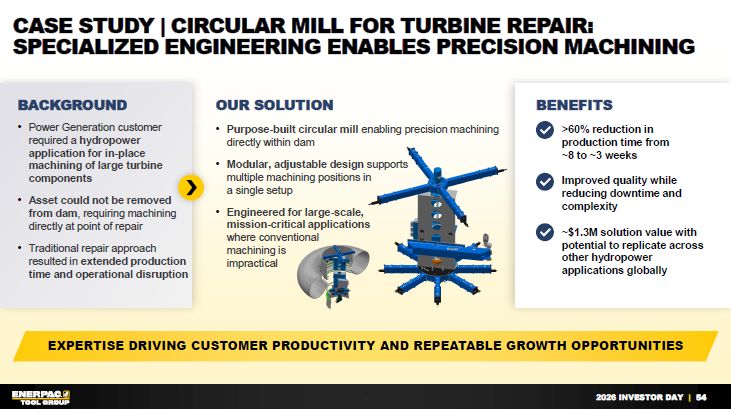
54 Case Study | circular mill for turbine repair: specialized engineering
enables precision machining Expertise driving customer productivity and repeatable growth opportunities OUR SOLUTION Purpose-built circular mill enabling precision machining directly within dam Modular, adjustable design supportsmultiple
machining positions in a single setup Engineered for large-scale,mission-critical applications where conventionalmachining is impractical Power Generation customer required a hydropower application for in-place machining of large turbine
components Asset could not be removed from dam, requiring machining directly at point of repair Traditional repair approach resulted in extended production time and operational disruption BACKGROUND Benefits >60% reduction in
production time from ~8 to ~3 weeks Improved quality while reducing downtime and complexity ~$1.3M solution value with potential to replicate across other hydropower applications globally
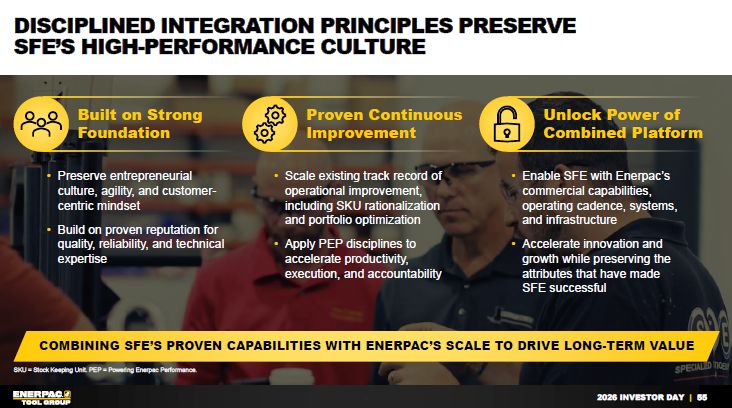
55 Disciplined integration principles preserve SFE’s high-performance
culture Combining SFE’s Proven Capabilities with Enerpac’s Scale to Drive Long-term Value Preserve entrepreneurial culture, agility, and customer-centric mindset Build on proven reputation for quality, reliability, and technical
expertise Scale existing track record of operational improvement, including SKU rationalization and portfolio optimization Apply PEP disciplines to accelerate productivity, execution, and accountability Enable SFE with Enerpac’s commercial
capabilities, operating cadence, systems, and infrastructure Accelerate innovation and growth while preserving the attributes that have made SFE successful Unlock Power ofCombined Platform Proven ContinuousImprovement Built on
Strong Foundation SKU = Stock Keeping Unit. PEP = Powering Enerpac Performance.
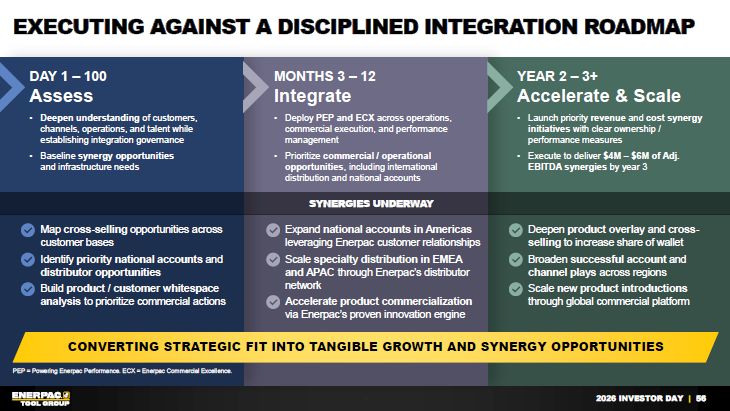
56 Executing against a Disciplined Integration Roadmap Deepen understanding of
customers, channels, operations, and talent while establishing integration governance Baseline synergy opportunities and infrastructure needs Deploy PEP and ECX across operations, commercial execution, and performance management Prioritize
commercial / operational opportunities, including international distribution and national accounts Launch priority revenue and cost synergy initiatives with clear ownership / performance measures Execute to deliver $4M – $6M of Adj. EBITDA
synergies by year 3 DAY 1 – 100Assess YEAR 2 – 3+Accelerate & Scale MONTHS 3 – 12Integrate SYNERGIES UNDERWAY Converting strategic fit into tangible growth and synergy opportunities Map cross-selling opportunities across customer
bases Identify priority national accounts and distributor opportunities Build product / customer whitespace analysis to prioritize commercial actions Expand national accounts in Americas leveraging Enerpac customer relationships Scale
specialty distribution in EMEA and APAC through Enerpac’s distributor network Accelerate product commercialization via Enerpac’s proven innovation engine Deepen product overlay and cross-selling to increase share of wallet Broaden
successful account and channel plays across regions Scale new product introductions through global commercial platform PEP = Powering Enerpac Performance. ECX = Enerpac Commercial Excellence.
57 Key Takeaways Expanding addressable market and platform for growth with
financial strength and established M&A playbook 3 Increasing and aligning exposure to priority end markets, including industrial & MRO, power generation, and data centers 4 Building on premium brand platform with demonstrated
track record of organic and inorganic growth and strong margins 2 Advancing pure-play fabrication solutions strategy 1 Capturing upside opportunities through commercial and operational synergies 5 MRO = Maintenance, Repair, and
Operation.
Q&A Session 58

Break 59 ~15 Minutes
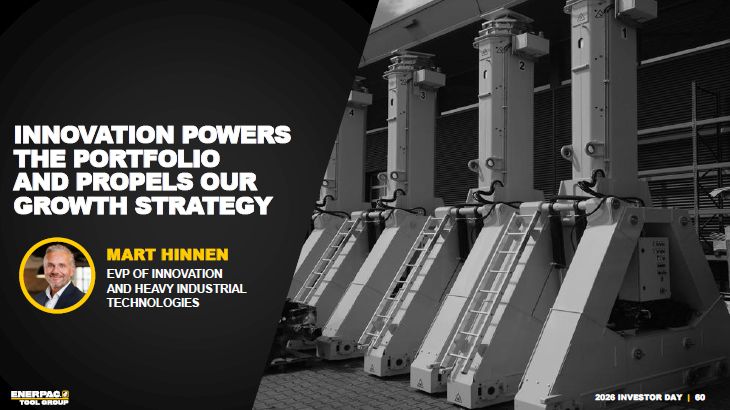
Innovation Powers The Portfolio and propels our growth strategy 60 Mart
Hinnen EVP Of Innovationand Heavy Industrial Technologies 2026 INVESTOR DAY |
Building on position of strength through portfolio of premium solutions and
top-tier distribution to extend market leadership Advancing PROPEL’s DIFFERENTIATE pillar through innovation priorities to expand served markets and capture share in high-growth end markets Driving disciplined innovation process to deliver
commercial solutions on time, on budget, and at scale 2 61 Key Messages 3 1
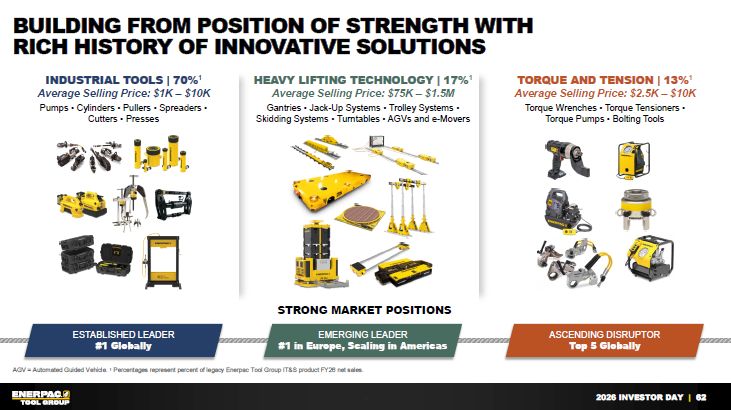
62 Building from position of strength withRich history of innovative
solutions AGV = Automated Guided Vehicle. 1 Percentages represent percent of legacy Enerpac Tool Group IT&S product FY26 net sales. INDUSTRIAL TOOLS | 70%1 Average Selling Price: $1K – $10K HEAVY LIFTING TECHNOLOGY | 17%1 Average
Selling Price: $75K – $1.5M Pumps • Cylinders • Pullers • Spreaders • Cutters • Presses Gantries • Jack-Up Systems • Trolley Systems • Skidding Systems • Turntables • AGVs and e-Movers STRONG MARKET POSITIONS ESTABLISHED LEADER#1
Globally EMERGING LEADER#1 in Europe, Scaling in Americas TORQUE AND TENSION | 13%1 Average Selling Price: $2.5K – $10K Torque Wrenches • Torque Tensioners • Torque Pumps • Bolting Tools ASCENDING DISRUPTORTop 5 Globally
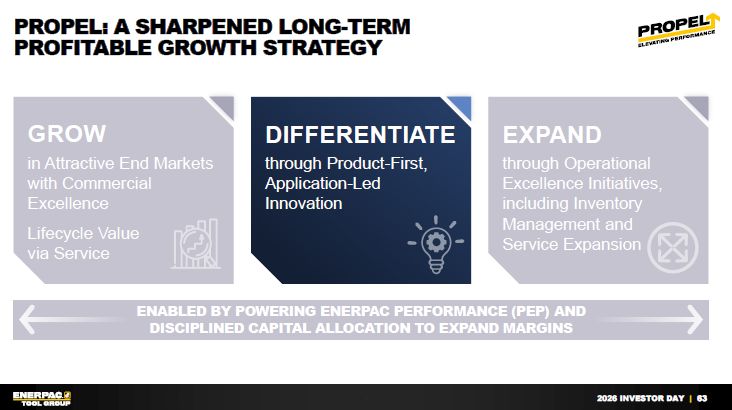
63 Propel: A Sharpened Long-term Profitable Growth Strategy GROW in
Attractive End Markets with Commercial Excellence Lifecycle Valuevia Service DIFFERENTIATE through Product-First, Application-LedInnovation EXPAND through Operational Excellence Initiatives, including Inventory Management andService
Expansion ENABLED BY POWERING ENERPAC PERFORMANCE (PEP) ANDDISCIPLINED CAPITAL ALLOCATION TO EXPAND MARGINS
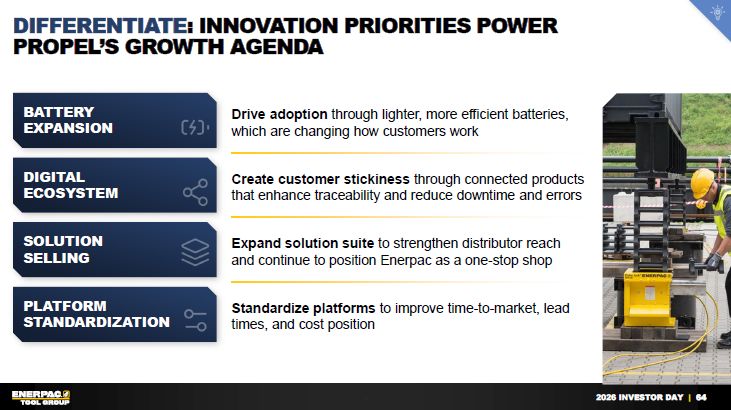
Differentiate: INNOVATION PRIORITIES POWERPROPEL’S GROWTH
AGENDA 64 BATTERY EXPANSION DIGITAL ECOSYSTEM SOLUTION SELLING PLATFORM STANDARDIZATION Drive adoption through lighter, more efficient batteries, which are changing how customers work Create customer stickiness through connected
products that enhance traceability and reduce downtime and errors Expand solution suite to strengthen distributor reach and continue to position Enerpac as a one-stop shop Standardize platforms to improve time-to-market, lead times, and
cost position
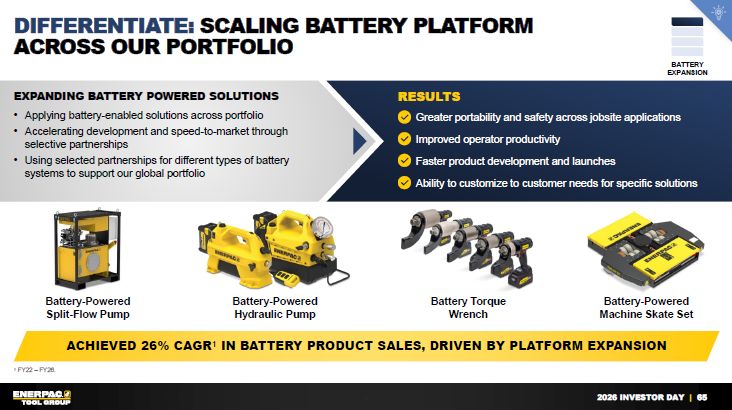
65 Differentiate: Scaling battery platformacross our portfolio Achieved 26%
CAGR1 in battery product sales, driven by platform expansion 1 FY22 – FY26. Battery-Powered Split-Flow Pump Battery Torque Wrench Battery-Powered Machine Skate Set Battery-Powered Hydraulic Pump RESULTS Greater portability and safety
across jobsite applications Improved operator productivity Faster product development and launches Ability to customize to customer needs for specific solutions EXPANDING BATTERY POWERED SOLUTIONS Applying battery-enabled solutions
across portfolio Accelerating development and speed-to-market through selective partnerships Using selected partnerships for different types of battery systems to support our global portfolio BATTERY EXPANSION
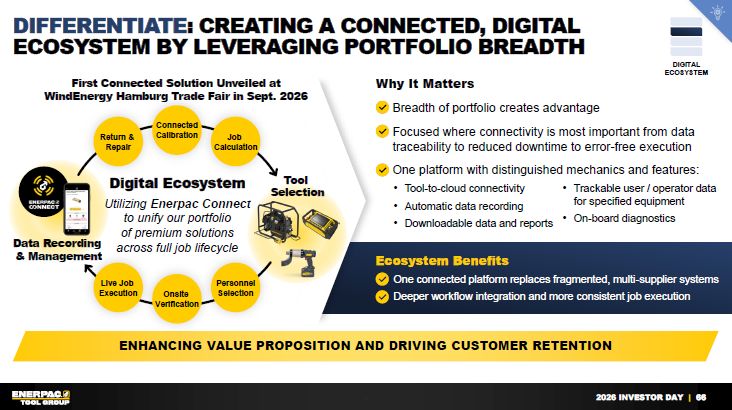
66 Differentiate: Creating a Connected, Digital Ecosystem by leveraging
portfolio breadth Enhancing value proposition and driving customer retention Ecosystem Benefits One connected platform replaces fragmented, multi-supplier systems Deeper workflow integration and more consistent job
execution DIGITAL ECOSYSTEM Trackable user / operator datafor specified equipment On-board diagnostics Why It Matters Breadth of portfolio creates advantage Focused where connectivity is most important from data traceability to reduced
downtime to error-free execution One platform with distinguished mechanics and features: Tool-to-cloud connectivity Automatic data recording Downloadable data and reports Data Recording & Management Tool
Selection ConnectedCalibration Job Calculation Return & Repair Onsite Verification Live Job Execution PersonnelSelection First Connected Solution Unveiled at WindEnergy Hamburg Trade Fair in Sept. 2026 Digital
Ecosystem Utilizing Enerpac Connect to unify our portfolio of premium solutions across full job lifecycle
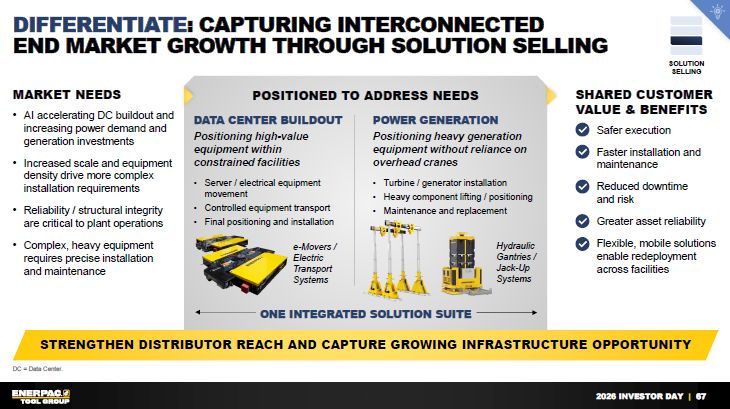
SHARED CUSTOMER VALUE & BENEFITS Safer execution Faster installation and
maintenance Reduced downtime and risk Greater asset reliability Flexible, mobile solutions enable redeployment across facilities MARKET NEEDS AI accelerating DC buildout and increasing power demand and generation investments Increased
scale and equipment density drive more complex installation requirements Reliability / structural integrity are critical to plant operations Complex, heavy equipment requires precise installation and maintenance 67 Differentiate:
Capturing interconnectedEnd Market growth through solution selling strengthen distributor reach and capture growing infrastructure opportunity DC = Data Center. DATA CENTER BUILDOUT Positioning high-value equipment within constrained
facilities Server / electrical equipment movement Controlled equipment transport Final positioning and installation POSITIONED TO ADDRESS NEEDS POWER GENERATION Positioning heavy generation equipment without reliance on overhead
cranes Turbine / generator installation Heavy component lifting / positioning Maintenance and replacement ONE INTEGRATED SOLUTION SUITE Hydraulic Gantries / Jack-Up Systems e-Movers / Electric Transport Systems SOLUTION SELLING
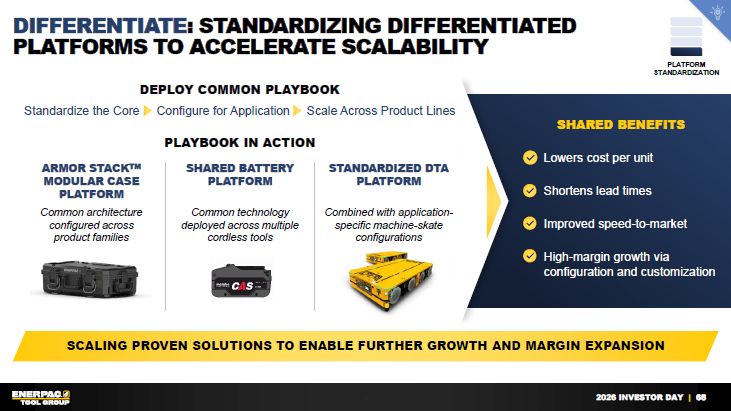
SHARED BENEFITS Lowers cost per unit Shortens lead times Improved
speed-to-market High-margin growth via configuration and customization 68 Differentiate: STANDARDIZING DIFFERENTIATED PLATFORMS TO ACCELERATE Scalability Scaling proven solutions to ENABLE further growth and Margin expansion ARMOR
STACKTM MODULAR CASE PLATFORM Common architecture configured across product families SHARED BATTERY PLATFORM Common technology deployed across multiple cordless tools STANDARDIZED DTA PLATFORM Combined with application-specific
machine-skate configurations DEPLOY COMMON PLAYBOOK Standardize the Core Configure for Application Scale Across Product Lines PLAYBOOK IN ACTION PLATFORMSTANDARDIZATION
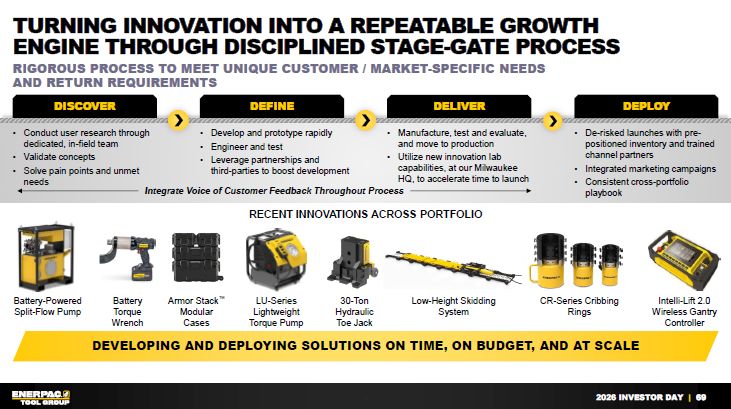
DISCOVER DEFINE DELIVER 69 Turning innovation into a repeatable growth
engine through disciplined Stage-gate process developing and Deploying solutions on time, on budget, and at scale RECENT INNOVATIONS ACROSS PORTFOLIO RIGOROUS PROCESS TO MEET UNIQUE CUSTOMER / MARKET-SPECIFIC NEEDSAND RETURN
REQUIREMENTS Conduct user research through dedicated, in-field team Validate concepts Solve pain points and unmet needs Develop and prototype rapidly Engineer and test Leverage partnerships and third-parties to boost
development Manufacture, test and evaluate, and move to production Utilize new innovation lab capabilities, at our Milwaukee HQ, to accelerate time to launch Armor Stack™ Modular Cases Battery-Powered Split-Flow Pump 30-Ton Hydraulic
Toe Jack Intelli-Lift 2.0 Wireless Gantry Controller Low-Height Skidding System CR-Series Cribbing Rings LU-Series Lightweight Torque Pump DEPLOY De-risked launches with pre-positioned inventory and trained channel partners Integrated
marketing campaigns Consistent cross-portfolio playbook Battery Torque Wrench Integrate Voice of Customer Feedback Throughout Process
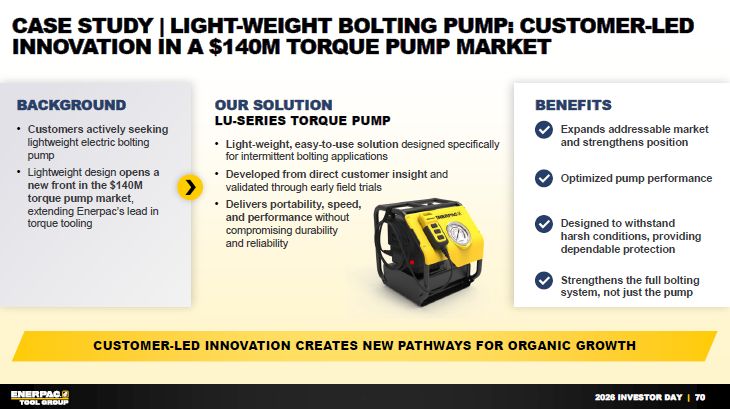
70 Case Study | Light-weight Bolting Pump: customer-led innovation in a $140M
torque pump market Customer-led Innovation creates new pathways for organic growth OUR SOLUTIONLU-Series Torque Pump Light-weight, easy-to-use solution designed specifically for intermittent bolting applications Developed from direct
customer insight and validated through early field trials Delivers portability, speed, and performance without compromising durability and reliability Benefits Expands addressable market and strengthens position BACKGROUND Customers
actively seeking lightweight electric bolting pump Lightweight design opens a new front in the $140M torque pump market, extending Enerpac’s lead in torque tooling Optimized pump performance Designed to withstand harsh conditions,
providing dependable protection Strengthens the full bolting system, not just the pump
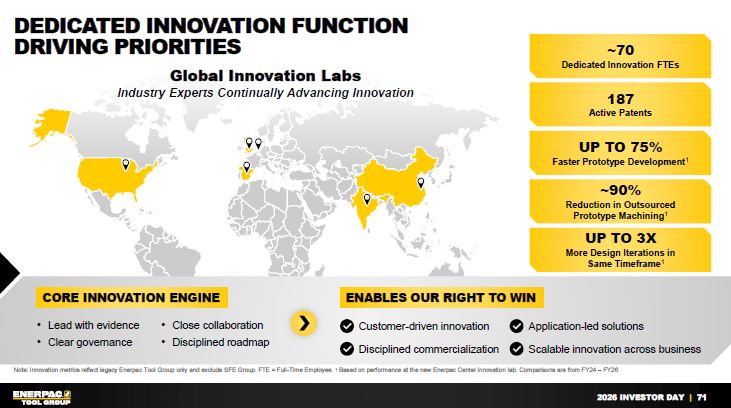
71 Dedicated Innovation FunctionDriving Priorities Note: innovation metrics
reflect legacy Enerpac Tool Group only and exclude SFE Group. FTE = Full-Time Employee. 1 Based on performance at the new Enerpac Center innovation lab. Comparisons are from FY24 – FY26. Disciplined commercialization CORE INNOVATION
ENGINE Customer-driven innovation ENABLES OUR RIGHT TO WIN Scalable innovation across business Application-led solutions Lead with evidence Clear governance Close collaboration Disciplined roadmap Global Innovation LabsIndustry
Experts Continually Advancing Innovation ~70 Dedicated Innovation FTEs UP TO 75% Faster Prototype Development1 ~90% Reduction in Outsourced Prototype Machining1 UP TO 3x More Design Iterations inSame Timeframe1 187 Active Patents
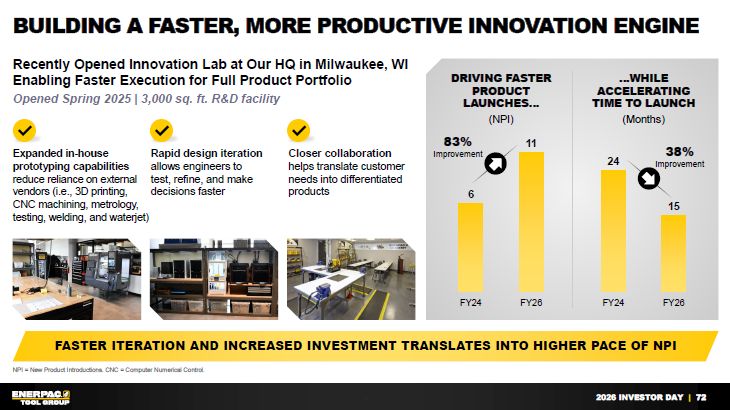
72 Building a faster, more productive innovation engine Recently Opened
Innovation Lab at Our HQ in Milwaukee, WI Enabling Faster Execution for Full Product Portfolio Opened Spring 2025 | 3,000 sq. ft. R&D facility Faster iteration and increased investment translates into higher pace of NPI NPI = New
Product Introductions. CNC = Computer Numerical Control. Expanded in-house prototyping capabilities reduce reliance on external vendors (i.e., 3D printing, CNC machining, metrology, testing, welding, and waterjet) Rapid design iteration
allows engineers to test, refine, and make decisions faster Closer collaboration helps translate customer needs into differentiated products DRIVING FASTERPRODUCT LAUNCHES… (NPI) …WHILE ACCELERATINGTIME TO LAUNCH (Months) 83%
Improvement 38% Improvement
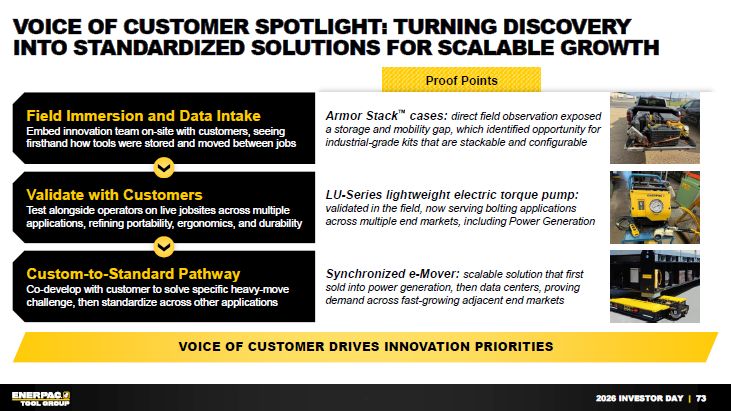
Proof Points 73 Voice of Customer Spotlight: Turning Discovery Into
Standardized Solutions for scalable growth Voice of Customer Drives innovation priorities Field Immersion and Data Intake Embed innovation team on-site with customers, seeing firsthand how tools were stored and moved between jobs Validate
with Customers Test alongside operators on live jobsites across multiple applications, refining portability, ergonomics, and durability Custom-to-Standard Pathway Co-develop with customer to solve specific heavy-move challenge, then
standardize across other applications Armor Stack™ cases: direct field observation exposed a storage and mobility gap, which identified opportunity for industrial-grade kits that are stackable and configurable LU-Series lightweight electric
torque pump: validated in the field, now serving bolting applications across multiple end markets, including Power Generation Synchronized e-Mover: scalable solution that first sold into power generation, then data centers, proving demand
across fast-growing adjacent end markets
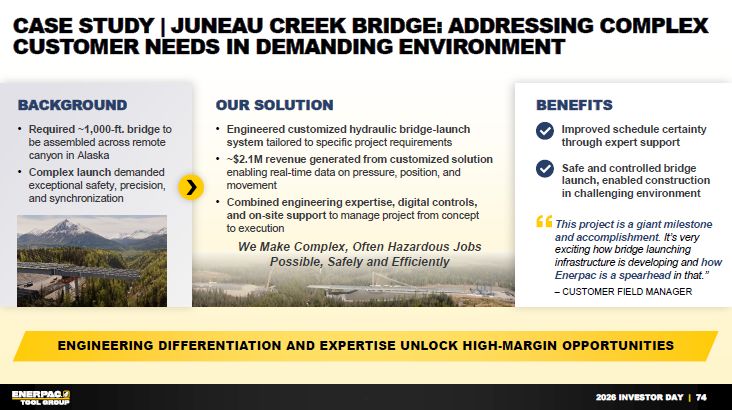
74 Case Study | Juneau Creek Bridge: Addressing Complex customer needs in
demanding environment Engineering Differentiation and expertise unlock high-margin opportunities Benefits BACKGROUND Required ~1,000-ft. bridge to be assembled across remote canyon in Alaska Complex launch demanded exceptional safety,
precision, and synchronization Improved schedule certainty through expert support Safe and controlled bridge launch, enabled construction in challenging environment This project is a giant milestone and accomplishment. It’s very exciting
how bridge launching infrastructure is developing and how Enerpac is a spearhead in that.” – CUSTOMER FIELD MANAGER OUR SOLUTION Engineered customized hydraulic bridge-launch system tailored to specific project requirements ~$2.1M
revenue generated from customized solution enabling real-time data on pressure, position, and movement Combined engineering expertise, digital controls, and on-site support to manage project from concept to execution We Make Complex, Often
Hazardous Jobs Possible, Safely and Efficiently
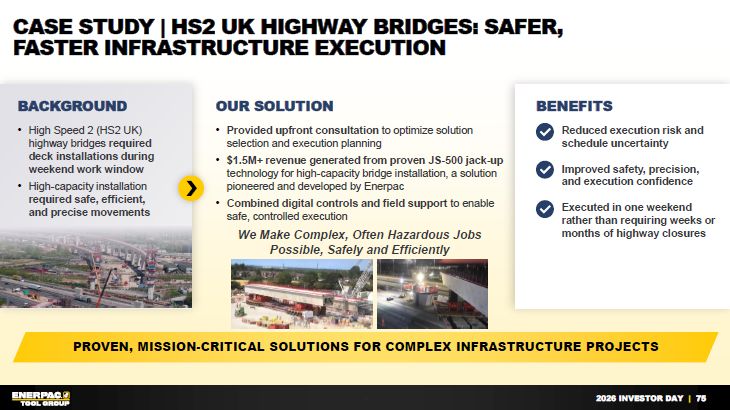
75 Case Study | HS2 UK HIGHWAY Bridges: SAFER, Faster Infrastructure
Execution Proven, Mission-critical Solutions for Complex Infrastructure projects OUR SOLUTION Provided upfront consultation to optimize solution selection and execution planning $1.5M+ revenue generated from proven JS-500 jack-up
technology for high-capacity bridge installation, a solution pioneered and developed by Enerpac Combined digital controls and field support to enable safe, controlled execution We Make Complex, Often Hazardous Jobs Possible, Safely and
Efficiently Benefits Reduced execution risk and schedule uncertainty Improved safety, precision, and execution confidence Executed in one weekend rather than requiring weeks or months of highway closures High Speed 2 (HS2 UK) highway
bridges required deck installations during weekend work window High-capacity installation required safe, efficient, and precise movements BACKGROUND
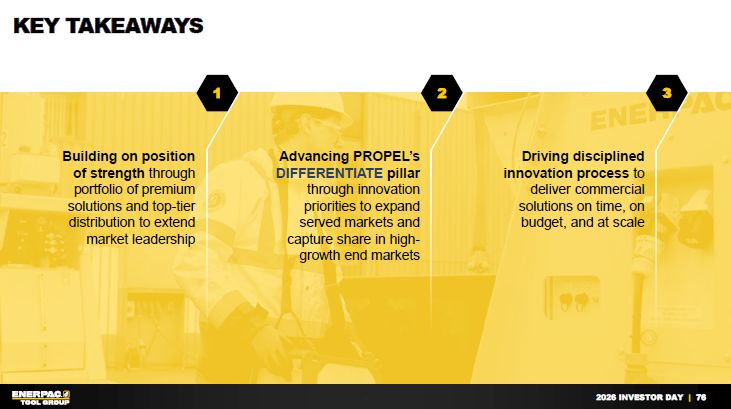
76 Key Takeaways Driving disciplined innovation process to deliver commercial
solutions on time, on budget, and at scale 3 Advancing PROPEL’s DIFFERENTIATE pillar through innovation priorities to expand served markets and capture share in high-growth end markets 2 Building on position of strength through portfolio
of premium solutions and top-tier distribution to extend market leadership 1
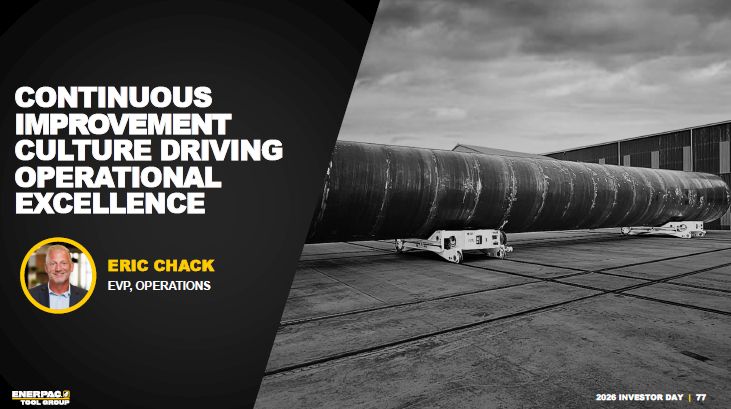
Continuous improvement culture driving operational excellence Eric Chack EVP,
Operations 77 2026 INVESTOR DAY |
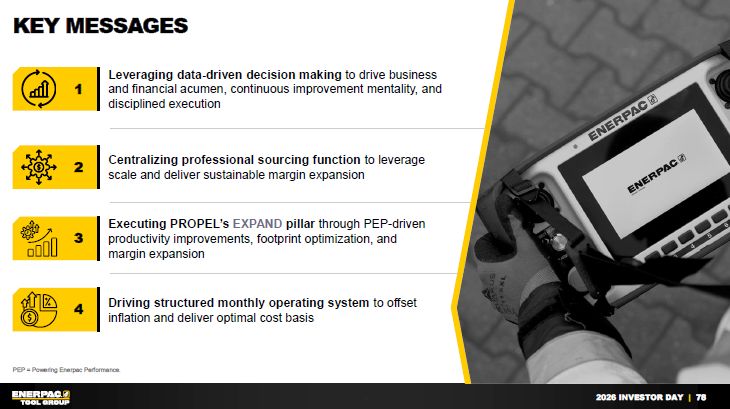
78 Key Messages PEP = Powering Enerpac Performance. Leveraging data-driven
decision making to drive business and financial acumen, continuous improvement mentality, and disciplined execution 1 Centralizing professional sourcing function to leverage scale and deliver sustainable margin expansion 2 Executing
PROPEL’s EXPAND pillar through PEP-driven productivity improvements, footprint optimization, and margin expansion 3 Driving structured monthly operating system to offset inflation and deliver optimal cost basis 4
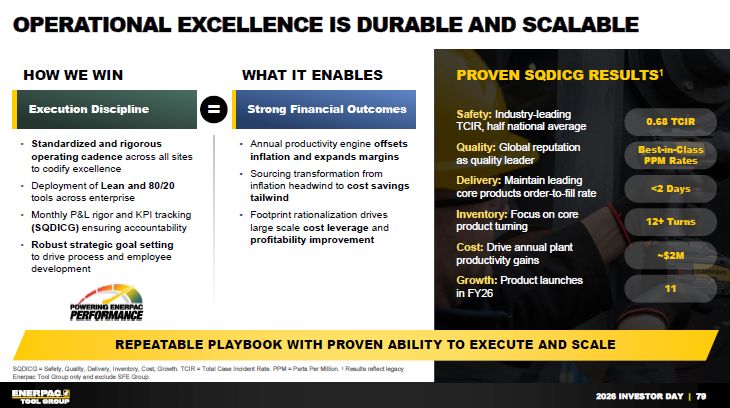
79 Operational Excellence is Durable and Scalable Repeatable Playbook with
Proven Ability to Execute And Scale PROVEN SQDICG RESULTS1 Strong Financial Outcomes HOW WE WIN WHAT IT ENABLES = Execution Discipline Standardized and rigorous operating cadence across all sites to codify excellence Deployment of
Lean and 80/20 tools across enterprise Monthly P&L rigor and KPI tracking (SQDICG) ensuring accountability Robust strategic goal setting to drive process and employee development Annual productivity engine offsets inflation and expands
margins Sourcing transformation from inflation headwind to cost savings tailwind Footprint rationalization drives large scale cost leverage and profitability improvement 0.68 TCIR Best-in-Class PPM Rates <2 Days ~$2M 11 SQDICG =
Safety, Quality, Delivery, Inventory, Cost, Growth. TCIR = Total Case Incident Rate. PPM = Parts Per Million. 1 Results reflect legacy Enerpac Tool Group only and exclude SFE Group. 12+ Turns Safety: Industry-leading TCIR, half national
average Quality: Global reputation as quality leader Delivery: Maintain leading core products order-to-fill rate Cost: Drive annual plantproductivity gains Growth: Product launches in FY26 Inventory: Focus on core product turning
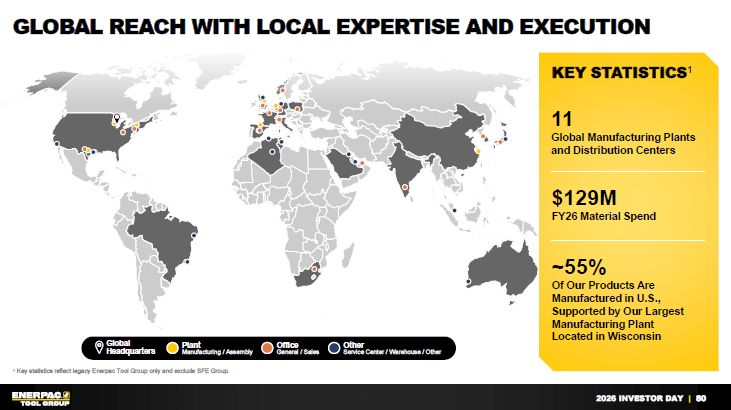
Office General / Sales Global Headquarters Other Service Center / Warehouse
/ Other Plant Manufacturing / Assembly 80 Global Reach with Local Expertise and Execution 1 Key statistics reflect legacy Enerpac Tool Group only and exclude SFE Group. KEY STATISTICS1 ~55% Of Our Products Are Manufactured in U.S.,
Supported by Our Largest Manufacturing PlantLocated in Wisconsin 11 Global Manufacturing Plants and Distribution Centers $129M FY26 Material Spend
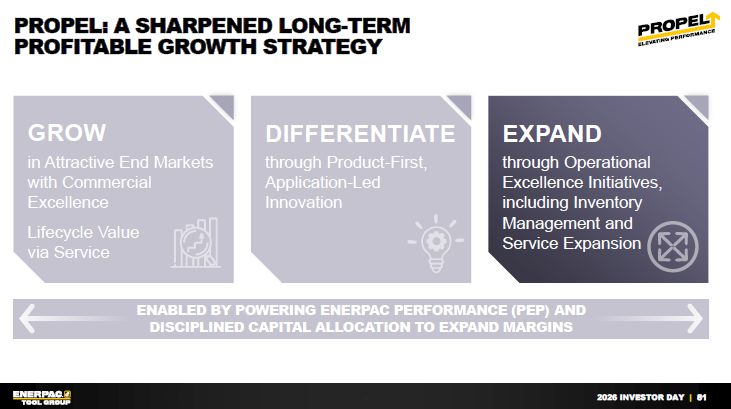
81 GROW in Attractive End Markets with Commercial Excellence Lifecycle
Valuevia Service DIFFERENTIATE through Product-First, Application-LedInnovation EXPAND through Operational Excellence Initiatives, including Inventory Management andService Expansion Propel: A Sharpened Long-term Profitable Growth
Strategy ENABLED BY POWERING ENERPAC PERFORMANCE (PEP) ANDDISCIPLINED CAPITAL ALLOCATION TO EXPAND MARGINS
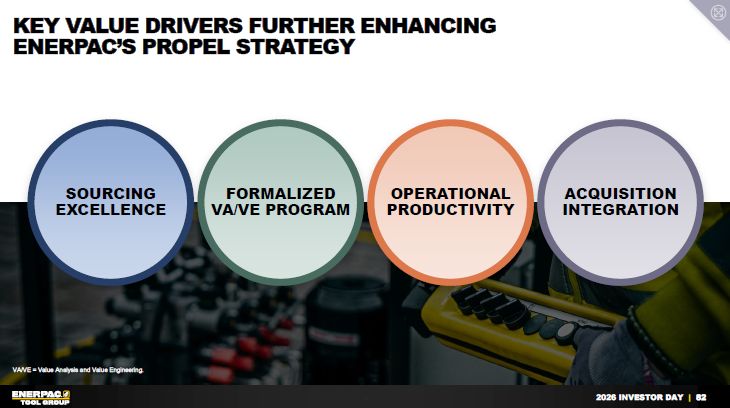
82 Key Value Drivers Further Enhancing Enerpac’s PROPEL Strategy VA/VE = Value
Analysis and Value Engineering. Sourcing Excellence Formalized VA/VE Program Operational Productivity Acquisition Integration
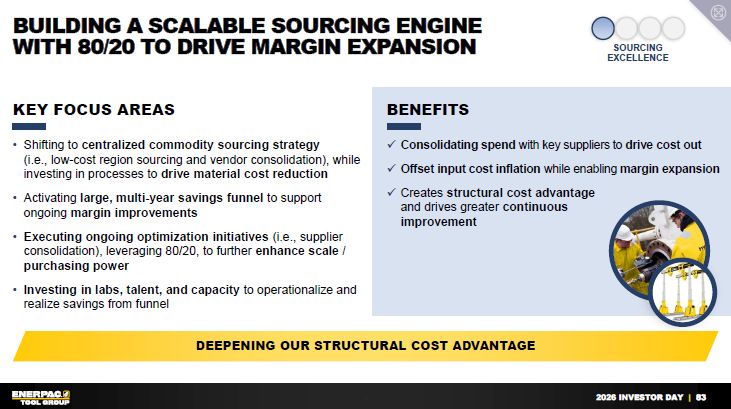
83 Building a Scalable Sourcing Enginewith 80/20 to Drive Margin Expansion KEY
FOCUS AREAS Shifting to centralized commodity sourcing strategy (i.e., low-cost region sourcing and vendor consolidation), while investing in processes to drive material cost reduction Activating large, multi-year savings funnel to support
ongoing margin improvements Executing ongoing optimization initiatives (i.e., supplier consolidation), leveraging 80/20, to further enhance scale / purchasing power Investing in labs, talent, and capacity to operationalize and realize
savings from funnel DEEPENING OUR Structural Cost Advantage Sourcing Excellence BENEFITS Consolidating spend with key suppliers to drive cost out Offset input cost inflation while enabling margin expansion Creates structural cost
advantageand drives greater continuous improvement
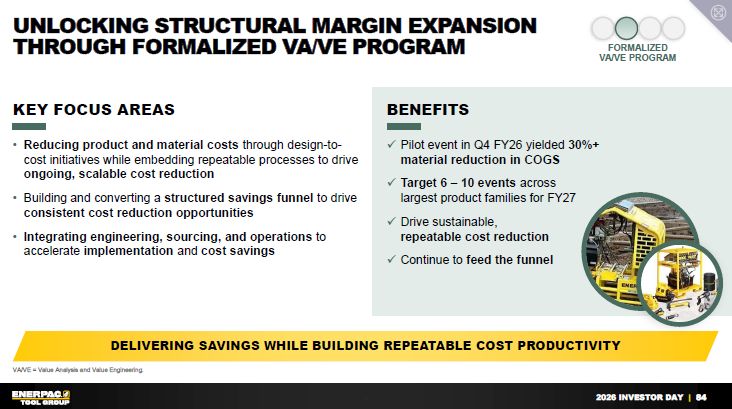
Unlocking structural margin expansionthrough Formalized VA/VE
Program FormalizedVA/VE Program 84 Delivering savings while Building Repeatable Cost Productivity VA/VE = Value Analysis and Value Engineering. BENEFITS Pilot event in Q4 FY26 yielded 30%+material reduction in COGS Target 6 – 10
events across largest product families for FY27 Drive sustainable, repeatable cost reduction Continue to feed the funnel KEY FOCUS AREAS Reducing product and material costs through design-to-cost initiatives while embedding repeatable
processes to drive ongoing, scalable cost reduction Building and converting a structured savings funnel to drive consistent cost reduction opportunities Integrating engineering, sourcing, and operations to accelerate implementation and cost
savings
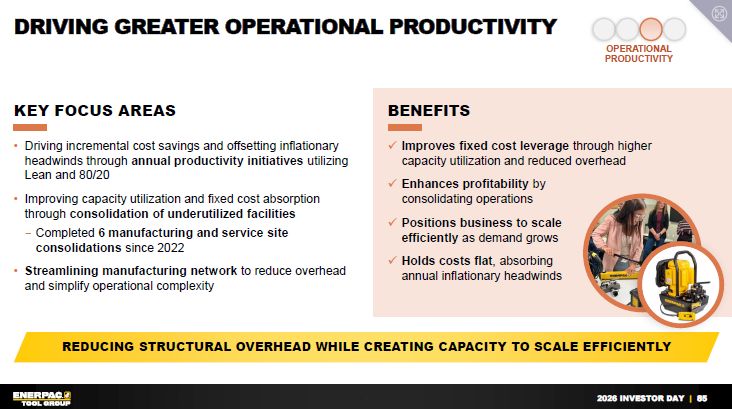
Operational Productivity 85 Driving Greater Operational Productivity Reducing
Structural Overhead While Creating Capacity to Scale Efficiently BENEFITS Improves fixed cost leverage through higher capacity utilization and reduced overhead Enhances profitability by consolidating operations Positions business to scale
efficiently as demand grows Holds costs flat, absorbing annual inflationary headwinds KEY FOCUS AREAS Driving incremental cost savings and offsetting inflationary headwinds through annual productivity initiatives utilizing Lean and
80/20 Improving capacity utilization and fixed cost absorption through consolidation of underutilized facilities Completed 6 manufacturing and service site consolidations since 2022 Streamlining manufacturing network to reduce overhead and
simplify operational complexity
86 Deploying Acquisition Integration playbook to Standardize Best
Practices Enables scalable, repeatable value creation through proven integration playbook KEY FOCUS AREAS Applying standardized operating model to accelerate integration and drive consistent execution Capturing cost and operational
synergies through sourcing, footprint alignment, and process optimization Integrating systems, data, and KPIs to enhance visibility, accountability, and performance management BENEFITS Consolidated global distribution network to optimize
overhead and freight costs Greater economies of scale with enhanced discounts andvolume rebates Potential site consolidations to minimize overhead and maximize fixed asset utilization Acquisition Integration KPI = Key Performance
Indicator.
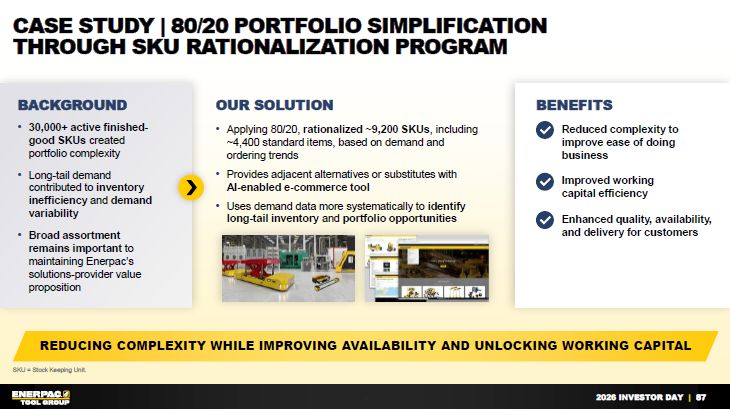
87 Case Study | 80/20 Portfolio Simplification through SKU Rationalization
Program Reducing Complexity while improving availability and unlocking working capital Our Solution Applying 80/20, rationalized ~9,200 SKUs, including ~4,400 standard items, based on demand and ordering trends Provides adjacent
alternatives or substitutes with AI-enabled e-commerce tool Uses demand data more systematically to identify long-tail inventory and portfolio opportunities 30,000+ active finished-good SKUs created portfolio complexity Long-tail demand
contributed to inventory inefficiency and demand variability Broad assortment remains important to maintaining Enerpac’s solutions-provider value proposition BENEFITS Background Reduced complexity to improve ease of doing
business Improved working capital efficiency Enhanced quality, availability, and delivery for customers SKU = Stock Keeping Unit.
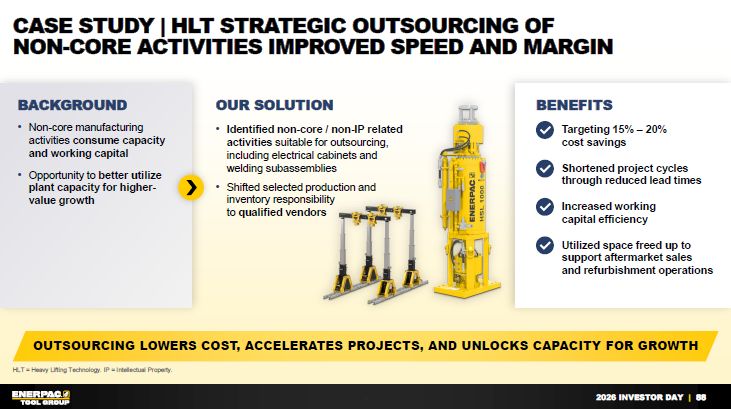
88 Case Study | HLT Strategic Outsourcing of non-core activities IMPROVED speed
and margin Outsourcing Lowers cost, accelerates projects, and unlocks capacity for growth Our solution Identified non-core / non-IP related activities suitable for outsourcing, including electrical cabinets and welding
subassemblies Shifted selected production and inventory responsibilityto qualified vendors Non-core manufacturing activities consume capacity and working capital Opportunity to better utilize plant capacity for higher-value growth
BENEFITS Targeting 15% – 20% cost savings Shortened project cycles through reduced lead times Increased working capital efficiency Utilized space freed up to support aftermarket sales and refurbishment operations Background HLT =
Heavy Lifting Technology. IP = Intellectual Property.
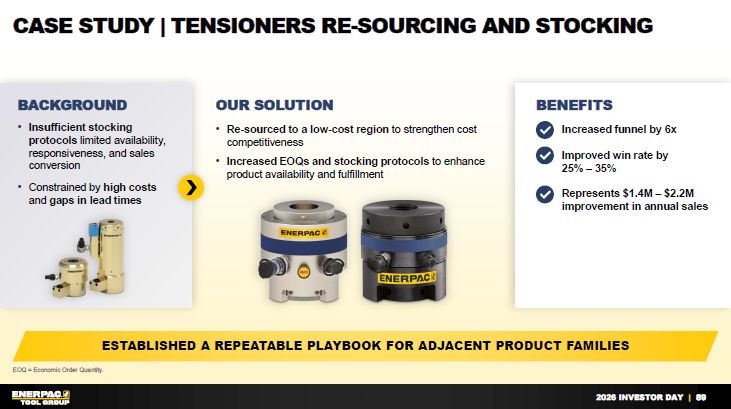
89 Case Study | Tensioners Re-sourcing and Stocking Established a repeatable
playbook for adjacent product families Our solution Re-sourced to a low-cost region to strengthen cost competitiveness Increased EOQs and stocking protocols to enhance product availability and fulfillment Insufficient stocking protocols
limited availability, responsiveness, and sales conversion Constrained by high costs and gaps in lead times BENEFITS Increased funnel by 6x Improved win rate by25% – 35% Represents $1.4M – $2.2M improvement in annual
sales Background EOQ = Economic Order Quantity.
90 Key Takeaways PEP = Powering Enerpac Performance. Executing PROPEL’s
EXPAND pillar through PEP-driven productivity improvements, footprint optimization, and margin expansion 3 Driving structured monthly operating system to offset inflation and deliver optimal cost basis 4 Centralizing professional sourcing
function to leverage scale and deliver sustainable margin expansion 2 Leveraging data-driven decision making to drive business and financial acumen, continuous improvement mentality, and disciplined execution 1
Financial Framework for a High-quality Industrial Compounder 91 Darren
Kozik EVP and CFO 2026 INVESTOR DAY |
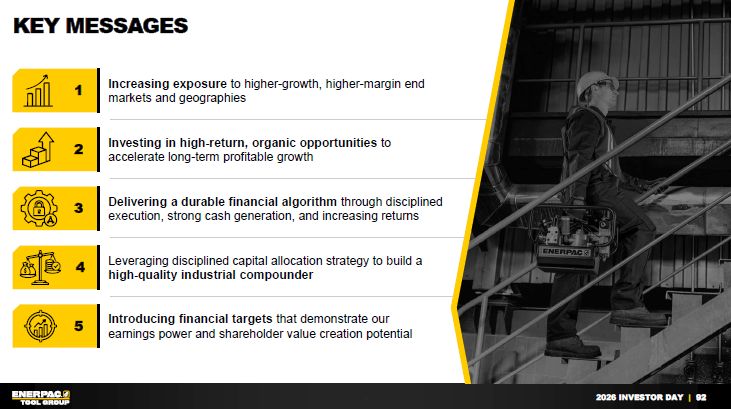
92 Key Messages 01 Increasing exposure to higher-growth, higher-margin end
markets and geographies 1 Investing in high-return, organic opportunities to accelerate long-term profitable growth 2 Delivering a durable financial algorithm through disciplined execution, strong cash generation, and increasing
returns 3 Leveraging disciplined capital allocation strategy to build a high-quality industrial compounder 4 Introducing financial targets that demonstrate our earnings power and shareholder value creation potential 5
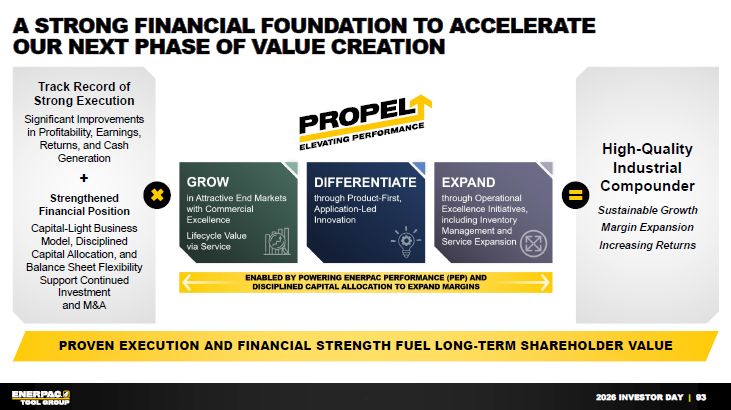
High-Quality Industrial Compounder Sustainable Growth Margin
Expansion Increasing Returns 93 A Strong Financial foundation to accelerateour next phase of value creation Proven execution and financial strength Fuel long-term shareholder value Track Record ofStrong Execution Significant
Improvements in Profitability, Earnings, Returns, and Cash Generation + StrengthenedFinancial Position Capital-Light Business Model, Disciplined Capital Allocation, and Balance Sheet Flexibility Support Continued Investment and
M&A + =
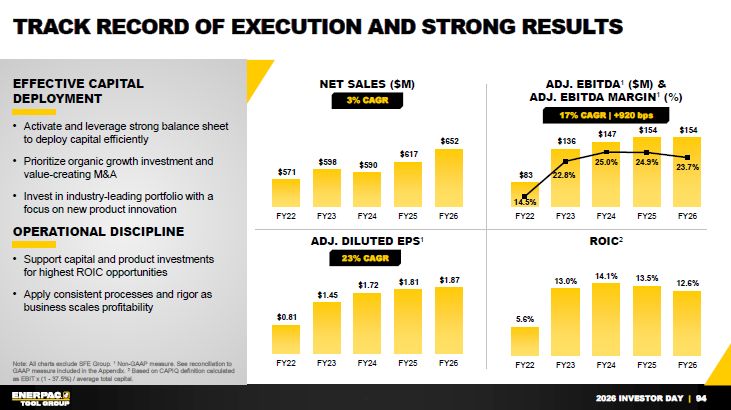
94 Track Record of Execution And strong results Net Sales ($M) Adj. EBITDA1
($M) &Adj. EBITDA Margin1 (%) EFFECTIVE CAPITAL DEPLOYMENT Activate and leverage strong balance sheet to deploy capital efficiently Prioritize organic growth investment and value-creating M&A Invest in industry-leading portfolio
with a focus on new product innovation OPERATIONAL DISCIPLINE Support capital and product investments for highest ROIC opportunities Apply consistent processes and rigor as business scales profitability Adj. Diluted EPS1 ROIC2 3%
CAGR 17% CAGR | +920 bps 23% CAGR Note: All charts exclude SFE Group. 1 Non-GAAP measure. See reconciliation to GAAP measure included in the Appendix. 2 Based on CAPIQ definition calculatedas EBIT x (1 - 37.5%) / average total capital.
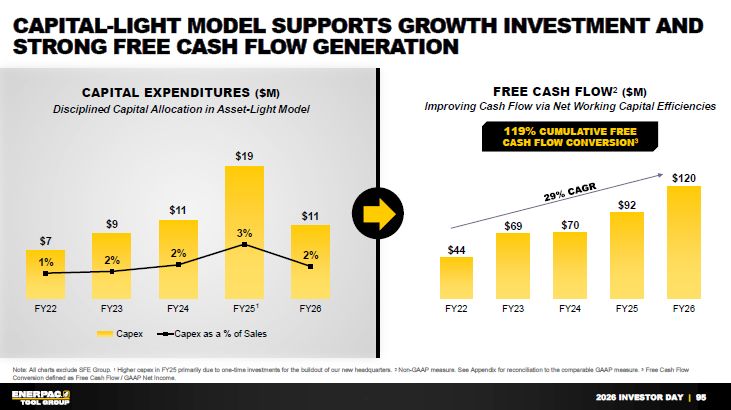
95 Capital-light model supports growth investment and strong Free Cash Flow
Generation Note: All charts exclude SFE Group. 1 Higher capex in FY25 primarily due to one-time investments for the buildout of our new headquarters. 2 Non-GAAP measure. See Appendix for reconciliation to the comparable GAAP measure. 3 Free
Cash Flow Conversion defined as Free Cash Flow / GAAP Net Income. Capital Expenditures ($M) Disciplined Capital Allocation in Asset-Light Model Free Cash Flow2 ($M)Improving Cash Flow via Net Working Capital Efficiencies 119% CUMULATIVE
FREE CASH FLOW CONVERSION3 1 29% CAGR
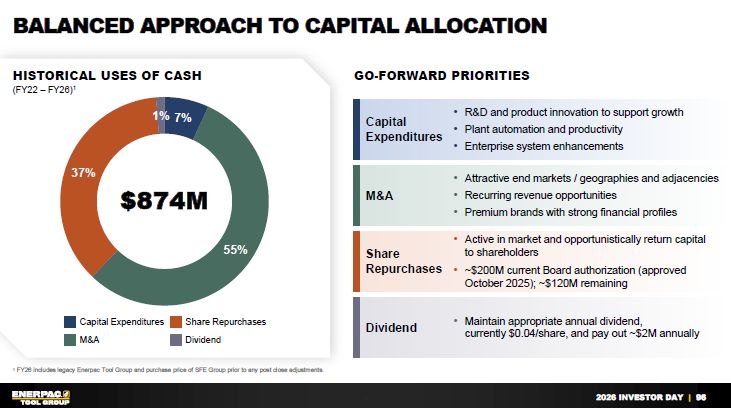
96 balanced Approach To capital allocation 1 FY26 includes legacy Enerpac Tool
Group and purchase price of SFE Group prior to any post close adjustments. Historical Uses of Cash (FY22 – FY26)1 $874M Go-Forward Priorities Capital Expenditures R&D and product innovation to support growth Plant automation and
productivity Enterprise system enhancements M&A Attractive end markets / geographies and adjacencies Recurring revenue opportunities Premium brands with strong financial profiles Share Repurchases Active in market and
opportunistically return capitalto shareholders ~$200M current Board authorization (approved October 2025); ~$120M remaining Dividend Maintain appropriate annual dividend, currently $0.04/share, and pay out ~$2M annually Capital
Expenditures M&A Share Repurchases Dividend
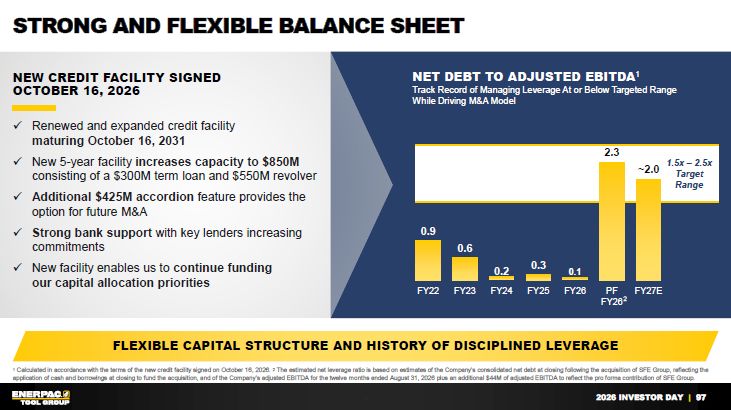
97 Strong and flexible Balance sheet Flexible Capital structure and history of
Disciplined Leverage 1 Calculated in accordance with the terms of the new credit facility signed on October 16, 2026. 2 The estimated net leverage ratio is based on estimates of the Company’s consolidated net debt at closing following the
acquisition of SFE Group, reflecting the application of cash and borrowings at closing to fund the acquisition, and of the Company’s adjusted EBITDA for the twelve months ended August 31, 2026 plus an additional $44M of adjusted EBITDA to
reflect the pro forma contribution of SFE Group. New credit facility signed October 16, 2026 Net Debt to Adjusted EBITDA1 Track Record of Managing Leverage At or Below Targeted Range While Driving M&A Model 1.5x – 2.5x
TargetRange Renewed and expanded credit facilitymaturing October 16, 2031 New 5-year facility increases capacity to $850M consisting of a $300M term loan and $550M revolver Additional $425M accordion feature provides the option for future
M&A Strong bank support with key lenders increasing commitments New facility enables us to continue funding our capital allocation priorities 2 0.1
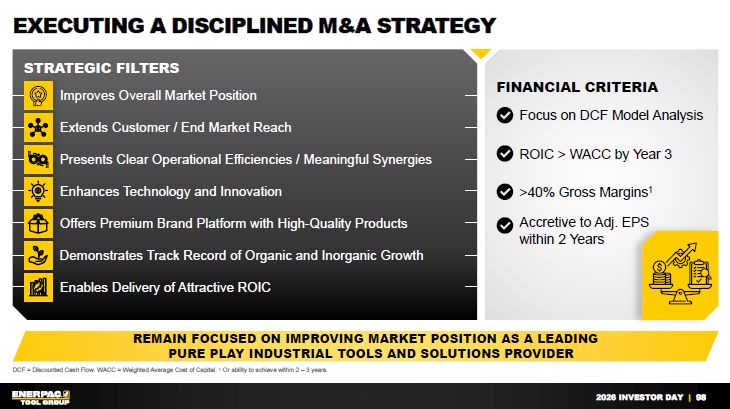
98 Executing a disciplined M&A Strategy Remain Focused on Improving Market
Position As a Leadingpure play industrial tools and solutions provider Strategic Filters FINANCIAL CRITERIA Focus on DCF Model Analysis ROIC > WACC by Year 3 >40% Gross Margins1 Accretive to Adj. EPS within 2 Years Improves
Overall Market Position Enables Delivery of Attractive ROIC Offers Premium Brand Platform with High-Quality Products Demonstrates Track Record of Organic and Inorganic Growth Presents Clear Operational Efficiencies / Meaningful
Synergies Enhances Technology and Innovation Extends Customer / End Market Reach DCF = Discounted Cash Flow. WACC = Weighted Average Cost of Capital. 1 Or ability to achieve within 2 – 3 years.
99 M&A Strategy in Action: SFE GROUP Scorecard Transaction
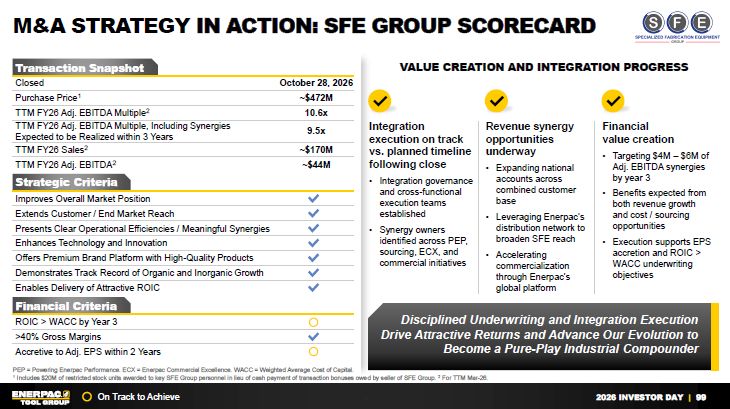
Snapshot Closed October 28, 2026 Purchase Price1 ~$472M TTM FY26 Adj. EBITDA Multiple2 10.6x TTM FY26 Adj. EBITDA Multiple, Including SynergiesExpected to be Realized within 3 Years 9.5x TTM FY26 Sales2 ~$170M TTM FY26 Adj.
EBITDA2 ~$44M Strategic Criteria Improves Overall Market Position Extends Customer / End Market Reach Presents Clear Operational Efficiencies / Meaningful Synergies Enhances Technology and Innovation Offers Premium Brand Platform with
High-Quality Products Demonstrates Track Record of Organic and Inorganic Growth Enables Delivery of Attractive ROIC Financial Criteria ROIC > WACC by Year 3 >40% Gross Margins Accretive to Adj. EPS within 2 Years On Track to
Achieve VALUE CREATION AND INTEGRATION PROGRESS Disciplined Underwriting and Integration Execution Drive Attractive Returns and Advance Our Evolution to Become a Pure-Play Industrial Compounder PEP = Powering Enerpac Performance. ECX =
Enerpac Commercial Excellence. WACC = Weighted Average Cost of Capital. 1 Includes $20M of restricted stock units awarded to key SFE Group personnel in lieu of cash payment of transaction bonuses owed by seller of SFE Group. 2 For TTM
Mar-26. Integration execution on track vs. planned timeline following close Integration governance and cross-functional execution teams established Synergy owners identified across PEP, sourcing, ECX, and commercial initiatives Revenue
synergy opportunities underway Expanding national accounts across combined customer base Leveraging Enerpac’s distribution network to broaden SFE reach Accelerating commercialization through Enerpac’s global platform Financial value
creation Targeting $4M – $6M of Adj. EBITDA synergies by year 3 Benefits expected from both revenue growth and cost / sourcing opportunities Execution supports EPS accretion and ROIC > WACC underwriting objectives
100 Growing Cash Flow strengthens Balance Sheet and increases Capital
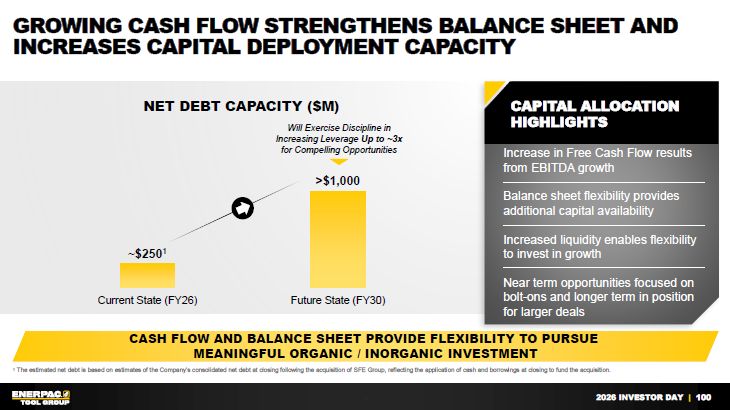
Deployment Capacity 1 The estimated net debt is based on estimates of the Company’s consolidated net debt at closing following the acquisition of SFE Group, reflecting the application of cash and borrowings at closing to fund the
acquisition. CAPITAL ALLOCATION HIGHLIGHTS Will Exercise Discipline in Increasing Leverage Up to ~3xfor Compelling Opportunities Net DEBT CAPACITY ($M) Cash flow and balance sheet provide flexibility to pursue meaningful organic /
inorganic investment Cash flow and balance sheet provide flexibility to pursue meaningful organic / inorganic investment Increase in Free Cash Flow results from EBITDA growth Balance sheet flexibility provides additional capital
availability Increased liquidity enables flexibility to invest in growth Near term opportunities focused on bolt-ons and longer term in position for larger deals
101 A Sharpened Long-term Profitable Growth Strategy to become an industrial
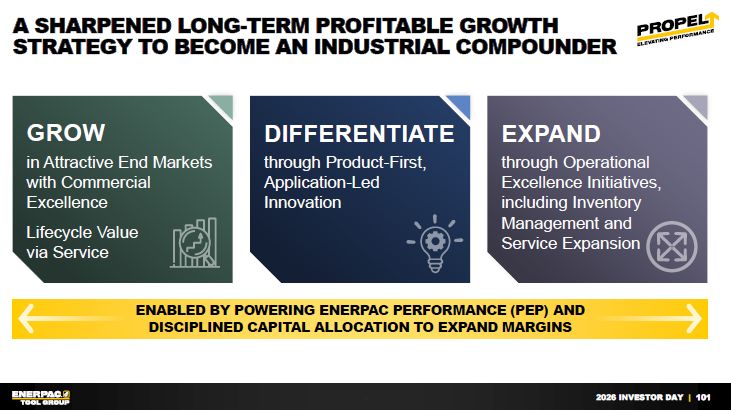
compounder GROW in Attractive End Markets with Commercial Excellence Lifecycle Valuevia Service DIFFERENTIATE through Product-First, Application-LedInnovation EXPAND through Operational Excellence Initiatives, including Inventory
Management andService Expansion ENABLED BY POWERING ENERPAC PERFORMANCE (PEP) ANDDISCIPLINED CAPITAL ALLOCATION TO EXPAND MARGINS
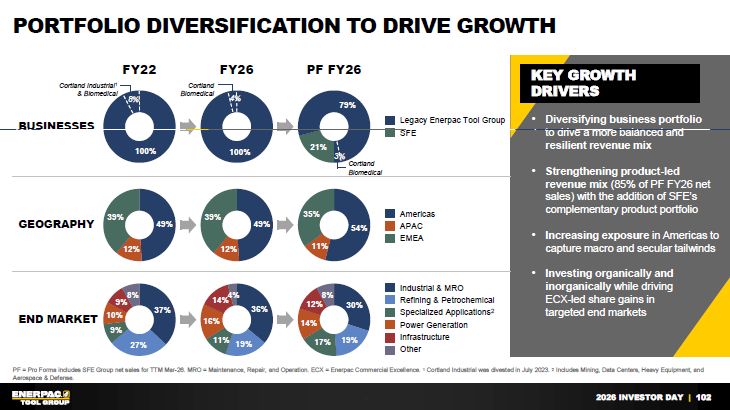
KEY GROWTHDRIVERS 102 PF = Pro Forma includes SFE Group net sales for TTM
Mar-26. MRO = Maintenance, Repair, and Operation. ECX = Enerpac Commercial Excellence. 1 Cortland Industrial was divested in July 2023. 2 Includes Mining, Data Centers, Heavy Equipment, and Aerospace & Defense.
Businesses Geography End Market Legacy Enerpac Tool Group SFE Americas APAC EMEA FY22 PF FY26 Diversifying business portfolio to drive a more balanced and resilient revenue mix Strengthening product-led revenue mix (85% of PF
FY26 net sales) with the addition of SFE’s complementary product portfolio Increasing exposure in Americas to capture macro and secular tailwinds Investing organically and inorganically while driving ECX-led share gains in targeted end
markets FY26 Industrial & MRO Refining & Petrochemical Specialized Applications2 Power Generation Infrastructure Other Cortland Industrial1 & Biomedical Cortland Biomedical Cortland Biomedical PORTFOLIO Diversification
TO DRIVE GROWTH
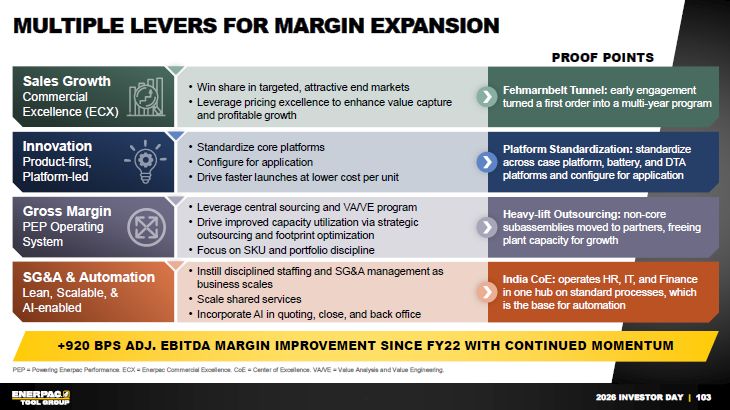
103 Multiple levers for margin expansion +920 Bps Adj. EBITDA margin
improvement since FY22 with continued momentum PEP = Powering Enerpac Performance. ECX = Enerpac Commercial Excellence. CoE = Center of Excellence. VA/VE = Value Analysis and Value Engineering. Sales Growth Commercial Excellence (ECX)
Innovation Product-first, Platform-led SG&A & Automation Lean, Scalable, & AI-enabled Win share in targeted, attractive end markets Leverage pricing excellence to enhance value capture and profitable growth Instill
disciplined staffing and SG&A management as business scales Scale shared services Incorporate AI in quoting, close, and back office Standardize core platforms Configure for application Drive faster launches at lower cost per
unit PROOF POINTS Fehmarnbelt Tunnel: early engagement turned a first order into a multi-year program Platform Standardization: standardize across case platform, battery, and DTA platforms and configure for application India CoE: operates
HR, IT, and Finance in one hub on standard processes, which is the base for automation Gross Margin PEP Operating System Leverage central sourcing and VA/VE program Drive improved capacity utilization via strategic outsourcing and
footprint optimization Focus on SKU and portfolio discipline Heavy-lift Outsourcing: non-core subassemblies moved to partners, freeing plant capacity for growth
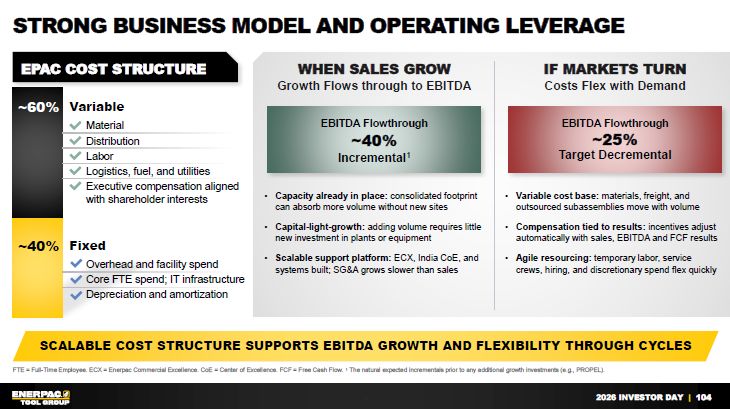
104 Strong business model and operating leverage Scalable cost structure
supports EBITDA Growth and Flexibility through cycles Fixed Overhead and facility spend Core FTE spend; IT infrastructure Depreciation and amortization Variable Material Distribution Labor Logistics, fuel, and utilities Executive
compensation aligned with shareholder interests ~60% ~40% EPAC COST STRUCTURE Capacity already in place: consolidated footprint can absorb more volume without new sites Capital-light-growth: adding volume requires little new investment
in plants or equipment Scalable support platform: ECX, India CoE, and systems built; SG&A grows slower than sales WHEN SALES GROWGrowth Flows through to EBITDA Variable cost base: materials, freight, and outsourced subassemblies move
with volume Compensation tied to results: incentives adjust automatically with sales, EBITDA and FCF results Agile resourcing: temporary labor, service crews, hiring, and discretionary spend flex quickly IF MARKETS TURN Costs Flex with
Demand FTE = Full-Time Employee. ECX = Enerpac Commercial Excellence. CoE = Center of Excellence. FCF = Free Cash Flow. 1 The natural expected incrementals prior to any additional growth investments (e.g., PROPEL). EBITDA
Flowthrough ~40% Incremental1 EBITDA Flowthrough ~25% Target Decremental
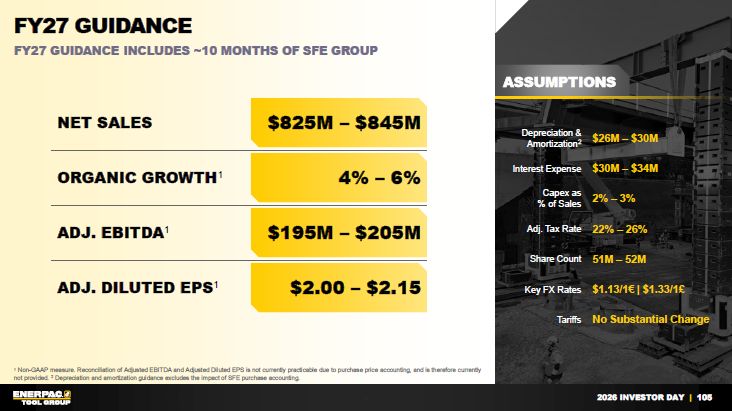
105 FY27 guidance 1 Non-GAAP measure. Reconciliation of Adjusted EBITDA and
Adjusted Diluted EPS is not currently practicable due to purchase price accounting, and is therefore currently not provided. 2 Depreciation and amortization guidance excludes the impact of SFE purchase accounting.
Assumptions Depreciation & Amortization2 $26M – $30M Interest Expense $30M – $34M Capex as% of Sales 2% – 3% Adj. Tax Rate 22% – 26% Share Count 51M – 52M Key FX Rates $1.13/1€ | $1.33/1£ Tariffs No Substantial Change Net
Sales $825M – $845M Organic Growth1 4% – 6% Adj. EBITDA1 $195M – $205M Adj. Diluted EPS1 $2.00 – $2.15 FY27 GUIDANCE INCLUDES ~10 MONTHS OF SFE GROUP
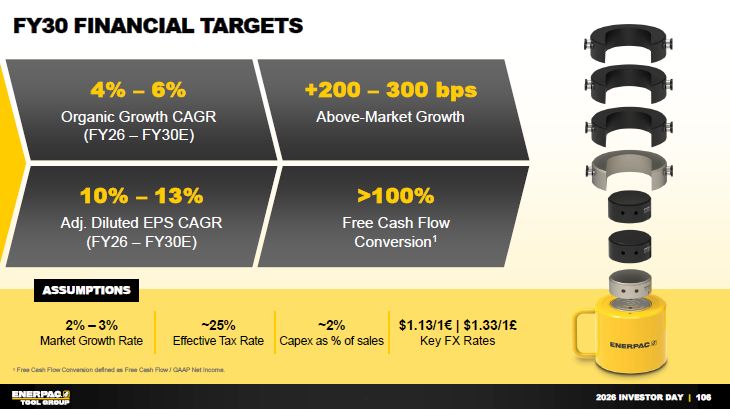
106 FY30 Financial Targets 1 Free Cash Flow Conversion defined as Free Cash
Flow / GAAP Net Income. 2% – 3% Market Growth Rate ~25% Effective Tax Rate ~2% Capex as % of sales $1.13/1€ | $1.33/1£ Key FX Rates 4% – 6% Organic Growth CAGR (FY26 – FY30E) 10% – 13% Adj. Diluted EPS CAGR(FY26 – FY30E) +200 –
300 bps Above-Market Growth >100% Free Cash FlowConversion1 ASSUMPTIONS
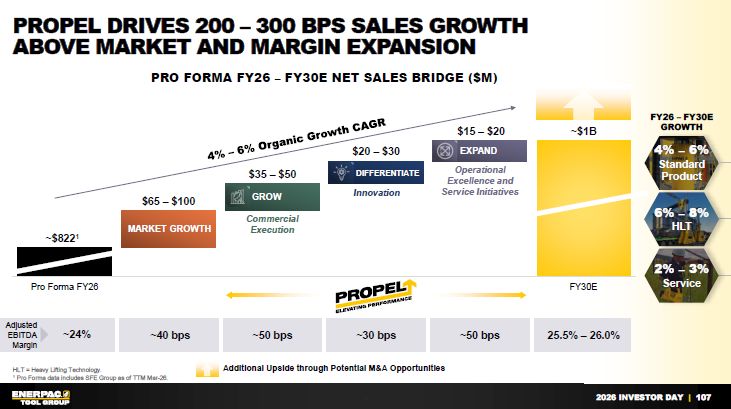
107 Propel drives 200 – 300 bps sales growthabove market and margin
expansion HLT = Heavy Lifting Technology.1 Pro Forma data includes SFE Group as of TTM Mar-26. ~$8221 $65 – $100 GROW PRO FORMA FY26 – fY30E Net Sales bridge ($M) Adjusted EBITDA Margin ~24% ~40 bps ~50 bps ~30 bps ~50 bps 25.5%
– 26.0% Additional Upside through Potential M&A Opportunities DIFFERENTIATE EXPAND $35 – $50 $20 – $30 $15 – $20 4% – 6% Standard Product FY26 – FY30EGrowth ~$1B MARKET GROWTH 4% – 6% Organic Growth CAGR Commercial
Execution Innovation Operational Excellence and Service Initiatives 6% – 8% HLT 2% – 3% Service
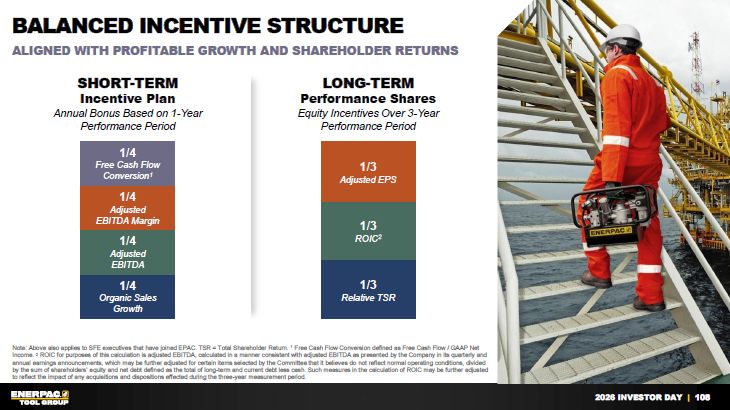
108 Balanced incentive structure SHORT-TERMIncentive Plan Annual Bonus Based
on 1-YearPerformance Period 1/4 Organic Sales Growth 1/4 AdjustedEBITDA 1/4 AdjustedEBITDA Margin 1/4 Free Cash Flow Conversion1 LONG-TERMPerformance Shares Equity Incentives Over 3-YearPerformance Period Note: Above also applies
to SFE executives that have joined EPAC. TSR = Total Shareholder Return. 1 Free Cash Flow Conversion defined as Free Cash Flow / GAAP Net Income. 2 ROIC for purposes of this calculation is adjusted EBITDA, calculated in a manner consistent
with adjusted EBITDA as presented by the Company in its quarterly and annual earnings announcements, which may be further adjusted for certain items selected by the Committee that it believes do not reflect normal operating conditions,
divided by the sum of shareholders’ equity and net debt defined as the total of long-term and current debt less cash. Such measures in the calculation of ROIC may be further adjusted to reflect the impact of any acquisitions and dispositions
effected during the three-year measurement period. 1/3 Relative TSR 1/3 ROIC2 1/3 Adjusted EPS ALIGNED WITH PROFITABLE GROWTH AND SHAREHOLDER RETURNS
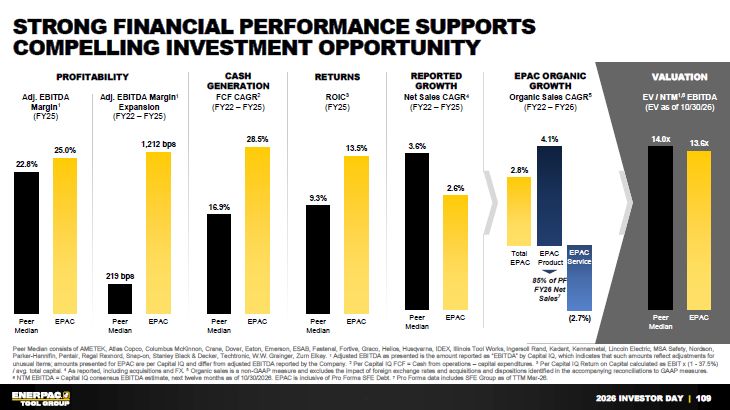
109 strong financial performance supports compelling investment
opportunity Adj. EBITDA Margin1 Expansion(FY22 – FY25) PROFITABILITY ROIC3(FY25) EV / NTM1,6 EBITDA(EV as of 10/30/26) RETURNS VALUATION Net Sales CAGR4(FY22 – FY25) REPORTEDGROWTH Adj. EBITDAMargin1(FY25) EPAC ORGANIC
GROWTH Organic Sales CAGR5(FY22 – FY26) Peer Median consists of AMETEK, Atlas Copco, Columbus McKinnon, Crane, Dover, Eaton, Emerson, ESAB, Fastenal, Fortive, Graco, Helios, Husqvarna, IDEX, Illinois Tool Works, Ingersoll Rand, Kadant,
Kennametal, Lincoln Electric, MSA Safety, Nordson, Parker-Hannifin, Pentair, Regal Rexnord, Snap-on, Stanley Black & Decker, Techtronic, W.W. Grainger, Zurn Elkay. 1 Adjusted EBITDA as presented is the amount reported as “EBITDA” by
Capital IQ, which indicates that such amounts reflect adjustments for unusual items; amounts presented for EPAC are per Capital IQ and differ from adjusted EBITDA reported by the Company. 2 Per Capital IQ FCF = Cash from operations – capital
expenditures. 3 Per Capital IQ Return on Capital calculated as EBIT x (1 - 37.5%) / avg. total capital. 4 As reported, including acquisitions and FX. 5 Organic sales is a non-GAAP measure and excludes the impact of foreign exchange rates and
acquisitions and dispositions identified in the accompanying reconciliations to GAAP measures.6 NTM EBITDA = Capital IQ consensus EBITDA estimate, next twelve months as of 10/30/2026. EPAC is inclusive of Pro Forma SFE Debt. 7 Pro Forma data
includes SFE Group as of TTM Mar-26. 85% of PF FY26 Net Sales7 EPAC Service FCF CAGR2(FY22 – FY25) CASH GENERATION
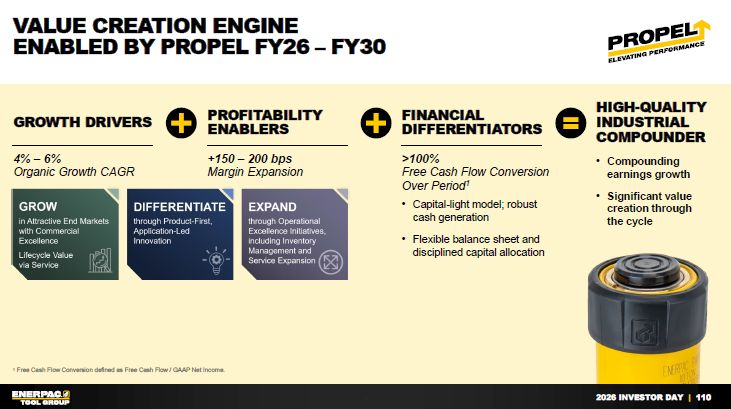
110 value creation engineenabled by Propel Fy26 – Fy30 1 Free Cash Flow
Conversion defined as Free Cash Flow / GAAP Net Income. Compounding earnings growth Significant value creation through the cycle High-quality industrial compounder Growth Drivers 4% – 6%Organic Growth CAGR ProfitabilityEnablers +150 –
200 bpsMargin Expansion Capital-light model; robust cash generation Flexible balance sheet and disciplined capital allocation Financial Differentiators >100%Free Cash Flow Conversion Over Period1
Closing remarks: Invest with Us 111 Paul Sternlieb President and CEO 2026
INVESTOR DAY |
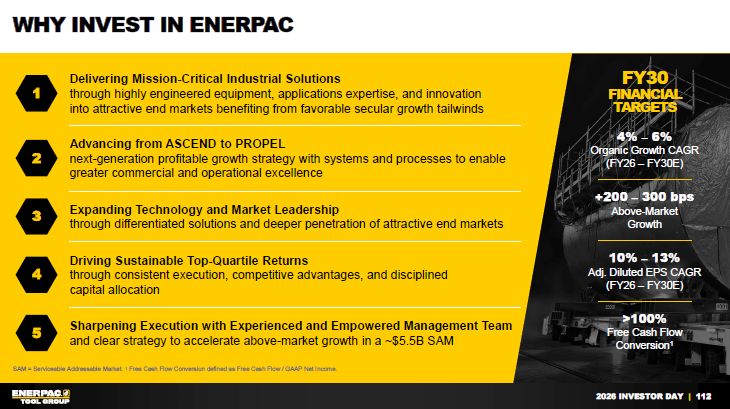
112 Why Invest in Enerpac Delivering Mission-Critical Industrial Solutions
through highly engineered equipment, applications expertise, and innovation into attractive end markets benefiting from favorable secular growth tailwinds 1 Advancing from ASCEND to PROPEL next-generation profitable growth strategy with
systems and processes to enable greater commercial and operational excellence 2 Expanding Technology and Market Leadershipthrough differentiated solutions and deeper penetration of attractive end markets 3 Driving Sustainable Top-Quartile
Returns through consistent execution, competitive advantages, and disciplined capital allocation 4 Sharpening Execution with Experienced and Empowered Management Teamand clear strategy to accelerate above-market growth in a ~$5.5B
SAM 5 FY30 Financial Targets 4% – 6% Organic Growth CAGR (FY26 – FY30E) +200 – 300 bps Above-MarketGrowth 10% – 13% Adj. Diluted EPS CAGR (FY26 – FY30E) >100% Free Cash Flow Conversion1 SAM = Serviceable Addressable Market. 1
Free Cash Flow Conversion defined as Free Cash Flow / GAAP Net Income.
Q&A Session 113
appendix 114 Reconciliations of non-GAAP measures
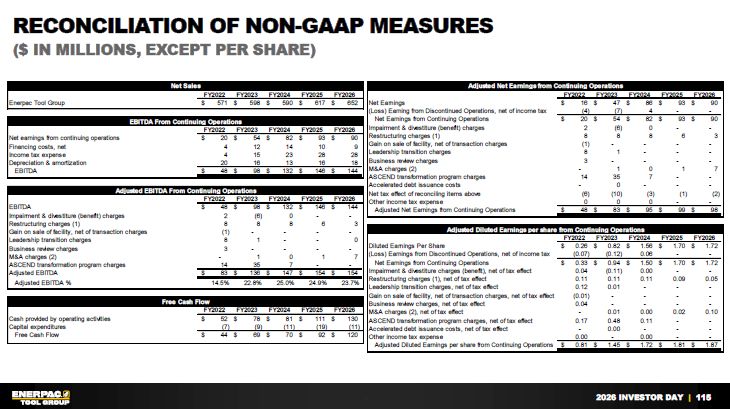
115 Reconciliation of non-GAAP measures ($ IN MILLIONS, EXCEPT PER SHARE)
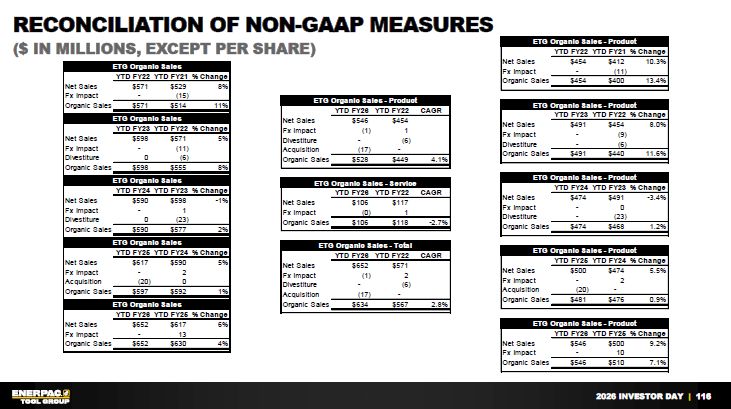
116 Reconciliation of non-GAAP measures ($ IN MILLIONS, EXCEPT PER SHARE)
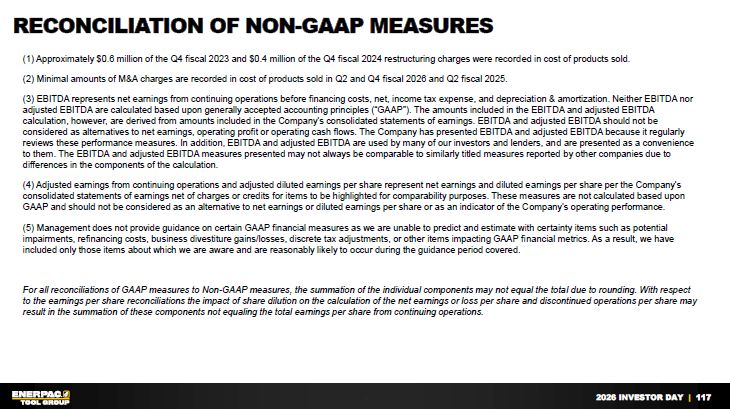
117 Reconciliation of non-GAAP measures (1) Approximately $0.6 million of the
Q4 fiscal 2023 and $0.4 million of the Q4 fiscal 2024 restructuring charges were recorded in cost of products sold. (2) Minimal amounts of M&A charges are recorded in cost of products sold in Q2 and Q4 fiscal 2026 and Q2 fiscal
2025. (3) EBITDA represents net earnings from continuing operations before financing costs, net, income tax expense, and depreciation & amortization. Neither EBITDA nor adjusted EBITDA are calculated based upon generally accepted
accounting principles (“GAAP”). The amounts included in the EBITDA and adjusted EBITDA calculation, however, are derived from amounts included in the Company’s consolidated statements of earnings. EBITDA and adjusted EBITDA should not be
considered as alternatives to net earnings, operating profit or operating cash flows. The Company has presented EBITDA and adjusted EBITDA because it regularly reviews these performance measures. In addition, EBITDA and adjusted EBITDA are
used by many of our investors and lenders, and are presented as a convenience to them. The EBITDA and adjusted EBITDA measures presented may not always be comparable to similarly titled measures reported by other companies due to differences
in the components of the calculation. (4) Adjusted earnings from continuing operations and adjusted diluted earnings per share represent net earnings and diluted earnings per share per the Company’s consolidated statements of earnings net of
charges or credits for items to be highlighted for comparability purposes. These measures are not calculated based upon GAAP and should not be considered as an alternative to net earnings or diluted earnings per share or as an indicator of
the Company’s operating performance. (5) Management does not provide guidance on certain GAAP financial measures as we are unable to predict and estimate with certainty items such as potential impairments, refinancing costs, business
divestiture gains/losses, discrete tax adjustments, or other items impacting GAAP financial metrics. As a result, we have included only those items about which we are aware and are reasonably likely to occur during the guidance period
covered. For all reconciliations of GAAP measures to Non-GAAP measures, the summation of the individual components may not equal the total due to rounding. With respect to the earnings per share reconciliations the impact of share dilution
on the calculation of the net earnings or loss per share and discontinued operations per share may result in the summation of these components not equaling the total earnings per share from continuing operations.

appendix 118 SPEAKER Biography
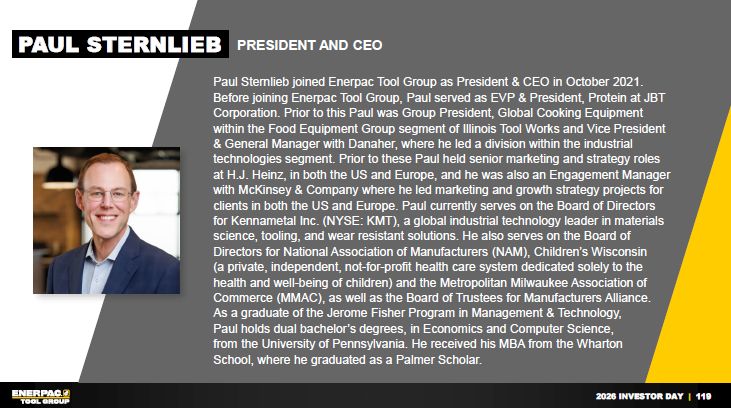
119 Paul Sternlieb joined Enerpac Tool Group as President & CEO in October
2021. Before joining Enerpac Tool Group, Paul served as EVP & President, Protein at JBT Corporation. Prior to this Paul was Group President, Global Cooking Equipment within the Food Equipment Group segment of Illinois Tool Works and Vice
President & General Manager with Danaher, where he led a division within the industrial technologies segment. Prior to these Paul held senior marketing and strategy roles at H.J. Heinz, in both the US and Europe, and he was also an
Engagement Manager with McKinsey & Company where he led marketing and growth strategy projects for clients in both the US and Europe. Paul currently serves on the Board of Directors for Kennametal Inc. (NYSE: KMT), a global industrial
technology leader in materials science, tooling, and wear resistant solutions. He also serves on the Board of Directors for National Association of Manufacturers (NAM), Children’s Wisconsin (a private, independent, not-for-profit health care
system dedicated solely to the health and well-being of children) and the Metropolitan Milwaukee Association of Commerce (MMAC), as well as the Board of Trustees for Manufacturers Alliance. As a graduate of the Jerome Fisher Program in
Management & Technology, Paul holds dual bachelor’s degrees, in Economics and Computer Science, from the University of Pennsylvania. He received his MBA from the Wharton School, where he graduated as a Palmer Scholar. PAUL
STERNLIEB PRESIDENT AND CEO
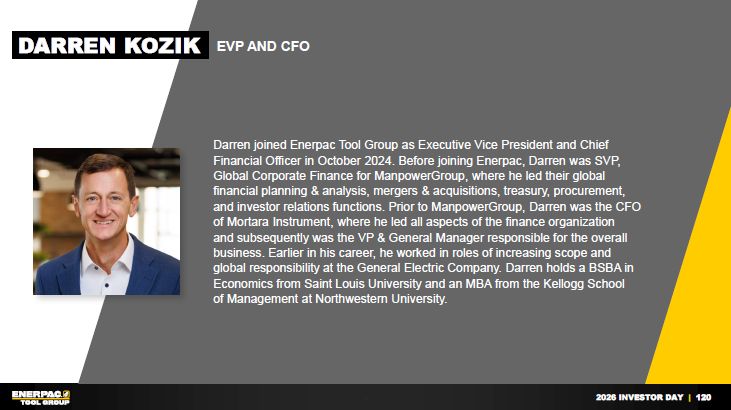
120 Darren joined Enerpac Tool Group as Executive Vice President and Chief
Financial Officer in October 2024. Before joining Enerpac, Darren was SVP, Global Corporate Finance for ManpowerGroup, where he led their global financial planning & analysis, mergers & acquisitions, treasury, procurement, and
investor relations functions. Prior to ManpowerGroup, Darren was the CFO of Mortara Instrument, where he led all aspects of the finance organization and subsequently was the VP & General Manager responsible for the overall business.
Earlier in his career, he worked in roles of increasing scope and global responsibility at the General Electric Company. Darren holds a BSBA in Economics from Saint Louis University and an MBA from the Kellogg School of Management at
Northwestern University. DARREN KOZIK EVP AND CFO
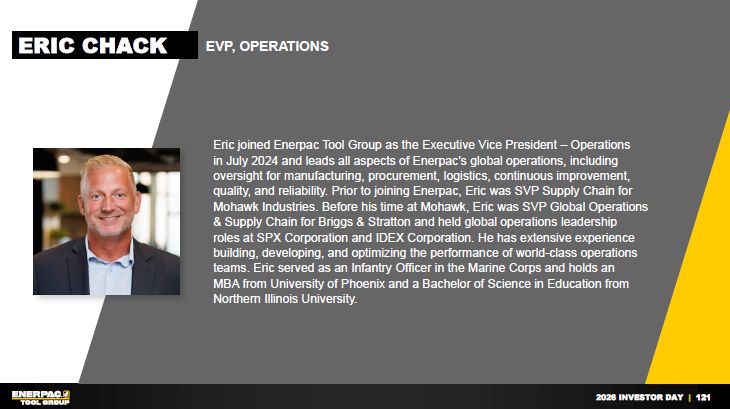
121 Eric joined Enerpac Tool Group as the Executive Vice President – Operations
in July 2024 and leads all aspects of Enerpac’s global operations, including oversight for manufacturing, procurement, logistics, continuous improvement, quality, and reliability. Prior to joining Enerpac, Eric was SVP Supply Chain for Mohawk
Industries. Before his time at Mohawk, Eric was SVP Global Operations & Supply Chain for Briggs & Stratton and held global operations leadership roles at SPX Corporation and IDEX Corporation. He has extensive experience building,
developing, and optimizing the performance of world-class operations teams. Eric served as an Infantry Officer in the Marine Corps and holds an MBA from University of Phoenix and a Bachelor of Science in Education from Northern Illinois
University. ERIC CHACK EVP, OPERATIONS
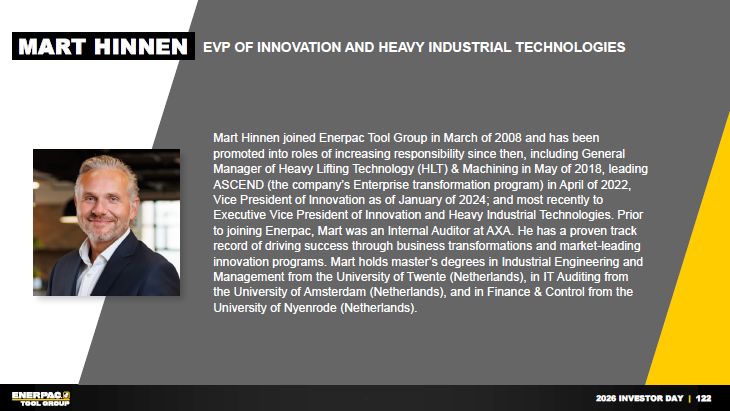
122 Mart Hinnen joined Enerpac Tool Group in March of 2008 and has been
promoted into roles of increasing responsibility since then, including General Manager of Heavy Lifting Technology (HLT) & Machining in May of 2018, leading ASCEND (the company’s Enterprise transformation program) in April of 2022, Vice
President of Innovation as of January of 2024; and most recently to Executive Vice President of Innovation and Heavy Industrial Technologies. Prior to joining Enerpac, Mart was an Internal Auditor at AXA. He has a proven track record of
driving success through business transformations and market-leading innovation programs. Mart holds master’s degrees in Industrial Engineering and Management from the University of Twente (Netherlands), in IT Auditing from the University of
Amsterdam (Netherlands), and in Finance & Control from the University of Nyenrode (Netherlands). EVP OF INNOVATION AND HEAVY INDUSTRIAL TECHNOLOGIES MART HINNEN
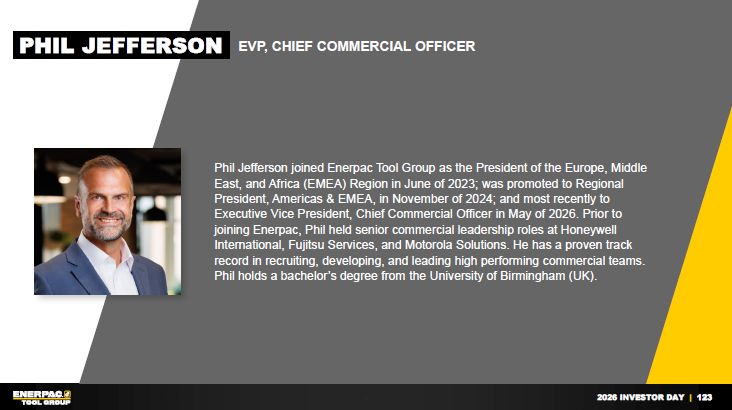
123 Phil Jefferson joined Enerpac Tool Group as the President of the Europe,
Middle East, and Africa (EMEA) Region in June of 2023; was promoted to Regional President, Americas & EMEA, in November of 2024; and most recently to Executive Vice President, Chief Commercial Officer in May of 2026. Prior to joining
Enerpac, Phil held senior commercial leadership roles at Honeywell International, Fujitsu Services, and Motorola Solutions. He has a proven track record in recruiting, developing, and leading high performing commercial teams. Phil holds a
bachelor’s degree from the University of Birmingham (UK). PHIL JEFFERSON EVP, CHIEF COMMERCIAL OFFICER
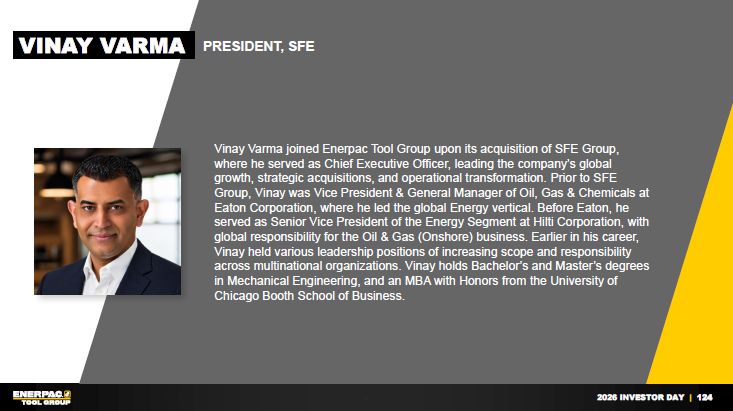
124 Vinay Varma joined Enerpac Tool Group upon its acquisition of SFE Group,
where he served as Chief Executive Officer, leading the company’s global growth, strategic acquisitions, and operational transformation. Prior to SFE Group, Vinay was Vice President & General Manager of Oil, Gas & Chemicals at Eaton
Corporation, where he led the global Energy vertical. Before Eaton, he served as Senior Vice President of the Energy Segment at Hilti Corporation, with global responsibility for the Oil & Gas (Onshore) business. Earlier in his career,
Vinay held various leadership positions of increasing scope and responsibility across multinational organizations. Vinay holds Bachelor’s and Master’s degrees in Mechanical Engineering, and an MBA with Honors from the University of Chicago
Booth School of Business. VINAY VARMA PRESIDENT, SFE