Associated Banc-Corp Third Quarter 2026 Investor Presentation September 14, 2026
Important Disclosures 2 Forward-looking statements: Statements made in this document which are not purely historical are forward-looking statements, as defined in the Private Securities Litigation Reform Act of 1995. This includes any statements regarding management’s plans, objectives, or goals for future operations, products or services, and forecasts of its revenues, earnings, or other measures of performance. Such forward-looking statements may be identified by the use of words such as “believe,” “expect,” “anticipate,” “plan,” “estimate,” “should," “intend,” "target," “outlook,” "project," "guidance," "forecast," or similar expressions. Forward-looking statements are based on current management expectations and, by their nature, are subject to risks and uncertainties. Actual results may differ materially from those contained in the forward- looking statements. Factors which may cause actual results to differ materially from those contained in such forward-looking statements include the ability to integrate the American National Bank (“ANB”) business successfully and in a timely manner; the possibility that the anticipated benefits of the ANB transaction are not realized when expected or at all; the possibility that the ANB transaction may be more expensive to integrate than anticipated; and such other risk factors as identified in the Company’s most recent Form 10-K and subsequent Form 10-Qs and other SEC filings, and such factors are incorporated herein by reference. Trademarks: All trademarks, service marks, and trade names referenced in this material are official trademarks and the property of their respective owners. Presentation: Within the charts and tables presented, certain segments, columns and rows may not sum to totals shown due to rounding. Non-GAAP measures: This presentation includes certain non-GAAP financial measures. These financial measures have been included as they provide meaningful supplemental information to assess trends in the Corporation’s results of operations. These non-GAAP measures are provided in addition to, and not as substitutes for, measures of our financial performance determined in accordance with GAAP. Our calculation of these non-GAAP measures may not be comparable to similarly titled measures of other companies due to potential differences between companies in the method of calculation. As a result, the use of these non-GAAP measures has limitations and should not be considered superior to, in isolation from, or as a substitute for, related GAAP measures. Unless otherwise noted, reconciliations of these non-GAAP financial measures to the most directly comparable GAAP financial measures can be found at the end of this presentation.
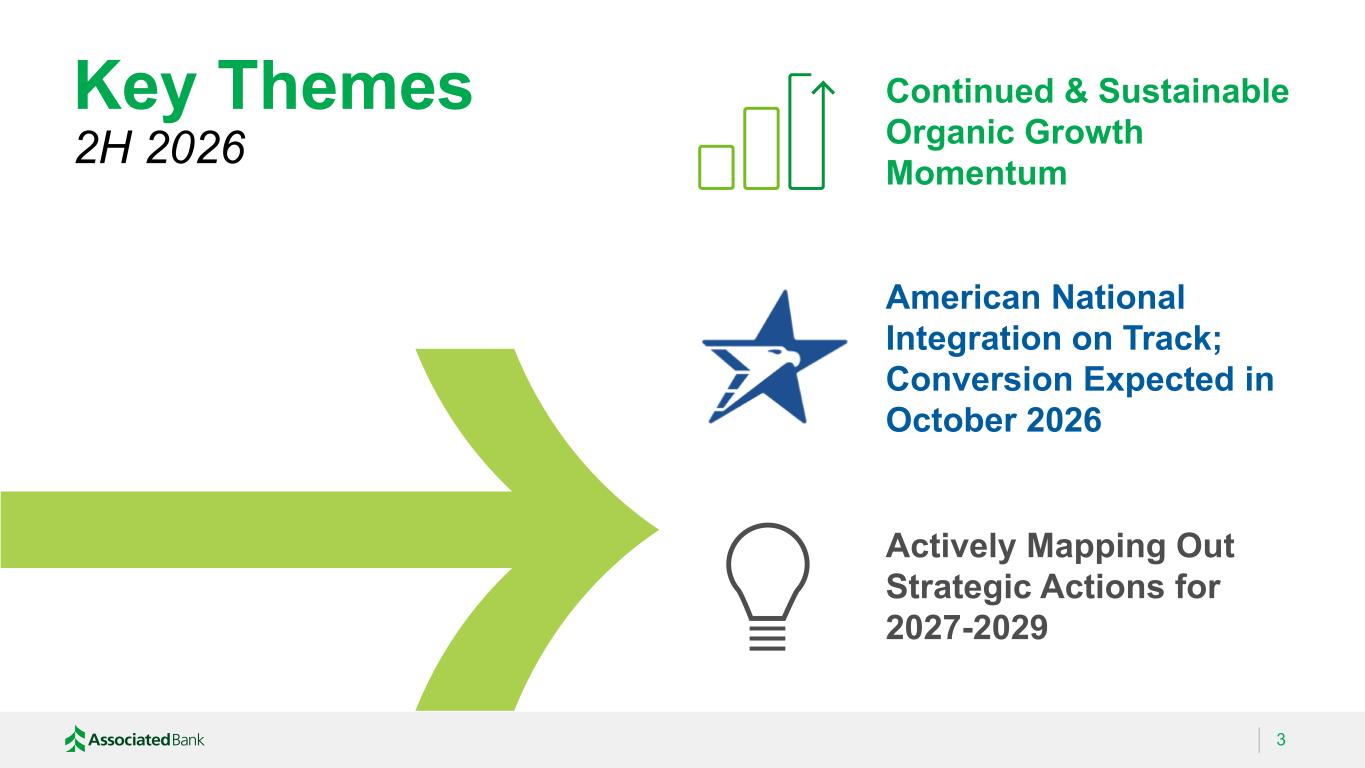
3 Key Themes 2H 2026 Continued & Sustainable Organic Growth Momentum American National Integration on Track; Conversion Expected in October 2026 Actively Mapping Out Strategic Actions for 2027-2029
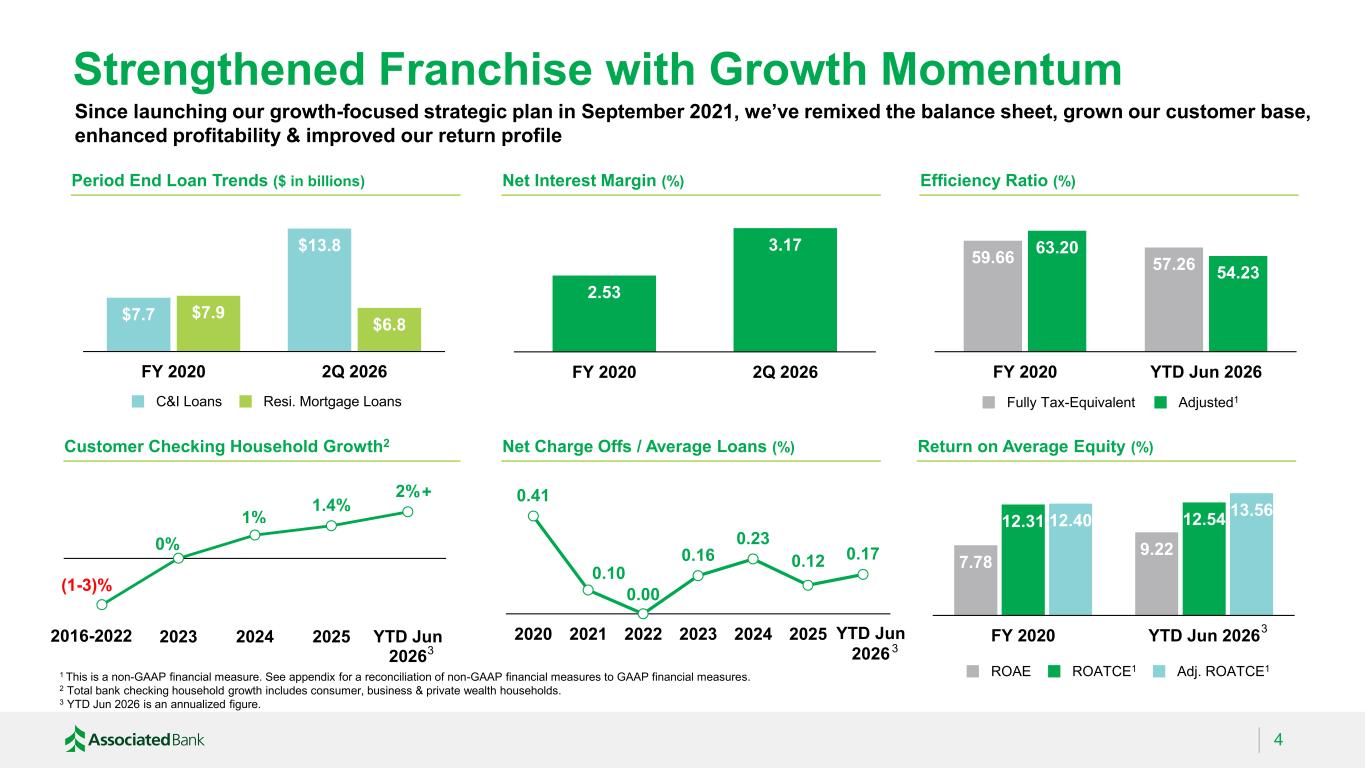
Strengthened Franchise with Growth Momentum 4 $7.7 $13.8 $7.9 $6.8 FY 2020 2Q 2026 Period End Loan Trends ($ in billions) Customer Checking Household Growth2 Net Interest Margin (%) 2.53 3.17 FY 2020 2Q 2026 Net Charge Offs / Average Loans (%) 0.41 0.10 0.00 0.16 0.23 0.12 0.17 2020 2021 2022 2023 2024 2025 2026 YTD Efficiency Ratio (%) Return on Average Equity (%) 7.78 9.22 12.31 12.5412.40 13.56 FY 2020 YTD Jun 2026 ROATCE1ROAE 59.66 57.26 63.20 54.23 FY 2020 YTD Jun 2026 Adjusted1Fully Tax-Equivalent 1 This is a non-GAAP financial measure. See appendix for a reconciliation of non-GAAP financial measures to GAAP financial measures. 2 Total bank checking household growth includes consumer, business & private wealth households. 3 YTD Jun 2026 is an annualized figure. Since launching our growth-focused strategic plan in September 2021, we’ve remixed the balance sheet, grown our customer base, enhanced profitability & improved our return profile Resi. Mortgage LoansC&I Loans (1-3)% 0% 1% 1.4% 2% 2023 2024 2025 YTD Jun 2026 2016-2022 + Adj. ROATCE1 3YTD Jun 2026 33
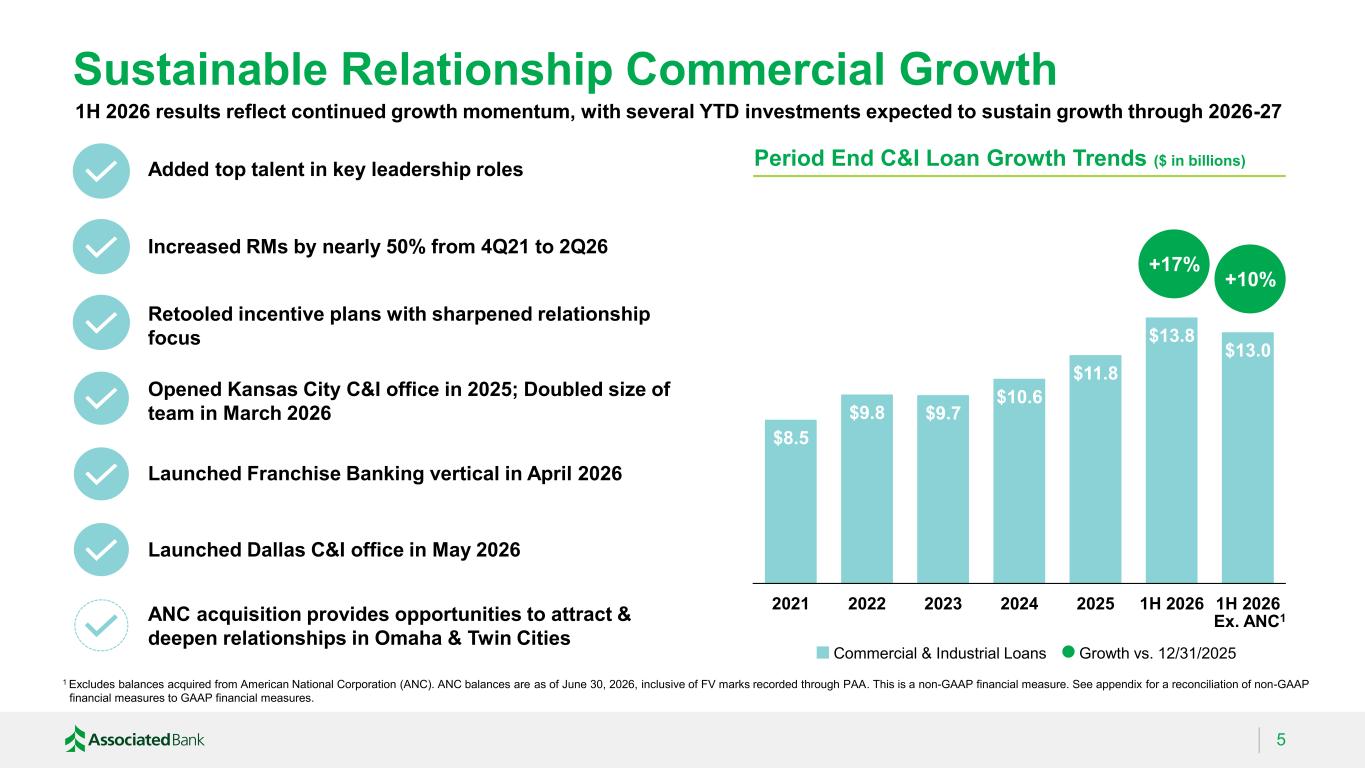
$8.5 $9.8 $9.7 $10.6 $11.8 $13.8 $13.0 2021 2022 2023 2024 2025 1H 2026 1H 2026 5 Period End C&I Loan Growth Trends ($ in billions) Launched Dallas C&I office in May 2026 Added top talent in key leadership roles Increased RMs by nearly 50% from 4Q21 to 2Q26 Sustainable Relationship Commercial Growth 1H 2026 results reflect continued growth momentum, with several YTD investments expected to sustain growth through 2026-27 Opened Kansas City C&I office in 2025; Doubled size of team in March 2026 Ex. ANC1 +17% Growth vs. 12/31/2025Commercial & Industrial Loans Launched Franchise Banking vertical in April 2026 Retooled incentive plans with sharpened relationship focus 1 Excludes balances acquired from American National Corporation (ANC). ANC balances are as of June 30, 2026, inclusive of FV marks recorded through PAA. This is a non-GAAP financial measure. See appendix for a reconciliation of non-GAAP financial measures to GAAP financial measures. +10% ANC acquisition provides opportunities to attract & deepen relationships in Omaha & Twin Cities
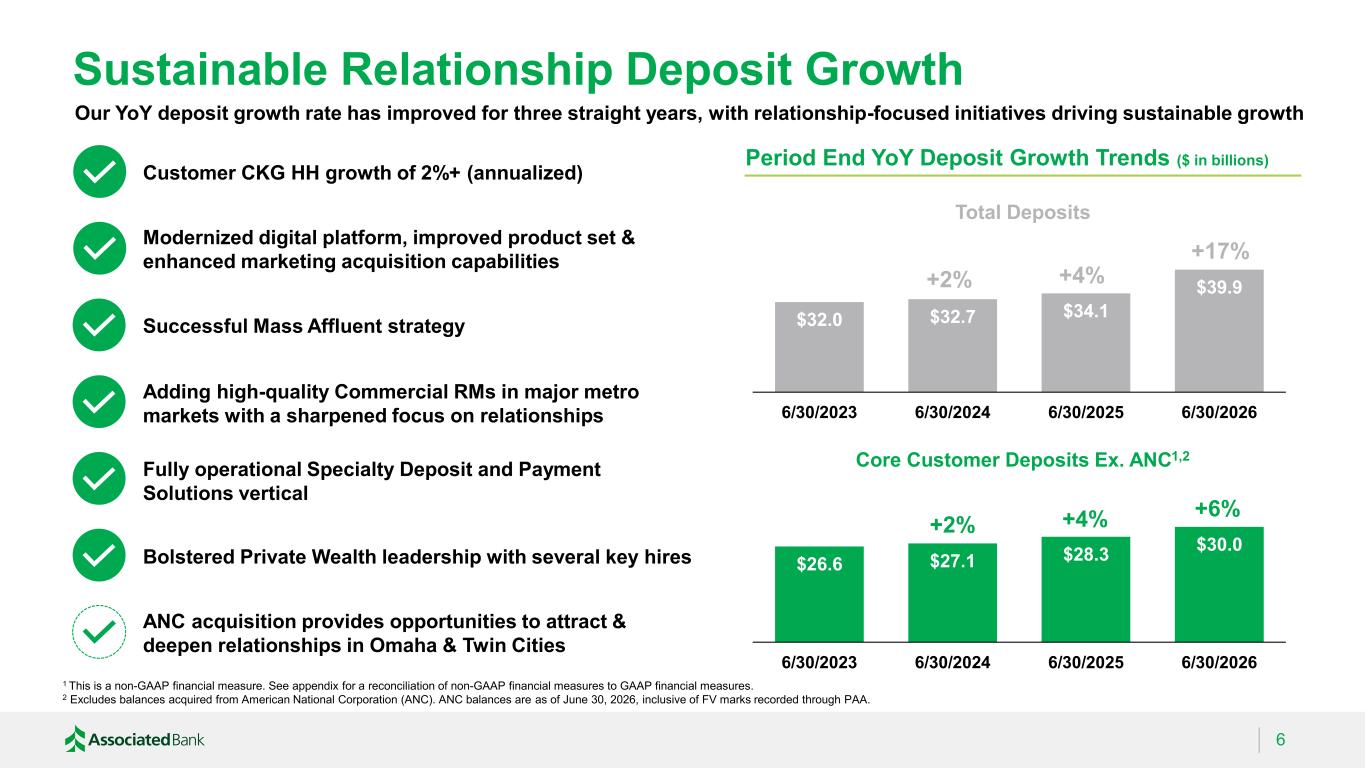
$26.6 $27.1 $28.3 $30.0 6/30/2023 6/30/2024 6/30/2025 6/30/2026 $32.0 $32.7 $34.1 $39.9 6/30/2023 6/30/2024 6/30/2025 6/30/2026 Sustainable Relationship Deposit Growth 6 1 This is a non-GAAP financial measure. See appendix for a reconciliation of non-GAAP financial measures to GAAP financial measures. 2 Excludes balances acquired from American National Corporation (ANC). ANC balances are as of June 30, 2026, inclusive of FV marks recorded through PAA. Our YoY deposit growth rate has improved for three straight years, with relationship-focused initiatives driving sustainable growth Period End YoY Deposit Growth Trends ($ in billions) Customer CKG HH growth of 2%+ (annualized) Adding high-quality Commercial RMs in major metro markets with a sharpened focus on relationships Fully operational Specialty Deposit and Payment Solutions vertical ANC acquisition provides opportunities to attract & deepen relationships in Omaha & Twin Cities Modernized digital platform, improved product set & enhanced marketing acquisition capabilities Successful Mass Affluent strategy +2% +17% +2% +4% +6% Total Deposits Core Customer Deposits Ex. ANC1,2 +4% Bolstered Private Wealth leadership with several key hires
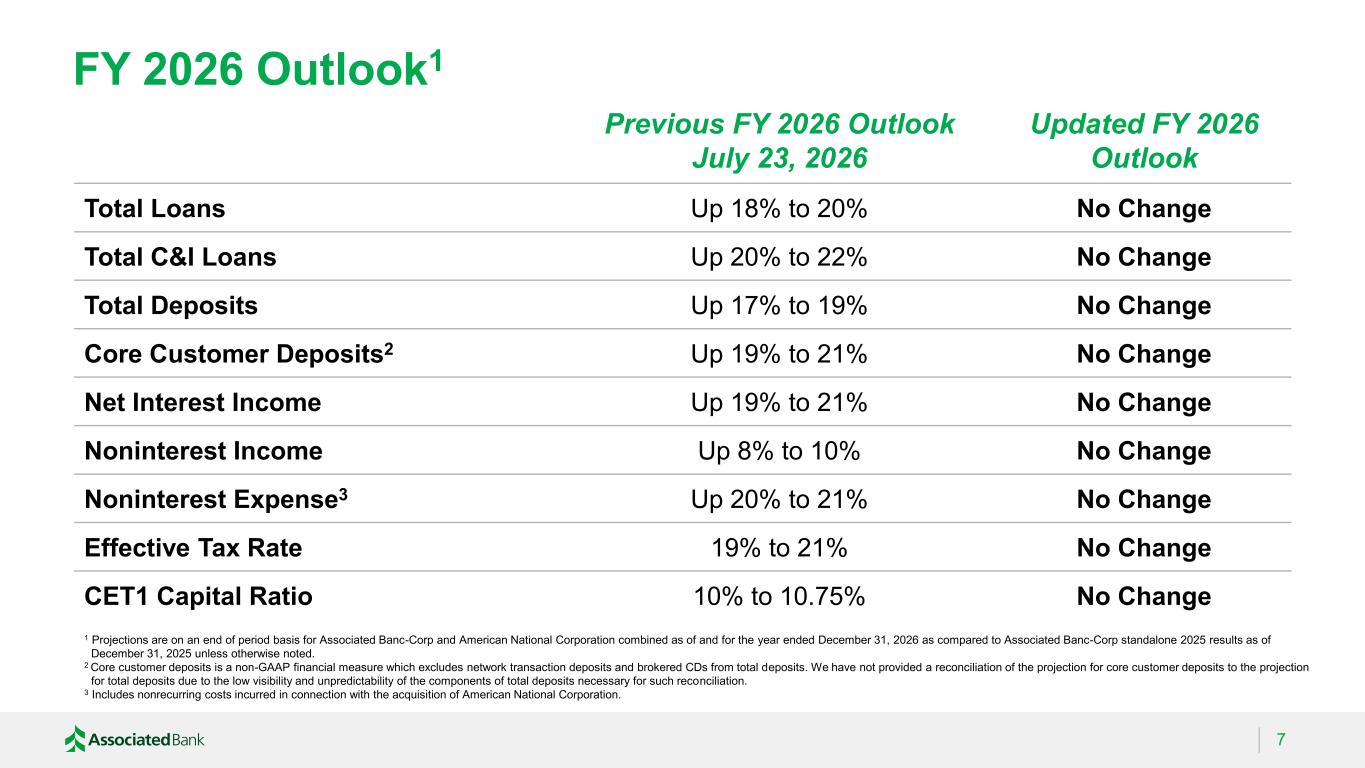
FY 2026 Outlook1 7 Previous FY 2026 Outlook July 23, 2026 Updated FY 2026 Outlook Total Loans Up 18% to 20% No Change Total C&I Loans Up 20% to 22% No Change Total Deposits Up 17% to 19% No Change Core Customer Deposits2 Up 19% to 21% No Change Net Interest Income Up 19% to 21% No Change Noninterest Income Up 8% to 10% No Change Noninterest Expense3 Up 20% to 21% No Change Effective Tax Rate 19% to 21% No Change CET1 Capital Ratio 10% to 10.75% No Change 1 Projections are on an end of period basis for Associated Banc-Corp and American National Corporation combined as of and for the year ended December 31, 2026 as compared to Associated Banc-Corp standalone 2025 results as of December 31, 2025 unless otherwise noted. 2 Core customer deposits is a non-GAAP financial measure which excludes network transaction deposits and brokered CDs from total deposits. We have not provided a reconciliation of the projection for core customer deposits to the projection for total deposits due to the low visibility and unpredictability of the components of total deposits necessary for such reconciliation. 3 Includes nonrecurring costs incurred in connection with the acquisition of American National Corporation.
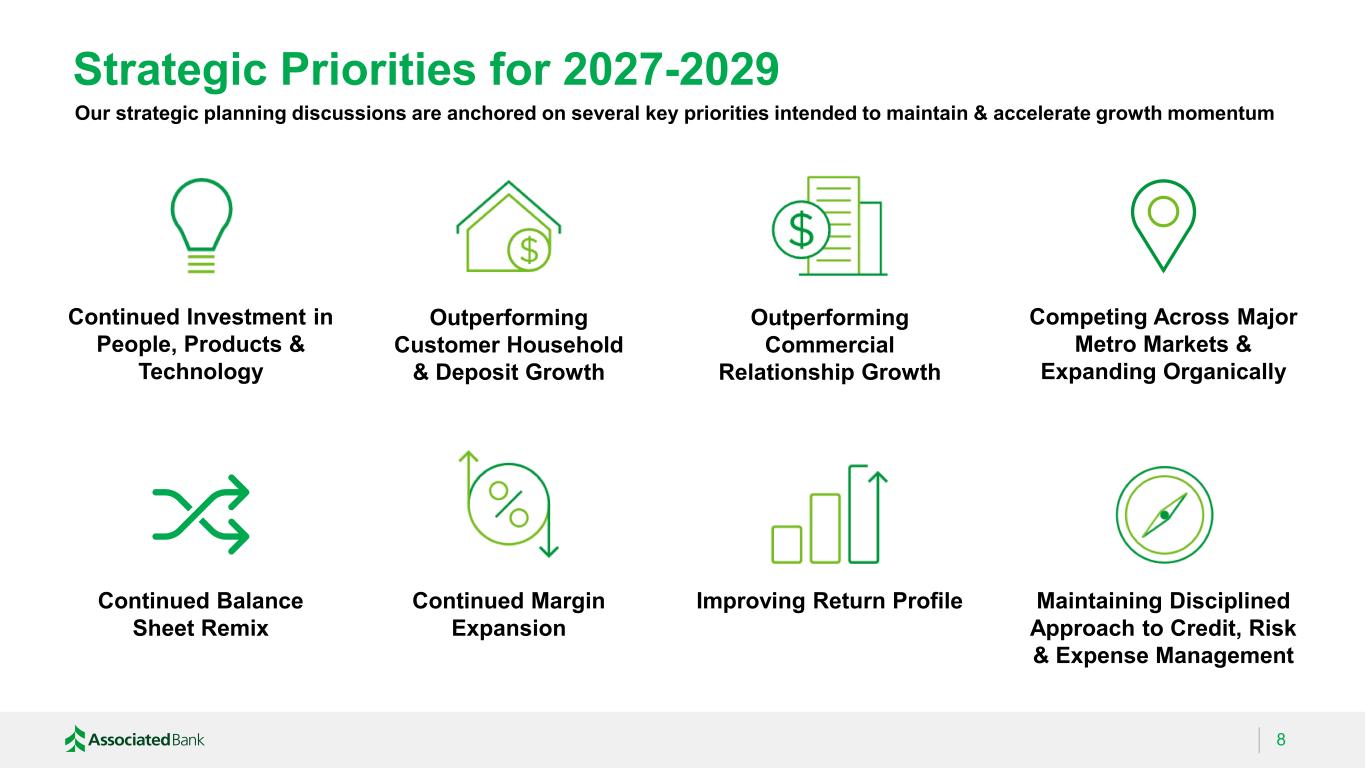
Strategic Priorities for 2027-2029 8 Our strategic planning discussions are anchored on several key priorities intended to maintain & accelerate growth momentum Outperforming Customer Household & Deposit Growth Continued Balance Sheet Remix Outperforming Commercial Relationship Growth Continued Margin Expansion Improving Return Profile Competing Across Major Metro Markets & Expanding Organically Maintaining Disciplined Approach to Credit, Risk & Expense Management Continued Investment in People, Products & Technology

Appendix Minneapolis, MN
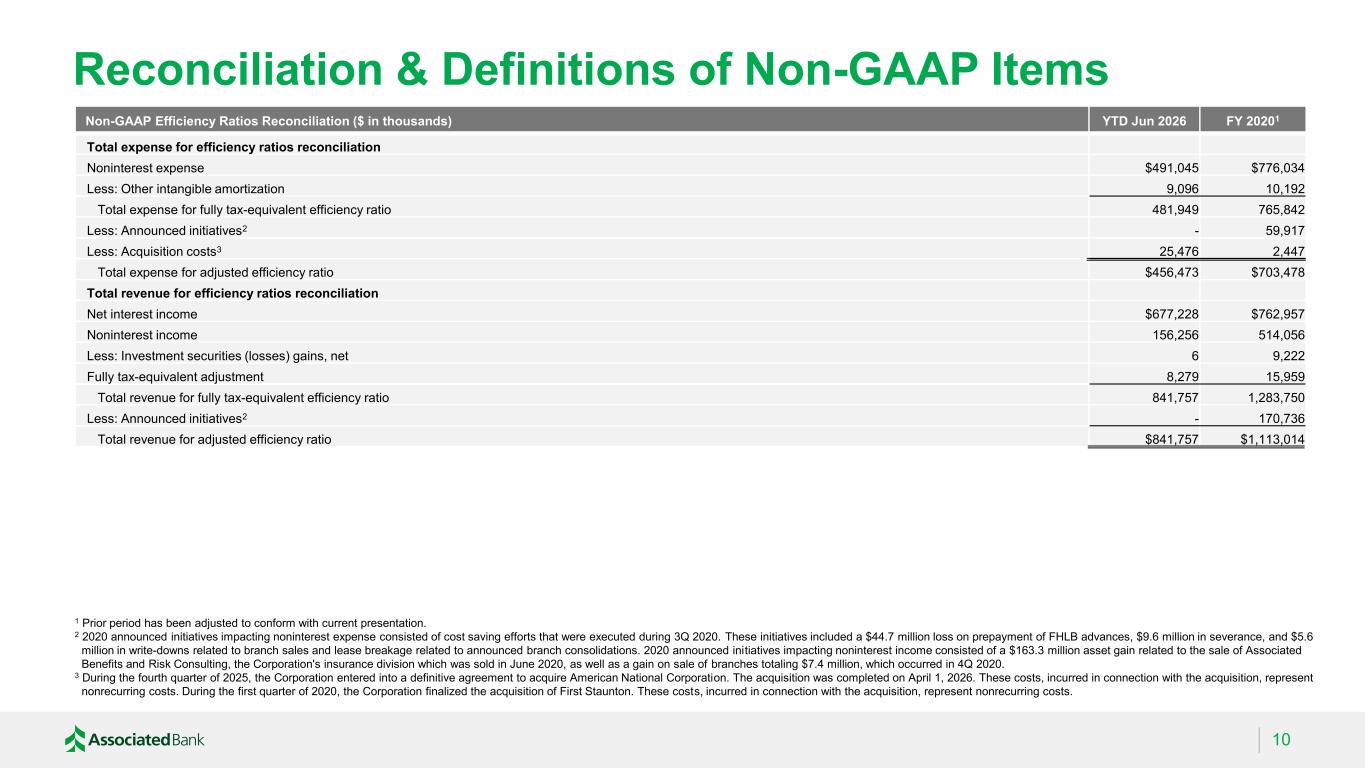
Reconciliation & Definitions of Non-GAAP Items 10 Non-GAAP Efficiency Ratios Reconciliation ($ in thousands) YTD Jun 2026 FY 20201 Total expense for efficiency ratios reconciliation Noninterest expense $491,045 $776,034 Less: Other intangible amortization 9,096 10,192 Total expense for fully tax-equivalent efficiency ratio 481,949 765,842 Less: Announced initiatives2 - 59,917 Less: Acquisition costs3 25,476 2,447 Total expense for adjusted efficiency ratio $456,473 $703,478 Total revenue for efficiency ratios reconciliation Net interest income $677,228 $762,957 Noninterest income 156,256 514,056 Less: Investment securities (losses) gains, net 6 9,222 Fully tax-equivalent adjustment 8,279 15,959 Total revenue for fully tax-equivalent efficiency ratio 841,757 1,283,750 Less: Announced initiatives2 - 170,736 Total revenue for adjusted efficiency ratio $841,757 $1,113,014 1 Prior period has been adjusted to conform with current presentation. 2 2020 announced initiatives impacting noninterest expense consisted of cost saving efforts that were executed during 3Q 2020. These initiatives included a $44.7 million loss on prepayment of FHLB advances, $9.6 million in severance, and $5.6 million in write-downs related to branch sales and lease breakage related to announced branch consolidations. 2020 announced initiatives impacting noninterest income consisted of a $163.3 million asset gain related to the sale of Associated Benefits and Risk Consulting, the Corporation's insurance division which was sold in June 2020, as well as a gain on sale of branches totaling $7.4 million, which occurred in 4Q 2020. 3 During the fourth quarter of 2025, the Corporation entered into a definitive agreement to acquire American National Corporation. The acquisition was completed on April 1, 2026. These costs, incurred in connection with the acquisition, represent nonrecurring costs. During the first quarter of 2020, the Corporation finalized the acquisition of First Staunton. These costs, incurred in connection with the acquisition, represent nonrecurring costs.
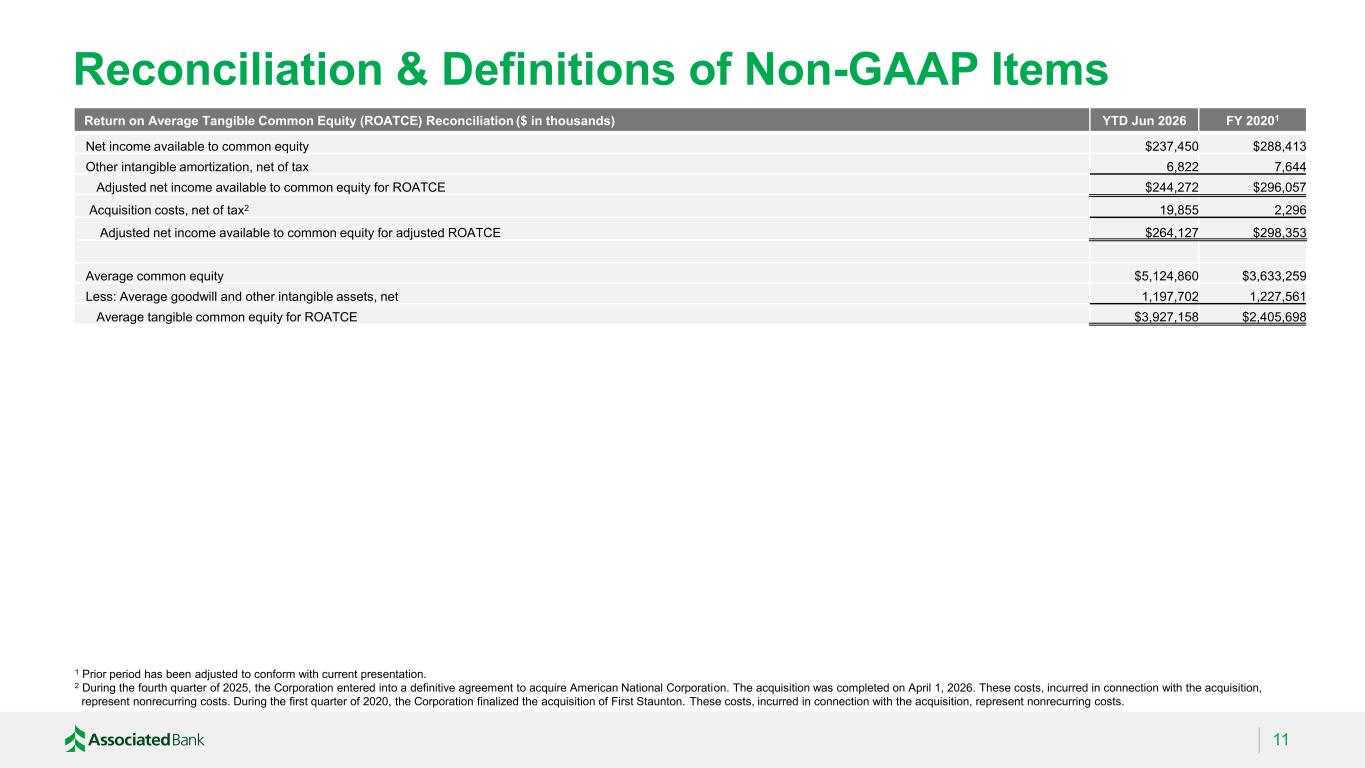
Reconciliation & Definitions of Non-GAAP Items 11 Update 1 Prior period has been adjusted to conform with current presentation. 2 During the fourth quarter of 2025, the Corporation entered into a definitive agreement to acquire American National Corporation. The acquisition was completed on April 1, 2026. These costs, incurred in connection with the acquisition, represent nonrecurring costs. During the first quarter of 2020, the Corporation finalized the acquisition of First Staunton. These costs, incurred in connection with the acquisition, represent nonrecurring costs. Return on Average Tangible Common Equity (ROATCE) Reconciliation ($ in thousands) YTD Jun 2026 FY 20201 Net income available to common equity $237,450 $288,413 Other intangible amortization, net of tax 6,822 7,644 Adjusted net income available to common equity for ROATCE $244,272 $296,057 Acquisition costs, net of tax2 19,855 2,296 Adjusted net income available to common equity for adjusted ROATCE $264,127 $298,353 Average common equity $5,124,860 $3,633,259 Less: Average goodwill and other intangible assets, net 1,197,702 1,227,561 Average tangible common equity for ROATCE $3,927,158 $2,405,698
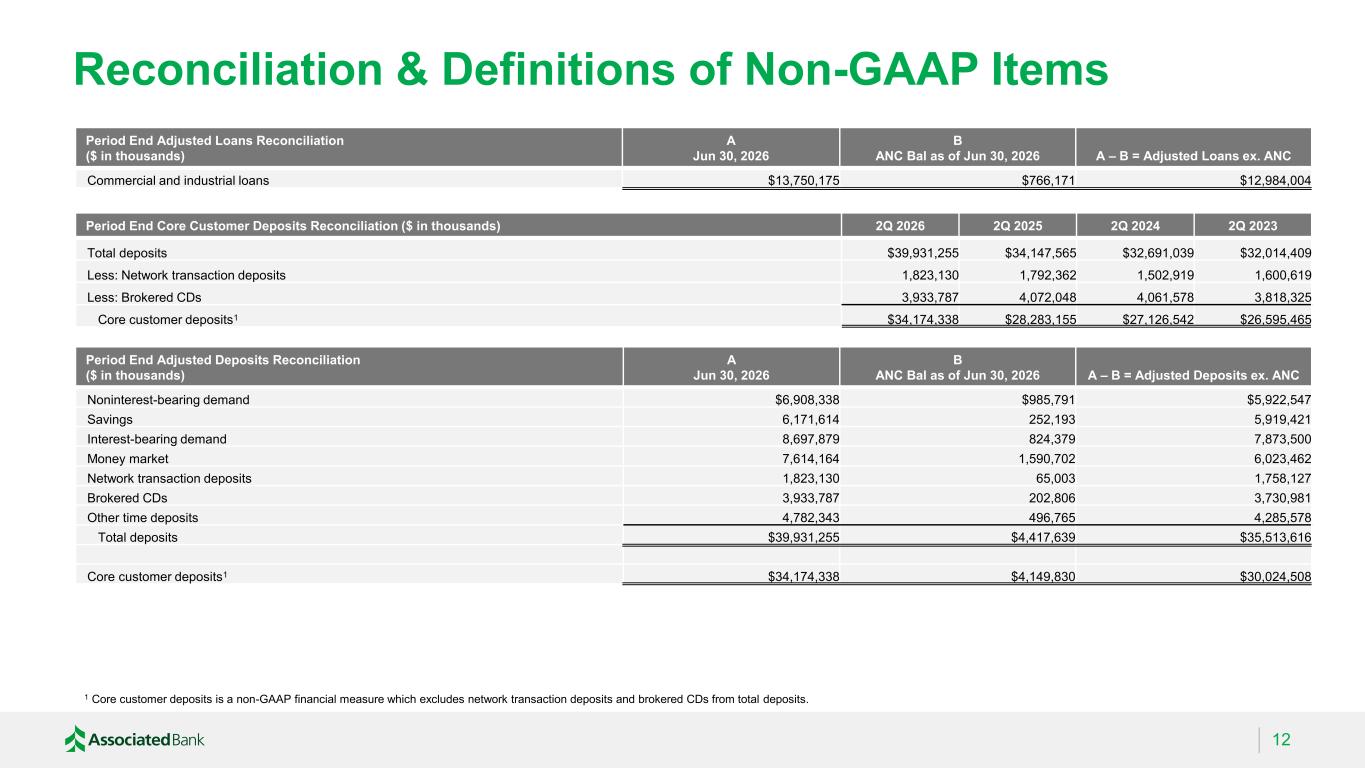
Reconciliation & Definitions of Non-GAAP Items 12 Period End Adjusted Loans Reconciliation ($ in thousands) A Jun 30, 2026 B ANC Bal as of Jun 30, 2026 A – B = Adjusted Loans ex. ANC Commercial and industrial loans $13,750,175 $766,171 $12,984,004 Period End Adjusted Deposits Reconciliation ($ in thousands) A Jun 30, 2026 B ANC Bal as of Jun 30, 2026 A – B = Adjusted Deposits ex. ANC Noninterest-bearing demand $6,908,338 $985,791 $5,922,547 Savings 6,171,614 252,193 5,919,421 Interest-bearing demand 8,697,879 824,379 7,873,500 Money market 7,614,164 1,590,702 6,023,462 Network transaction deposits 1,823,130 65,003 1,758,127 Brokered CDs 3,933,787 202,806 3,730,981 Other time deposits 4,782,343 496,765 4,285,578 Total deposits $39,931,255 $4,417,639 $35,513,616 Core customer deposits1 $34,174,338 $4,149,830 $30,024,508 1 Core customer deposits is a non-GAAP financial measure which excludes network transaction deposits and brokered CDs from total deposits. Period End Core Customer Deposits Reconciliation ($ in thousands) 2Q 2026 2Q 2025 2Q 2024 2Q 2023 Total deposits $39,931,255 $34,147,565 $32,691,039 $32,014,409 Less: Network transaction deposits 1,823,130 1,792,362 1,502,919 1,600,619 Less: Brokered CDs 3,933,787 4,072,048 4,061,578 3,818,325 Core customer deposits1 $34,174,338 $28,283,155 $27,126,542 $26,595,465