Management’s Discussion and Analysis
OVERVIEW OF PERFORMANCE
Financial Results: 2025 vs 2024
Net income was $7,758 million compared to $7,892 million, a decrease of 2%. The decrease was driven primarily by higher non-interest expenses, income taxes and provision for credit losses, partly offset by higher net interest income and non-interest income. Diluted earnings per share (EPS) were $5.67 in fiscal 2025 compared to $5.87 last year. Return on equity was 9.7% this year compared to 10.2% in fiscal 2024.
Adjusting items impacting net income in the current year were a net charge of $1,752 million after-tax ($1,927 million pre-tax). The net impact of the adjusting items on diluted earnings per share was $1.42 and on Basel III Common Equity Tier 1 (CET1) ratio was negative 20 basis points. In the prior year, adjusting items were a net charge of $735 million after-tax ($877 million pre-tax), with an impact on diluted earnings per share of $0.60 and on Basel III Common Equity Tier 1 (CET1) ratio of negative nine basis points. Refer to Non-GAAP Measures starting on page 20 for further details.
Adjusted net income was $9,510 million compared to $8,627 million, an increase of 10%. The increase was driven primarily by higher net interest income and non-interest income, partly offset by higher non-interest expenses, income taxes and provision for credit losses. Adjusted diluted EPS was $7.09 compared to $6.47, and adjusted return on equity was 11.8% compared to 11.3%.
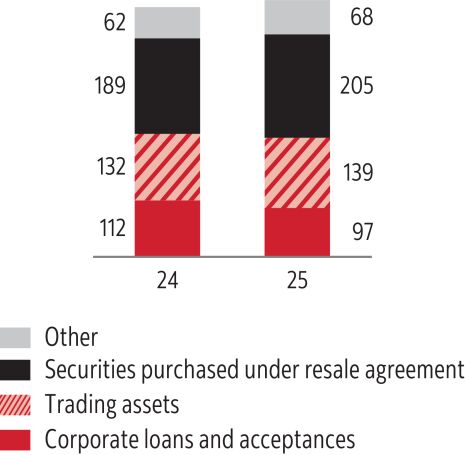
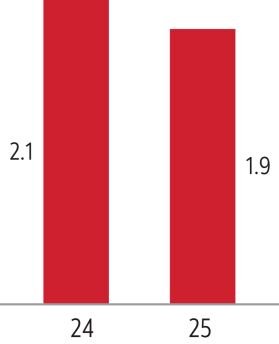
Net interest income was $21,522 million compared to $19,252 million, an increase of $2,270 million or 12% due primarily to a higher net interest margin and loan growth inclusive of the conversion of bankers’ acceptances to loans resulting from the cessation of CDOR in June 2024 (“BA conversion”). Higher net interest income was driven by the Other segment due mainly to lower funding costs, as well as increases in Canadian Banking from asset and deposit growth, Global Banking and Markets driven by higher corporate lending margins and deposit growth, and Global Wealth Management from growth in loans and deposits. The net interest margin was 2.33%, an increase of 17 basis points primarily from significantly lower funding costs driven by central bank rate cuts and higher margins in Global Banking and Markets. This was partly offset by lower deposit margins in Canadian Banking, and increased levels of high quality, lower yielding treasury assets.
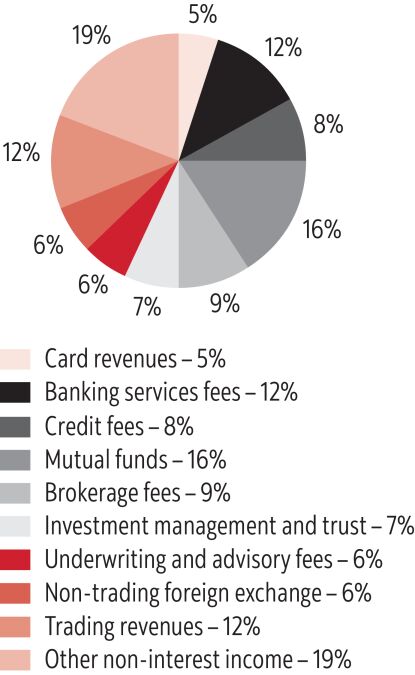
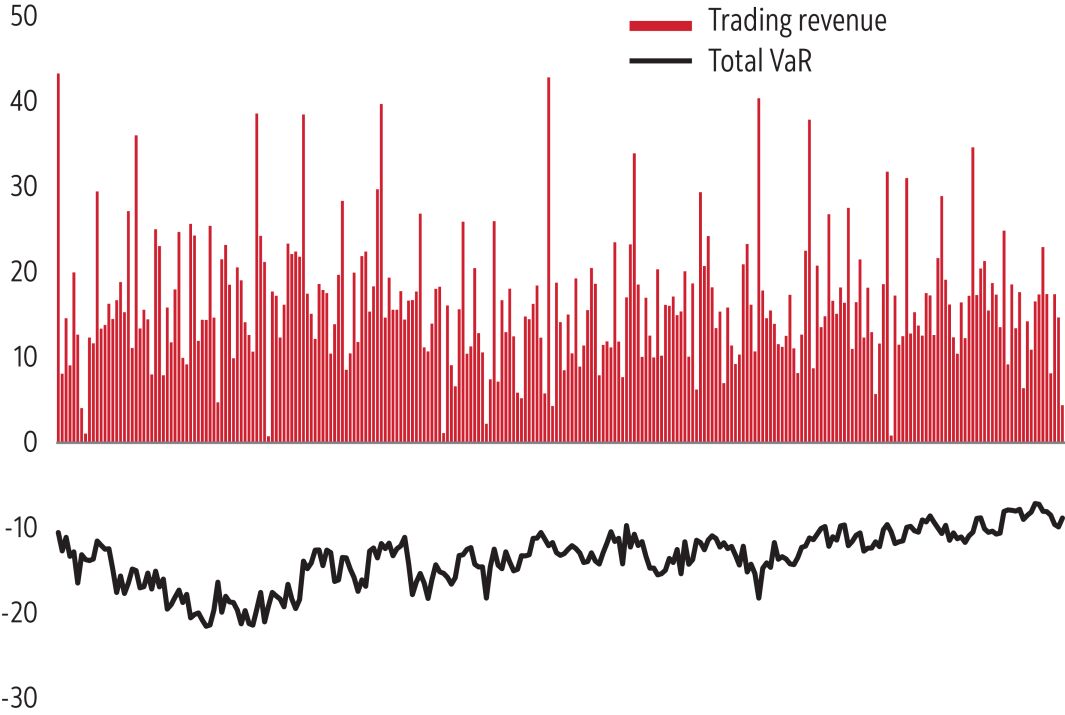
Non-interest income was $16,219 million, an increase of $1,801 million or 12%. Adjusted non-interest income was $16,209 million, an increase of $1,648 million or 11%. The increase was driven mainly by higher wealth management revenue, trading related revenues, underwriting and advisory fees, and net income from associated corporations, partially offset by lower banking revenues.
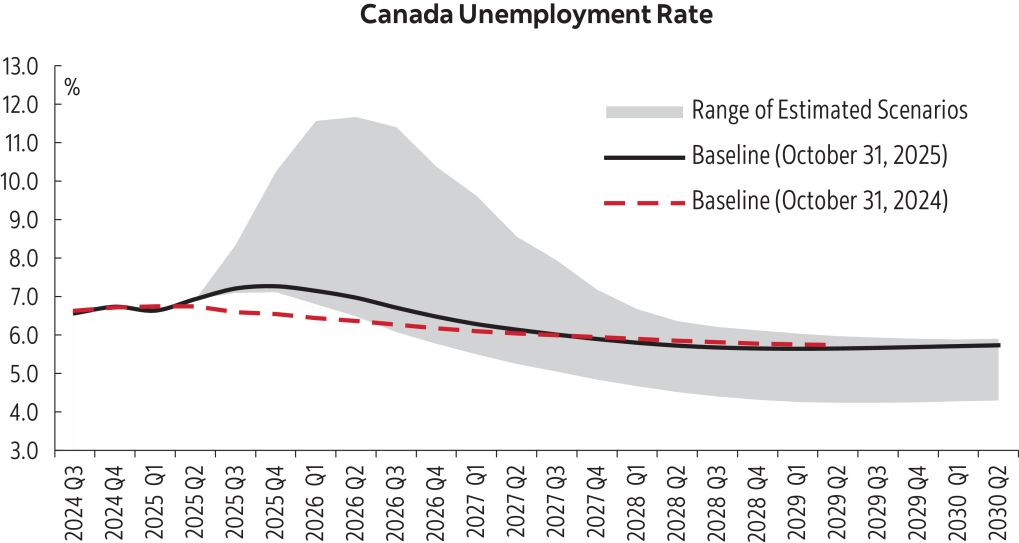
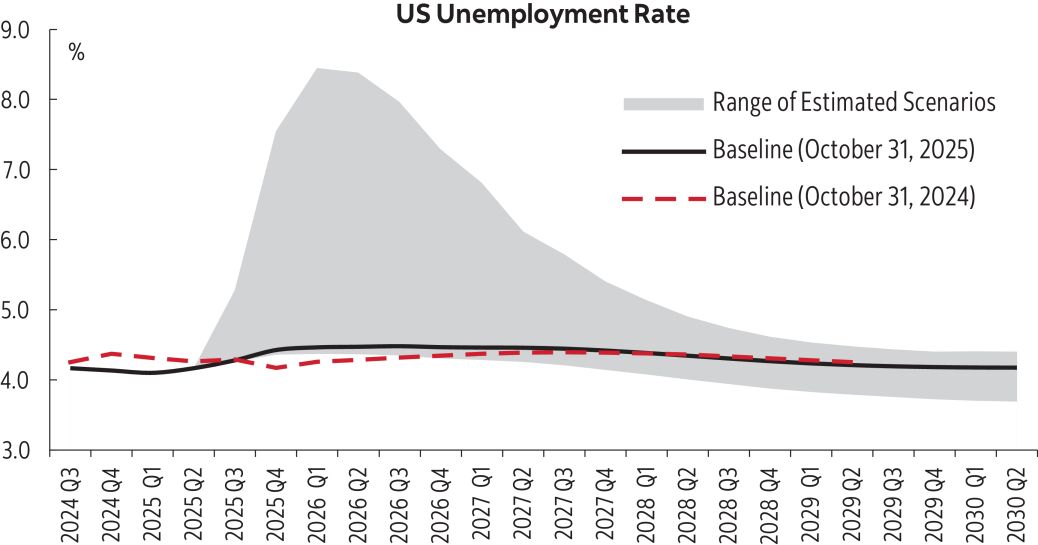
The provision for credit losses was $4,714 million compared to $4,051 million last year, an increase of $663 million due mainly to higher provisions on performing loans. The provision for credit losses ratio increased nine basis points to 62 basis points. The provision for credit losses on performing loans increased by $460 million driven by the impact of credit migration, an unfavourable macroeconomic outlook primarily driven by the U.S. tariffs, and business growth, mainly in the International retail portfolio. The increase in provision for credit losses on impaired loans this year was due primarily to higher formations in Canadian Banking.
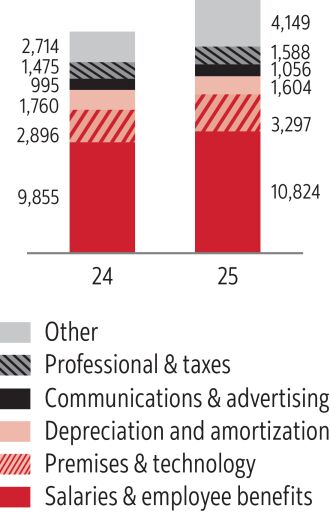
Non-interest expenses were $22,518 million compared to $19,695 million, an increase of $2,823 million or 14%. Adjusted non-interest expenses were $20,581 million compared to $18,961 million, an increase of $1,620 million or 9%. The increase was mainly driven by higher personnel costs, including performance and share-based compensation, inflationary adjustments and annual increases, higher technology and advertising and business development costs to support strategic and regulatory initiatives, as well as the negative impact of foreign currency translation, partly offset by lower depreciation and amortization. Operating leverage was negative 2.2% on a reported basis and positive 3.0% on an adjusted basis.
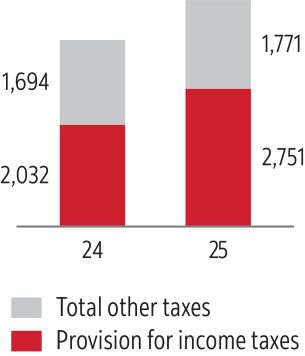
The effective tax rate was 26.2% compared to 20.5% due primarily to the impairment loss related to the announced sale of the banking operations in Colombia, Costa Rica and Panama, lower income in lower tax jurisdictions and the implementation of the Global Minimum Tax (GMT), partially offset by higher non-deductible expenses and the impairment charge on Bank of Xi’an Co in the prior year. On an adjusted basis, the effective tax rate was 23.5% compared to 20.1% primarily due to lower income in lower tax jurisdictions and the implementation of the GMT.
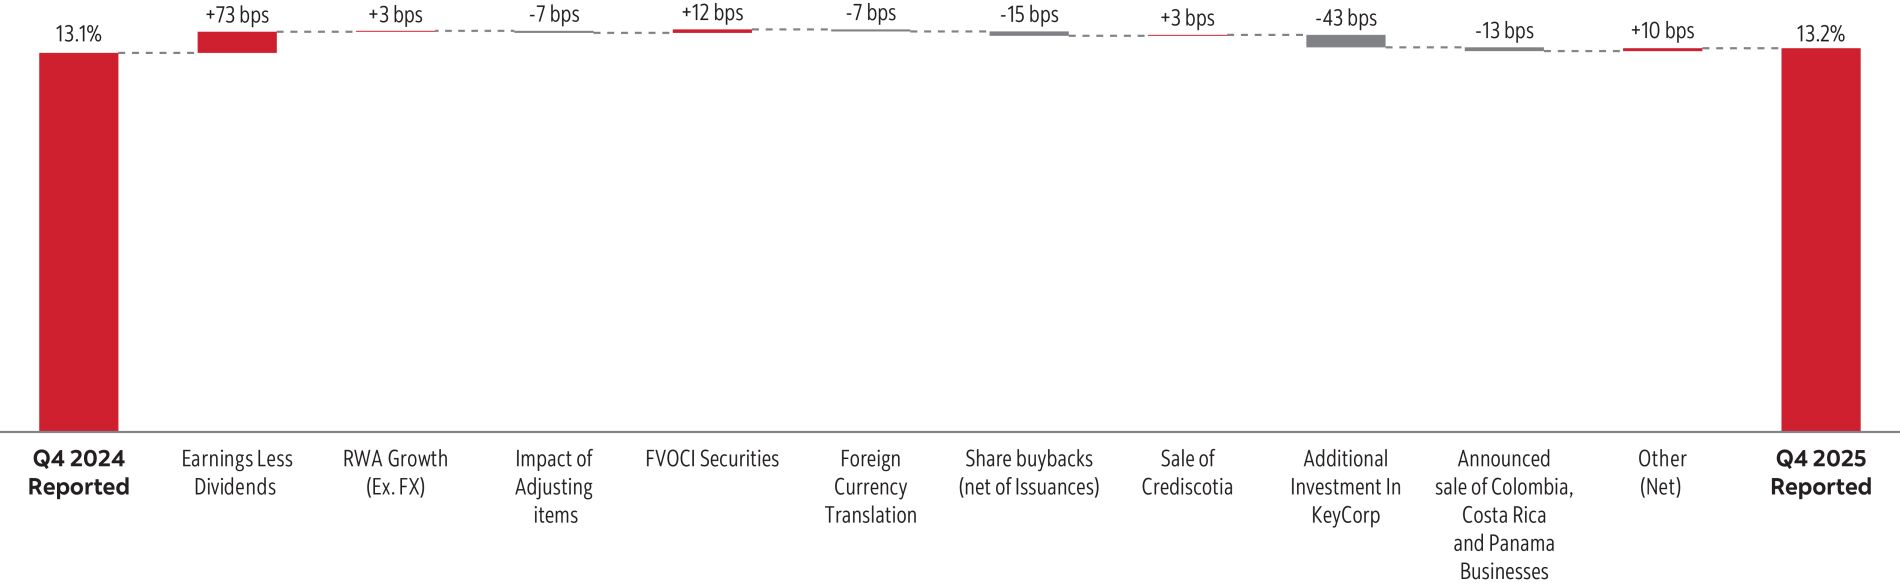
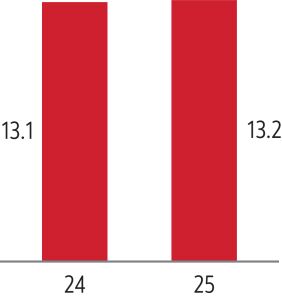
The Basel III Common Equity Tier 1 (CET1) ratio was 13.2% as at October 31, 2025, compared to 13.1% last year.
Medium-term financial objectives
The following table provides a summary of our 2025 performance against our medium-term financial objectives:
| 2025 Results | ||||||||||||
| Reported | Adjusted(1) | |||||||||||
| Diluted earnings per share growth of 7%+ |
(3.4) | % | 9.6% | |||||||||
| Return on equity of 14%+ |
9.7 | % | 11.8% | |||||||||
| Achieve positive operating leverage |
Negative 2.2 | % | Positive 3.0% | |||||||||
| Maintain strong capital ratios |
CET1 capital ratio of 13.2 | % | N/A | |||||||||
| (1) | Refer to Non-GAAP Measures on page 20. |
|
In fiscal 2025, the total shareholder return on the Bank’s shares was 36%, compared to the total return of the S&P/TSX Composite Index of 29%. The total compound annual shareholder return on the Bank’s shares over the past five years was 17.1%, and 9.6% over the past 10 years. This is below the total annual return of the S&P/TSX Composite Index over the past five years and ten years of 17.7% and 11.7%, respectively.
Dividends per share totaled $4.32 for the year, an increase of 1.9% from 2024. The Bank’s target payout range is 40-50%. The dividend payout ratio for the year was 73.7% on a reported basis and 60.7% on an adjusted basis. The Board of Directors approved a quarterly dividend of $1.10 per common share, at its meeting on December 1, 2025. This quarterly dividend applies to shareholders of record at the close of business on January 6, 2026, and is payable January 28, 2026. |
C1 Closing common share price as
|
28 | 2025 Scotiabank Annual Report