
Supplemental Earnings Results Presentation April 30, 2026 First Quarter 2026 Financial Results
2 Safe Harbor Some statements in this presentation may be forward-looking statements within the meaning of the Private Securities Litigation Reform Act of 1995, including, without limitation, statements regarding management’s goals, plans, and expectations, our future financial performance, our future financial projections, our growth strategy, and other matters. Forward looking statements generally can be identified by the use of forward-looking terminology such as, “anticipate,” “believe,” “expect,” “assume,” “continue,” “may,” “will,” “intend,” “estimate,” or similar expressions or the negative of those terms or expressions, although not all forward- looking statements contain these words. These statements are based on assumptions and expectations of future events that are subject to risks and uncertainties. Our actual results may differ materially from these plans and expectations. Undue reliance should not be placed on these forward-looking statements, and it is encouraged to review our SEC filings, where the risk factors in our business are discussed in detail. The forward-looking statements contained in this presentation reflect our views and assumptions only as of the date of this presentation. While we may elect to update forward-looking statements at some point in the future, we specifically disclaim any obligation to do so, even if estimates change, so you should not rely on these forward-looking statements as representing our views as of any date other than the date of this presentation. In addition to financial measures prepared in accordance with generally accepted accounting principles (GAAP), this presentation also contains non-GAAP financial measures. Calculations of these measures, explanations of what these measures represent, the reasons why we believe these measures provide useful information to investors, a reconciliation of these measures to the most directly comparable GAAP measures, as applicable, and other information relating to these non-GAAP measures can be found in the Appendix at the end of this presentation. In addressing various financial metrics, the presentation describes some of the factors that impacted year-over-year performance. For additional factors that impacted year-over-year performance, please refer to our earnings release and our SEC filings, which are available in the “Investor Relations” section of our web site under the subheadings “Financials/Financial Results” and “Quarterly Results."

Our Mission is to advance science and save lives, together
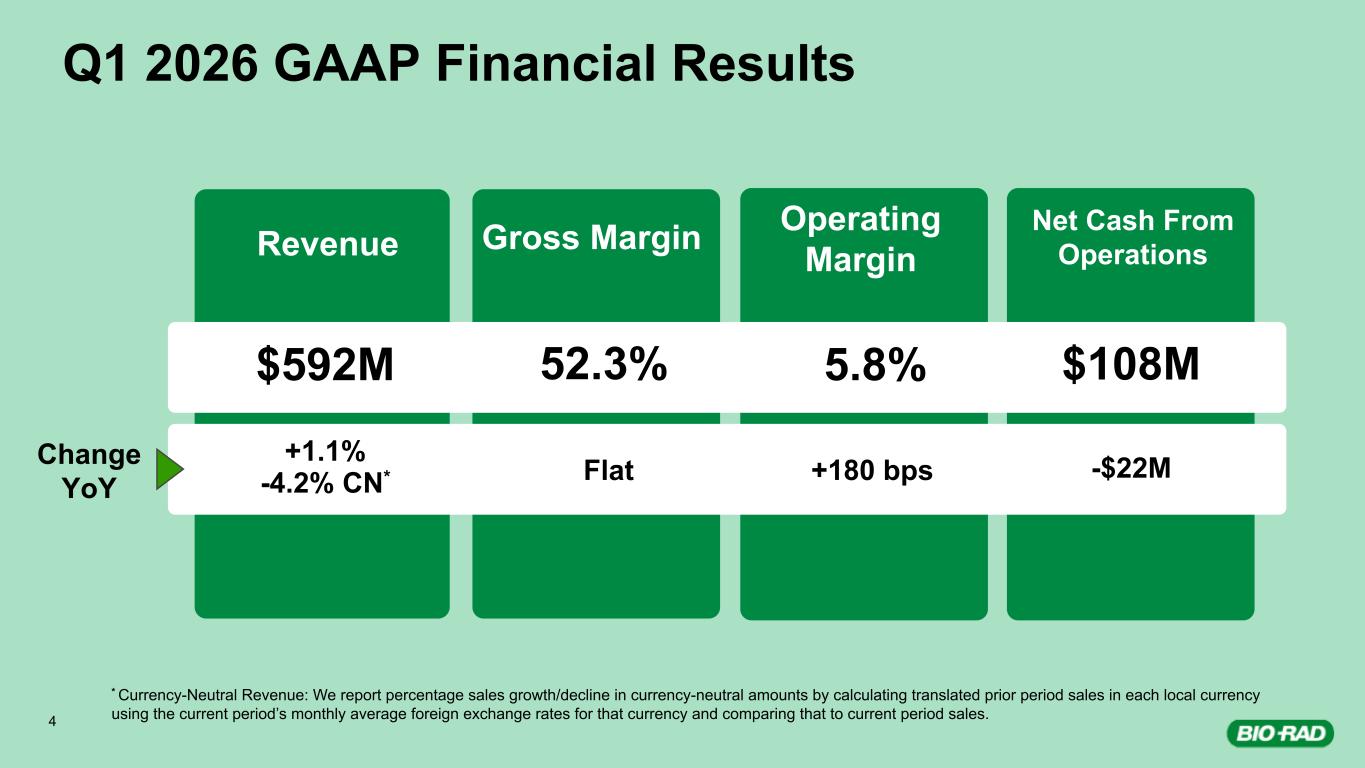
Q1 2026 GAAP Financial Results Revenue Gross Margin Operating Margin Net Cash From Operations $592M +1.1% -4.2% CN* 52.3% Flat 5.8% +180 bps $108M -$22M * Currency-Neutral Revenue: We report percentage sales growth/decline in currency-neutral amounts by calculating translated prior period sales in each local currency using the current period’s monthly average foreign exchange rates for that currency and comparing that to current period sales.4 Change YoY
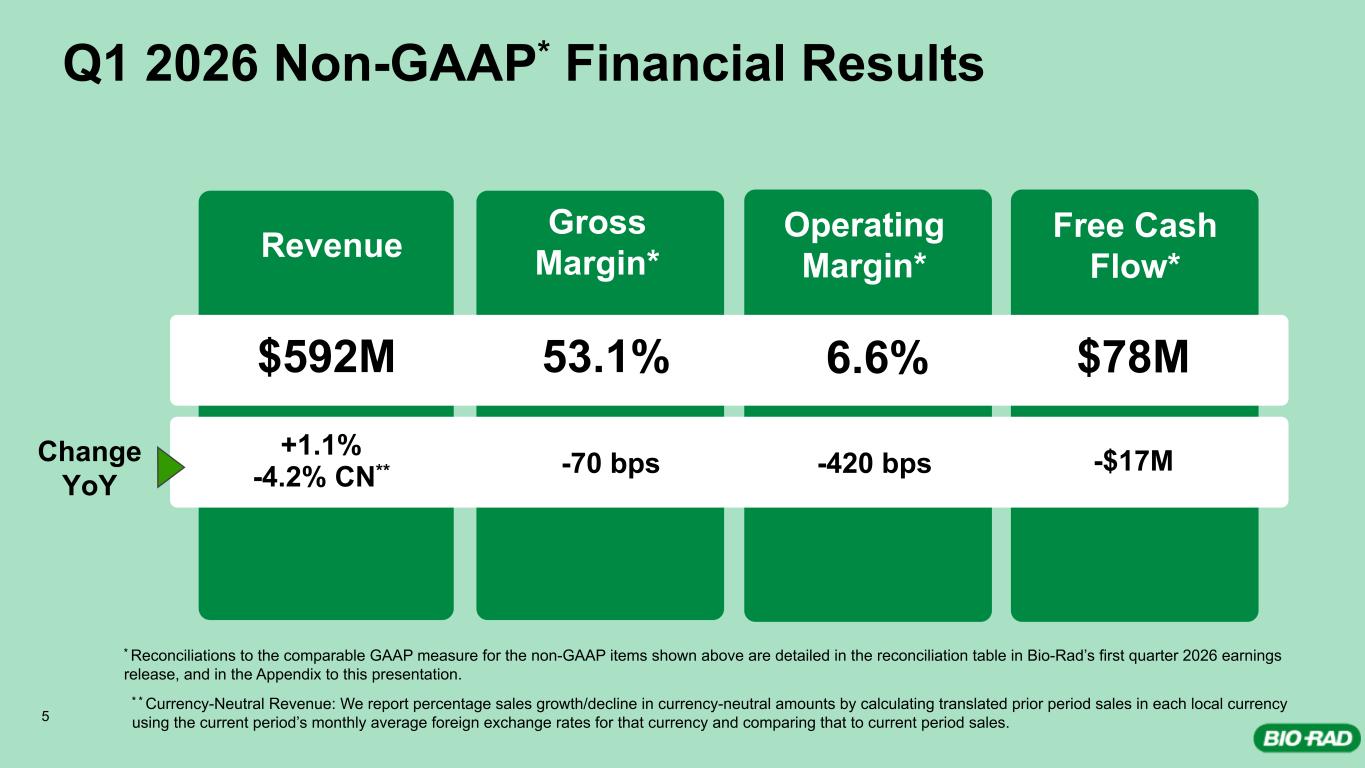
Q1 2026 Non-GAAP* Financial Results Revenue Gross Margin* Operating Margin* Free Cash Flow* $592M +1.1% -4.2% CN** 53.1% -70 bps 6.6% -420 bps $78M -$17M * Reconciliations to the comparable GAAP measure for the non-GAAP items shown above are detailed in the reconciliation table in Bio-Rad’s first quarter 2026 earnings release, and in the Appendix to this presentation. * * Currency-Neutral Revenue: We report percentage sales growth/decline in currency-neutral amounts by calculating translated prior period sales in each local currency using the current period’s monthly average foreign exchange rates for that currency and comparing that to current period sales.5 Change YoY
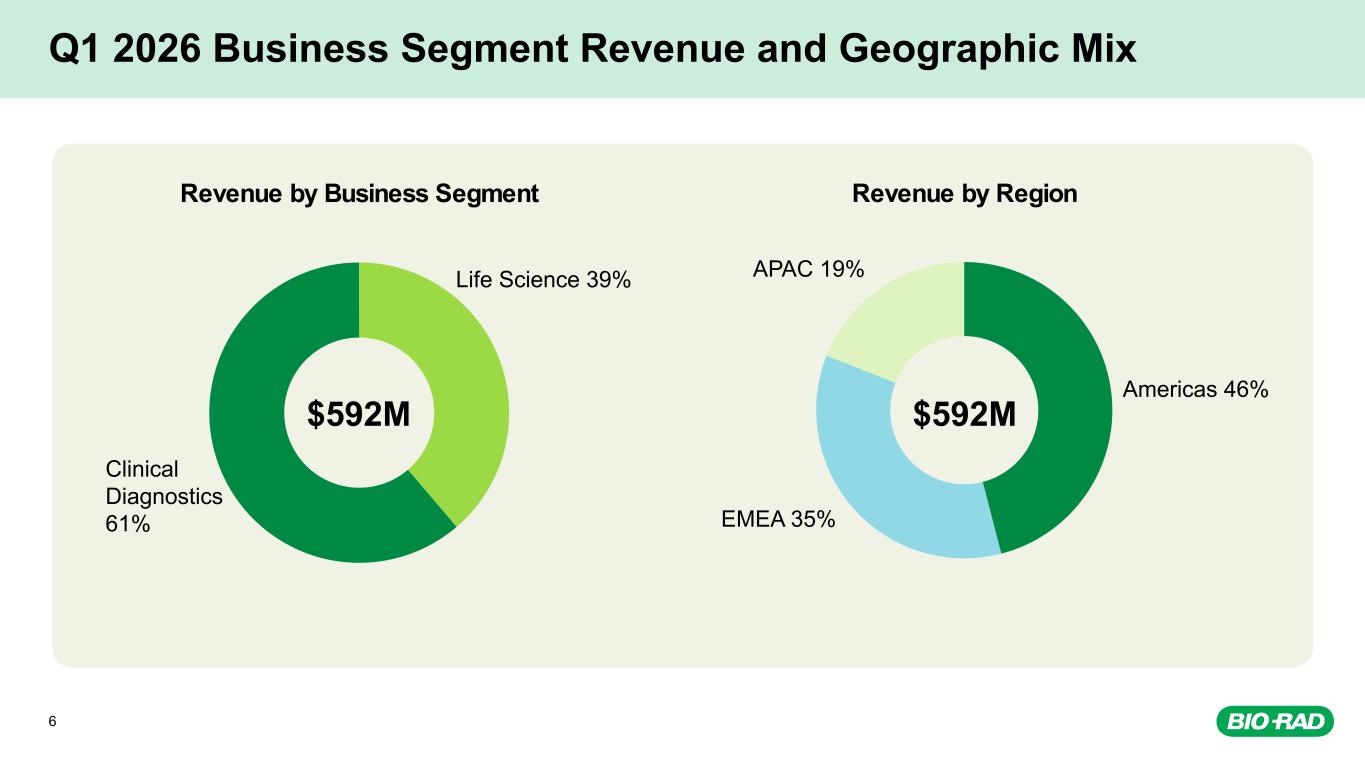
6 Q1 2026 Business Segment Revenue and Geographic Mix $592M $592M Revenue by Business Segment Life Science 39% Clinical Diagnostics 61% Revenue by Region Americas 46% EMEA 35% APAC 19%
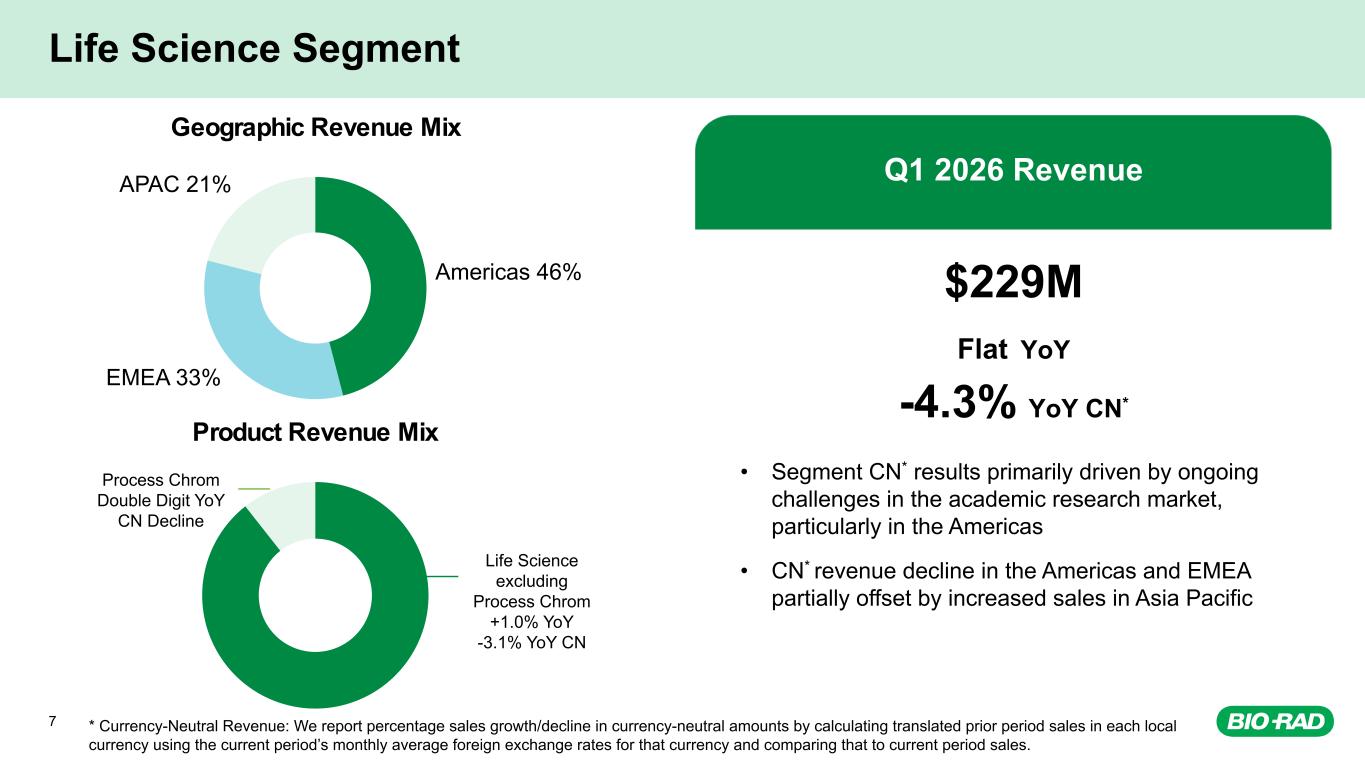
7 Life Science Segment Q1 2026 Revenue $229M Flat YoY -4.3% YoY CN* • Segment CN* results primarily driven by ongoing challenges in the academic research market, particularly in the Americas • CN* revenue decline in the Americas and EMEA partially offset by increased sales in Asia Pacific Life Science excluding Process Chrom +1.0% YoY -3.1% YoY CN Process Chrom Double Digit YoY CN Decline * Currency-Neutral Revenue: We report percentage sales growth/decline in currency-neutral amounts by calculating translated prior period sales in each local currency using the current period’s monthly average foreign exchange rates for that currency and comparing that to current period sales. Geographic Revenue Mix Americas 46% EMEA 33% APAC 21% Product Revenue Mix
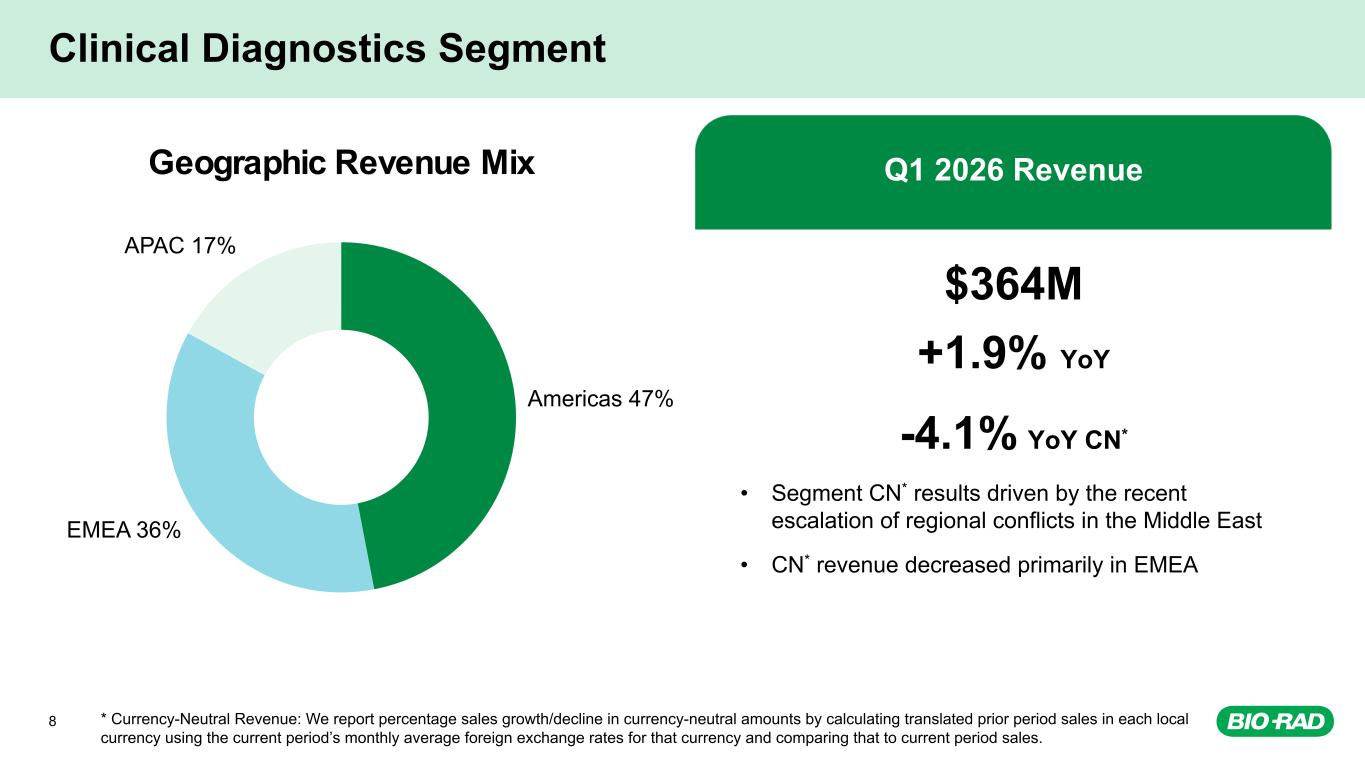
Clinical Diagnostics Segment Q1 2026 Revenue $364M +1.9% YoY -4.1% YoY CN* • Segment CN* results driven by the recent escalation of regional conflicts in the Middle East • CN* revenue decreased primarily in EMEA * Currency-Neutral Revenue: We report percentage sales growth/decline in currency-neutral amounts by calculating translated prior period sales in each local currency using the current period’s monthly average foreign exchange rates for that currency and comparing that to current period sales. 8 Geographic Revenue Mix Americas 47% EMEA 36% APAC 17%
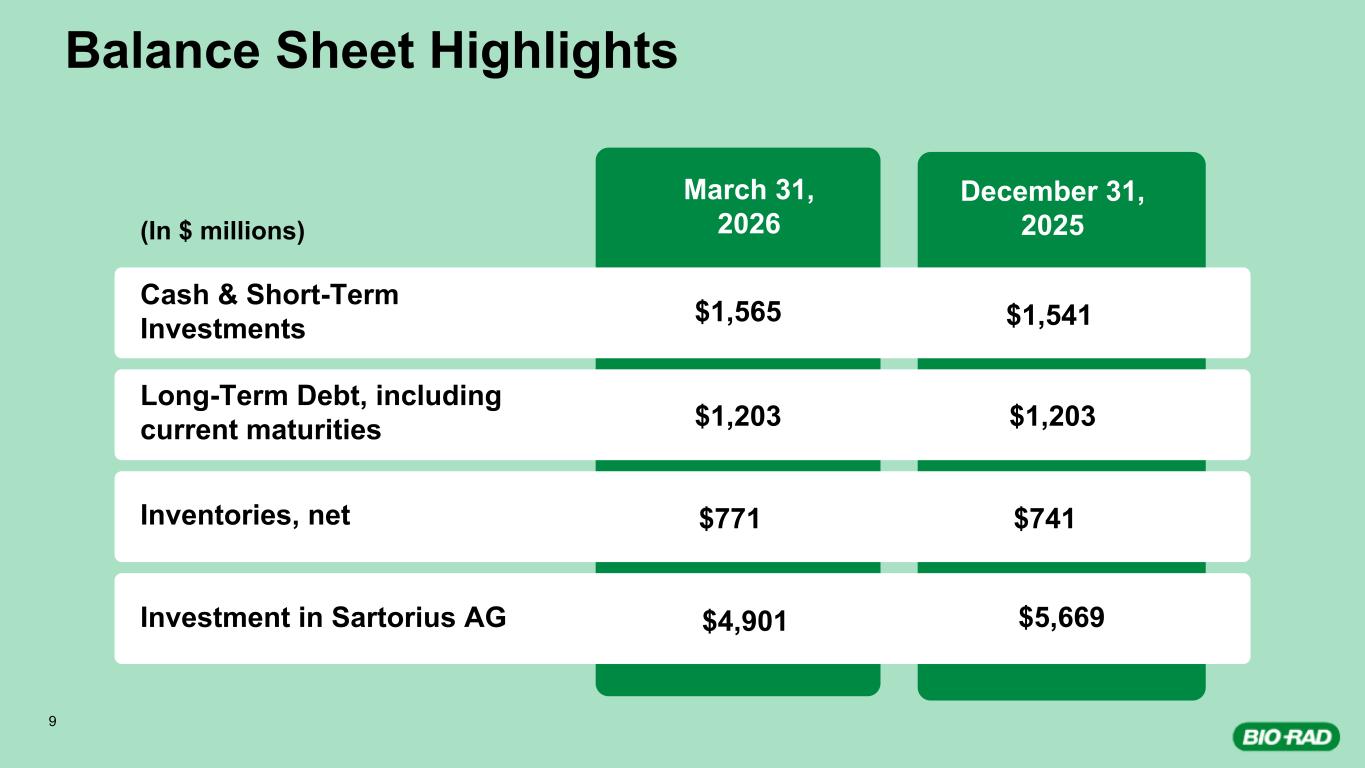
Balance Sheet Highlights March 31, 2026 December 31, 2025 Cash & Short-Term Investments Long-Term Debt, including current maturities Inventories, net Investment in Sartorius AG $1,565 $1,203 $771 $4,901 $1,541 $1,203 $741 $5,669 9 (In $ millions)
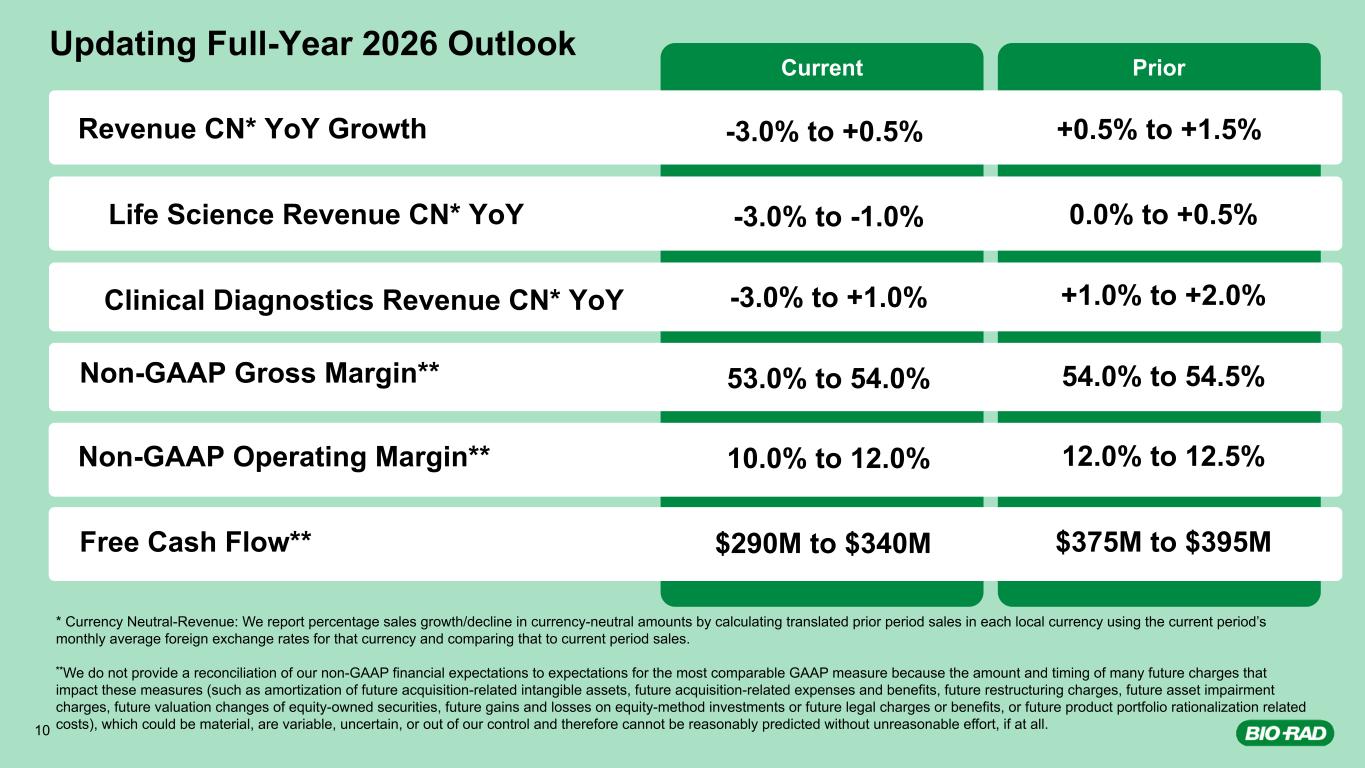
Updating Full-Year 2026 Outlook Non-GAAP Gross Margin** Non-GAAP Operating Margin** +1.0% to +2.0% $375M to $395M Clinical Diagnostics Revenue CN* YoY Revenue CN* YoY Growth Life Science Revenue CN* YoY Free Cash Flow** +0.5% to +1.5% 0.0% to +0.5% * Currency Neutral-Revenue: We report percentage sales growth/decline in currency-neutral amounts by calculating translated prior period sales in each local currency using the current period’s monthly average foreign exchange rates for that currency and comparing that to current period sales. **We do not provide a reconciliation of our non-GAAP financial expectations to expectations for the most comparable GAAP measure because the amount and timing of many future charges that impact these measures (such as amortization of future acquisition-related intangible assets, future acquisition-related expenses and benefits, future restructuring charges, future asset impairment charges, future valuation changes of equity-owned securities, future gains and losses on equity-method investments or future legal charges or benefits, or future product portfolio rationalization related costs), which could be material, are variable, uncertain, or out of our control and therefore cannot be reasonably predicted without unreasonable effort, if at all. 54.0% to 54.5% 12.0% to 12.5% 10 Current Prior $290M to $340M -3.0% to +1.0% -3.0% to +0.5% -3.0% to -1.0% 53.0% to 54.0% 10.0% to 12.0%

Appendix
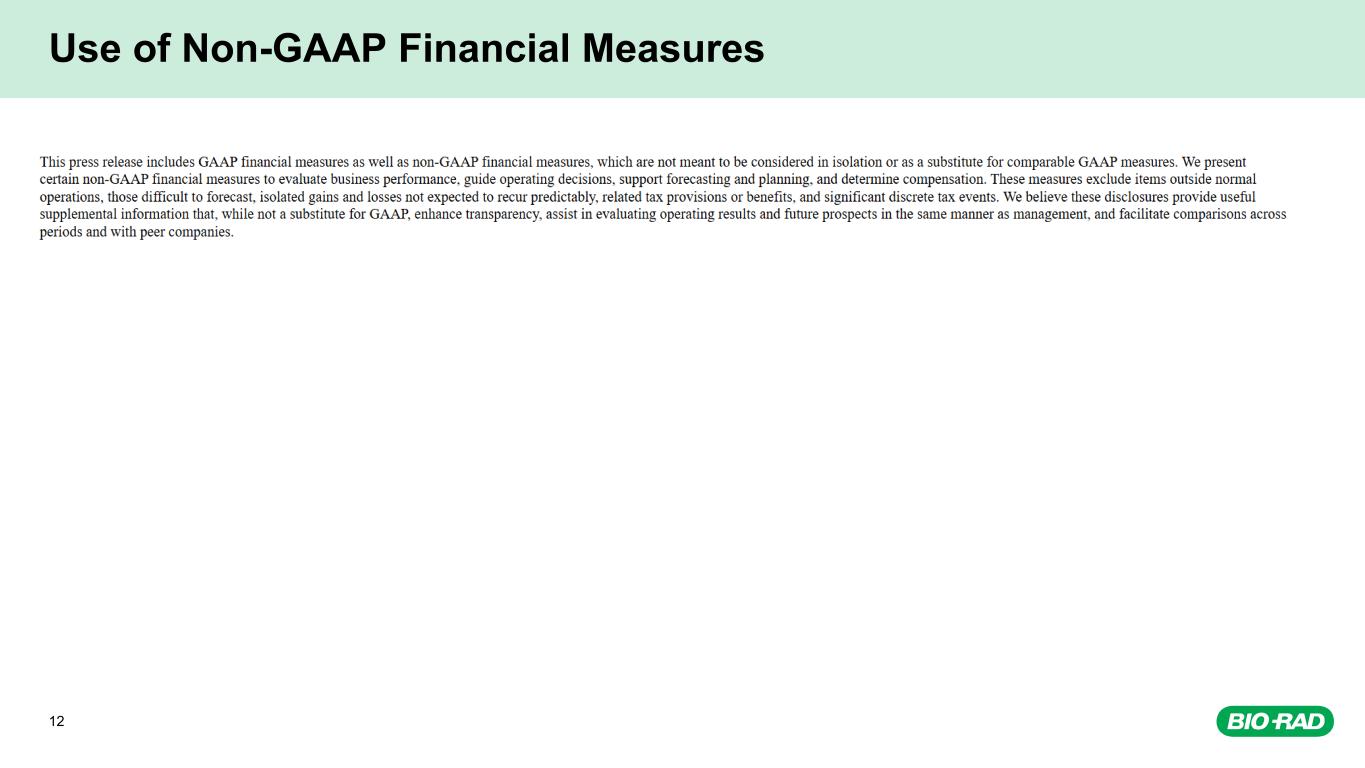
12 Use of Non-GAAP Financial Measures
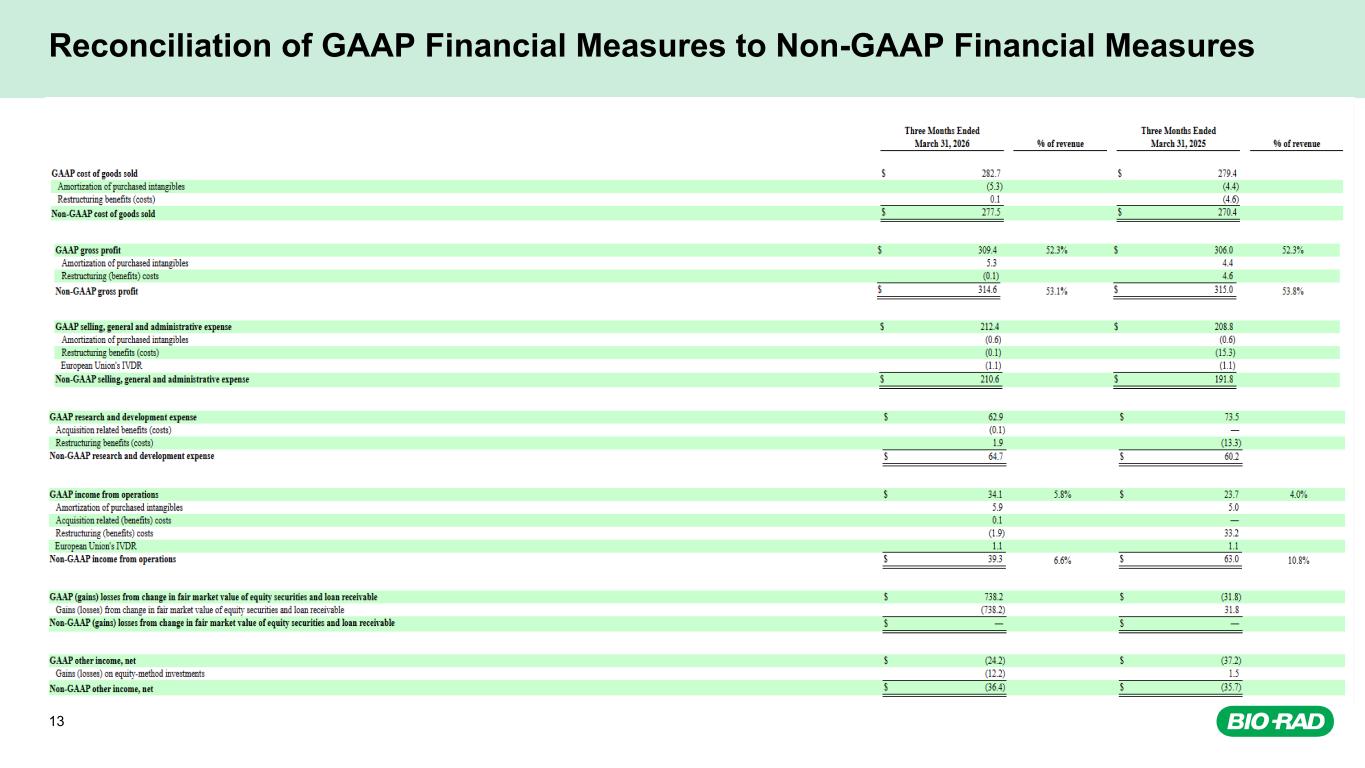
13 Reconciliation of GAAP Financial Measures to Non-GAAP Financial Measures
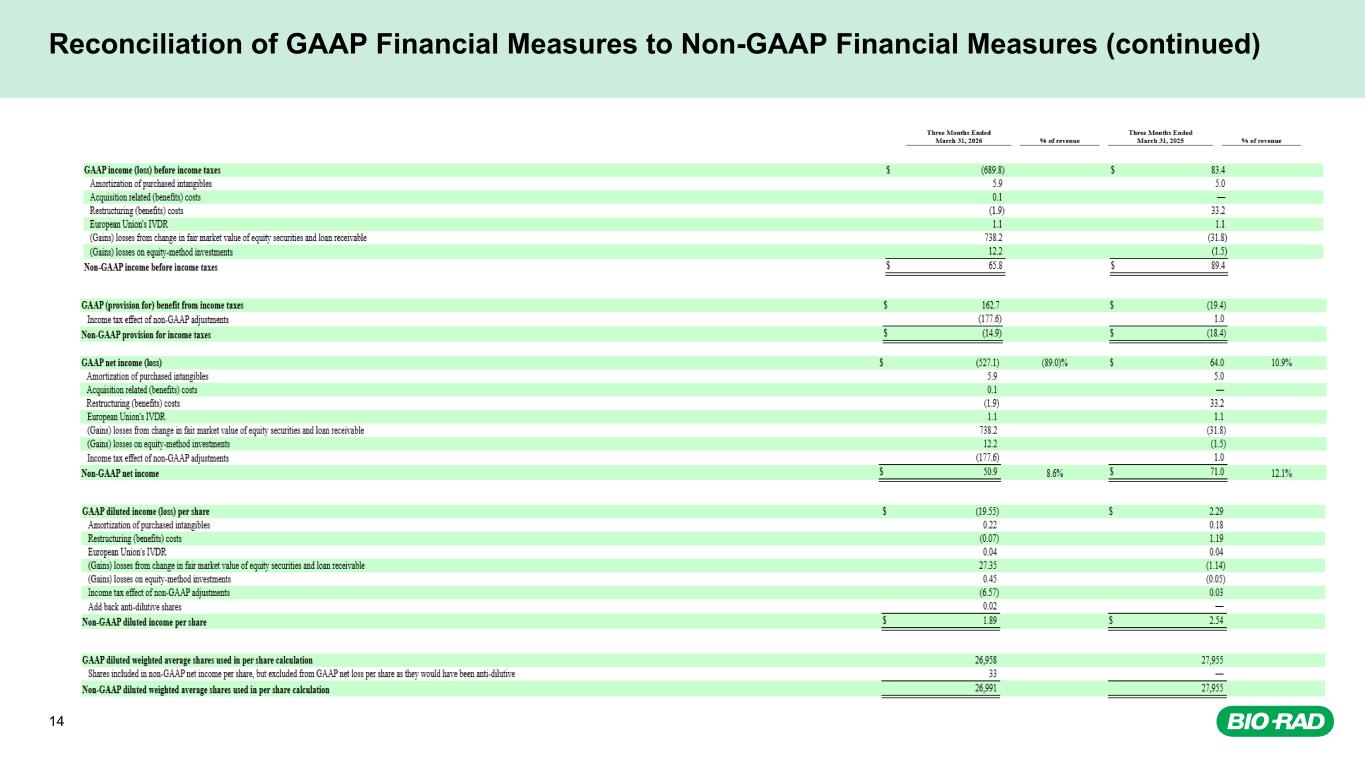
14 Reconciliation of GAAP Financial Measures to Non-GAAP Financial Measures (continued)
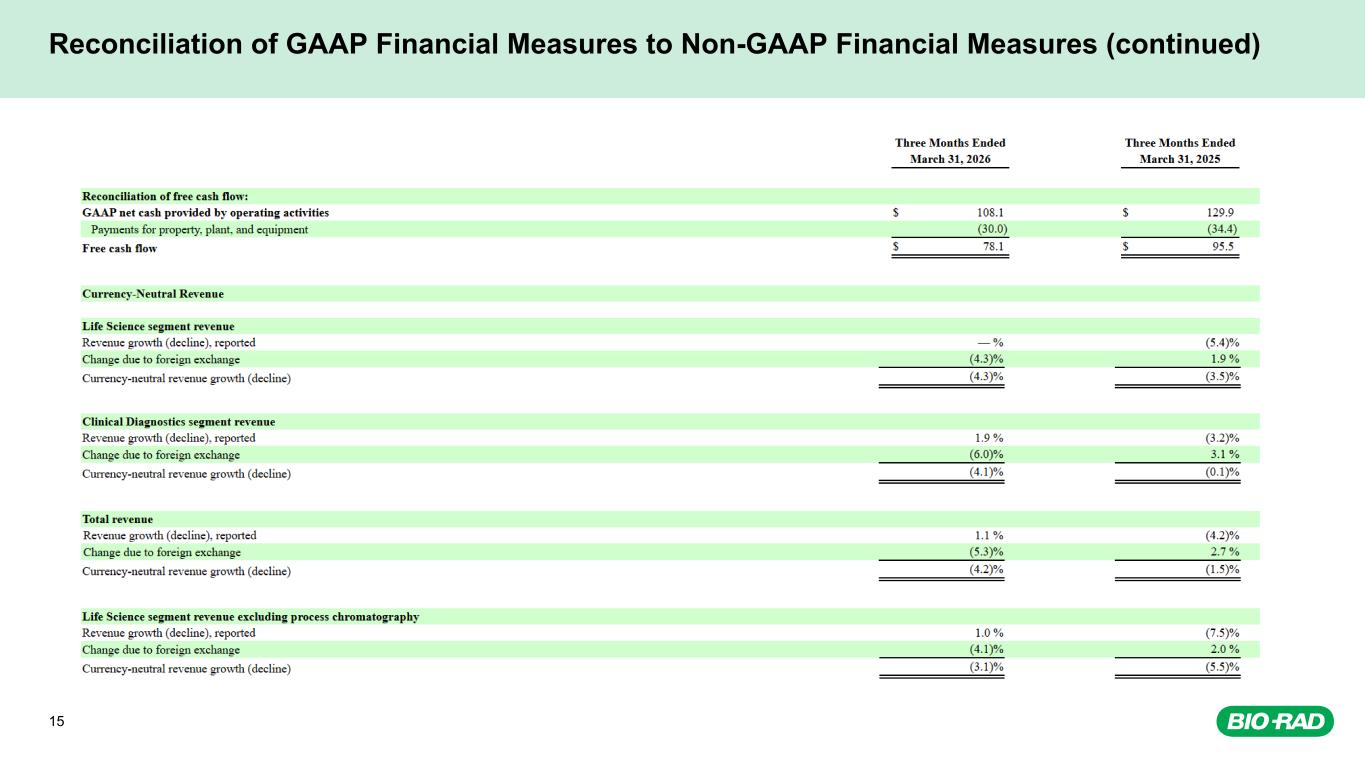
15 Reconciliation of GAAP Financial Measures to Non-GAAP Financial Measures (continued)
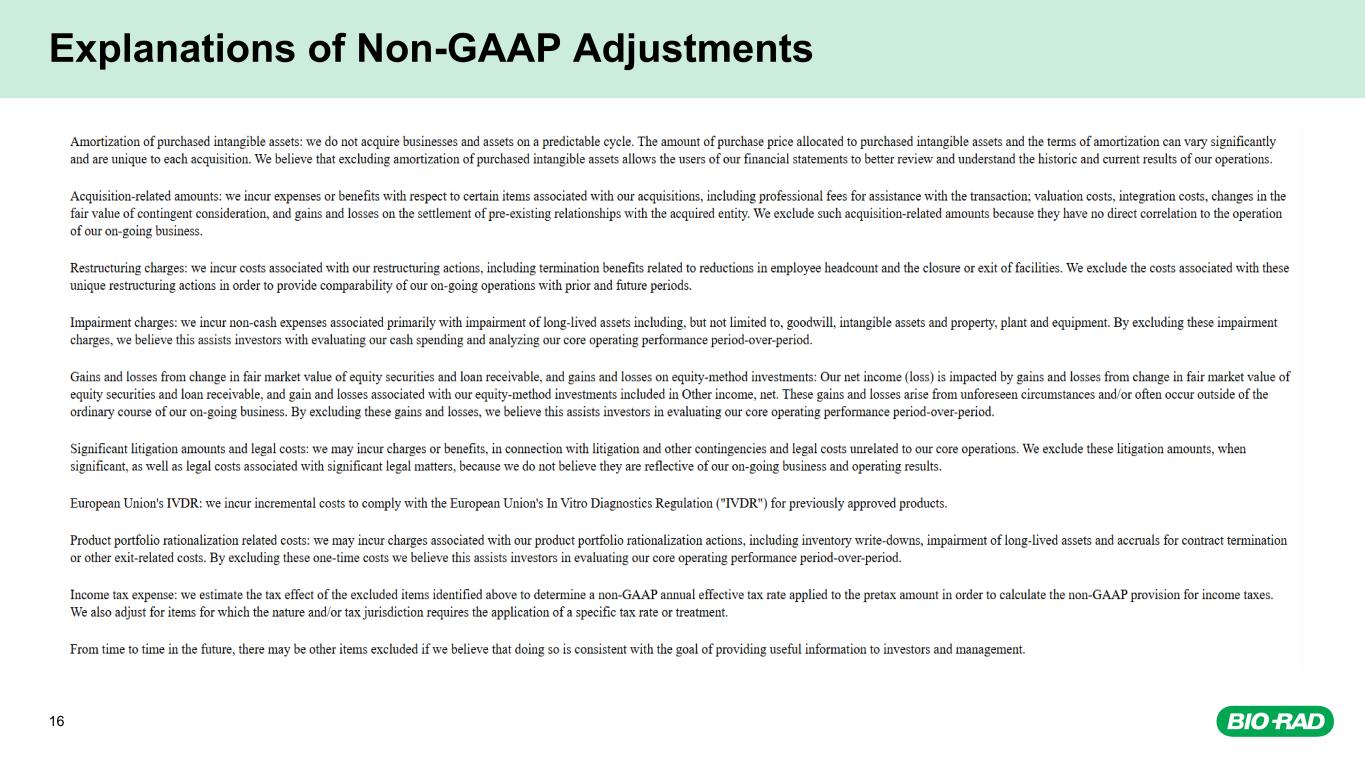
16 Explanations of Non-GAAP Adjustments
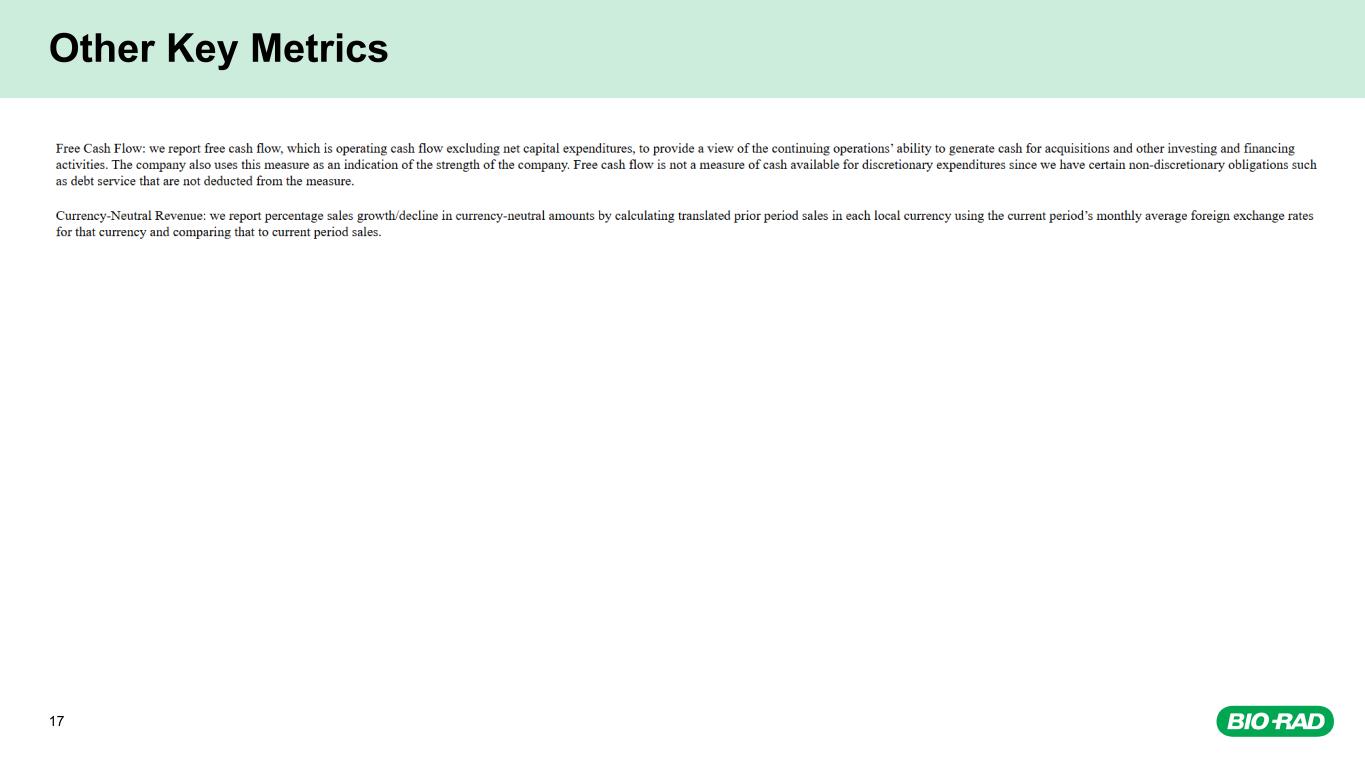
17 Other Key Metrics

18 2026 Financial Outlook