
.3
EVERSOURCE ENERGY Q3 2025 EARNINGS REPORT November 5, 2025 EVERSOURCE ENERGY Q3 2025 EARNINGS REPORT
EVERSOURCE ENERGY Q3 2025 EARNINGS REPORT Safe Harbor Statement 1 All per - share amounts in this presentation are reported on a diluted basis. The only common equity securities that are publicly traded are common shares of Eversource Energy. The third quarter and first nine months of 2025 and 2024 earnings discussion includes financial measures that are not recognized under generally accepted accounting principles (non - GAAP ) referencing earnings and EPS excluding losses associated with previous offshore wind investments. EPS by business is also a non - GAAP financial measure and is calculated by dividing the net income attributable to common shareho lders of each business by the weighted average diluted Eversource Energy common shares outstanding for the period. The earnings and EPS of each business do not represent a direct legal interest in the assets and lia bilities of such business, but rather represent a direct interest in Eversource Energy’s assets and liabilities as a whole. Full year 2024 earnings discussion also includes a non - GAAP financial measure referencing earnings and EPS excluding a loss on the pending sale of the Aquarion water distribution business of $298.3 million. Eversource Energy uses these non - GAAP financial measures to evaluate and provide details of earnings results by business and to more fully compare and explain results without including these items. This information is among the primary indicators management uses as a basis for evaluating performance and planning and forecasting of future periods. Mana gem ent believes the impacts of the losses on the previous offshore wind investments and the loss on the pending sale of the Aquarion water distribution business are not indicative of Eversource Energy's ongoing costs and performa nce . Management views these charges as not directly related to the ongoing operations of the business and therefore not an indicator of baseline operating performance. Due to the nature and significance of the effect of these items on net income attributable to common shareholders and EPS, management believes that the non - GAAP presentation is a more meaningful representation of Eversource Energy's financial performance and provides additional and use ful information to readers of this report in analyzing historical and future performance of the business. These non - GAAP financial measures should not be considered as alternatives to reported net income attributable to common shareho lders or EPS determined in accordance with GAAP as indicators of Eversource Energy's operating performance. Eversource Energy does not provide guidance for net income attributable to common shareholders or recurring EPS or a reconciliation of guidance for non - GAAP recurring earnings or non - GAAP recurring EPS to the most directly comparable GAAP measure because it is not able to predict with reasonable certainty the amount or nature of all item s t hat will be included in our net income attributable to common shareholders or recurring EPS for the year ending December 31, 2025. These items are uncertain, depend on many factors and could have a material impact on our net income a ttributable to common shareholders and recurring EPS for the year ending December 31, 2025, and therefore cannot be made available without unreasonable effort. This document includes statements concerning Eversource Energy’s expectations, beliefs, plans, objectives, goals, strategies, as sumptions of future events, future financial performance or growth and other statements that are not historical facts. These statements are “forward - looking statements” within the meaning of the U. S. federal securities laws. Ge nerally, readers can identify these forward - looking statements through the use of words or phrases such as “estimate,” “expect,” “pending,” “anticipate,” “intend,” “plan,” “project,” “believe,” “forecast,” “would,” “should,” “could” an d other similar expressions. Forward - looking statements involve risks and uncertainties that may cause actual results or outcomes to differ materially from those included in the forward - looking statements. Forward - looking statements are based on the current expectations, estimates, assumptions or projections of management and are not guarantees of future performance. These expectations, estimates, assumptions or projections may vary materially from actual results. Accord ing ly, any such statements are qualified in their entirety by reference to, and are accompanied by, the following important factors that may cause our actual results or outcomes to differ materially from those contained in our fo rwa rd - looking statements, including, but not limited to cyberattacks or breaches, including those resulting in the compromise of the confidentiality of our proprietary information and the personal information of our customers; the ability t o q ualify for investment tax credits and investment tax credit adders; variability in the costs and final investment returns of the Revolution Wind and South Fork Wind offshore wind projects as it relates to the purchase price post - closing adjus tment under the terms of the sale agreement for these projects; disruptions in the capital markets or other events that make our access to necessary capital more difficult or costly; changes in economic conditions, including impact o n i nterest rates, tax policies, tariffs, and customer demand and payment ability; ability or inability to commence and complete our major strategic development projects and opportunities; acts of war or terrorism, physical attacks or grid d ist urbances that may damage and disrupt our electric transmission and electric, natural gas, and water distribution systems; actions or inaction of local, state and federal regulatory, public policy and taxing bodies; substandar d p erformance of third - party suppliers and service providers; fluctuations in weather patterns, including extreme weather due to climate change; changes in business conditions, which could include disruptive technology or development of al ter native energy sources related to our current or future business model; contamination of, or disruption in, our water supplies; changes in levels or timing of capital expenditures; changes in laws, regulations, Presidential executive or ders or regulatory policy, including compliance with environmental laws and regulations; changes in accounting standards and financial reporting regulations; actions of rating agencies; and other presently unknown or unforese en factors. Other risk factors are detailed in Eversource Energy’s reports filed with the Securities and Exchange Commission (SEC). They ar e updated as necessary and available on Eversource Energy’s website at www.eversource.com and on the SEC’s website at www.sec.gov and management encourages you to consult such disclosures. All such factors are difficult to predict and contain uncertainties that may materially affect Eversource Energy’s actual res ult s, many of which are beyond our control. You should not place undue reliance on the forward - looking statements, as each speaks only as of the date on which such statement is made, and, except as required by federal securities la ws, Eversource Energy undertakes no obligation to update any forward - looking statement or statements to reflect events or circumstances after the date on which such statement is made or to reflect the occurrence of unanticipat ed events.
EVERSOURCE ENERGY Q3 2025 EARNINGS REPORT Agenda Business Update ▪ Key Strategic Priorities ▪ Quarterly Highlights 2 Joe Nolan Chairman, President & CEO John Moreira EVP, CFO & Treasurer Financial Update ▪ Q3 2025 Financial Results ▪ Regulatory Update ▪ Balance Sheet & Credit Metrics

EVERSOURCE ENERGY Q3 2025 EARNINGS REPORT EVERSOURCE ENERGY Q3 2025 EARNINGS REPORT Chairman, President & Chief Executive Officer Joe Nolan Business Update
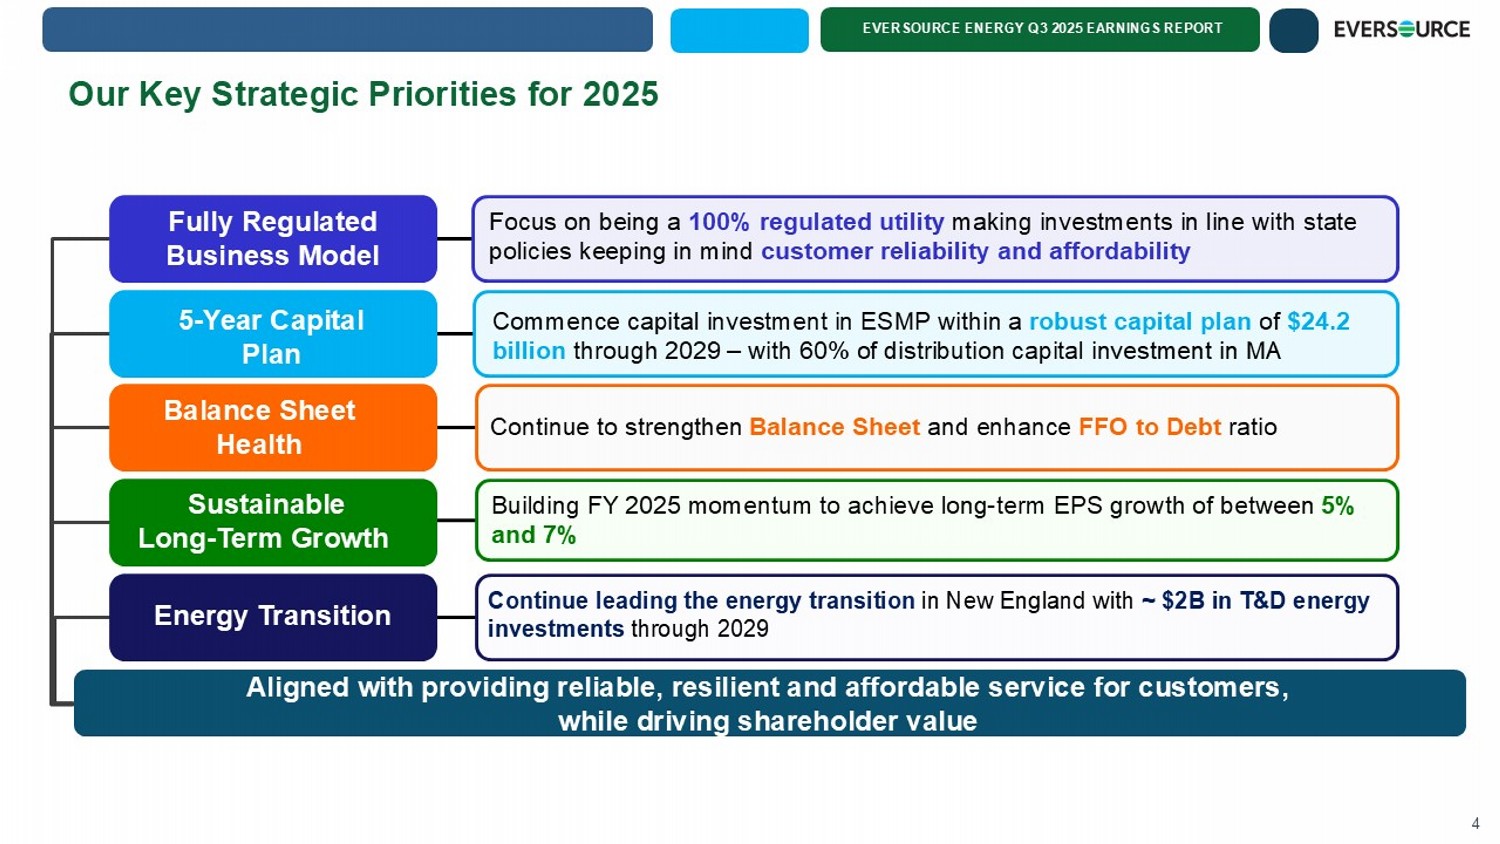
EVERSOURCE ENERGY Q3 2025 EARNINGS REPORT Aligned with providing reliable, resilient and affordable service for customers, while driving shareholder value Our Key Strategic Priorities for 2025 Building FY 2025 momentum to achieve long - term EPS growth of between 5% and 7% Fully Regulated Business Model Balance Sheet Health Energy Transition Focus on being a 100% regulated utility making investments in line with state policies keeping in mind customer reliability and affordability Continue to strengthen Balance Sheet and enhance FFO to Debt ratio Continue leading the energy transition in New England with ~ $2B in T&D energy investments through 2029 5 - Year Capital Plan Commence capital investment in ESMP within a robust capital plan of $24.2 billion through 2029 – with 60% of distribution capital investment in MA Sustainable Long - Term Growth 4
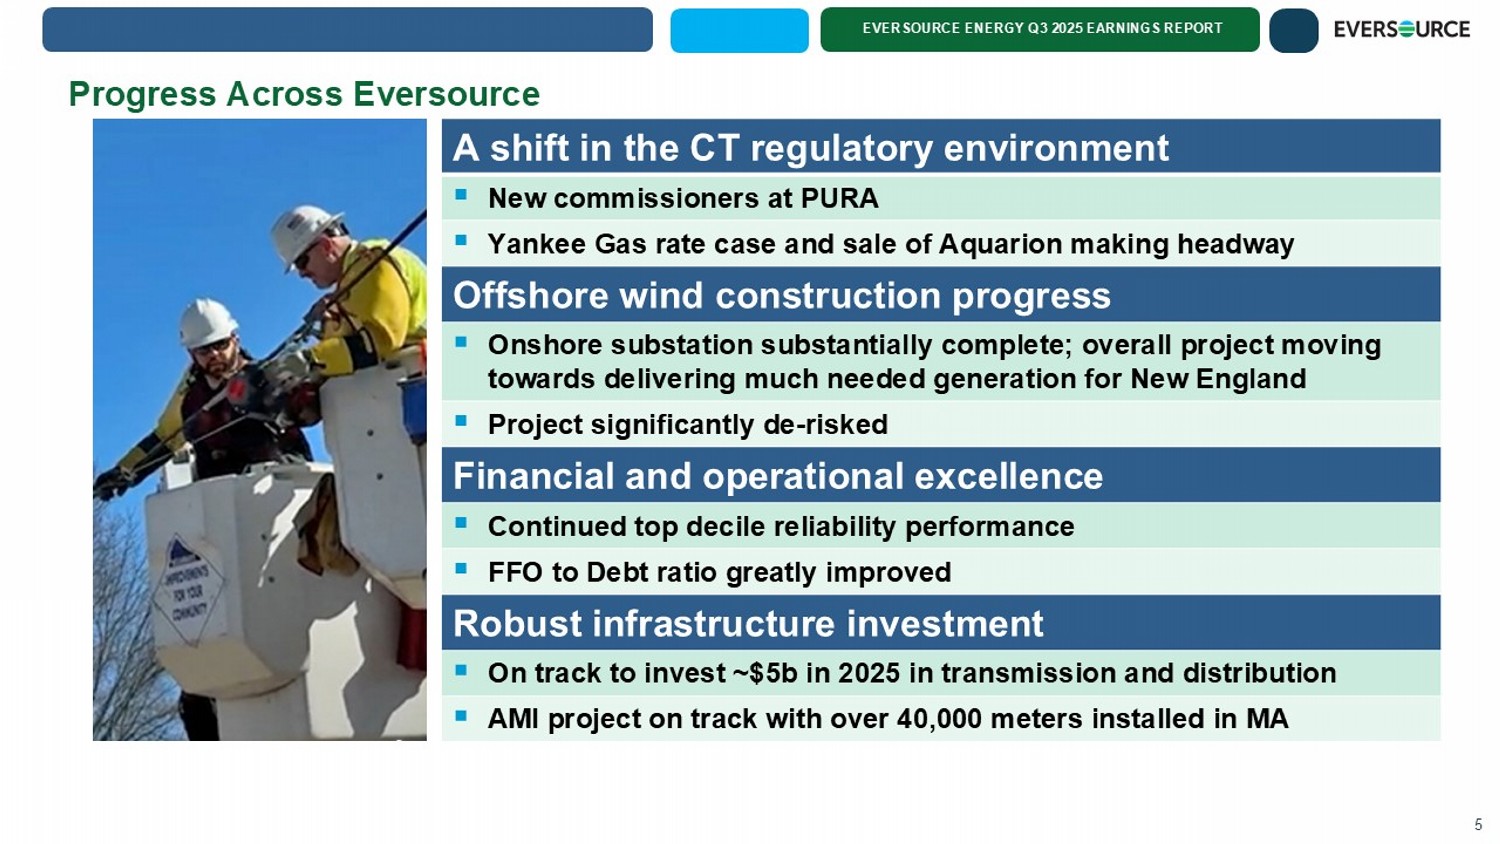
EVERSOURCE ENERGY Q3 2025 EARNINGS REPORT 5 Progress Across Eversource A shift in the CT regulatory environment ▪ New commissioners at PURA ▪ Yankee Gas rate case and sale of Aquarion making headway Offshore wind construction progress ▪ Onshore substation substantially complete; overall project moving towards delivering much needed generation for New England ▪ Project significantly de - risked Financial and operational excellence ▪ Continued top decile reliability performance ▪ FFO to Debt ratio greatly improved Robust infrastructure investment ▪ On track to invest ~$5b in 2025 in transmission and distribution ▪ AMI project on track with over 40,000 meters installed in MA
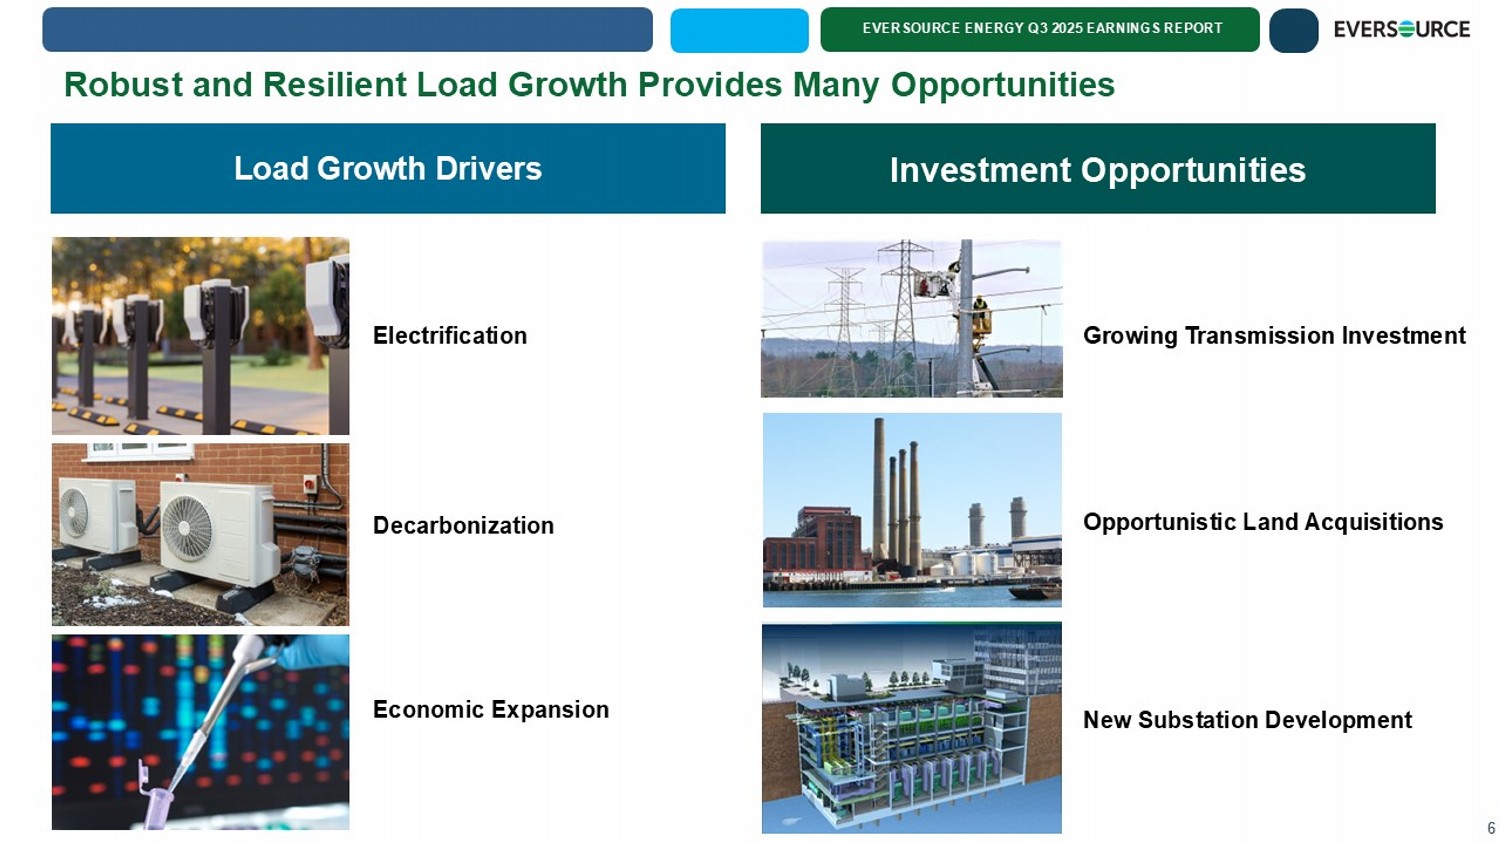
EVERSOURCE ENERGY Q3 2025 EARNINGS REPORT 6 Robust and Resilient Load Growth Provides Many Opportunities Load Growth Drivers Investment Opportunities Electrification New Substation Development Decarbonization Economic Expansion Growing Transmission Investment Opportunistic Land Acquisitions
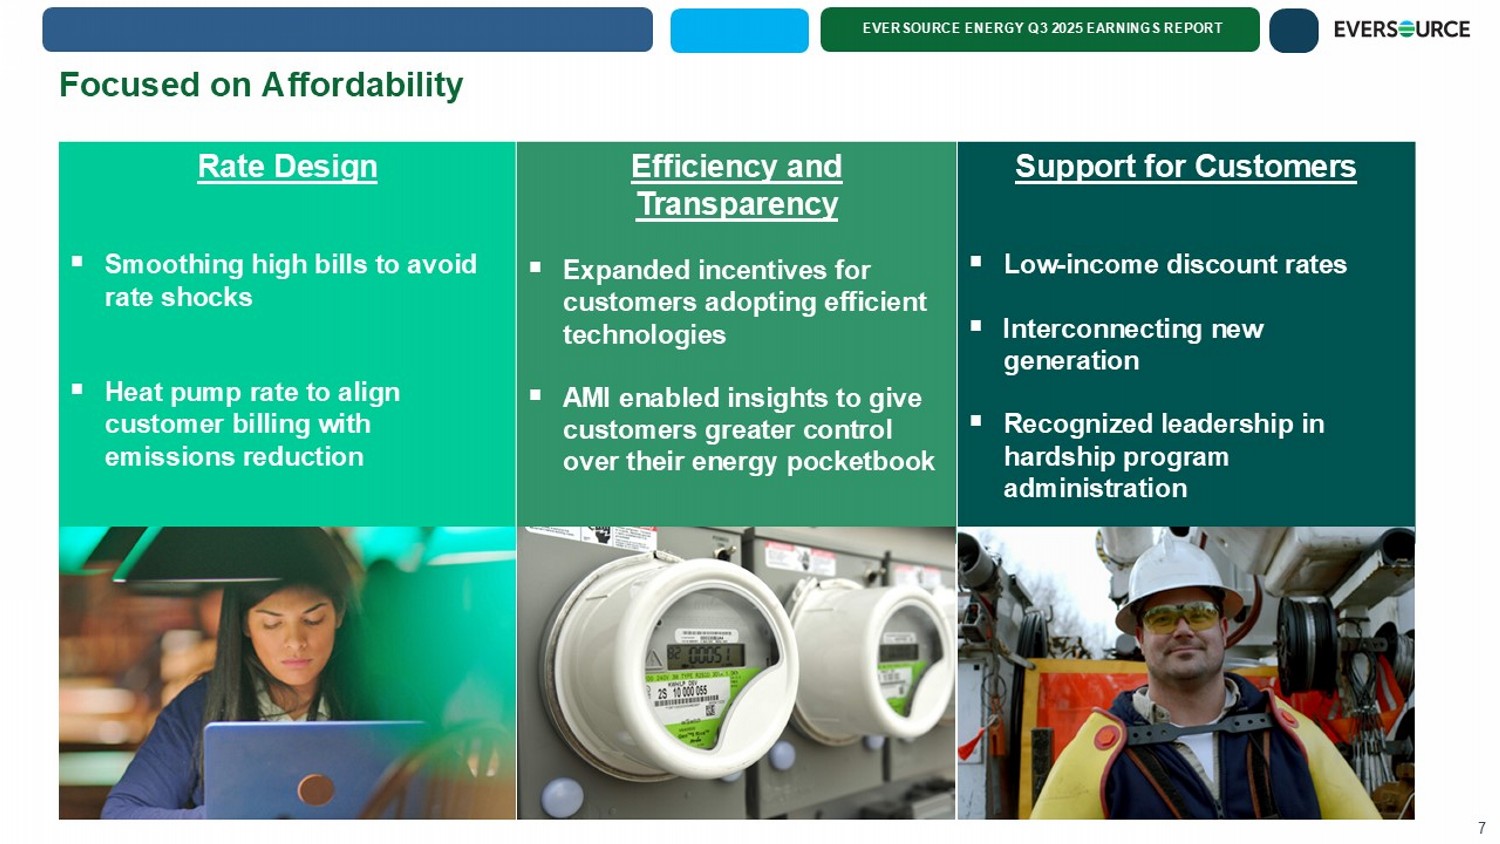
EVERSOURCE ENERGY Q3 2025 EARNINGS REPORT 7 Focused on Affordability Support for Customers ▪ Low - income discount rates ▪ Interconnecting new generation ▪ Recognized leadership in hardship program administration Efficiency and Transparency ▪ Expanded incentives for customers adopting efficient technologies ▪ AMI enabled insights to give customers greater control over their energy pocketbook Rate Design ▪ Smoothing high bills to avoid rate shocks ▪ Heat pump rate to align customer billing with emissions reduction
EVERSOURCE ENERGY Q3 2025 EARNINGS REPORT EVERSOURCE ENERGY Q3 2025 EARNINGS REPORT Executive Vice President, Chief Financial Officer & Treasurer John Moreira Financial Update
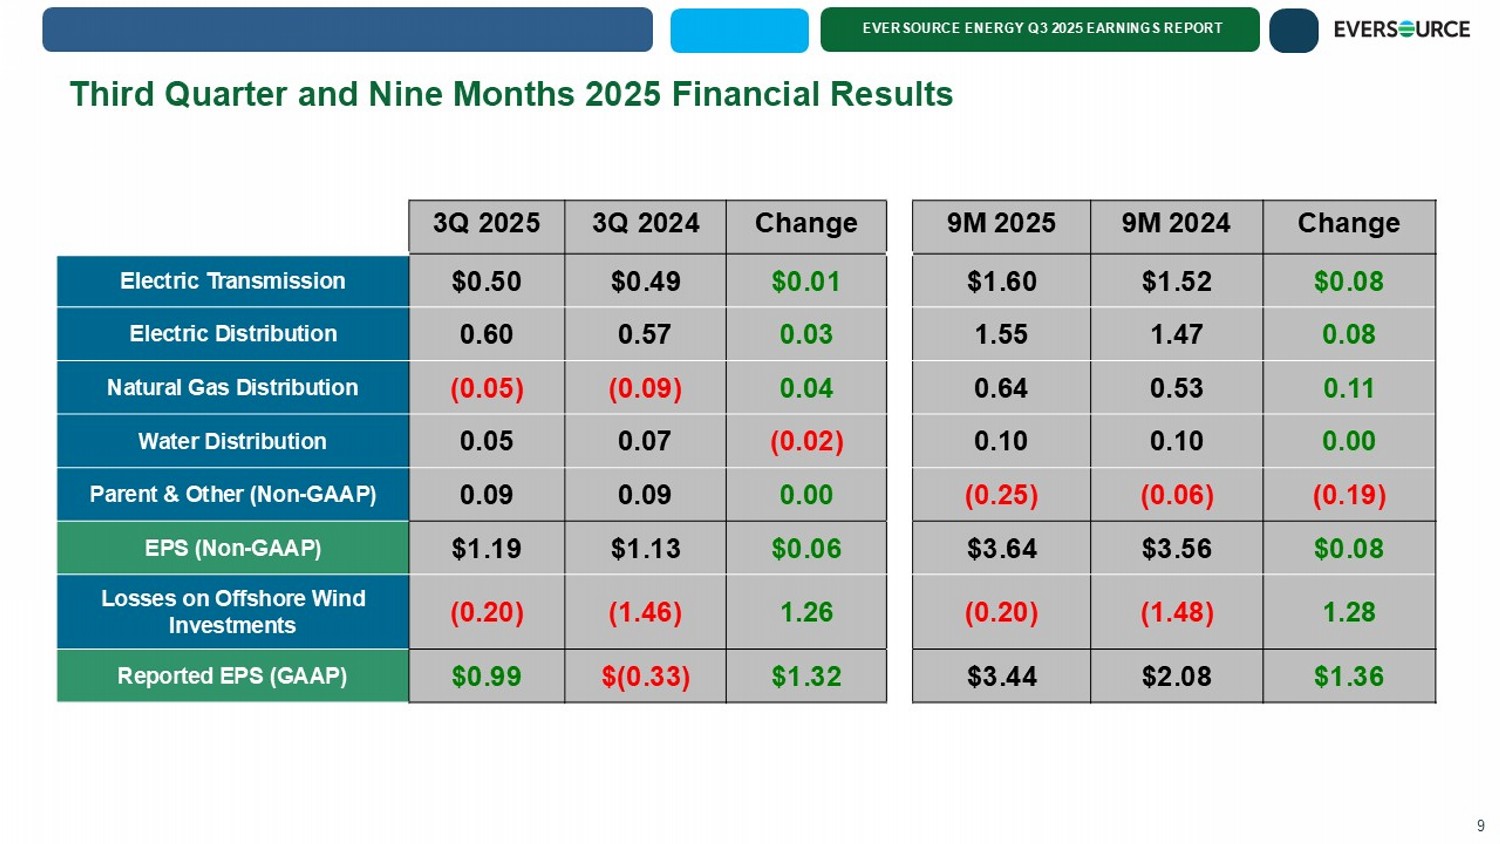
EVERSOURCE ENERGY Q3 2025 EARNINGS REPORT Third Quarter and Nine Months 2025 Financial Results 9 Change 9M 2024 9M 2025 Change 3Q 2024 3Q 2025 $0.08 $1.52 $1.60 $0.01 $0.49 $0.50 Electric Transmission 0.08 1.47 1.55 0.03 0.57 0.60 Electric Distribution 0.11 0.53 0.64 0.04 (0.09) (0.05) Natural Gas Distribution 0.00 0.10 0.10 (0.02) 0.07 0.05 Water Distribution (0.19) (0.06) (0.25) 0.00 0.09 0.09 Parent & Other (Non - GAAP) $0.08 $3.56 $3.64 $0.06 $1.13 $1.19 EPS (Non - GAAP) 1.28 (1.48) (0.20) 1.26 (1.46) (0.20) Losses on Offshore Wind Investments $1.36 $2.08 $3.44 $1.32 $(0.33) $0.99 Reported EPS (GAAP)
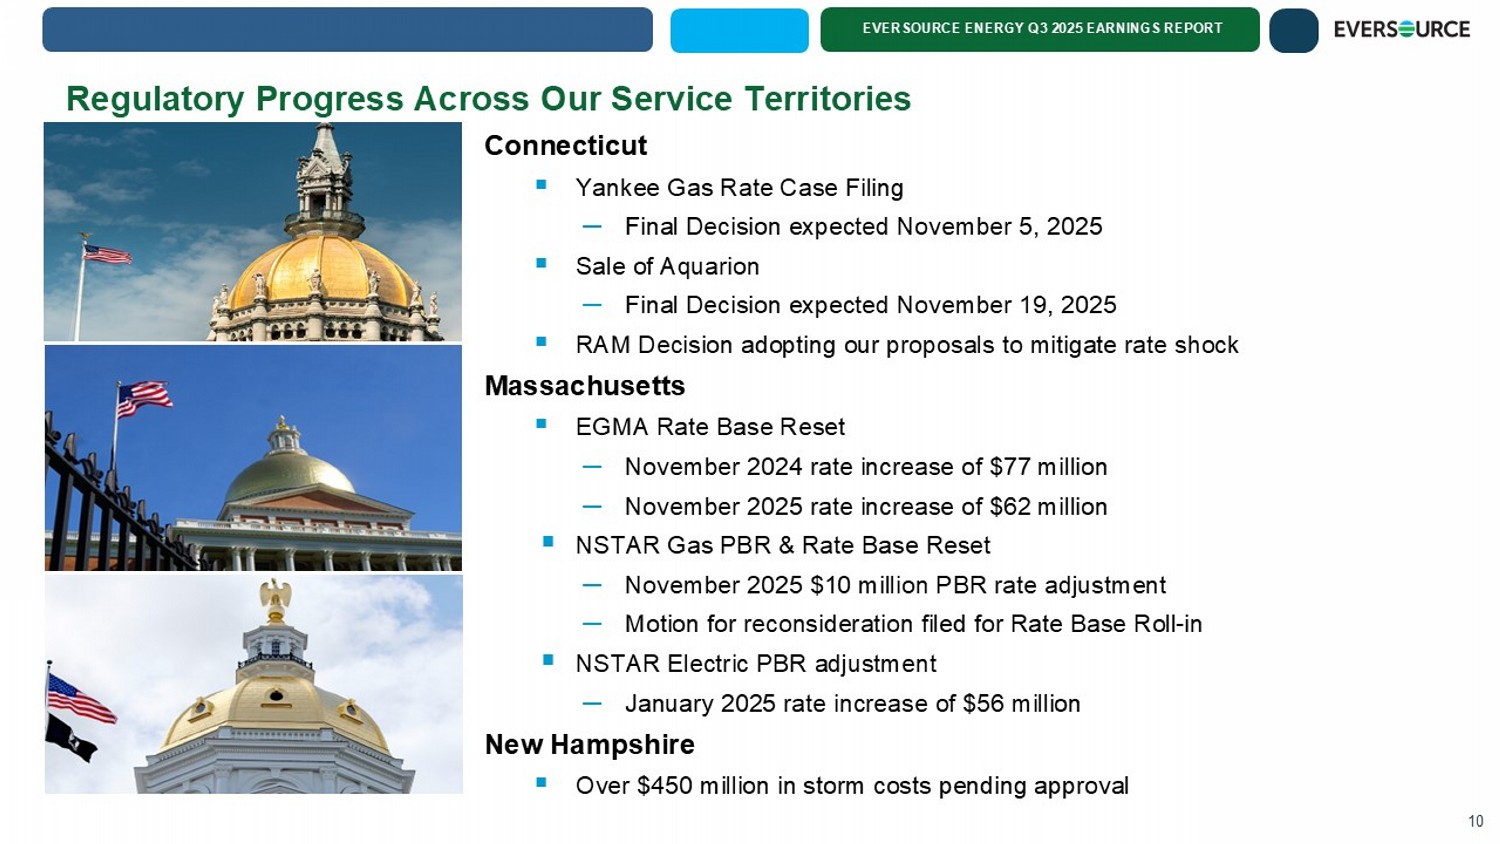
EVERSOURCE ENERGY Q3 2025 EARNINGS REPORT Regulatory Progress Across Our Service Territories Connecticut ▪ Yankee Gas Rate Case Filing – Final Decision expected November 5, 2025 ▪ Sale of Aquarion – Final Decision expected November 19, 2025 ▪ RAM Decision adopting our proposals to mitigate rate shock Massachusetts ▪ EGMA Rate Base Reset – November 2024 rate increase of $77 million – November 2025 rate increase of $62 million ▪ NSTAR Gas PBR & Rate Base Reset – November 2025 $10 million PBR rate adjustment – Motion for reconsideration filed for Rate Base Roll - in ▪ NSTAR Electric PBR adjustment – January 2025 rate increase of $56 million New Hampshire ▪ Over $450 million in storm costs pending approval 10
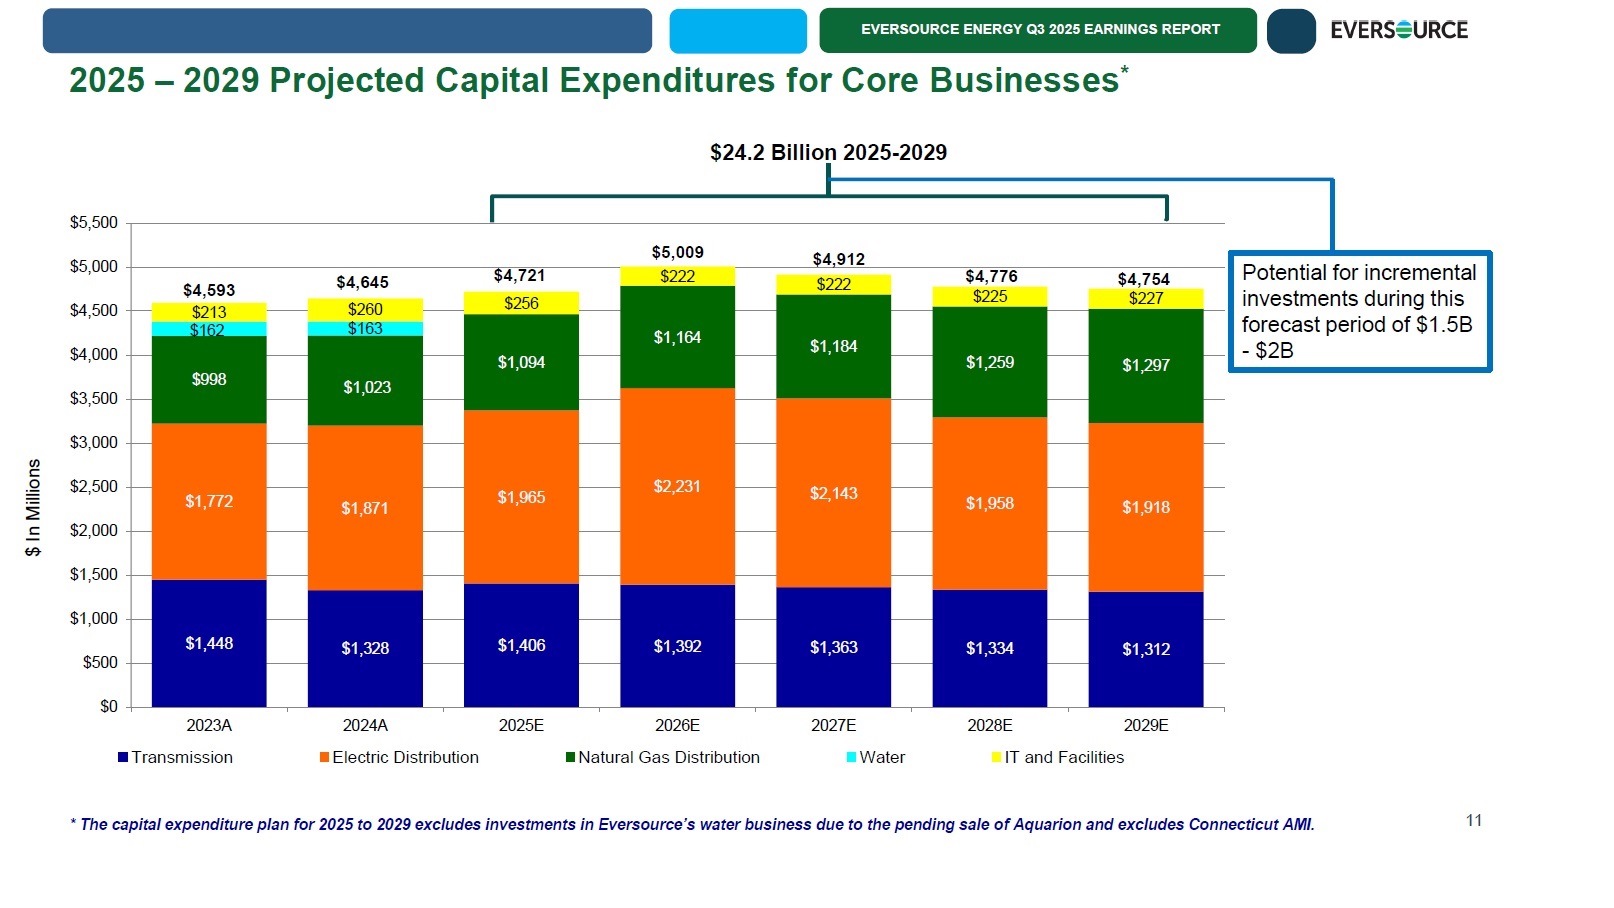
EVERSOURCE ENERGY Q3 2025 EARNINGS REPORT $1,448 $1,328 $1,406 $1,392 $1,363 $1,334 $1,312 $1,772 $1,871 $1,965 $2,231 $2,143 $1,958 $1,918 $998 $1,023 $1,094 $1,164 $1,184 $1,259 $1,297 $162 $163 $213 $260 $256 $222 $222 $225 $227 $4,593 $4,645 $4,721 $5,009 $4,912 $4,776 $4,754 $0 $500 $1,000 $1,500 $2,000 $2,500 $3,000 $3,500 $4,000 $4,500 $5,000 $5,500 2023A 2024A 2025E 2026E 2027E 2028E 2029E Transmission Electric Distribution Natural Gas Distribution Water IT and Facilities $ In Millions $24.2 Billion 2025 - 2029 2025 – 2029 Projected Capital Expenditures for Core Businesses * 11 * The capital expenditure plan for 2025 to 2029 excludes investments in Eversource’s water business due to the pending sale o f A quarion and excludes Connecticut AMI. Potential for incremental investments during this forecast period of $1.5B - $2B
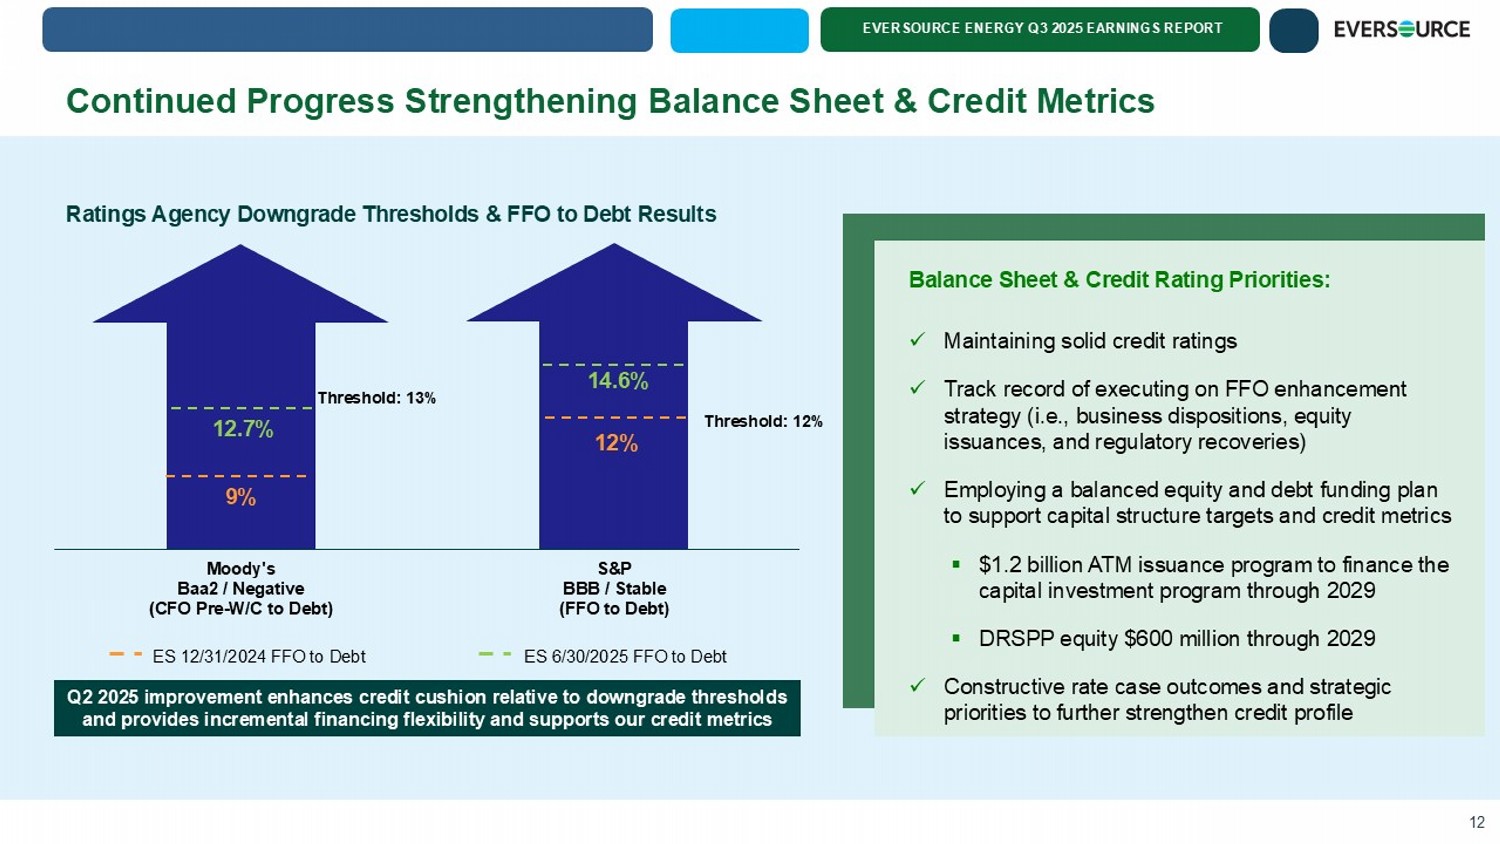
EVERSOURCE ENERGY Q3 2025 EARNINGS REPORT Continued Progress Strengthening Balance Sheet & Credit Metrics Ratings Agency Downgrade Thresholds & FFO to Debt Results Q2 2025 improvement enhances credit cushion relative to downgrade thresholds and provides incremental financing flexibility and supports our credit metric s Moody's Baa2 / Negative (CFO Pre-W/C to Debt) S&P BBB / Stable (FFO to Debt) 9% 12% ES 12/31/2024 FFO to Debt Balance Sheet & Credit Rating Priorities: x Maintaining solid credit ratings x Track record of executing on FFO enhancement strategy (i.e., business dispositions, equity issuances, and regulatory recoveries) x Employing a balanced equity and debt funding plan to support capital structure targets and credit metrics ▪ $1.2 billion ATM issuance program to finance the capital investment program through 2029 ▪ DRSPP equity $600 million through 2029 x Constructive rate case outcomes and strategic priorities to further strengthen credit profile 12 12.7% ES 6/30/2025 FFO to Debt 14.6% Threshold: 13% Threshold: 12%
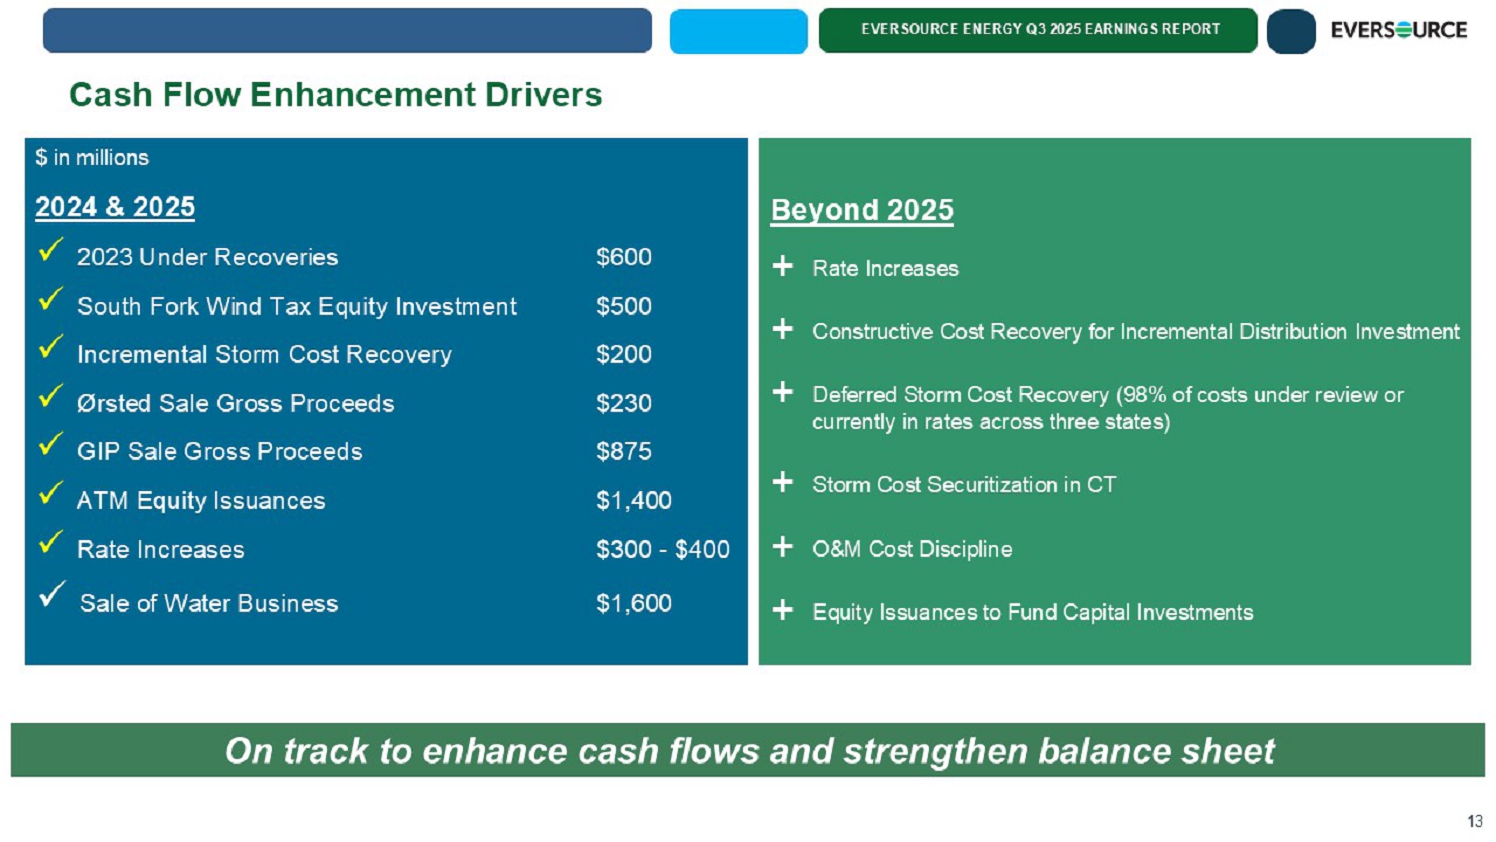
EVERSOURCE ENERGY Q3 2025 EARNINGS REPORT Cash Flow Enhancement Drivers 13 $ in millions 2024 & 2025 x 2023 Under Recoveries $600 x South Fork Wind Tax Equity Investment $500 x Incremental Storm Cost Recovery $200 x Ørsted Sale Gross Proceeds $230 x GIP Sale Gross Proceeds $875 x ATM Equity Issuances $1,200 x Rate Increases $300 - $400 Sale of Water Business $1,600 Beyond 2025 Rate Increases Constructive Cost Recovery for Incremental Distribution Investment Deferred Storm Cost Recovery (98% of costs under review or currently in rates across three states) Storm Cost Securitization in CT O&M Cost Discipline Equity Issuances to Fund Capital Investments On track to enhance cash flows and strengthen balance sheet
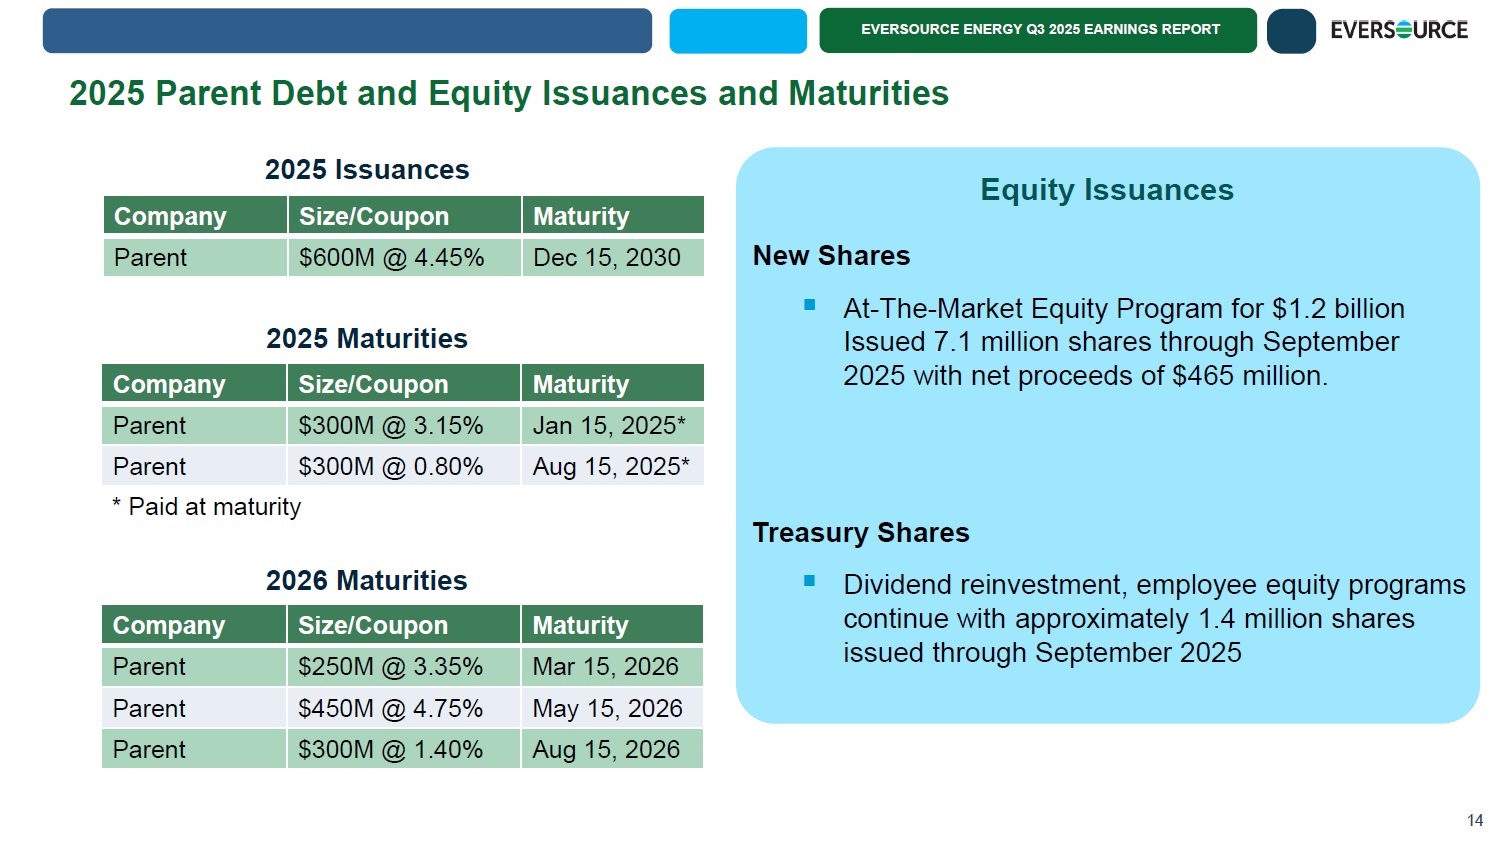
EVERSOURCE ENERGY Q3 2025 EARNINGS REPORT 2025 Parent Debt and Equity Issuances and Maturities 14 New Shares ▪ At - The - Market Equity Program for $1.2 billion Issued 7.1 million shares through September 2025 with net proceeds of $465 million. Treasury Shares ▪ Dividend reinvestment, employee equity programs continue with approximately 1.4 million shares issued through September 2025 Equity Issuances 2025 Maturities Maturity Size/Coupon Company Jan 15, 2025* $300M @ 3.15% Parent Aug 15, 2025* $300M @ 0.80% Parent * Paid at maturity 2026 Maturities Maturity Size/Coupon Company Mar 15, 2026 $250M @ 3.35% Parent May 15, 2026 $450M @ 4.75% Parent Aug 15, 2026 $300M @ 1.40% Parent 2025 Issuances Maturity Size/Coupon Company Dec 15, 2030 $600M @ 4.45% Parent
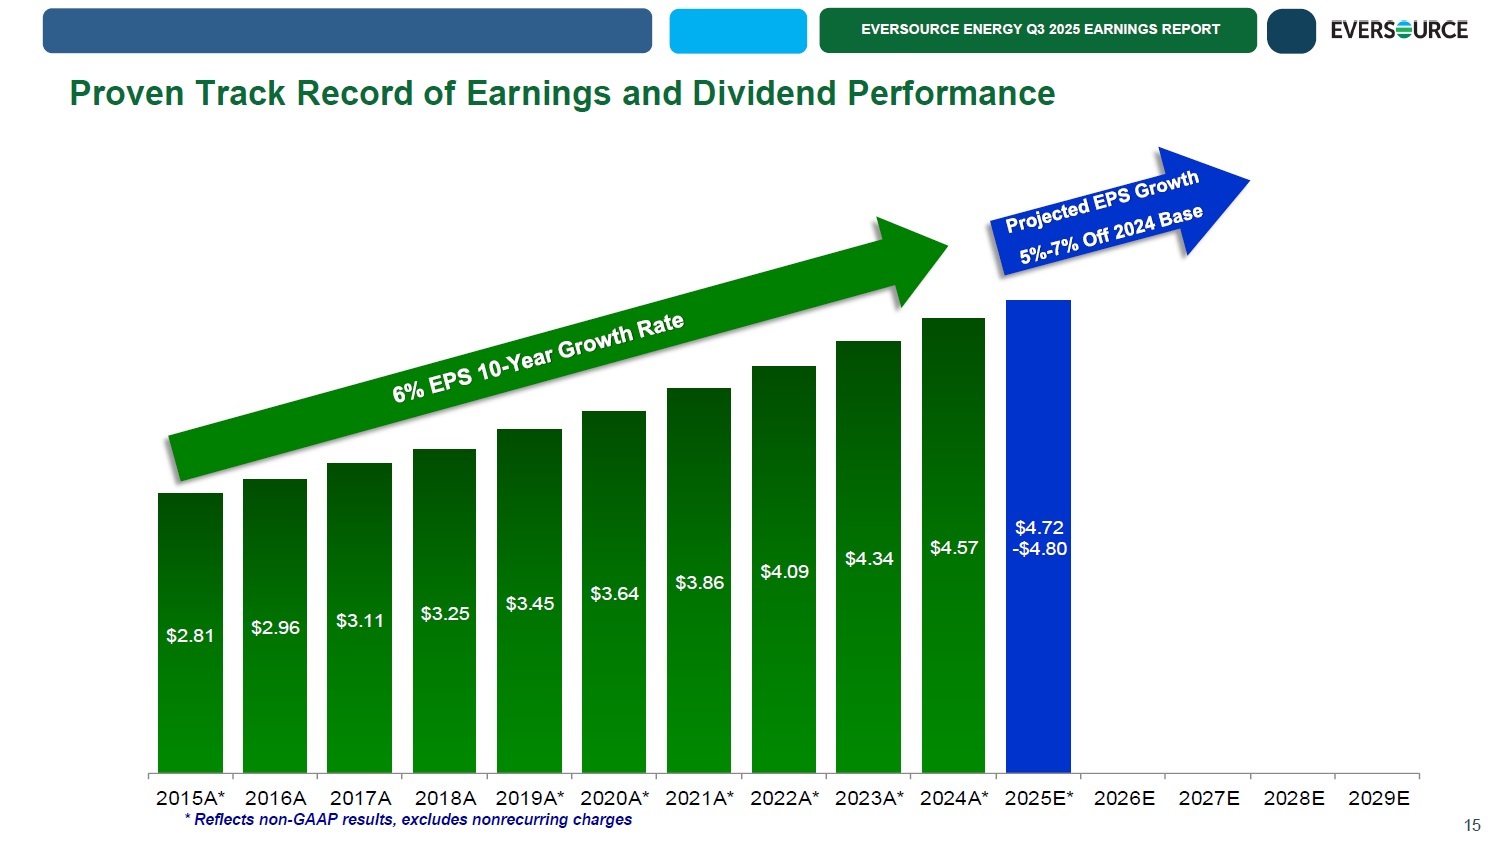
EVERSOURCE ENERGY Q3 2025 EARNINGS REPORT $2.81 $2.96 $3.11 $3.25 $3.45 $3.64 $3.86 $4.09 $4.34 $4.57 $4.72 - $4.80 2015A* 2016A 2017A 2018A 2019A* 2020A* 2021A* 2022A* 2023A* 2024A* 2025E* 2026E 2027E 2028E 2029E * Reflects non - GAAP results, excludes nonrecurring charges 15 Proven Track Record of Earnings and Dividend Performance
EVERSOURCE ENERGY Q3 2025 EARNINGS REPORT EVERSOURCE ENERGY Q3 2025 EARNINGS REPORT Q&A 16
EVERSOURCE ENERGY Q3 2025 EARNINGS REPORT APPENDIX 17

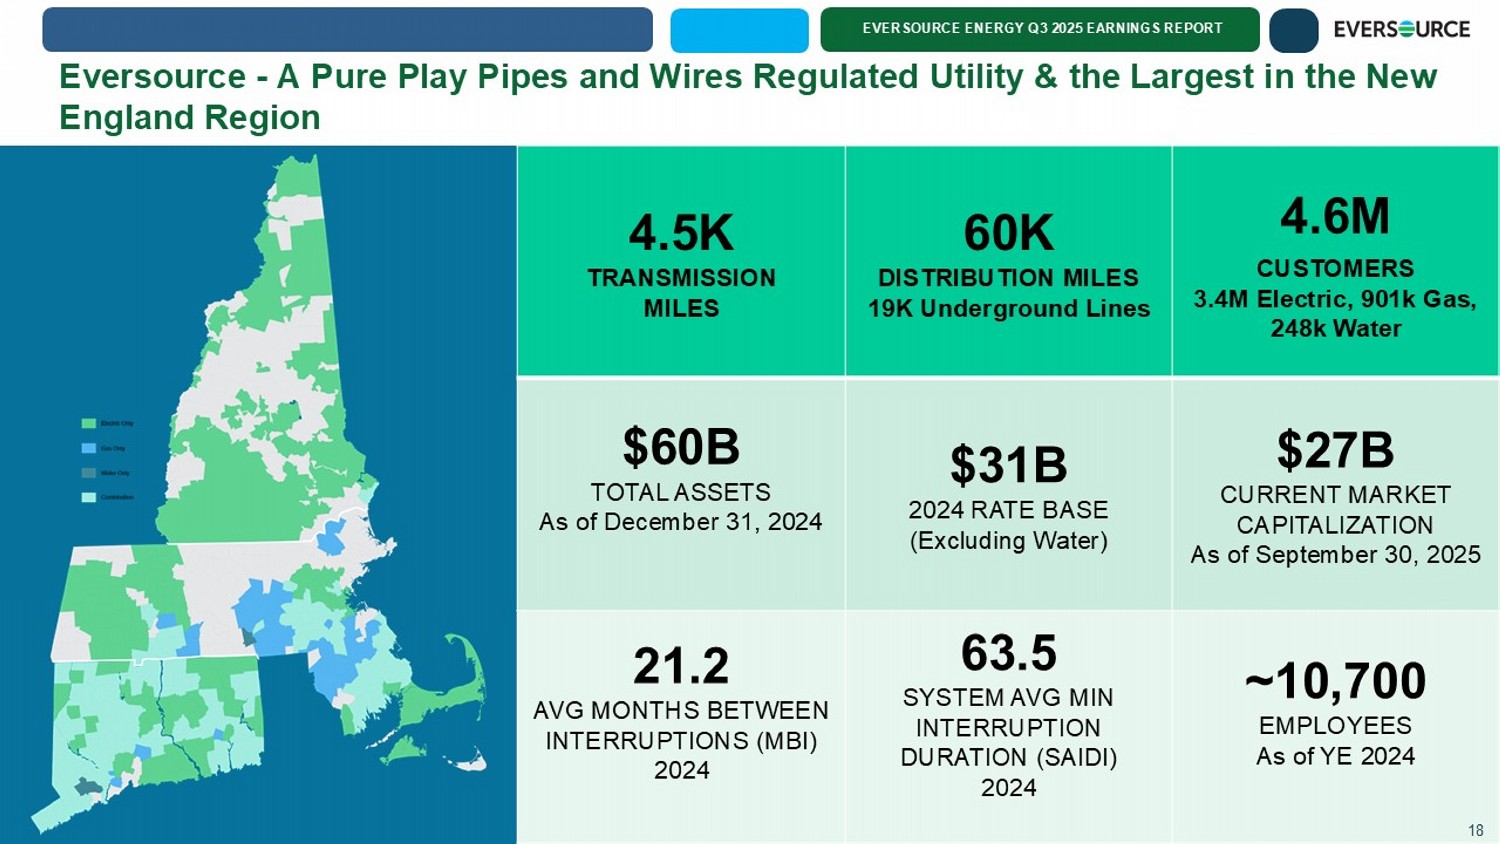
EVERSOURCE ENERGY Q3 2025 EARNINGS REPORT Eversource - A Pure Play Pipes and Wires Regulated Utility & the Largest in the New England Region 18 4.6M CUSTOMERS 3.4M Electric, 901k Gas, 248k Water 60K DISTRIBUTION MILES 19K Underground Lines 4.5K TRANSMISSION MILES $27B CURRENT MARKET CAPITALIZATION As of September 30, 2025 $31B 2024 RATE BASE (Excluding Water) $60B TOTAL ASSETS As of December 31, 2024 ~10,700 EMPLOYEES As of YE 2024 63.5 SYSTEM AVG MIN INTERRUPTION DURATION (SAIDI) 2024 21.2 AVG MONTHS BETWEEN INTERRUPTIONS (MBI) 2024 18
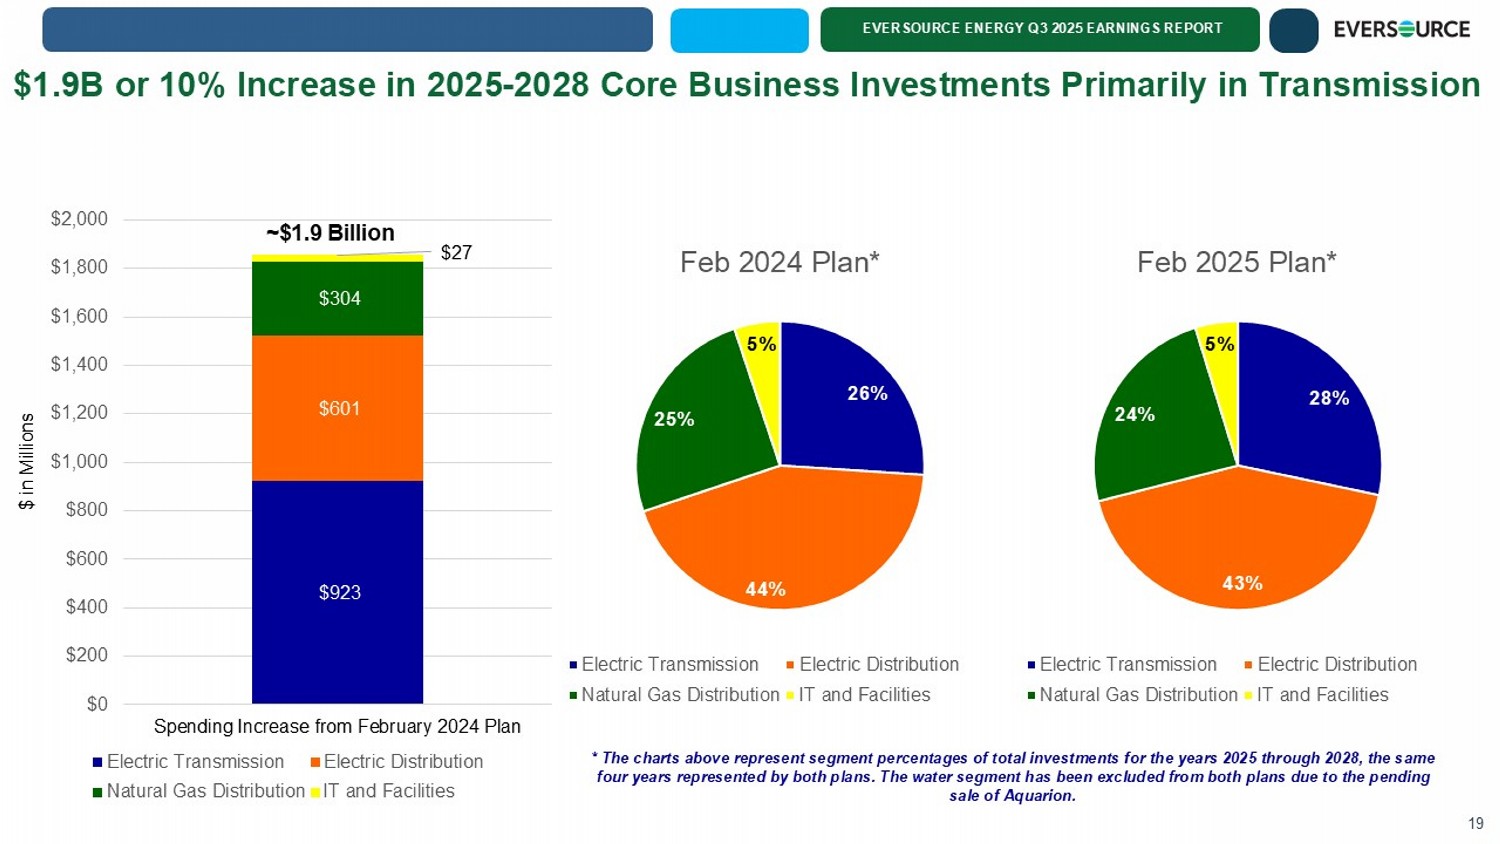
EVERSOURCE ENERGY Q3 2025 EARNINGS REPORT $ in Millions $1.9B or 10% Increase in 2025 - 2028 Core Business Investments Primarily in Transmission 19 26% 44% 25% 5% Feb 2024 Plan* Electric Transmission Electric Distribution Natural Gas Distribution IT and Facilities 28% 43% 24% 5% Feb 2025 Plan* Electric Transmission Electric Distribution Natural Gas Distribution IT and Facilities $923 $601 $304 $27 $0 $200 $400 $600 $800 $1,000 $1,200 $1,400 $1,600 $1,800 $2,000 Spending Increase from February 2024 Plan Electric Transmission Electric Distribution Natural Gas Distribution IT and Facilities ~$1.9 Billion * The charts above represent segment percentages of total investments for the years 2025 through 2028, the same four years represented by both plans. The water segment has been excluded from both plans due to the pending sale of Aquarion.
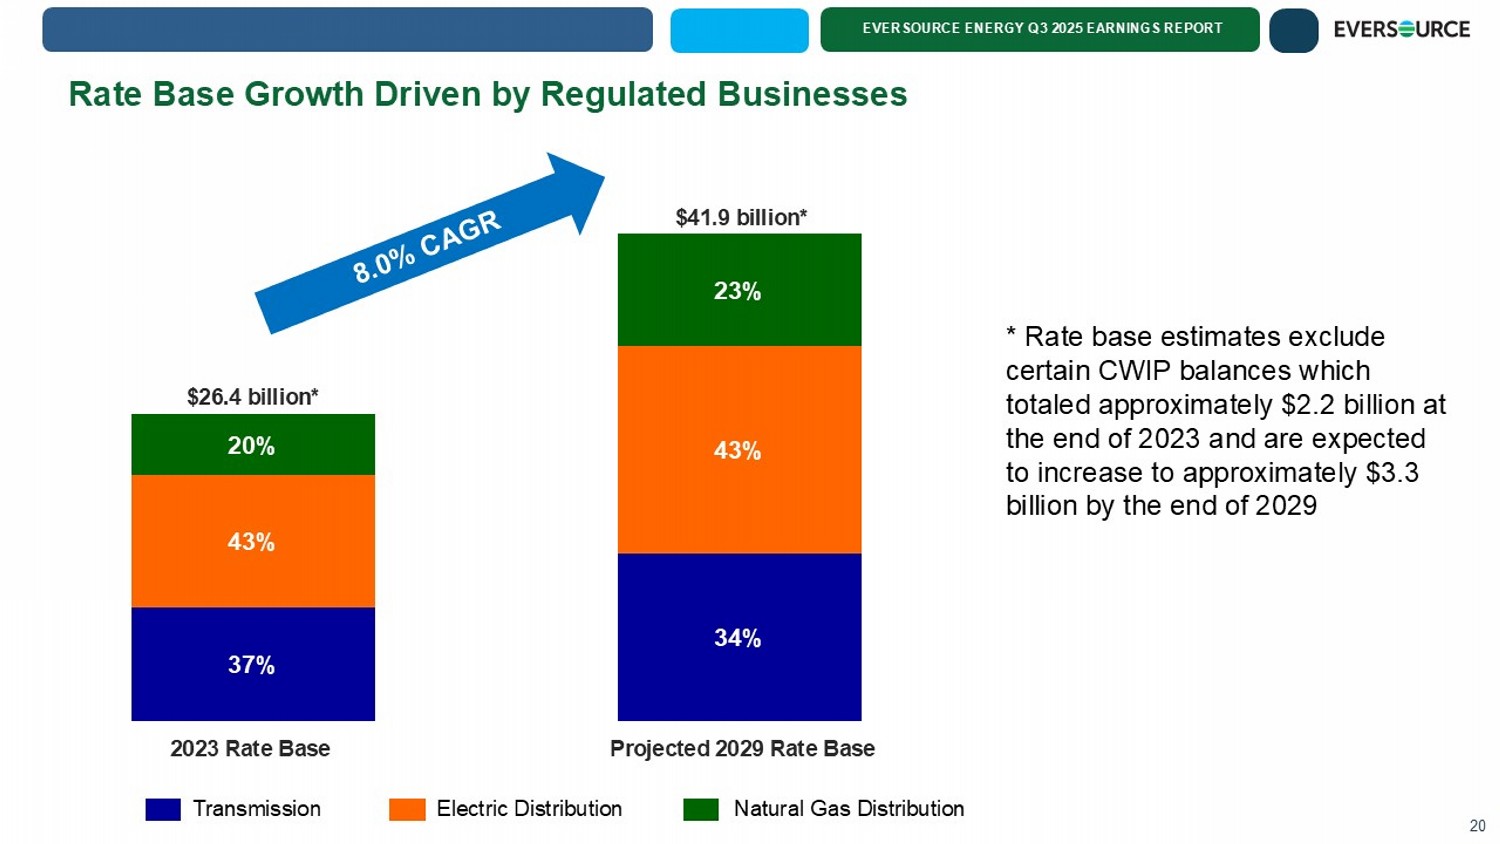
EVERSOURCE ENERGY Q3 2025 EARNINGS REPORT 37% 34% 43% 43% 20% 23% 2023 Rate Base Projected 2029 Rate Base $26.4 billion* $41.9 billion* * Rate base estimates exclude certain CWIP balances which totaled approximately $2.2 billion at the end of 2023 and are expected to increase to approximately $3.3 billion by the end of 2029 Rate Base Growth Driven by Regulated Businesses 20 Transmission Electric Distribution Natural Gas Distribution
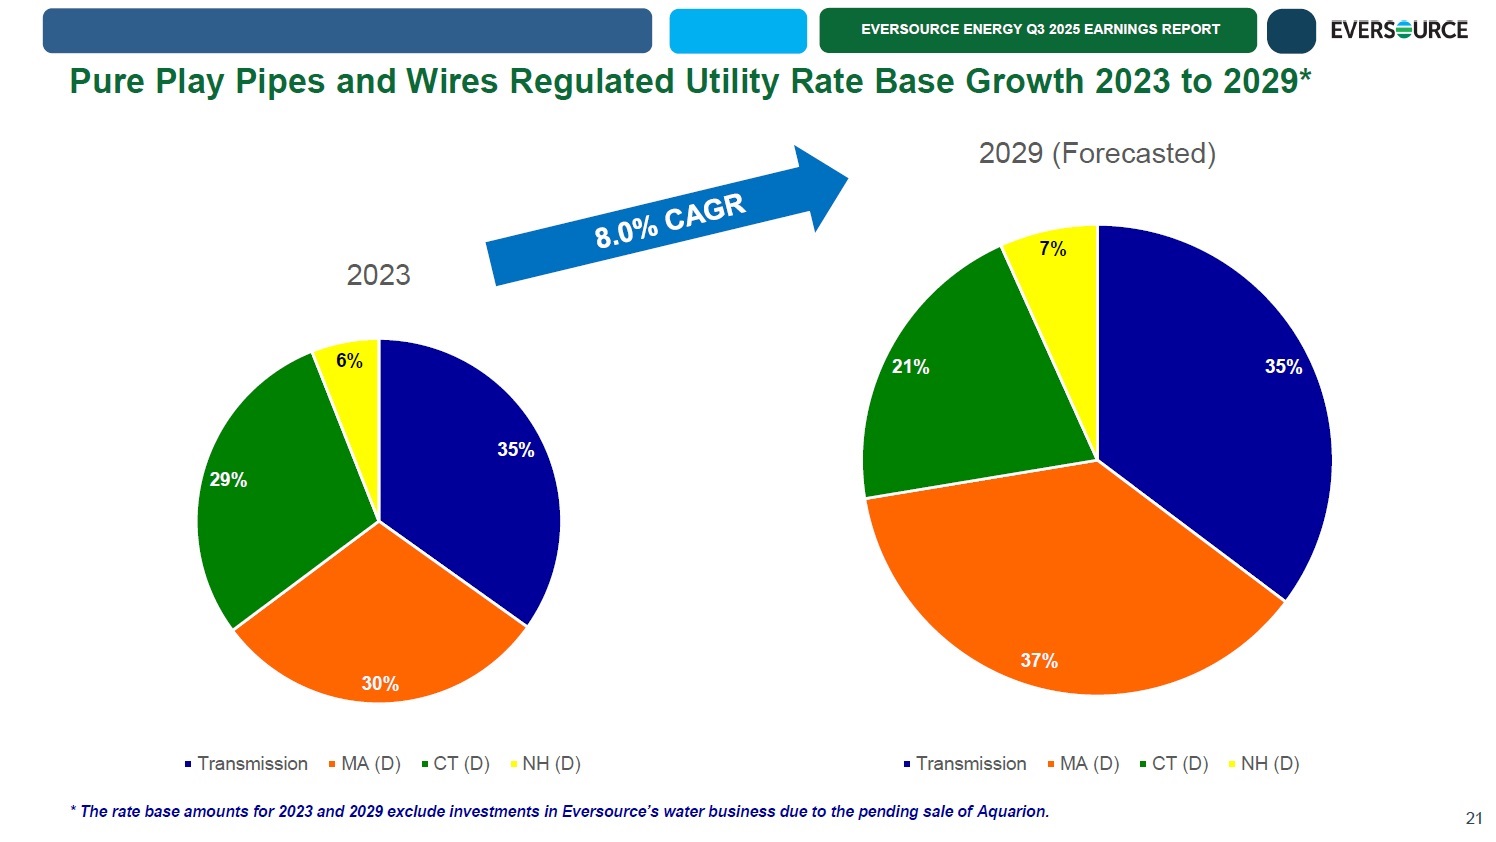
EVERSOURCE ENERGY Q3 2025 EARNINGS REPORT Pure Play Pipes and Wires Regulated Utility Rate Base Growth 2023 to 2029* 21 35% 30% 29% 6% 2023 Transmission MA (D) CT (D) NH (D) 35% 37% 21% 7% 2029 (Forecasted) Transmission MA (D) CT (D) NH (D) * The rate base amounts for 2023 and 2029 exclude investments in Eversource’s water business due to the pending sale of Aquarion .
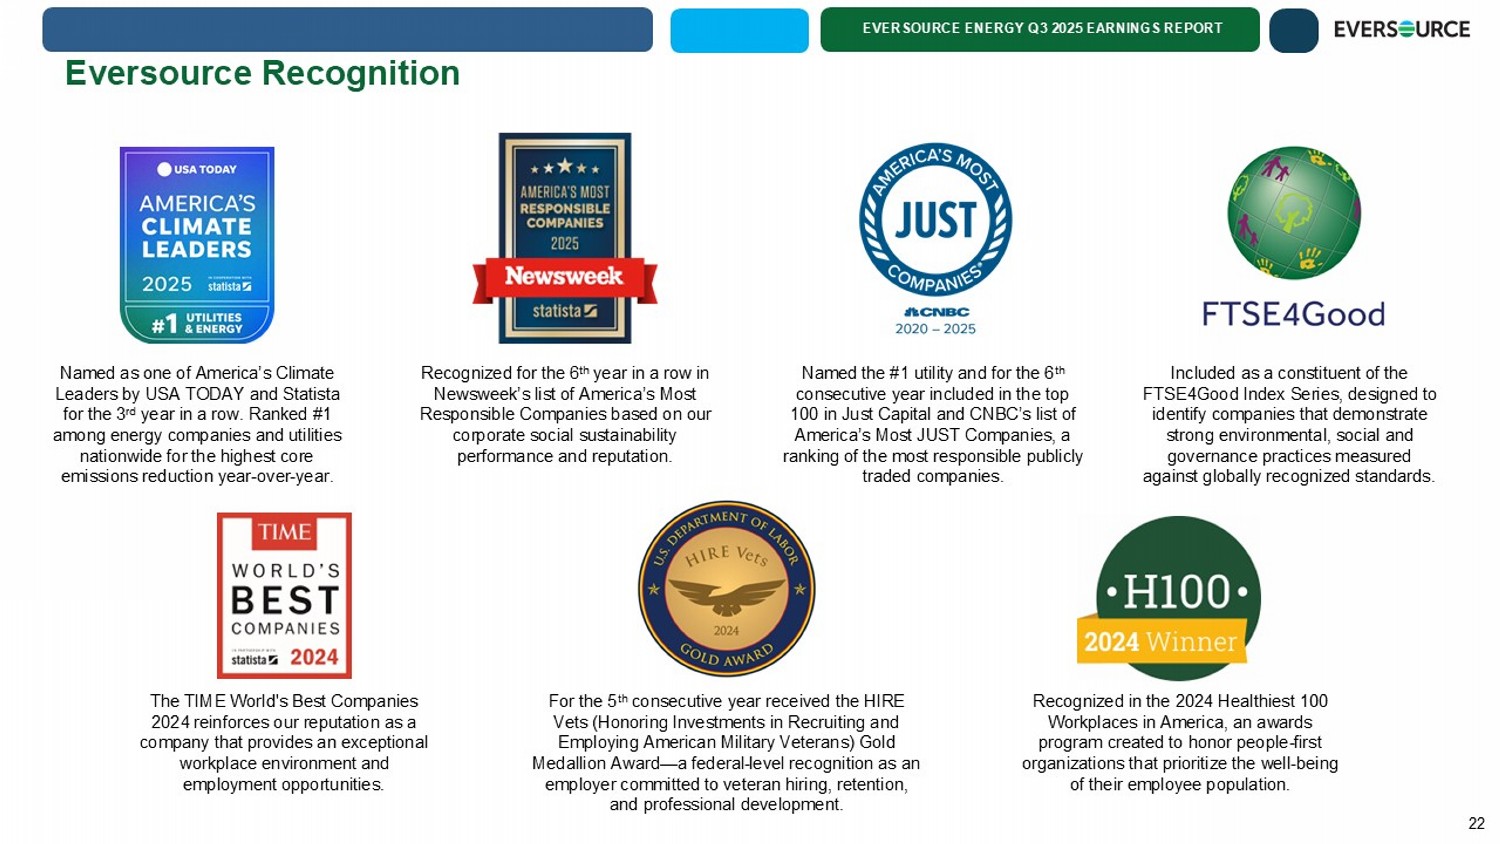
EVERSOURCE ENERGY Q3 2025 EARNINGS REPORT Eversource Recognition For the 5 th consecutive year received the HIRE Vets (Honoring Investments in Recruiting and Employing American Military Veterans) Gold Medallion Award — a federal - level recognition as an employer committed to veteran hiring, retention, and professional development. Named as one of America’s Climate Leaders by USA TODAY and Statista for the 3 rd year in a row. Ranked #1 among energy companies and utilities nationwide for the highest core emissions reduction year - over - year. Recognized for the 6 th year in a row in Newsweek’s list of America’s Most Responsible Companies based on our corporate social sustainability performance and reputation. Named the #1 utility and for the 6 th consecutive year included in the top 100 in Just Capital and CNBC’s list of America’s Most JUST Companies, a ranking of the most responsible publicly traded companies. The TIME World's Best Companies 2024 reinforces our reputation as a company that provides an exceptional workplace environment and employment opportunities. Included as a constituent of the FTSE4Good Index Series, designed to identify companies that demonstrate strong environmental, social and governance practices measured against globally recognized standards. Recognized in the 2024 Healthiest 100 Workplaces in America, an awards program created to honor people - first organizations that prioritize the well - being of their employee population. 22
EVERSOURCE ENERGY Q3 2025 EARNINGS REPORT Eversource Recognition For the 5 th consecutive year received the HIRE Vets (Honoring Investments in Recruiting and Employing American Military Veterans) Gold Medallion Award — a federal - level recognition as an employer committed to veteran hiring, retention, and professional development. Named as one of America’s Climate Leaders by USA TODAY and Statista for the 3 rd year in a row. Ranked #1 among energy companies and utilities nationwide for the highest core emissions reduction year - over - year. Recognized for the 6 th year in a row in Newsweek’s list of America’s Most Responsible Companies based on our corporate social sustainability performance and reputation. Named the #1 utility and for the 6 th consecutive year included in the top 100 in Just Capital and CNBC’s list of America’s Most JUST Companies, a ranking of the most responsible publicly traded companies. The TIME World's Best Companies 2024 reinforces our reputation as a company that provides an exceptional workplace environment and employment opportunities. Included as a constituent of the FTSE4Good Index Series, designed to identify companies that demonstrate strong environmental, social and governance practices measured against globally recognized standards. Recognized in the 2024 Healthiest 100 Workplaces in America, an awards program created to honor people - first organizations that prioritize the well - being of their employee population. 22