.3
Q1 2026 EARNINGS REPORT May 7, 2026 MAY 7, 2026 Eversource Energy Q1 2026 Earnings Report
Q1 2026 EARNINGS REPORT May 7, 2026 Safe Harbor Statement 1 All per - share amounts in this presentation are reported on a diluted basis. The only common equity securities that are publicly traded are common shares of Eversource Energy. The earnings discussion includes financial measures that are not recognized under generally accepted accounting principles (non - GAAP) referencing first quarter 2026 earnings and EPS exc luding a charge for the March 2026 FERC decision in the FERC base ROE complaints. EPS by business is also a non - GAAP financial measure and is calculated by dividing the net income attributable to common shareholders of each busin ess by the weighted average diluted Eversource Energy common shares outstanding for the period. The earnings and EPS of each business do not represent a direct legal interest in the assets and liabilities of such business , b ut rather represent a direct interest in Eversource Energy’s assets and liabilities as a whole. Eversource Energy uses these non - GAAP financial measures to evaluate and provide details of earnings results by business and to more fully compare and explain results without including these items. This information is among the primary indicators management uses as a basis for evaluating performance and planning and forecasting of future periods. Management believes the im pact of the FERC ROE refund charge is not indicative of Eversource Energy's ongoing costs and performance. Management views this charge as not directly related to the ongoing operations of the business and therefore not an indicator of baseline operating performance. Due to the nature and significance of the effect of this item on net income attributable to common shareholders and EPS, management believes that the non - GAAP presentation is a more mea ningful representation of Eversource Energy's financial performance and provides additional and useful information to readers of this report in analyzing historical and future performance of the business. These non - GAAP fina ncial measures should not be considered as alternatives to reported net income attributable to common shareholders or EPS determined in accordance with GAAP as indicators of Eversource Energy's operating performance. Eversource Energy does not provide a reconciliation of guidance from non - GAAP recurring EPS to the most directly comparable GAAP measure of EPS because we are not able to predict with reasonable certainty the amount or nature of all items that will be included in our Net Income Attributable to Common Shareholders or non - GAAP recurring earnings for the year ending December 31, 2026. These items are uncertain, depend on many factors and could have a material impact on our Net Income Attributable to Common Shareholders and non - GAAP recurring earnings for the year ending Decemb er 31, 2026, and therefore cannot be made available without unreasonable effort. This document includes statements concerning Eversource Energy’s expectations, beliefs, plans, objectives, goals, strategies, as sumptions of future events, future financial performance or growth and other statements that are not historical facts. These statements are “forward - looking statements” within the meaning of the U. S. federal securities laws. Gen erally, readers can identify these forward - looking statements through the use of words or phrases such as “estimate,” “expect,” “pending,” “anticipate,” “intend,” “plan,” “project,” “believe,” “forecast,” “would,” “should,” “could” an d other similar expressions. Forward - looking statements involve risks and uncertainties that may cause actual results or outcomes to differ materially from those included in the forward - looking statements. Forward - looking statements are b ased on the current expectations, estimates, assumptions or projections of management and are not guarantees of future performance. These expectations, estimates, assumptions or projections may vary materially from actual r esu lts. Accordingly, any such statements are qualified in their entirety by reference to, and are accompanied by, the following important factors that may cause our actual results or outcomes to differ materially from those contained i n o ur forward - looking statements, including, but not limited to cyber events or breaches, including acts of war or terrorism, affecting our systems or the systems of third parties on which we rely; unauthorized access to, and the misapprop riation of, confidential and proprietary Company, customer, employee, financial or system operating information; actions or inaction of local, state and federal regulatory, public policy and taxing bodies; changes in laws, re gul ations, Presidential executive orders or regulatory policy, including compliance with laws and regulations, which may impact the cost of compliance and strategic initiatives of the Company; adverse publicity, which can harm our reput ati on, influence legislative and regulatory bodies, and result in unfavorable outcomes; variability in the costs and final investment returns of the Revolution Wind and South Fork Wind offshore wind projects as it relates to the purchase pri ce post - closing adjustment under the terms of the sale agreement for these projects; the ability to qualify for investment tax credits; extreme weather, including severe storms, due to the impacts of climate change, and fluctuations in weather patterns; adequacy, contamination of, or disruption in, our water supplies; physical attacks or grid disturbances that may damage and disrupt our electric transmission and electric, natural gas, and water distribution systems; ab ility or inability to commence and complete our major strategic development projects and opportunities; breakdown, failure of, or damage to operating equipment, information technology systems, or processes of our transmission and di stribution systems; changes in levels or timing of capital expenditures, including unplanned expenditures and increased capital expenditure requirements; changes in business conditions, which could include disruptive t ech nology or development of alternative energy sources related to our current or future business model; substandard performance of third - party suppliers and service providers, or counterparties not meeting their obligations; limits on our access to, or increases in, the cost of capital, including disruptions in the capital markets or other events that make our access to necessary capital more difficult or costly; changes in economic conditions, including impact o n i nterest rates, tax policies, tariffs and customer demand and payment ability; changes in accounting standards and financial reporting regulations; actions of rating agencies; and other presently unknown or unforeseen factors. Other risk factors are detailed in Eversource Energy’s reports filed with the Securities and Exchange Commission (SEC). They are updated as necessary and available on Eversource Energy’s website at investors.eversource.com and on the SEC’s website at www.sec.gov , and management encourages you to consult such disclosures. All such factors are difficult to predict and contain uncertainties that may materially affect Eversource Energy’s actual res ult s, many of which are beyond our control. You should not place undue reliance on the forward - looking statements, as each speaks only as of the date on which such statement is made, and, except as required by federal securities la ws, Eversource Energy undertakes no obligation to update any forward - looking statement or statements to reflect events or circumstances after the date on which such statement is made or to reflect the occurrence of unanticipat ed events.
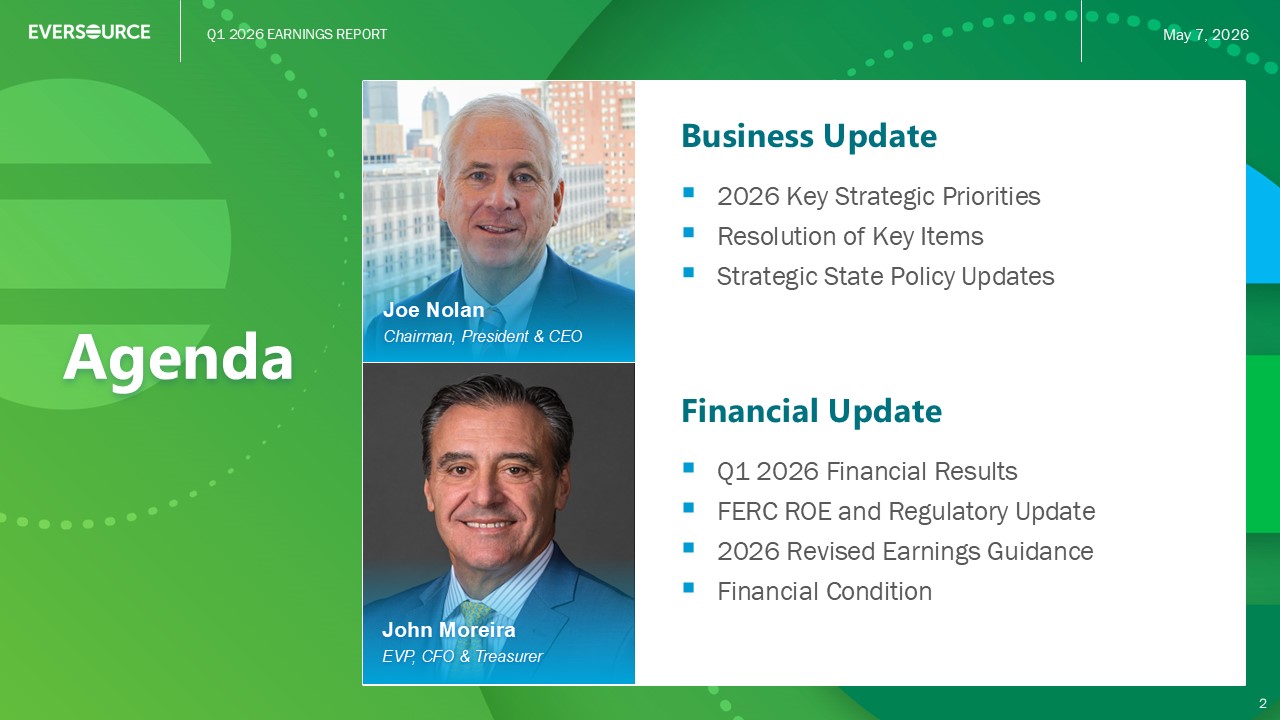
Q1 2026 EARNINGS REPORT May 7, 2026 Agenda Business Update ▪ 2026 Key Strategic Priorities ▪ Resolution of Key Items ▪ Strategic State Policy Updates 2 Joe Nolan Chairman, President & CEO Financial Update ▪ Q1 2026 Financial Results ▪ FERC ROE and Regulatory Update ▪ 2026 Revised Earnings Guidance ▪ Financial Condition John Moreira EVP, CFO & Treasurer

Q1 2026 EARNINGS REPORT May 7, 2026 Q1 2026 EARNINGS REPORT 3 CHAIRMAN, PRESIDENT & CHIEF EXECUTIVE OFFICER Joe Nolan Business Update
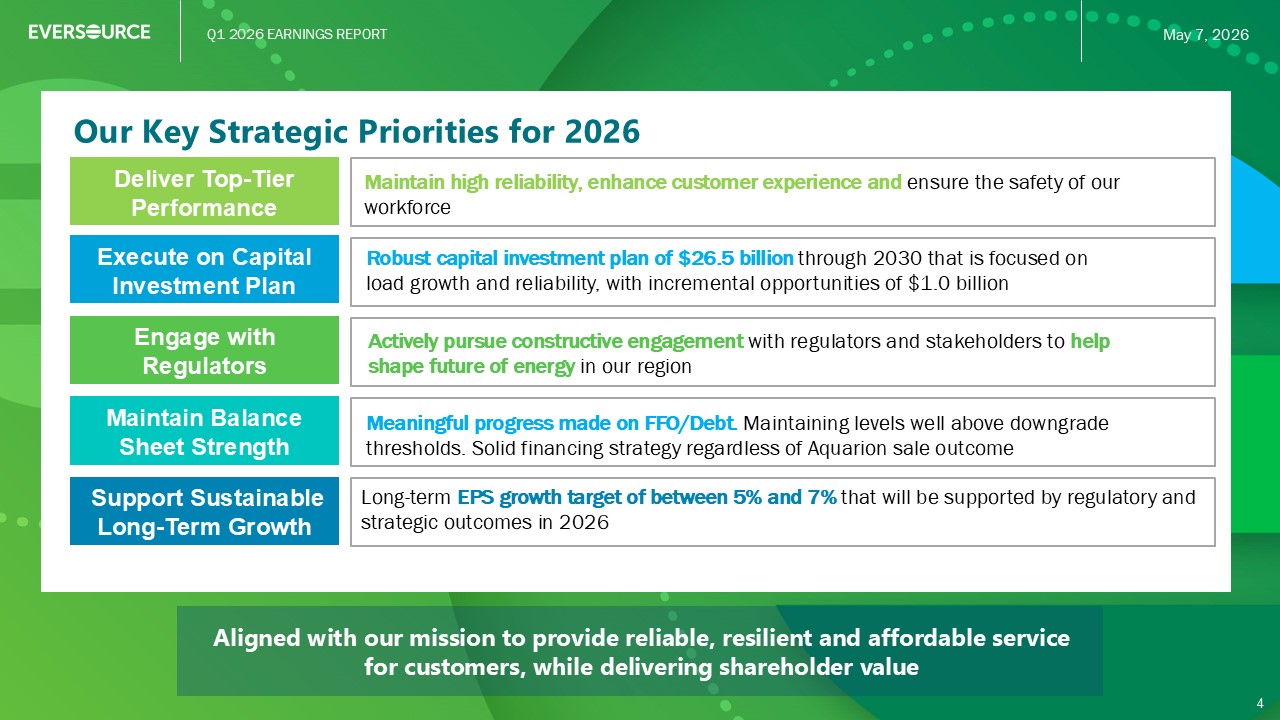
Q1 2026 EARNINGS REPORT May 7, 2026 Aligned with our mission to provide reliable, resilient and affordable service for customers, while delivering shareholder value Our Key Strategic Priorities for 2026 Long - term EPS growth target of between 5% and 7% that will be supported by regulatory and strategic outcomes in 2026 Execute on Capital Investment Plan Maintain Balance Sheet Strength Deliver Top - Tier Performance Robust capital investment plan of $26.5 billion through 2030 that is focused on load growth and reliability, with incremental opportunities of $1.0 billion Meaningful progress made on FFO/Debt. Maintaining levels well above downgrade thresholds. Solid financing strategy regardless of Aquarion sale outcome Maintain high reliability, enhance customer experience and ensure the safety of our workforce Engage with Regulators Actively pursue constructive engagement with regulators and stakeholders to help shape future of energy in our region Support Sustainable Long - Term Growth 4
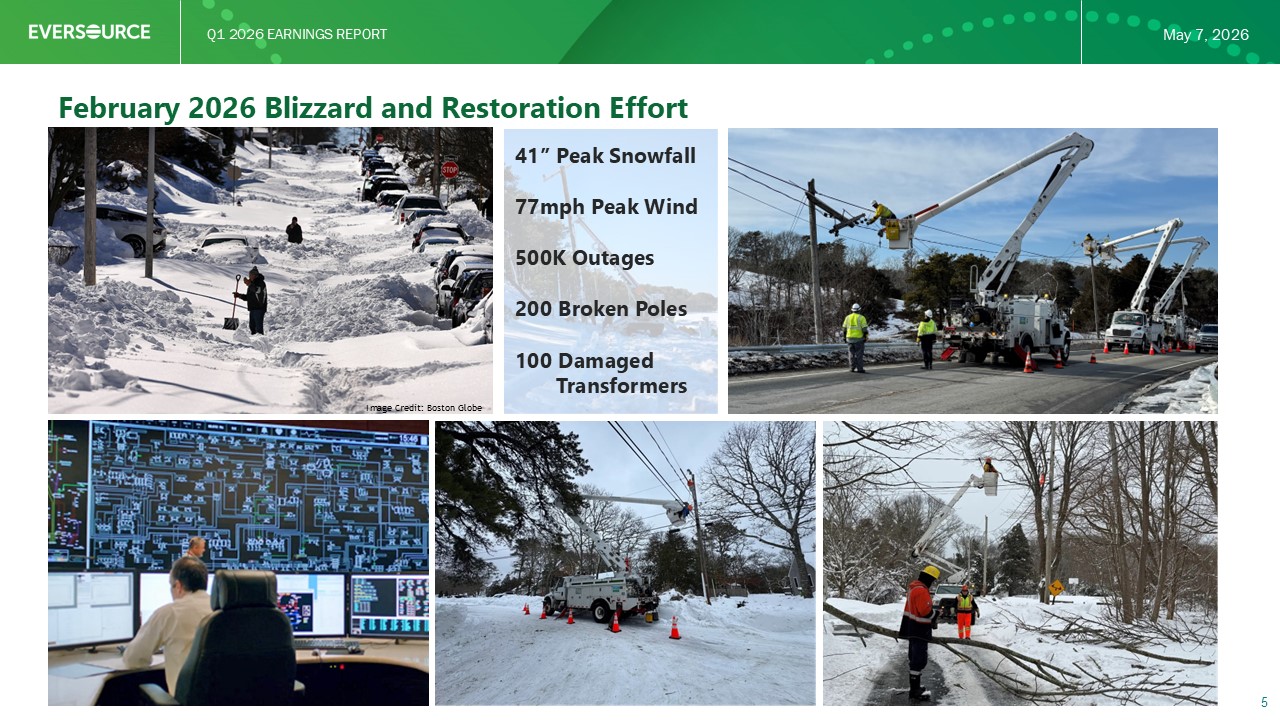
Q1 2026 EARNINGS REPORT May 7, 2026 February 2026 Blizzard and Restoration Effort 5 41” Peak Snowfall 77mph Peak Wind 500K Outages 200 Broken Poles 100 Damaged Transformers Image Credit: Boston Globe
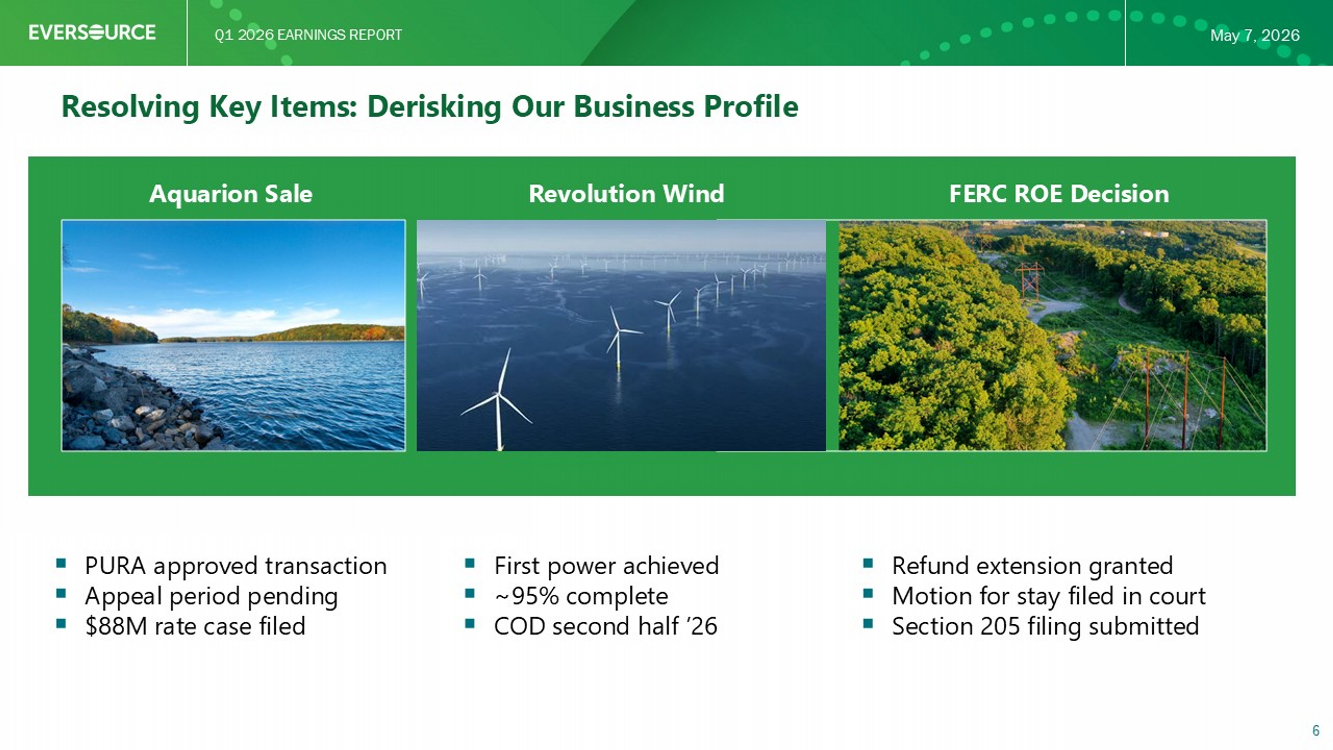
Q1 2026 EARNINGS REPORT May 7, 2026 Resolving Key Items: Derisking Our Business Profile 6 Aquarion Sale Revolution Wind FERC ROE Decision ▪ First power achieved ▪ ~95% complete ▪ Second Half ’26 COD ▪ PURA approved transaction ▪ Appeal period pending ▪ $88M rate case filed ▪ Refund extension granted ▪ Motion for stay filed in court ▪ Section 205 filing submitted
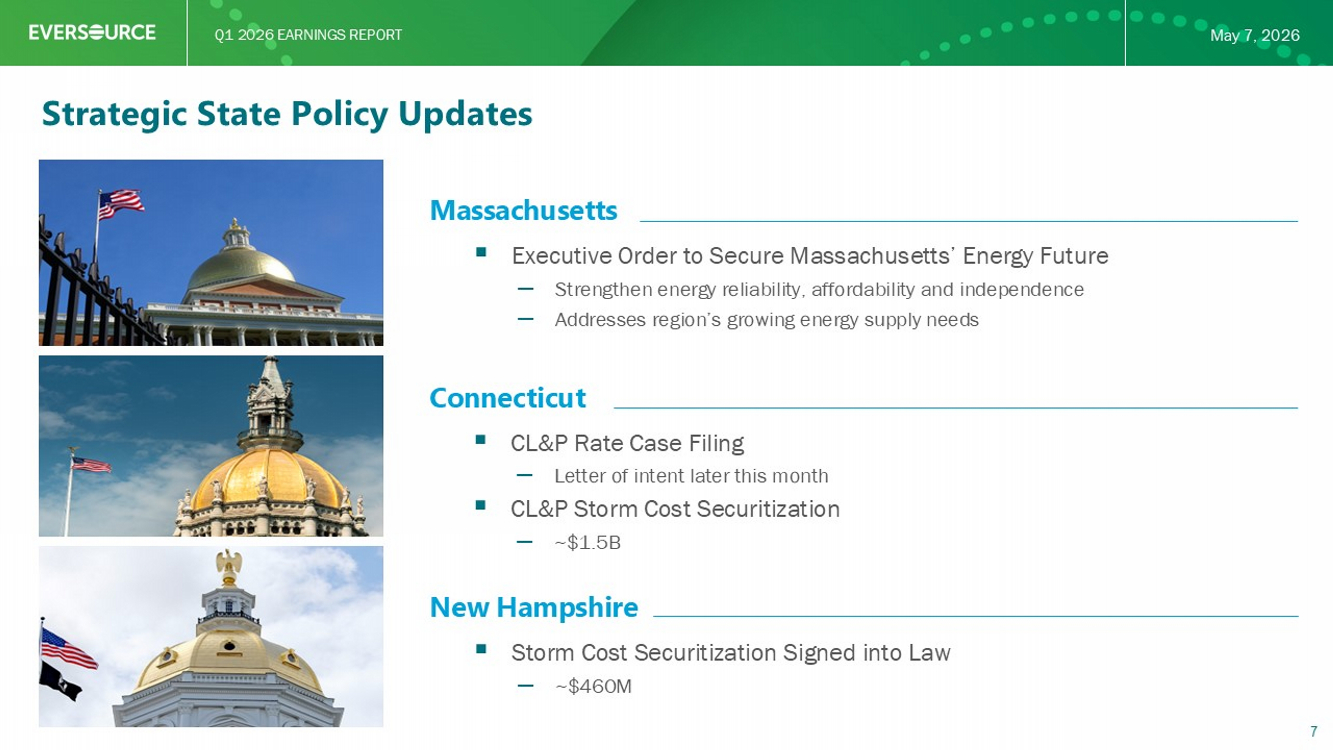
Q1 2026 EARNINGS REPORT May 7, 2026 Strategic State Policy Updates Massachusetts ▪ Executive Order to Secure Massachusetts’ Energy Future – Strengthen energy reliability, affordability and independence – Addresses region’s growing energy supply needs Connecticut ▪ CL&P Rate Case Filing – Letter of intent to be filed soon ▪ CL&P Storm Cost Securitization – ~$1.5B New Hampshire ▪ Storm Cost Securitization Signed into Law – ~$460M 7

Q1 2026 EARNINGS REPORT May 7, 2026 Q1 2026 EARNINGS REPORT 8 EXECUTIVE VICE PRESIDENT, CHIEF FINANCIAL OFFICER & TREASURER John Moreira Financial Update
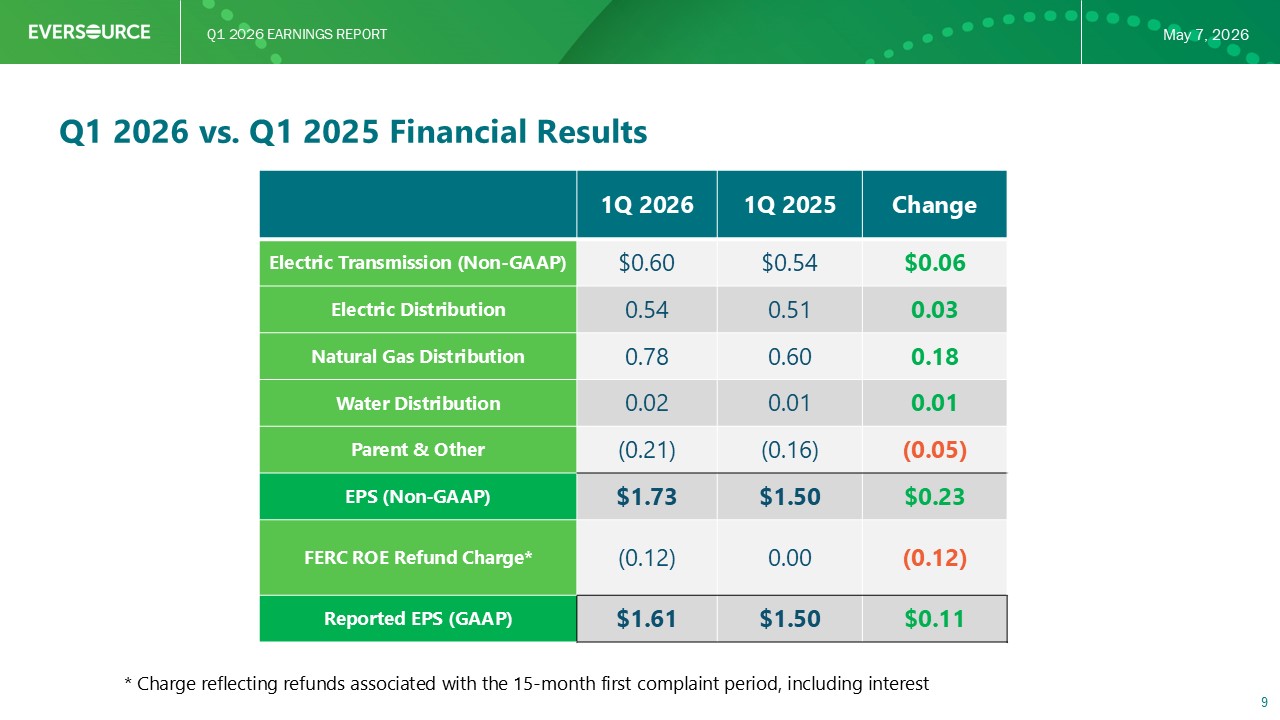
Q1 2026 EARNINGS REPORT May 7, 2026 Q1 2026 vs. Q1 2025 Financial Results 9 Change 1Q 2025 1Q 2026 $0.06 $0.54 $0.60 Electric Transmission (Non - GAAP) 0.03 0.51 0.54 Electric Distribution 0.18 0.60 0.78 Natural Gas Distribution 0.01 0.01 0.02 Water Distribution (0.05) (0.16) (0.21) Parent & Other $0.23 $1.50 $1.73 EPS (Non - GAAP) (0.12) 0.00 (0.12) FERC ROE Refund Charge* $0.11 $1.50 $1.61 Reported EPS (GAAP) * Charge reflecting refunds associated with the 15 - month first complaint period, including interest
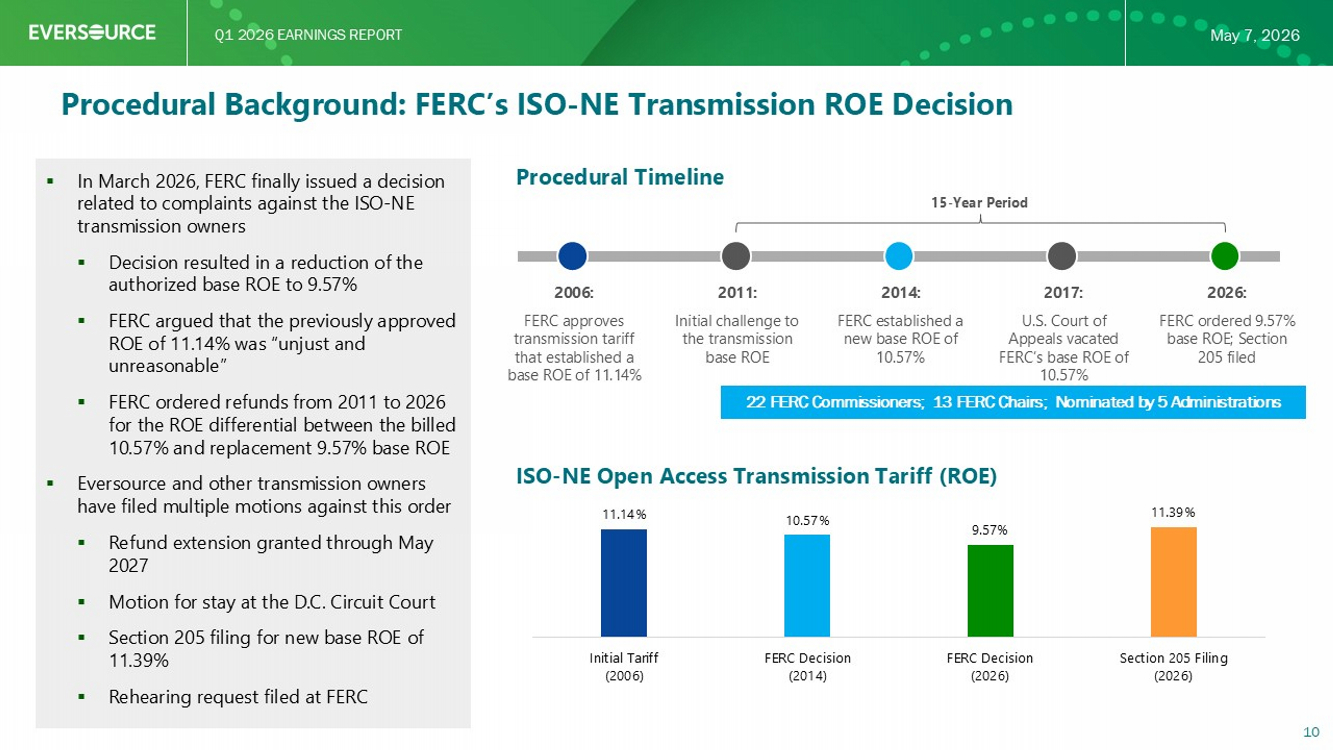
Q1 2026 EARNINGS REPORT May 7, 2026 Procedural Background: FERC’s ISO - NE Transmission ROE Decision Procedural Timeline ▪ In March 2026, FERC finally issued a decision related to complaints against the ISO - NE transmission owners ▪ Decision resulted in a reduction of the authorized base ROE to 9.57% ▪ FERC argued that the previously approved ROE of 11.14% was “unjust and unreasonable” ▪ FERC ordered refunds from 2011 to 2026 for the ROE differential between the billed 10.57% and replacement 9.57% base ROE ▪ Eversource and other transmission owners have filed multiple motions against this order ▪ Re fund extension granted through May 2027 ▪ Motion for stay at the D.C. Circuit Court ▪ Section 205 filing for new base ROE of 11.39% ▪ Rehearing request filed 10 ISO - NE Open Access Transmission Tariff (ROE) 11.14% 10.57% 9.57% 11.39% Initial Tariff (2006) FERC Decision (2014) FERC Decision (2026) Section 205 Filing (2026) 2006: FERC approves transmission tariff that established a base ROE of 11.14% 2011: Initial challenge to the transmission base ROE 2014: FERC established a new base ROE of 10.57% 2017: U.S. Court of Appeals vacated FERC’s base ROE of 10.57% 2026: FERC ordered 9.57% base ROE; Section 205 filed 15 - Year Period 22 FERC Commissioners; 13 FERC Chairs; Nominated by 5 Administrations
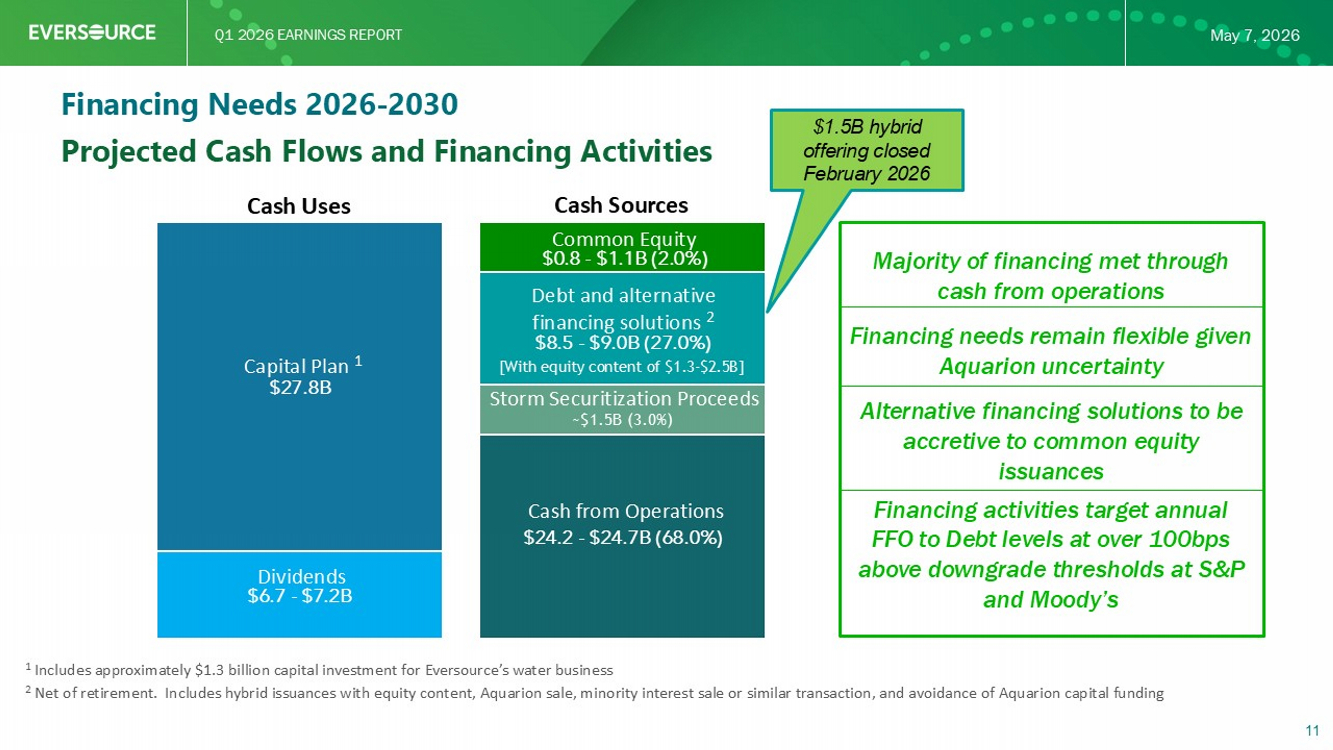
Q1 2026 EARNINGS REPORT May 7, 2026 $6.7 - $7.2B $27.8B $24.2 - $24.7B (68.0%) $8.5 - $9.0B (27.0%) $0.8 - $1.1B (2.0%) Projected Cash Flows and Financing Activities 11 Financing Needs 2026 - 2030 Cash Uses Cash Sources Common Equity Debt and alternative financing solutions 2 Cash from Operations Dividends Capital Plan 1 1: Includes approximately $1.3 billion capital investment for Eversource’s water business 2: Net of retirement. Includes hybrid issuances with equity content, Aquarion sale, minority interest sale or similar transaction, and avoidance of Aquarion capital funding Majority of financing met through cash from operations. Financing needs remain flexible given Aquarion uncertainty Alternative financing solutions to be accretive to common equity issuances Financing activities target annual FFO - Debt levels at over 100bps above downgrade thresholds at S&P and Moody’s Storm Securitization Proceeds [With equity content of $1.3 - $2.5B] ~$1.5B (3.0%) $1.5B hybrid offering closed February 2026
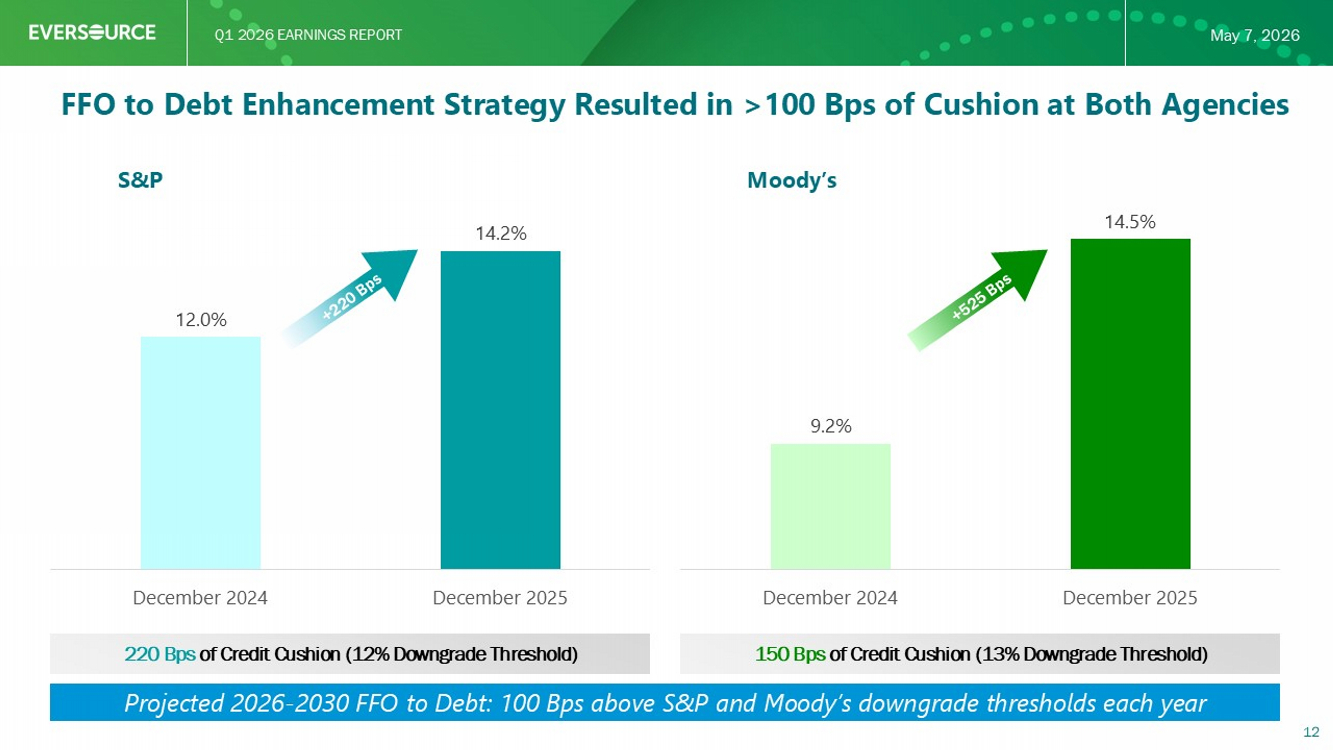
Q1 2026 EARNINGS REPORT May 7, 2026 FFO : Debt Enhancement Strategy Resulted in >100 Bps of Cushion at Both Agencies S&P Moody’s 12.0% 14.2% December 2024 December 2025 9.2% 14.5% December 2024 December 2025 220 Bps of Credit Cushion (12% Downgrade Threshold) 150 Bps of Credit Cushion (13% Downgrade Threshold) 12 Projected 2026 - 2030 FFO to Debt: 100 Bps above S&P and Moody’s downgrade thresholds each year
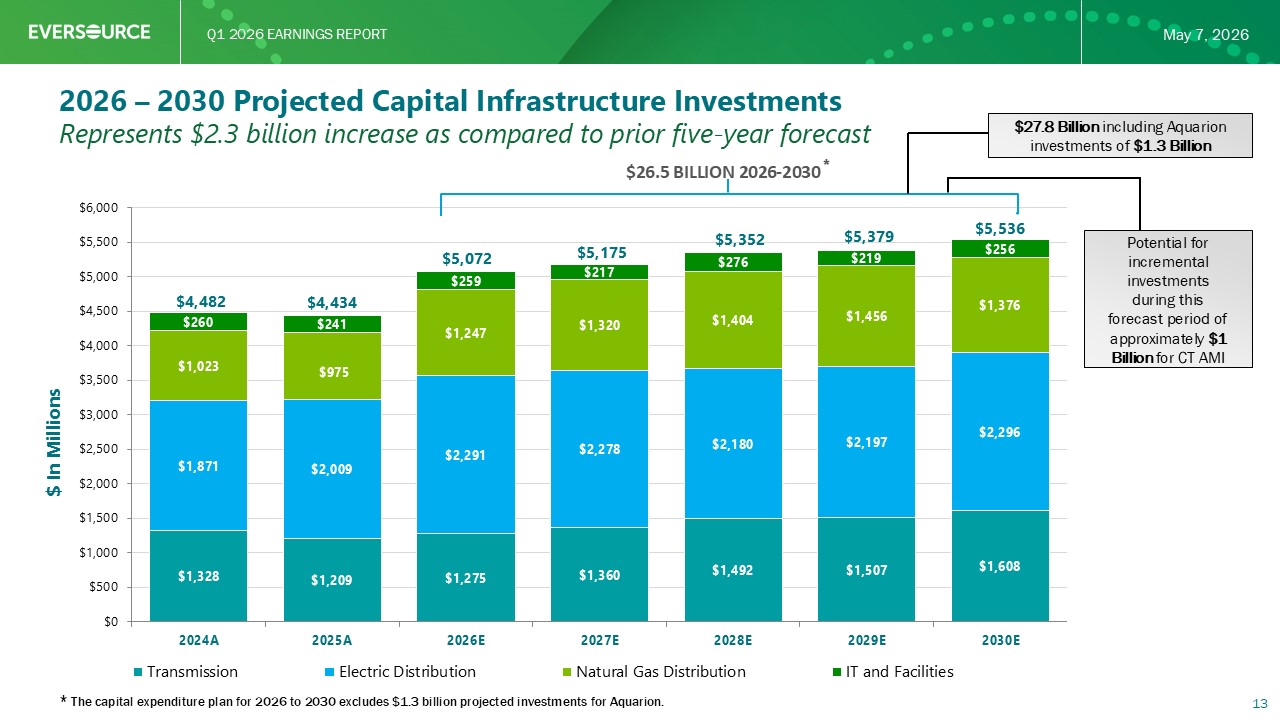
Q1 2026 EARNINGS REPORT May 7, 2026 $1,328 $1,209 $1,275 $1,360 $1,492 $1,507 $1,608 $1,871 $2,009 $2,291 $2,278 $2,180 $2,197 $2,296 $1,023 $975 $1,247 $1,320 $1,404 $1,456 $1,376 $260 $241 $259 $217 $276 $219 $256 $4,482 $4,434 $5,072 $5,175 $5,352 $5,379 $5,536 $0 $500 $1,000 $1,500 $2,000 $2,500 $3,000 $3,500 $4,000 $4,500 $5,000 $5,500 $6,000 2024A 2025A 2026E 2027E 2028E 2029E 2030E Transmission Electric Distribution Natural Gas Distribution IT and Facilities $ In Millions $26.5 BILLION 2026 - 2030 * 2026 – 2030 Projected Capital Infrastructure Investments 13 * The capital expenditure plan for 2026 to 2030 excludes $1.3 billion projected investments for Aquarion. Represents $2.3 billion increase as compared to prior five - year forecast $27.8 Billion including Aquarion investments of $1.3 Billion Potential for incremental investments during this forecast period of approximately $1 Billion for CT AMI
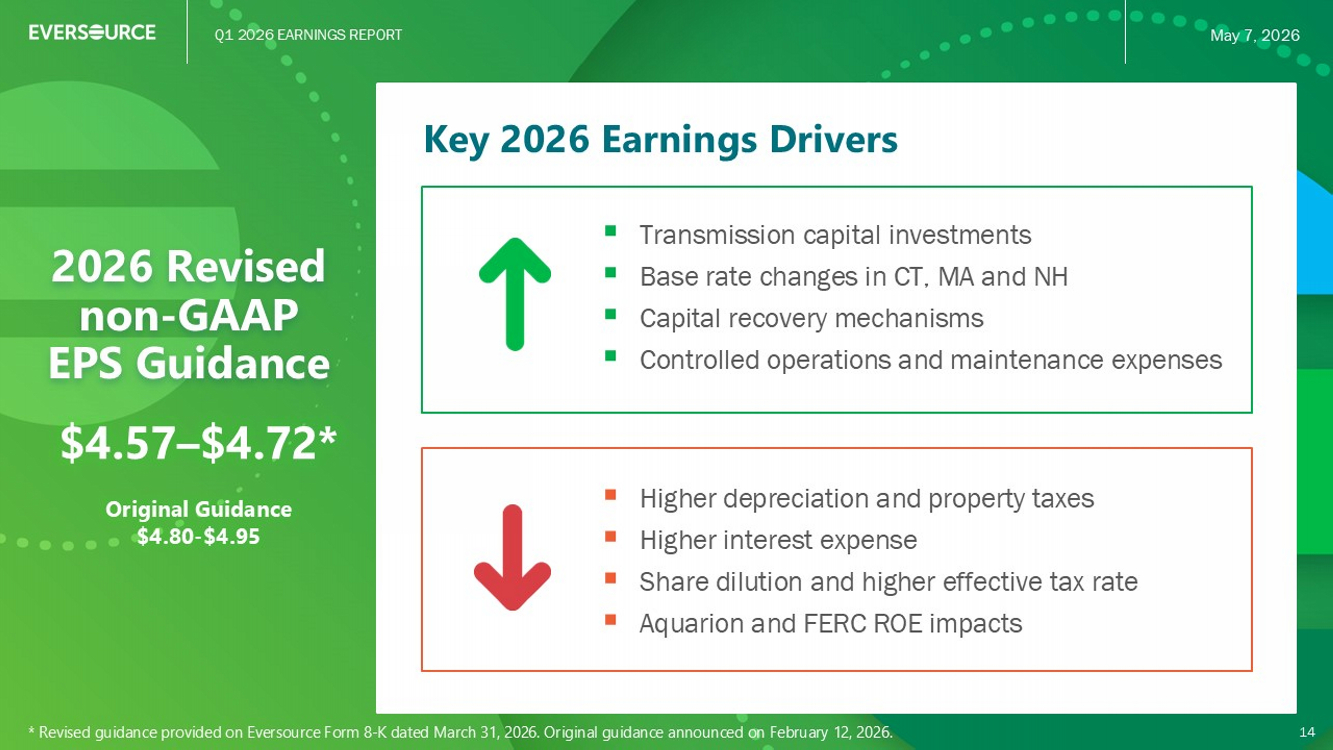
Q1 2026 EARNINGS REPORT May 7, 2026 Key 2026 Earnings Drivers 2026 Revised EPS Guidance ▪ Transmission capital investments ▪ Base rate changes in CT, MA and NH ▪ Capital recovery mechanisms ▪ Controlled operations and maintenance expenses 14 ▪ Higher depreciation and property taxes ▪ Higher interest expense ▪ Share dilution and higher effective tax rate ▪ Aquarion and FERC ROE impacts $4.57 – $4.72* Original Guidance $4.80 - $4.95 * Revised guidance provided on Eversource Form 8 - K dated March 31, 2026 . Original guidance announced on February 12, 2026.
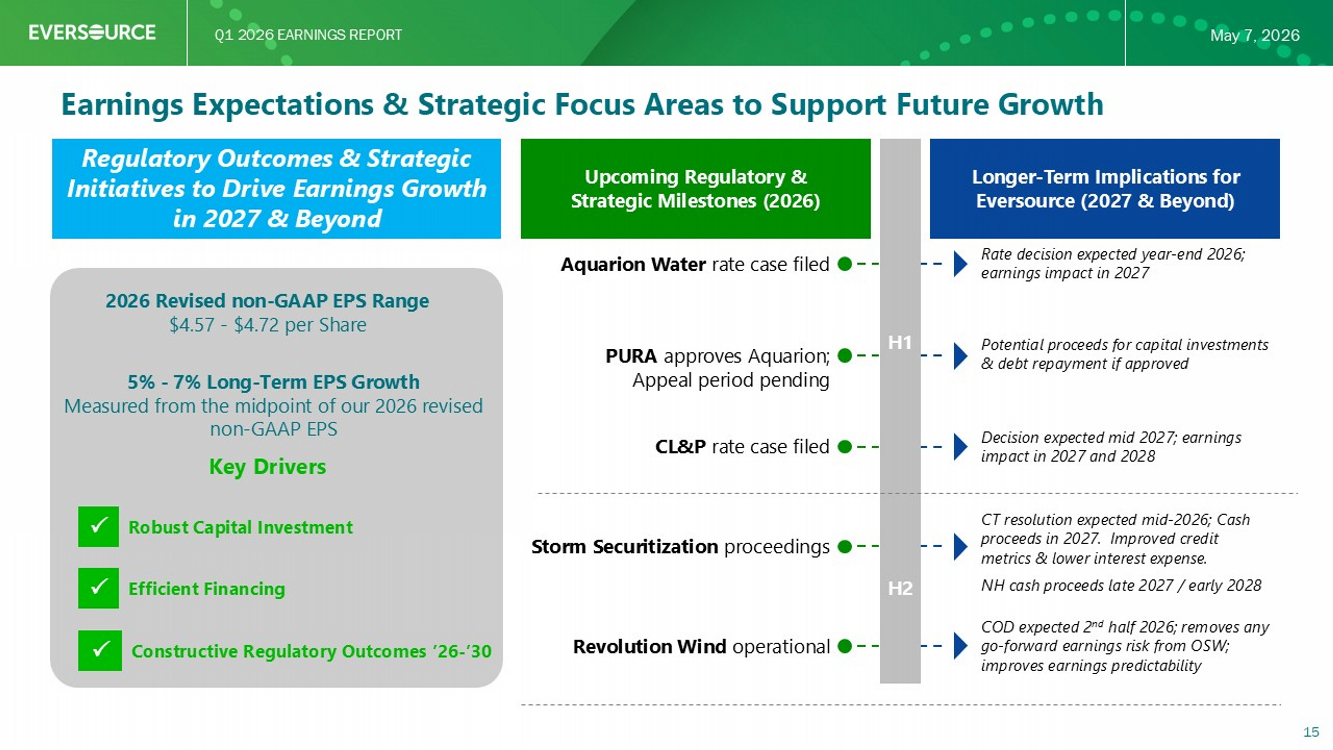
Q1 2026 EARNINGS REPORT May 7, 2026 Earnings Expectations & Strategic Focus Areas to Support Future Growth Upcoming Regulatory & Strategic Milestones (2026) Regulatory Outcomes & Strategic Initiatives to Drive Earnings Growth in 2027 & Beyond 2026 Revised EPS Range $4. 57 - $4.72 per Share 5% - 7% Long - Term EPS Growth Measured from the midpoint of our 2026 revised non - GAAP EPS Key Drivers Robust Capital Investment Efficient Financing Constructive Regulatory Outcomes ’26 - ’30 Longer - Term Implications for Eversource (2027 & Beyond) Aquarion Water rate case filed CL&P rate case filed PURA approves Aquarion; Appeal period pending Storm Securitization proceedings Revolution Wind operational Rate decision expected year - end 2026; earnings impact in 2027 Potential proceeds for capital investments & debt repayment if approved Decision expected mid 2027; earnings impact in 2027 and 2028 CT resolution expected mid - 2026; Cash proceeds in 2027. Improved credit metrics & lower interest expense. NH cash proceeds late 2027 / early 2028 COD expected 2 nd half 2026; removes any go - forward earnings risk from OSW; improves earnings predictability 15 H1 H2

Q1 2026 EARNINGS REPORT May 7, 2026 Q & A 16

Q1 2026 EARNINGS REPORT May 7, 2026 Appendix 17
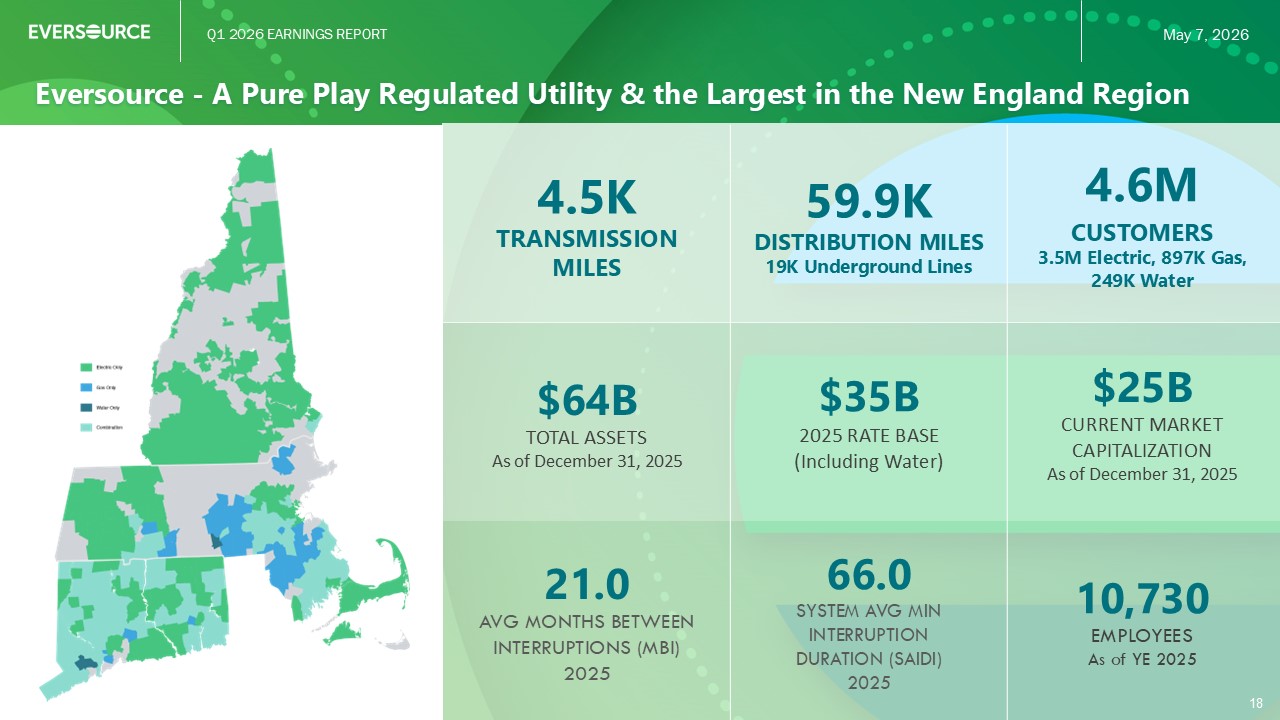
Q1 2026 EARNINGS REPORT May 7, 2026 Eversource - A Pure Play Regulated Utility & the Largest in the New England Region 18 4.6M CUSTOMERS 3.5M Electric, 897K Gas, 249K Water 59.9K DISTRIBUTION MILES 19K Underground Lines 4.5K TRANSMISSION MILES $25B CURRENT MARKET CAPITALIZATION As of December 31, 2025 $35B 2025 RATE BASE (Including Water) $64B TOTAL ASSETS As of December 31, 2025 10,730 EMPLOYEES As of YE 2025 66.0 SYSTEM AVG MIN INTERRUPTION DURATION (SAIDI) 2025 21.0 AVG MONTHS BETWEEN INTERRUPTIONS (MBI) 2025
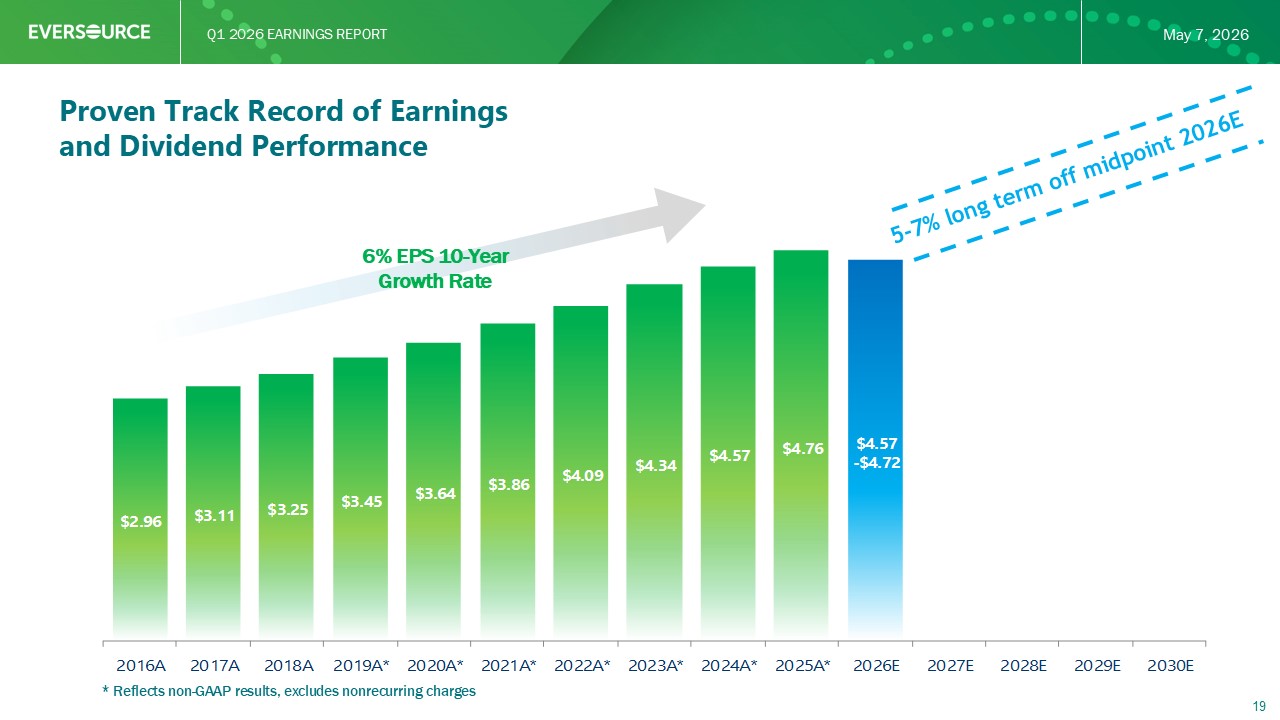
Q1 2026 EARNINGS REPORT May 7, 2026 $2.96 $3.11 $3.25 $3.45 $3.64 $3.86 $4.09 $4.34 $4.57 $4.76 $4.57 - $4.72 2016A 2017A 2018A 2019A* 2020A* 2021A* 2022A* 2023A* 2024A* 2025A* 2026E 2027E 2028E 2029E 2030E * Reflects non - GAAP results, excludes nonrecurring charges 19 Proven Track Record of Earnings and Dividend Performance 6% EPS 10 - Year Growth Rate
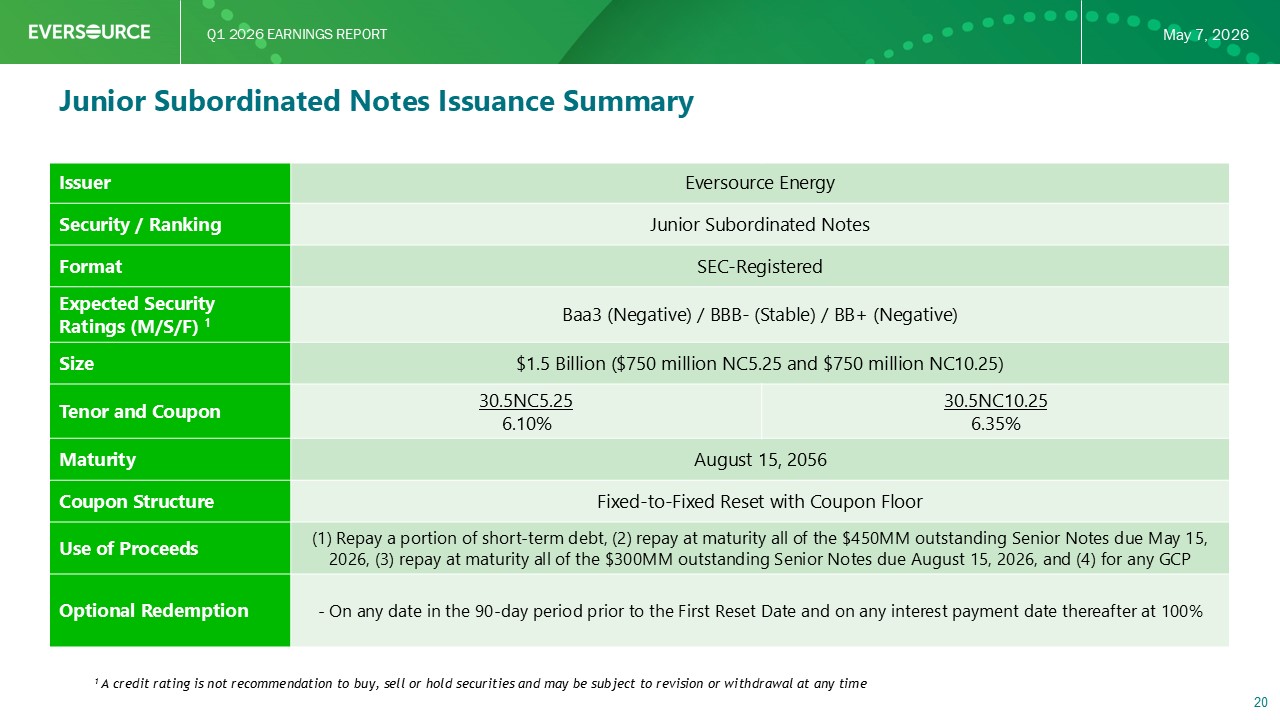
Q1 2026 EARNINGS REPORT May 7, 2026 Eversource Energy Issuer Junior Subordinated Notes Security / Ranking SEC - Registered Format Baa3 (Negative) / BBB - (Stable) / BB+ (Negative) Expected Security Ratings (M/S/F) 1 $1.5 Billion ($750 million NC5.25 and $750 million NC10.25) Size 30.5NC10.25 6.35% 30.5NC5.25 6.10% Tenor and Coupon August 15, 2056 Maturity Fixed - to - Fixed Reset with Coupon Floor Coupon Structure (1) Repay a portion of short - term debt, (2) repay at maturity all of the $450MM outstanding Senior Notes due May 15, 2026, (3) repay at maturity all of the $300MM outstanding Senior Notes due August 15, 2026, and (4) for any GCP Use of Proceeds - On any date in the 90 - day period prior to the First Reset Date and on any interest payment date thereafter at 100% Optional Redemption 20 1 A credit rating is not recommendation to buy, sell or hold securities and may be subject to revision or withdrawal at any tim e Junior Subordinated Notes Issuance Summary
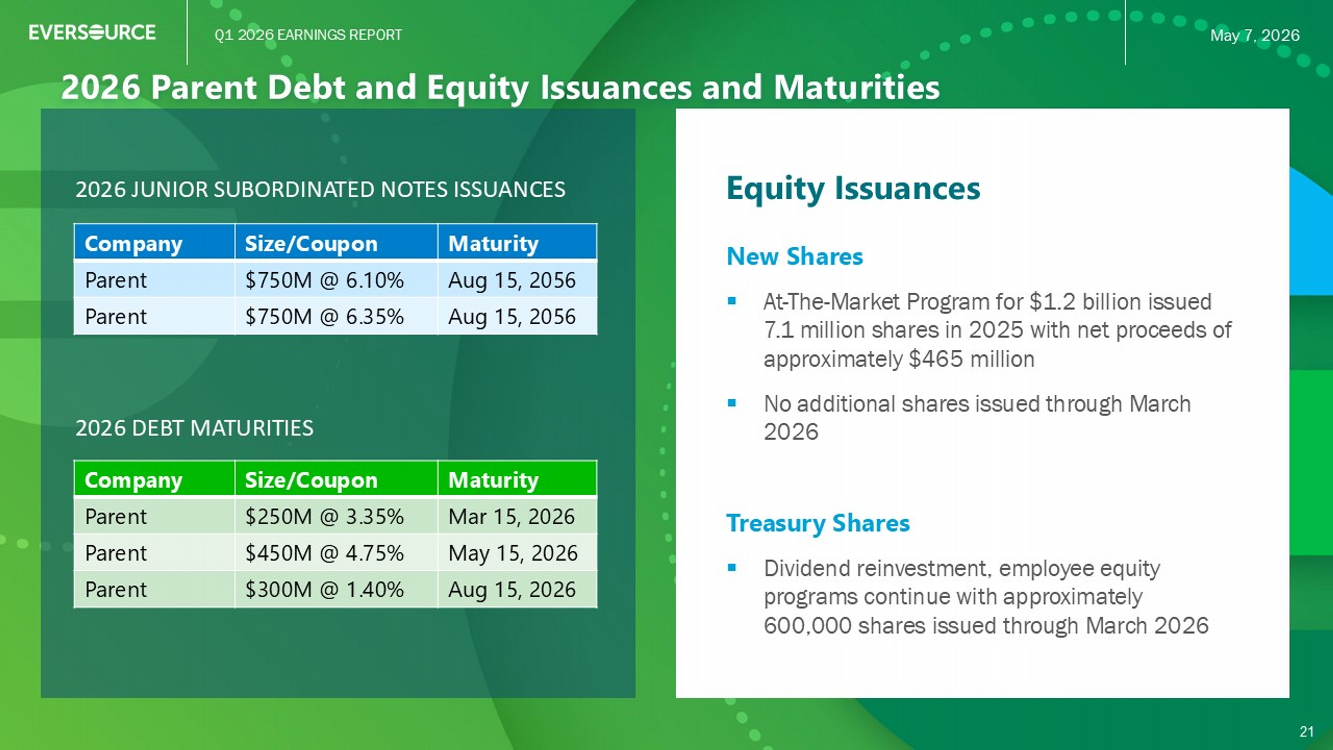
Q1 2026 EARNINGS REPORT May 7, 2026 2026 Parent Debt and Equity Issuances and Maturities 21 Equity Issuances New Shares ▪ At - The - Market Program for $1.2 billion issued 7.1 million shares in 2025 with net proceeds of approximately $ 465 million ▪ No additional shares issued through March 2026 Treasury Shares ▪ Dividend reinvestment, employee equity programs continue with approximately 600 thousand shares issued through March 2026 2026 DEBT MATURITIES Maturity Size/Coupon Company Mar 15, 2026 $250M @ 3.35% Parent May 15, 2026 $450M @ 4.75% Parent Aug 15, 2026 $300M @ 1.40% Parent 21 2026 JUNIOR SUBORDINATED NOTES ISSUANCES Maturity Size/Coupon Company Aug 15, 2056 $750M @ 6.10% Parent Aug 15, 2056 $750M @ 6.35% Parent
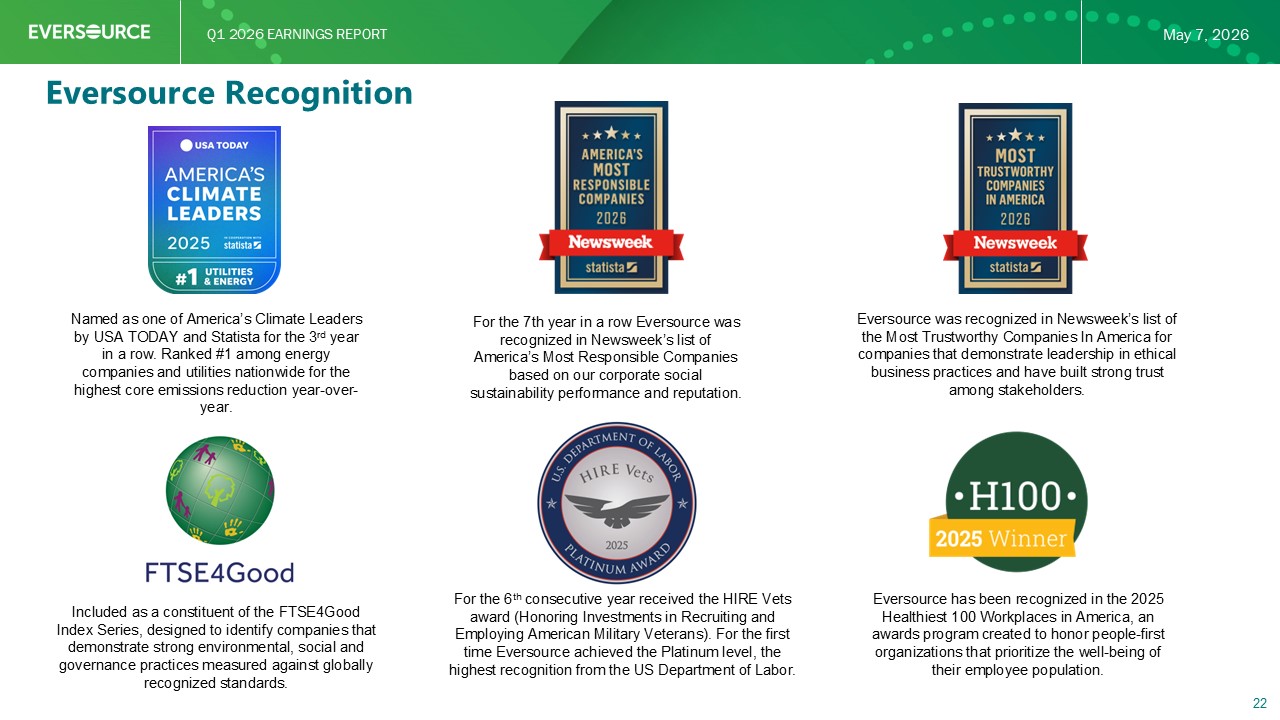
Q1 2026 EARNINGS REPORT May 7, 2026 For the 6 th consecutive year received the HIRE Vets award (Honoring Investments in Recruiting and Employing American Military Veterans). For the first time Eversource achieved the Platinum level, the highest recognition from the US Department of Labor. Named as one of America’s Climate Leaders by USA TODAY and Statista for the 3 rd year in a row. Ranked #1 among energy companies and utilities nationwide for the highest core emissions reduction year - over - year. For the 7th year in a row Eversource was recognized in Newsweek’s list of America’s Most Responsible Companies based on our corporate social sustainability performance and reputation. Eversource was recognized in Newsweek’s list of the Most Trustworthy Companies In America for companies that demonstrate leadership in ethical business practices and have built strong trust among stakeholders. Included as a constituent of the FTSE4Good Index Series, designed to identify companies that demonstrate strong environmental, social and governance practices measured against globally recognized standards. Eversource has been recognized in the 2025 Healthiest 100 Workplaces in America, an awards program created to honor people - first organizations that prioritize the well - being of their employee population. 22 Eversource Recognition