| Third Quarter | |||||||||||
| ($ in billions except profit per share) | 2025 | 2024 | |||||||||
| Sales and Revenues | $17.6 | $16.1 | |||||||||
| Profit Per Share | $4.88 | $5.06 | |||||||||
| Adjusted Profit Per Share | $4.95 | $5.17 | |||||||||
Please see a reconciliation of GAAP to non-GAAP financial measures in the appendix on pages 12 and 13. | |||||||||||
| ● | Third-quarter 2025 sales and revenues increased 10% to $17.6 billion | ||||
| ● | Third-quarter 2025 profit per share of $4.88; adjusted profit per share of $4.95 | ||||
| ● | Deployed $1.1 billion of cash for dividends and share repurchases in the third quarter | ||||
| Sales and Revenues by Segment | |||||||||||||||||||||||||||||||||||||||||||||||
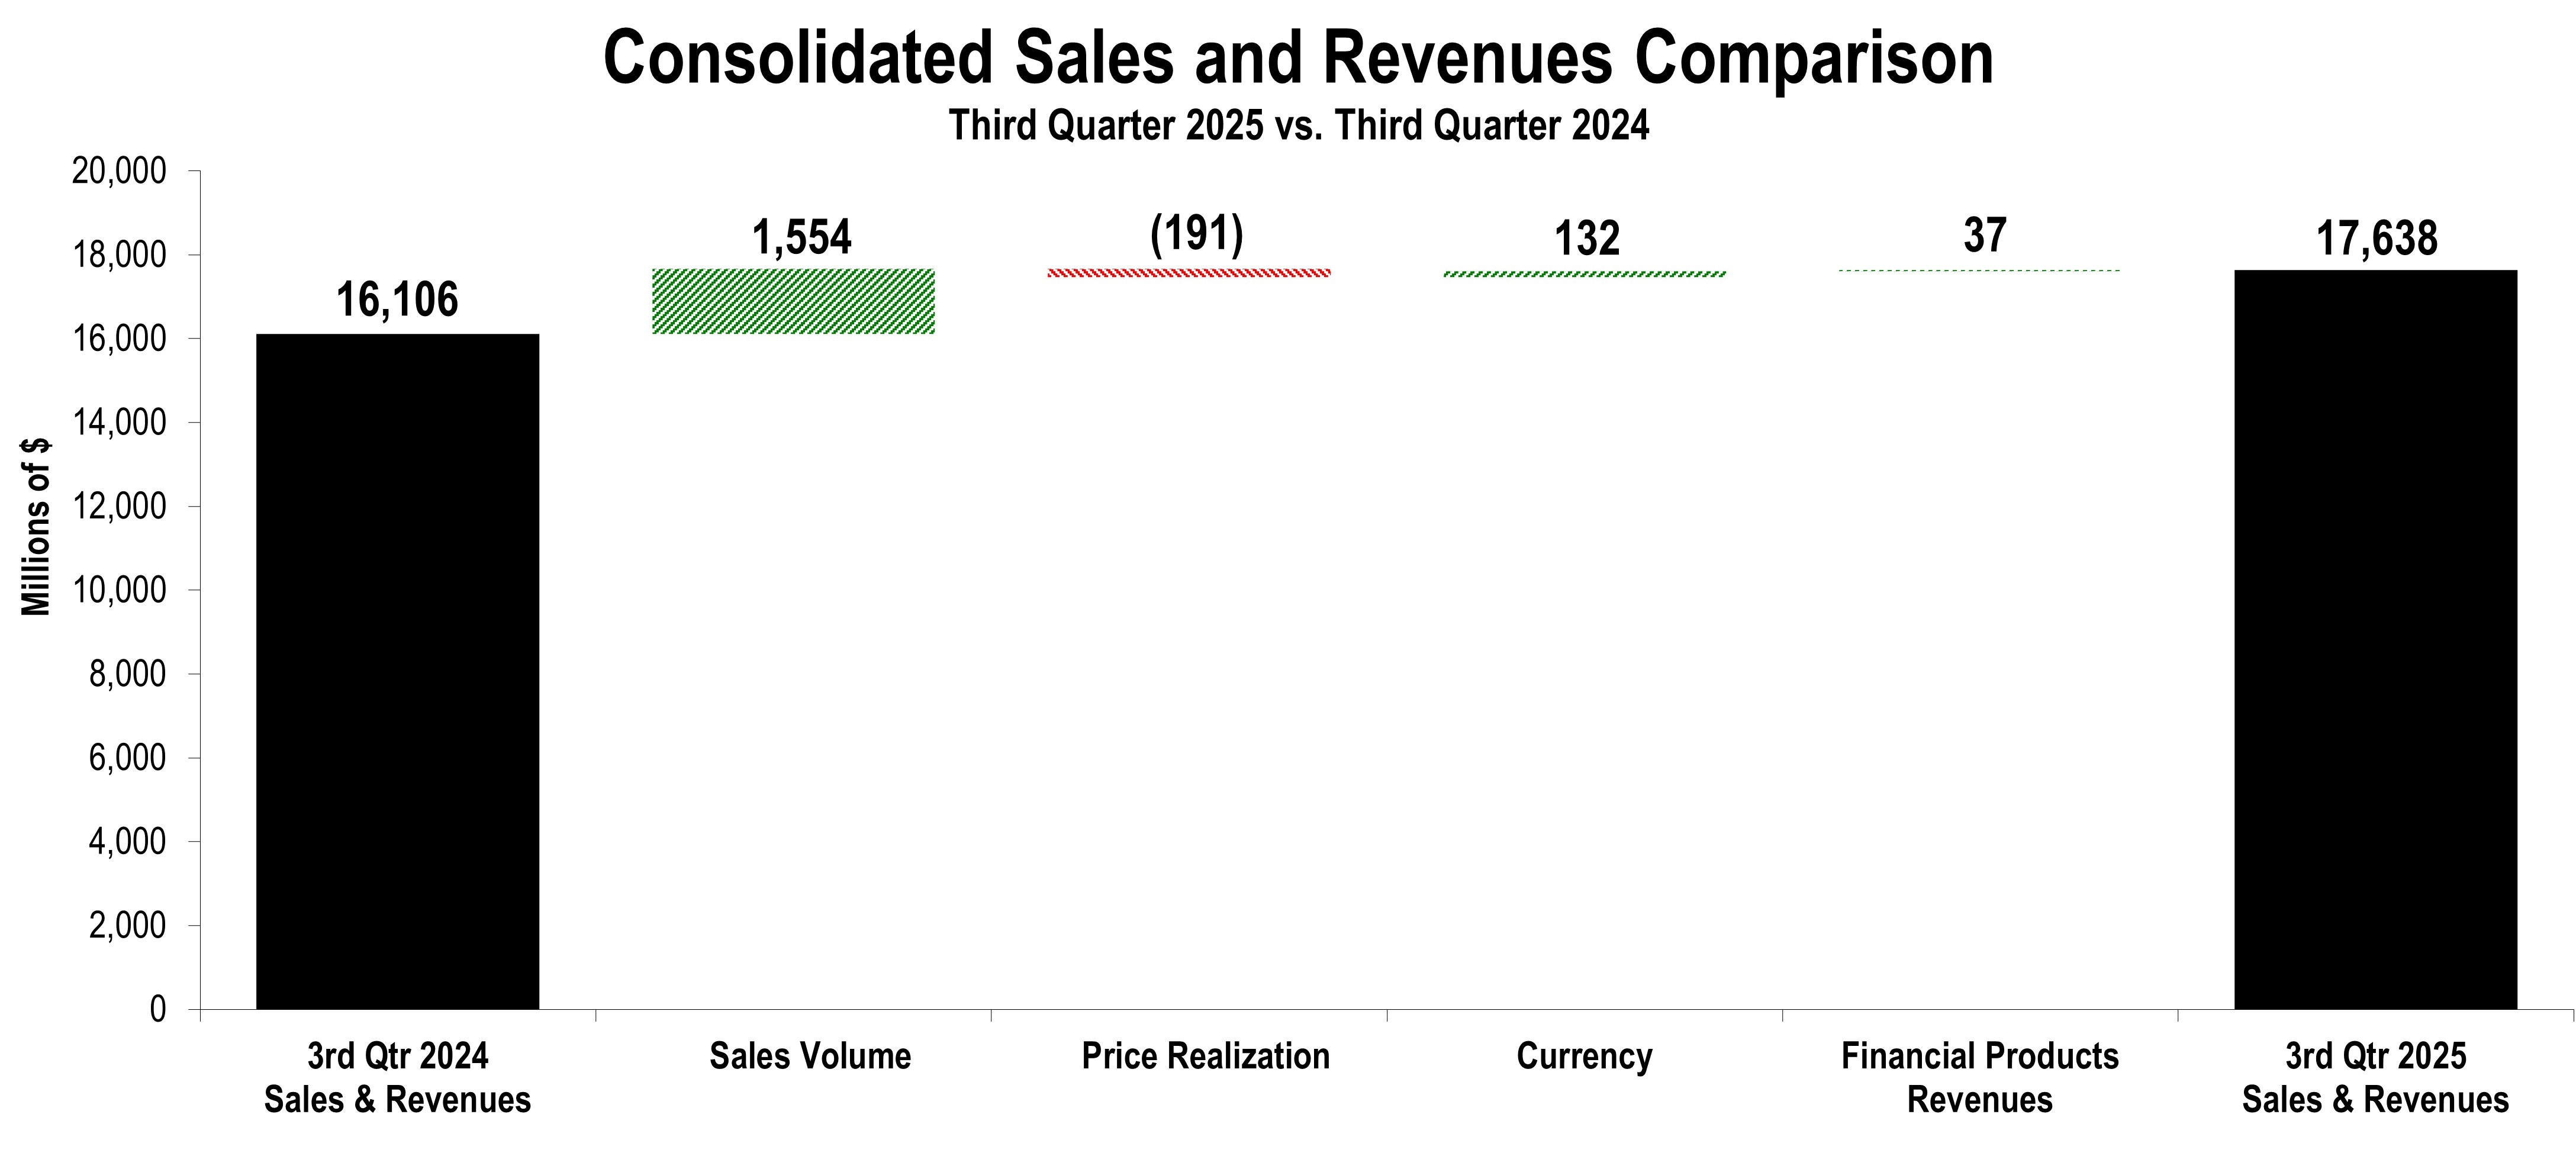
| (Millions of dollars) | Third Quarter 2024 | Sales Volume | Price Realization | Currency | Inter-Segment / Other | Third Quarter 2025 | $ Change | % Change | |||||||||||||||||||||||||||||||||||||||
| Construction Industries | $ | 6,345 | $ | 568 | $ | (262) | $ | 69 | $ | 40 | $ | 6,760 | $ | 415 | 7% | ||||||||||||||||||||||||||||||||
| Resource Industries | 3,048 | 138 | (61) | 4 | (19) | 3,110 | 62 | 2% | |||||||||||||||||||||||||||||||||||||||
| Energy & Transportation | 7,187 | 870 | 132 | 52 | 156 | 8,397 | 1,210 | 17% | |||||||||||||||||||||||||||||||||||||||
| All Other Segment | 72 | 2 | — | — | (1) | 73 | 1 | 1% | |||||||||||||||||||||||||||||||||||||||
| Corporate Items and Eliminations | (1,421) | (24) | — | 7 | (176) | (1,614) | (193) | ||||||||||||||||||||||||||||||||||||||||
| Machinery, Energy & Transportation | 15,231 | 1,554 | (191) | 132 | — | 16,726 | 1,495 | 10% | |||||||||||||||||||||||||||||||||||||||
| Financial Products Segment | 1,034 | — | — | — | 42 | 1,076 | 42 | 4% | |||||||||||||||||||||||||||||||||||||||
| Corporate Items and Eliminations | (159) | — | — | — | (5) | (164) | (5) | ||||||||||||||||||||||||||||||||||||||||
| Financial Products Revenues | 875 | — | — | — | 37 | 912 | 37 | 4% | |||||||||||||||||||||||||||||||||||||||
| Consolidated Sales and Revenues | $ | 16,106 | $ | 1,554 | $ | (191) | $ | 132 | $ | 37 | $ | 17,638 | $ | 1,532 | 10% | ||||||||||||||||||||||||||||||||
| Sales and Revenues by Geographic Region | |||||||||||||||||||||||||||||||||||||||||||||||||||||||||||||||||||||||||||||||||||
| North America | Latin America | EAME | Asia/Pacific | External Sales and Revenues | Inter-Segment | Total Sales and Revenues | |||||||||||||||||||||||||||||||||||||||||||||||||||||||||||||||||||||||||||||
| (Millions of dollars) | $ | % Chg | $ | % Chg | $ | % Chg | $ | % Chg | $ | % Chg | $ | % Chg | $ | % Chg | |||||||||||||||||||||||||||||||||||||||||||||||||||||||||||||||||||||
| Third Quarter 2025 | |||||||||||||||||||||||||||||||||||||||||||||||||||||||||||||||||||||||||||||||||||
| Construction Industries | $ | 3,912 | 8% | $ | 654 | (1%) | $ | 1,217 | 6% | $ | 904 | 3% | $ | 6,687 | 6% | $ | 73 | 121% | $ | 6,760 | 7% | ||||||||||||||||||||||||||||||||||||||||||||||||||||||||||||||
| Resource Industries | 1,152 | 1% | 543 | 9% | 541 | 22% | 799 | (8%) | 3,035 | 3% | 75 | (20%) | 3,110 | 2% | |||||||||||||||||||||||||||||||||||||||||||||||||||||||||||||||||||||
| Energy & Transportation | 4,045 | 26% | 559 | 24% | 1,367 | (8%) | 1,088 | 27% | 7,059 | 18% | 1,338 | 13% | 8,397 | 17% | |||||||||||||||||||||||||||||||||||||||||||||||||||||||||||||||||||||
| All Other Segment | 5 | 400% | — | 100% | 2 | 100% | 3 | (57%) | 10 | 25% | 63 | (2%) | 73 | 1% | |||||||||||||||||||||||||||||||||||||||||||||||||||||||||||||||||||||
| Corporate Items and Eliminations | (59) | 2 | (3) | (5) | (65) | (1,549) | (1,614) | ||||||||||||||||||||||||||||||||||||||||||||||||||||||||||||||||||||||||||||
| Machinery, Energy & Transportation | 9,055 | 14% | 1,758 | 10% | 3,124 | 1% | 2,789 | 7% | 16,726 | 10% | — | —% | 16,726 | 10% | |||||||||||||||||||||||||||||||||||||||||||||||||||||||||||||||||||||
| Financial Products Segment | 722 | 4% | 118 | 22% | 130 | —% | 106 | (5%) | 1,076 | 4% | — | —% | 1,076 | 4% | |||||||||||||||||||||||||||||||||||||||||||||||||||||||||||||||||||||
| Corporate Items and Eliminations | (96) | (26) | (23) | (19) | (164) | — | (164) | ||||||||||||||||||||||||||||||||||||||||||||||||||||||||||||||||||||||||||||
| Financial Products Revenues | 626 | 4% | 92 | 21% | 107 | (2%) | 87 | (1%) | 912 | 4% | — | —% | 912 | 4% | |||||||||||||||||||||||||||||||||||||||||||||||||||||||||||||||||||||
| Consolidated Sales and Revenues | $ | 9,681 | 13% | $ | 1,850 | 10% | $ | 3,231 | 1% | $ | 2,876 | 7% | $ | 17,638 | 10% | $ | — | —% | $ | 17,638 | 10% | ||||||||||||||||||||||||||||||||||||||||||||||||||||||||||||||
| Third Quarter 2024 | |||||||||||||||||||||||||||||||||||||||||||||||||||||||||||||||||||||||||||||||||||
| Construction Industries | $ | 3,629 | $ | 658 | $ | 1,150 | $ | 875 | $ | 6,312 | $ | 33 | $ | 6,345 | |||||||||||||||||||||||||||||||||||||||||||||||||||||||||||||||||||||
| Resource Industries | 1,141 | 499 | 444 | 870 | 2,954 | 94 | 3,048 | ||||||||||||||||||||||||||||||||||||||||||||||||||||||||||||||||||||||||||||
| Energy & Transportation | 3,214 | 449 | 1,486 | 856 | 6,005 | 1,182 | 7,187 | ||||||||||||||||||||||||||||||||||||||||||||||||||||||||||||||||||||||||||||
| All Other Segment | 1 | (1) | 1 | 7 | 8 | 64 | 72 | ||||||||||||||||||||||||||||||||||||||||||||||||||||||||||||||||||||||||||||
| Corporate Items and Eliminations | (42) | (3) | 9 | (12) | (48) | (1,373) | (1,421) | ||||||||||||||||||||||||||||||||||||||||||||||||||||||||||||||||||||||||||||
| Machinery, Energy & Transportation | 7,943 | 1,602 | 3,090 | 2,596 | 15,231 | — | 15,231 | ||||||||||||||||||||||||||||||||||||||||||||||||||||||||||||||||||||||||||||
| Financial Products Segment | 695 | 97 | 130 | 112 | 1,034 | — | 1,034 | ||||||||||||||||||||||||||||||||||||||||||||||||||||||||||||||||||||||||||||
| Corporate Items and Eliminations | (93) | (21) | (21) | (24) | (159) | — | (159) | ||||||||||||||||||||||||||||||||||||||||||||||||||||||||||||||||||||||||||||
| Financial Products Revenues | 602 | 76 | 109 | 88 | 875 | — | 875 | ||||||||||||||||||||||||||||||||||||||||||||||||||||||||||||||||||||||||||||
| Consolidated Sales and Revenues | $ | 8,545 | $ | 1,678 | $ | 3,199 | $ | 2,684 | $ | 16,106 | $ | — | $ | 16,106 | |||||||||||||||||||||||||||||||||||||||||||||||||||||||||||||||||||||
| Profit (Loss) by Segment | |||||||||||||||||||||||
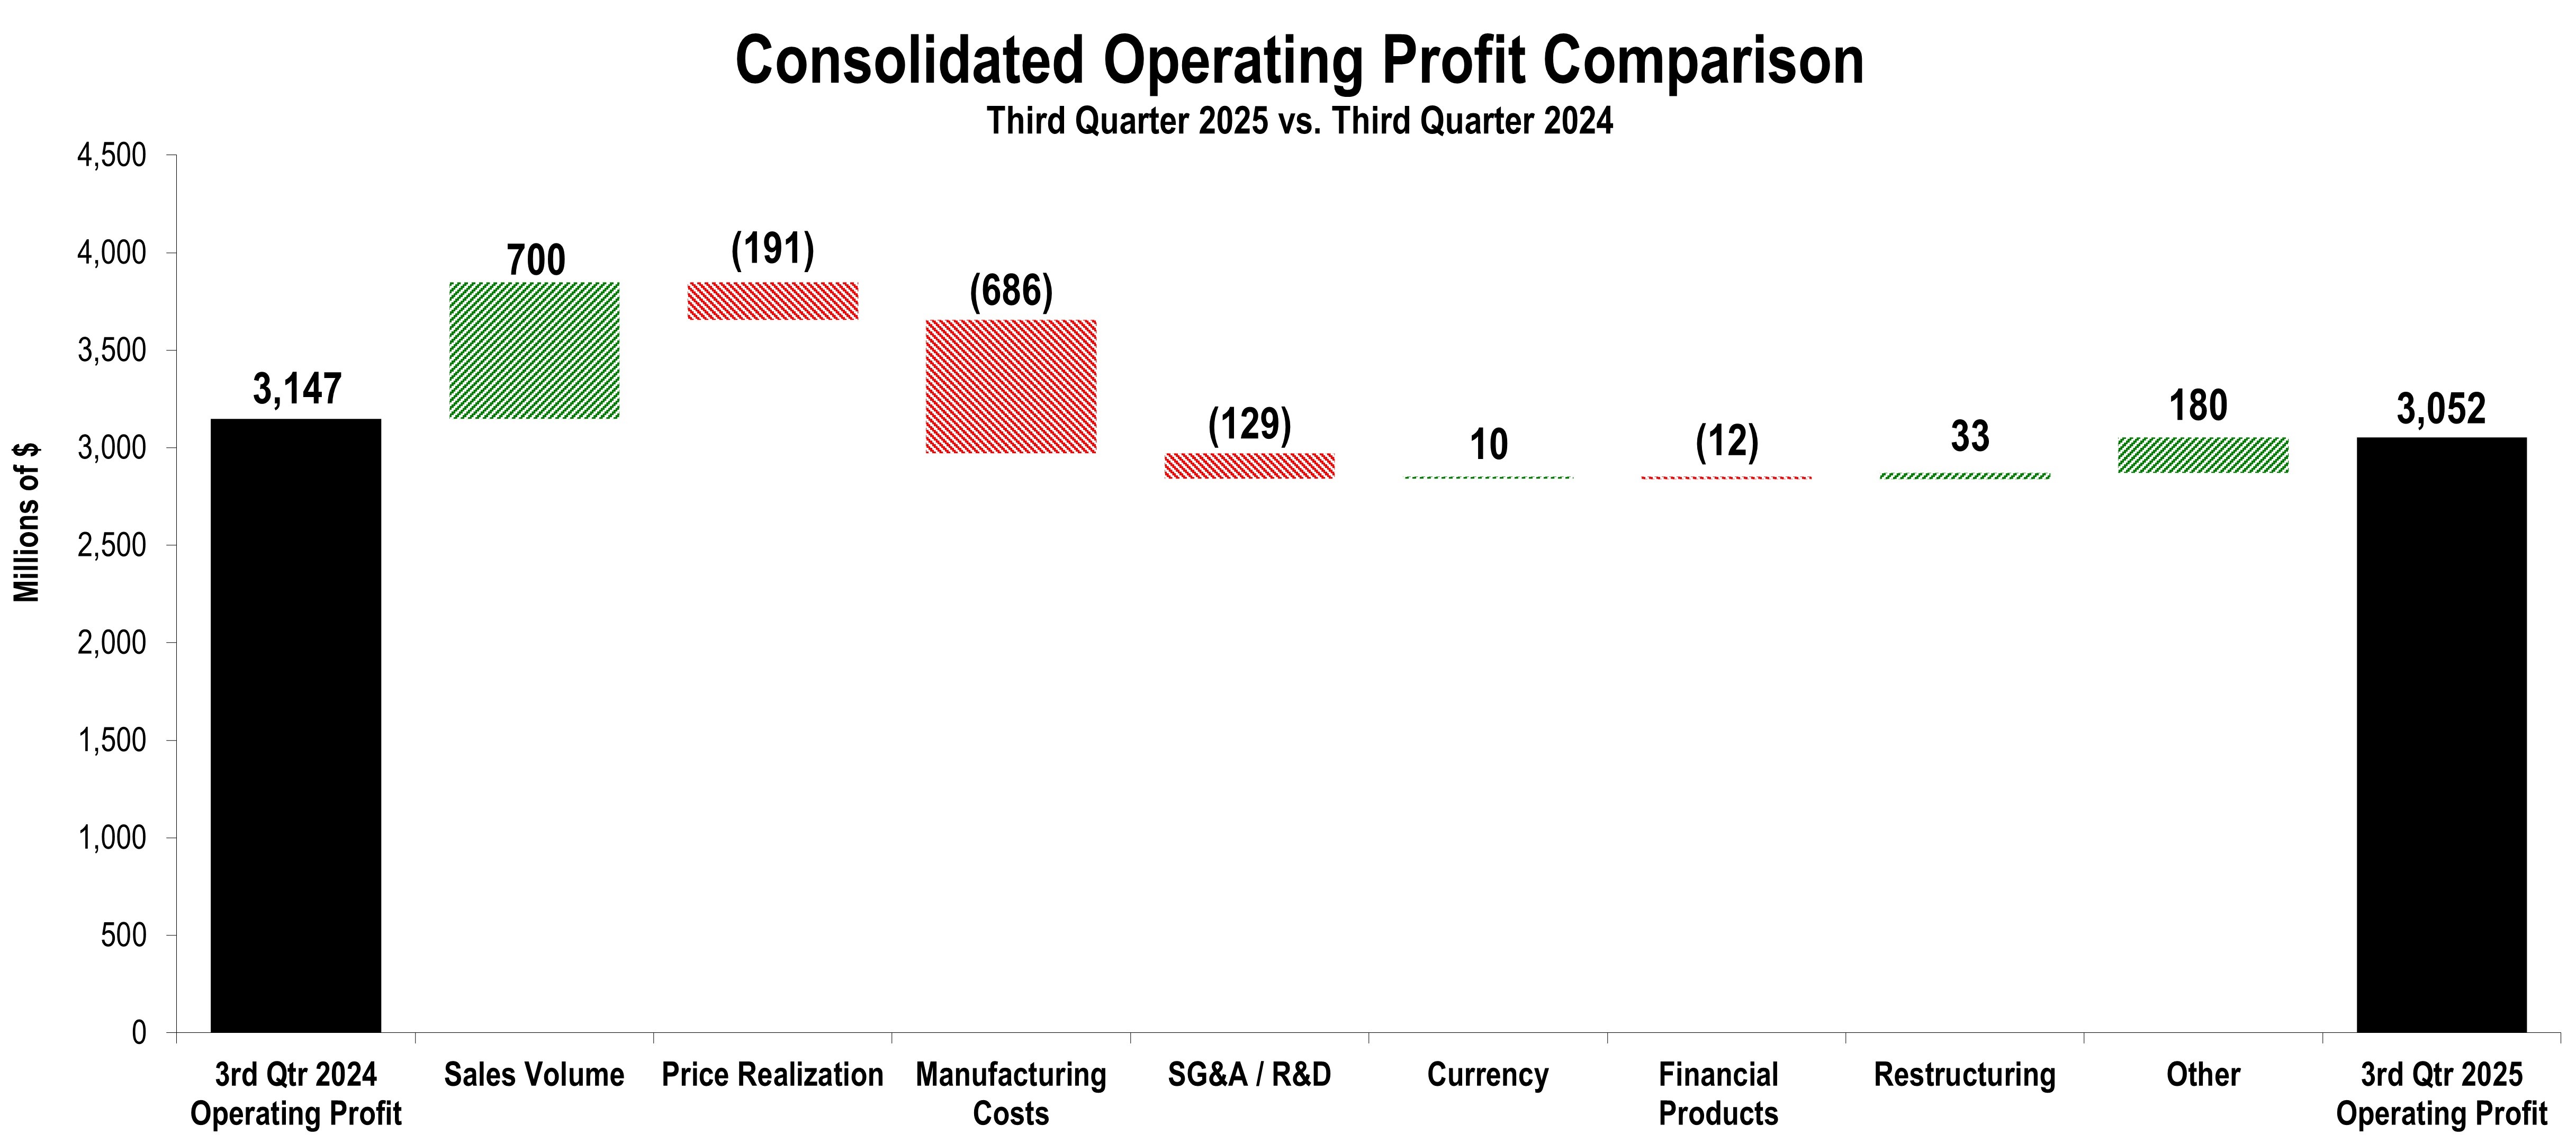
| (Millions of dollars) | Third Quarter 2025 | Third Quarter 2024 | $ Change | % Change | |||||||||||||||||||
| Construction Industries | $ | 1,377 | $ | 1,486 | $ | (109) | (7 | %) | |||||||||||||||
| Resource Industries | 499 | 619 | (120) | (19 | %) | ||||||||||||||||||
| Energy & Transportation | 1,678 | 1,433 | 245 | 17 | % | ||||||||||||||||||
| All Other Segment | (6) | (13) | 7 | 54 | % | ||||||||||||||||||
| Corporate Items and Eliminations | (546) | (427) | (119) | ||||||||||||||||||||
| Machinery, Energy & Transportation | 3,002 | 3,098 | (96) | (3 | %) | ||||||||||||||||||
| Financial Products Segment | 241 | 246 | (5) | (2 | %) | ||||||||||||||||||
| Corporate Items and Eliminations | (38) | (30) | (8) | ||||||||||||||||||||
| Financial Products | 203 | 216 | (13) | (6 | %) | ||||||||||||||||||
| Consolidating Adjustments | (153) | (167) | 14 | ||||||||||||||||||||
| Consolidated Operating Profit | $ | 3,052 | $ | 3,147 | $ | (95) | (3 | %) | |||||||||||||||
| CONSTRUCTION INDUSTRIES | ||||||||||||||||||||||||||||||||||||||||||||||||||
| (Millions of dollars) | ||||||||||||||||||||||||||||||||||||||||||||||||||
| Segment Sales | ||||||||||||||||||||||||||||||||||||||||||||||||||
| Third Quarter 2024 | Sales Volume | Price Realization | Currency | Inter-Segment | Third Quarter 2025 | $ Change | % Change | |||||||||||||||||||||||||||||||||||||||||||
| Total Sales | $ | 6,345 | $ | 568 | $ | (262) | $ | 69 | $ | 40 | $ | 6,760 | $ | 415 | 7 | % | ||||||||||||||||||||||||||||||||||
| Sales by Geographic Region | ||||||||||||||||||||||||||||||||||||||||||||||||||
| Third Quarter 2025 | Third Quarter 2024 | $ Change | % Change | |||||||||||||||||||||||||||||||||||||||||||||||
| North America | $ | 3,912 | $ | 3,629 | $ | 283 | 8 | % | ||||||||||||||||||||||||||||||||||||||||||
| Latin America | 654 | 658 | (4) | (1 | %) | |||||||||||||||||||||||||||||||||||||||||||||
| EAME | 1,217 | 1,150 | 67 | 6 | % | |||||||||||||||||||||||||||||||||||||||||||||
| Asia/Pacific | 904 | 875 | 29 | 3 | % | |||||||||||||||||||||||||||||||||||||||||||||
| External Sales | 6,687 | 6,312 | 375 | 6 | % | |||||||||||||||||||||||||||||||||||||||||||||
| Inter-segment | 73 | 33 | 40 | 121 | % | |||||||||||||||||||||||||||||||||||||||||||||
| Total Sales | $ | 6,760 | $ | 6,345 | $ | 415 | 7 | % | ||||||||||||||||||||||||||||||||||||||||||
| Segment Profit | ||||||||||||||||||||||||||||||||||||||||||||||||||
| Third Quarter 2025 | Third Quarter 2024 | Change | % Change | |||||||||||||||||||||||||||||||||||||||||||||||
| Segment Profit | $ | 1,377 | $ | 1,486 | $ | (109) | (7 | %) | ||||||||||||||||||||||||||||||||||||||||||
| Segment Profit Margin | 20.4 | % | 23.4 | % | (3.0 | pts) | ||||||||||||||||||||||||||||||||||||||||||||
| RESOURCE INDUSTRIES | ||||||||||||||||||||||||||||||||||||||||||||||||||
| (Millions of dollars) | ||||||||||||||||||||||||||||||||||||||||||||||||||
| Segment Sales | ||||||||||||||||||||||||||||||||||||||||||||||||||
| Third Quarter 2024 | Sales Volume | Price Realization | Currency | Inter-Segment | Third Quarter 2025 | $ Change | % Change | |||||||||||||||||||||||||||||||||||||||||||
| Total Sales | $ | 3,048 | $ | 138 | $ | (61) | $ | 4 | $ | (19) | $ | 3,110 | $ | 62 | 2 | % | ||||||||||||||||||||||||||||||||||
| Sales by Geographic Region | ||||||||||||||||||||||||||||||||||||||||||||||||||
| Third Quarter 2025 | Third Quarter 2024 | $ Change | % Change | |||||||||||||||||||||||||||||||||||||||||||||||
| North America | $ | 1,152 | $ | 1,141 | $ | 11 | 1 | % | ||||||||||||||||||||||||||||||||||||||||||
| Latin America | 543 | 499 | 44 | 9 | % | |||||||||||||||||||||||||||||||||||||||||||||
| EAME | 541 | 444 | 97 | 22 | % | |||||||||||||||||||||||||||||||||||||||||||||
| Asia/Pacific | 799 | 870 | (71) | (8 | %) | |||||||||||||||||||||||||||||||||||||||||||||
| External Sales | 3,035 | 2,954 | 81 | 3 | % | |||||||||||||||||||||||||||||||||||||||||||||
| Inter-segment | 75 | 94 | (19) | (20 | %) | |||||||||||||||||||||||||||||||||||||||||||||
| Total Sales | $ | 3,110 | $ | 3,048 | $ | 62 | 2 | % | ||||||||||||||||||||||||||||||||||||||||||
| Segment Profit | ||||||||||||||||||||||||||||||||||||||||||||||||||
| Third Quarter 2025 | Third Quarter 2024 | Change | % Change | |||||||||||||||||||||||||||||||||||||||||||||||
| Segment Profit | $ | 499 | $ | 619 | $ | (120) | (19 | %) | ||||||||||||||||||||||||||||||||||||||||||
| Segment Profit Margin | 16.0 | % | 20.3 | % | (4.3 | pts) | ||||||||||||||||||||||||||||||||||||||||||||
| ENERGY & TRANSPORTATION | ||||||||||||||||||||||||||||||||||||||||||||||||||
| (Millions of dollars) | ||||||||||||||||||||||||||||||||||||||||||||||||||
| Segment Sales | ||||||||||||||||||||||||||||||||||||||||||||||||||
| Third Quarter 2024 | Sales Volume | Price Realization | Currency | Inter-Segment | Third Quarter 2025 | $ Change | % Change | |||||||||||||||||||||||||||||||||||||||||||
| Total Sales | $ | 7,187 | $ | 870 | $ | 132 | $ | 52 | $ | 156 | $ | 8,397 | $ | 1,210 | 17 | % | ||||||||||||||||||||||||||||||||||
| Sales by Application | ||||||||||||||||||||||||||||||||||||||||||||||||||
| Third Quarter 2025 | Third Quarter 2024 | $ Change | % Change | |||||||||||||||||||||||||||||||||||||||||||||||
| Oil and Gas | $ | 1,979 | $ | 1,656 | $ | 323 | 20 | % | ||||||||||||||||||||||||||||||||||||||||||
| Power Generation | 2,634 | 2,011 | 623 | 31 | % | |||||||||||||||||||||||||||||||||||||||||||||
| Industrial | 1,077 | 1,028 | 49 | 5 | % | |||||||||||||||||||||||||||||||||||||||||||||
| Transportation | 1,369 | 1,310 | 59 | 5 | % | |||||||||||||||||||||||||||||||||||||||||||||
| External Sales | 7,059 | 6,005 | 1,054 | 18 | % | |||||||||||||||||||||||||||||||||||||||||||||
| Inter-segment | 1,338 | 1,182 | 156 | 13 | % | |||||||||||||||||||||||||||||||||||||||||||||
| Total Sales | $ | 8,397 | $ | 7,187 | $ | 1,210 | 17 | % | ||||||||||||||||||||||||||||||||||||||||||
| Segment Profit | ||||||||||||||||||||||||||||||||||||||||||||||||||
| Third Quarter 2025 | Third Quarter 2024 | Change | % Change | |||||||||||||||||||||||||||||||||||||||||||||||
| Segment Profit | $ | 1,678 | $ | 1,433 | $ | 245 | 17 | % | ||||||||||||||||||||||||||||||||||||||||||
| Segment Profit Margin | 20.0 | % | 19.9 | % | 0.1 | pts | ||||||||||||||||||||||||||||||||||||||||||||
| FINANCIAL PRODUCTS SEGMENT | ||||||||||||||||||||||||||||||||||||||||||||||||||
| (Millions of dollars) | ||||||||||||||||||||||||||||||||||||||||||||||||||
| Revenues by Geographic Region | ||||||||||||||||||||||||||||||||||||||||||||||||||
| Third Quarter 2025 | Third Quarter 2024 | $ Change | % Change | |||||||||||||||||||||||||||||||||||||||||||||||
| North America | $ | 722 | $ | 695 | $ | 27 | 4 | % | ||||||||||||||||||||||||||||||||||||||||||
| Latin America | 118 | 97 | 21 | 22 | % | |||||||||||||||||||||||||||||||||||||||||||||
| EAME | 130 | 130 | — | — | % | |||||||||||||||||||||||||||||||||||||||||||||
| Asia/Pacific | 106 | 112 | (6) | (5 | %) | |||||||||||||||||||||||||||||||||||||||||||||
| Total Revenues | $ | 1,076 | $ | 1,034 | $ | 42 | 4 | % | ||||||||||||||||||||||||||||||||||||||||||
| Segment Profit | ||||||||||||||||||||||||||||||||||||||||||||||||||
| Third Quarter 2025 | Third Quarter 2024 | Change | % Change | |||||||||||||||||||||||||||||||||||||||||||||||
| Segment Profit | $ | 241 | $ | 246 | $ | (5) | (2 | %) | ||||||||||||||||||||||||||||||||||||||||||
| (Dollars in millions except per share data) | Operating Profit | Operating Profit Margin | Profit Before Taxes | Provision (Benefit) for Income Taxes | Profit | Profit per Share | |||||||||||||||||||||||||||||||||||
Three Months Ended September 30, 2025 - U.S. GAAP | $ | 3,052 | 17.3 | % | $ | 3,127 | $ | 836 | $ | 2,300 | $ | 4.88 | |||||||||||||||||||||||||||||
| Restructuring (income) costs | 37 | 0.2 | % | 37 | 9 | 28 | 0.07 | ||||||||||||||||||||||||||||||||||
Three Months Ended September 30, 2025 - Adjusted | $ | 3,089 | 17.5 | % | $ | 3,164 | $ | 845 | $ | 2,328 | $ | 4.95 | |||||||||||||||||||||||||||||
Three Months Ended September 30, 2024 - U.S. GAAP | $ | 3,147 | 19.5 | % | $ | 3,098 | $ | 642 | $ | 2,464 | $ | 5.06 | |||||||||||||||||||||||||||||
| Restructuring (income) costs | 70 | 0.5 | % | 70 | 16 | 54 | 0.11 | ||||||||||||||||||||||||||||||||||
Three Months Ended September 30, 2024 - Adjusted | $ | 3,217 | 20.0 | % | $ | 3,168 | $ | 658 | $ | 2,518 | $ | 5.17 | |||||||||||||||||||||||||||||
| (Dollars in millions) | Profit Before Taxes | Provision (Benefit) for Income Taxes | Effective Tax Rate | |||||||||||||||||
Three Months Ended September 30, 2025 - U.S. GAAP | $ | 3,127 | 836 | 26.7 | % | |||||||||||||||
| Increase in annual effective tax rate | — | (54) | ||||||||||||||||||
| Changes in estimates related to prior years | — | (41) | ||||||||||||||||||
| Excess stock-based compensation | — | 10 | ||||||||||||||||||
| Annual effective tax rate, excluding discrete items | $ | 3,127 | $ | 751 | 24.0 | % | ||||||||||||||
| Increase in annual effective tax rate | — | 54 | ||||||||||||||||||
| Changes in estimates related to prior years | — | 41 | ||||||||||||||||||
| Excess stock-based compensation | — | (10) | ||||||||||||||||||
| Restructuring (income) costs | 37 | 9 | ||||||||||||||||||
Three Months Ended September 30, 2025 - Adjusted | $ | 3,164 | $ | 845 | ||||||||||||||||
Three Months Ended September 30, 2024 - U.S. GAAP | $ | 3,098 | $ | 642 | 20.7 | % | ||||||||||||||
| Changes in estimates related to prior years | — | 47 | ||||||||||||||||||
| Excess stock-based compensation | — | 7 | ||||||||||||||||||
| Annual effective tax rate, excluding discrete items | $ | 3,098 | $ | 696 | 22.5 | % | ||||||||||||||
| Changes in estimates related to prior years | — | (47) | ||||||||||||||||||
| Excess stock-based compensation | — | (7) | ||||||||||||||||||
| Restructuring (income) costs | 70 | 16 | ||||||||||||||||||
Three Months Ended September 30, 2024 - Adjusted | $ | 3,168 | $ | 658 | ||||||||||||||||
| Three Months Ended September 30, | Nine Months Ended September 30, | ||||||||||||||||||||||
| 2025 | 2024 | 2025 | 2024 | ||||||||||||||||||||
| Sales and revenues: | |||||||||||||||||||||||
| Sales of Machinery, Energy & Transportation | $ | 16,726 | $ | 15,231 | $ | 45,778 | $ | 46,031 | |||||||||||||||
| Revenues of Financial Products | 912 | 875 | 2,678 | 2,563 | |||||||||||||||||||
| Total sales and revenues | 17,638 | 16,106 | 48,456 | 48,594 | |||||||||||||||||||
| Operating costs: | |||||||||||||||||||||||
| Cost of goods sold | 11,673 | 10,066 | 31,445 | 29,878 | |||||||||||||||||||
| Selling, general and administrative expenses | 1,822 | 1,669 | 5,109 | 4,898 | |||||||||||||||||||
| Research and development expenses | 555 | 533 | 1,586 | 1,588 | |||||||||||||||||||
| Interest expense of Financial Products | 346 | 336 | 1,008 | 948 | |||||||||||||||||||
| Other operating (income) expenses | 190 | 355 | 817 | 1,134 | |||||||||||||||||||
| Total operating costs | 14,586 | 12,959 | 39,965 | 38,446 | |||||||||||||||||||
| Operating profit | 3,052 | 3,147 | 8,491 | 10,148 | |||||||||||||||||||
| Interest expense excluding Financial Products | 133 | 125 | 375 | 405 | |||||||||||||||||||
| Other income (expense) | 208 | 76 | 399 | 387 | |||||||||||||||||||
| Consolidated profit before taxes | 3,127 | 3,098 | 8,515 | 10,130 | |||||||||||||||||||
| Provision (benefit) for income taxes | 836 | 642 | 2,056 | 2,166 | |||||||||||||||||||
| Profit of consolidated companies | 2,291 | 2,456 | 6,459 | 7,964 | |||||||||||||||||||
| Equity in profit (loss) of unconsolidated affiliated companies | 8 | 7 | 22 | 34 | |||||||||||||||||||
| Profit of consolidated and affiliated companies | 2,299 | 2,463 | 6,481 | 7,998 | |||||||||||||||||||
| Less: Profit (loss) attributable to noncontrolling interests | (1) | (1) | (1) | (3) | |||||||||||||||||||
Profit 1 | $ | 2,300 | $ | 2,464 | $ | 6,482 | $ | 8,001 | |||||||||||||||
| Profit per common share | $ | 4.91 | $ | 5.09 | $ | 13.76 | $ | 16.36 | |||||||||||||||
Profit per common share — diluted 2 | $ | 4.88 | $ | 5.06 | $ | 13.69 | $ | 16.27 | |||||||||||||||
| Weighted-average common shares outstanding (millions) | |||||||||||||||||||||||
| – Basic | 468.6 | 484.2 | 471.3 | 489.0 | |||||||||||||||||||
– Diluted 2 | 470.8 | 486.7 | 473.4 | 491.7 | |||||||||||||||||||
| 1 | Profit attributable to common shareholders. | ||||
| 2 | Diluted by assumed exercise of stock-based compensation awards using the treasury stock method. | ||||
| September 30, 2025 | December 31, 2024 | ||||||||||
| Assets | |||||||||||
| Current assets: | |||||||||||
| Cash and cash equivalents | $ | 7,538 | $ | 6,889 | |||||||
| Receivables – trade and other | 10,146 | 9,282 | |||||||||
| Receivables – finance | 10,315 | 9,565 | |||||||||
| Prepaid expenses and other current assets | 2,861 | 3,119 | |||||||||
| Inventories | 18,958 | 16,827 | |||||||||
| Total current assets | 49,818 | 45,682 | |||||||||
| Property, plant and equipment – net | 14,310 | 13,361 | |||||||||
| Long-term receivables – trade and other | 1,618 | 1,225 | |||||||||
| Long-term receivables – finance | 13,985 | 13,242 | |||||||||
| Noncurrent deferred and refundable income taxes | 3,000 | 3,312 | |||||||||
| Intangible assets | 281 | 399 | |||||||||
| Goodwill | 5,329 | 5,241 | |||||||||
| Other assets | 5,381 | 5,302 | |||||||||
| Total assets | $ | 93,722 | $ | 87,764 | |||||||
| Liabilities | |||||||||||
| Current liabilities: | |||||||||||
| Short-term borrowings: | |||||||||||
| -- Financial Products | $ | 4,509 | $ | 4,393 | |||||||
| Accounts payable | 8,729 | 7,675 | |||||||||
| Accrued expenses | 5,187 | 5,243 | |||||||||
| Accrued wages, salaries and employee benefits | 2,126 | 2,391 | |||||||||
| Customer advances | 3,391 | 2,322 | |||||||||
| Dividends payable | — | 674 | |||||||||
| Other current liabilities | 2,760 | 2,909 | |||||||||
| Long-term debt due within one year: | |||||||||||
| -- Machinery, Energy & Transportation | 32 | 46 | |||||||||
| -- Financial Products | 9,257 | 6,619 | |||||||||
| Total current liabilities | 35,991 | 32,272 | |||||||||
| Long-term debt due after one year: | |||||||||||
| -- Machinery, Energy & Transportation | 10,669 | 8,564 | |||||||||
| -- Financial Products | 17,067 | 18,787 | |||||||||
| Liability for postemployment benefits | 3,664 | 3,757 | |||||||||
| Other liabilities | 5,672 | 4,890 | |||||||||
| Total liabilities | 73,063 | 68,270 | |||||||||
| Shareholders’ equity | |||||||||||
| Common stock | 6,223 | 6,941 | |||||||||
| Treasury stock | (48,302) | (44,331) | |||||||||
| Profit employed in the business | 64,460 | 59,352 | |||||||||
| Accumulated other comprehensive income (loss) | (1,723) | (2,471) | |||||||||
| Noncontrolling interests | 1 | 3 | |||||||||
| Total shareholders’ equity | 20,659 | 19,494 | |||||||||
| Total liabilities and shareholders’ equity | $ | 93,722 | $ | 87,764 | |||||||
| Nine Months Ended September 30, | |||||||||||
| 2025 | 2024 | ||||||||||
| Cash flow from operating activities: | |||||||||||
| Profit of consolidated and affiliated companies | $ | 6,481 | $ | 7,998 | |||||||
| Adjustments to reconcile profit to net cash provided by operating activities: | |||||||||||
| Depreciation and amortization | 1,664 | 1,598 | |||||||||
| Provision (benefit) for deferred income taxes | 300 | (329) | |||||||||
| (Gain) loss on divestiture | — | 164 | |||||||||
| Other | 509 | 221 | |||||||||
| Changes in assets and liabilities, net of acquisitions and divestitures: | |||||||||||
| Receivables – trade and other | (788) | (30) | |||||||||
| Inventories | (2,015) | (781) | |||||||||
| Accounts payable | 1,086 | (96) | |||||||||
| Accrued expenses | 51 | 9 | |||||||||
| Accrued wages, salaries and employee benefits | (296) | (671) | |||||||||
| Customer advances | 1,649 | 476 | |||||||||
| Other assets – net | (138) | 120 | |||||||||
| Other liabilities – net | (355) | (37) | |||||||||
| Net cash provided by (used for) operating activities | 8,148 | 8,642 | |||||||||
| Cash flow from investing activities: | |||||||||||
| Capital expenditures – excluding equipment leased to others | (1,923) | (1,285) | |||||||||
| Expenditures for equipment leased to others | (1,021) | (893) | |||||||||
| Proceeds from disposals of leased assets and property, plant and equipment | 544 | 541 | |||||||||
| Additions to finance receivables | (10,964) | (11,457) | |||||||||
| Collections of finance receivables | 9,890 | 10,234 | |||||||||
| Proceeds from sale of finance receivables | 26 | 69 | |||||||||
| Investments and acquisitions (net of cash acquired) | (26) | (32) | |||||||||
| Proceeds from sale of businesses and investments (net of cash sold) | 12 | (67) | |||||||||
| Proceeds from maturities and sale of securities | 1,945 | 2,841 | |||||||||
| Investments in securities | (1,291) | (892) | |||||||||
| Other – net | (19) | 137 | |||||||||
| Net cash provided by (used for) investing activities | (2,827) | (804) | |||||||||
| Cash flow from financing activities: | |||||||||||
| Dividends paid | (2,043) | (1,966) | |||||||||
| Common stock issued, and other stock compensation transactions, net | (39) | 15 | |||||||||
| Payments to purchase common stock | (4,850) | (7,057) | |||||||||
| Excise tax paid on purchases of common stock | (73) | — | |||||||||
| Proceeds from debt issued (original maturities greater than three months) | 8,454 | 7,579 | |||||||||
| Payments on debt (original maturities greater than three months) | (6,205) | (6,862) | |||||||||
| Short-term borrowings – net (original maturities three months or less) | 106 | (848) | |||||||||
| Net cash provided by (used for) financing activities | (4,650) | (9,139) | |||||||||
| Effect of exchange rate changes on cash | (23) | (39) | |||||||||
| Increase (decrease) in cash, cash equivalents and restricted cash | 648 | (1,340) | |||||||||
| Cash, cash equivalents and restricted cash at beginning of period | 6,896 | 6,985 | |||||||||
| Cash, cash equivalents and restricted cash at end of period | $ | 7,544 | $ | 5,645 | |||||||
Cash equivalents primarily represent short-term, highly liquid investments with original maturities of generally three months or less. | ||
| Supplemental Consolidating Data | ||||||||||||||||||||||||||
| Consolidated | Machinery, Energy & Transportation | Financial Products | Consolidating Adjustments | |||||||||||||||||||||||
| Sales and revenues: | ||||||||||||||||||||||||||
| Sales of Machinery, Energy & Transportation | $ | 16,726 | $ | 16,726 | $ | — | $ | — | ||||||||||||||||||
| Revenues of Financial Products | 912 | — | 1,115 | (203) | 1 | |||||||||||||||||||||
| Total sales and revenues | 17,638 | 16,726 | 1,115 | (203) | ||||||||||||||||||||||
| Operating costs: | ||||||||||||||||||||||||||
| Cost of goods sold | 11,673 | 11,675 | — | (2) | 2 | |||||||||||||||||||||
| Selling, general and administrative expenses | 1,822 | 1,608 | 218 | (4) | 2 | |||||||||||||||||||||
| Research and development expenses | 555 | 555 | — | — | ||||||||||||||||||||||
| Interest expense of Financial Products | 346 | — | 358 | (12) | 2 | |||||||||||||||||||||
| Other operating (income) expenses | 190 | (114) | 336 | (32) | 2 | |||||||||||||||||||||
| Total operating costs | 14,586 | 13,724 | 912 | (50) | ||||||||||||||||||||||
| Operating profit | 3,052 | 3,002 | 203 | (153) | ||||||||||||||||||||||
| Interest expense excluding Financial Products | 133 | 136 | — | (3) | 3 | |||||||||||||||||||||
| Other income (expense) | 208 | 25 | 33 | 150 | 4 | |||||||||||||||||||||
| Consolidated profit before taxes | 3,127 | 2,891 | 236 | — | ||||||||||||||||||||||
| Provision (benefit) for income taxes | 836 | 773 | 63 | — | ||||||||||||||||||||||
| Profit of consolidated companies | 2,291 | 2,118 | 173 | — | ||||||||||||||||||||||
| Equity in profit (loss) of unconsolidated affiliated companies | 8 | 8 | — | — | ||||||||||||||||||||||
| Profit of consolidated and affiliated companies | 2,299 | 2,126 | 173 | — | ||||||||||||||||||||||
| Less: Profit (loss) attributable to noncontrolling interests | (1) | (1) | — | — | ||||||||||||||||||||||
Profit 5 | $ | 2,300 | $ | 2,127 | $ | 173 | $ | — | ||||||||||||||||||
| 1 | Elimination of Financial Products’ revenues earned from ME&T. | ||||
| 2 | Elimination of net expenses recorded between ME&T and Financial Products. | ||||
| 3 | Elimination of interest expense recorded between Financial Products and ME&T. | ||||
| 4 | Elimination of discount recorded by ME&T on receivables sold to Financial Products and of interest earned between ME&T and Financial Products as well as dividends paid by Financial Products to ME&T. | ||||
| 5 | Profit attributable to common shareholders. | ||||
| Supplemental Consolidating Data | ||||||||||||||||||||||||||
| Consolidated | Machinery, Energy & Transportation | Financial Products | Consolidating Adjustments | |||||||||||||||||||||||
| Sales and revenues: | ||||||||||||||||||||||||||
| Sales of Machinery, Energy & Transportation | $ | 15,231 | $ | 15,231 | $ | — | $ | — | ||||||||||||||||||
| Revenues of Financial Products | 875 | — | 1,078 | (203) | 1 | |||||||||||||||||||||
| Total sales and revenues | 16,106 | 15,231 | 1,078 | (203) | ||||||||||||||||||||||
| Operating costs: | ||||||||||||||||||||||||||
| Cost of goods sold | 10,066 | 10,067 | — | (1) | 2 | |||||||||||||||||||||
| Selling, general and administrative expenses | 1,669 | 1,484 | 197 | (12) | 2 | |||||||||||||||||||||
| Research and development expenses | 533 | 533 | — | — | ||||||||||||||||||||||
| Interest expense of Financial Products | 336 | — | 336 | — | ||||||||||||||||||||||
| Other operating (income) expenses | 355 | 49 | 329 | (23) | 2 | |||||||||||||||||||||
| Total operating costs | 12,959 | 12,133 | 862 | (36) | ||||||||||||||||||||||
| Operating profit | 3,147 | 3,098 | 216 | (167) | ||||||||||||||||||||||
| Interest expense excluding Financial Products | 125 | 127 | — | (2) | ||||||||||||||||||||||
| Other income (expense) | 76 | (122) | 33 | 165 | 3 | |||||||||||||||||||||
| Consolidated profit before taxes | 3,098 | 2,849 | 249 | — | ||||||||||||||||||||||
| Provision (benefit) for income taxes | 642 | 582 | 60 | — | ||||||||||||||||||||||
| Profit of consolidated companies | 2,456 | 2,267 | 189 | — | ||||||||||||||||||||||
| Equity in profit (loss) of unconsolidated affiliated companies | 7 | 7 | — | — | ||||||||||||||||||||||
| Profit of consolidated and affiliated companies | 2,463 | 2,274 | 189 | — | ||||||||||||||||||||||
| Less: Profit (loss) attributable to noncontrolling interests | (1) | (1) | — | — | ||||||||||||||||||||||
Profit 4 | $ | 2,464 | $ | 2,275 | $ | 189 | $ | — | ||||||||||||||||||
| 1 | Elimination of Financial Products’ revenues earned from ME&T. | ||||
| 2 | Elimination of net expenses recorded by ME&T paid to Financial Products. | ||||
| 3 | Elimination of discount recorded by ME&T on receivables sold to Financial Products and of interest earned between ME&T and Financial Products as well as dividends paid by Financial Products to ME&T. | ||||
| 4 | Profit attributable to common shareholders. | ||||
| Supplemental Consolidating Data | ||||||||||||||||||||||||||
| Consolidated | Machinery, Energy & Transportation | Financial Products | Consolidating Adjustments | |||||||||||||||||||||||
| Sales and revenues: | ||||||||||||||||||||||||||
| Sales of Machinery, Energy & Transportation | $ | 45,778 | $ | 45,778 | $ | — | $ | — | ||||||||||||||||||
| Revenues of Financial Products | 2,678 | — | 3,244 | (566) | 1 | |||||||||||||||||||||
| Total sales and revenues | 48,456 | 45,778 | 3,244 | (566) | ||||||||||||||||||||||
| Operating costs: | ||||||||||||||||||||||||||
| Cost of goods sold | 31,445 | 31,451 | — | (6) | 2 | |||||||||||||||||||||
| Selling, general and administrative expenses | 5,109 | 4,513 | 623 | (27) | 2 | |||||||||||||||||||||
| Research and development expenses | 1,586 | 1,586 | — | — | ||||||||||||||||||||||
| Interest expense of Financial Products | 1,008 | — | 1,026 | (18) | 2 | |||||||||||||||||||||
| Other operating (income) expenses | 817 | (84) | 979 | (78) | 2 | |||||||||||||||||||||
| Total operating costs | 39,965 | 37,466 | 2,628 | (129) | ||||||||||||||||||||||
| Operating profit | 8,491 | 8,312 | 616 | (437) | ||||||||||||||||||||||
| Interest expense excluding Financial Products | 375 | 385 | — | (10) | 3 | |||||||||||||||||||||
| Other income (expense) | 399 | (121) | 93 | 427 | 4 | |||||||||||||||||||||
| Consolidated profit before taxes | 8,515 | 7,806 | 709 | — | ||||||||||||||||||||||
| Provision (benefit) for income taxes | 2,056 | 1,878 | 178 | — | ||||||||||||||||||||||
| Profit of consolidated companies | 6,459 | 5,928 | 531 | — | ||||||||||||||||||||||
| Equity in profit (loss) of unconsolidated affiliated companies | 22 | 22 | — | — | ||||||||||||||||||||||
| Profit of consolidated and affiliated companies | 6,481 | 5,950 | 531 | — | ||||||||||||||||||||||
| Less: Profit (loss) attributable to noncontrolling interests | (1) | (2) | 1 | — | ||||||||||||||||||||||
Profit 5 | $ | 6,482 | $ | 5,952 | $ | 530 | $ | — | ||||||||||||||||||
| 1 | Elimination of Financial Products’ revenues earned from ME&T. | ||||
| 2 | Elimination of net expenses recorded between ME&T and Financial Products. | ||||
| 3 | Elimination of interest expense recorded between Financial Products and ME&T. | ||||
| 4 | Elimination of discount recorded by ME&T on receivables sold to Financial Products and of interest earned between ME&T and Financial Products as well as dividends paid by Financial Products to ME&T. | ||||
| 5 | Profit attributable to common shareholders. | ||||
| Supplemental Consolidating Data | ||||||||||||||||||||||||||
| Consolidated | Machinery, Energy & Transportation | Financial Products | Consolidating Adjustments | |||||||||||||||||||||||
| Sales and revenues: | ||||||||||||||||||||||||||
| Sales of Machinery, Energy & Transportation | $ | 46,031 | $ | 46,031 | $ | — | $ | — | ||||||||||||||||||
| Revenues of Financial Products | 2,563 | — | 3,150 | (587) | 1 | |||||||||||||||||||||
| Total sales and revenues | 48,594 | 46,031 | 3,150 | (587) | ||||||||||||||||||||||
| Operating costs: | ||||||||||||||||||||||||||
| Cost of goods sold | 29,878 | 29,883 | — | (5) | 2 | |||||||||||||||||||||
| Selling, general and administrative expenses | 4,898 | 4,346 | 560 | (8) | 2 | |||||||||||||||||||||
| Research and development expenses | 1,588 | 1,588 | — | — | ||||||||||||||||||||||
| Interest expense of Financial Products | 948 | — | 948 | — | ||||||||||||||||||||||
| Other operating (income) expenses | 1,134 | 51 | 1,174 | (91) | 2 | |||||||||||||||||||||
| Total operating costs | 38,446 | 35,868 | 2,682 | (104) | ||||||||||||||||||||||
| Operating profit | 10,148 | 10,163 | 468 | (483) | ||||||||||||||||||||||
| Interest expense excluding Financial Products | 405 | 407 | — | (2) | ||||||||||||||||||||||
| Other income (expense) | 387 | (163) | 69 | 481 | 3 | |||||||||||||||||||||
| Consolidated profit before taxes | 10,130 | 9,593 | 537 | — | ||||||||||||||||||||||
| Provision (benefit) for income taxes | 2,166 | 1,983 | 183 | — | ||||||||||||||||||||||
| Profit of consolidated companies | 7,964 | 7,610 | 354 | — | ||||||||||||||||||||||
| Equity in profit (loss) of unconsolidated affiliated companies | 34 | 34 | — | — | ||||||||||||||||||||||
| Profit of consolidated and affiliated companies | 7,998 | 7,644 | 354 | — | ||||||||||||||||||||||
| Less: Profit (loss) attributable to noncontrolling interests | (3) | (4) | 1 | — | ||||||||||||||||||||||
Profit 4 | $ | 8,001 | $ | 7,648 | $ | 353 | $ | — | ||||||||||||||||||
| 1 | Elimination of Financial Products’ revenues earned from ME&T. | ||||
| 2 | Elimination of net expenses recorded between ME&T and Financial Products. | ||||
| 3 | Elimination of discount recorded by ME&T on receivables sold to Financial Products and of interest earned between ME&T and Financial Products as well as dividends paid by Financial Products to ME&T. | ||||
| 4 | Profit attributable to common shareholders. | ||||
| Supplemental Consolidating Data | ||||||||||||||||||||||||||
| Consolidated | Machinery, Energy & Transportation | Financial Products | Consolidating Adjustments | |||||||||||||||||||||||
| Assets | ||||||||||||||||||||||||||
| Current assets: | ||||||||||||||||||||||||||
| Cash and cash equivalents | $ | 7,538 | $ | 6,633 | $ | 905 | $ | — | ||||||||||||||||||
| Receivables – trade and other | 10,146 | 3,531 | 542 | 6,073 | 1,2 | |||||||||||||||||||||
| Receivables – finance | 10,315 | — | 16,665 | (6,350) | 2 | |||||||||||||||||||||
| Prepaid expenses and other current assets | 2,861 | 2,659 | 440 | (238) | 3 | |||||||||||||||||||||
| Inventories | 18,958 | 18,958 | — | — | ||||||||||||||||||||||
| Total current assets | 49,818 | 31,781 | 18,552 | (515) | ||||||||||||||||||||||
| Property, plant and equipment – net | 14,310 | 10,348 | 3,962 | — | ||||||||||||||||||||||
| Long-term receivables – trade and other | 1,618 | 1,712 | 166 | (260) | 1,2 | |||||||||||||||||||||
| Long-term receivables – finance | 13,985 | — | 14,948 | (963) | 2 | |||||||||||||||||||||
| Noncurrent deferred and refundable income taxes | 3,000 | 3,264 | 130 | (394) | 4 | |||||||||||||||||||||
| Intangible assets | 281 | 281 | — | — | ||||||||||||||||||||||
| Goodwill | 5,329 | 5,329 | — | — | ||||||||||||||||||||||
| Other assets | 5,381 | 3,923 | 2,468 | (1,010) | 5 | |||||||||||||||||||||
| Total assets | $ | 93,722 | $ | 56,638 | $ | 40,226 | $ | (3,142) | ||||||||||||||||||
| Liabilities | ||||||||||||||||||||||||||
| Current liabilities: | ||||||||||||||||||||||||||
| Short-term borrowings | $ | 4,509 | $ | — | $ | 4,509 | $ | — | ||||||||||||||||||
| Accounts payable | 8,729 | 8,636 | 391 | (298) | 6,7 | |||||||||||||||||||||
| Accrued expenses | 5,187 | 4,558 | 629 | — | ||||||||||||||||||||||
| Accrued wages, salaries and employee benefits | 2,126 | 2,081 | 45 | — | ||||||||||||||||||||||
| Customer advances | 3,391 | 3,359 | 3 | 29 | 7 | |||||||||||||||||||||
| Dividends payable | — | — | — | — | ||||||||||||||||||||||
| Other current liabilities | 2,760 | 2,209 | 806 | (255) | 4,5,8 | |||||||||||||||||||||
| Long-term debt due within one year | 9,289 | 32 | 9,257 | — | ||||||||||||||||||||||
| Total current liabilities | 35,991 | 20,875 | 15,640 | (524) | ||||||||||||||||||||||
| Long-term debt due after one year | 27,736 | 10,899 | 18,067 | (1,230) | 7,9 | |||||||||||||||||||||
| Liability for postemployment benefits | 3,664 | 3,663 | 1 | — | ||||||||||||||||||||||
| Other liabilities | 5,672 | 4,679 | 1,407 | (414) | 4,5 | |||||||||||||||||||||
| Total liabilities | 73,063 | 40,116 | 35,115 | (2,168) | ||||||||||||||||||||||
| Shareholders’ equity | ||||||||||||||||||||||||||
| Common stock | 6,223 | 6,223 | 905 | (905) | 10 | |||||||||||||||||||||
| Treasury stock | (48,302) | (48,302) | — | — | ||||||||||||||||||||||
| Profit employed in the business | 64,460 | 59,365 | 5,085 | 10 | 10 | |||||||||||||||||||||
| Accumulated other comprehensive income (loss) | (1,723) | (768) | (955) | — | ||||||||||||||||||||||
| Noncontrolling interests | 1 | 4 | 76 | (79) | 10 | |||||||||||||||||||||
| Total shareholders’ equity | 20,659 | 16,522 | 5,111 | (974) | ||||||||||||||||||||||
| Total liabilities and shareholders’ equity | $ | 93,722 | $ | 56,638 | $ | 40,226 | $ | (3,142) | ||||||||||||||||||
| 1 | Elimination of receivables between ME&T and Financial Products. | ||||
| 2 | Reclassification of ME&T’s trade receivables purchased by Financial Products and Financial Products’ wholesale inventory receivables. | ||||
| 3 | Elimination of ME&T's insurance premiums that are prepaid to Financial Products. | ||||
| 4 | Reclassification reflecting required netting of deferred tax assets/liabilities by taxing jurisdiction. | ||||
| 5 | Elimination of other intercompany assets and liabilities between ME&T and Financial Products. | ||||
| 6 | Elimination of payables between ME&T and Financial Products. | ||||
| 7 | Reclassification of Financial Products' payables to customer advances. | ||||
| 8 | Elimination of prepaid insurance in Financial Products’ other liabilities. | ||||
| 9 | Elimination of debt between ME&T and Financial Products. | ||||
| 10 | Eliminations associated with ME&T’s investments in Financial Products’ subsidiaries. | ||||
| Supplemental Consolidating Data | ||||||||||||||||||||||||||
| Consolidated | Machinery, Energy & Transportation | Financial Products | Consolidating Adjustments | |||||||||||||||||||||||
| Assets | ||||||||||||||||||||||||||
| Current assets: | ||||||||||||||||||||||||||
| Cash and cash equivalents | $ | 6,889 | $ | 6,165 | $ | 724 | $ | — | ||||||||||||||||||
| Receivables – trade and other | 9,282 | 3,463 | 688 | 5,131 | 1,2 | |||||||||||||||||||||
| Receivables – finance | 9,565 | — | 14,957 | (5,392) | 2 | |||||||||||||||||||||
| Prepaid expenses and other current assets | 3,119 | 2,872 | 401 | (154) | 3 | |||||||||||||||||||||
| Inventories | 16,827 | 16,827 | — | — | ||||||||||||||||||||||
| Total current assets | 45,682 | 29,327 | 16,770 | (415) | ||||||||||||||||||||||
| Property, plant and equipment – net | 13,361 | 9,531 | 3,830 | — | ||||||||||||||||||||||
| Long-term receivables – trade and other | 1,225 | 500 | 86 | 639 | 1,2 | |||||||||||||||||||||
| Long-term receivables – finance | 13,242 | — | 14,048 | (806) | 2 | |||||||||||||||||||||
| Noncurrent deferred and refundable income taxes | 3,312 | 3,594 | 118 | (400) | 4 | |||||||||||||||||||||
| Intangible assets | 399 | 399 | — | — | ||||||||||||||||||||||
| Goodwill | 5,241 | 5,241 | — | — | ||||||||||||||||||||||
| Other assets | 5,302 | 4,050 | 2,277 | (1,025) | 5 | |||||||||||||||||||||
| Total assets | $ | 87,764 | $ | 52,642 | $ | 37,129 | $ | (2,007) | ||||||||||||||||||
| Liabilities | ||||||||||||||||||||||||||
| Current liabilities: | ||||||||||||||||||||||||||
| Short-term borrowings | $ | 4,393 | $ | — | $ | 4,393 | $ | — | ||||||||||||||||||
| Accounts payable | 7,675 | 7,619 | 331 | (275) | 6,7 | |||||||||||||||||||||
| Accrued expenses | 5,243 | 4,589 | 654 | — | ||||||||||||||||||||||
| Accrued wages, salaries and employee benefits | 2,391 | 2,335 | 56 | — | ||||||||||||||||||||||
| Customer advances | 2,322 | 2,305 | 3 | 14 | 7 | |||||||||||||||||||||
| Dividends payable | 674 | 674 | — | — | ||||||||||||||||||||||
| Other current liabilities | 2,909 | 2,388 | 696 | (175) | 4,8 | |||||||||||||||||||||
| Long-term debt due within one year | 6,665 | 46 | 6,619 | — | ||||||||||||||||||||||
| Total current liabilities | 32,272 | 19,956 | 12,752 | (436) | ||||||||||||||||||||||
| Long-term debt due after one year | 27,351 | 8,731 | 18,787 | (167) | 9 | |||||||||||||||||||||
| Liability for postemployment benefits | 3,757 | 3,757 | — | — | ||||||||||||||||||||||
| Other liabilities | 4,890 | 3,977 | 1,344 | (431) | 4 | |||||||||||||||||||||
| Total liabilities | 68,270 | 36,421 | 32,883 | (1,034) | ||||||||||||||||||||||
| Shareholders’ equity | ||||||||||||||||||||||||||
| Common stock | 6,941 | 6,941 | 905 | (905) | 10 | |||||||||||||||||||||
| Treasury stock | (44,331) | (44,331) | — | — | ||||||||||||||||||||||
| Profit employed in the business | 59,352 | 54,787 | 4,555 | 10 | 10 | |||||||||||||||||||||
| Accumulated other comprehensive income (loss) | (2,471) | (1,182) | (1,289) | — | ||||||||||||||||||||||
| Noncontrolling interests | 3 | 6 | 75 | (78) | 10 | |||||||||||||||||||||
| Total shareholders’ equity | 19,494 | 16,221 | 4,246 | (973) | ||||||||||||||||||||||
| Total liabilities and shareholders’ equity | $ | 87,764 | $ | 52,642 | $ | 37,129 | $ | (2,007) | ||||||||||||||||||
| 1 | Elimination of receivables between ME&T and Financial Products. | ||||
| 2 | Reclassification of ME&T’s trade receivables purchased by Financial Products and Financial Products’ wholesale inventory receivables. | ||||
| 3 | Elimination of ME&T’s insurance premiums that are prepaid to Financial Products. | ||||
| 4 | Reclassification reflecting required netting of deferred tax assets/liabilities by taxing jurisdiction. | ||||
| 5 | Elimination of other intercompany assets and liabilities between ME&T and Financial Products. | ||||
| 6 | Elimination of payables between ME&T and Financial Products. | ||||
| 7 | Reclassification of Financial Products' payables to customer advances. | ||||
| 8 | Elimination of prepaid insurance in Financial Products’ other liabilities. | ||||
| 9 | Elimination of debt between ME&T and Financial Products. | ||||
| 10 | Eliminations associated with ME&T’s investments in Financial Products’ subsidiaries. | ||||
| Supplemental Consolidating Data | ||||||||||||||||||||||||||
| Consolidated | Machinery, Energy & Transportation | Financial Products | Consolidating Adjustments | |||||||||||||||||||||||
| Cash flow from operating activities: | ||||||||||||||||||||||||||
| Profit of consolidated and affiliated companies | $ | 6,481 | $ | 5,950 | $ | 531 | $ | — | ||||||||||||||||||
| Adjustments to reconcile profit to net cash provided by operating activities: | ||||||||||||||||||||||||||
| Depreciation and amortization | 1,664 | 1,096 | 568 | — | ||||||||||||||||||||||
| Provision (benefit) for deferred income taxes | 300 | 308 | (8) | — | ||||||||||||||||||||||
| Other | 509 | 431 | (412) | 490 | 1 | |||||||||||||||||||||
| Changes in assets and liabilities, net of acquisitions and divestitures: | ||||||||||||||||||||||||||
| Receivables – trade and other | (788) | 89 | 102 | (979) | 1,2 | |||||||||||||||||||||
| Inventories | (2,015) | (2,012) | — | (3) | 1 | |||||||||||||||||||||
| Accounts payable | 1,086 | 1,051 | 44 | (9) | 1 | |||||||||||||||||||||
| Accrued expenses | 51 | 161 | (110) | — | ||||||||||||||||||||||
| Accrued wages, salaries and employee benefits | (296) | (284) | (12) | — | ||||||||||||||||||||||
| Customer advances | 1,649 | 1,649 | — | — | ||||||||||||||||||||||
| Other assets – net | (138) | (219) | 15 | 66 | 1 | |||||||||||||||||||||
| Other liabilities – net | (355) | (475) | 176 | (56) | 1 | |||||||||||||||||||||
| Net cash provided by (used for) operating activities | 8,148 | 7,745 | 894 | (491) | ||||||||||||||||||||||
| Cash flow from investing activities: | ||||||||||||||||||||||||||
| Capital expenditures – excluding equipment leased to others | (1,923) | (1,920) | (33) | 30 | 1 | |||||||||||||||||||||
| Expenditures for equipment leased to others | (1,021) | (24) | (1,004) | 7 | 1 | |||||||||||||||||||||
| Proceeds from disposals of leased assets and property, plant and equipment | 544 | 54 | 524 | (34) | 1 | |||||||||||||||||||||
| Additions to finance receivables | (10,964) | — | (12,668) | 1,704 | 2 | |||||||||||||||||||||
| Collections of finance receivables | 9,890 | — | 11,347 | (1,457) | 2 | |||||||||||||||||||||
| Net intercompany purchased receivables | — | — | (241) | 241 | 2 | |||||||||||||||||||||
| Proceeds from sale of finance receivables | 26 | — | 26 | — | ||||||||||||||||||||||
| Additions to intercompany receivables (original maturities greater than three months) | — | (1,000) | — | 1,000 | 3 | |||||||||||||||||||||
| Collections of intercompany receivables (original maturities greater than three months) | — | — | 56 | (56) | 3 | |||||||||||||||||||||
| Investments and acquisitions (net of cash acquired) | (26) | (26) | — | — | ||||||||||||||||||||||
| Proceeds from sale of businesses and investments (net of cash sold) | 12 | 12 | — | — | ||||||||||||||||||||||
| Proceeds from maturities and sale of securities | 1,945 | 1,259 | 686 | — | ||||||||||||||||||||||
| Investments in securities | (1,291) | (510) | (781) | — | ||||||||||||||||||||||
| Other – net | (19) | 43 | (62) | — | ||||||||||||||||||||||
| Net cash provided by (used for) investing activities | (2,827) | (2,112) | (2,150) | 1,435 | ||||||||||||||||||||||
| Cash flow from financing activities: | ||||||||||||||||||||||||||
| Dividends paid | (2,043) | (2,043) | — | — | ||||||||||||||||||||||
| Common stock issued, and other stock compensation transactions, net | (39) | (39) | — | — | ||||||||||||||||||||||
| Payments to purchase common stock | (4,850) | (4,850) | — | — | ||||||||||||||||||||||
| Excise tax paid on purchases of common stock | (73) | (73) | — | — | ||||||||||||||||||||||
| Proceeds from intercompany borrowings (original maturities greater than three months) | — | — | 1,000 | (1,000) | 3 | |||||||||||||||||||||
| Payments on intercompany borrowings (original maturities greater than three months) | — | (56) | — | 56 | 3 | |||||||||||||||||||||
| Proceeds from debt issued (original maturities greater than three months) | 8,454 | 1,976 | 6,478 | — | ||||||||||||||||||||||
| Payments on debt (original maturities greater than three months) | (6,205) | (43) | (6,162) | — | ||||||||||||||||||||||
| Short-term borrowings – net (original maturities three months or less) | 106 | — | 106 | — | ||||||||||||||||||||||
| Net cash provided by (used for) financing activities | (4,650) | (5,128) | 1,422 | (944) | ||||||||||||||||||||||
| Effect of exchange rate changes on cash | (23) | (39) | 16 | — | ||||||||||||||||||||||
| Increase (decrease) in cash, cash equivalents and restricted cash | 648 | 466 | 182 | — | ||||||||||||||||||||||
| Cash, cash equivalents and restricted cash at beginning of period | 6,896 | 6,170 | 726 | — | ||||||||||||||||||||||
| Cash, cash equivalents and restricted cash at end of period | $ | 7,544 | $ | 6,636 | $ | 908 | $ | — | ||||||||||||||||||
| 1 | Elimination of non-cash adjustments and changes in assets and liabilities related to consolidated reporting. | ||||
| 2 | Reclassification of Financial Products’ cash flow activity from investing to operating for receivables that arose from the sale of inventory. | ||||
| 3 | Elimination of proceeds and payments to/from ME&T and Financial Products. | ||||
| Supplemental Consolidating Data | ||||||||||||||||||||||||||
| Consolidated | Machinery, Energy & Transportation | Financial Products | Consolidating Adjustments | |||||||||||||||||||||||
| Cash flow from operating activities: | ||||||||||||||||||||||||||
| Profit of consolidated and affiliated companies | $ | 7,998 | $ | 7,644 | $ | 354 | $ | — | ||||||||||||||||||
| Adjustments to reconcile profit to net cash provided by operating activities: | ||||||||||||||||||||||||||
| Depreciation and amortization | 1,598 | 1,010 | 588 | — | ||||||||||||||||||||||
| Provision (benefit) for deferred income taxes | (329) | (277) | (52) | — | ||||||||||||||||||||||
| (Gain) loss on divestiture | 164 | (46) | 210 | — | ||||||||||||||||||||||
| Other | 221 | 236 | (447) | 432 | 1 | |||||||||||||||||||||
| Changes in assets and liabilities, net of acquisitions and divestitures: | ||||||||||||||||||||||||||
| Receivables – trade and other | (30) | 554 | (17) | (567) | 1,2 | |||||||||||||||||||||
| Inventories | (781) | (770) | — | (11) | 1 | |||||||||||||||||||||
| Accounts payable | (96) | (79) | (40) | 23 | 1 | |||||||||||||||||||||
| Accrued expenses | 9 | — | 9 | — | ||||||||||||||||||||||
| Accrued wages, salaries and employee benefits | (671) | (660) | (11) | — | ||||||||||||||||||||||
| Customer advances | 476 | 475 | 1 | — | ||||||||||||||||||||||
| Other assets – net | 120 | (226) | 191 | 155 | 1 | |||||||||||||||||||||
| Other liabilities – net | (37) | (135) | 232 | (134) | 1 | |||||||||||||||||||||
| Net cash provided by (used for) operating activities | 8,642 | 7,726 | 1,018 | (102) | ||||||||||||||||||||||
| Cash flow from investing activities: | ||||||||||||||||||||||||||
| Capital expenditures – excluding equipment leased to others | (1,285) | (1,264) | (25) | 4 | 1 | |||||||||||||||||||||
| Expenditures for equipment leased to others | (893) | (20) | (889) | 16 | 1 | |||||||||||||||||||||
| Proceeds from disposals of leased assets and property, plant and equipment | 541 | 25 | 525 | (9) | 1 | |||||||||||||||||||||
| Additions to finance receivables | (11,457) | — | (12,271) | 814 | 2 | |||||||||||||||||||||
| Collections of finance receivables | 10,234 | — | 10,889 | (655) | 2 | |||||||||||||||||||||
| Net intercompany purchased receivables | — | — | 68 | (68) | 2 | |||||||||||||||||||||
| Proceeds from sale of finance receivables | 69 | — | 69 | — | ||||||||||||||||||||||
| Net intercompany borrowings | — | — | 15 | (15) | 3 | |||||||||||||||||||||
| Investments and acquisitions (net of cash acquired) | (32) | (32) | — | — | ||||||||||||||||||||||
| Proceeds from sale of businesses and investments (net of cash sold) | (67) | 86 | (153) | — | ||||||||||||||||||||||
| Proceeds from maturities and sale of securities | 2,841 | 2,565 | 276 | — | ||||||||||||||||||||||
| Investments in securities | (892) | (469) | (423) | — | ||||||||||||||||||||||
| Other – net | 137 | 118 | 19 | — | ||||||||||||||||||||||
| Net cash provided by (used for) investing activities | (804) | 1,009 | (1,900) | 87 | ||||||||||||||||||||||
| Cash flow from financing activities: | ||||||||||||||||||||||||||
| Dividends paid | (1,966) | (1,966) | — | — | ||||||||||||||||||||||
| Common stock issued, including treasury shares reissued | 15 | 15 | — | — | ||||||||||||||||||||||
| Payments to purchase common stock | (7,057) | (7,057) | — | — | ||||||||||||||||||||||
| Net intercompany borrowings | — | (15) | — | 15 | 3 | |||||||||||||||||||||
| Proceeds from debt issued (original maturities greater than three months) | 7,579 | — | 7,579 | — | ||||||||||||||||||||||
| Payments on debt (original maturities greater than three months) | (6,862) | (1,021) | (5,841) | — | ||||||||||||||||||||||
| Short-term borrowings – net (original maturities three months or less) | (848) | — | (848) | — | ||||||||||||||||||||||
| Net cash provided by (used for) financing activities | (9,139) | (10,044) | 890 | 15 | ||||||||||||||||||||||
| Effect of exchange rate changes on cash | (39) | (37) | (2) | — | ||||||||||||||||||||||
| Increase (decrease) in cash, cash equivalents and restricted cash | (1,340) | (1,346) | 6 | — | ||||||||||||||||||||||
| Cash, cash equivalents and restricted cash at beginning of period | 6,985 | 6,111 | 874 | — | ||||||||||||||||||||||
| Cash, cash equivalents and restricted cash at end of period | $ | 5,645 | $ | 4,765 | $ | 880 | $ | — | ||||||||||||||||||
| 1 | Elimination of non-cash adjustments and changes in assets and liabilities related to consolidated reporting. | ||||
| 2 | Reclassification of Financial Products’ cash flow activity from investing to operating for receivables that arose from the sale of inventory. | ||||
| 3 | Elimination of net proceeds and payments to/from ME&T and Financial Products. | ||||