| ● | Fourth-quarter 2025 sales and revenues were $19.1 billion; full-year sales and revenues were $67.6 billion | ||||
| ● | Fourth-quarter 2025 profit per share of $5.12; adjusted profit per share of $5.16 | ||||
| ● | Full-year profit per share of $18.81; adjusted profit per share of $19.06 | ||||
| ● | Strong full-year enterprise operating cash flow of $11.7 billion; ended 2025 with $10.0 billion of enterprise cash | ||||
| ● | Deployed $7.9 billion of cash for share repurchases and dividends in 2025 | ||||
| Fourth Quarter | Full Year | |||||||||||||||||||
| ($ in billions except profit per share) | 2025 | 2024 | 2025 | 2024 | ||||||||||||||||
| Sales and Revenues | $19.1 | $16.2 | $67.6 | $64.8 | ||||||||||||||||
| Profit Per Share | $5.12 | $5.78 | $18.81 | $22.05 | ||||||||||||||||
| Adjusted Profit Per Share | $5.16 | $5.14 | $19.06 | $21.90 | ||||||||||||||||
| Sales and Revenues by Segment | |||||||||||||||||||||||||||||||||||||||||||||||
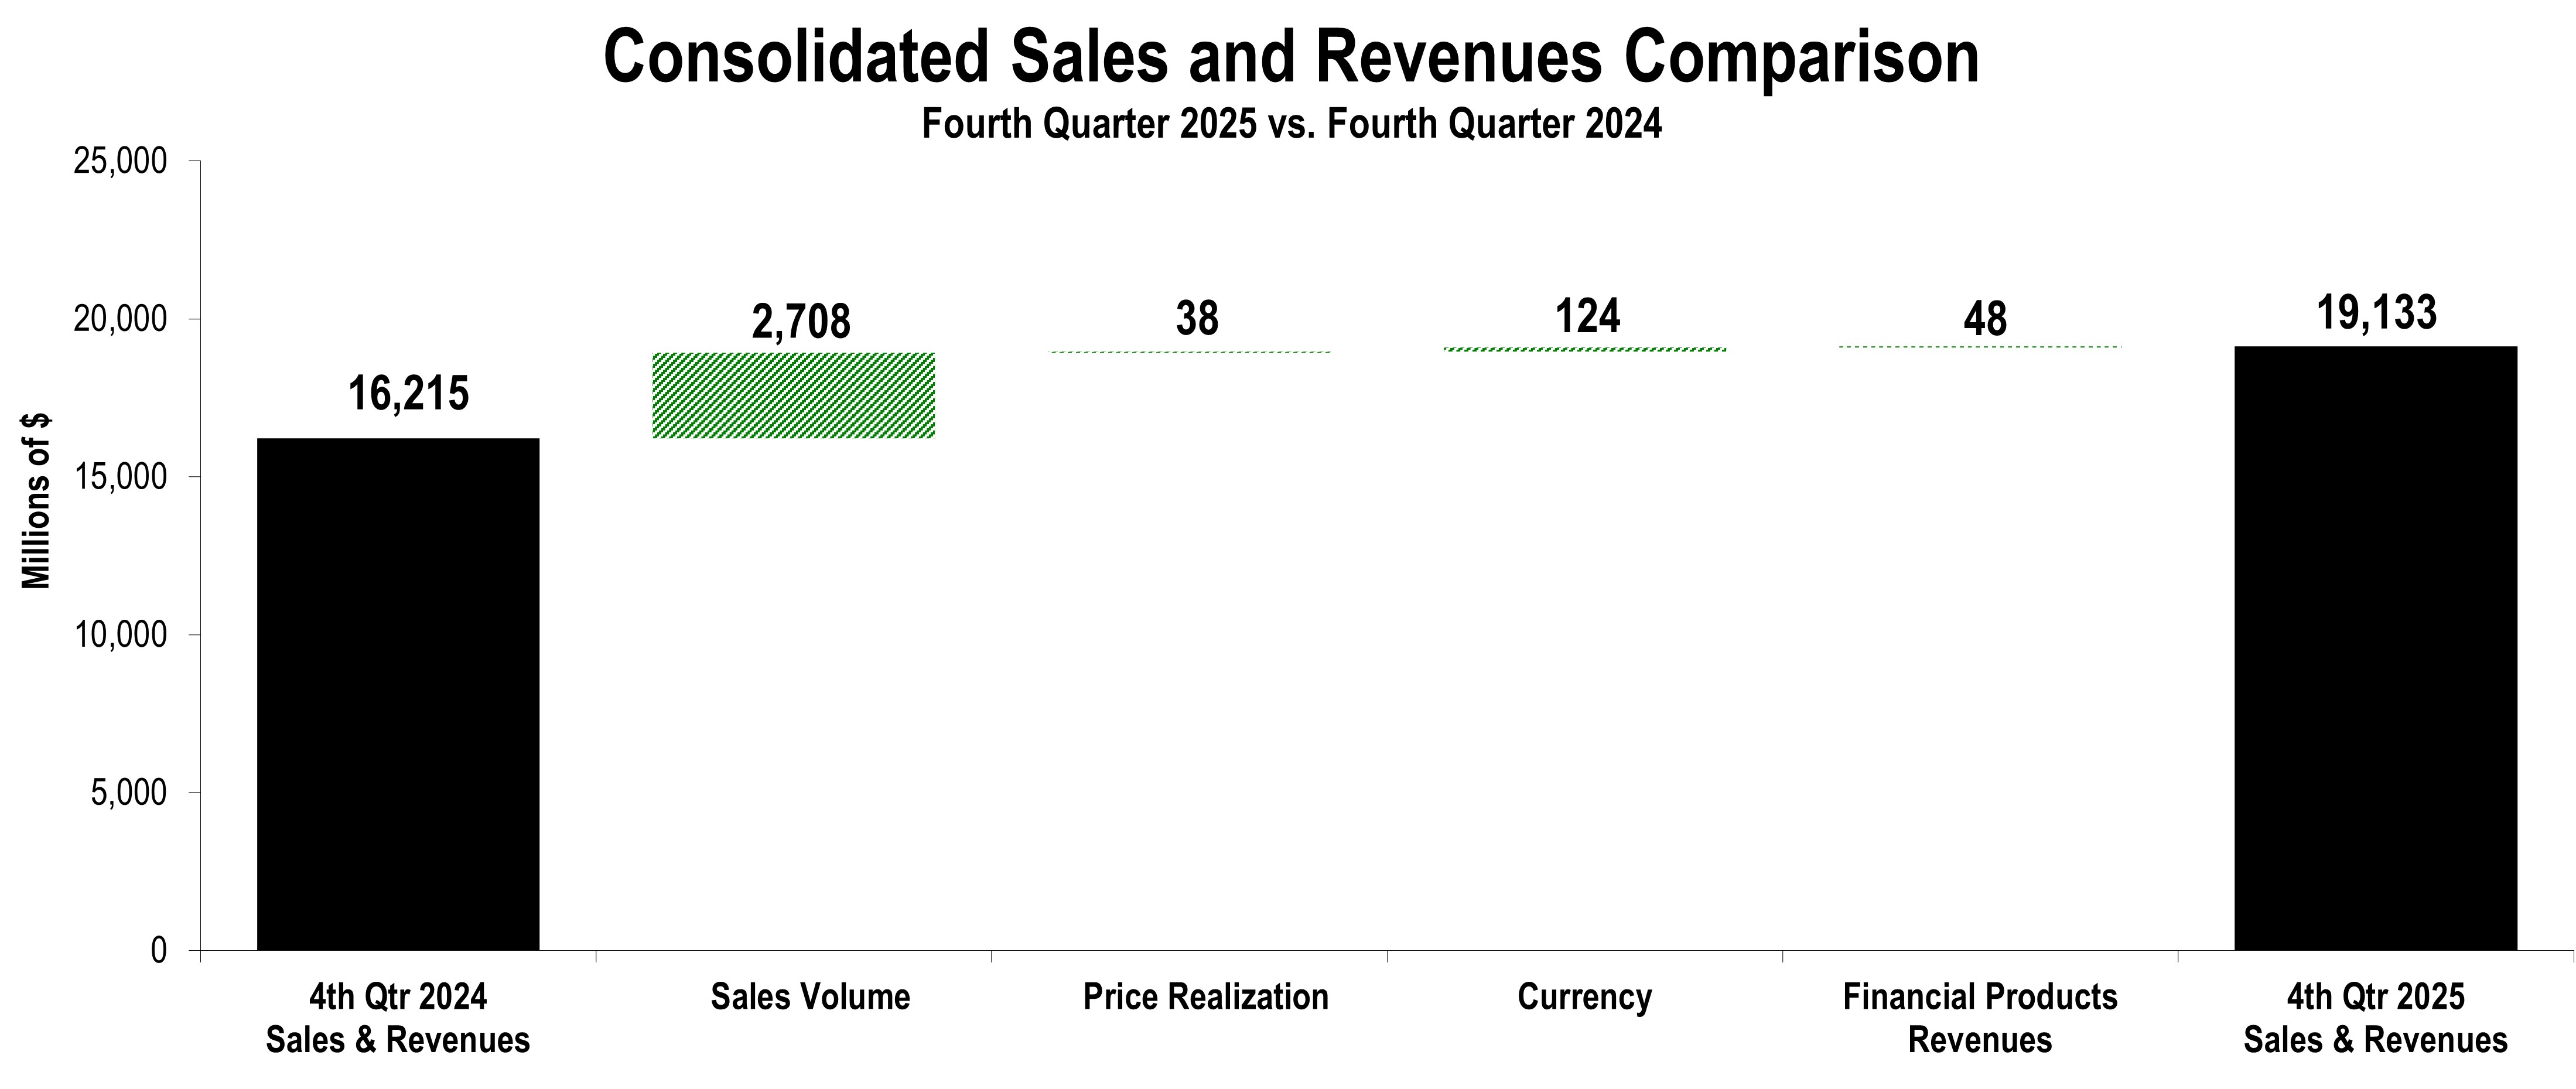
| (Millions of dollars) | Fourth Quarter 2024 | Sales Volume | Price Realization | Currency | Inter-Segment / Other | Fourth Quarter 2025 | $ Change | % Change | |||||||||||||||||||||||||||||||||||||||
| Construction Industries | $ | 6,003 | $ | 903 | $ | (60) | $ | 44 | $ | 36 | $ | 6,926 | $ | 923 | 15% | ||||||||||||||||||||||||||||||||
| Resource Industries | 2,980 | 459 | (67) | 7 | (26) | 3,353 | 373 | 13% | |||||||||||||||||||||||||||||||||||||||
| Power & Energy | 7,649 | 1,380 | 166 | 64 | 141 | 9,400 | 1,751 | 23% | |||||||||||||||||||||||||||||||||||||||
| All Other Segment | 98 | 3 | 1 | — | (3) | 99 | 1 | 1% | |||||||||||||||||||||||||||||||||||||||
| Corporate Items and Eliminations | (1,398) | (37) | (2) | 9 | (148) | (1,576) | (178) | ||||||||||||||||||||||||||||||||||||||||
| Machinery, Power & Energy | 15,332 | 2,708 | 38 | 124 | — | 18,202 | 2,870 | 19% | |||||||||||||||||||||||||||||||||||||||
| Financial Products Segment | 1,024 | — | — | — | 71 | 1,095 | 71 | 7% | |||||||||||||||||||||||||||||||||||||||
| Corporate Items and Eliminations | (141) | — | — | — | (23) | (164) | (23) | ||||||||||||||||||||||||||||||||||||||||
| Financial Products Revenues | 883 | — | — | — | 48 | 931 | 48 | 5% | |||||||||||||||||||||||||||||||||||||||
| Consolidated Sales and Revenues | $ | 16,215 | $ | 2,708 | $ | 38 | $ | 124 | $ | 48 | $ | 19,133 | $ | 2,918 | 18% | ||||||||||||||||||||||||||||||||
| Sales and Revenues by Geographic Region | |||||||||||||||||||||||||||||||||||||||||||||||||||||||||||||||||||||||||||||||||||
| North America | Latin America | EAME | Asia/Pacific | External Sales and Revenues | Inter-Segment | Total Sales and Revenues | |||||||||||||||||||||||||||||||||||||||||||||||||||||||||||||||||||||||||||||
| (Millions of dollars) | $ | % Chg | $ | % Chg | $ | % Chg | $ | % Chg | $ | % Chg | $ | % Chg | $ | % Chg | |||||||||||||||||||||||||||||||||||||||||||||||||||||||||||||||||||||
| Fourth Quarter 2025 | |||||||||||||||||||||||||||||||||||||||||||||||||||||||||||||||||||||||||||||||||||
| Construction Industries | $ | 3,879 | 23% | $ | 660 | 6% | $ | 1,326 | 18% | $ | 981 | (7%) | $ | 6,846 | 15% | $ | 80 | 82% | $ | 6,926 | 15% | ||||||||||||||||||||||||||||||||||||||||||||||||||||||||||||||
| Resource Industries | 1,280 | 32% | 647 | 12% | 610 | 34% | 747 | (15%) | 3,284 | 14% | 69 | (27%) | 3,353 | 13% | |||||||||||||||||||||||||||||||||||||||||||||||||||||||||||||||||||||
| Power & Energy | 4,595 | 30% | 563 | 21% | 1,834 | 16% | 1,134 | 22% | 8,126 | 25% | 1,274 | 12% | 9,400 | 23% | |||||||||||||||||||||||||||||||||||||||||||||||||||||||||||||||||||||
| All Other Segment | 7 | —% | — | —% | 2 | 100% | 3 | —% | 12 | 50% | 87 | (3%) | 99 | 1% | |||||||||||||||||||||||||||||||||||||||||||||||||||||||||||||||||||||
| Corporate Items and Eliminations | (61) | 2 | (3) | (4) | (66) | (1,510) | (1,576) | ||||||||||||||||||||||||||||||||||||||||||||||||||||||||||||||||||||||||||||
| Machinery, Power & Energy | 9,700 | 27% | 1,872 | 12% | 3,769 | 19% | 2,861 | —% | 18,202 | 19% | — | —% | 18,202 | 19% | |||||||||||||||||||||||||||||||||||||||||||||||||||||||||||||||||||||
| Financial Products Segment | 734 | 8% | 120 | 17% | 133 | 4% | 108 | (4%) | 1,095 | 7% | — | —% | 1,095 | 7% | |||||||||||||||||||||||||||||||||||||||||||||||||||||||||||||||||||||
| Corporate Items and Eliminations | (95) | (25) | (26) | (18) | (164) | — | (164) | ||||||||||||||||||||||||||||||||||||||||||||||||||||||||||||||||||||||||||||
| Financial Products Revenues | 639 | 6% | 95 | 16% | 107 | 1% | 90 | (2%) | 931 | 5% | — | —% | 931 | 5% | |||||||||||||||||||||||||||||||||||||||||||||||||||||||||||||||||||||
| Consolidated Sales and Revenues | $ | 10,339 | 26% | $ | 1,967 | 12% | $ | 3,876 | 19% | $ | 2,951 | —% | $ | 19,133 | 18% | $ | — | —% | $ | 19,133 | 18% | ||||||||||||||||||||||||||||||||||||||||||||||||||||||||||||||
| Fourth Quarter 2024 | |||||||||||||||||||||||||||||||||||||||||||||||||||||||||||||||||||||||||||||||||||
| Construction Industries | $ | 3,157 | $ | 623 | $ | 1,122 | $ | 1,057 | $ | 5,959 | $ | 44 | $ | 6,003 | |||||||||||||||||||||||||||||||||||||||||||||||||||||||||||||||||||||
| Resource Industries | 967 | 580 | 455 | 883 | 2,885 | 95 | 2,980 | ||||||||||||||||||||||||||||||||||||||||||||||||||||||||||||||||||||||||||||
| Power & Energy | 3,532 | 467 | 1,586 | 931 | 6,516 | 1,133 | 7,649 | ||||||||||||||||||||||||||||||||||||||||||||||||||||||||||||||||||||||||||||
| All Other Segment | 7 | — | 1 | — | 8 | 90 | 98 | ||||||||||||||||||||||||||||||||||||||||||||||||||||||||||||||||||||||||||||
| Corporate Items and Eliminations | (30) | — | (2) | (4) | (36) | (1,362) | (1,398) | ||||||||||||||||||||||||||||||||||||||||||||||||||||||||||||||||||||||||||||
| Machinery, Power & Energy | 7,633 | 1,670 | 3,162 | 2,867 | 15,332 | — | 15,332 | ||||||||||||||||||||||||||||||||||||||||||||||||||||||||||||||||||||||||||||
| Financial Products Segment | 680 | 103 | 128 | 113 | 1,024 | — | 1,024 | ||||||||||||||||||||||||||||||||||||||||||||||||||||||||||||||||||||||||||||
| Corporate Items and Eliminations | (77) | (21) | (22) | (21) | (141) | — | (141) | ||||||||||||||||||||||||||||||||||||||||||||||||||||||||||||||||||||||||||||
| Financial Products Revenues | 603 | 82 | 106 | 92 | 883 | — | 883 | ||||||||||||||||||||||||||||||||||||||||||||||||||||||||||||||||||||||||||||
| Consolidated Sales and Revenues | $ | 8,236 | $ | 1,752 | $ | 3,268 | $ | 2,959 | $ | 16,215 | $ | — | $ | 16,215 | |||||||||||||||||||||||||||||||||||||||||||||||||||||||||||||||||||||
| Profit (Loss) by Segment | |||||||||||||||||||||||
| (Millions of dollars) | Fourth Quarter 2025 | Fourth Quarter 2024 | $ Change | % Change | |||||||||||||||||||
| Construction Industries | $ | 1,030 | $ | 1,174 | $ | (144) | (12 | %) | |||||||||||||||
| Resource Industries | 360 | 471 | (111) | (24 | %) | ||||||||||||||||||
| Power & Energy | 1,841 | 1,477 | 364 | 25 | % | ||||||||||||||||||
| All Other Segment | 17 | 11 | 6 | 55 | % | ||||||||||||||||||
| Corporate Items and Eliminations | (676) | (198) | (478) | ||||||||||||||||||||
| Machinery, Power & Energy | 2,572 | 2,935 | (363) | (12 | %) | ||||||||||||||||||
| Financial Products Segment | 262 | 166 | 96 | 58 | % | ||||||||||||||||||
| Corporate Items and Eliminations | (14) | (29) | 15 | ||||||||||||||||||||
| Financial Products | 248 | 137 | 111 | 81 | % | ||||||||||||||||||
| Consolidating Adjustments | (160) | (148) | (12) | ||||||||||||||||||||
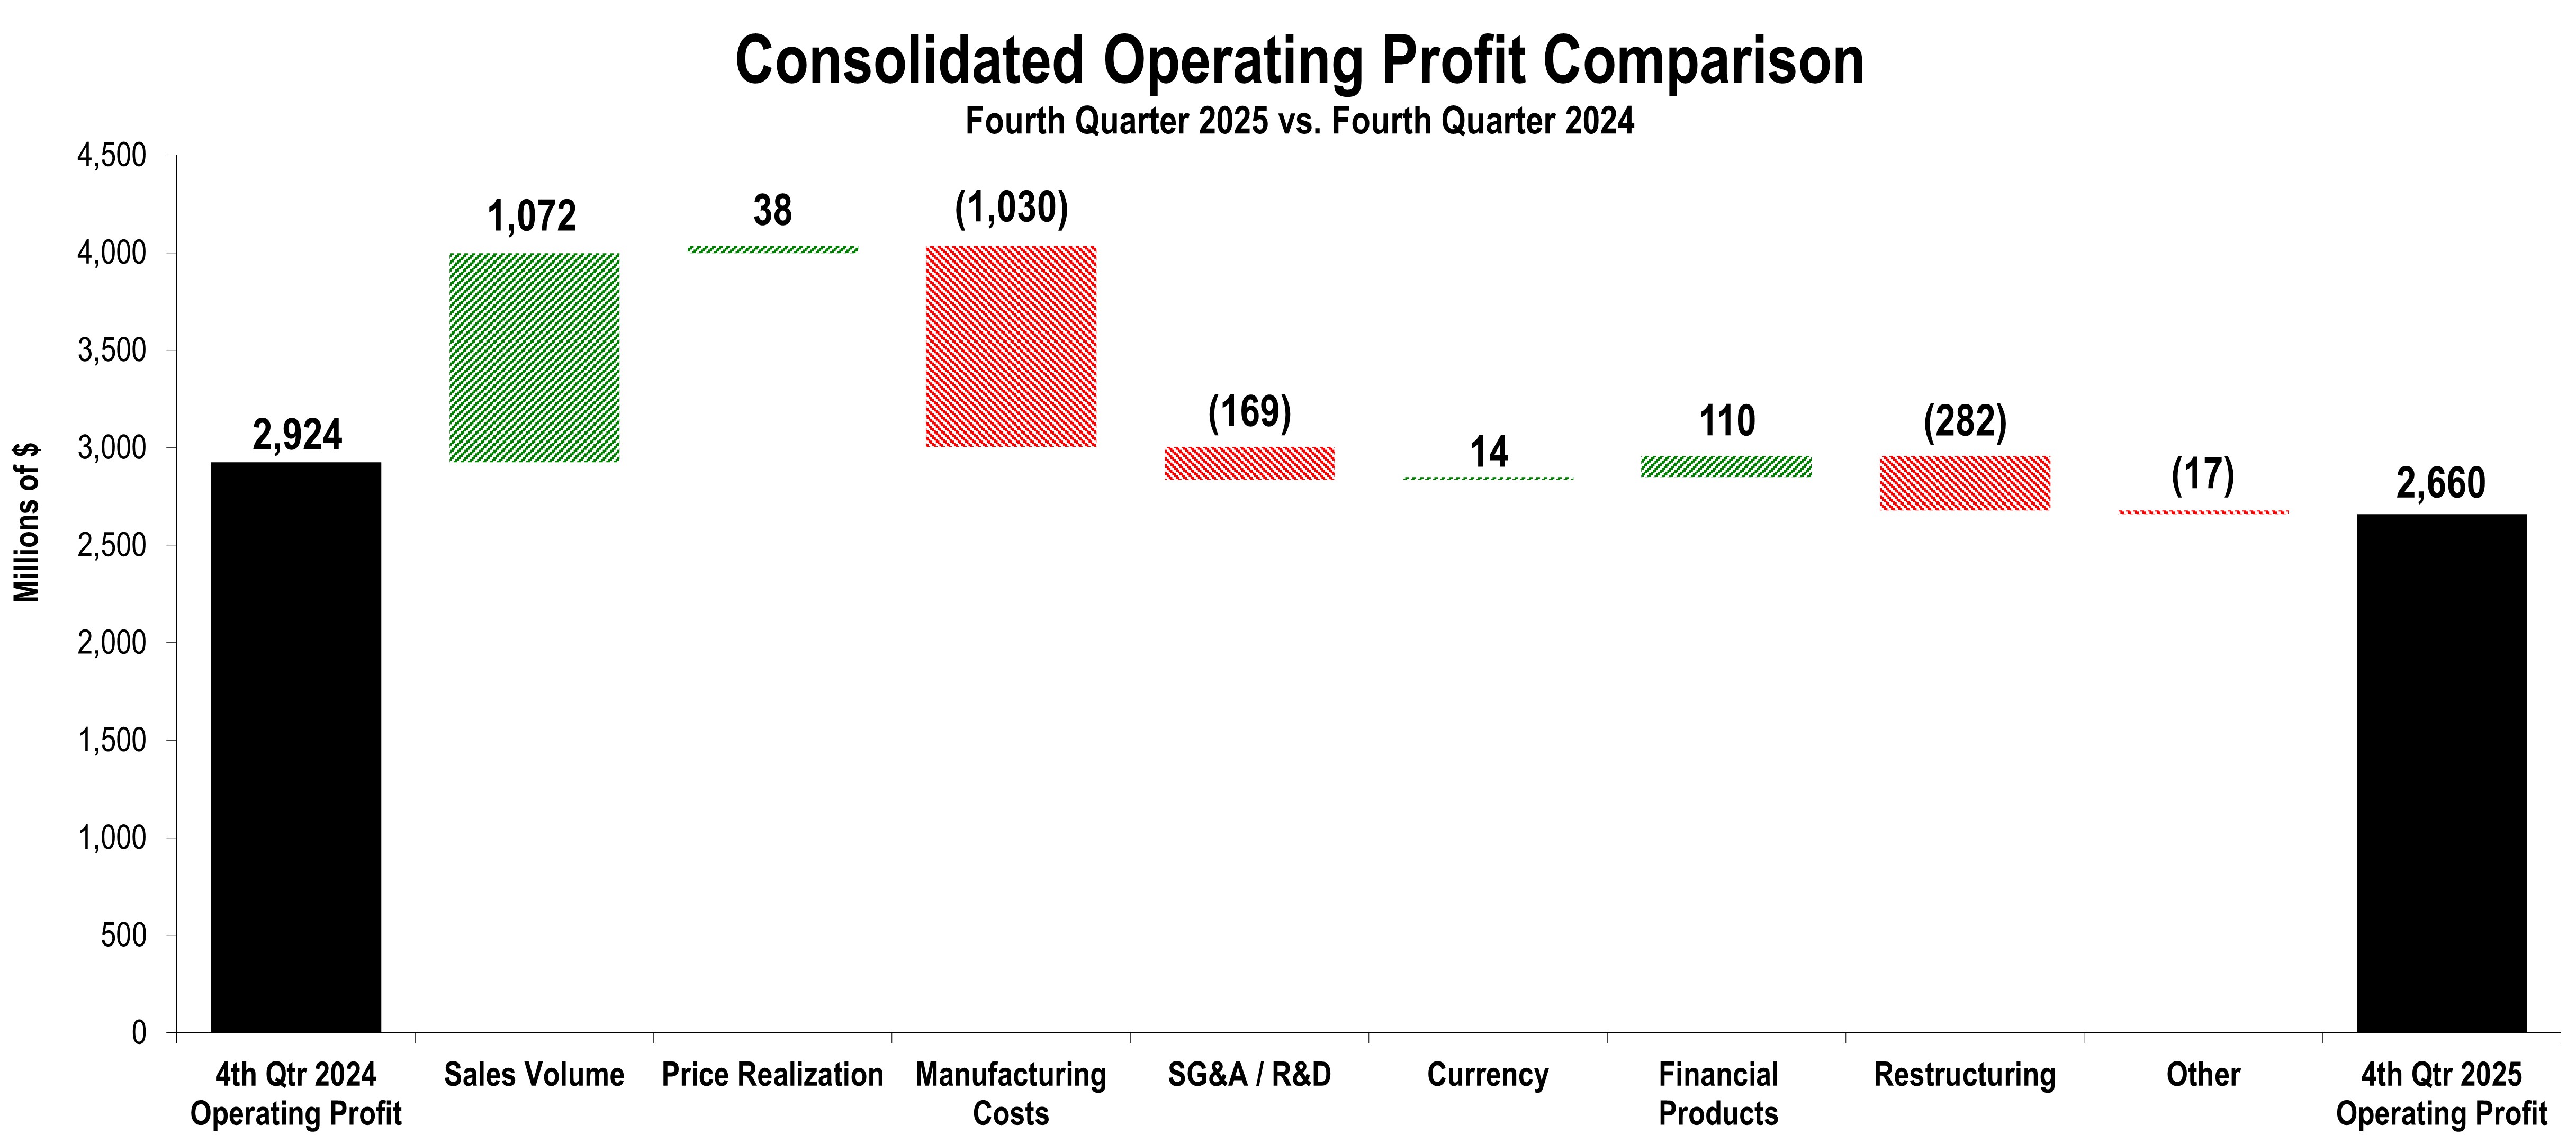
| Consolidated Operating Profit | $ | 2,660 | $ | 2,924 | $ | (264) | (9 | %) | |||||||||||||||
| CONSTRUCTION INDUSTRIES | ||||||||||||||||||||||||||||||||||||||||||||||||||
| (Millions of dollars) | ||||||||||||||||||||||||||||||||||||||||||||||||||
| Segment Sales | ||||||||||||||||||||||||||||||||||||||||||||||||||
| Fourth Quarter 2024 | Sales Volume | Price Realization | Currency | Inter-Segment | Fourth Quarter 2025 | $ Change | % Change | |||||||||||||||||||||||||||||||||||||||||||
| Total Sales | $ | 6,003 | $ | 903 | $ | (60) | $ | 44 | $ | 36 | $ | 6,926 | $ | 923 | 15 | % | ||||||||||||||||||||||||||||||||||
| Sales by Geographic Region | ||||||||||||||||||||||||||||||||||||||||||||||||||
| Fourth Quarter 2025 | Fourth Quarter 2024 | $ Change | % Change | |||||||||||||||||||||||||||||||||||||||||||||||
| North America | $ | 3,879 | $ | 3,157 | $ | 722 | 23 | % | ||||||||||||||||||||||||||||||||||||||||||
| Latin America | 660 | 623 | 37 | 6 | % | |||||||||||||||||||||||||||||||||||||||||||||
| EAME | 1,326 | 1,122 | 204 | 18 | % | |||||||||||||||||||||||||||||||||||||||||||||
| Asia/Pacific | 981 | 1,057 | (76) | (7 | %) | |||||||||||||||||||||||||||||||||||||||||||||
| External Sales | 6,846 | 5,959 | 887 | 15 | % | |||||||||||||||||||||||||||||||||||||||||||||
| Inter-segment | 80 | 44 | 36 | 82 | % | |||||||||||||||||||||||||||||||||||||||||||||
| Total Sales | $ | 6,926 | $ | 6,003 | $ | 923 | 15 | % | ||||||||||||||||||||||||||||||||||||||||||
| Segment Profit | ||||||||||||||||||||||||||||||||||||||||||||||||||
| Fourth Quarter 2025 | Fourth Quarter 2024 | Change | % Change | |||||||||||||||||||||||||||||||||||||||||||||||
| Segment Profit | $ | 1,030 | $ | 1,174 | $ | (144) | (12 | %) | ||||||||||||||||||||||||||||||||||||||||||
| Segment Profit Margin | 14.9 | % | 19.6 | % | (4.7 | pts) | ||||||||||||||||||||||||||||||||||||||||||||
| RESOURCE INDUSTRIES | ||||||||||||||||||||||||||||||||||||||||||||||||||
| (Millions of dollars) | ||||||||||||||||||||||||||||||||||||||||||||||||||
| Segment Sales | ||||||||||||||||||||||||||||||||||||||||||||||||||
| Fourth Quarter 2024 | Sales Volume | Price Realization | Currency | Inter-Segment | Fourth Quarter 2025 | $ Change | % Change | |||||||||||||||||||||||||||||||||||||||||||
| Total Sales | $ | 2,980 | $ | 459 | $ | (67) | $ | 7 | $ | (26) | $ | 3,353 | $ | 373 | 13 | % | ||||||||||||||||||||||||||||||||||
| Sales by Geographic Region | ||||||||||||||||||||||||||||||||||||||||||||||||||
| Fourth Quarter 2025 | Fourth Quarter 2024 | $ Change | % Change | |||||||||||||||||||||||||||||||||||||||||||||||
| North America | $ | 1,280 | $ | 967 | $ | 313 | 32 | % | ||||||||||||||||||||||||||||||||||||||||||
| Latin America | 647 | 580 | 67 | 12 | % | |||||||||||||||||||||||||||||||||||||||||||||
| EAME | 610 | 455 | 155 | 34 | % | |||||||||||||||||||||||||||||||||||||||||||||
| Asia/Pacific | 747 | 883 | (136) | (15 | %) | |||||||||||||||||||||||||||||||||||||||||||||
| External Sales | 3,284 | 2,885 | 399 | 14 | % | |||||||||||||||||||||||||||||||||||||||||||||
| Inter-segment | 69 | 95 | (26) | (27 | %) | |||||||||||||||||||||||||||||||||||||||||||||
| Total Sales | $ | 3,353 | $ | 2,980 | $ | 373 | 13 | % | ||||||||||||||||||||||||||||||||||||||||||
| Segment Profit | ||||||||||||||||||||||||||||||||||||||||||||||||||
| Fourth Quarter 2025 | Fourth Quarter 2024 | Change | % Change | |||||||||||||||||||||||||||||||||||||||||||||||
| Segment Profit | $ | 360 | $ | 471 | $ | (111) | (24 | %) | ||||||||||||||||||||||||||||||||||||||||||
| Segment Profit Margin | 10.7 | % | 15.8 | % | (5.1 | pts) | ||||||||||||||||||||||||||||||||||||||||||||
| POWER & ENERGY | ||||||||||||||||||||||||||||||||||||||||||||||||||
| (Millions of dollars) | ||||||||||||||||||||||||||||||||||||||||||||||||||
| Segment Sales | ||||||||||||||||||||||||||||||||||||||||||||||||||
| Fourth Quarter 2024 | Sales Volume | Price Realization | Currency | Inter-Segment | Fourth Quarter 2025 | $ Change | % Change | |||||||||||||||||||||||||||||||||||||||||||
| Total Sales | $ | 7,649 | $ | 1,380 | $ | 166 | $ | 64 | $ | 141 | $ | 9,400 | $ | 1,751 | 23 | % | ||||||||||||||||||||||||||||||||||
| Sales by Application | ||||||||||||||||||||||||||||||||||||||||||||||||||
| Fourth Quarter 2025 | Fourth Quarter 2024 | $ Change | % Change | |||||||||||||||||||||||||||||||||||||||||||||||
| Oil and Gas | $ | 2,398 | $ | 1,927 | $ | 471 | 24 | % | ||||||||||||||||||||||||||||||||||||||||||
| Power Generation | 3,238 | 2,242 | 996 | 44 | % | |||||||||||||||||||||||||||||||||||||||||||||
| Industrial | 967 | 928 | 39 | 4 | % | |||||||||||||||||||||||||||||||||||||||||||||
| Transportation | 1,523 | 1,419 | 104 | 7 | % | |||||||||||||||||||||||||||||||||||||||||||||
| External Sales | 8,126 | 6,516 | 1,610 | 25 | % | |||||||||||||||||||||||||||||||||||||||||||||
| Inter-segment | 1,274 | 1,133 | 141 | 12 | % | |||||||||||||||||||||||||||||||||||||||||||||
| Total Sales | $ | 9,400 | $ | 7,649 | $ | 1,751 | 23 | % | ||||||||||||||||||||||||||||||||||||||||||
| Segment Profit | ||||||||||||||||||||||||||||||||||||||||||||||||||
| Fourth Quarter 2025 | Fourth Quarter 2024 | Change | % Change | |||||||||||||||||||||||||||||||||||||||||||||||
| Segment Profit | $ | 1,841 | $ | 1,477 | $ | 364 | 25 | % | ||||||||||||||||||||||||||||||||||||||||||
| Segment Profit Margin | 19.6 | % | 19.3 | % | 0.3 | pts | ||||||||||||||||||||||||||||||||||||||||||||
| FINANCIAL PRODUCTS SEGMENT | ||||||||||||||||||||||||||||||||||||||||||||||||||
| (Millions of dollars) | ||||||||||||||||||||||||||||||||||||||||||||||||||
| Revenues by Geographic Region | ||||||||||||||||||||||||||||||||||||||||||||||||||
| Fourth Quarter 2025 | Fourth Quarter 2024 | $ Change | % Change | |||||||||||||||||||||||||||||||||||||||||||||||
| North America | $ | 734 | $ | 680 | $ | 54 | 8 | % | ||||||||||||||||||||||||||||||||||||||||||
| Latin America | 120 | 103 | 17 | 17 | % | |||||||||||||||||||||||||||||||||||||||||||||
| EAME | 133 | 128 | 5 | 4 | % | |||||||||||||||||||||||||||||||||||||||||||||
| Asia/Pacific | 108 | 113 | (5) | (4 | %) | |||||||||||||||||||||||||||||||||||||||||||||
| Total Revenues | $ | 1,095 | $ | 1,024 | $ | 71 | 7 | % | ||||||||||||||||||||||||||||||||||||||||||
| Segment Profit | ||||||||||||||||||||||||||||||||||||||||||||||||||
| Fourth Quarter 2025 | Fourth Quarter 2024 | Change | % Change | |||||||||||||||||||||||||||||||||||||||||||||||
| Segment Profit | $ | 262 | $ | 166 | $ | 96 | 58 | % | ||||||||||||||||||||||||||||||||||||||||||
| (Dollars in millions except per share data) | Operating Profit | Operating Profit Margin | Profit Before Taxes | Provision (Benefit) for Income Taxes | Profit | Profit per Share | ||||||||||||||||||||||||||||||||
| Three Months Ended December 31, 2025 - U.S. GAAP | $ | 2,660 | 13.9 | % | $ | 3,026 | $ | 712 | $ | 2,402 | $ | 5.12 | ||||||||||||||||||||||||||
| Other restructuring (income) costs | 319 | 1.7 | % | 319 | 73 | 246 | 0.52 | |||||||||||||||||||||||||||||||
| Pension/OPEB mark-to-market (gains) losses | — | — | % | (294) | (68) | (226) | (0.48) | |||||||||||||||||||||||||||||||
| Three Months Ended December 31, 2025 - Adjusted | $ | 2,979 | 15.6 | % | $ | 3,051 | $ | 717 | $ | 2,422 | $ | 5.16 | ||||||||||||||||||||||||||
| Three Months Ended December 31, 2024 - U.S. GAAP | $ | 2,924 | 18.0 | % | $ | 3,243 | $ | 463 | $ | 2,791 | $ | 5.78 | ||||||||||||||||||||||||||
| Other restructuring (income) costs | 37 | 0.3 | % | 37 | 10 | 27 | 0.05 | |||||||||||||||||||||||||||||||
| Pension/OPEB mark-to-market (gains) losses | — | — | % | (154) | (43) | (111) | (0.23) | |||||||||||||||||||||||||||||||
| Tax law change related to currency translation | — | — | % | — | 224 | (224) | (0.46) | |||||||||||||||||||||||||||||||
| Three Months Ended December 31, 2024 - Adjusted | $ | 2,961 | 18.3 | % | $ | 3,126 | $ | 654 | $ | 2,483 | $ | 5.14 | ||||||||||||||||||||||||||
| Twelve Months Ended December 31, 2025 - U.S. GAAP | $ | 11,151 | 16.5 | % | $ | 11,541 | $ | 2,768 | $ | 8,884 | $ | 18.81 | ||||||||||||||||||||||||||
| Other restructuring (income) costs | 444 | 0.7 | % | 445 | 102 | 346 | 0.73 | |||||||||||||||||||||||||||||||
| Pension/OPEB mark-to-market (gains) losses | — | — | % | (294) | (68) | (226) | (0.48) | |||||||||||||||||||||||||||||||
| Twelve Months Ended December 31, 2025 - Adjusted | $ | 11,595 | 17.2 | % | $ | 11,692 | $ | 2,802 | $ | 9,004 | $ | 19.06 | ||||||||||||||||||||||||||
| Twelve Months Ended December 31, 2024 - U.S. GAAP | $ | 13,072 | 20.2 | % | $ | 13,373 | $ | 2,629 | $ | 10,792 | $ | 22.05 | ||||||||||||||||||||||||||
| Restructuring (income) costs - divestitures of certain non-U.S. entities | 164 | 0.2 | % | 164 | 54 | 110 | 0.22 | |||||||||||||||||||||||||||||||
| Other restructuring (income) costs | 195 | 0.3 | % | 195 | 46 | 149 | 0.32 | |||||||||||||||||||||||||||||||
| Pension/OPEB mark-to-market (gains) losses | — | — | % | (154) | (43) | (111) | (0.23) | |||||||||||||||||||||||||||||||
| Tax law change related to currency translation | — | — | % | — | 224 | (224) | (0.46) | |||||||||||||||||||||||||||||||
| Twelve Months Ended December 31, 2024 - Adjusted | $ | 13,431 | 20.7 | % | $ | 13,578 | $ | 2,910 | $ | 10,716 | $ | 21.90 | ||||||||||||||||||||||||||
| (Dollars in millions) | Profit Before Taxes | Provision (Benefit) for Income Taxes | Effective Tax Rate | |||||||||||||||||
| Three Months Ended December 31, 2025 - U.S. GAAP | $ | 3,026 | $ | 712 | 23.5 | % | ||||||||||||||
| Pension/OPEB mark-to-market (gains) losses | (294) | (68) | ||||||||||||||||||
| Change in annual effective tax rate | — | (8) | ||||||||||||||||||
| Excess stock-based compensation | — | 22 | ||||||||||||||||||
| Annual effective tax rate, excluding discrete items | $ | 2,732 | $ | 658 | 24.1 | % | ||||||||||||||
| Other restructuring (income) costs | 319 | 73 | ||||||||||||||||||
| Change in annual effective tax rate | — | 8 | ||||||||||||||||||
| Excess stock-based compensation | — | (22) | ||||||||||||||||||
| Three Months Ended December 31, 2025 - Adjusted | $ | 3,051 | $ | 717 | ||||||||||||||||
| Three Months Ended December 31, 2024 - U.S. GAAP | $ | 3,243 | $ | 463 | 14.3 | % | ||||||||||||||
| Pension/OPEB mark-to-market (gains) losses | (154) | (43) | ||||||||||||||||||
| Tax law change related to currency translation | — | 224 | ||||||||||||||||||
| Change in annual effective tax rate | — | 33 | ||||||||||||||||||
| Excess stock-based compensation | — | 8 | ||||||||||||||||||
| Annual effective tax rate, excluding discrete items | $ | 3,089 | $ | 685 | 22.2 | % | ||||||||||||||
| Change in annual effective tax rate | — | (33) | ||||||||||||||||||
| Excess stock-based compensation | — | (8) | ||||||||||||||||||
| Other restructuring (income) costs | 37 | 10 | ||||||||||||||||||
| Three Months Ended December 31, 2024 - Adjusted | $ | 3,126 | $ | 654 | ||||||||||||||||
| Twelve Months Ended December 31, 2025 - U.S. GAAP | $ | 11,541 | $ | 2,768 | 24.0 | % | ||||||||||||||
| Pension/OPEB mark-to-market (gains) losses | (294) | (68) | ||||||||||||||||||
| Changes in estimates related to prior years | — | (41) | ||||||||||||||||||
| Excess stock-based compensation | — | 50 | ||||||||||||||||||
| Annual effective tax rate, excluding discrete items | $ | 11,247 | $ | 2,709 | 24.1 | % | ||||||||||||||
| Other restructuring (income) costs | 445 | 102 | ||||||||||||||||||
| Changes in estimates related to prior years | — | 41 | ||||||||||||||||||
| Excess stock-based compensation | — | (50) | ||||||||||||||||||
| Twelve Months Ended December 31, 2025 - Adjusted | $ | 11,692 | $ | 2,802 | ||||||||||||||||
| Twelve Months Ended December 31, 2024 - U.S. GAAP | $ | 13,373 | $ | 2,629 | 19.7 | % | ||||||||||||||
| Restructuring (income) costs - divestitures of certain non-U.S. entities | 164 | 54 | ||||||||||||||||||
| Pension/OPEB mark-to-market (gains) losses | (154) | (43) | ||||||||||||||||||
| Tax law change related to currency translation | — | 224 | ||||||||||||||||||
| Changes in estimates related to prior years | — | 47 | ||||||||||||||||||
| Excess stock-based compensation | — | 57 | ||||||||||||||||||
| Annual effective tax rate, excluding discrete items | $ | 13,383 | $ | 2,968 | 22.2 | % | ||||||||||||||
| Changes in estimates related to prior years | — | (47) | ||||||||||||||||||
| Excess stock-based compensation | — | (57) | ||||||||||||||||||
| Other restructuring (income) costs | 195 | 46 | ||||||||||||||||||
| Twelve Months Ended December 31, 2024 - Adjusted | $ | 13,578 | $ | 2,910 | ||||||||||||||||
| Three Months Ended December 31, | Twelve Months Ended December 31, | ||||||||||||||||||||||
| 2025 | 2024 | 2025 | 2024 | ||||||||||||||||||||
| Sales and revenues: | |||||||||||||||||||||||
| Sales of Machinery, Power & Energy | $ | 18,202 | $ | 15,332 | $ | 63,980 | $ | 61,363 | |||||||||||||||
| Revenues of Financial Products | 931 | 883 | 3,609 | 3,446 | |||||||||||||||||||
| Total sales and revenues | 19,133 | 16,215 | 67,589 | 64,809 | |||||||||||||||||||
| Operating costs: | |||||||||||||||||||||||
| Cost of goods sold | 13,307 | 10,321 | 44,752 | 40,199 | |||||||||||||||||||
| Selling, general and administrative expenses | 1,876 | 1,769 | 6,985 | 6,667 | |||||||||||||||||||
| Research and development expenses | 562 | 519 | 2,148 | 2,107 | |||||||||||||||||||
| Interest expense of Financial Products | 351 | 338 | 1,359 | 1,286 | |||||||||||||||||||
| Other operating (income) expenses | 377 | 344 | 1,194 | 1,478 | |||||||||||||||||||
| Total operating costs | 16,473 | 13,291 | 56,438 | 51,737 | |||||||||||||||||||
| Operating profit | 2,660 | 2,924 | 11,151 | 13,072 | |||||||||||||||||||
| Interest expense excluding Financial Products | 127 | 107 | 502 | 512 | |||||||||||||||||||
| Other income (expense) | 493 | 426 | 892 | 813 | |||||||||||||||||||
| Consolidated profit before taxes | 3,026 | 3,243 | 11,541 | 13,373 | |||||||||||||||||||
| Provision (benefit) for income taxes | 712 | 463 | 2,768 | 2,629 | |||||||||||||||||||
| Profit of consolidated companies | 2,314 | 2,780 | 8,773 | 10,744 | |||||||||||||||||||
| Equity in profit (loss) of unconsolidated affiliated companies | 87 | 10 | 109 | 44 | |||||||||||||||||||
| Profit of consolidated and affiliated companies | 2,401 | 2,790 | 8,882 | 10,788 | |||||||||||||||||||
| Less: Profit (loss) attributable to noncontrolling interests | (1) | (1) | (2) | (4) | |||||||||||||||||||
Profit 1 | $ | 2,402 | $ | 2,791 | $ | 8,884 | $ | 10,792 | |||||||||||||||
| Profit per common share | $ | 5.15 | $ | 5.81 | $ | 18.90 | $ | 22.17 | |||||||||||||||
Profit per common share — diluted 2 | $ | 5.12 | $ | 5.78 | $ | 18.81 | $ | 22.05 | |||||||||||||||
| Weighted-average common shares outstanding (millions) | |||||||||||||||||||||||
| – Basic | 466.5 | 480.0 | 470.0 | 486.7 | |||||||||||||||||||
– Diluted 2 | 469.0 | 482.6 | 472.3 | 489.4 | |||||||||||||||||||
| 1 | Profit attributable to common shareholders. | ||||
| 2 | Diluted by assumed exercise of stock-based compensation awards using the treasury stock method. | ||||
| December 31, 2025 | December 31, 2024 | ||||||||||
| Assets | |||||||||||
| Current assets: | |||||||||||
| Cash and cash equivalents | $ | 9,980 | $ | 6,889 | |||||||
| Receivables – trade and other | 10,920 | 9,282 | |||||||||
| Receivables – finance | 10,649 | 9,565 | |||||||||
| Prepaid expenses and other current assets | 2,801 | 3,119 | |||||||||
| Inventories | 18,135 | 16,827 | |||||||||
| Total current assets | 52,485 | 45,682 | |||||||||
| Property, plant and equipment – net | 15,140 | 13,361 | |||||||||
| Long-term receivables – trade and other | 2,142 | 1,225 | |||||||||
| Long-term receivables – finance | 14,272 | 13,242 | |||||||||
| Noncurrent deferred and refundable income taxes | 2,882 | 3,312 | |||||||||
| Intangible assets | 241 | 399 | |||||||||
| Goodwill | 5,321 | 5,241 | |||||||||
| Other assets | 6,102 | 5,302 | |||||||||
| Total assets | $ | 98,585 | $ | 87,764 | |||||||
| Liabilities | |||||||||||
| Current liabilities: | |||||||||||
| Short-term borrowings: | |||||||||||
| -- Financial Products | $ | 5,514 | $ | 4,393 | |||||||
| Accounts payable | 8,968 | 7,675 | |||||||||
| Accrued expenses | 5,587 | 5,243 | |||||||||
| Accrued wages, salaries and employee benefits | 2,554 | 2,391 | |||||||||
| Customer advances | 3,314 | 2,322 | |||||||||
| Dividends payable | 703 | 674 | |||||||||
| Other current liabilities | 2,798 | 2,909 | |||||||||
| Long-term debt due within one year: | |||||||||||
| -- Machinery, Power & Energy | 35 | 46 | |||||||||
| -- Financial Products | 7,085 | 6,619 | |||||||||
| Total current liabilities | 36,558 | 32,272 | |||||||||
| Long-term debt due after one year: | |||||||||||
| -- Machinery, Power & Energy | 10,678 | 8,564 | |||||||||
| -- Financial Products | 20,018 | 18,787 | |||||||||
| Liability for postemployment benefits | 3,838 | 3,757 | |||||||||
| Other liabilities | 6,175 | 4,890 | |||||||||
| Total liabilities | 77,267 | 68,270 | |||||||||
| Shareholders’ equity | |||||||||||
| Common stock | 7,181 | 6,941 | |||||||||
| Treasury stock | (49,539) | (44,331) | |||||||||
| Profit employed in the business | 65,448 | 59,352 | |||||||||
| Accumulated other comprehensive income (loss) | (1,772) | (2,471) | |||||||||
| Noncontrolling interests | — | 3 | |||||||||
| Total shareholders’ equity | 21,318 | 19,494 | |||||||||
| Total liabilities and shareholders’ equity | $ | 98,585 | $ | 87,764 | |||||||
| Twelve Months Ended December 31, | |||||||||||
| 2025 | 2024 | ||||||||||
| Cash flow from operating activities: | |||||||||||
| Profit of consolidated and affiliated companies | $ | 8,882 | $ | 10,788 | |||||||
| Adjustments to reconcile profit to net cash provided by operating activities: | |||||||||||
| Depreciation and amortization | 2,262 | 2,153 | |||||||||
| Actuarial (gain) loss on pension and postretirement benefits | (294) | (154) | |||||||||
| Provision (benefit) for deferred income taxes | 465 | (621) | |||||||||
| (Gain) loss on divestiture | 30 | 164 | |||||||||
| Other | 742 | 564 | |||||||||
| Changes in assets and liabilities, net of acquisitions and divestitures: | |||||||||||
| Receivables – trade and other | (2,138) | (160) | |||||||||
| Inventories | (1,477) | (414) | |||||||||
| Accounts payable | 1,179 | (282) | |||||||||
| Accrued expenses | 438 | 191 | |||||||||
| Accrued wages, salaries and employee benefits | 187 | (363) | |||||||||
| Customer advances | 1,933 | 370 | |||||||||
| Other assets – net | (176) | (97) | |||||||||
| Other liabilities – net | (294) | (104) | |||||||||
| Net cash provided by (used for) operating activities | 11,739 | 12,035 | |||||||||
| Cash flow from investing activities: | |||||||||||
| Capital expenditures – excluding equipment leased to others | (2,821) | (1,988) | |||||||||
| Expenditures for equipment leased to others | (1,465) | (1,227) | |||||||||
| Proceeds from disposals of leased assets and property, plant and equipment | 708 | 722 | |||||||||
| Additions to finance receivables | (15,329) | (15,409) | |||||||||
| Collections of finance receivables | 13,515 | 13,608 | |||||||||
| Proceeds from sale of finance receivables | 71 | 83 | |||||||||
| Investments and acquisitions (net of cash acquired) | (47) | (34) | |||||||||
| Proceeds from sale of businesses and investments (net of cash sold) | 22 | (61) | |||||||||
| Proceeds from maturities and sale of securities | 2,494 | 3,155 | |||||||||
| Investments in securities | (1,930) | (1,495) | |||||||||
| Other – net | 75 | 193 | |||||||||
| Net cash provided by (used for) investing activities | (4,707) | (2,453) | |||||||||
| Cash flow from financing activities: | |||||||||||
| Dividends paid | (2,749) | (2,646) | |||||||||
| Common stock issued, and other stock compensation transactions, net | (16) | 20 | |||||||||
| Payments to purchase common stock | (5,190) | (7,697) | |||||||||
| Excise tax paid on purchases of common stock | (73) | (40) | |||||||||
| Proceeds from debt issued (original maturities greater than three months) | 11,105 | 10,283 | |||||||||
| Payments on debt (original maturities greater than three months) | (8,081) | (9,316) | |||||||||
| Short-term borrowings – net (original maturities three months or less) | 1,106 | (168) | |||||||||
| Other – net | (1) | (1) | |||||||||
| Net cash provided by (used for) financing activities | (3,899) | (9,565) | |||||||||
| Effect of exchange rate changes on cash | (43) | (106) | |||||||||
| Increase (decrease) in cash, cash equivalents and restricted cash | 3,090 | (89) | |||||||||
| Cash, cash equivalents and restricted cash at beginning of period | 6,896 | 6,985 | |||||||||
| Cash, cash equivalents and restricted cash at end of period | $ | 9,986 | $ | 6,896 | |||||||
| Cash equivalents primarily represent short-term, highly liquid investments with original maturities of generally three months or less. | ||
| Supplemental Consolidating Data | ||||||||||||||||||||||||||
| Consolidated | Machinery, Power & Energy | Financial Products | Consolidating Adjustments | |||||||||||||||||||||||
| Sales and revenues: | ||||||||||||||||||||||||||
| Sales of Machinery, Power & Energy | $ | 18,202 | $ | 18,202 | $ | — | $ | — | ||||||||||||||||||
| Revenues of Financial Products | 931 | — | 1,138 | (207) | 1 | |||||||||||||||||||||
| Total sales and revenues | 19,133 | 18,202 | 1,138 | (207) | ||||||||||||||||||||||
| Operating costs: | ||||||||||||||||||||||||||
| Cost of goods sold | 13,307 | 13,310 | — | (3) | 2 | |||||||||||||||||||||
| Selling, general and administrative expenses | 1,876 | 1,670 | 219 | (13) | 2 | |||||||||||||||||||||
| Research and development expenses | 562 | 562 | — | — | ||||||||||||||||||||||
| Interest expense of Financial Products | 351 | — | 363 | (12) | 2 | |||||||||||||||||||||
| Other operating (income) expenses | 377 | 88 | 308 | (19) | 2 | |||||||||||||||||||||
| Total operating costs | 16,473 | 15,630 | 890 | (47) | ||||||||||||||||||||||
| Operating profit | 2,660 | 2,572 | 248 | (160) | ||||||||||||||||||||||
| Interest expense excluding Financial Products | 127 | 131 | — | (4) | 3 | |||||||||||||||||||||
| Other income (expense) | 493 | 806 | 20 | (333) | 4 | |||||||||||||||||||||
| Consolidated profit before taxes | 3,026 | 3,247 | 268 | (489) | ||||||||||||||||||||||
| Provision (benefit) for income taxes | 712 | 647 | 65 | — | ||||||||||||||||||||||
| Profit of consolidated companies | 2,314 | 2,600 | 203 | (489) | ||||||||||||||||||||||
| Equity in profit (loss) of unconsolidated affiliated companies | 87 | 87 | — | — | ||||||||||||||||||||||
| Profit of consolidated and affiliated companies | 2,401 | 2,687 | 203 | (489) | ||||||||||||||||||||||
| Less: Profit (loss) attributable to noncontrolling interests | (1) | (1) | — | — | ||||||||||||||||||||||
Profit 5 | $ | 2,402 | $ | 2,688 | $ | 203 | $ | (489) | ||||||||||||||||||
| 1 | Elimination of Financial Products’ revenues earned from MP&E. | ||||
| 2 | Elimination of net expenses recorded between MP&E and Financial Products. | ||||
| 3 | Elimination of interest expense recorded between Financial Products and MP&E. | ||||
| 4 | Elimination of discount recorded by MP&E on receivables sold to Financial Products and of interest earned between MP&E and Financial Products as well as dividends paid by Financial Products to MP&E. | ||||
| 5 | Profit attributable to common shareholders. | ||||
| Supplemental Consolidating Data | ||||||||||||||||||||||||||
| Consolidated | Machinery, Power & Energy | Financial Products | Consolidating Adjustments | |||||||||||||||||||||||
| Sales and revenues: | ||||||||||||||||||||||||||
| Sales of Machinery, Power & Energy | $ | 15,332 | $ | 15,332 | $ | — | $ | — | ||||||||||||||||||
| Revenues of Financial Products | 883 | — | 1,062 | (179) | 1 | |||||||||||||||||||||
| Total sales and revenues | 16,215 | 15,332 | 1,062 | (179) | ||||||||||||||||||||||
| Operating costs: | ||||||||||||||||||||||||||
| Cost of goods sold | 10,321 | 10,323 | — | (2) | 2 | |||||||||||||||||||||
| Selling, general and administrative expenses | 1,769 | 1,535 | 226 | 8 | 2 | |||||||||||||||||||||
| Research and development expenses | 519 | 519 | — | — | ||||||||||||||||||||||
| Interest expense of Financial Products | 338 | — | 338 | — | ||||||||||||||||||||||
| Other operating (income) expenses | 344 | 20 | 361 | (37) | 2 | |||||||||||||||||||||
| Total operating costs | 13,291 | 12,397 | 925 | (31) | ||||||||||||||||||||||
| Operating profit | 2,924 | 2,935 | 137 | (148) | ||||||||||||||||||||||
| Interest expense excluding Financial Products | 107 | 111 | — | (4) | 3 | |||||||||||||||||||||
| Other income (expense) | 426 | 891 | 16 | (481) | 4 | |||||||||||||||||||||
| Consolidated profit before taxes | 3,243 | 3,715 | 153 | (625) | ||||||||||||||||||||||
| Provision (benefit) for income taxes | 463 | 680 | (217) | — | ||||||||||||||||||||||
| Profit of consolidated companies | 2,780 | 3,035 | 370 | (625) | ||||||||||||||||||||||
| Equity in profit (loss) of unconsolidated affiliated companies | 10 | 10 | — | — | ||||||||||||||||||||||
| Profit of consolidated and affiliated companies | 2,790 | 3,045 | 370 | (625) | ||||||||||||||||||||||
| Less: Profit (loss) attributable to noncontrolling interests | (1) | (1) | — | — | ||||||||||||||||||||||
Profit 5 | $ | 2,791 | $ | 3,046 | $ | 370 | $ | (625) | ||||||||||||||||||
| 1 | Elimination of Financial Products’ revenues earned from MP&E. | ||||
| 2 | Elimination of net expenses recorded between MP&E paid to Financial Products. | ||||
| 3 | Elimination of interest expense recorded between Financial Products and MP&E. | ||||
| 4 | Elimination of discount recorded by MP&E on receivables sold to Financial Products and of interest earned between MP&E and Financial Products as well as dividends paid by Financial Products to MP&E. | ||||
| 5 | Profit attributable to common shareholders. | ||||
| Supplemental Consolidating Data | ||||||||||||||||||||||||||
| Consolidated | Machinery, Power & Energy | Financial Products | Consolidating Adjustments | |||||||||||||||||||||||
| Sales and revenues: | ||||||||||||||||||||||||||
| Sales of Machinery, Power & Energy | $ | 63,980 | $ | 63,980 | $ | — | $ | — | ||||||||||||||||||
| Revenues of Financial Products | 3,609 | — | 4,382 | (773) | 1 | |||||||||||||||||||||
| Total sales and revenues | 67,589 | 63,980 | 4,382 | (773) | ||||||||||||||||||||||
| Operating costs: | ||||||||||||||||||||||||||
| Cost of goods sold | 44,752 | 44,761 | — | (9) | 2 | |||||||||||||||||||||
| Selling, general and administrative expenses | 6,985 | 6,183 | 842 | (40) | 2 | |||||||||||||||||||||
| Research and development expenses | 2,148 | 2,148 | — | — | ||||||||||||||||||||||
| Interest expense of Financial Products | 1,359 | — | 1,389 | (30) | 2 | |||||||||||||||||||||
| Other operating (income) expenses | 1,194 | 4 | 1,287 | (97) | 2 | |||||||||||||||||||||
| Total operating costs | 56,438 | 53,096 | 3,518 | (176) | ||||||||||||||||||||||
| Operating profit | 11,151 | 10,884 | 864 | (597) | ||||||||||||||||||||||
| Interest expense excluding Financial Products | 502 | 516 | — | (14) | 3 | |||||||||||||||||||||
| Other income (expense) | 892 | 685 | 113 | 94 | 4 | |||||||||||||||||||||
| Consolidated profit before taxes | 11,541 | 11,053 | 977 | (489) | ||||||||||||||||||||||
| Provision (benefit) for income taxes | 2,768 | 2,525 | 243 | — | ||||||||||||||||||||||
| Profit of consolidated companies | 8,773 | 8,528 | 734 | (489) | ||||||||||||||||||||||
| Equity in profit (loss) of unconsolidated affiliated companies | 109 | 109 | — | — | ||||||||||||||||||||||
| Profit of consolidated and affiliated companies | 8,882 | 8,637 | 734 | (489) | ||||||||||||||||||||||
| Less: Profit (loss) attributable to noncontrolling interests | (2) | (3) | 1 | — | ||||||||||||||||||||||
Profit 5 | $ | 8,884 | $ | 8,640 | $ | 733 | $ | (489) | ||||||||||||||||||
| 1 | Elimination of Financial Products’ revenues earned from MP&E. | ||||
| 2 | Elimination of net expenses recorded between MP&E and Financial Products. | ||||
| 3 | Elimination of interest expense recorded between Financial Products and MP&E. | ||||
| 4 | Elimination of discount recorded by MP&E on receivables sold to Financial Products and of interest earned between MP&E and Financial Products as well as dividends paid by Financial Products to MP&E. | ||||
| 5 | Profit attributable to common shareholders. | ||||
| Supplemental Consolidating Data | ||||||||||||||||||||||||||
| Consolidated | Machinery, Power & Energy | Financial Products | Consolidating Adjustments | |||||||||||||||||||||||
| Sales and revenues: | ||||||||||||||||||||||||||
| Sales of Machinery, Power & Energy | $ | 61,363 | $ | 61,363 | $ | — | $ | — | ||||||||||||||||||
| Revenues of Financial Products | 3,446 | — | 4,212 | (766) | 1 | |||||||||||||||||||||
| Total sales and revenues | 64,809 | 61,363 | 4,212 | (766) | ||||||||||||||||||||||
| Operating costs: | ||||||||||||||||||||||||||
| Cost of goods sold | 40,199 | 40,206 | — | (7) | 2 | |||||||||||||||||||||
| Selling, general and administrative expenses | 6,667 | 5,881 | 786 | — | ||||||||||||||||||||||
| Research and development expenses | 2,107 | 2,107 | — | — | ||||||||||||||||||||||
| Interest expense of Financial Products | 1,286 | — | 1,286 | — | ||||||||||||||||||||||
| Other operating (income) expenses | 1,478 | 71 | 1,535 | (128) | 2 | |||||||||||||||||||||
| Total operating costs | 51,737 | 48,265 | 3,607 | (135) | ||||||||||||||||||||||
| Operating profit | 13,072 | 13,098 | 605 | (631) | ||||||||||||||||||||||
| Interest expense excluding Financial Products | 512 | 518 | — | (6) | 3 | |||||||||||||||||||||
| Other income (expense) | 813 | 728 | 85 | — | ||||||||||||||||||||||
| Consolidated profit before taxes | 13,373 | 13,308 | 690 | (625) | ||||||||||||||||||||||
| Provision (benefit) for income taxes | 2,629 | 2,663 | (34) | — | ||||||||||||||||||||||
| Profit of consolidated companies | 10,744 | 10,645 | 724 | (625) | ||||||||||||||||||||||
| Equity in profit (loss) of unconsolidated affiliated companies | 44 | 44 | — | — | ||||||||||||||||||||||
| Profit of consolidated and affiliated companies | 10,788 | 10,689 | 724 | (625) | ||||||||||||||||||||||
| Less: Profit (loss) attributable to noncontrolling interests | (4) | (5) | 1 | — | ||||||||||||||||||||||
Profit 4 | $ | 10,792 | $ | 10,694 | $ | 723 | $ | (625) | ||||||||||||||||||
| 1 | Elimination of Financial Products’ revenues earned from MP&E. | ||||
| 2 | Elimination of net expenses recorded between MP&E and Financial Products. | ||||
| 3 | Elimination of interest expense recorded between Financial Products and MP&E. | ||||
| 4 | Profit attributable to common shareholders. | ||||
| Supplemental Consolidating Data | ||||||||||||||||||||||||||
| Consolidated | Machinery, Power & Energy | Financial Products | Consolidating Adjustments | |||||||||||||||||||||||
| Assets | ||||||||||||||||||||||||||
| Current assets: | ||||||||||||||||||||||||||
| Cash and cash equivalents | $ | 9,980 | $ | 9,333 | $ | 647 | $ | — | ||||||||||||||||||
| Receivables – trade and other | 10,920 | 3,883 | 657 | 6,380 | 1,2 | |||||||||||||||||||||
| Receivables – finance | 10,649 | — | 17,325 | (6,676) | 2 | |||||||||||||||||||||
| Prepaid expenses and other current assets | 2,801 | 2,448 | 441 | (88) | 3 | |||||||||||||||||||||
| Inventories | 18,135 | 18,135 | — | — | ||||||||||||||||||||||
| Total current assets | 52,485 | 33,799 | 19,070 | (384) | ||||||||||||||||||||||
| Property, plant and equipment – net | 15,140 | 10,985 | 4,106 | 49 | 4 | |||||||||||||||||||||
| Long-term receivables – trade and other | 2,142 | 1,982 | 163 | (3) | 1,2 | |||||||||||||||||||||
| Long-term receivables – finance | 14,272 | — | 15,538 | (1,266) | 2 | |||||||||||||||||||||
| Noncurrent deferred and refundable income taxes | 2,882 | 3,208 | 133 | (459) | 5 | |||||||||||||||||||||
| Intangible assets | 241 | 241 | — | — | ||||||||||||||||||||||
| Goodwill | 5,321 | 5,321 | — | — | ||||||||||||||||||||||
| Other assets | 6,102 | 4,525 | 2,651 | (1,074) | 6 | |||||||||||||||||||||
| Total assets | $ | 98,585 | $ | 60,061 | $ | 41,661 | $ | (3,137) | ||||||||||||||||||
| Liabilities | ||||||||||||||||||||||||||
| Current liabilities: | ||||||||||||||||||||||||||
| Short-term borrowings | $ | 5,514 | $ | — | $ | 5,514 | $ | — | ||||||||||||||||||
| Accounts payable | 8,968 | 8,988 | 268 | (288) | 7,8 | |||||||||||||||||||||
| Accrued expenses | 5,587 | 4,877 | 710 | — | ||||||||||||||||||||||
| Accrued wages, salaries and employee benefits | 2,554 | 2,494 | 60 | — | ||||||||||||||||||||||
| Customer advances | 3,314 | 3,311 | 3 | — | ||||||||||||||||||||||
| Dividends payable | 703 | 703 | — | — | ||||||||||||||||||||||
| Other current liabilities | 2,798 | 2,259 | 645 | (106) | 5,9 | |||||||||||||||||||||
| Long-term debt due within one year | 7,120 | 35 | 7,085 | — | ||||||||||||||||||||||
| Total current liabilities | 36,558 | 22,667 | 14,285 | (394) | ||||||||||||||||||||||
| Long-term debt due after one year | 30,696 | 10,955 | 21,018 | (1,277) | 10 | |||||||||||||||||||||
| Liability for postemployment benefits | 3,838 | 3,837 | 1 | — | ||||||||||||||||||||||
| Other liabilities | 6,175 | 5,162 | 1,516 | (503) | 5 | |||||||||||||||||||||
| Total liabilities | 77,267 | 42,621 | 36,820 | (2,174) | ||||||||||||||||||||||
| Shareholders’ equity | ||||||||||||||||||||||||||
| Common stock | 7,181 | 7,181 | 905 | (905) | 11 | |||||||||||||||||||||
| Treasury stock | (49,539) | (49,539) | — | — | ||||||||||||||||||||||
| Profit employed in the business | 65,448 | 60,639 | 4,799 | 10 | 11 | |||||||||||||||||||||
| Accumulated other comprehensive income (loss) | (1,772) | (843) | (929) | — | ||||||||||||||||||||||
| Noncontrolling interests | — | 2 | 66 | (68) | 11 | |||||||||||||||||||||
| Total shareholders’ equity | 21,318 | 17,440 | 4,841 | (963) | ||||||||||||||||||||||
| Total liabilities and shareholders’ equity | $ | 98,585 | $ | 60,061 | $ | 41,661 | $ | (3,137) | ||||||||||||||||||
| 1 | Elimination of receivables between MP&E and Financial Products. | ||||
| 2 | Reclassification of MP&E’s trade receivables purchased by Financial Products and Financial Products’ wholesale inventory receivables. | ||||
| 3 | Elimination of MP&E's insurance premiums that are prepaid to Financial Products. | ||||
| 4 | Reclassification of Financial Products’ other assets to property, plant and equipment. | ||||
| 5 | Reclassification reflecting required netting of deferred tax assets/liabilities by taxing jurisdiction. | ||||
| 6 | Elimination of other intercompany assets and liabilities between MP&E and Financial Products. | ||||
| 7 | Elimination of payables between MP&E and Financial Products. | ||||
| 8 | Reclassification of Financial Products’ payables to customer advances. | ||||
| 9 | Elimination of prepaid insurance in Financial Products’ other liabilities. | ||||
| 10 | Elimination of debt between MP&E and Financial Products. | ||||
| 11 | Eliminations associated with MP&E’s investments in Financial Products’ subsidiaries. | ||||
| Supplemental Consolidating Data | ||||||||||||||||||||||||||
| Consolidated | Machinery, Power & Energy | Financial Products | Consolidating Adjustments | |||||||||||||||||||||||
| Assets | ||||||||||||||||||||||||||
| Current assets: | ||||||||||||||||||||||||||
| Cash and cash equivalents | $ | 6,889 | $ | 6,165 | $ | 724 | $ | — | ||||||||||||||||||
| Receivables – trade and other | 9,282 | 3,463 | 688 | 5,131 | 1,2 | |||||||||||||||||||||
| Receivables – finance | 9,565 | — | 14,957 | (5,392) | 2 | |||||||||||||||||||||
| Prepaid expenses and other current assets | 3,119 | 2,872 | 401 | (154) | 3 | |||||||||||||||||||||
| Inventories | 16,827 | 16,827 | — | — | ||||||||||||||||||||||
| Total current assets | 45,682 | 29,327 | 16,770 | (415) | ||||||||||||||||||||||
| Property, plant and equipment – net | 13,361 | 9,531 | 3,830 | — | ||||||||||||||||||||||
| Long-term receivables – trade and other | 1,225 | 500 | 86 | 639 | 1,2 | |||||||||||||||||||||
| Long-term receivables – finance | 13,242 | — | 14,048 | (806) | 2 | |||||||||||||||||||||
| Noncurrent deferred and refundable income taxes | 3,312 | 3,594 | 118 | (400) | 4 | |||||||||||||||||||||
| Intangible assets | 399 | 399 | — | — | ||||||||||||||||||||||
| Goodwill | 5,241 | 5,241 | — | — | ||||||||||||||||||||||
| Other assets | 5,302 | 4,050 | 2,277 | (1,025) | 5 | |||||||||||||||||||||
| Total assets | $ | 87,764 | $ | 52,642 | $ | 37,129 | $ | (2,007) | ||||||||||||||||||
| Liabilities | ||||||||||||||||||||||||||
| Current liabilities: | ||||||||||||||||||||||||||
| Short-term borrowings | $ | 4,393 | $ | — | $ | 4,393 | $ | — | ||||||||||||||||||
| Accounts payable | 7,675 | 7,619 | 331 | (275) | 6,7 | |||||||||||||||||||||
| Accrued expenses | 5,243 | 4,589 | 654 | — | ||||||||||||||||||||||
| Accrued wages, salaries and employee benefits | 2,391 | 2,335 | 56 | — | ||||||||||||||||||||||
| Customer advances | 2,322 | 2,305 | 3 | 14 | 7 | |||||||||||||||||||||
| Dividends payable | 674 | 674 | — | — | ||||||||||||||||||||||
| Other current liabilities | 2,909 | 2,388 | 696 | (175) | 4,8 | |||||||||||||||||||||
| Long-term debt due within one year | 6,665 | 46 | 6,619 | — | ||||||||||||||||||||||
| Total current liabilities | 32,272 | 19,956 | 12,752 | (436) | ||||||||||||||||||||||
| Long-term debt due after one year | 27,351 | 8,731 | 18,787 | (167) | 9 | |||||||||||||||||||||
| Liability for postemployment benefits | 3,757 | 3,757 | — | — | ||||||||||||||||||||||
| Other liabilities | 4,890 | 3,977 | 1,344 | (431) | 4 | |||||||||||||||||||||
| Total liabilities | 68,270 | 36,421 | 32,883 | (1,034) | ||||||||||||||||||||||
| Shareholders’ equity | ||||||||||||||||||||||||||
| Common stock | 6,941 | 6,941 | 905 | (905) | 10 | |||||||||||||||||||||
| Treasury stock | (44,331) | (44,331) | — | — | ||||||||||||||||||||||
| Profit employed in the business | 59,352 | 54,787 | 4,555 | 10 | 10 | |||||||||||||||||||||
| Accumulated other comprehensive income (loss) | (2,471) | (1,182) | (1,289) | — | ||||||||||||||||||||||
| Noncontrolling interests | 3 | 6 | 75 | (78) | 10 | |||||||||||||||||||||
| Total shareholders’ equity | 19,494 | 16,221 | 4,246 | (973) | ||||||||||||||||||||||
| Total liabilities and shareholders’ equity | $ | 87,764 | $ | 52,642 | $ | 37,129 | $ | (2,007) | ||||||||||||||||||
| 1 | Elimination of receivables between MP&E and Financial Products. | ||||
| 2 | Reclassification of MP&E’s trade receivables purchased by Financial Products and Financial Products’ wholesale inventory receivables. | ||||
| 3 | Elimination of MP&E's insurance premiums that are prepaid to Financial Products. | ||||
| 4 | Reclassification reflecting required netting of deferred tax assets/liabilities by taxing jurisdiction. | ||||
| 5 | Elimination of other intercompany assets and liabilities between MP&E and Financial Products. | ||||
| 6 | Elimination of payables between MP&E and Financial Products. | ||||
| 7 | Reclassification of Financial Products’ payables to customer advances. | ||||
| 8 | Elimination of prepaid insurance in Financial Products’ other liabilities. | ||||
| 9 | Elimination of debt between MP&E and Financial Products. | ||||
| 10 | Eliminations associated with MP&E’s investments in Financial Products’ subsidiaries. | ||||
| Supplemental Consolidating Data | ||||||||||||||||||||||||||
| Consolidated | Machinery, Power & Energy | Financial Products | Consolidating Adjustments | |||||||||||||||||||||||
| Cash flow from operating activities: | ||||||||||||||||||||||||||
| Profit of consolidated and affiliated companies | $ | 8,882 | $ | 8,637 | $ | 734 | $ | (489) | 1,5 | |||||||||||||||||
| Adjustments to reconcile profit to net cash provided by operating activities: | ||||||||||||||||||||||||||
| Depreciation and amortization | 2,262 | 1,497 | 765 | — | ||||||||||||||||||||||
| Actuarial (gain) loss on pension and postretirement benefits | (294) | (294) | — | — | ||||||||||||||||||||||
| Provision (benefit) for deferred income taxes | 465 | 395 | 70 | — | ||||||||||||||||||||||
| (Gain) loss on divestiture | 30 | 30 | — | — | ||||||||||||||||||||||
| Other | 742 | 658 | (513) | 597 | 2 | |||||||||||||||||||||
| Changes in assets and liabilities, net of acquisitions and divestitures: | ||||||||||||||||||||||||||
| Receivables – trade and other | (2,138) | (503) | 63 | (1,698) | 2,3 | |||||||||||||||||||||
| Inventories | (1,477) | (1,473) | — | (4) | 2 | |||||||||||||||||||||
| Accounts payable | 1,179 | 1,217 | (11) | (27) | 2 | |||||||||||||||||||||
| Accrued expenses | 438 | 486 | (48) | — | ||||||||||||||||||||||
| Accrued wages, salaries and employee benefits | 187 | 185 | 2 | — | ||||||||||||||||||||||
| Customer advances | 1,933 | 1,933 | — | — | ||||||||||||||||||||||
| Other assets – net | (176) | (48) | (28) | (100) | 2 | |||||||||||||||||||||
| Other liabilities – net | (294) | (442) | 40 | 108 | 2 | |||||||||||||||||||||
| Net cash provided by (used for) operating activities | 11,739 | 12,278 | 1,074 | (1,613) | ||||||||||||||||||||||
| Cash flow from investing activities: | ||||||||||||||||||||||||||
| Capital expenditures – excluding equipment leased to others | (2,821) | (2,758) | (94) | 31 | 2 | |||||||||||||||||||||
| Expenditures for equipment leased to others | (1,465) | (36) | (1,438) | 9 | 2 | |||||||||||||||||||||
| Proceeds from disposals of leased assets and property, plant and equipment | 708 | 79 | 665 | (36) | 2 | |||||||||||||||||||||
| Additions to finance receivables | (15,329) | — | (18,058) | 2,729 | 3 | |||||||||||||||||||||
| Collections of finance receivables | 13,515 | — | 15,664 | (2,149) | 3 | |||||||||||||||||||||
| Net intercompany purchased receivables | — | — | (529) | 529 | 3 | |||||||||||||||||||||
| Proceeds from sale of finance receivables | 71 | — | 71 | — | ||||||||||||||||||||||
| Additions to intercompany receivables (original maturities greater than three months) | — | (1,000) | — | 1,000 | 4 | |||||||||||||||||||||
| Collections of intercompany receivables (original maturities greater than three months) | — | — | 80 | (80) | 4 | |||||||||||||||||||||
| Investments and acquisitions (net of cash acquired) | (47) | (47) | — | — | ||||||||||||||||||||||
| Proceeds from sale of businesses and investments (net of cash sold) | 22 | 22 | — | — | ||||||||||||||||||||||
| Proceeds from maturities and sale of securities | 2,494 | 1,541 | 953 | — | ||||||||||||||||||||||
| Investments in securities | (1,930) | (797) | (1,133) | — | ||||||||||||||||||||||
| Other – net | 75 | 126 | (51) | — | ||||||||||||||||||||||
| Net cash provided by (used for) investing activities | (4,707) | (2,870) | (3,870) | 2,033 | ||||||||||||||||||||||
| Cash flow from financing activities: | ||||||||||||||||||||||||||
| Dividends paid | (2,749) | (2,749) | (500) | 500 | 5 | |||||||||||||||||||||
| Common stock issued, and other stock compensation transactions, net | (16) | (16) | — | — | ||||||||||||||||||||||
| Payments to purchase common stock | (5,190) | (5,190) | — | — | ||||||||||||||||||||||
| Excise tax paid on purchases of common stock | (73) | (73) | — | — | ||||||||||||||||||||||
| Proceeds from intercompany borrowings (original maturities greater than three months) | — | — | 1,000 | (1,000) | 4 | |||||||||||||||||||||
| Payments on intercompany borrowings (original maturities greater than three months) | — | (80) | — | 80 | 4 | |||||||||||||||||||||
| Proceeds from debt issued (original maturities greater than three months) | 11,105 | 1,976 | 9,129 | — | ||||||||||||||||||||||
| Payments on debt (original maturities greater than three months) | (8,081) | (51) | (8,030) | — | ||||||||||||||||||||||
| Short-term borrowings – net (original maturities three months or less) | 1,106 | — | 1,106 | — | ||||||||||||||||||||||
| Other – net | (1) | (1) | — | — | ||||||||||||||||||||||
| Net cash provided by (used for) financing activities | (3,899) | (6,184) | 2,705 | (420) | ||||||||||||||||||||||
| Effect of exchange rate changes on cash | (43) | (58) | 15 | — | ||||||||||||||||||||||
| Increase (decrease) in cash, cash equivalents and restricted cash | 3,090 | 3,166 | (76) | — | ||||||||||||||||||||||
| Cash, cash equivalents and restricted cash at beginning of period | 6,896 | 6,170 | 726 | — | ||||||||||||||||||||||
| Cash, cash equivalents and restricted cash at end of period | $ | 9,986 | $ | 9,336 | $ | 650 | $ | — | ||||||||||||||||||
| 1 | Elimination of equity profit earned from Financial Products' subsidiaries partially owned by MP&E subsidiaries. | ||||
| 2 | Elimination of non-cash adjustments and changes in assets and liabilities related to consolidated reporting. | ||||
| 3 | Reclassification of Financial Products’ cash flow activity from investing to operating for receivables that arose from the sale of inventory. | ||||
| 4 | Elimination of proceeds and payments to/from MP&E and Financial Products | ||||
| 5 | Elimination of dividend activity between Financial Products and MP&E. | ||||
| Supplemental Consolidating Data | ||||||||||||||||||||||||||
| Consolidated | Machinery, Power & Energy | Financial Products | Consolidating Adjustments | |||||||||||||||||||||||
| Cash flow from operating activities: | ||||||||||||||||||||||||||
| Profit of consolidated and affiliated companies | $ | 10,788 | $ | 10,689 | $ | 724 | $ | (625) | 1,5 | |||||||||||||||||
| Adjustments to reconcile profit to net cash provided by operating activities: | ||||||||||||||||||||||||||
| Depreciation and amortization | 2,153 | 1,368 | 785 | — | ||||||||||||||||||||||
| Actuarial (gain) loss on pension and postretirement benefits | (154) | (154) | — | — | ||||||||||||||||||||||
| Provision (benefit) for deferred income taxes | (621) | (327) | (294) | — | ||||||||||||||||||||||
| (Gain) loss on divestiture | 164 | (46) | 210 | — | ||||||||||||||||||||||
| Other | 564 | 355 | (388) | 597 | 2 | |||||||||||||||||||||
| Changes in assets and liabilities, net of acquisitions and divestitures: | ||||||||||||||||||||||||||
| Receivables – trade and other | (160) | 413 | 207 | (780) | 2,3 | |||||||||||||||||||||
| Inventories | (414) | (400) | — | (14) | 2 | |||||||||||||||||||||
| Accounts payable | (282) | (200) | (41) | (41) | 2 | |||||||||||||||||||||
| Accrued expenses | 191 | 78 | 113 | — | ||||||||||||||||||||||
| Accrued wages, salaries and employee benefits | (363) | (358) | (5) | — | ||||||||||||||||||||||
| Customer advances | 370 | 369 | 1 | — | ||||||||||||||||||||||
| Other assets – net | (97) | (188) | 48 | 43 | 2 | |||||||||||||||||||||
| Other liabilities – net | (104) | (162) | 85 | (27) | 2 | |||||||||||||||||||||
| Net cash provided by (used for) operating activities | 12,035 | 11,437 | 1,445 | (847) | ||||||||||||||||||||||
| Cash flow from investing activities: | ||||||||||||||||||||||||||
| Capital expenditures – excluding equipment leased to others | (1,988) | (1,952) | (41) | 5 | 2 | |||||||||||||||||||||
| Expenditures for equipment leased to others | (1,227) | (36) | (1,211) | 20 | 2 | |||||||||||||||||||||
| Proceeds from disposals of leased assets and property, plant and equipment | 722 | 35 | 698 | (11) | 2 | |||||||||||||||||||||
| Additions to finance receivables | (15,409) | — | (16,845) | 1,436 | 3 | |||||||||||||||||||||
| Collections of finance receivables | 13,608 | — | 14,707 | (1,099) | 3 | |||||||||||||||||||||
| Net intercompany purchased receivables | — | — | 129 | (129) | 3 | |||||||||||||||||||||
| Proceeds from sale of finance receivables | 83 | — | 83 | — | ||||||||||||||||||||||
| Net intercompany borrowings | — | — | 21 | (21) | 4 | |||||||||||||||||||||
| Investments and acquisitions (net of cash acquired) | (34) | (34) | — | — | ||||||||||||||||||||||
| Proceeds from sale of businesses and investments (net of cash sold) | (61) | 92 | (153) | — | ||||||||||||||||||||||
| Proceeds from maturities and sale of securities | 3,155 | 2,795 | 360 | — | ||||||||||||||||||||||
| Investments in securities | (1,495) | (909) | (586) | — | ||||||||||||||||||||||
| Other – net | 193 | 142 | 51 | — | ||||||||||||||||||||||
| Net cash provided by (used for) investing activities | (2,453) | 133 | (2,787) | 201 | ||||||||||||||||||||||
| Cash flow from financing activities: | ||||||||||||||||||||||||||
| Dividends paid | (2,646) | (2,646) | (625) | 625 | 5 | |||||||||||||||||||||
| Common stock issued, including treasury shares reissued | 20 | 20 | — | — | ||||||||||||||||||||||
| Payments to purchase common stock | (7,697) | (7,697) | — | — | ||||||||||||||||||||||
| Excise tax paid on purchases of common stock | (40) | (40) | — | — | ||||||||||||||||||||||
| Net intercompany borrowings | — | (21) | — | 21 | 4 | |||||||||||||||||||||
| Proceeds from debt issued (original maturities greater than three months) | 10,283 | — | 10,283 | — | ||||||||||||||||||||||
| Payments on debt (original maturities greater than three months) | (9,316) | (1,032) | (8,284) | — | ||||||||||||||||||||||
| Short-term borrowings – net (original maturities three months or less) | (168) | — | (168) | — | ||||||||||||||||||||||
| Other – net | (1) | (1) | — | — | ||||||||||||||||||||||
| Net cash provided by (used for) financing activities | (9,565) | (11,417) | 1,206 | 646 | ||||||||||||||||||||||
| Effect of exchange rate changes on cash | (106) | (94) | (12) | — | ||||||||||||||||||||||
| Increase (decrease) in cash, cash equivalents and restricted cash | (89) | 59 | (148) | — | ||||||||||||||||||||||
| Cash, cash equivalents and restricted cash at beginning of period | 6,985 | 6,111 | 874 | — | ||||||||||||||||||||||
| Cash, cash equivalents and restricted cash at end of period | $ | 6,896 | $ | 6,170 | $ | 726 | $ | — | ||||||||||||||||||
| 1 | Elimination of equity profit earned from Financial Products' subsidiaries partially owned by MP&E subsidiaries. | ||||
| 2 | Elimination of non-cash adjustments and changes in assets and liabilities related to consolidated reporting. | ||||
| 3 | Reclassification of Financial Products’ cash flow activity from investing to operating for receivables that arose from the sale of inventory. | ||||
| 4 | Elimination of net proceeds and payments to/from MP&E and Financial Products. | ||||
| 5 | Elimination of dividend activity between Financial Products and MP&E. | ||||