CNA Financial Corporation Supplemental Financial Information September 30, 2026 This report is for informational purposes only and includes consolidated financial statements and financial exhibits that are unaudited. This report should be read in conjunction with documents filed with the U.S. Securities and Exchange Commission, including the most recent Annual Report on Form 10-K and Quarterly Reports on Form 10-Q.
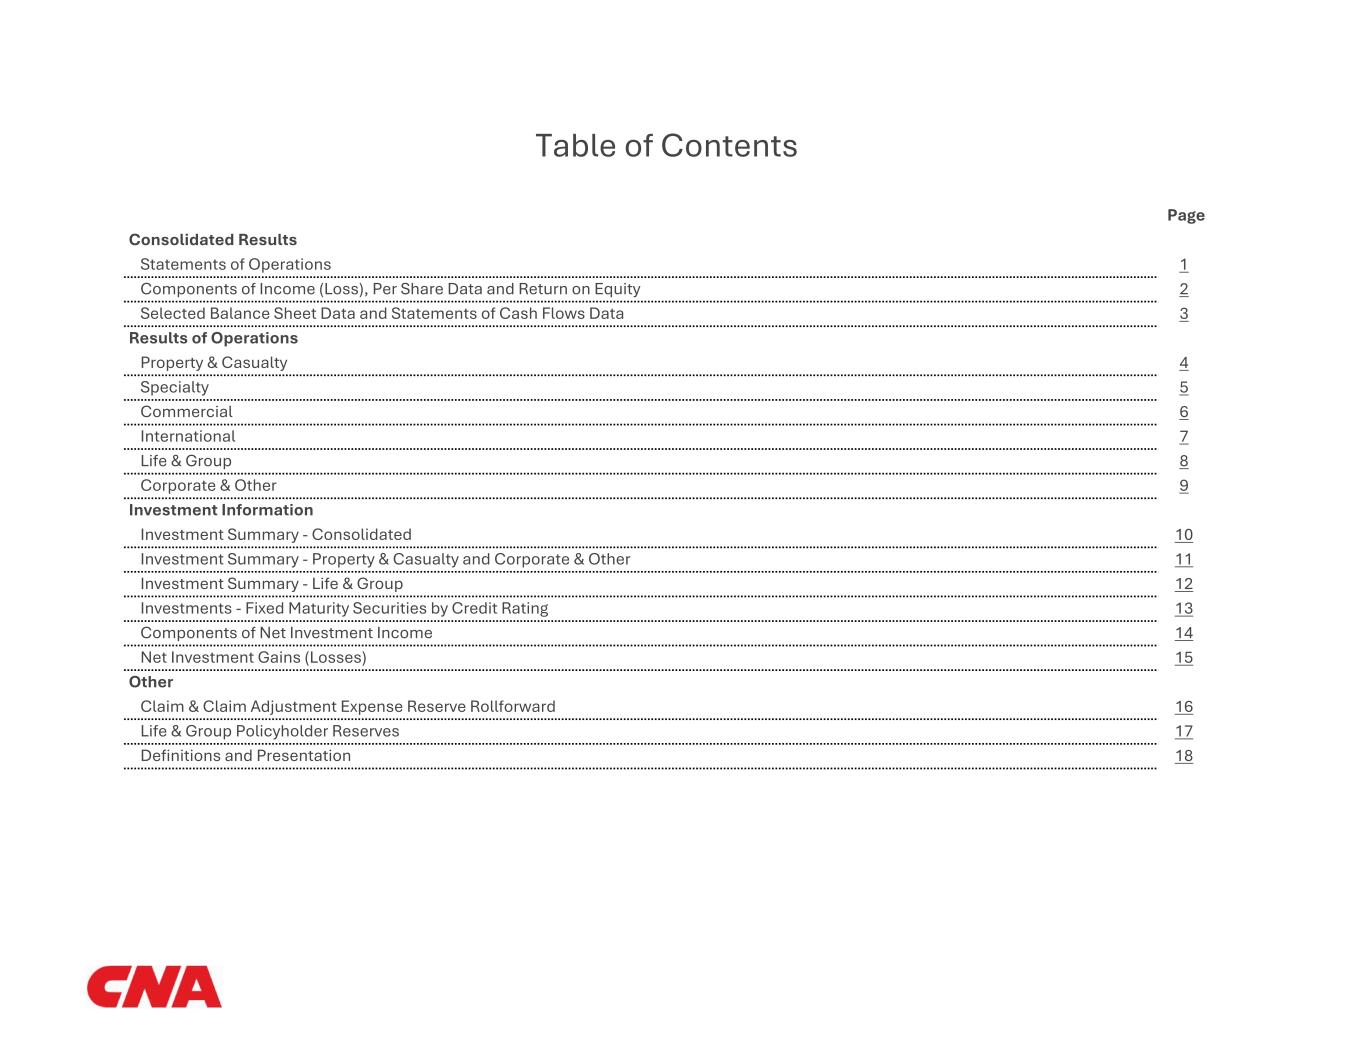
Table of Contents Consolidated Results Statements of Operations 1 Components of Income (Loss), Per Share Data and Return on Equity 2 Selected Balance Sheet Data and Statements of Cash Flows Data 3 Results of Operations Property & Casualty 4 Specialty 5 Commercial 6 International 7 Life & Group 8 Corporate & Other 9 Investment Information Investment Summary - Consolidated 10 Investment Summary - Property & Casualty and Corporate & Other 11 Investment Summary - Life & Group 12 Investments - Fixed Maturity Securities by Credit Rating 13 Components of Net Investment Income 14 Net Investment Gains (Losses) 15 Other Claim & Claim Adjustment Expense Reserve Rollforward 16 Life & Group Policyholder Reserves 17 Definitions and Presentation 18 Page
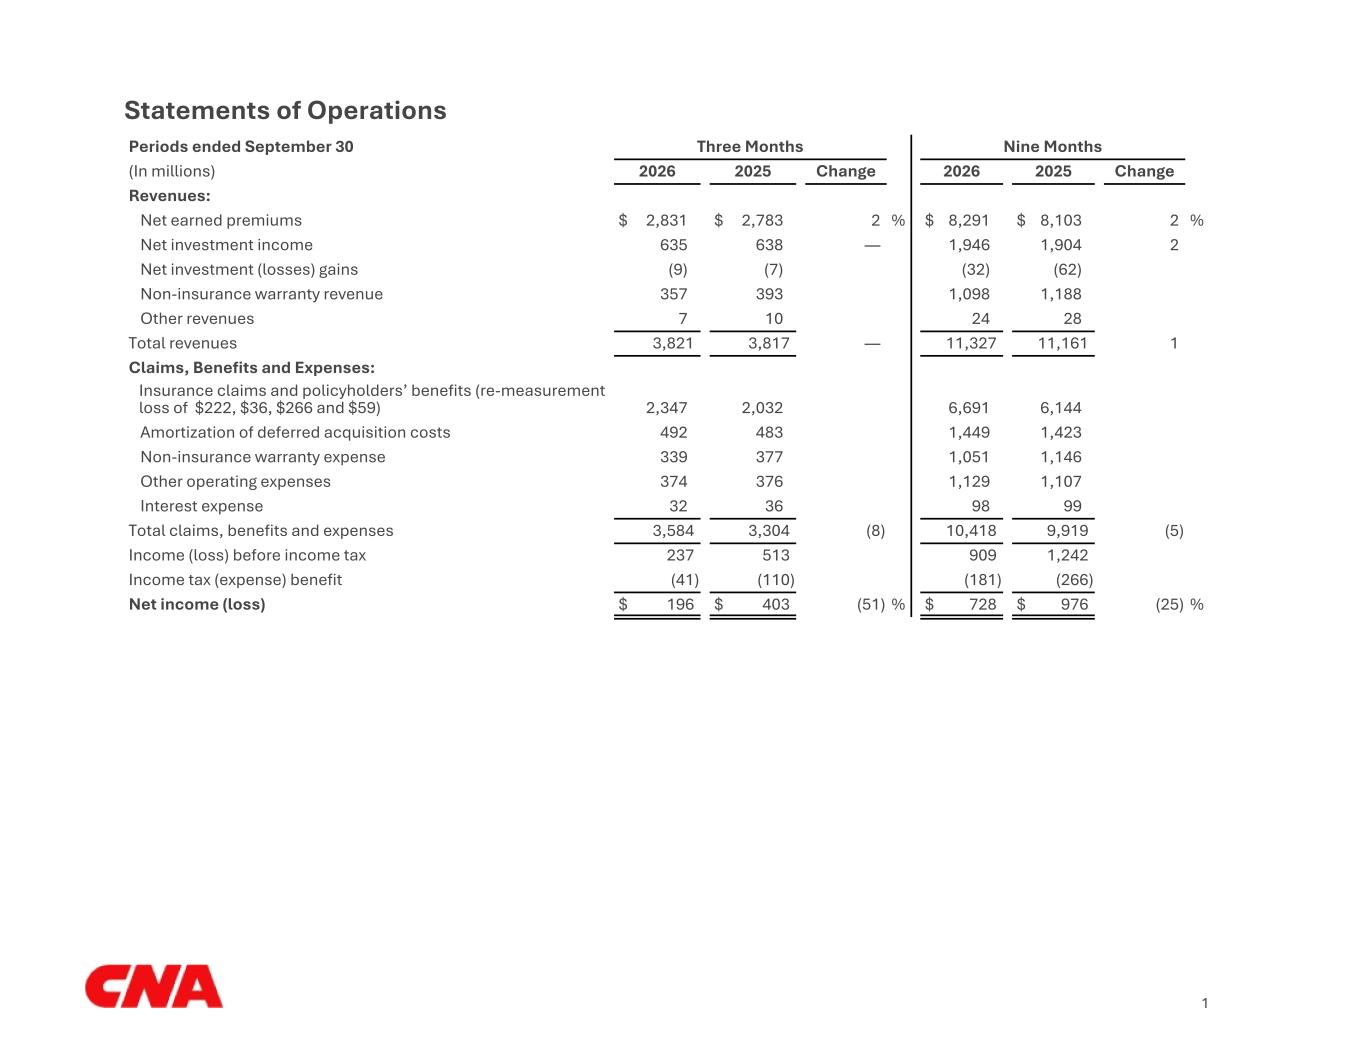
Statements of Operations Periods ended September 30 Three Months Nine Months (In millions) 2026 2025 Change 2026 2025 Change Revenues: Net earned premiums $ 2,831 $ 2,783 2 % $ 8,291 $ 8,103 2 % Net investment income 635 638 — 1,946 1,904 2 Net investment (losses) gains (9) (7) (32) (62) Non-insurance warranty revenue 357 393 1,098 1,188 Other revenues 7 10 24 28 Total revenues 3,821 3,817 — 11,327 11,161 1 Claims, Benefits and Expenses: Insurance claims and policyholders’ benefits (re-measurement loss of $222, $36, $266 and $59) 2,347 2,032 6,691 6,144 Amortization of deferred acquisition costs 492 483 1,449 1,423 Non-insurance warranty expense 339 377 1,051 1,146 Other operating expenses 374 376 1,129 1,107 Interest expense 32 36 98 99 Total claims, benefits and expenses 3,584 3,304 (8) 10,418 9,919 (5) Income (loss) before income tax 237 513 909 1,242 Income tax (expense) benefit (41) (110) (181) (266) Net income (loss) $ 196 $ 403 (51) % $ 728 $ 976 (25) % 1
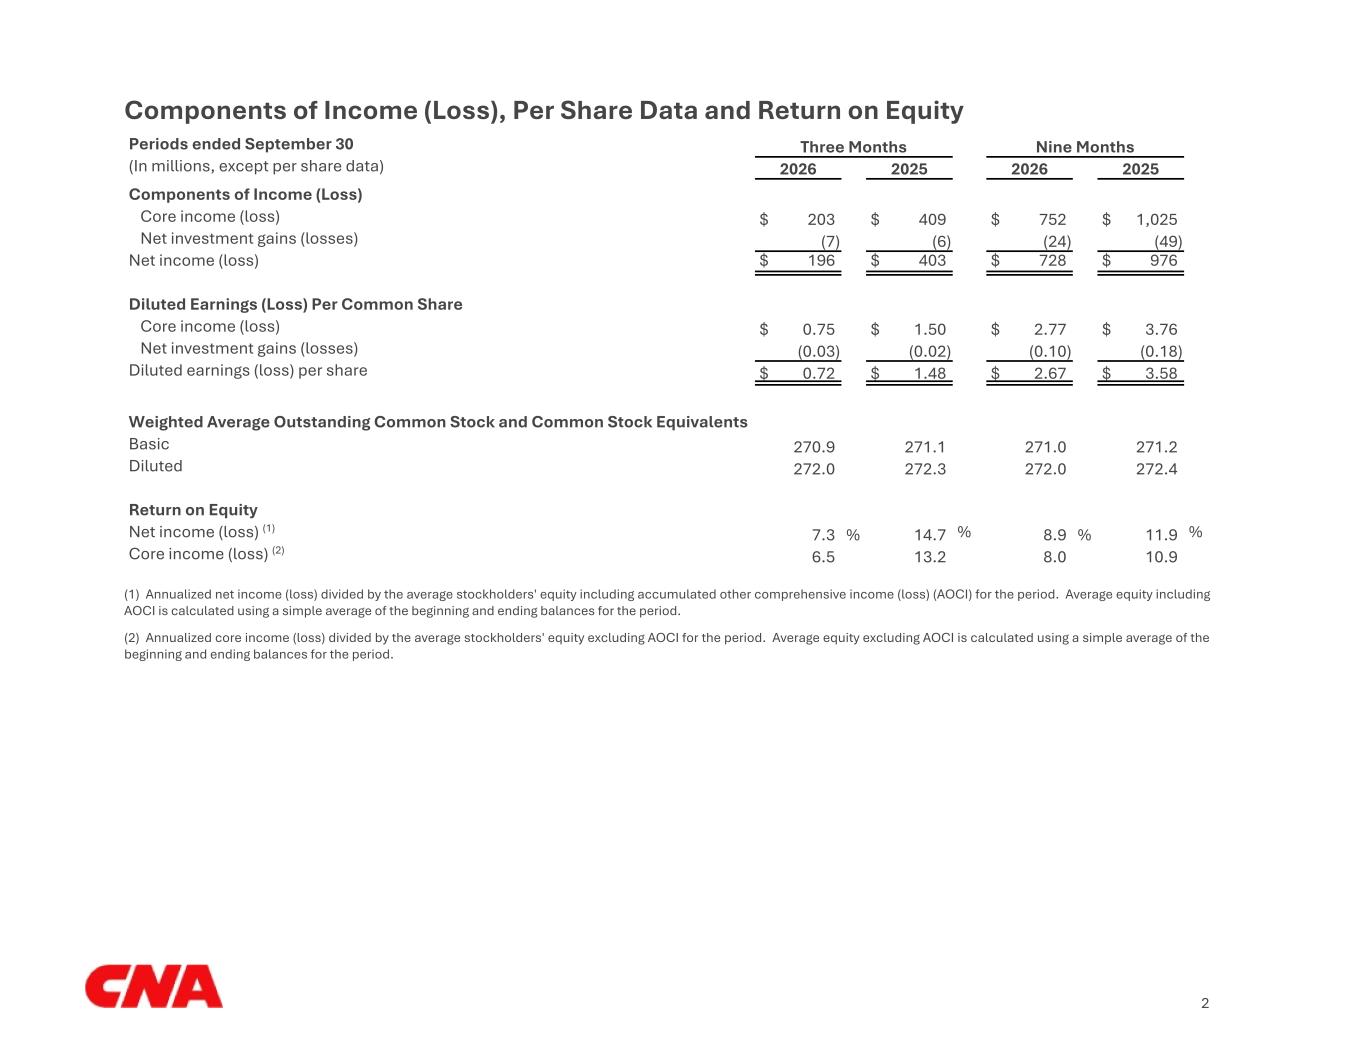
Components of Income (Loss), Per Share Data and Return on Equity Periods ended September 30 Three Months Nine Months (In millions, except per share data) 2026 2025 2026 2025 Components of Income (Loss) Core income (loss) $ 203 $ 409 $ 752 $ 1,025 Net investment gains (losses) (7) (6) (24) (49) Net income (loss) $ 196 $ 403 $ 728 $ 976 Diluted Earnings (Loss) Per Common Share Core income (loss) $ 0.75 $ 1.50 $ 2.77 $ 3.76 Net investment gains (losses) (0.03) (0.02) (0.10) (0.18) Diluted earnings (loss) per share $ 0.72 $ 1.48 $ 2.67 $ 3.58 Weighted Average Outstanding Common Stock and Common Stock Equivalents Basic 270.9 271.1 271.0 271.2 Diluted 272.0 272.3 272.0 272.4 Return on Equity Net income (loss) (1) 7.3 % 14.7 % 8.9 % 11.9 % Core income (loss) (2) 6.5 13.2 8.0 10.9 (1) Annualized net income (loss) divided by the average stockholders' equity including accumulated other comprehensive income (loss) (AOCI) for the period. Average equity including AOCI is calculated using a simple average of the beginning and ending balances for the period. (2) Annualized core income (loss) divided by the average stockholders' equity excluding AOCI for the period. Average equity excluding AOCI is calculated using a simple average of the beginning and ending balances for the period. 2
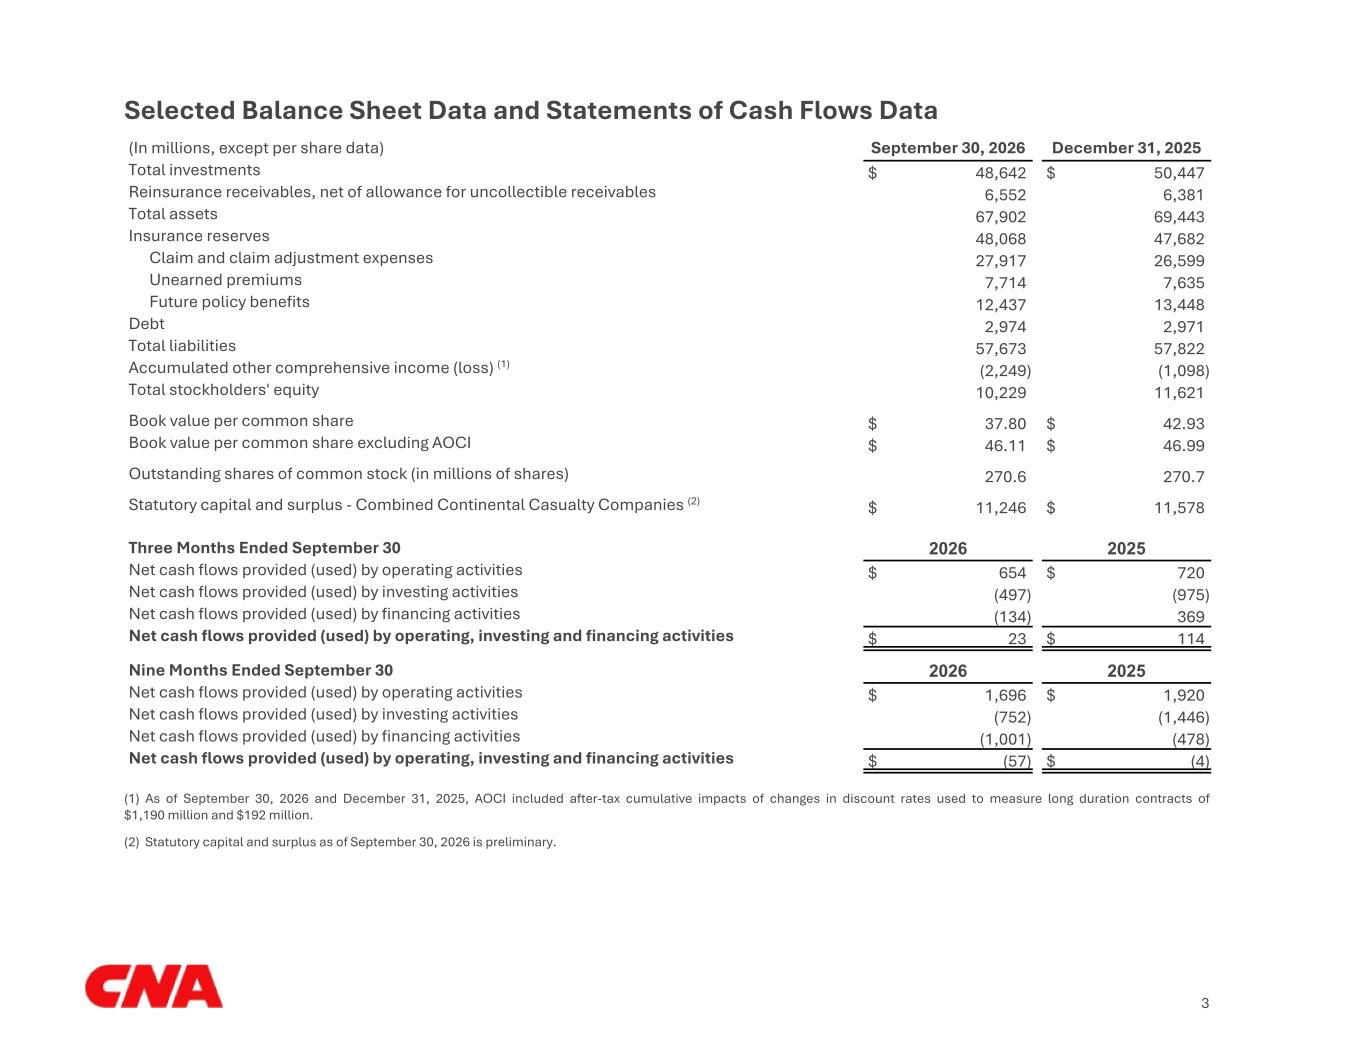
Selected Balance Sheet Data and Statements of Cash Flows Data (In millions, except per share data) September 30, 2026 December 31, 2025 Total investments $ 48,642 $ 50,447 Reinsurance receivables, net of allowance for uncollectible receivables 6,552 6,381 Total assets 67,902 69,443 Insurance reserves 48,068 47,682 Claim and claim adjustment expenses 27,917 26,599 Unearned premiums 7,714 7,635 Future policy benefits 12,437 13,448 Debt 2,974 2,971 Total liabilities 57,673 57,822 Accumulated other comprehensive income (loss) (1) (2,249) (1,098) Total stockholders' equity 10,229 11,621 Book value per common share $ 37.80 $ 42.93 Book value per common share excluding AOCI $ 46.11 $ 46.99 Outstanding shares of common stock (in millions of shares) 270.6 270.7 Statutory capital and surplus - Combined Continental Casualty Companies (2) $ 11,246 $ 11,578 Three Months Ended September 30 2026 2025 Net cash flows provided (used) by operating activities $ 654 $ 720 Net cash flows provided (used) by investing activities (497) (975) Net cash flows provided (used) by financing activities (134) 369 Net cash flows provided (used) by operating, investing and financing activities $ 23 $ 114 Nine Months Ended September 30 2026 2025 Net cash flows provided (used) by operating activities $ 1,696 $ 1,920 Net cash flows provided (used) by investing activities (752) (1,446) Net cash flows provided (used) by financing activities (1,001) (478) Net cash flows provided (used) by operating, investing and financing activities $ (57) $ (4) (1) As of September 30, 2026 and December 31, 2025, AOCI included after-tax cumulative impacts of changes in discount rates used to measure long duration contracts of $1,190 million and $192 million. (2) Statutory capital and surplus as of September 30, 2026 is preliminary. 3
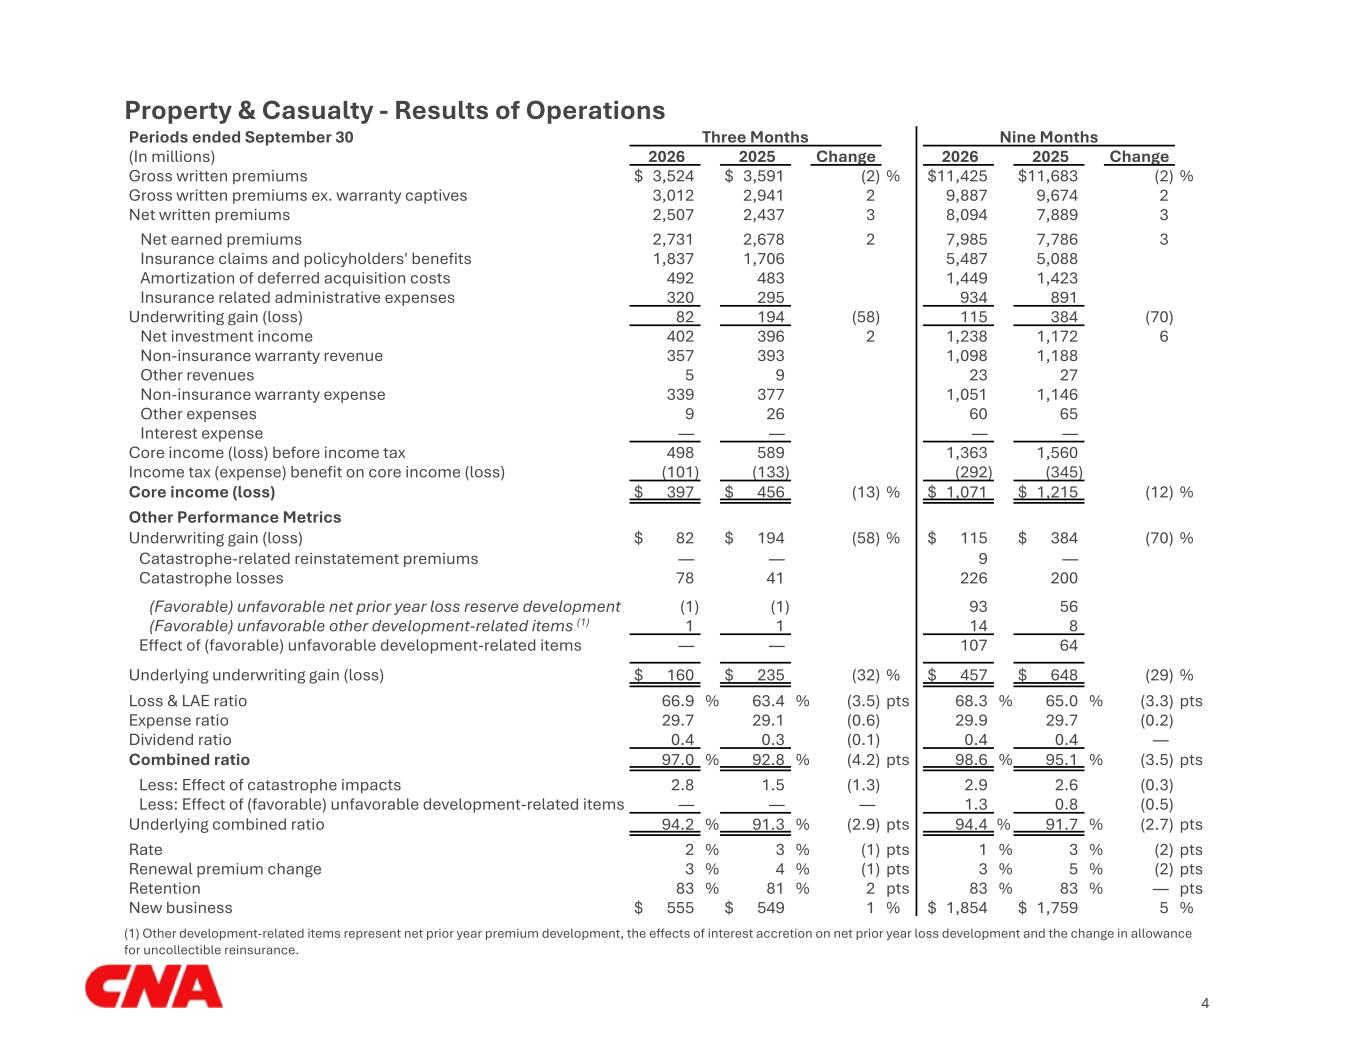
Property & Casualty - Results of Operations Periods ended September 30 Three Months Nine Months (In millions) 2026 2025 Change 2026 2025 Change Gross written premiums $ 3,524 $ 3,591 (2) % $ 11,425 $ 11,683 (2) % Gross written premiums ex. warranty captives 3,012 2,941 2 9,887 9,674 2 Net written premiums 2,507 2,437 3 8,094 7,889 3 Net earned premiums 2,731 2,678 2 7,985 7,786 3 Insurance claims and policyholders' benefits 1,837 1,706 5,487 5,088 Amortization of deferred acquisition costs 492 483 1,449 1,423 Insurance related administrative expenses 320 295 934 891 Underwriting gain (loss) 82 194 (58) 115 384 (70) Net investment income 402 396 2 1,238 1,172 6 Non-insurance warranty revenue 357 393 1,098 1,188 Other revenues 5 9 23 27 Non-insurance warranty expense 339 377 1,051 1,146 Other expenses 9 26 60 65 Interest expense — — — — Core income (loss) before income tax 498 589 1,363 1,560 Income tax (expense) benefit on core income (loss) (101) (133) (292) (345) Core income (loss) $ 397 $ 456 (13) % $ 1,071 $ 1,215 (12) % Other Performance Metrics Underwriting gain (loss) $ 82 $ 194 (58) % $ 115 $ 384 (70) % Catastrophe-related reinstatement premiums — — 9 — Catastrophe losses 78 41 226 200 (Favorable) unfavorable net prior year loss reserve development (1) (1) 93 56 (Favorable) unfavorable other development-related items (1) 1 1 14 8 Effect of (favorable) unfavorable development-related items — — 107 64 Underlying underwriting gain (loss) $ 160 $ 235 (32) % $ 457 $ 648 (29) % Loss & LAE ratio 66.9 % 63.4 % (3.5) pts 68.3 % 65.0 % (3.3) pts Expense ratio 29.7 29.1 (0.6) 29.9 29.7 (0.2) Dividend ratio 0.4 0.3 (0.1) 0.4 0.4 — Combined ratio 97.0 % 92.8 % (4.2) pts 98.6 % 95.1 % (3.5) pts Less: Effect of catastrophe impacts 2.8 1.5 (1.3) 2.9 2.6 (0.3) Less: Effect of (favorable) unfavorable development-related items — — — 1.3 0.8 (0.5) Underlying combined ratio 94.2 % 91.3 % (2.9) pts 94.4 % 91.7 % (2.7) pts Rate 2 % 3 % (1) pts 1 % 3 % (2) pts Renewal premium change 3 % 4 % (1) pts 3 % 5 % (2) pts Retention 83 % 81 % 2 pts 83 % 83 % — pts New business $ 555 $ 549 1 % $ 1,854 $ 1,759 5 % (1) Other development-related items represent net prior year premium development, the effects of interest accretion on net prior year loss development and the change in allowance for uncollectible reinsurance. 4
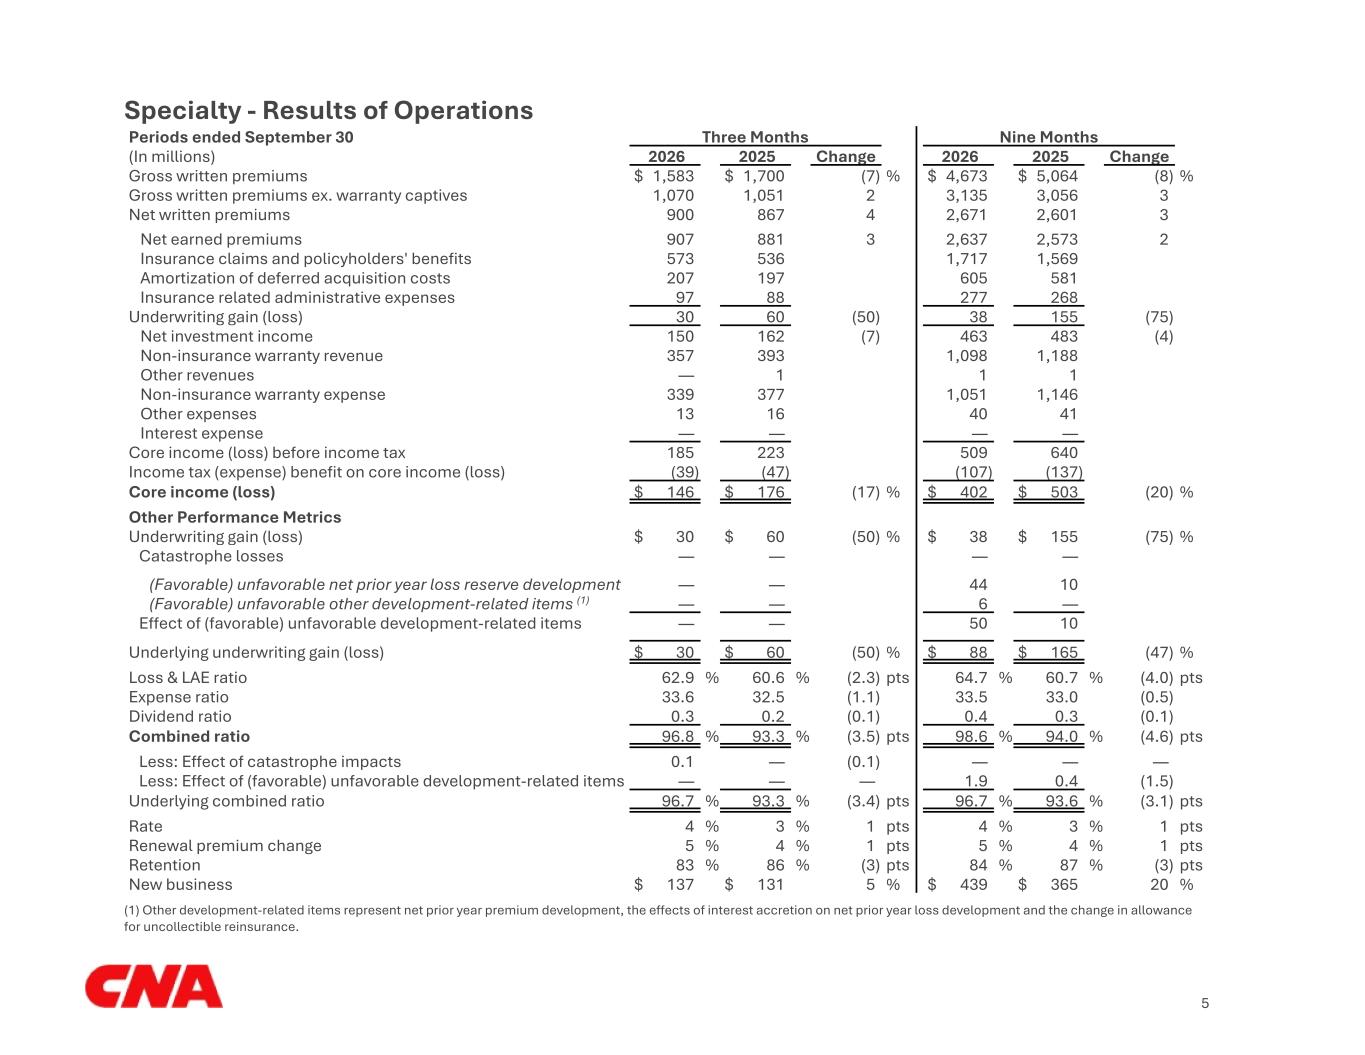
Specialty - Results of Operations Periods ended September 30 Three Months Nine Months (In millions) 2026 2025 Change 2026 2025 Change Gross written premiums $ 1,583 $ 1,700 (7) % $ 4,673 $ 5,064 (8) % Gross written premiums ex. warranty captives 1,070 1,051 2 3,135 3,056 3 Net written premiums 900 867 4 2,671 2,601 3 Net earned premiums 907 881 3 2,637 2,573 2 Insurance claims and policyholders' benefits 573 536 1,717 1,569 Amortization of deferred acquisition costs 207 197 605 581 Insurance related administrative expenses 97 88 277 268 Underwriting gain (loss) 30 60 (50) 38 155 (75) Net investment income 150 162 (7) 463 483 (4) Non-insurance warranty revenue 357 393 1,098 1,188 Other revenues — 1 1 1 Non-insurance warranty expense 339 377 1,051 1,146 Other expenses 13 16 40 41 Interest expense — — — — Core income (loss) before income tax 185 223 509 640 Income tax (expense) benefit on core income (loss) (39) (47) (107) (137) Core income (loss) $ 146 $ 176 (17) % $ 402 $ 503 (20) % Other Performance Metrics Underwriting gain (loss) $ 30 $ 60 (50) % $ 38 $ 155 (75) % Catastrophe losses — — — — (Favorable) unfavorable net prior year loss reserve development — — 44 10 (Favorable) unfavorable other development-related items (1) — — 6 — Effect of (favorable) unfavorable development-related items — — 50 10 Underlying underwriting gain (loss) $ 30 $ 60 (50) % $ 88 $ 165 (47) % Loss & LAE ratio 62.9 % 60.6 % (2.3) pts 64.7 % 60.7 % (4.0) pts Expense ratio 33.6 32.5 (1.1) 33.5 33.0 (0.5) Dividend ratio 0.3 0.2 (0.1) 0.4 0.3 (0.1) Combined ratio 96.8 % 93.3 % (3.5) pts 98.6 % 94.0 % (4.6) pts Less: Effect of catastrophe impacts 0.1 — (0.1) — — — Less: Effect of (favorable) unfavorable development-related items — — — 1.9 0.4 (1.5) Underlying combined ratio 96.7 % 93.3 % (3.4) pts 96.7 % 93.6 % (3.1) pts Rate 4 % 3 % 1 pts 4 % 3 % 1 pts Renewal premium change 5 % 4 % 1 pts 5 % 4 % 1 pts Retention 83 % 86 % (3) pts 84 % 87 % (3) pts New business $ 137 $ 131 5 % $ 439 $ 365 20 % (1) Other development-related items represent net prior year premium development, the effects of interest accretion on net prior year loss development and the change in allowance for uncollectible reinsurance. 5
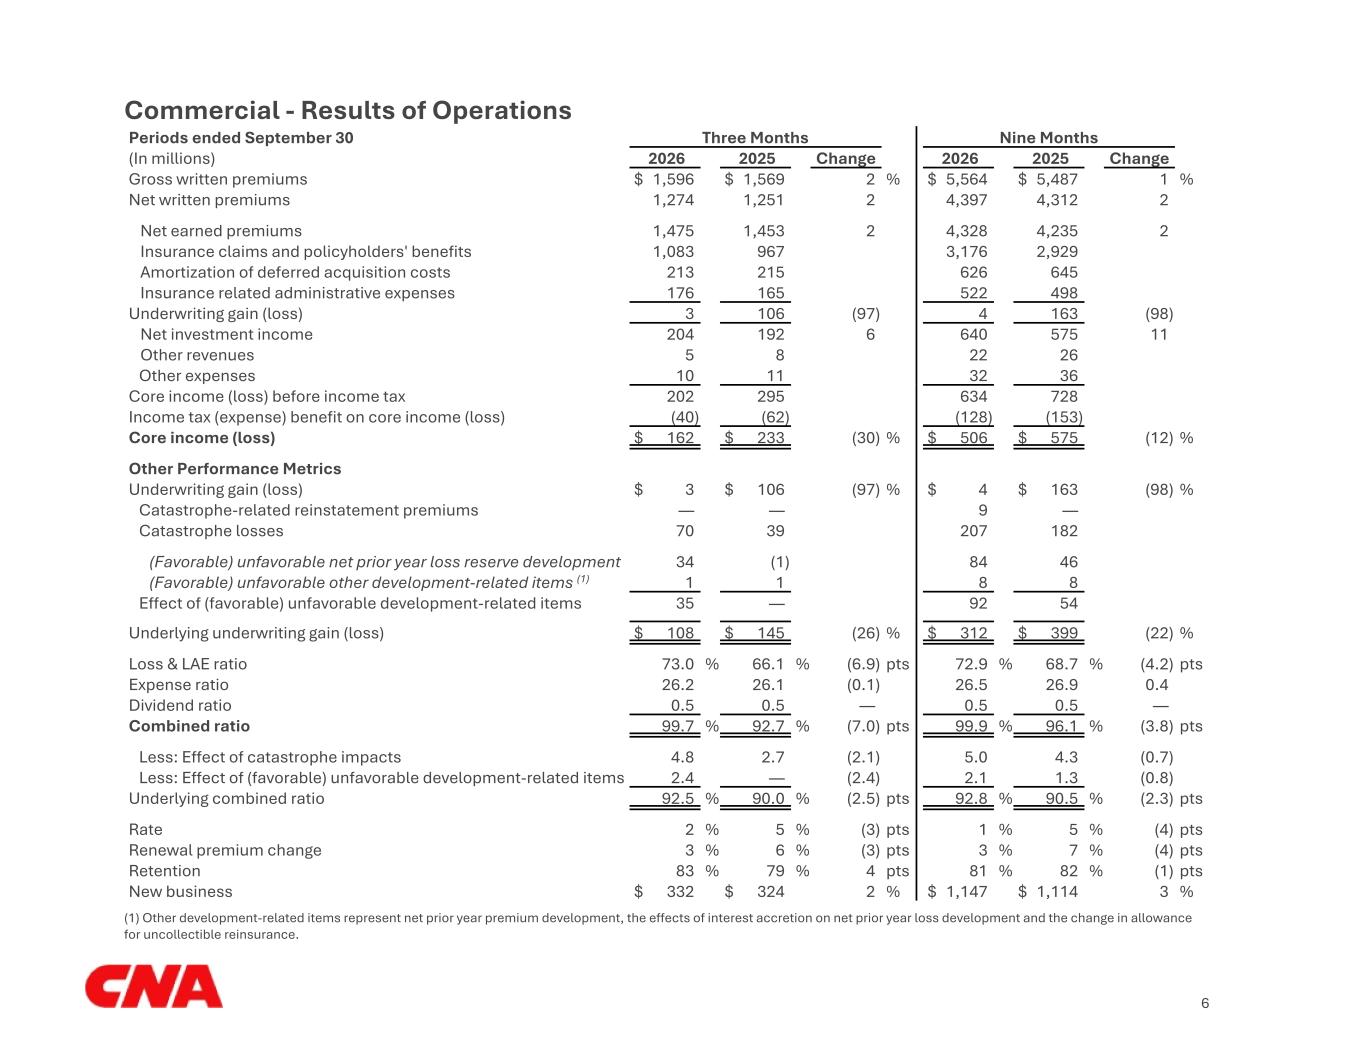
Commercial - Results of Operations Periods ended September 30 Three Months Nine Months (In millions) 2026 2025 Change 2026 2025 Change Gross written premiums $ 1,596 $ 1,569 2 % $ 5,564 $ 5,487 1 % Net written premiums 1,274 1,251 2 4,397 4,312 2 Net earned premiums 1,475 1,453 2 4,328 4,235 2 Insurance claims and policyholders' benefits 1,083 967 3,176 2,929 Amortization of deferred acquisition costs 213 215 626 645 Insurance related administrative expenses 176 165 522 498 Underwriting gain (loss) 3 106 (97) 4 163 (98) Net investment income 204 192 6 640 575 11 Other revenues 5 8 22 26 Other expenses 10 11 32 36 Core income (loss) before income tax 202 295 634 728 Income tax (expense) benefit on core income (loss) (40) (62) (128) (153) Core income (loss) $ 162 $ 233 (30) % $ 506 $ 575 (12) % Other Performance Metrics Underwriting gain (loss) $ 3 $ 106 (97) % $ 4 $ 163 (98) % Catastrophe-related reinstatement premiums — — 9 — Catastrophe losses 70 39 207 182 (Favorable) unfavorable net prior year loss reserve development 34 (1) 84 46 (Favorable) unfavorable other development-related items (1) 1 1 8 8 Effect of (favorable) unfavorable development-related items 35 — 92 54 Underlying underwriting gain (loss) $ 108 $ 145 (26) % $ 312 $ 399 (22) % Loss & LAE ratio 73.0 % 66.1 % (6.9) pts 72.9 % 68.7 % (4.2) pts Expense ratio 26.2 26.1 (0.1) 26.5 26.9 0.4 Dividend ratio 0.5 0.5 — 0.5 0.5 — Combined ratio 99.7 % 92.7 % (7.0) pts 99.9 % 96.1 % (3.8) pts Less: Effect of catastrophe impacts 4.8 2.7 (2.1) 5.0 4.3 (0.7) Less: Effect of (favorable) unfavorable development-related items 2.4 — (2.4) 2.1 1.3 (0.8) Underlying combined ratio 92.5 % 90.0 % (2.5) pts 92.8 % 90.5 % (2.3) pts Rate 2 % 5 % (3) pts 1 % 5 % (4) pts Renewal premium change 3 % 6 % (3) pts 3 % 7 % (4) pts Retention 83 % 79 % 4 pts 81 % 82 % (1) pts New business $ 332 $ 324 2 % $ 1,147 $ 1,114 3 % (1) Other development-related items represent net prior year premium development, the effects of interest accretion on net prior year loss development and the change in allowance for uncollectible reinsurance. 6
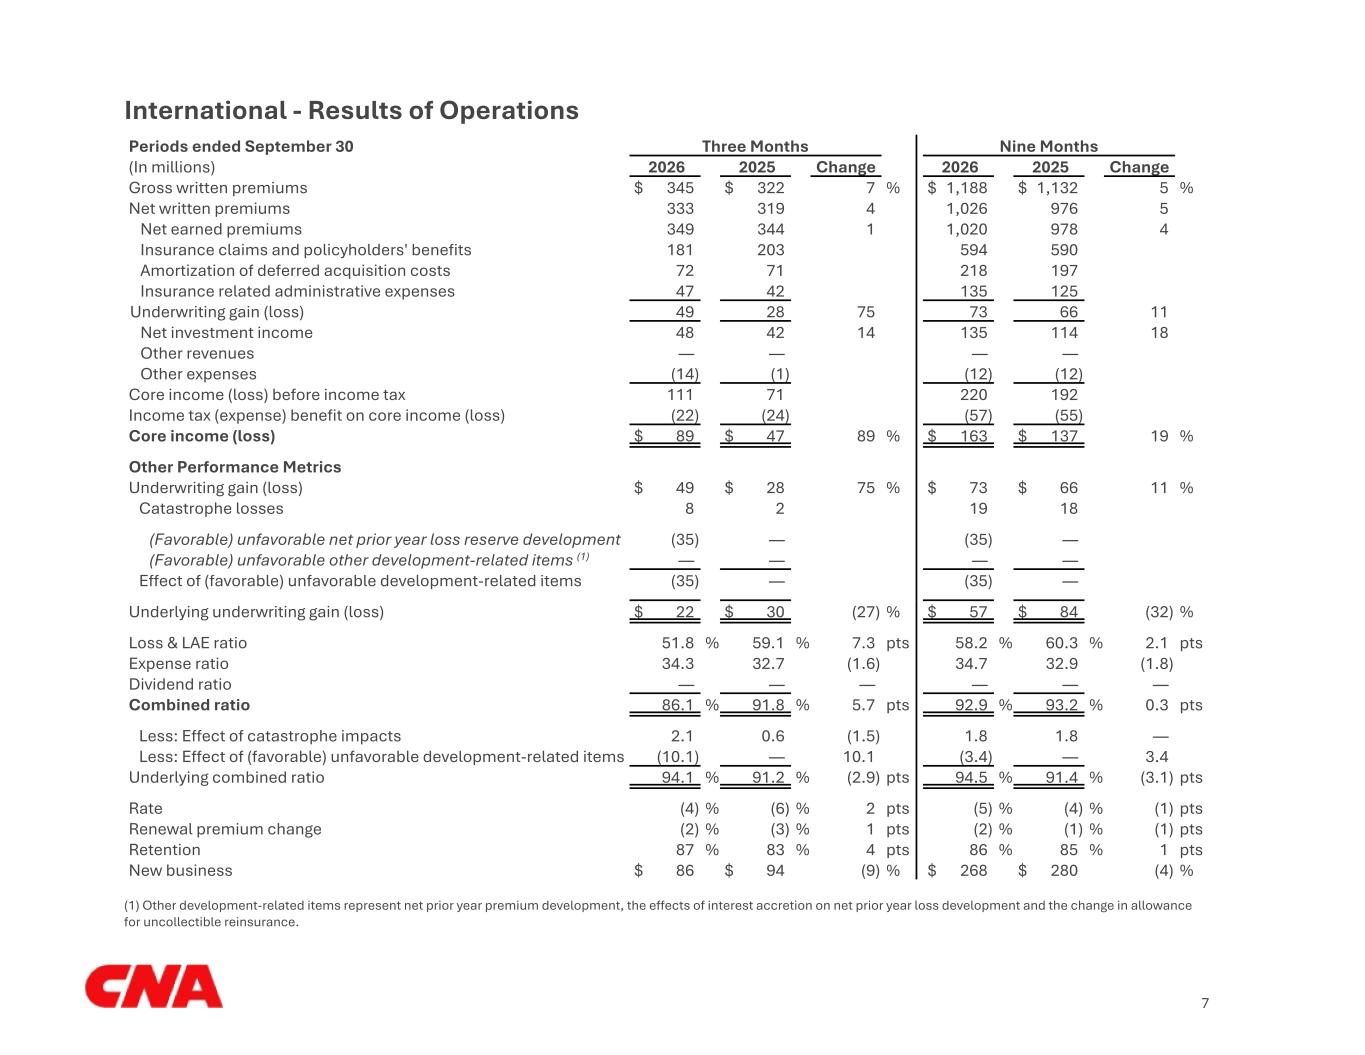
International - Results of Operations Periods ended September 30 Three Months Nine Months (In millions) 2026 2025 Change 2026 2025 Change Gross written premiums $ 345 $ 322 7 % $ 1,188 $ 1,132 5 % Net written premiums 333 319 4 1,026 976 5 Net earned premiums 349 344 1 1,020 978 4 Insurance claims and policyholders' benefits 181 203 594 590 Amortization of deferred acquisition costs 72 71 218 197 Insurance related administrative expenses 47 42 135 125 Underwriting gain (loss) 49 28 75 73 66 11 Net investment income 48 42 14 135 114 18 Other revenues — — — — Other expenses (14) (1) (12) (12) Core income (loss) before income tax 111 71 220 192 Income tax (expense) benefit on core income (loss) (22) (24) (57) (55) Core income (loss) $ 89 $ 47 89 % $ 163 $ 137 19 % Other Performance Metrics Underwriting gain (loss) $ 49 $ 28 75 % $ 73 $ 66 11 % Catastrophe losses 8 2 19 18 (Favorable) unfavorable net prior year loss reserve development (35) — (35) — (Favorable) unfavorable other development-related items (1) — — — — Effect of (favorable) unfavorable development-related items (35) — (35) — Underlying underwriting gain (loss) $ 22 $ 30 (27) % $ 57 $ 84 (32) % Loss & LAE ratio 51.8 % 59.1 % 7.3 pts 58.2 % 60.3 % 2.1 pts Expense ratio 34.3 32.7 (1.6) 34.7 32.9 (1.8) Dividend ratio — — — — — — Combined ratio 86.1 % 91.8 % 5.7 pts 92.9 % 93.2 % 0.3 pts Less: Effect of catastrophe impacts 2.1 0.6 (1.5) 1.8 1.8 — Less: Effect of (favorable) unfavorable development-related items (10.1) — 10.1 (3.4) — 3.4 Underlying combined ratio 94.1 % 91.2 % (2.9) pts 94.5 % 91.4 % (3.1) pts Rate (4) % (6) % 2 pts (5) % (4) % (1) pts Renewal premium change (2) % (3) % 1 pts (2) % (1) % (1) pts Retention 87 % 83 % 4 pts 86 % 85 % 1 pts New business $ 86 $ 94 (9) % $ 268 $ 280 (4) % (1) Other development-related items represent net prior year premium development, the effects of interest accretion on net prior year loss development and the change in allowance for uncollectible reinsurance. 7
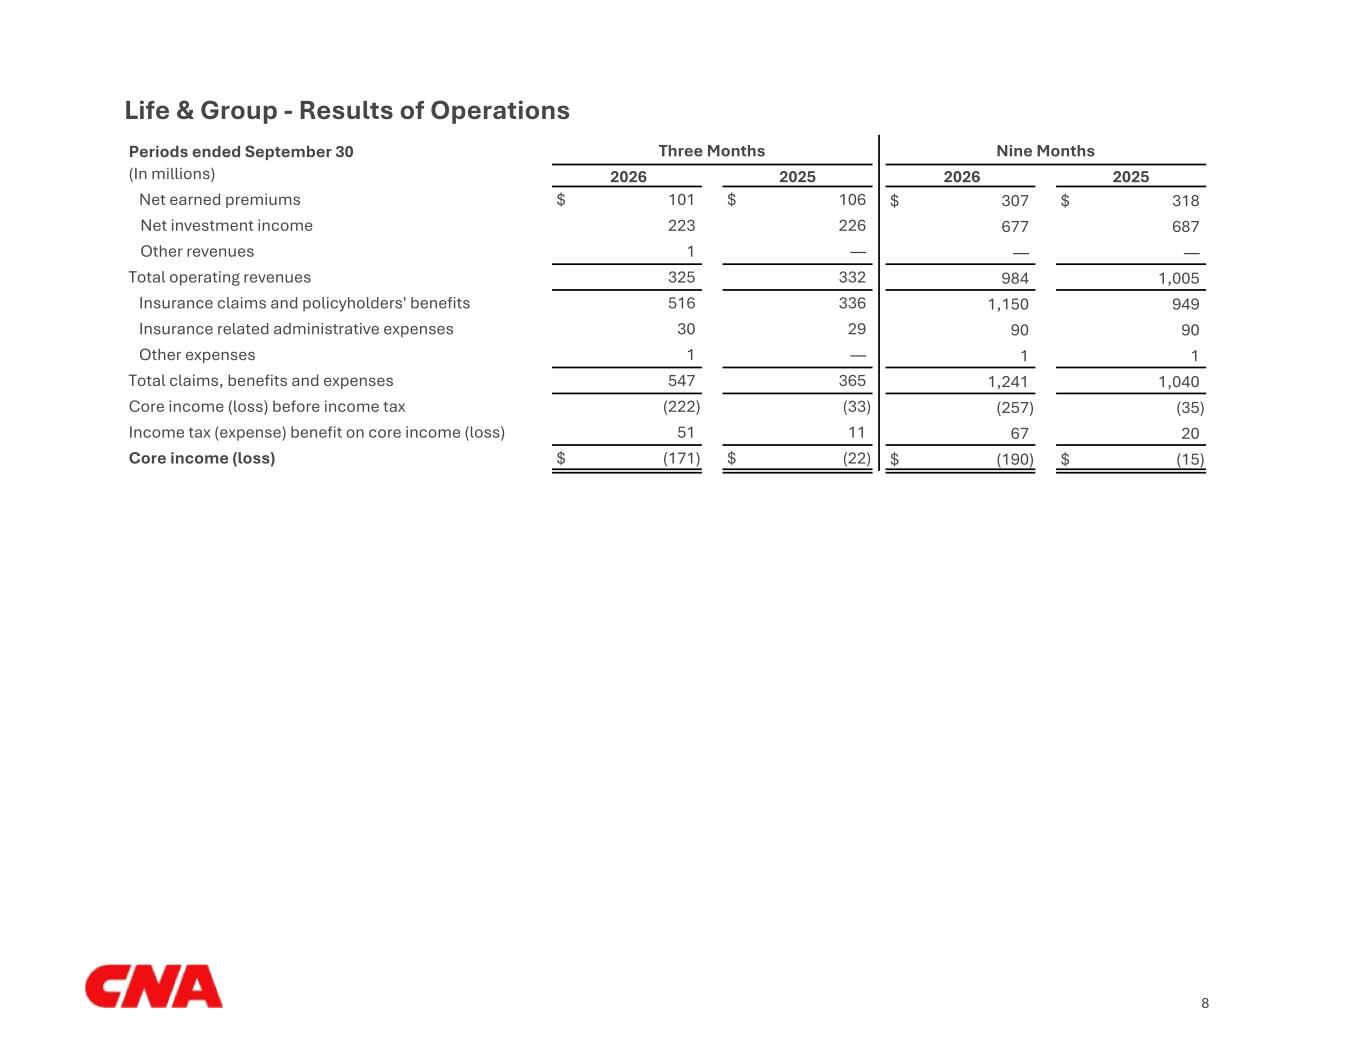
Life & Group - Results of Operations Periods ended September 30 Three Months Nine Months (In millions) 2026 2025 2026 2025 Net earned premiums $ 101 $ 106 $ 307 $ 318 Net investment income 223 226 677 687 Other revenues 1 — — — Total operating revenues 325 332 984 1,005 Insurance claims and policyholders' benefits 516 336 1,150 949 Insurance related administrative expenses 30 29 90 90 Other expenses 1 — 1 1 Total claims, benefits and expenses 547 365 1,241 1,040 Core income (loss) before income tax (222) (33) (257) (35) Income tax (expense) benefit on core income (loss) 51 11 67 20 Core income (loss) $ (171) $ (22) $ (190) $ (15) 8
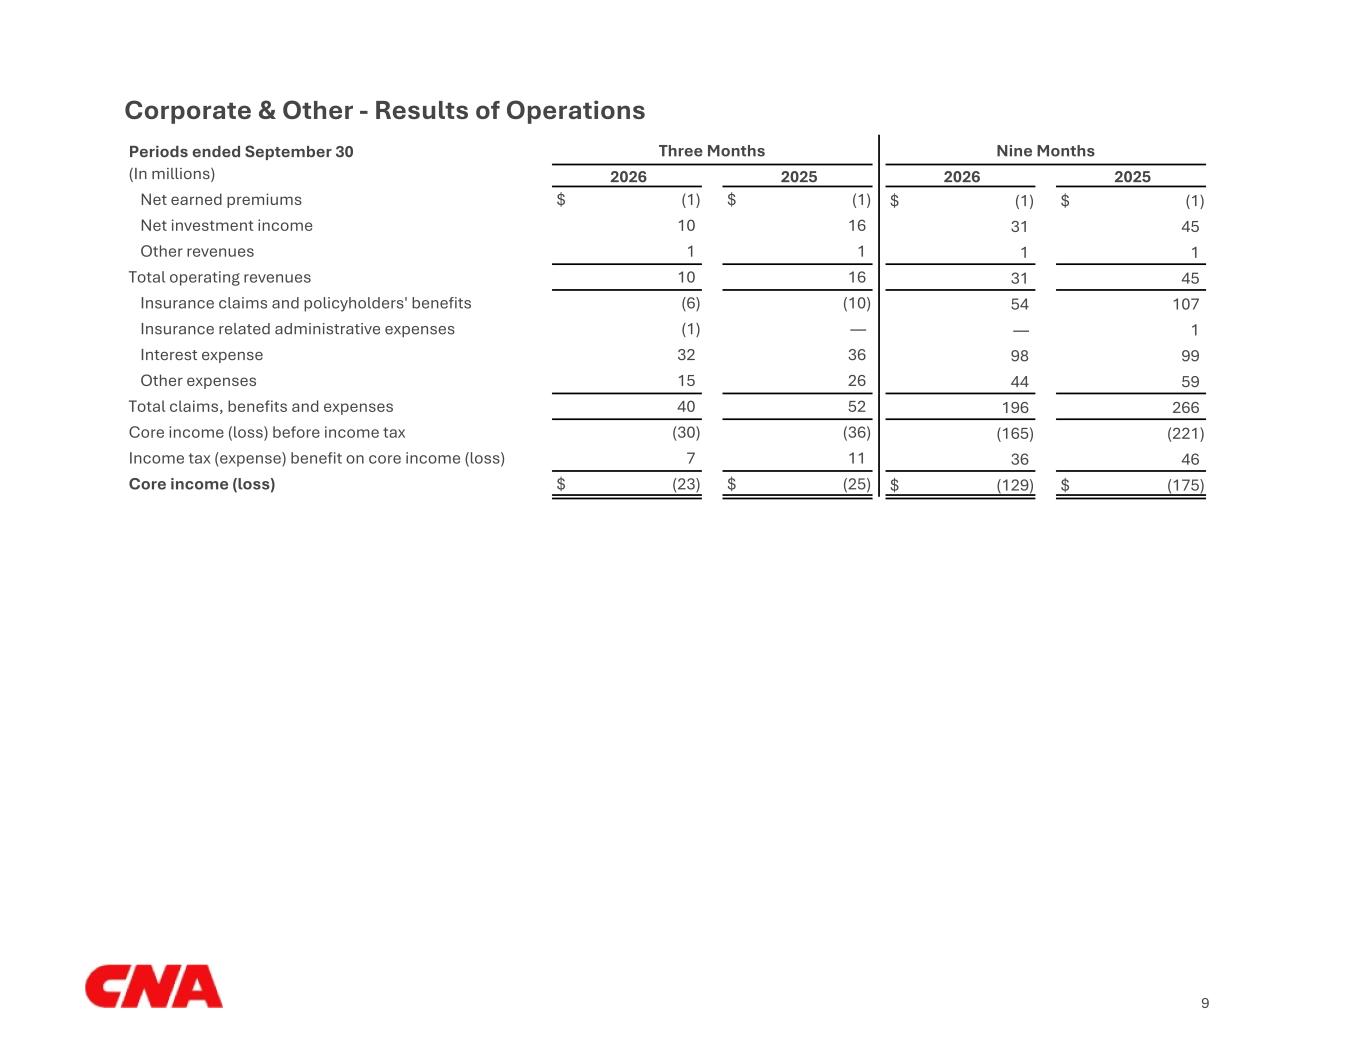
Corporate & Other - Results of Operations Periods ended September 30 Three Months Nine Months (In millions) 2026 2025 2026 2025 Net earned premiums $ (1) $ (1) $ (1) $ (1) Net investment income 10 16 31 45 Other revenues 1 1 1 1 Total operating revenues 10 16 31 45 Insurance claims and policyholders' benefits (6) (10) 54 107 Insurance related administrative expenses (1) — — 1 Interest expense 32 36 98 99 Other expenses 15 26 44 59 Total claims, benefits and expenses 40 52 196 266 Core income (loss) before income tax (30) (36) (165) (221) Income tax (expense) benefit on core income (loss) 7 11 36 46 Core income (loss) $ (23) $ (25) $ (129) $ (175) 9
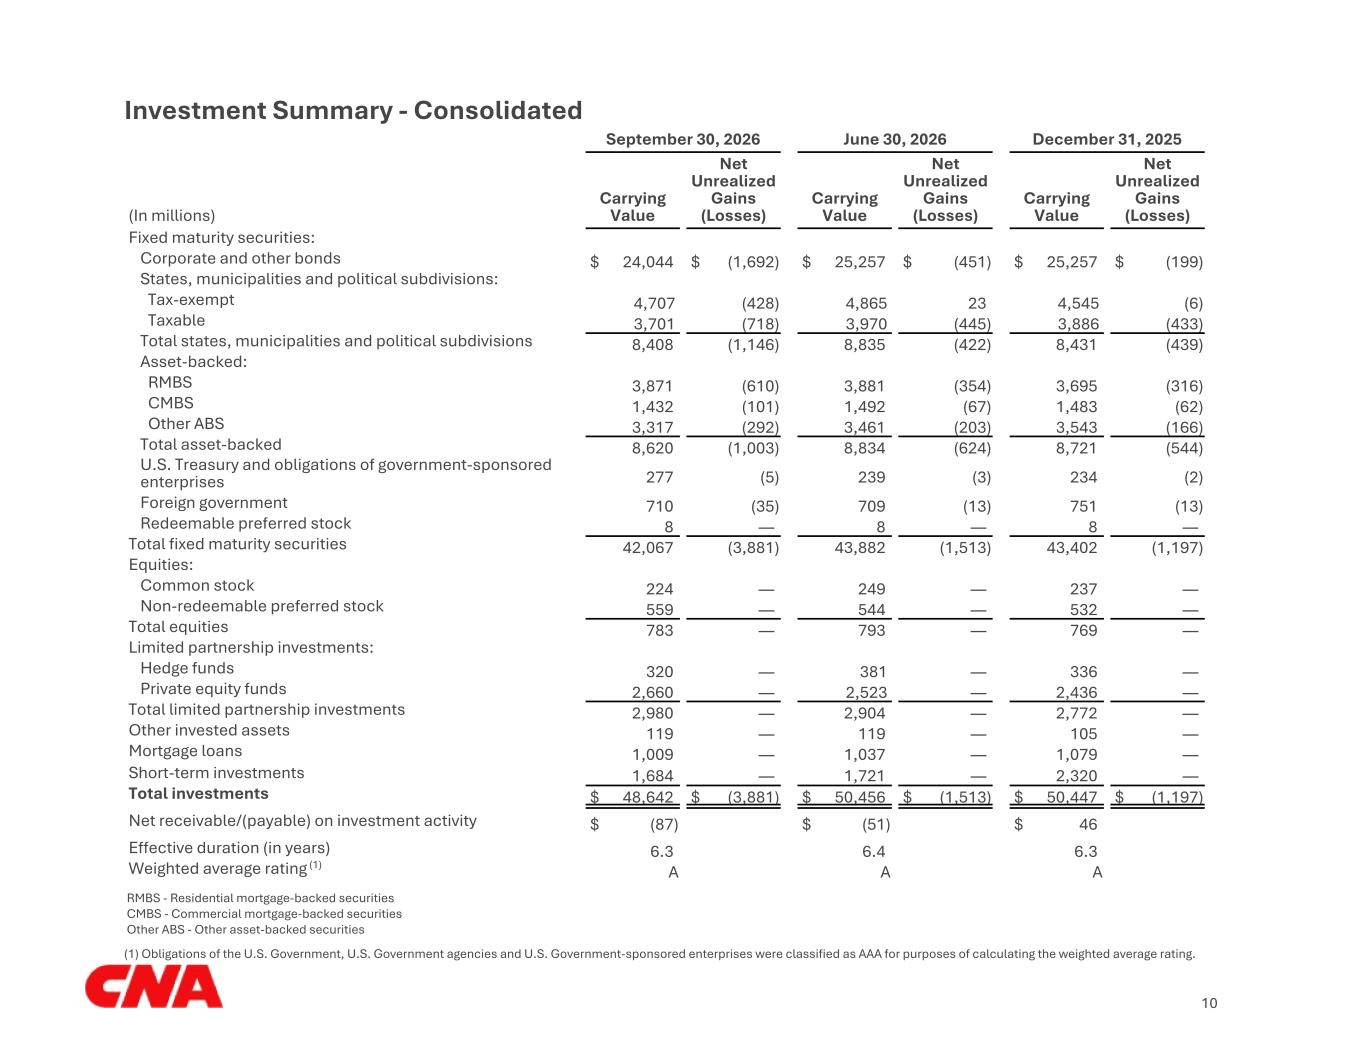
Investment Summary - Consolidated September 30, 2026 June 30, 2026 December 31, 2025 (In millions) Carrying Value Net Unrealized Gains (Losses) Carrying Value Net Unrealized Gains (Losses) Carrying Value Net Unrealized Gains (Losses) Fixed maturity securities: Corporate and other bonds $ 24,044 $ (1,692) $ 25,257 $ (451) $ 25,257 $ (199) States, municipalities and political subdivisions: Tax-exempt 4,707 (428) 4,865 23 4,545 (6) Taxable 3,701 (718) 3,970 (445) 3,886 (433) Total states, municipalities and political subdivisions 8,408 (1,146) 8,835 (422) 8,431 (439) Asset-backed: RMBS 3,871 (610) 3,881 (354) 3,695 (316) CMBS 1,432 (101) 1,492 (67) 1,483 (62) Other ABS 3,317 (292) 3,461 (203) 3,543 (166) Total asset-backed 8,620 (1,003) 8,834 (624) 8,721 (544) U.S. Treasury and obligations of government-sponsored enterprises 277 (5) 239 (3) 234 (2) Foreign government 710 (35) 709 (13) 751 (13) Redeemable preferred stock 8 — 8 — 8 — Total fixed maturity securities 42,067 (3,881) 43,882 (1,513) 43,402 (1,197) Equities: Common stock 224 — 249 — 237 — Non-redeemable preferred stock 559 — 544 — 532 — Total equities 783 — 793 — 769 — Limited partnership investments: Hedge funds 320 — 381 — 336 — Private equity funds 2,660 — 2,523 — 2,436 — Total limited partnership investments 2,980 — 2,904 — 2,772 — Other invested assets 119 — 119 — 105 — Mortgage loans 1,009 — 1,037 — 1,079 — Short-term investments 1,684 — 1,721 — 2,320 — Total investments $ 48,642 $ (3,881) $ 50,456 $ (1,513) $ 50,447 $ (1,197) Net receivable/(payable) on investment activity $ (87) $ (51) $ 46 Effective duration (in years) 6.3 6.4 6.3 Weighted average rating (1) A A A RMBS - Residential mortgage-backed securities CMBS - Commercial mortgage-backed securities Other ABS - Other asset-backed securities (1) Obligations of the U.S. Government, U.S. Government agencies and U.S. Government-sponsored enterprises were classified as AAA for purposes of calculating the weighted average rating. 10
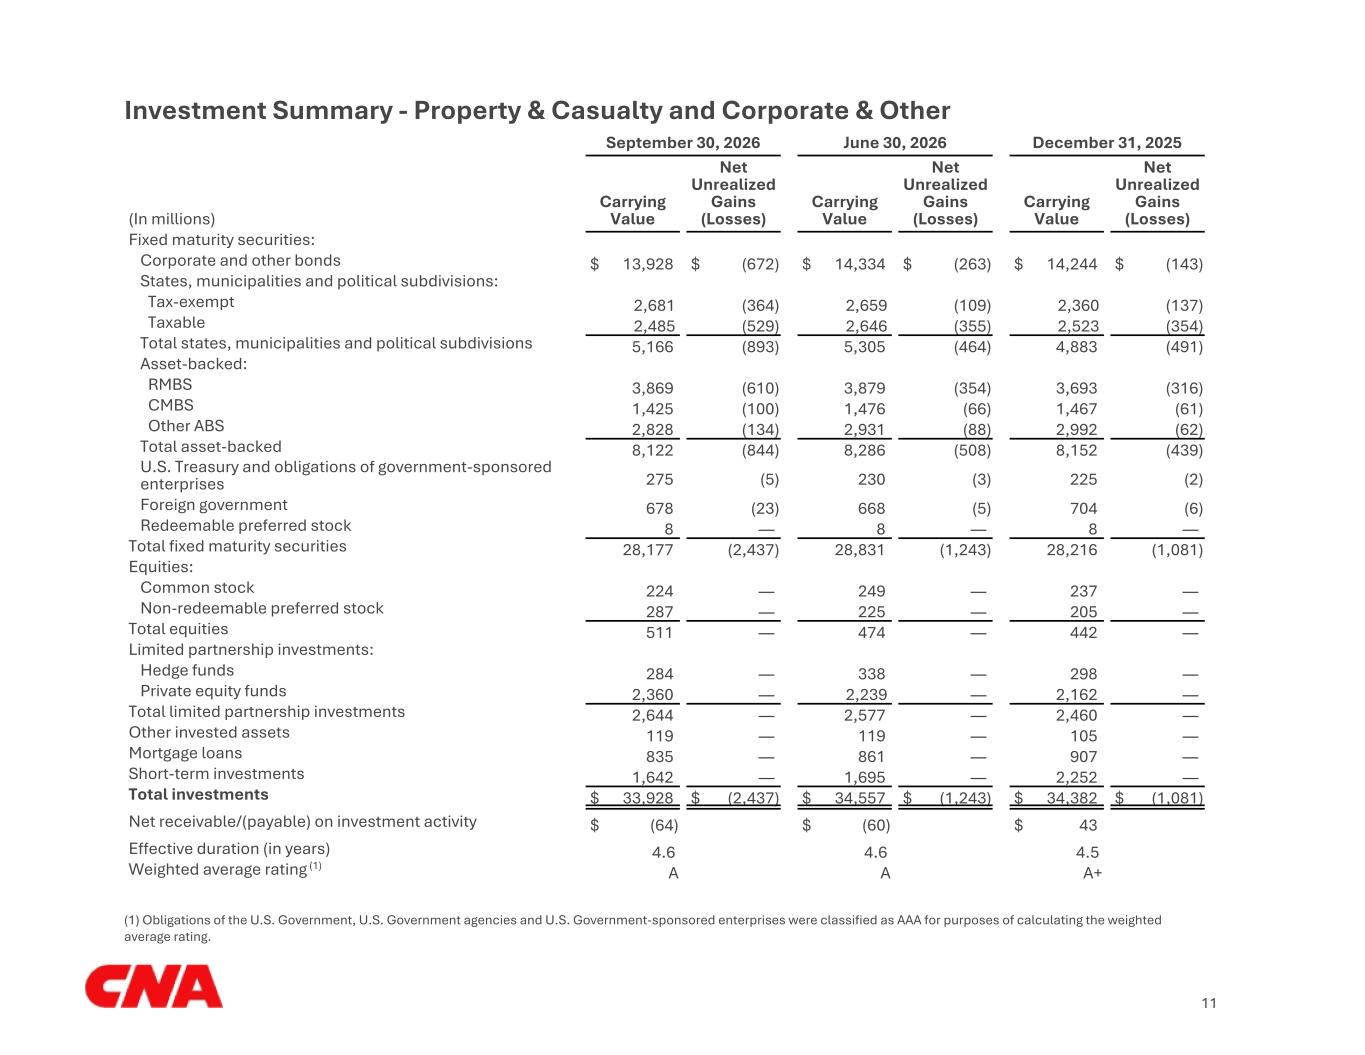
Investment Summary - Property & Casualty and Corporate & Other September 30, 2026 June 30, 2026 December 31, 2025 (In millions) Carrying Value Net Unrealized Gains (Losses) Carrying Value Net Unrealized Gains (Losses) Carrying Value Net Unrealized Gains (Losses) Fixed maturity securities: Corporate and other bonds $ 13,928 $ (672) $ 14,334 $ (263) $ 14,244 $ (143) States, municipalities and political subdivisions: Tax-exempt 2,681 (364) 2,659 (109) 2,360 (137) Taxable 2,485 (529) 2,646 (355) 2,523 (354) Total states, municipalities and political subdivisions 5,166 (893) 5,305 (464) 4,883 (491) Asset-backed: RMBS 3,869 (610) 3,879 (354) 3,693 (316) CMBS 1,425 (100) 1,476 (66) 1,467 (61) Other ABS 2,828 (134) 2,931 (88) 2,992 (62) Total asset-backed 8,122 (844) 8,286 (508) 8,152 (439) U.S. Treasury and obligations of government-sponsored enterprises 275 (5) 230 (3) 225 (2) Foreign government 678 (23) 668 (5) 704 (6) Redeemable preferred stock 8 — 8 — 8 — Total fixed maturity securities 28,177 (2,437) 28,831 (1,243) 28,216 (1,081) Equities: Common stock 224 — 249 — 237 — Non-redeemable preferred stock 287 — 225 — 205 — Total equities 511 — 474 — 442 — Limited partnership investments: Hedge funds 284 — 338 — 298 — Private equity funds 2,360 — 2,239 — 2,162 — Total limited partnership investments 2,644 — 2,577 — 2,460 — Other invested assets 119 — 119 — 105 — Mortgage loans 835 — 861 — 907 — Short-term investments 1,642 — 1,695 — 2,252 — Total investments $ 33,928 $ (2,437) $ 34,557 $ (1,243) $ 34,382 $ (1,081) Net receivable/(payable) on investment activity $ (64) $ (60) $ 43 Effective duration (in years) 4.6 4.6 4.5 Weighted average rating (1) A A A+ (1) Obligations of the U.S. Government, U.S. Government agencies and U.S. Government-sponsored enterprises were classified as AAA for purposes of calculating the weighted average rating. 11
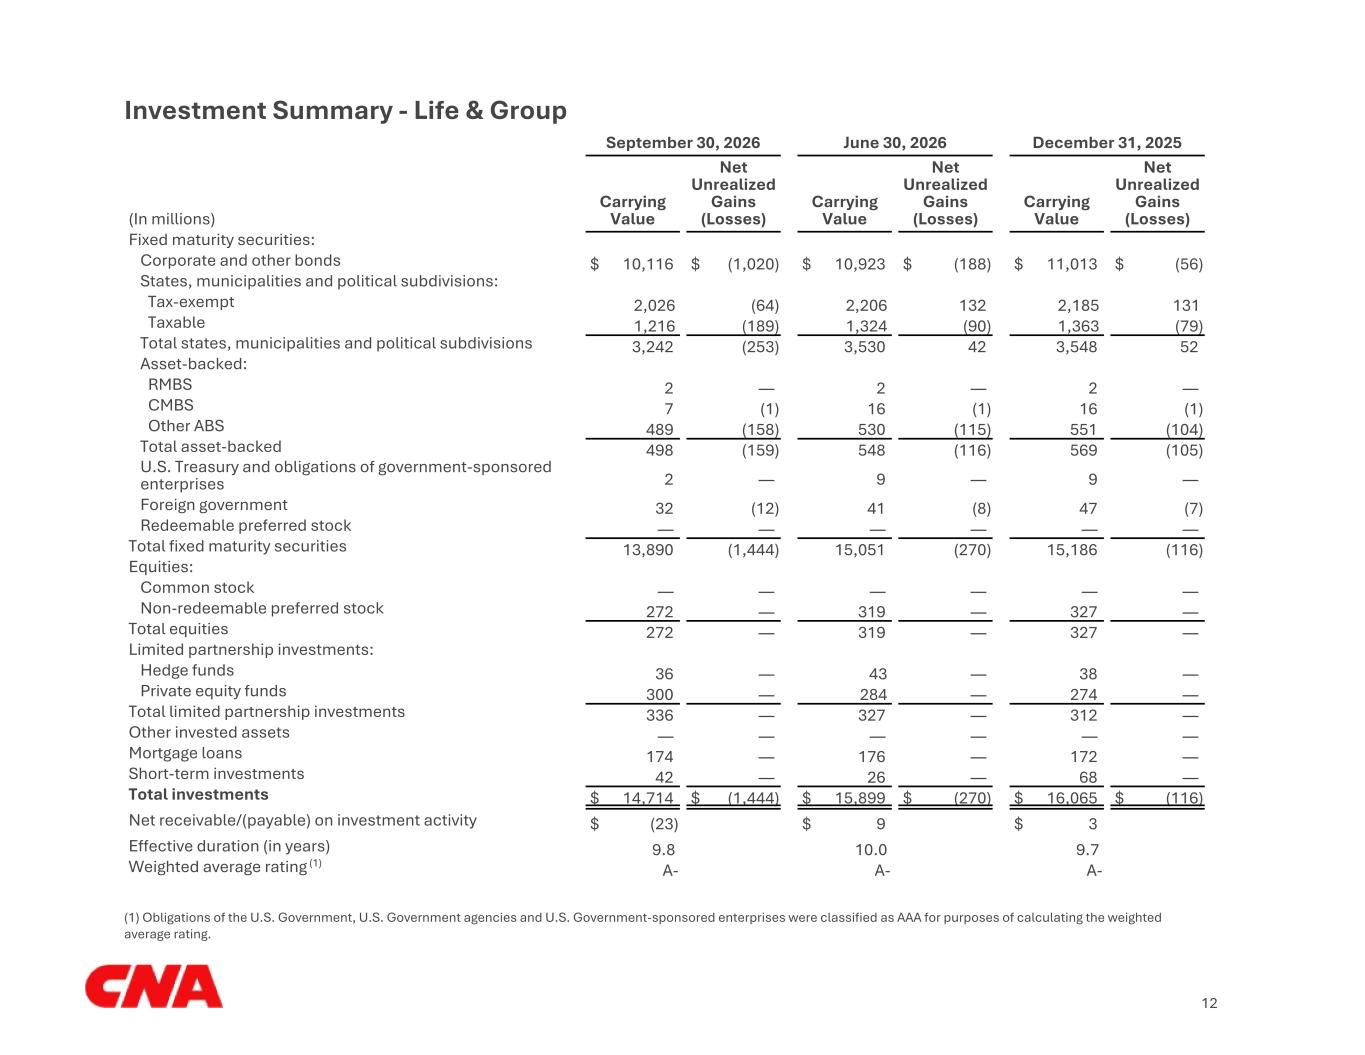
Investment Summary - Life & Group September 30, 2026 June 30, 2026 December 31, 2025 (In millions) Carrying Value Net Unrealized Gains (Losses) Carrying Value Net Unrealized Gains (Losses) Carrying Value Net Unrealized Gains (Losses) Fixed maturity securities: Corporate and other bonds $ 10,116 $ (1,020) $ 10,923 $ (188) $ 11,013 $ (56) States, municipalities and political subdivisions: Tax-exempt 2,026 (64) 2,206 132 2,185 131 Taxable 1,216 (189) 1,324 (90) 1,363 (79) Total states, municipalities and political subdivisions 3,242 (253) 3,530 42 3,548 52 Asset-backed: RMBS 2 — 2 — 2 — CMBS 7 (1) 16 (1) 16 (1) Other ABS 489 (158) 530 (115) 551 (104) Total asset-backed 498 (159) 548 (116) 569 (105) U.S. Treasury and obligations of government-sponsored enterprises 2 — 9 — 9 — Foreign government 32 (12) 41 (8) 47 (7) Redeemable preferred stock — — — — — — Total fixed maturity securities 13,890 (1,444) 15,051 (270) 15,186 (116) Equities: Common stock — — — — — — Non-redeemable preferred stock 272 — 319 — 327 — Total equities 272 — 319 — 327 — Limited partnership investments: Hedge funds 36 — 43 — 38 — Private equity funds 300 — 284 — 274 — Total limited partnership investments 336 — 327 — 312 — Other invested assets — — — — — — Mortgage loans 174 — 176 — 172 — Short-term investments 42 — 26 — 68 — Total investments $ 14,714 $ (1,444) $ 15,899 $ (270) $ 16,065 $ (116) Net receivable/(payable) on investment activity $ (23) $ 9 $ 3 Effective duration (in years) 9.8 10.0 9.7 Weighted average rating (1) A- A- A- (1) Obligations of the U.S. Government, U.S. Government agencies and U.S. Government-sponsored enterprises were classified as AAA for purposes of calculating the weighted average rating. 12
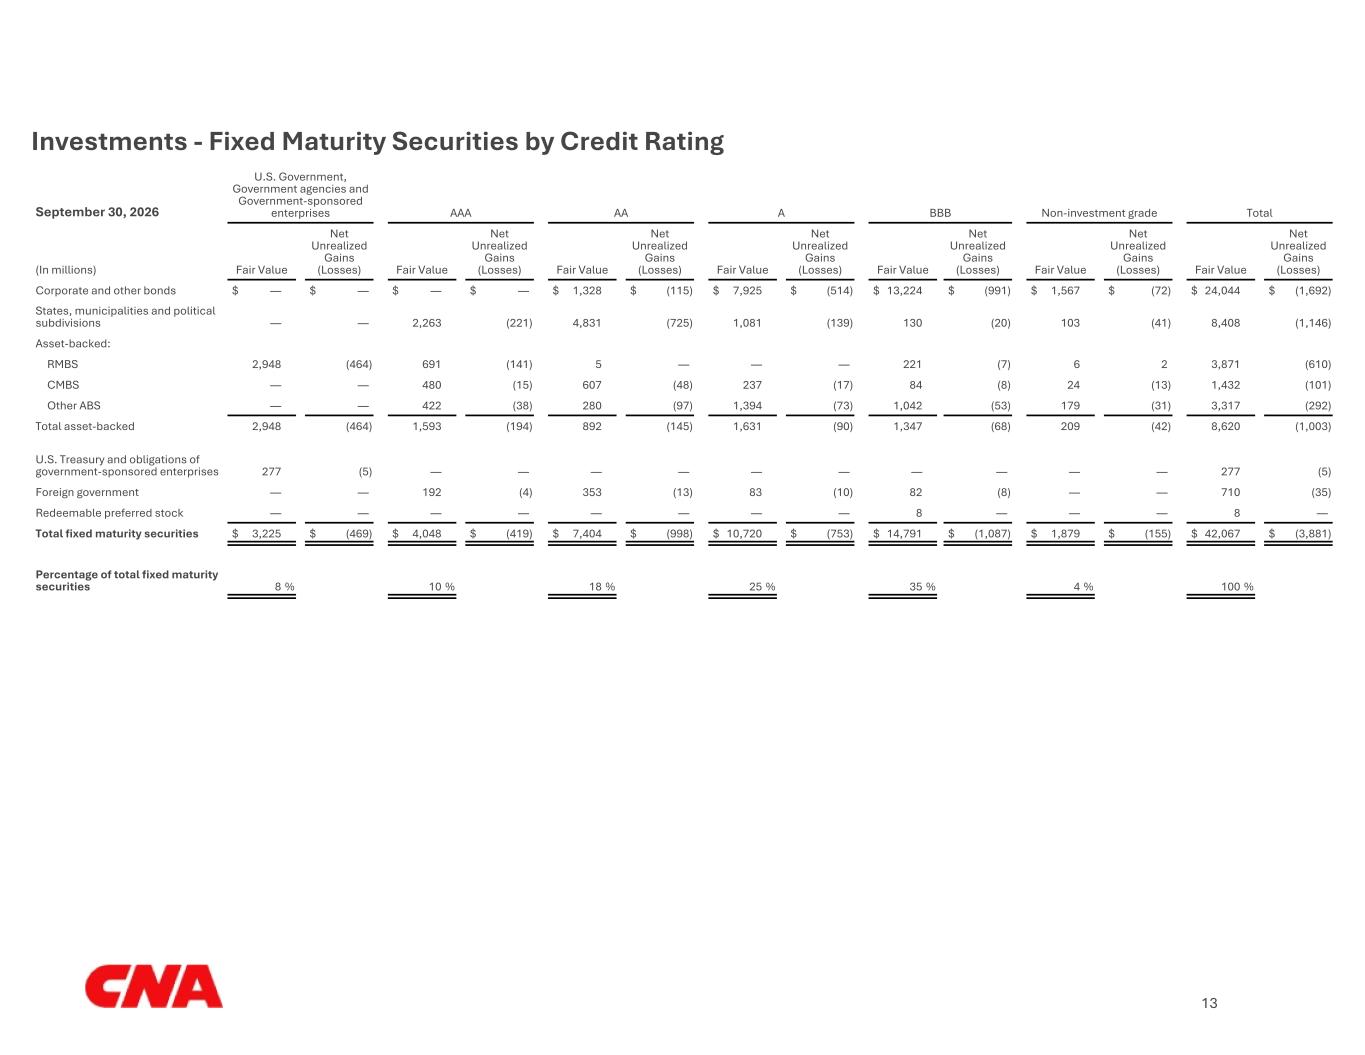
Investments - Fixed Maturity Securities by Credit Rating September 30, 2026 U.S. Government, Government agencies and Government-sponsored enterprises AAA AA A BBB Non-investment grade Total (In millions) Fair Value Net Unrealized Gains (Losses) Fair Value Net Unrealized Gains (Losses) Fair Value Net Unrealized Gains (Losses) Fair Value Net Unrealized Gains (Losses) Fair Value Net Unrealized Gains (Losses) Fair Value Net Unrealized Gains (Losses) Fair Value Net Unrealized Gains (Losses) Corporate and other bonds $ — $ — $ — $ — $ 1,328 $ (115) $ 7,925 $ (514) $ 13,224 $ (991) $ 1,567 $ (72) $ 24,044 $ (1,692) States, municipalities and political subdivisions — — 2,263 (221) 4,831 (725) 1,081 (139) 130 (20) 103 (41) 8,408 (1,146) Asset-backed: RMBS 2,948 (464) 691 (141) 5 — — — 221 (7) 6 2 3,871 (610) CMBS — — 480 (15) 607 (48) 237 (17) 84 (8) 24 (13) 1,432 (101) Other ABS — — 422 (38) 280 (97) 1,394 (73) 1,042 (53) 179 (31) 3,317 (292) Total asset-backed 2,948 (464) 1,593 (194) 892 (145) 1,631 (90) 1,347 (68) 209 (42) 8,620 (1,003) U.S. Treasury and obligations of government-sponsored enterprises 277 (5) — — — — — — — — — — 277 (5) Foreign government — — 192 (4) 353 (13) 83 (10) 82 (8) — — 710 (35) Redeemable preferred stock — — — — — — — — 8 — — — 8 — Total fixed maturity securities $ 3,225 $ (469) $ 4,048 $ (419) $ 7,404 $ (998) $ 10,720 $ (753) $ 14,791 $ (1,087) $ 1,879 $ (155) $ 42,067 $ (3,881) Percentage of total fixed maturity securities 8 % 10 % 18 % 25 % 35 % 4 % 100 % 13
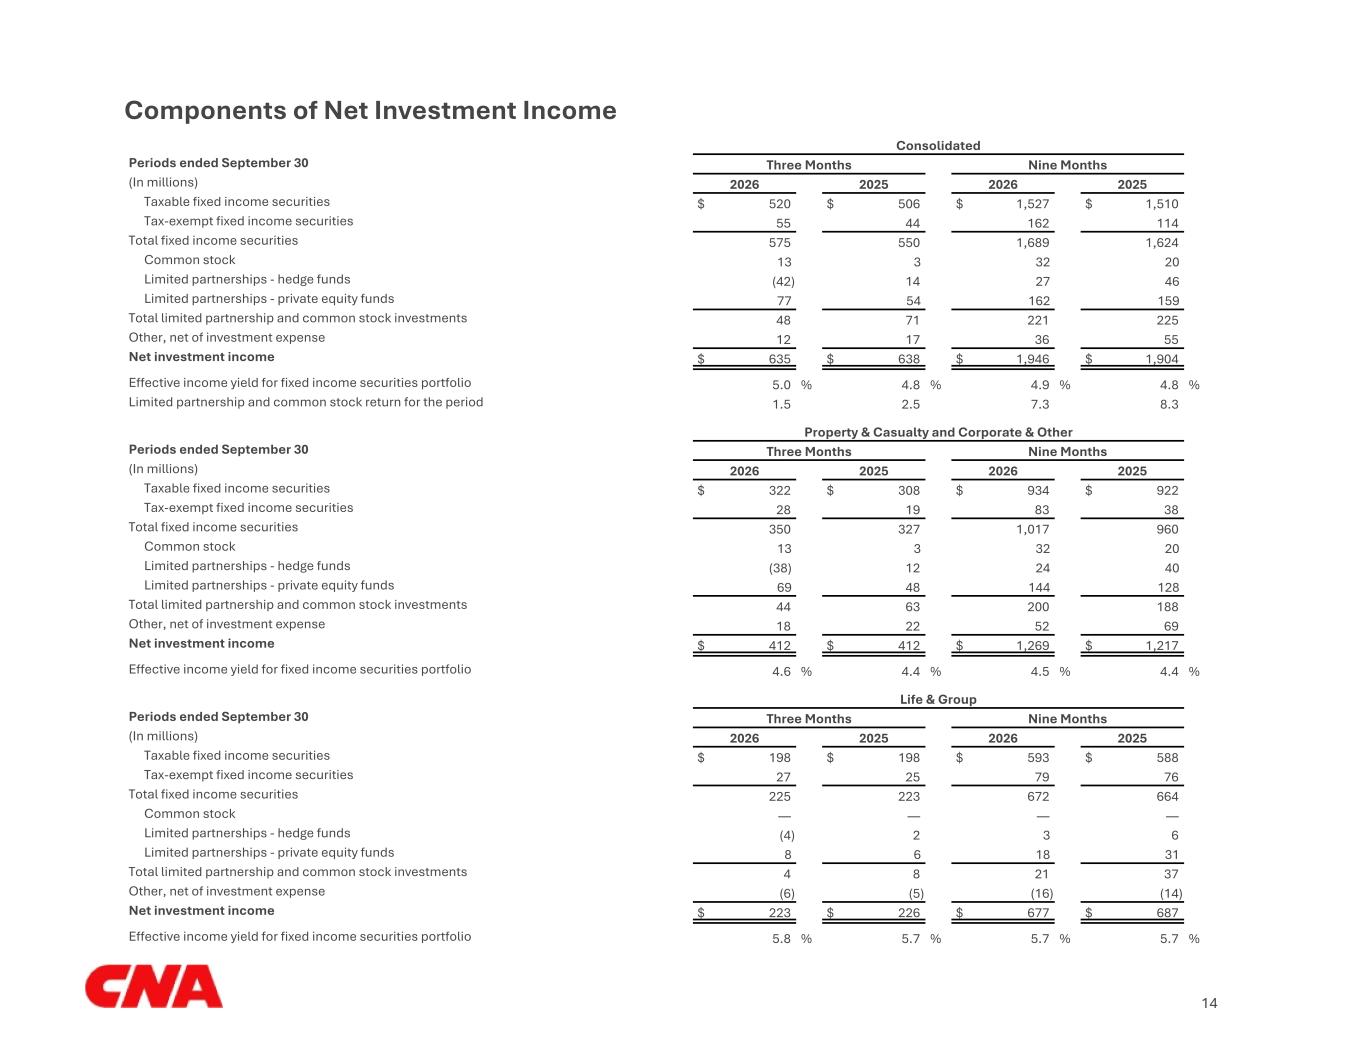
Components of Net Investment Income Consolidated Periods ended September 30 Three Months Nine Months (In millions) 2026 2025 2026 2025 Taxable fixed income securities $ 520 $ 506 $ 1,527 $ 1,510 Tax-exempt fixed income securities 55 44 162 114 Total fixed income securities 575 550 1,689 1,624 Common stock 13 3 32 20 Limited partnerships - hedge funds (42) 14 27 46 Limited partnerships - private equity funds 77 54 162 159 Total limited partnership and common stock investments 48 71 221 225 Other, net of investment expense 12 17 36 55 Net investment income $ 635 $ 638 $ 1,946 $ 1,904 Effective income yield for fixed income securities portfolio 5.0 % 4.8 % 4.9 % 4.8 % Limited partnership and common stock return for the period 1.5 2.5 7.3 8.3 Property & Casualty and Corporate & Other Periods ended September 30 Three Months Nine Months (In millions) 2026 2025 2026 2025 Taxable fixed income securities $ 322 $ 308 $ 934 $ 922 Tax-exempt fixed income securities 28 19 83 38 Total fixed income securities 350 327 1,017 960 Common stock 13 3 32 20 Limited partnerships - hedge funds (38) 12 24 40 Limited partnerships - private equity funds 69 48 144 128 Total limited partnership and common stock investments 44 63 200 188 Other, net of investment expense 18 22 52 69 Net investment income $ 412 $ 412 $ 1,269 $ 1,217 Effective income yield for fixed income securities portfolio 4.6 % 4.4 % 4.5 % 4.4 % Life & Group Periods ended September 30 Three Months Nine Months (In millions) 2026 2025 2026 2025 Taxable fixed income securities $ 198 $ 198 $ 593 $ 588 Tax-exempt fixed income securities 27 25 79 76 Total fixed income securities 225 223 672 664 Common stock — — — — Limited partnerships - hedge funds (4) 2 3 6 Limited partnerships - private equity funds 8 6 18 31 Total limited partnership and common stock investments 4 8 21 37 Other, net of investment expense (6) (5) (16) (14) Net investment income $ 223 $ 226 $ 677 $ 687 Effective income yield for fixed income securities portfolio 5.8 % 5.7 % 5.7 % 5.7 % 14
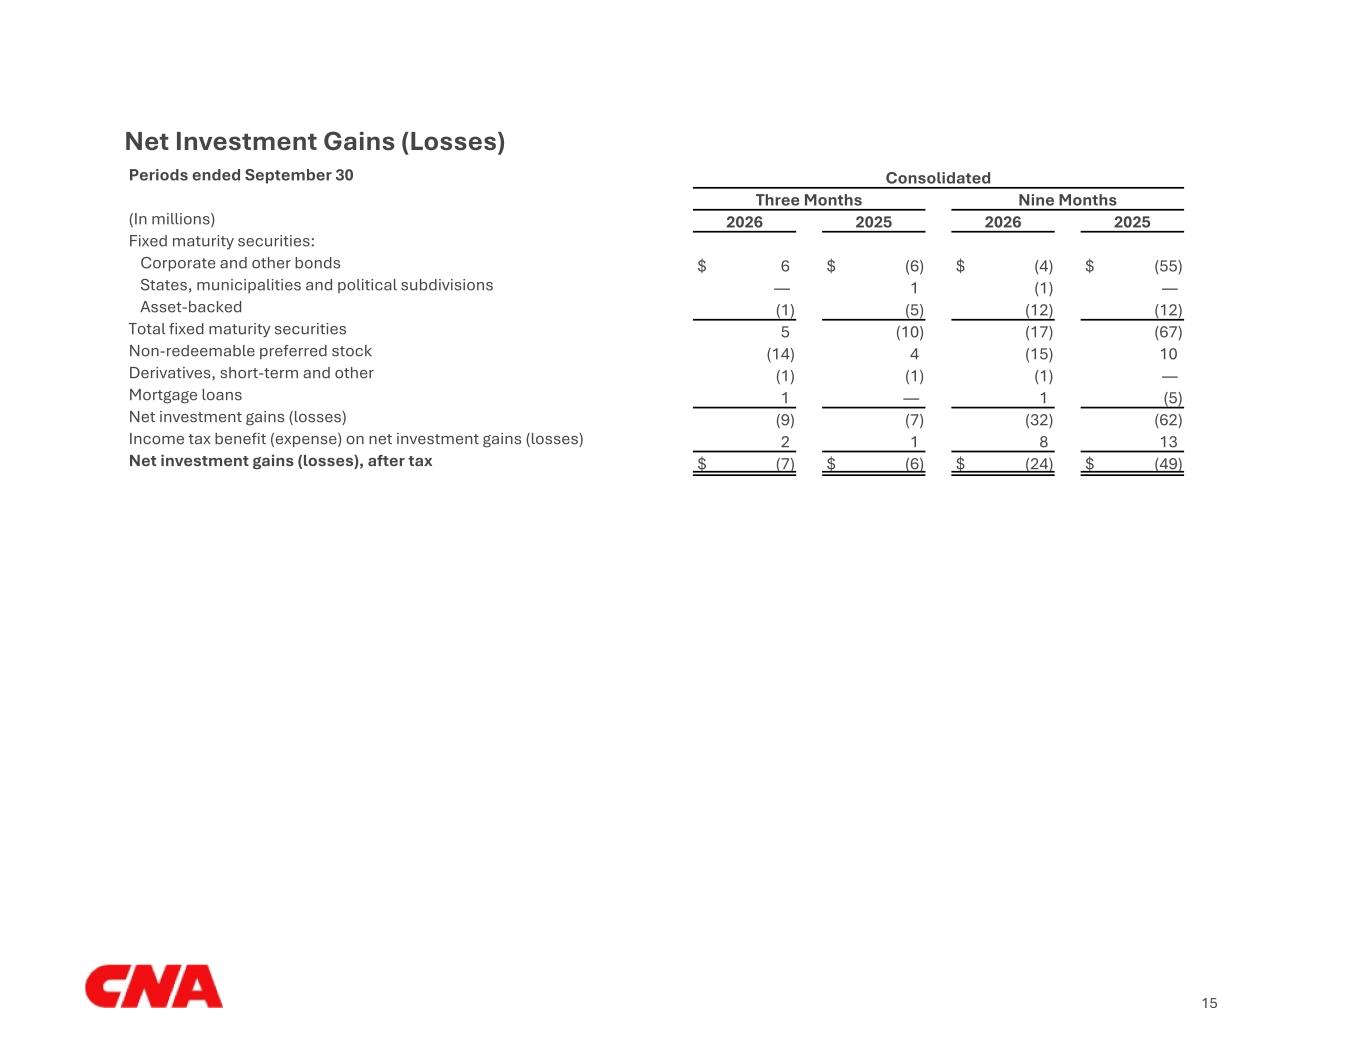
Net Investment Gains (Losses) Periods ended September 30 Consolidated Three Months Nine Months (In millions) 2026 2025 2026 2025 Fixed maturity securities: Corporate and other bonds $ 6 $ (6) $ (4) $ (55) States, municipalities and political subdivisions — 1 (1) — Asset-backed (1) (5) (12) (12) Total fixed maturity securities 5 (10) (17) (67) Non-redeemable preferred stock (14) 4 (15) 10 Derivatives, short-term and other (1) (1) (1) — Mortgage loans 1 — 1 (5) Net investment gains (losses) (9) (7) (32) (62) Income tax benefit (expense) on net investment gains (losses) 2 1 8 13 Net investment gains (losses), after tax $ (7) $ (6) $ (24) $ (49) 15
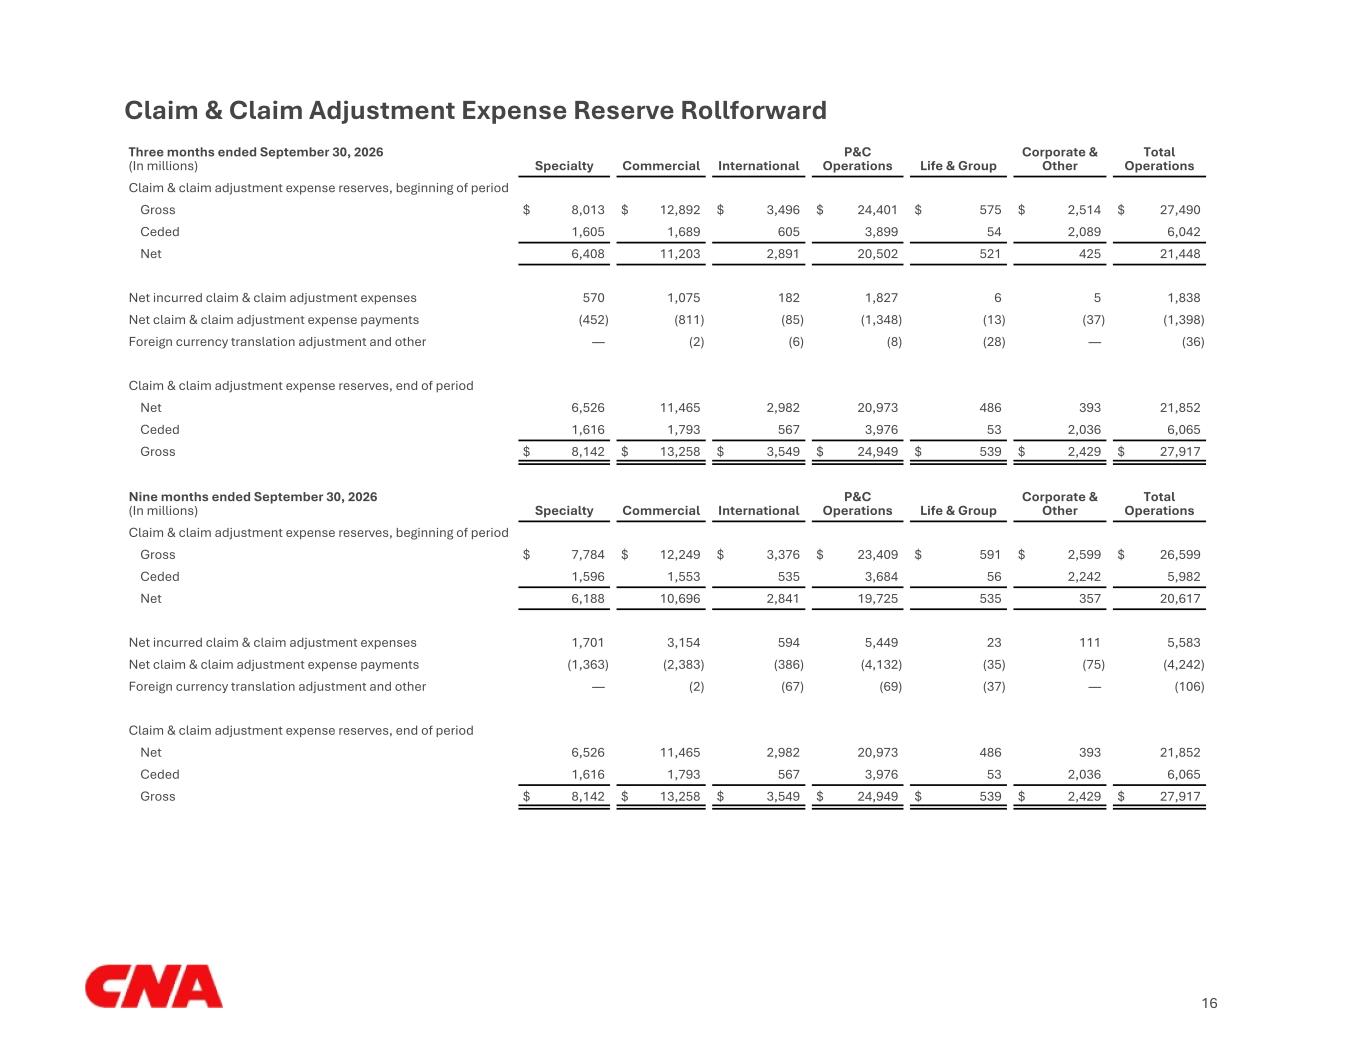
Claim & Claim Adjustment Expense Reserve Rollforward Three months ended September 30, 2026 (In millions) Specialty Commercial International P&C Operations Life & Group Corporate & Other Total Operations Claim & claim adjustment expense reserves, beginning of period Gross $ 8,013 $ 12,892 $ 3,496 $ 24,401 $ 575 $ 2,514 $ 27,490 Ceded 1,605 1,689 605 3,899 54 2,089 6,042 Net 6,408 11,203 2,891 20,502 521 425 21,448 Net incurred claim & claim adjustment expenses 570 1,075 182 1,827 6 5 1,838 Net claim & claim adjustment expense payments (452) (811) (85) (1,348) (13) (37) (1,398) Foreign currency translation adjustment and other — (2) (6) (8) (28) — (36) Claim & claim adjustment expense reserves, end of period Net 6,526 11,465 2,982 20,973 486 393 21,852 Ceded 1,616 1,793 567 3,976 53 2,036 6,065 Gross $ 8,142 $ 13,258 $ 3,549 $ 24,949 $ 539 $ 2,429 $ 27,917 Nine months ended September 30, 2026 (In millions) Specialty Commercial International P&C Operations Life & Group Corporate & Other Total Operations Claim & claim adjustment expense reserves, beginning of period Gross $ 7,784 $ 12,249 $ 3,376 $ 23,409 $ 591 $ 2,599 $ 26,599 Ceded 1,596 1,553 535 3,684 56 2,242 5,982 Net 6,188 10,696 2,841 19,725 535 357 20,617 Net incurred claim & claim adjustment expenses 1,701 3,154 594 5,449 23 111 5,583 Net claim & claim adjustment expense payments (1,363) (2,383) (386) (4,132) (35) (75) (4,242) Foreign currency translation adjustment and other — (2) (67) (69) (37) — (106) Claim & claim adjustment expense reserves, end of period Net 6,526 11,465 2,982 20,973 486 393 21,852 Ceded 1,616 1,793 567 3,976 53 2,036 6,065 Gross $ 8,142 $ 13,258 $ 3,549 $ 24,949 $ 539 $ 2,429 $ 27,917 16
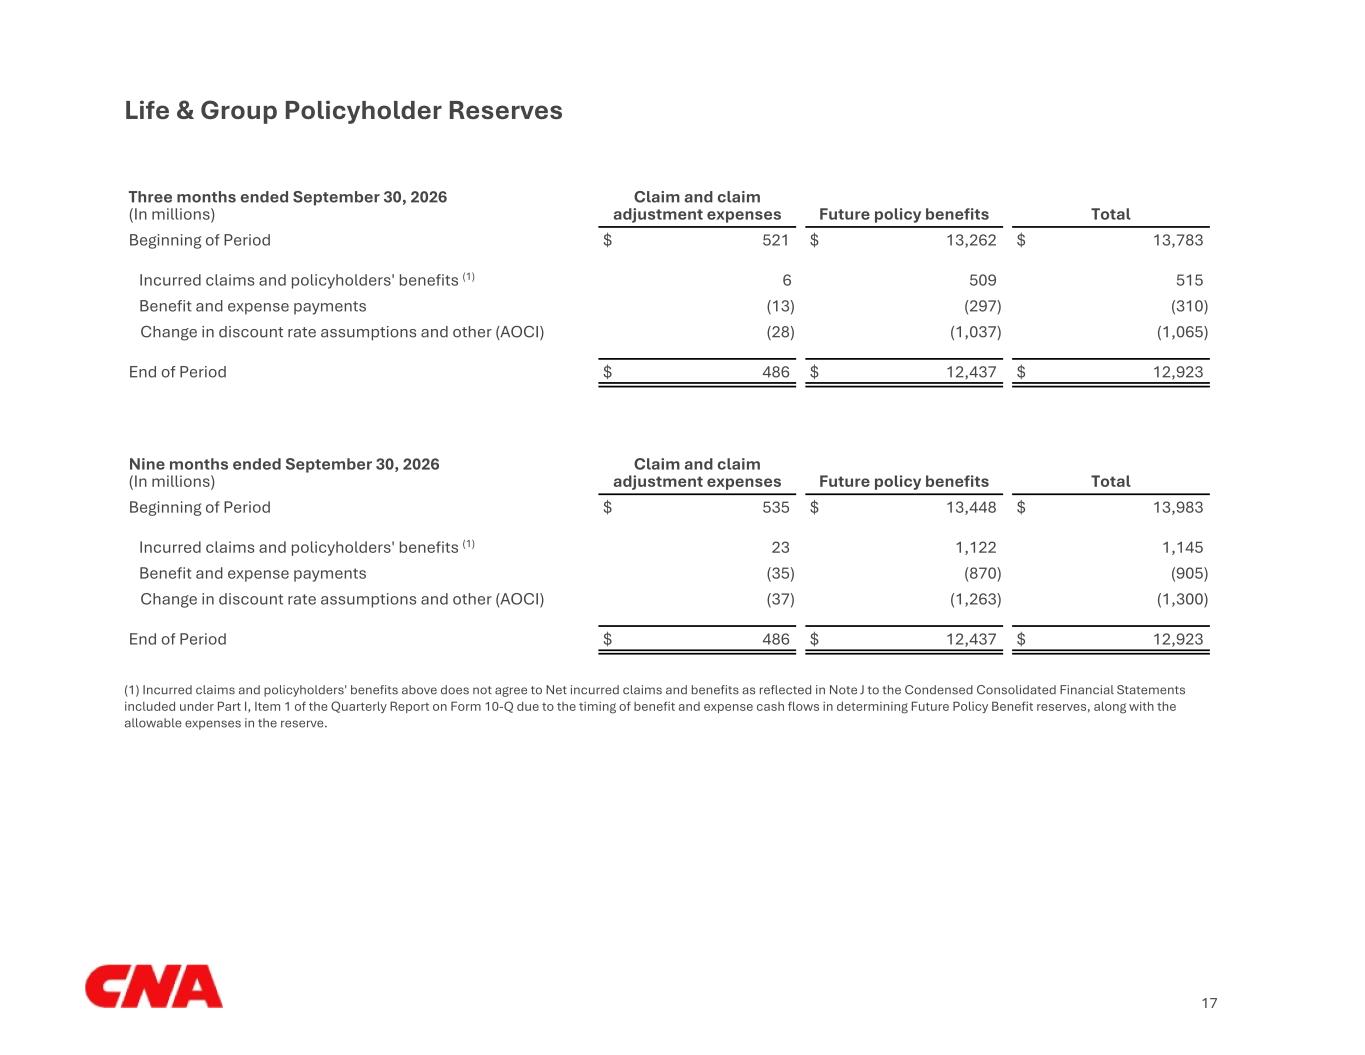
Life & Group Policyholder Reserves Three months ended September 30, 2026 (In millions) Claim and claim adjustment expenses Future policy benefits Total Beginning of Period $ 521 $ 13,262 $ 13,783 Incurred claims and policyholders' benefits (1) 6 509 515 Benefit and expense payments (13) (297) (310) Change in discount rate assumptions and other (AOCI) (28) (1,037) (1,065) End of Period $ 486 $ 12,437 $ 12,923 Nine months ended September 30, 2026 (In millions) Claim and claim adjustment expenses Future policy benefits Total Beginning of Period $ 535 $ 13,448 $ 13,983 Incurred claims and policyholders' benefits (1) 23 1,122 1,145 Benefit and expense payments (35) (870) (905) Change in discount rate assumptions and other (AOCI) (37) (1,263) (1,300) End of Period $ 486 $ 12,437 $ 12,923 (1) Incurred claims and policyholders' benefits above does not agree to Net incurred claims and benefits as reflected in Note J to the Condensed Consolidated Financial Statements included under Part I, Item 1 of the Quarterly Report on Form 10-Q due to the timing of benefit and expense cash flows in determining Future Policy Benefit reserves, along with the allowable expenses in the reserve. 17
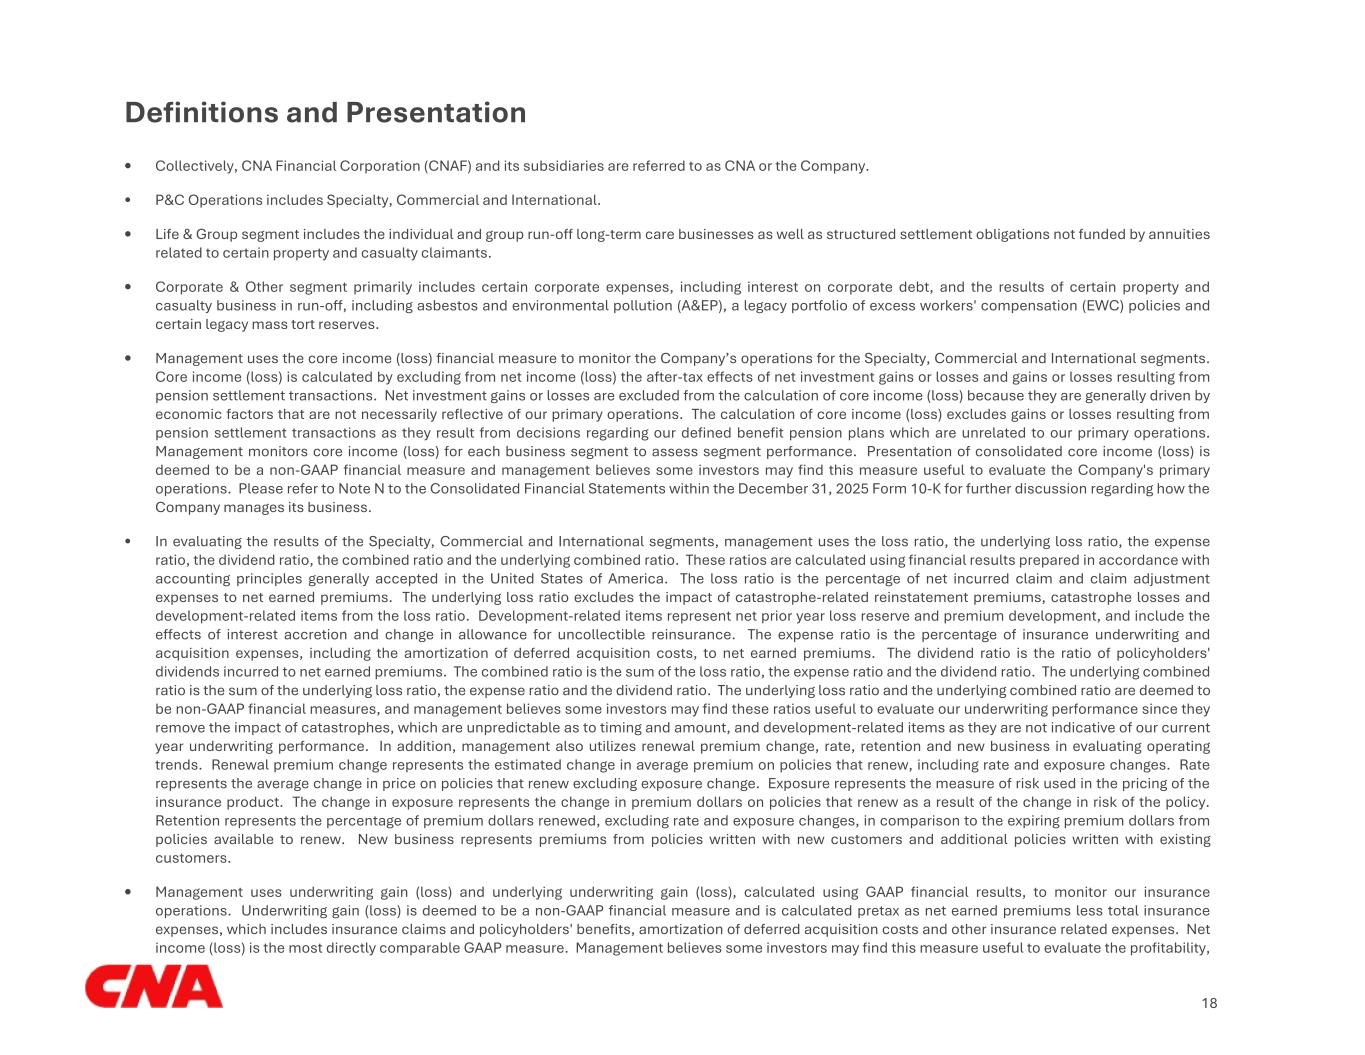
Definitions and Presentation • Collectively, CNA Financial Corporation (CNAF) and its subsidiaries are referred to as CNA or the Company. • P&C Operations includes Specialty, Commercial and International. • Life & Group segment includes the individual and group run-off long-term care businesses as well as structured settlement obligations not funded by annuities related to certain property and casualty claimants. • Corporate & Other segment primarily includes certain corporate expenses, including interest on corporate debt, and the results of certain property and casualty business in run-off, including asbestos and environmental pollution (A&EP), a legacy portfolio of excess workers' compensation (EWC) policies and certain legacy mass tort reserves. • Management uses the core income (loss) financial measure to monitor the Company’s operations for the Specialty, Commercial and International segments. Core income (loss) is calculated by excluding from net income (loss) the after-tax effects of net investment gains or losses and gains or losses resulting from pension settlement transactions. Net investment gains or losses are excluded from the calculation of core income (loss) because they are generally driven by economic factors that are not necessarily reflective of our primary operations. The calculation of core income (loss) excludes gains or losses resulting from pension settlement transactions as they result from decisions regarding our defined benefit pension plans which are unrelated to our primary operations. Management monitors core income (loss) for each business segment to assess segment performance. Presentation of consolidated core income (loss) is deemed to be a non-GAAP financial measure and management believes some investors may find this measure useful to evaluate the Company's primary operations. Please refer to Note N to the Consolidated Financial Statements within the December 31, 2025 Form 10-K for further discussion regarding how the Company manages its business. • In evaluating the results of the Specialty, Commercial and International segments, management uses the loss ratio, the underlying loss ratio, the expense ratio, the dividend ratio, the combined ratio and the underlying combined ratio. These ratios are calculated using financial results prepared in accordance with accounting principles generally accepted in the United States of America. The loss ratio is the percentage of net incurred claim and claim adjustment expenses to net earned premiums. The underlying loss ratio excludes the impact of catastrophe-related reinstatement premiums, catastrophe losses and development-related items from the loss ratio. Development-related items represent net prior year loss reserve and premium development, and include the effects of interest accretion and change in allowance for uncollectible reinsurance. The expense ratio is the percentage of insurance underwriting and acquisition expenses, including the amortization of deferred acquisition costs, to net earned premiums. The dividend ratio is the ratio of policyholders' dividends incurred to net earned premiums. The combined ratio is the sum of the loss ratio, the expense ratio and the dividend ratio. The underlying combined ratio is the sum of the underlying loss ratio, the expense ratio and the dividend ratio. The underlying loss ratio and the underlying combined ratio are deemed to be non-GAAP financial measures, and management believes some investors may find these ratios useful to evaluate our underwriting performance since they remove the impact of catastrophes, which are unpredictable as to timing and amount, and development-related items as they are not indicative of our current year underwriting performance. In addition, management also utilizes renewal premium change, rate, retention and new business in evaluating operating trends. Renewal premium change represents the estimated change in average premium on policies that renew, including rate and exposure changes. Rate represents the average change in price on policies that renew excluding exposure change. Exposure represents the measure of risk used in the pricing of the insurance product. The change in exposure represents the change in premium dollars on policies that renew as a result of the change in risk of the policy. Retention represents the percentage of premium dollars renewed, excluding rate and exposure changes, in comparison to the expiring premium dollars from policies available to renew. New business represents premiums from policies written with new customers and additional policies written with existing customers. • Management uses underwriting gain (loss) and underlying underwriting gain (loss), calculated using GAAP financial results, to monitor our insurance operations. Underwriting gain (loss) is deemed to be a non-GAAP financial measure and is calculated pretax as net earned premiums less total insurance expenses, which includes insurance claims and policyholders' benefits, amortization of deferred acquisition costs and other insurance related expenses. Net income (loss) is the most directly comparable GAAP measure. Management believes some investors may find this measure useful to evaluate the profitability, 18
before tax, derived from our underwriting activities, which are managed separately from our investing activities. Underlying underwriting gain (loss) is also deemed to be a non-GAAP financial measure, and represents pretax underwriting gain (loss) excluding catastrophe-related reinstatement premiums, catastrophe losses and development-related items. Management believes some investors may find this measure useful to evaluate the profitability, before tax, derived from our underwriting activities, excluding the impact of catastrophes, which are unpredictable as to timing and amount, and development-related items as they are not indicative of our current year underwriting performance. • This financial supplement may also reference or contain financial measures utilized to monitor the Company's investment portfolio that are not in accordance with GAAP. The Company's investment portfolio is monitored by management through analysis of various factors including unrealized gains and losses on securities, portfolio duration and exposure to market and credit risk. • For reconciliations of non-GAAP measures to the most comparable GAAP measures and other information, please refer herein and/or to CNA's filings with the Securities and Exchange Commission, available at cna.com. • Gross written premiums ex. warranty captives represents gross written premiums excluding warranty business that is ceded to third-party captives, which primarily consists of insurance policies supporting service contracts for portable electronics and vehicles. • Statutory capital and surplus represents the excess of an insurance company's admitted assets over its liabilities, including loss reserves, as determined in accordance with statutory accounting practices. • Net investment income from fixed income securities, as presented, includes both fixed maturity securities and non-redeemable preferred stock. • Certain immaterial differences are due to rounding. • N/M = Not Meaningful 19