COMMERCE BANCSHARES, INC. EARNINGS HIGHLIGHTS 3rd Quarter 2026
CAUTIONARY STATEMENT 2 Forward-Looking Statements This presentation contains forward-looking statements within the meaning of the Private Securities Litigation Reform Act of 1995, Section 27A of the Securities Act of 1933, as amended and Section 21E of the Securities Exchange Act of 1934, as amended, including, but not limited to, statements about the plans, expectations, goals, projections, and intentions of Commerce Bancshares, Inc. (“Commerce”). Statements that do not relate solely to historical facts may be deemed forward-looking statements. Forward- looking statements may be identified by the use of words and phrases such as “may,” “will,” “should,” “could,” “expect,” “anticipate,” “plan,” “project,” “believe,” “estimate, “intend,” “forecast,” “outlook,” “goal,” “target,” “guidance,” “predict,” or similar expressions or the negative thereof, or comparable terminology. Forward-looking statements involve significant risks and uncertainties and are subject to change based on various factors, many of which are beyond Commerce’s control. Factors that could cause Commerce’s actual results to differ materially from those expressed or implied in forward-looking statements made herein or by management of Commerce include, but are not limited to: general competitive, economic, and market conditions; changes in interest rates and the impact thereof on net interest income, asset valuations, and funding costs; changes in credit quality and loan losses; failure to realize the anticipate benefits from business combination transactions; changes in U.S. and global trade, monetary, and fiscal policies, including tariffs and retaliatory trade measures; cybersecurity incidents, data breaches, ransomware attacks, and risks related to third-party vendors and technology service providers; legislative and regulatory changes, including changes in banking regulations and capital requirements; geopolitical events, armed conflicts, terrorist activities, natural disasters, and public health crises; competitive pressures from traditional and non-traditional financial service providers; changes in laws or accounting standards; the impacts of artificial intelligence and other technological developments on our business; and other risks and factors identified in Commerce’s Annual Report on Form 10-K for the year ended December 31, 2025, including the discussion under “Item 1A. Risk Factors,” which is accessible on the Securities and Exchange Commission's (the “SEC”) website at www.sec.gov and at Investor.Commercebank.com, as well as in Commerce’s subsequently filed Quarterly Reports on Form 10-Q and Current Reports on Form 8-K. Information on these websites is not part of this document. We caution readers not to place undue reliance on any such forward-looking statements, which speak only as of the date on which they are made, and Commerce does not undertake to update forward-looking statements to reflect circumstances or events that occur after the date the forward-looking statements are made or to reflect the occurrence of unanticipated events. Non-GAAP Financial Measures Certain financial information in this presentation has not been prepared in accordance with U.S. generally accepted accounting principles (“GAAP”) and is presented on a non-GAAP basis. Commerce's management uses these non-GAAP financial measures in its analysis of the Company's performance and for internal planning and forecasting purposes. Management believes these measures provide meaningful supplemental information useful to investors in understanding the Company's financial performance, operating efficiency, and period-over-period trends. These measures generally adjust for items that management believes are not indicative of the Company's core operating performance or that may obscure trends in the Company's underlying performance. These non-GAAP financial measures should be considered in addition to, and not as an alternative to, substitute for, or superior to, measures prepared in accordance with GAAP, and should not be considered in isolation or as a substitute for analysis of the Company's financial condition as reported under GAAP. A reconciliation of each non- GAAP financial measure to the most directly comparable GAAP financial measure can be found in the table at the back of this presentation. Because non-GAAP financial measures are not standardized, these measures may not be comparable to similarly titled measures used by other companies due to differences in methods of calculation. Commerce strongly encourages investors to review its consolidated financial statements in their entirety and not to rely on any single financial measure.
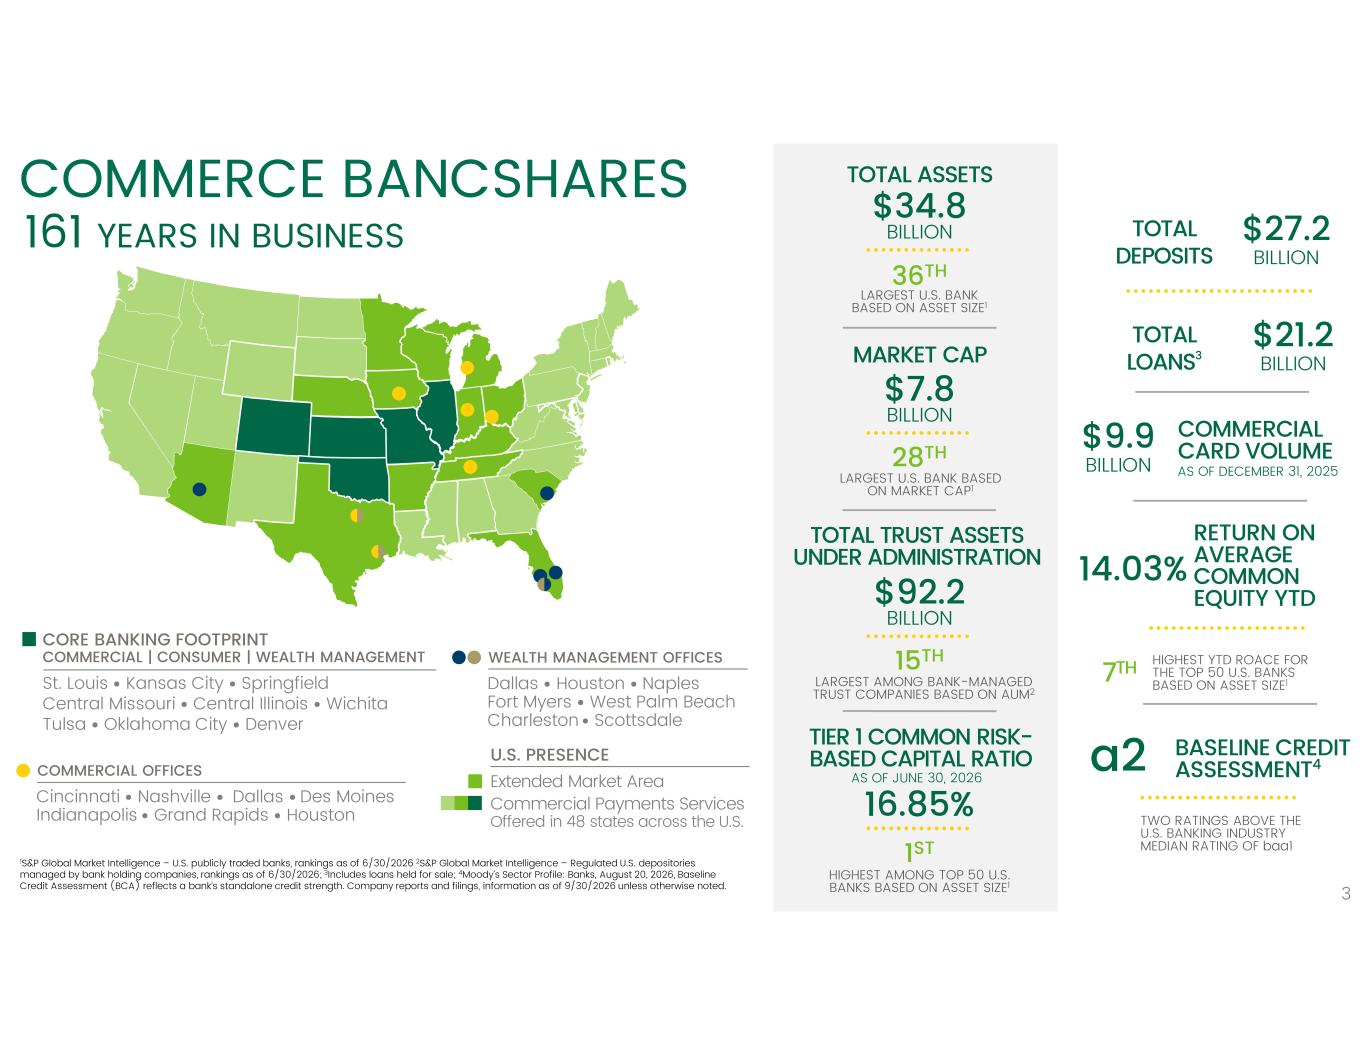
COMMERCE BANCSHARES 161 YEARS IN BUSINESS $34.8 BILLION TOTAL ASSETS 36TH LARGEST U.S. BANK BASED ON ASSET SIZE1 $7.8 BILLION MARKET CAP 28TH LARGEST U.S. BANK BASED ON MARKET CAP1 $92.2 BILLION TOTAL TRUST ASSETS UNDER ADMINISTRATION 15TH LARGEST AMONG BANK-MANAGED TRUST COMPANIES BASED ON AUM2 16.85% TIER 1 COMMON RISK- BASED CAPITAL RATIO 1ST HIGHEST AMONG TOP 50 U.S. BANKS BASED ON ASSET SIZE1 AS OF JUNE 30, 2026 $27.2 BILLION TOTAL DEPOSITS $21.2 BILLION TOTAL LOANS3 $9.9 BILLION COMMERCIAL CARD VOLUME AS OF DECEMBER 31, 2025 14.03% RETURN ON AVERAGE COMMON EQUITY YTD 7TH HIGHEST YTD ROACE FOR THE TOP 50 U.S. BANKS BASED ON ASSET SIZE1 a2 BASELINE CREDIT ASSESSMENT4 TWO RATINGS ABOVE THE U.S. BANKING INDUSTRY MEDIAN RATING OF baa1 3 1S&P Global Market Intelligence – U.S. publicly traded banks, rankings as of 6/30/2026 2S&P Global Market Intelligence – Regulated U.S. depositories managed by bank holding companies, rankings as of 6/30/2026; 3Includes loans held for sale; 4Moody’s Sector Profile: Banks, August 20, 2026, Baseline Credit Assessment (BCA) reflects a bank’s standalone credit strength. Company reports and filings, information as of 9/30/2026 unless otherwise noted. CORE BANKING FOOTPRINT COMMERCIAL | CONSUMER | WEALTH MANAGEMENT St. Louis • Kansas City • Springfield Central Missouri • Central Illinois • Wichita Tulsa • Oklahoma City • Denver COMMERCIAL OFFICES Cincinnati • Nashville • Dallas • Des Moines Indianapolis • Grand Rapids • Houston WEALTH MANAGEMENT OFFICES Dallas • Houston • Naples Fort Myers • West Palm Beach Charleston • Scottsdale U.S. PRESENCE Extended Market Area Commercial Payments Services Offered in 48 states across the U.S.
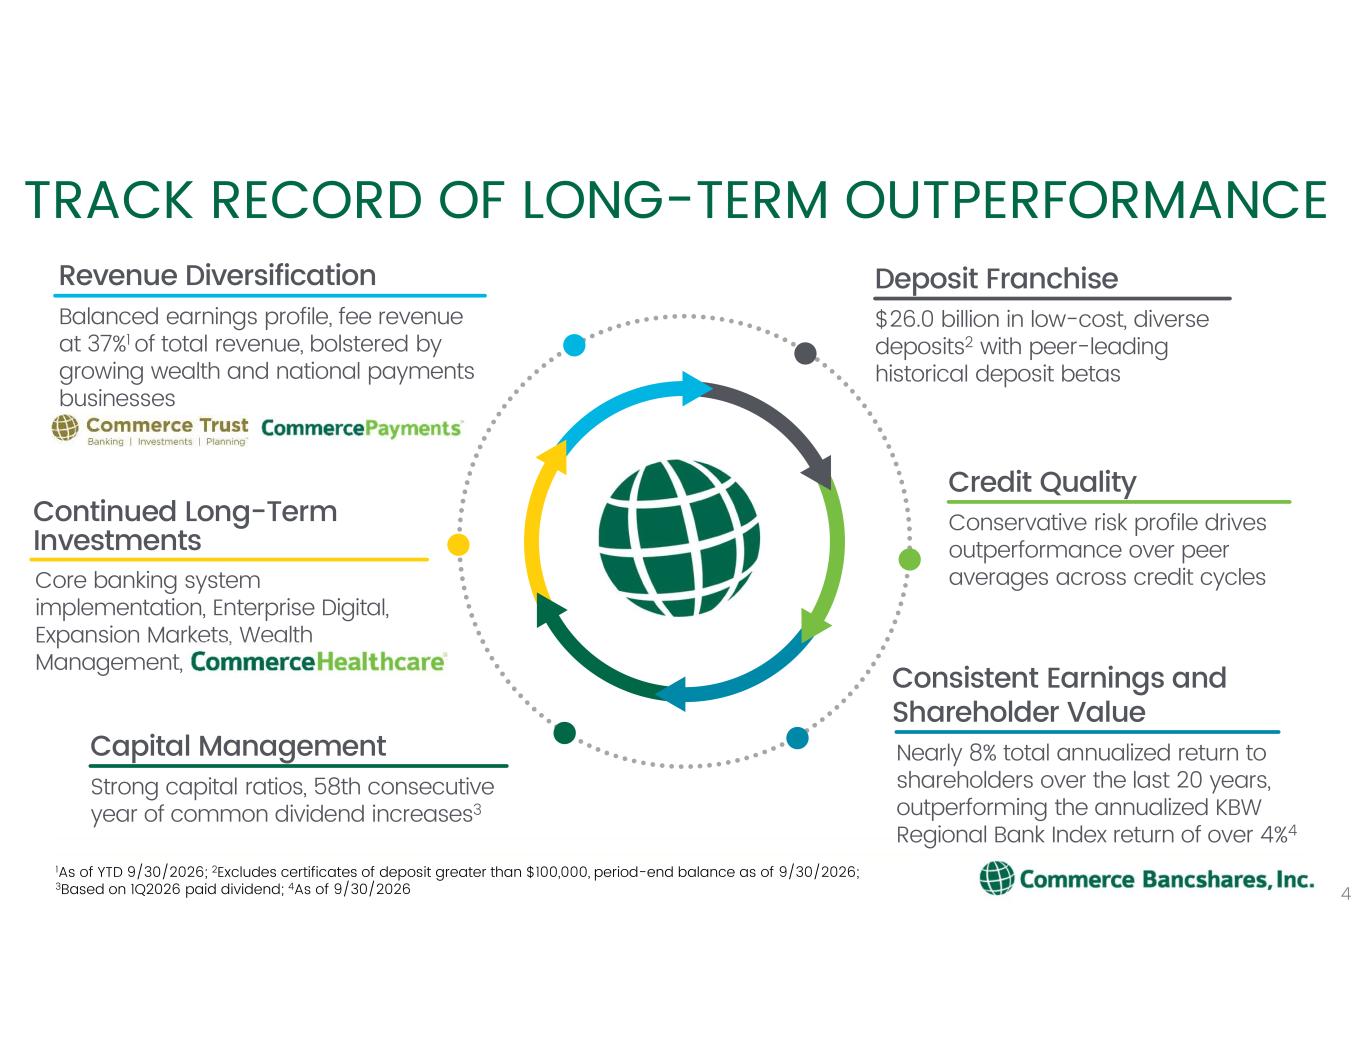
TRACK RECORD OF LONG-TERM OUTPERFORMANCE Revenue Diversification Balanced earnings profile, fee revenue at 37%1 of total revenue, bolstered by growing wealth and national payments businesses Deposit Franchise $26.0 billion in low-cost, diverse deposits2 with peer-leading historical deposit betas Credit Quality Conservative risk profile drives outperformance over peer averages across credit cycles Consistent Earnings and Shareholder Value Nearly 8% total annualized return to shareholders over the last 20 years, outperforming the annualized KBW Regional Bank Index return of over 4%4 Capital Management Strong capital ratios, 58th consecutive year of common dividend increases3 Continued Long-Term Investments Core banking system implementation, Enterprise Digital, Expansion Markets, Wealth Management, 1As of YTD 9/30/2026; 2Excludes certificates of deposit greater than $100,000, period-end balance as of 9/30/2026; 3Based on 1Q2026 paid dividend; 4As of 9/30/2026 4
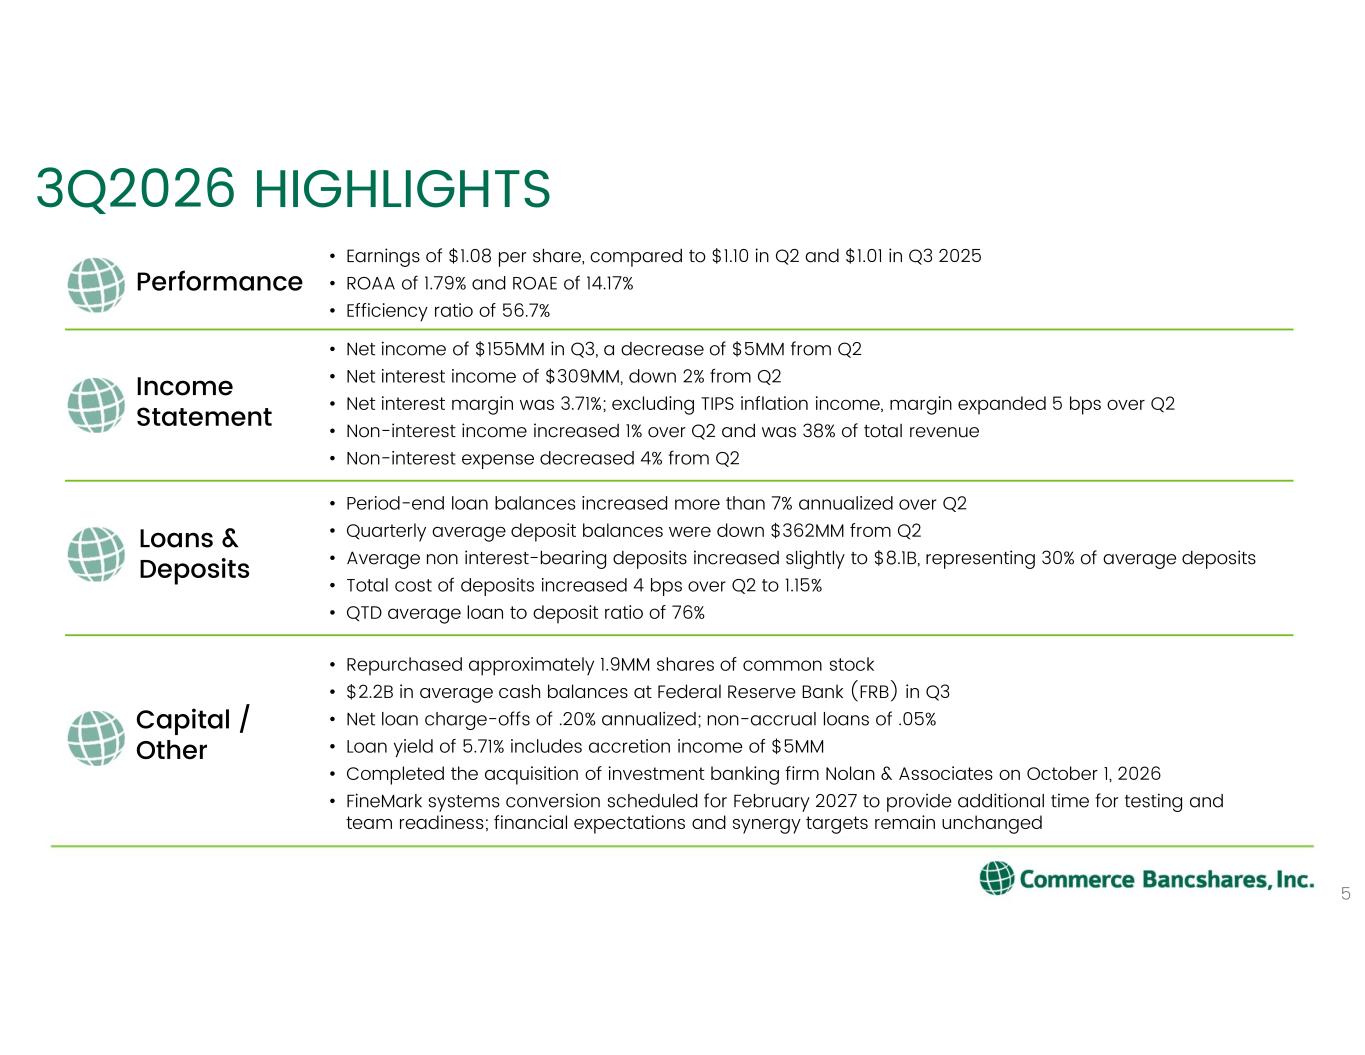
3Q2026 HIGHLIGHTS • Earnings of $1.08 per share, compared to $1.10 in Q2 and $1.01 in Q3 2025 • ROAA of 1.79% and ROAE of 14.17% • Efficiency ratio of 56.7% • Net income of $155MM in Q3, a decrease of $5MM from Q2 • Net interest income of $309MM, down 2% from Q2 • Net interest margin was 3.71%; excluding TIPS inflation income, margin expanded 5 bps over Q2 • Non-interest income increased 1% over Q2 and was 38% of total revenue • Non-interest expense decreased 4% from Q2 • Period-end loan balances increased more than 7% annualized over Q2 • Quarterly average deposit balances were down $362MM from Q2 • Average non interest-bearing deposits increased slightly to $8.1B, representing 30% of average deposits • Total cost of deposits increased 4 bps over Q2 to 1.15% • QTD average loan to deposit ratio of 76% • Repurchased approximately 1.9MM shares of common stock • $2.2B in average cash balances at Federal Reserve Bank (FRB) in Q3 • Net loan charge-offs of .20% annualized; non-accrual loans of .05% • Loan yield of 5.71% includes accretion income of $5MM • Completed the acquisition of investment banking firm Nolan & Associates on October 1, 2026 • FineMark systems conversion scheduled for February 2027 to provide additional time for testing and team readiness; financial expectations and synergy targets remain unchanged 5 Performance Income Statement Loans & Deposits Capital / Other
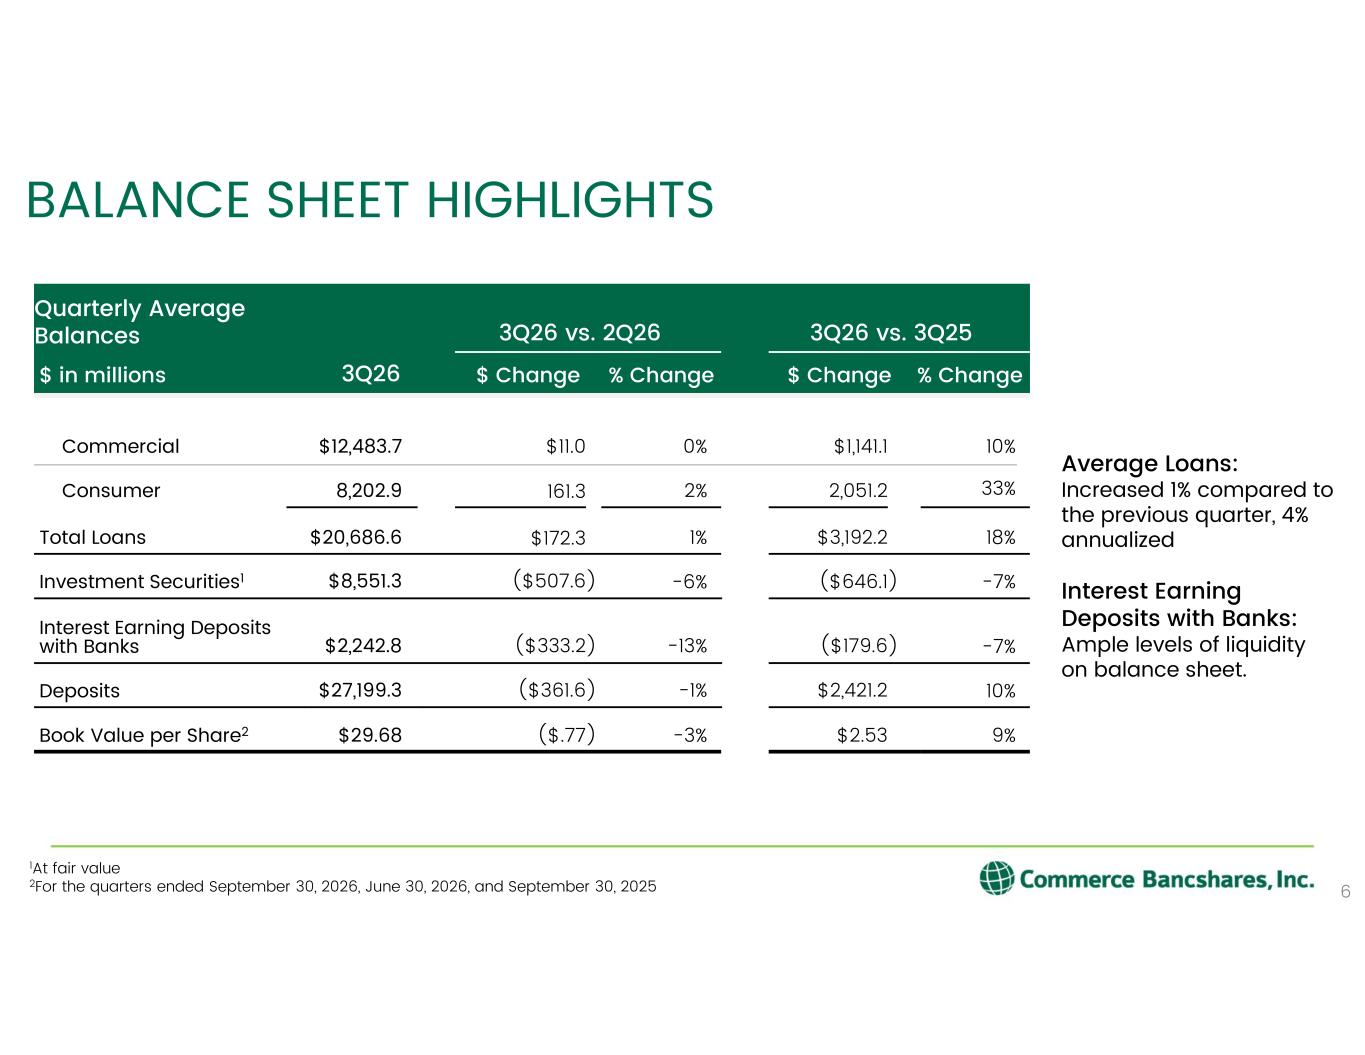
BALANCE SHEET HIGHLIGHTS 3Q26 vs. 3Q25 3Q26 vs. 2Q26 Quarterly Average Balances % Change$ Change% Change$ Change3Q26$ in millions 10%$1,141.10%$11.0$12,483.7Commercial 33%2,051.22%161.38,202.9Consumer 18%$3,192.21%$172.3$20,686.6Total Loans -7%)($646.1-6%)($507.6$8,551.3Investment Securities1 -7%)($179.6-13%)($333.2$2,242.8 Interest Earning Deposits with Banks 10%$2,421.2-1%)($361.6$27,199.3Deposits 9%$2.53-3%)($.77$29.68Book Value per Share2 Average Loans: Increased 1% compared to the previous quarter, 4% annualized Interest Earning Deposits with Banks: Ample levels of liquidity on balance sheet. 1At fair value 2For the quarters ended September 30, 2026, June 30, 2026, and September 30, 2025 6
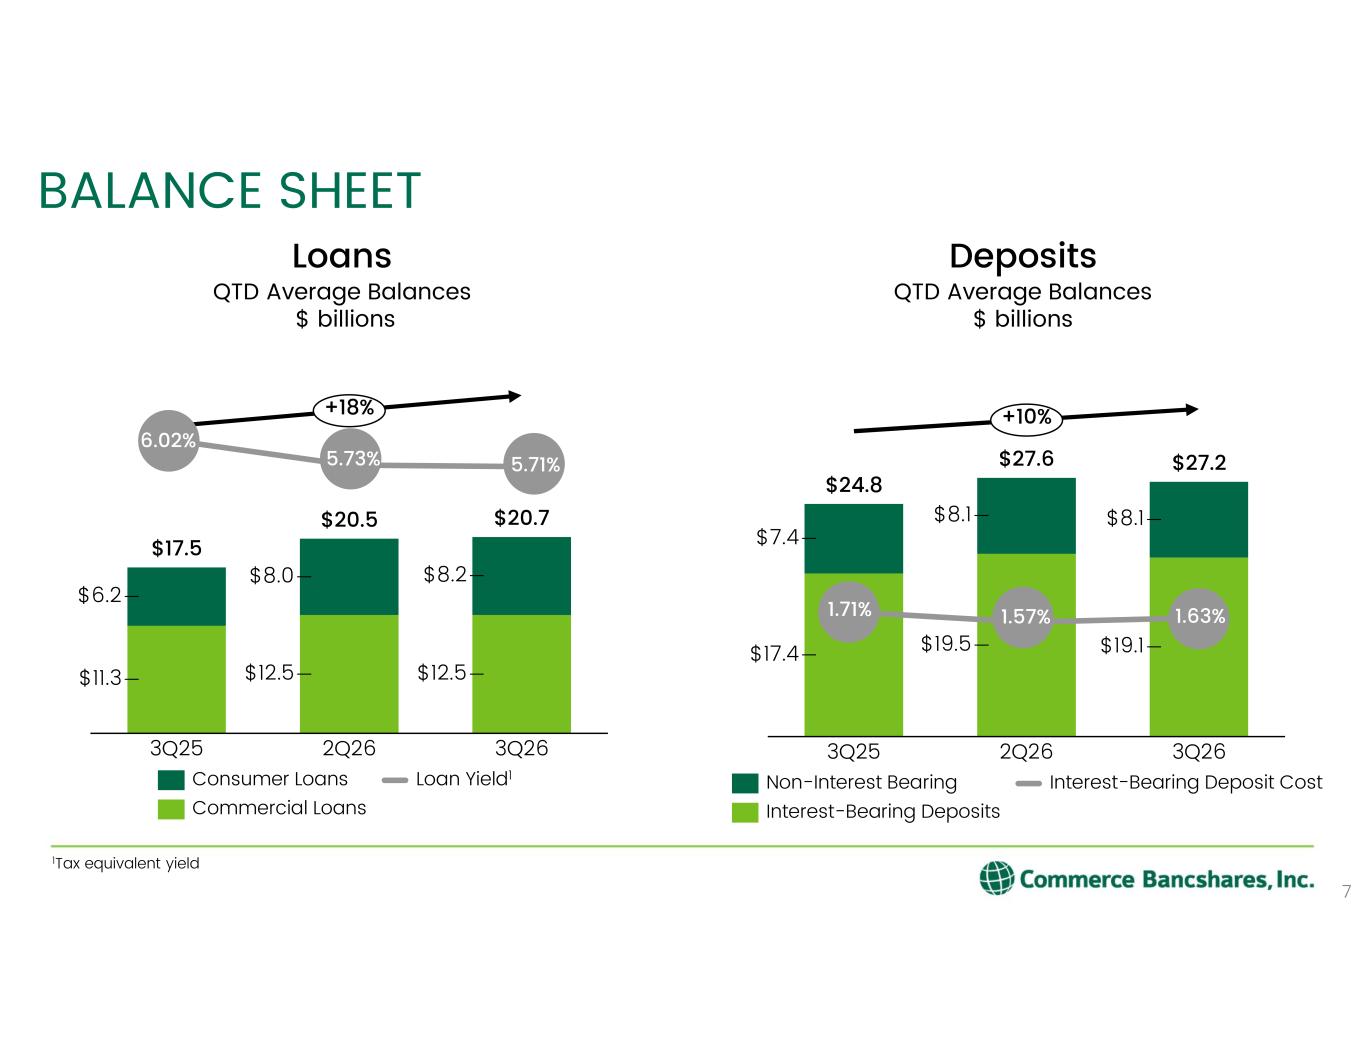
$17.4 $19.5 $19.1 $7.4 $8.1 $8.1 3Q25 2Q26 3Q26 $24.8 $27.6 $27.2 +10% $11.3 $12.5 $12.5 $6.2 $8.0 $8.2 3Q25 2Q26 3Q26 $17.5 $20.5 $20.7 +18% BALANCE SHEET 7 Loans Consumer Loans Commercial Loans Loan Yield1 Deposits QTD Average Balances $ billions Non-Interest Bearing Interest-Bearing Deposits Interest-Bearing Deposit Cost QTD Average Balances $ billions 6.02% 5.73% 5.71% 1.71% 1.57% 1.63% 1Tax equivalent yield
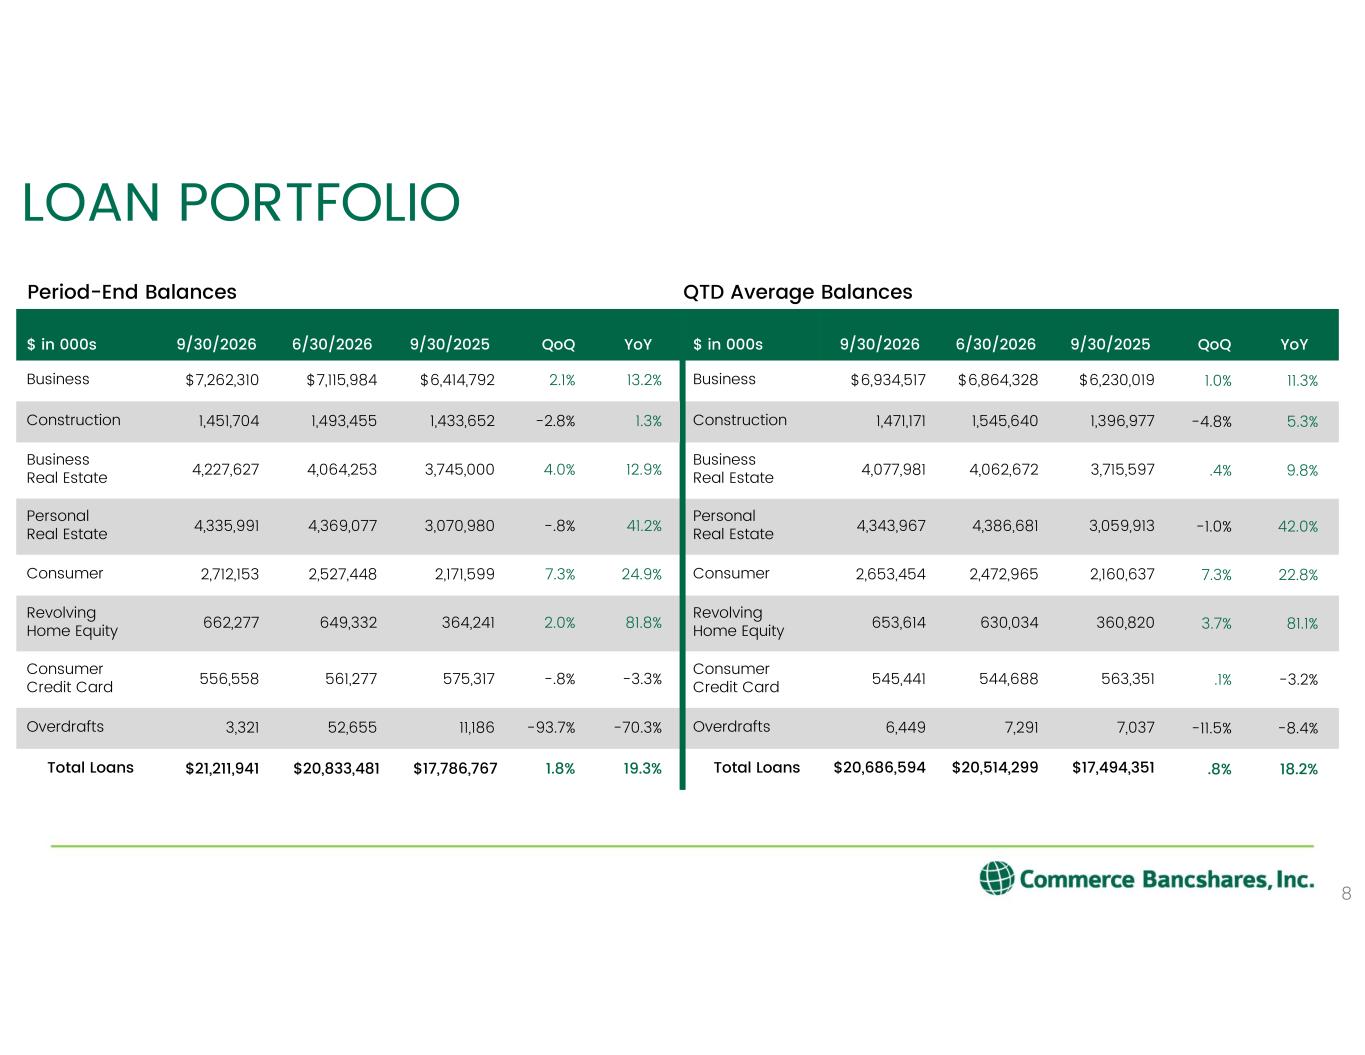
LOAN PORTFOLIO 8 YoYQoQ9/30/20256/30/20269/30/2026$ in 000s 13.2%2.1%$6,414,792 $7,115,984 $7,262,310 Business 1.3%-2.8%1,433,6521,493,4551,451,704Construction 12.9%4.0%3,745,0004,064,2534,227,627Business Real Estate 41.2%-.8%3,070,9804,369,0774,335,991Personal Real Estate 24.9%7.3%2,171,5992,527,4482,712,153Consumer 81.8%2.0%364,241649,332662,277Revolving Home Equity -3.3%-.8%575,317561,277556,558Consumer Credit Card -70.3%-93.7%11,18652,6553,321Overdrafts 19.3%1.8%$17,786,767$20,833,481$21,211,941Total Loans Period-End Balances YoYQoQ9/30/20256/30/20269/30/2026$ in 000s 11.3%1.0%$6,230,019 $6,864,328 $6,934,517 Business 5.3%-4.8%1,396,9771,545,6401,471,171Construction 9.8%.4%3,715,5974,062,6724,077,981Business Real Estate 42.0%-1.0%3,059,9134,386,6814,343,967Personal Real Estate 22.8%7.3%2,160,6372,472,9652,653,454Consumer 81.1%3.7%360,820630,034653,614Revolving Home Equity -3.2%.1%563,351544,688545,441Consumer Credit Card -8.4%-11.5%7,0377,2916,449Overdrafts 18.2%.8%$17,494,351$20,514,299$20,686,594Total Loans QTD Average Balances
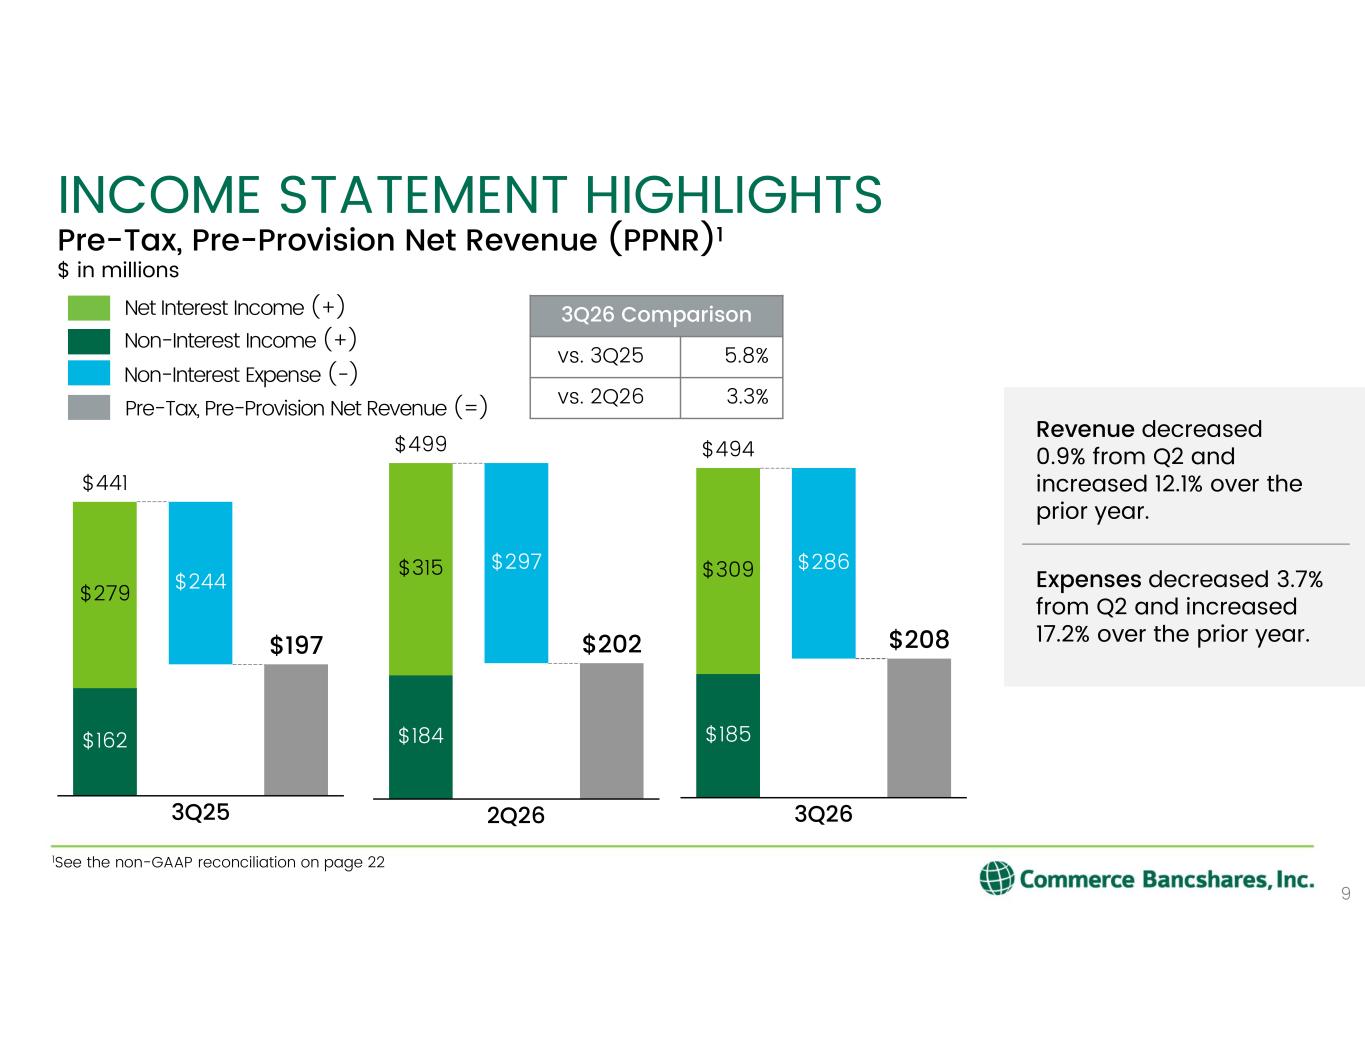
$184 $202 $315 $297 2Q26 $499 9 INCOME STATEMENT HIGHLIGHTS $162 $197 $279 $244 3Q25 $441 $185 $208 $309 $286 3Q26 $494 Non-Interest Income (+) Net Interest Income (+) Non-Interest Expense (-) Pre-Tax, Pre-Provision Net Revenue (=) 3Q26 Comparison 5.8%vs. 3Q25 3.3%vs. 2Q26 Pre-Tax, Pre-Provision Net Revenue (PPNR)1 $ in millions Expenses decreased 3.7% from Q2 and increased 17.2% over the prior year. Revenue decreased 0.9% from Q2 and increased 12.1% over the prior year. 1See the non-GAAP reconciliation on page 22
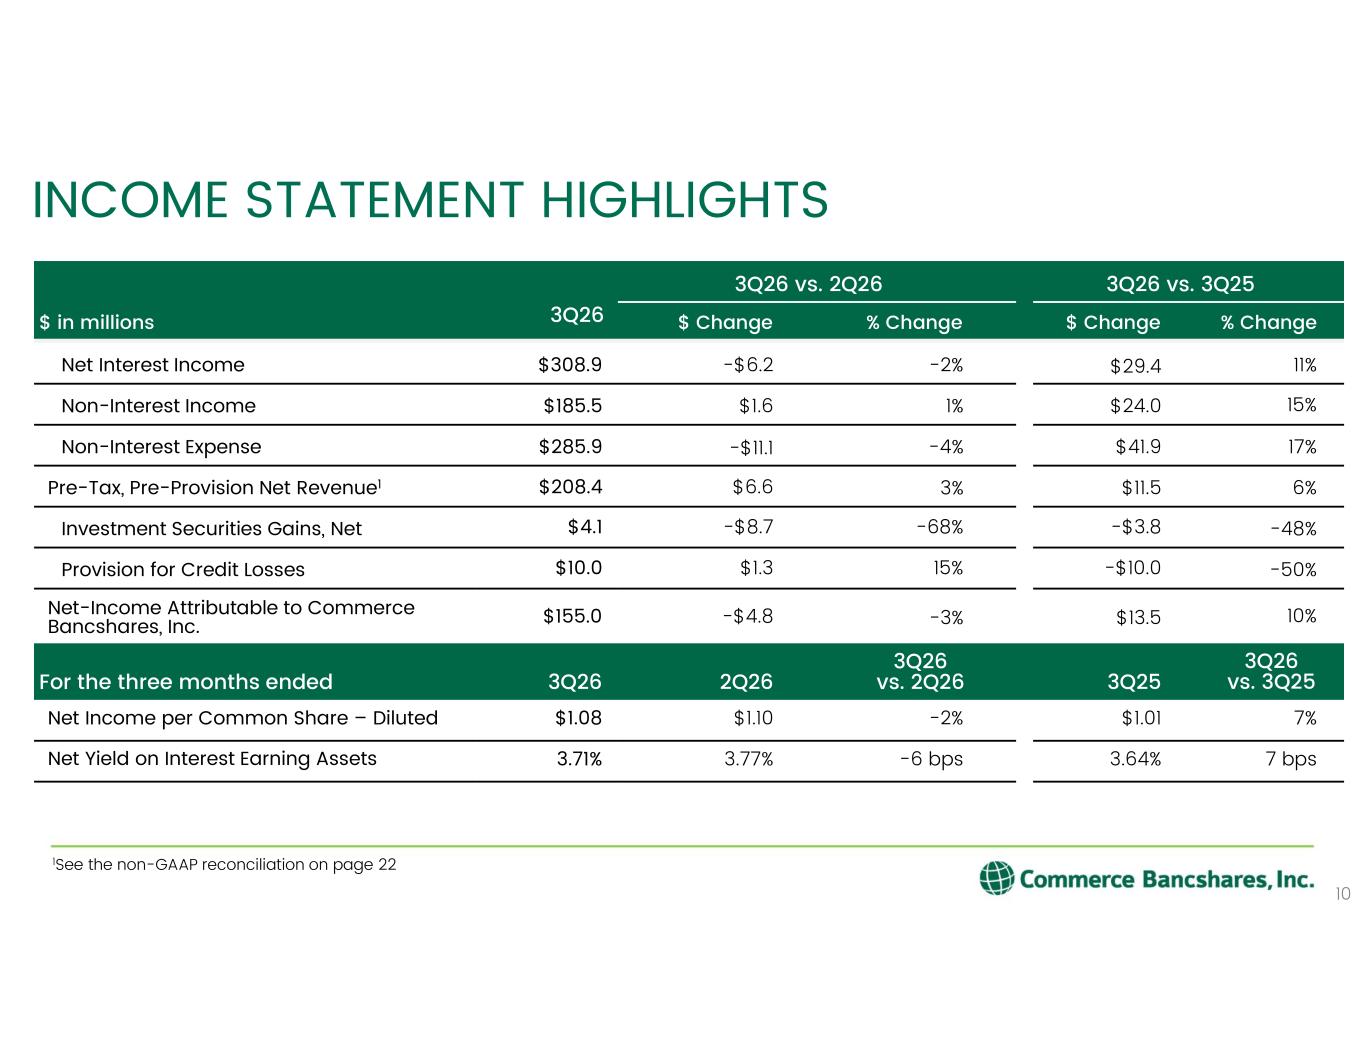
3Q26 vs. 3Q25 3Q26 vs. 2Q26 % Change$ Change% Change$ Change3Q26$ in millions 11%$29.4-2%-$6.2$308.9Net Interest Income 15%$24.01%$1.6$185.5Non-Interest Income 17%$41.9-4%-$11.1$285.9Non-Interest Expense 6%$11.53%$6.6$208.4Pre-Tax, Pre-Provision Net Revenue1 -48%-$3.8-68%-$8.7$4.1Investment Securities Gains, Net -50%-$10.015%$1.3$10.0Provision for Credit Losses 10%$13.5-3%-$4.8$155.0Net-Income Attributable to Commerce Bancshares, Inc. 3Q26 vs. 3Q253Q25 3Q26 vs. 2Q262Q263Q26For the three months ended 7%$1.01-2%$1.10$1.08Net Income per Common Share – Diluted 7 bps3.64%-6 bps3.77%3.71%Net Yield on Interest Earning Assets INCOME STATEMENT HIGHLIGHTS 1See the non-GAAP reconciliation on page 22 10
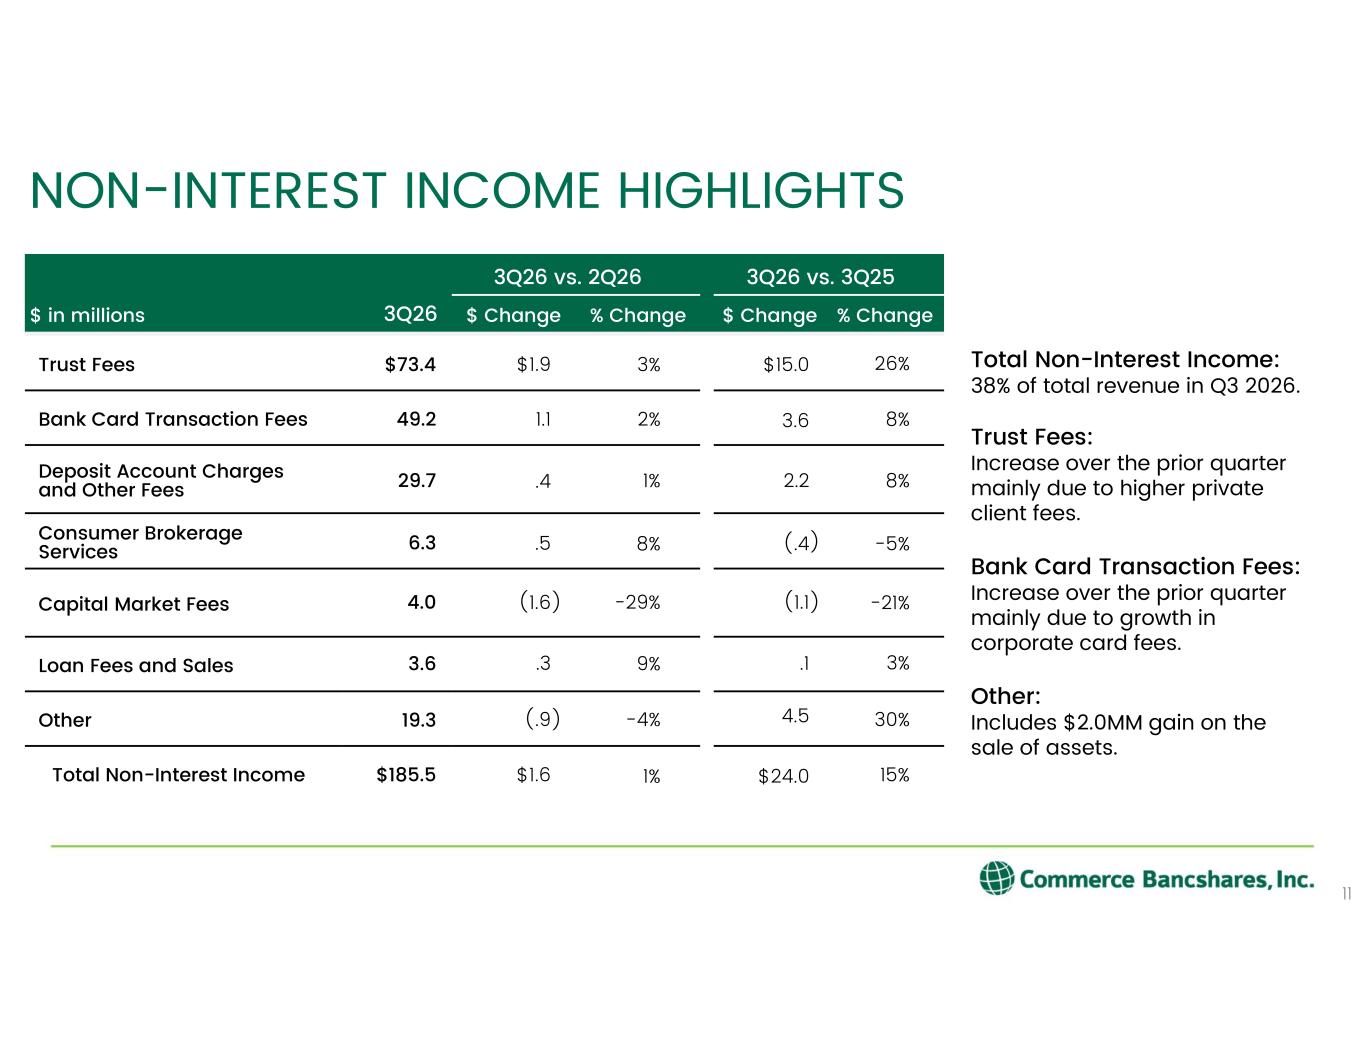
Total Non-Interest Income: 38% of total revenue in Q3 2026. Trust Fees: Increase over the prior quarter mainly due to higher private client fees. Bank Card Transaction Fees: Increase over the prior quarter mainly due to growth in corporate card fees. Other: Includes $2.0MM gain on the sale of assets. NON-INTEREST INCOME HIGHLIGHTS 11 3Q26 vs. 3Q25 3Q26 vs. 2Q26 % Change$ Change% Change$ Change3Q26$ in millions 26%$15.03%$1.9$73.4Trust Fees 8%3.62%1.149.2Bank Card Transaction Fees 8%2.21%.429.7Deposit Account Charges and Other Fees -5%)(.48%.56.3Consumer Brokerage Services -21%)(1.1-29%)(1.64.0Capital Market Fees 3%.19%.33.6Loan Fees and Sales 30%4.5-4%)(.919.3Other 15%$24.01%$1.6$185.5Total Non-Interest Income
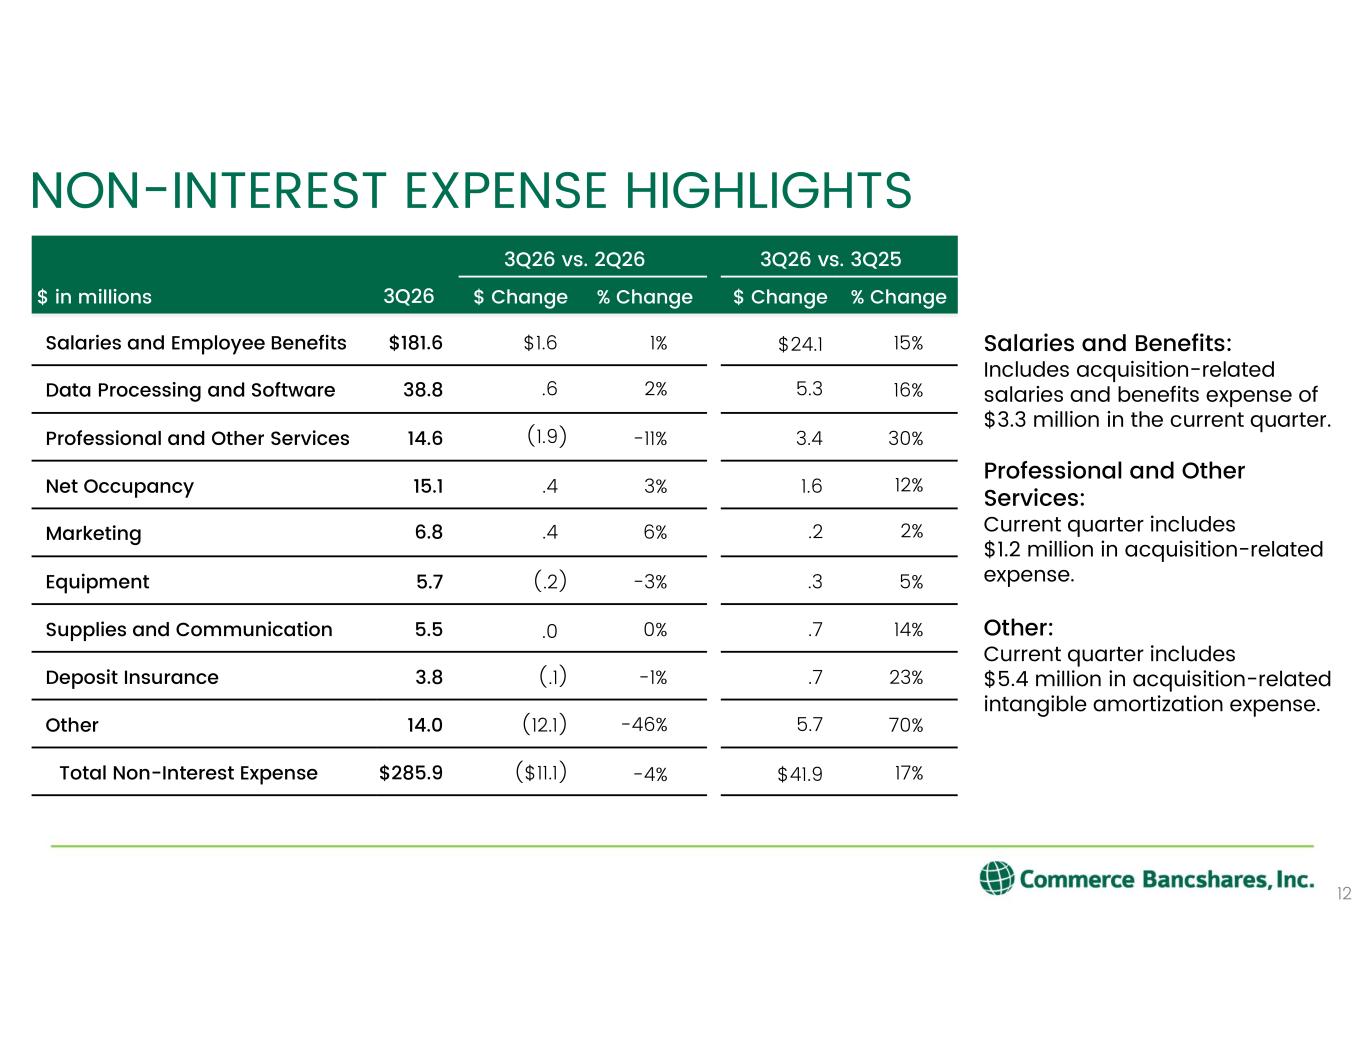
NON-INTEREST EXPENSE HIGHLIGHTS 12 3Q26 vs. 3Q25 3Q26 vs. 2Q26 % Change$ Change% Change$ Change3Q26$ in millions 15%$24.11%$1.6$181.6Salaries and Employee Benefits 16%5.32%.638.8Data Processing and Software 30%3.4-11%)(1.914.6Professional and Other Services 12%1.63%.415.1Net Occupancy 2%.26%.46.8Marketing 5%.3-3%)(.25.7Equipment 14%.70%.05.5Supplies and Communication 23%.7-1%)(.13.8Deposit Insurance 70%5.7-46%)(12.114.0Other 17%$41.9-4%)($11.1$285.9Total Non-Interest Expense Salaries and Benefits: Includes acquisition-related salaries and benefits expense of $3.3 million in the current quarter. Professional and Other Services: Current quarter includes $1.2 million in acquisition-related expense. Other: Current quarter includes $5.4 million in acquisition-related intangible amortization expense.
13 LIQUIDITY AND CAPITAL
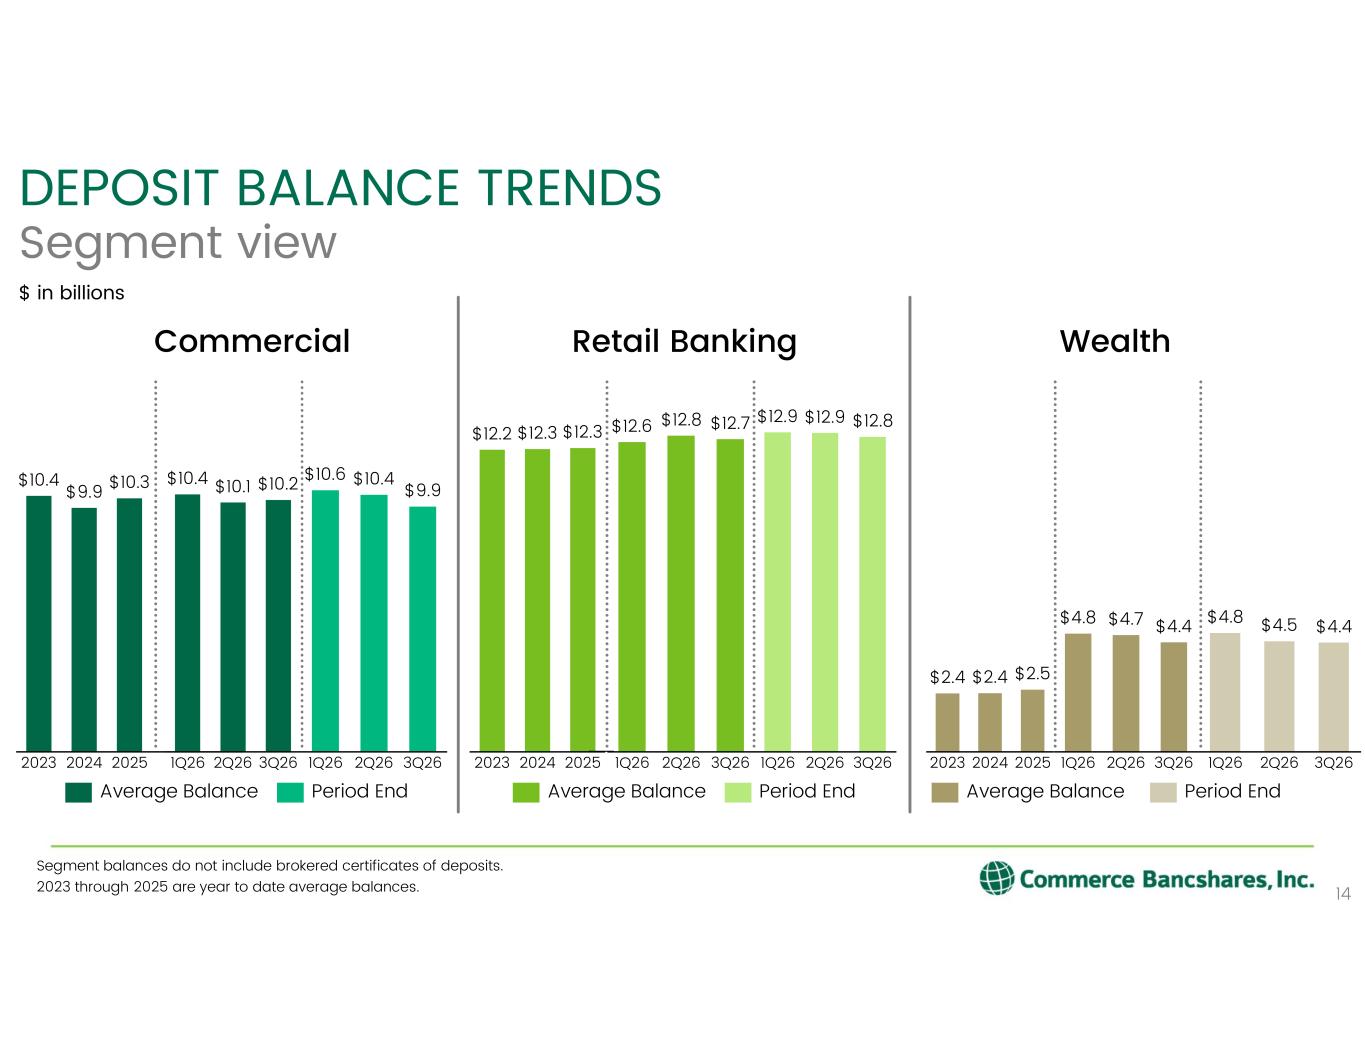
2023 2024 2025 $2.4 $2.4 $2.5 DEPOSIT BALANCE TRENDS Segment view $ in billions 14 2023 2024 2025 $10.4 $9.9 $10.3 2023 2024 2025 $12.2 $12.3 $12.3 Commercial Retail Banking Wealth Average Balance 1Q26 2Q26 3Q26 $12.9 $12.9 $12.8 Period EndAverage Balance Average Balance Segment balances do not include brokered certificates of deposits. 2023 through 2025 are year to date average balances. 1Q26 2Q26 3Q26 $10.6 $10.4 $9.9 Period End 1Q26 2Q26 3Q26 $4.8 $4.5 $4.4 Period End 1Q26 2Q26 3Q26 $10.4 $10.1 $10.2 1Q26 2Q26 3Q26 $12.6 $12.8 $12.7 1Q26 2Q26 3Q26 $4.8 $4.7 $4.4
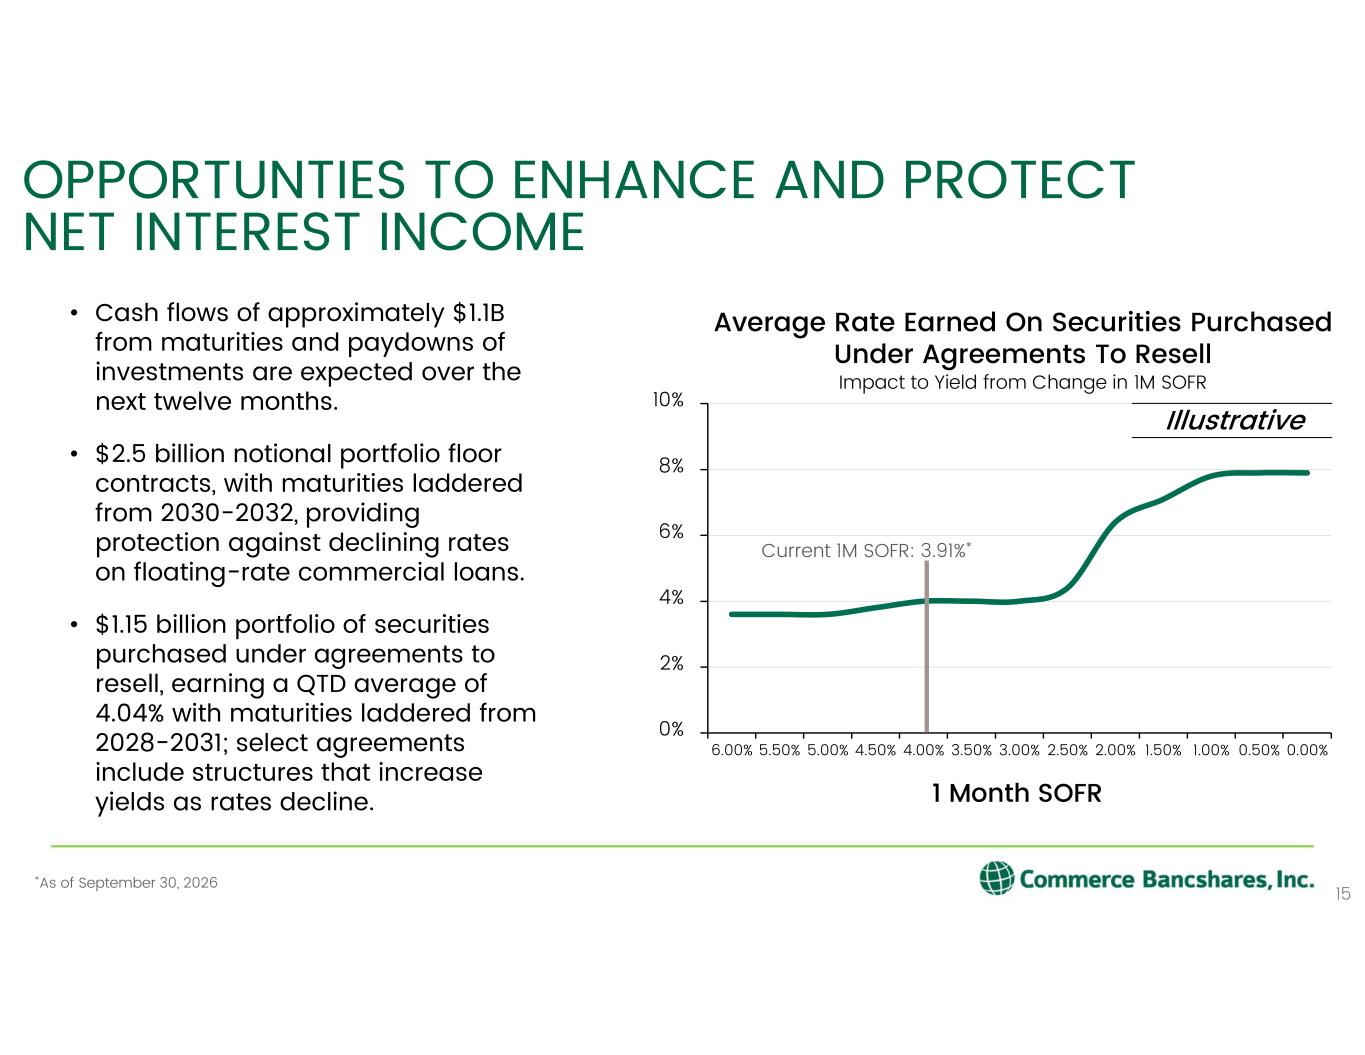
OPPORTUNTIES TO ENHANCE AND PROTECT NET INTEREST INCOME • Cash flows of approximately $1.1B from maturities and paydowns of investments are expected over the next twelve months. • $2.5 billion notional portfolio floor contracts, with maturities laddered from 2030-2032, providing protection against declining rates on floating-rate commercial loans. • $1.15 billion portfolio of securities purchased under agreements to resell, earning a QTD average of 4.04% with maturities laddered from 2028-2031; select agreements include structures that increase yields as rates decline. 15 0% 2% 4% 6% 8% 10% 6.00% 5.50% 5.00% 4.50% 4.00% 3.50% 3.00% 2.50% 2.00% 1.50% 1.00% 0.50% 0.00% Average Rate Earned On Securities Purchased Under Agreements To Resell Impact to Yield from Change in 1M SOFR 1 Month SOFR Current 1M SOFR: 3.91%* Illustrative *As of September 30, 2026
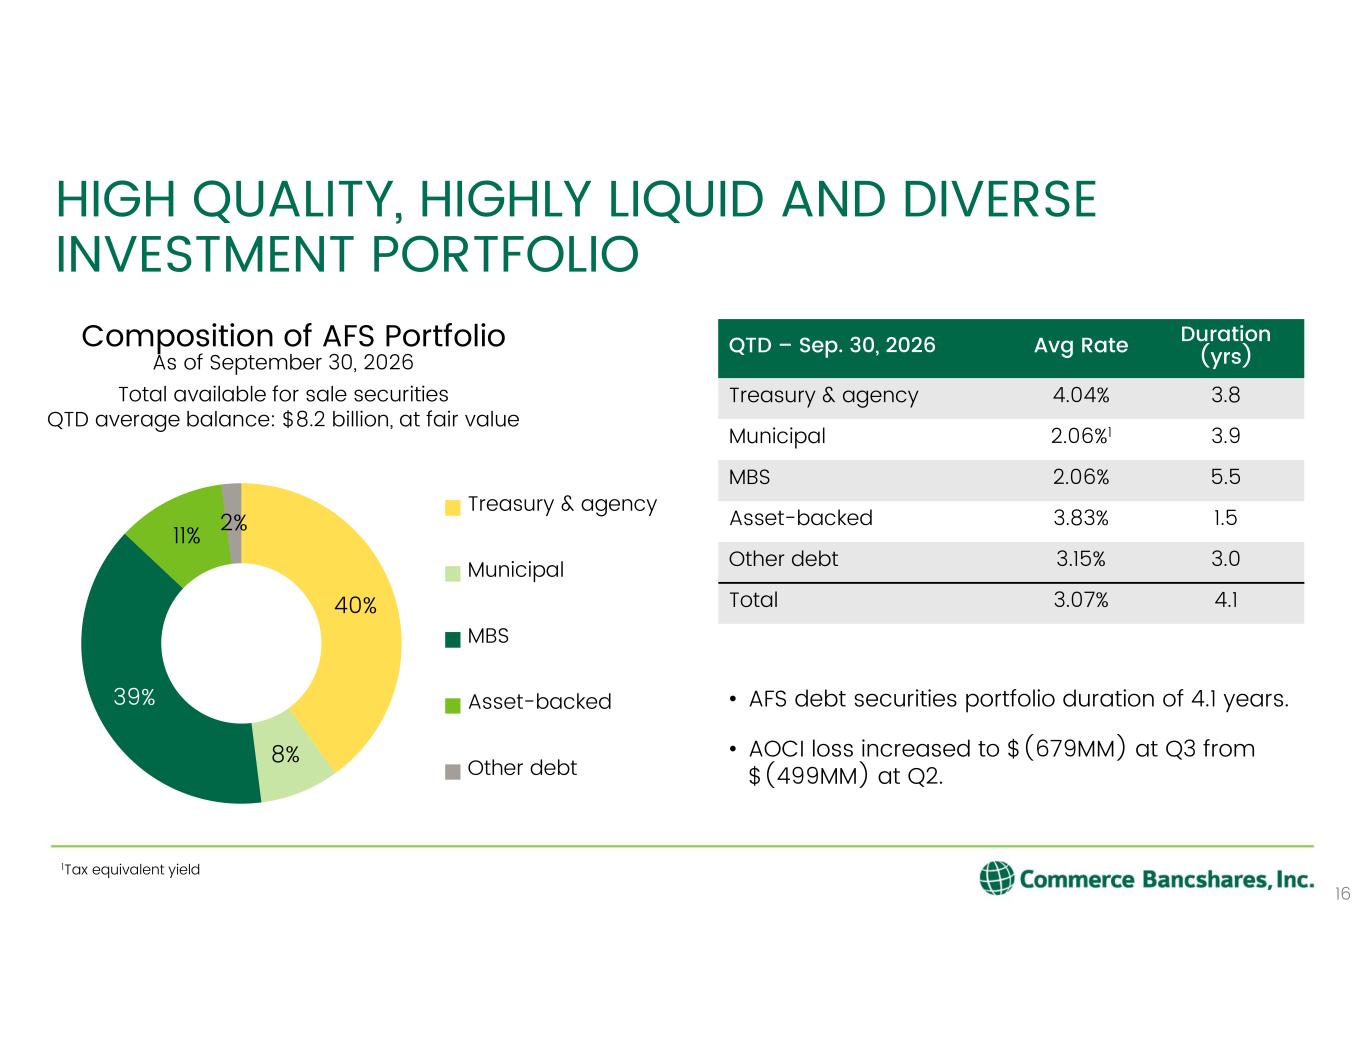
40% 8% 39% 11% 2% Composition of AFS Portfolio Treasury & agency Municipal MBS Asset-backed Other debt HIGH QUALITY, HIGHLY LIQUID AND DIVERSE INVESTMENT PORTFOLIO 1Tax equivalent yield Duration (yrs)Avg RateQTD – Sep. 30, 2026 3.84.04%Treasury & agency 3.92.06%1Municipal 5.52.06%MBS 1.53.83%Asset-backed 3.03.15%Other debt 4.13.07%Total 16 Total available for sale securities QTD average balance: $8.2 billion, at fair value As of September 30, 2026 • AFS debt securities portfolio duration of 4.1 years. • AOCI loss increased to $(679MM) at Q3 from $(499MM) at Q2.
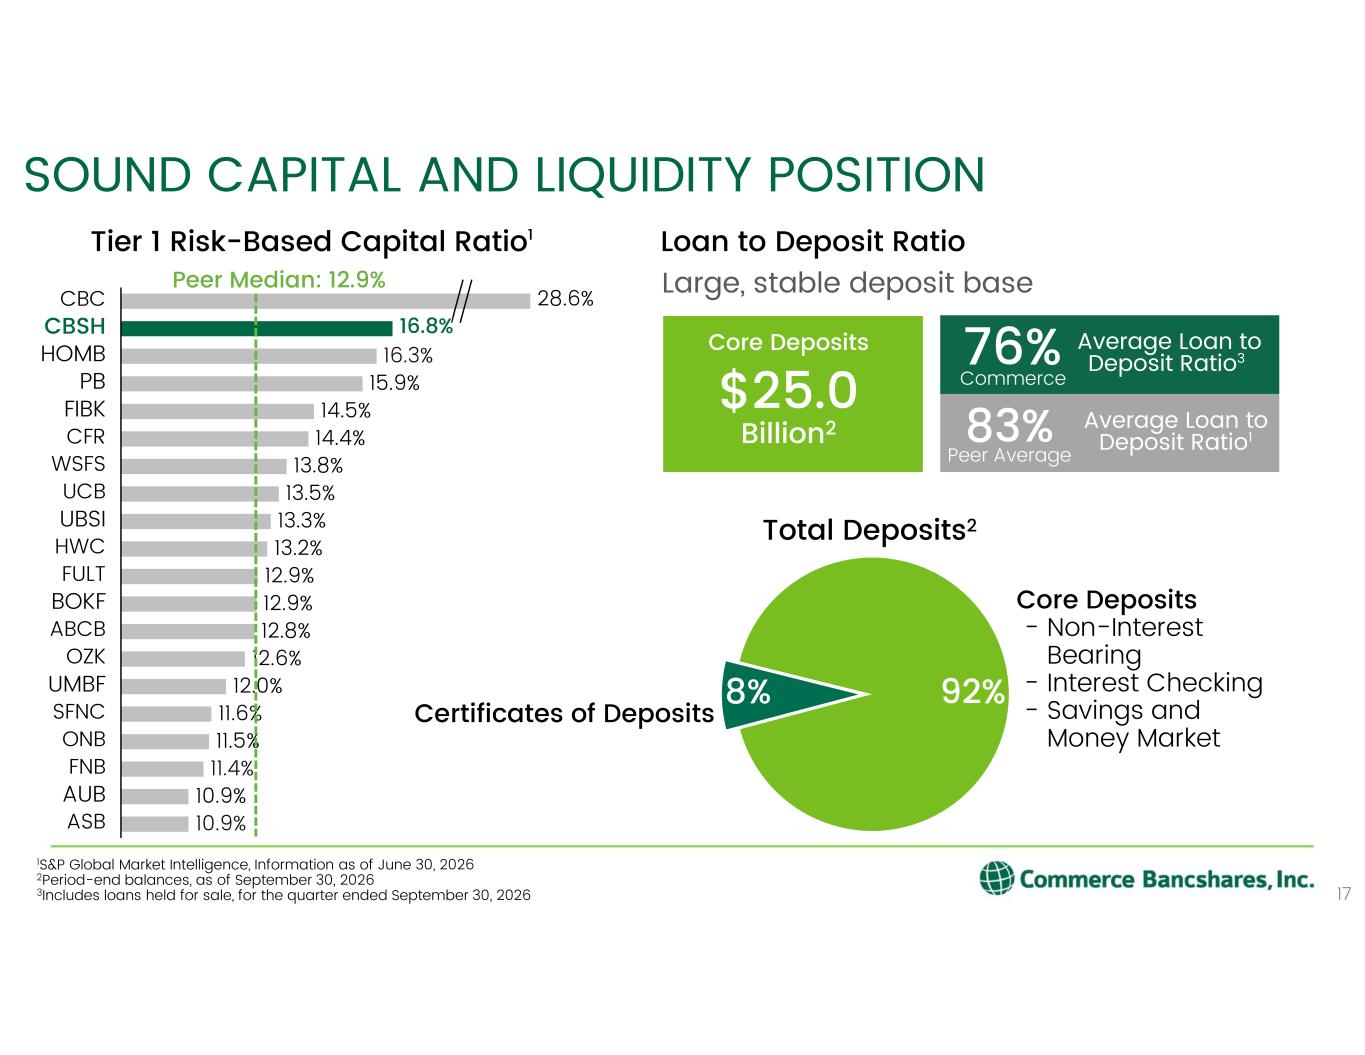
92%8% Core Deposits - Non-Interest Bearing - Interest Checking - Savings and Money Market Certificates of Deposits Average Loan to Deposit Ratio3 SOUND CAPITAL AND LIQUIDITY POSITION 17 Tier 1 Risk-Based Capital Ratio1 1S&P Global Market Intelligence, Information as of June 30, 2026 2Period-end balances, as of September 30, 2026 3Includes loans held for sale, for the quarter ended September 30, 2026 16.3% 15.9% 14.5% 14.4% 13.8% 13.5% 13.3% 13.2% 12.9% 12.9% 12.8% 12.6% 12.0% 11.6% 11.5% 11.4% 10.9% 10.9% CBC CBSH HOMB PB FIBK CFR WSFS UCB UBSI HWC FULT BOKF ABCB OZK UMBF SFNC ONB FNB AUB ASB 28.6% 16.8% Peer Median: 12.9% Core Deposits $25.0 Billion2 Large, stable deposit base Loan to Deposit Ratio Total Deposits2 76% Average Loan to Deposit Ratio183% Commerce Peer Average
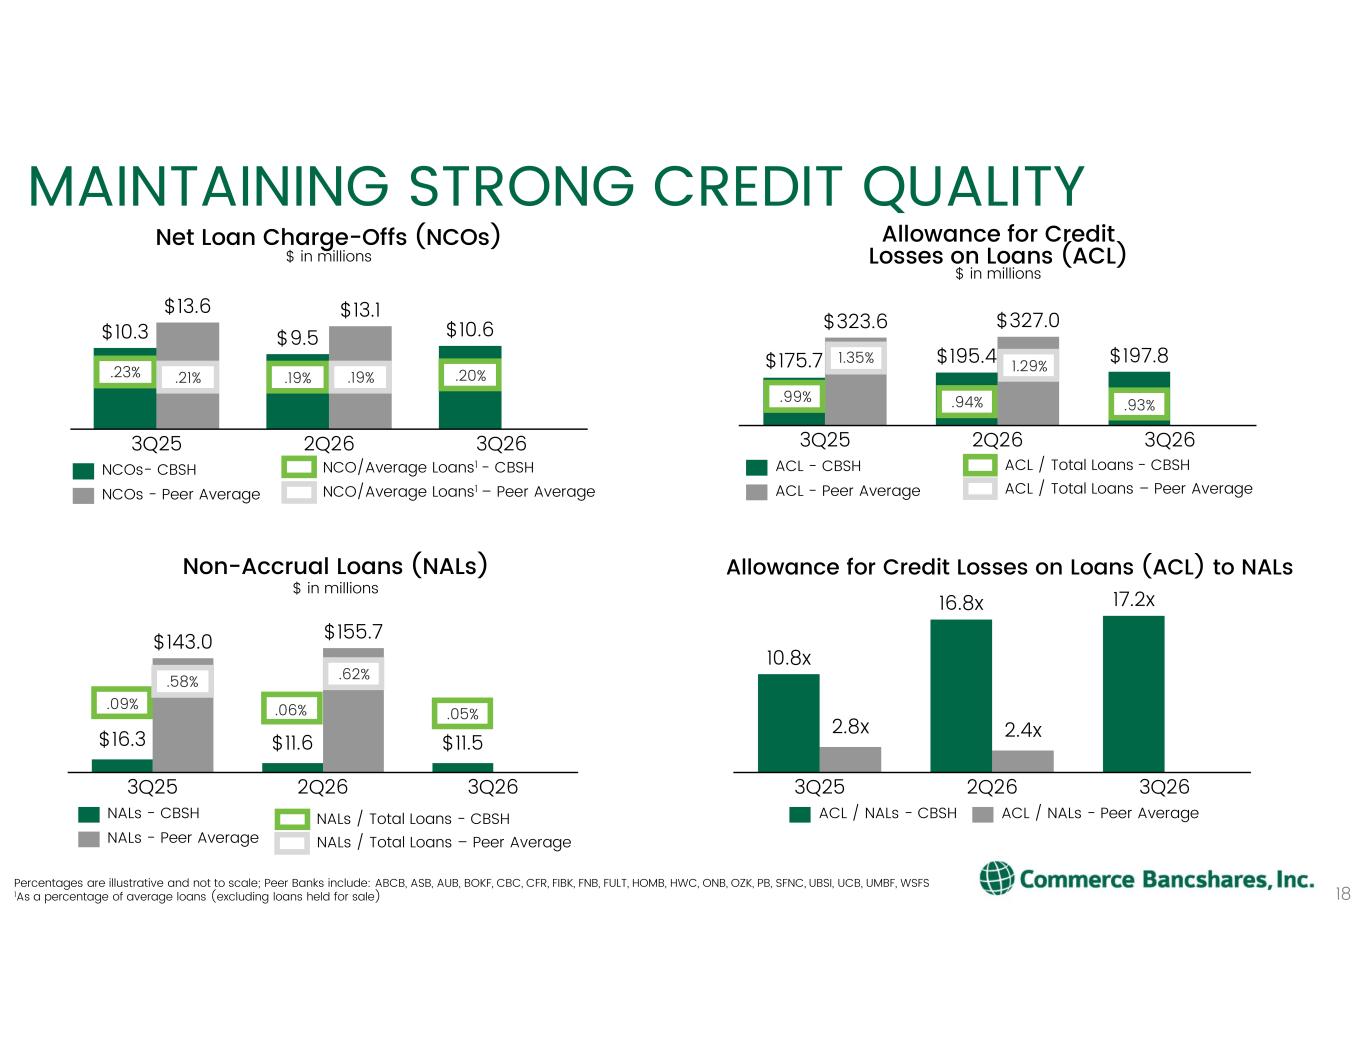
$16.3 $11.6 $11.5 $143.0 $155.7 3Q25 2Q26 3Q26 $10.3 $9.5 $10.6 $13.6 $13.1 3Q25 2Q26 3Q26 MAINTAINING STRONG CREDIT QUALITY Net Loan Charge-Offs (NCOs) $ in millions NCOs- CBSH NCOs - Peer Average NCO/Average Loans1 - CBSH $175.7 $195.4 $197.8 $323.6 $327.0 3Q25 2Q26 3Q26 Allowance for Credit Losses on Loans (ACL) $ in millions ACL - CBSH ACL - Peer Average ACL / Total Loans - CBSH Non-Accrual Loans (NALs) $ in millions NALs - CBSH NALs - Peer Average 10.8x 16.8x 17.2x 2.8x 2.4x 3Q25 2Q26 3Q26 Allowance for Credit Losses on Loans (ACL) to NALs ACL / NALs - CBSH ACL / NALs - Peer AverageNALs / Total Loans - CBSH NCO/Average Loans1 – Peer Average .09% NALs / Total Loans – Peer Average .06% .05% .58% ACL / Total Loans – Peer Average .99% .94% .93% 1.35% 1.29%.23% .19% .20%.21% .19% Percentages are illustrative and not to scale; Peer Banks include: ABCB, ASB, AUB, BOKF, CBC, CFR, FIBK, FNB, FULT, HOMB, HWC, ONB, OZK, PB, SFNC, UBSI, UCB, UMBF, WSFS 1As a percentage of average loans (excluding loans held for sale) 18 .62%
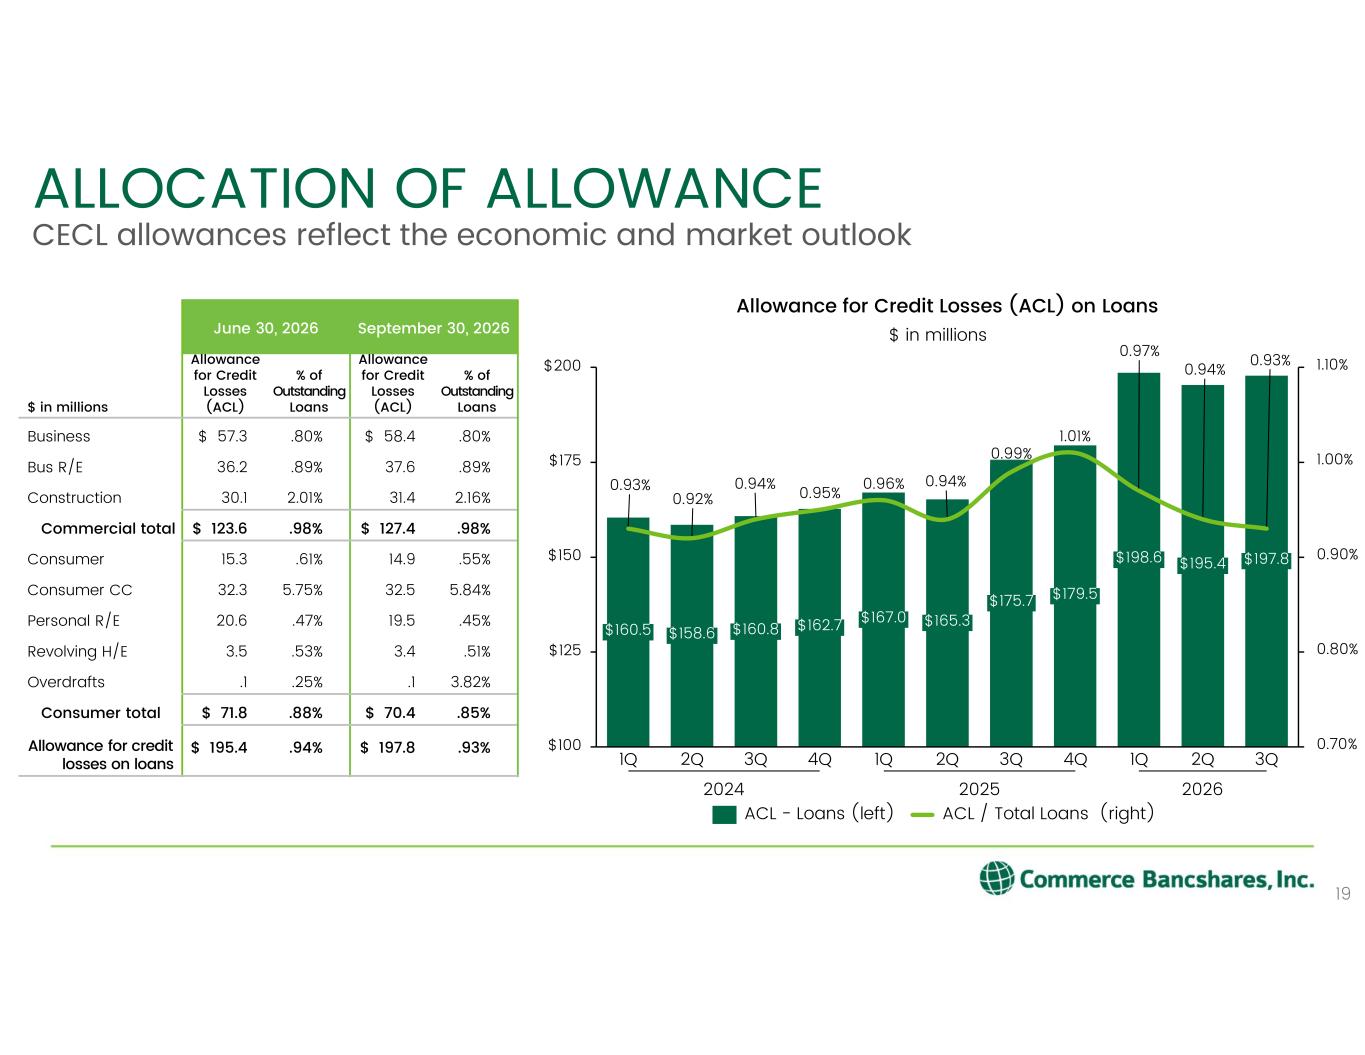
ALLOCATION OF ALLOWANCE 19 CECL allowances reflect the economic and market outlook September 30, 2026June 30, 2026 % of Outstanding Loans Allowance for Credit Losses (ACL) % of Outstanding Loans Allowance for Credit Losses (ACL)$ in millions .80%$ 58.4.80%$ 57.3Business .89%37.6 .89%36.2 Bus R/E 2.16%31.4 2.01%30.1 Construction .98%$ 127.4.98%$ 123.6Commercial total .55%14.9 .61%15.3 Consumer 5.84%32.55.75%32.3Consumer CC .45%19.5.47%20.6Personal R/E .51%3.4.53%3.5Revolving H/E 3.82%.1 .25%.1 Overdrafts .85%$ 70.4.88%$ 71.8Consumer total .93%$ 197.8.94%$ 195.4Allowance for credit losses on loans 0.93% 0.92% 0.94% 0.95% 0.96% 0.94% 1.01% 0.97% 0.94% 0.93% 0.70% 0.80% 0.90% 1.00% 1.10% $125 $150 $175 $200 $100 $160.5 1Q $158.6 2Q $160.8 3Q $162.7 4Q $167.0 1Q 2Q $175.7 0.99% 3Q $179.5 4Q $198.6 1Q $195.4 2Q $197.8 3Q $165.3 Allowance for Credit Losses (ACL) on Loans ACL - Loans (left) ACL / Total Loans (right) $ in millions 2024 2025 2026
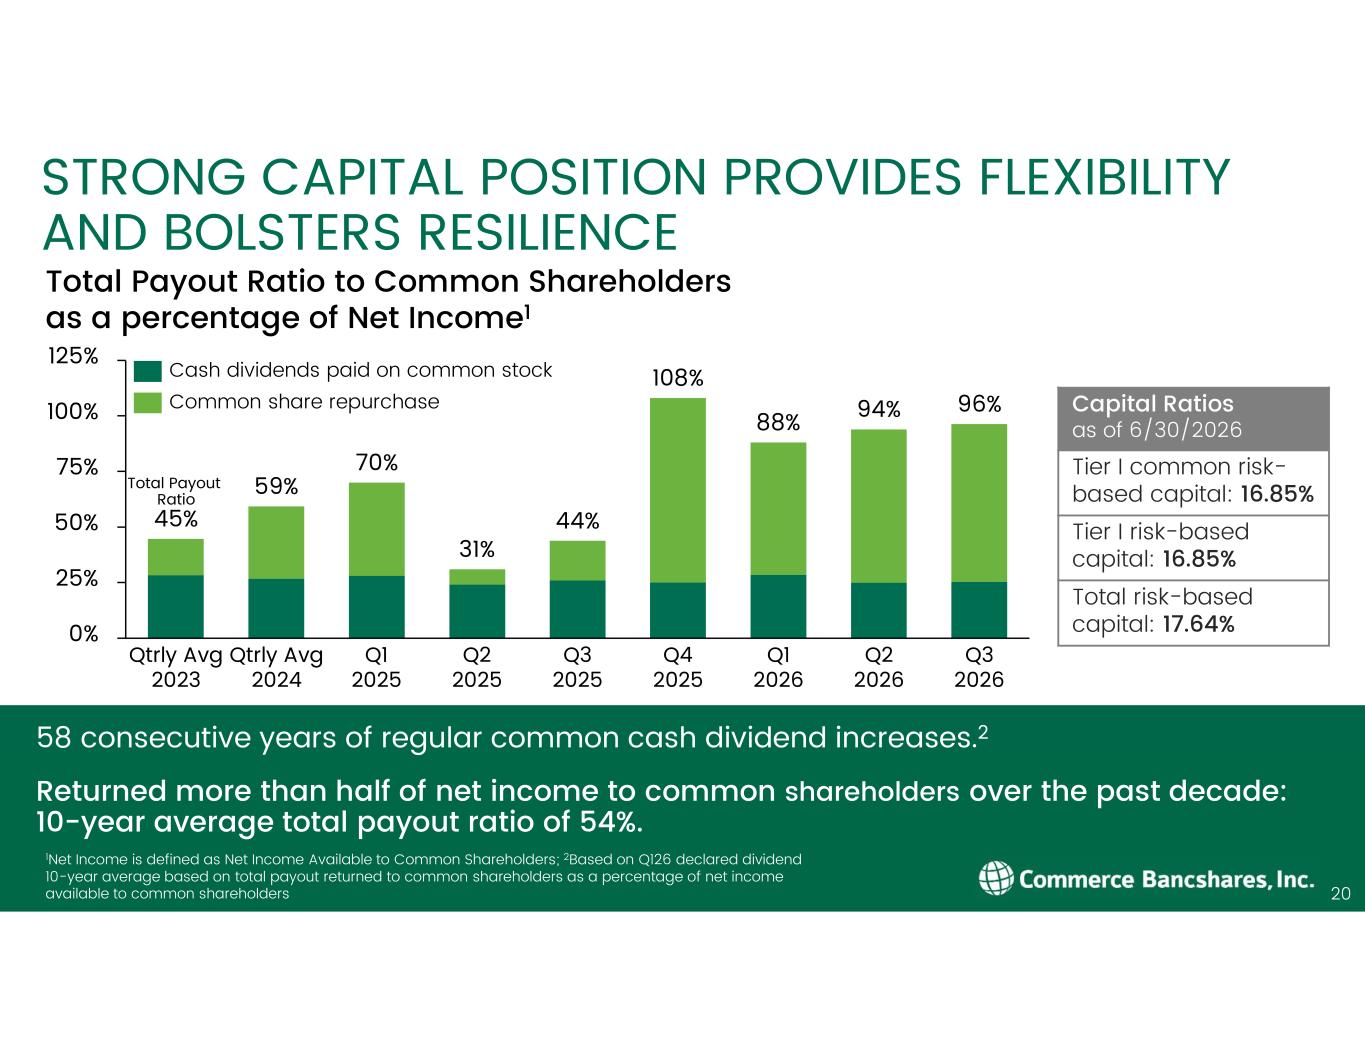
0% 25% 50% 75% 100% 125% Qtrly Avg 2023 Qtrly Avg 2024 Q1 2025 Q2 2025 Q3 2025 Q4 2025 Q1 2026 Q2 2026 Q3 2026 Total Payout Ratio 45% 59% 70% 31% 44% 108% 88% 94% 96% STRONG CAPITAL POSITION PROVIDES FLEXIBILITY AND BOLSTERS RESILIENCE Cash dividends paid on common stock Common share repurchase Total Payout Ratio to Common Shareholders as a percentage of Net Income1 1Net Income is defined as Net Income Available to Common Shareholders; 2Based on Q126 declared dividend 10-year average based on total payout returned to common shareholders as a percentage of net income available to common shareholders 20 58 consecutive years of regular common cash dividend increases.2 Returned more than half of net income to common shareholders over the past decade: 10-year average total payout ratio of 54%. Capital Ratios as of 6/30/2026 Tier I common risk- based capital: 16.85% Tier I risk-based capital: 16.85% Total risk-based capital: 17.64%
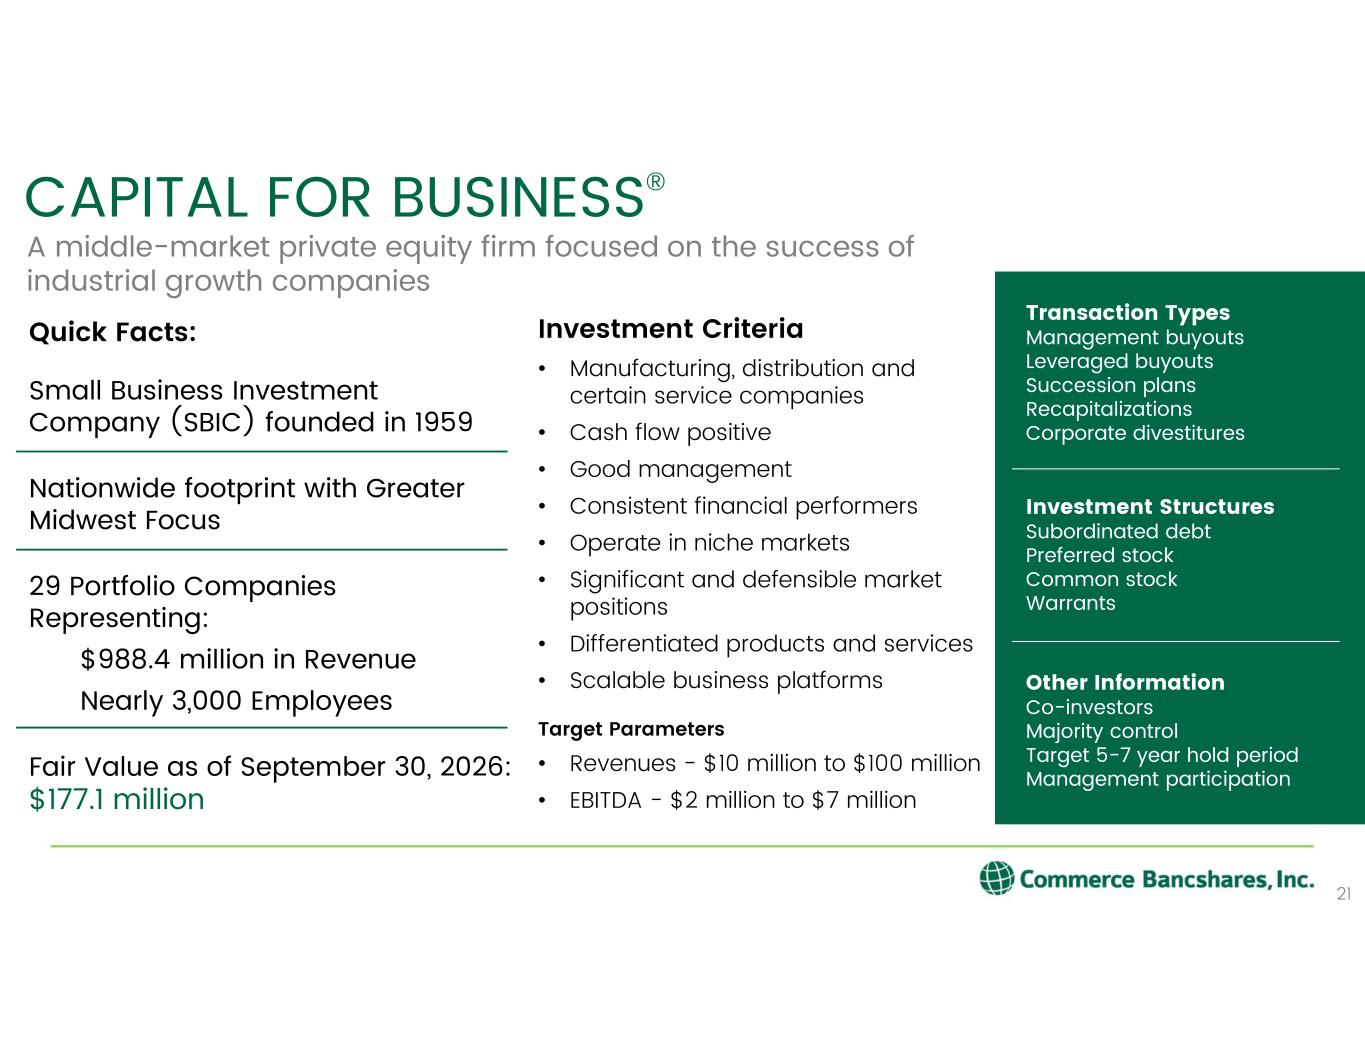
Quick Facts: Small Business Investment Company (SBIC) founded in 1959 Nationwide footprint with Greater Midwest Focus 29 Portfolio Companies Representing: $988.4 million in Revenue Nearly 3,000 Employees Fair Value as of September 30, 2026: $177.1 million Investment Criteria • Manufacturing, distribution and certain service companies • Cash flow positive • Good management • Consistent financial performers • Operate in niche markets • Significant and defensible market positions • Differentiated products and services • Scalable business platforms Target Parameters • Revenues - $10 million to $100 million • EBITDA - $2 million to $7 million CAPITAL FOR BUSINESS® A middle-market private equity firm focused on the success of industrial growth companies Transaction Types Management buyouts Leveraged buyouts Succession plans Recapitalizations Corporate divestitures Investment Structures Subordinated debt Preferred stock Common stock Warrants Other Information Co-investors Majority control Target 5-7 year hold period Management participation 21
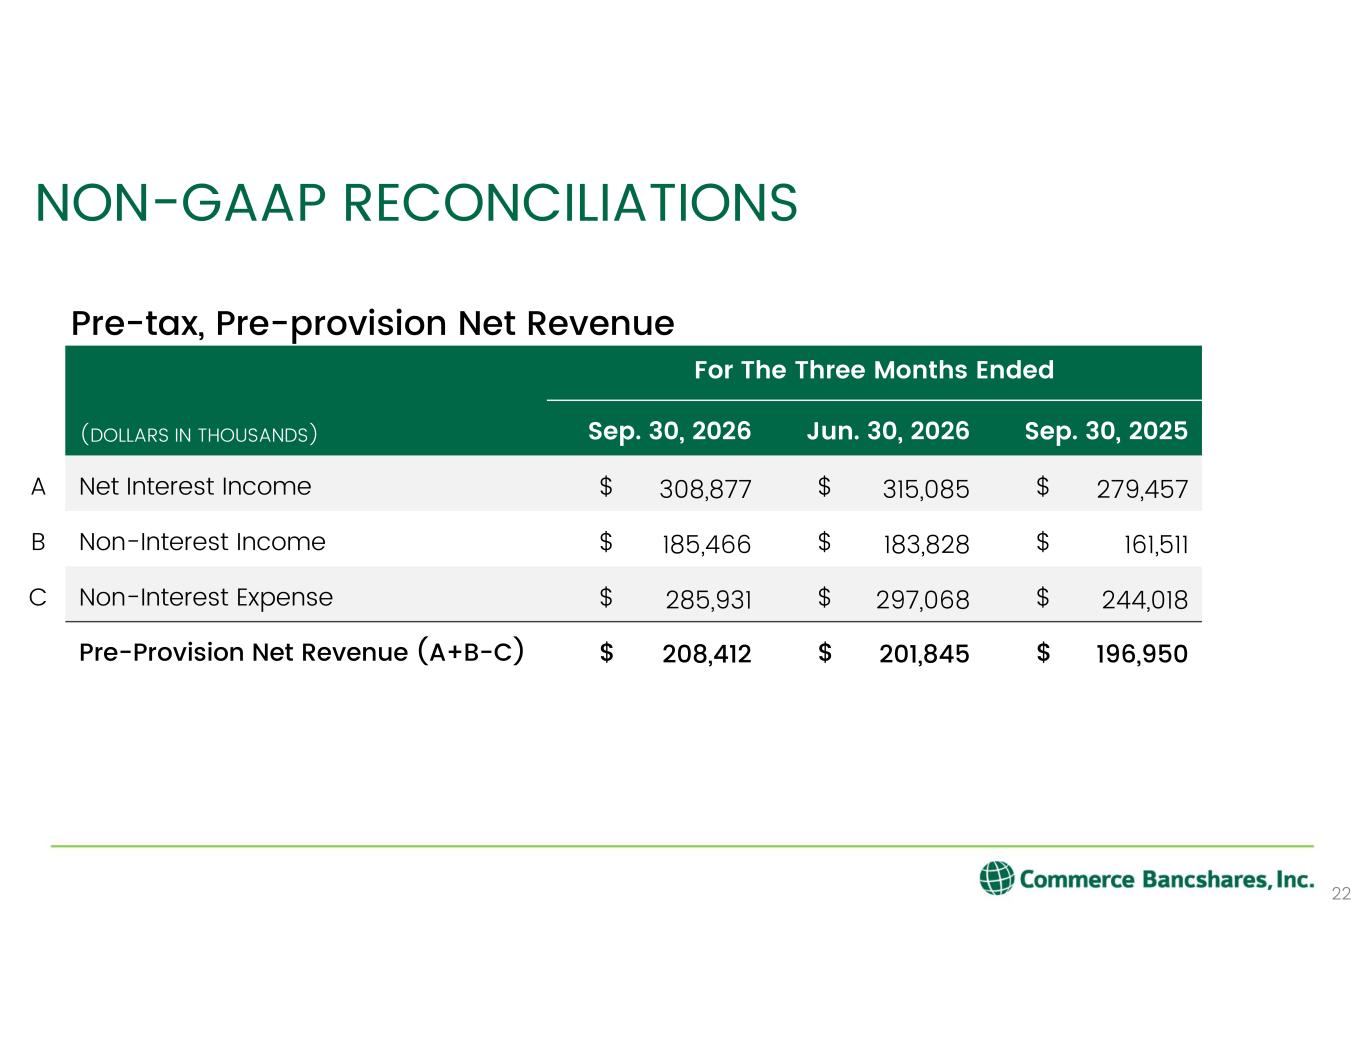
NON-GAAP RECONCILIATIONS 22 For The Three Months Ended Sep. 30, 2025Jun. 30, 2026Sep. 30, 2026(DOLLARS IN THOUSANDS) 279,457$315,085$308,877$Net Interest IncomeA 161,511$183,828$185,466$Non-Interest IncomeB 244,018$297,068$285,931$Non-Interest ExpenseC 196,950$201,845$208,412$Pre-Provision Net Revenue (A+B-C) Pre-tax, Pre-provision Net Revenue
Contact Information: Matt Burkemper Senior Vice President, Commerce Bank Corporate Development and Investor Relations 314.746.7485 Matthew.Burkemper@commercebank.com Commerce Bancshares, Inc. Investor Relations website: http://investor.commercebank.com/