.2 CMC Announces Acquisition of Foley Products Company (Foley) October 2025
Forward-Looking Statements This presentation contains forward-looking statements within the meaning of the federal securities laws with respect to the proposed acquisitions of Concrete Pipe & Precast ( CP&P ) and Foley Products Company ( Foley ) and the timing thereof, the ability to obtain regulatory approvals and meet other closing conditions for the proposed acquisitions, the expected benefits of the proposed acquisitions, general economic conditions, key macro-economic drivers that impact our business, the effects of ongoing trade actions, the effects of continued pressure on the liquidity of our customers, potential synergies and growth provided by acquisitions and strategic investments, demand for our products, shipment volumes, metal margins, the ability to operate our steel mills at full capacity, particularly during periods of domestic mill start-ups, future availability and cost of supplies of raw materials and energy for our operations, growth rates in certain reportable segments, product margins within our Emerging Businesses Group segment, share repurchases, legal proceedings, construction activity, international trade, the impact of geopolitical conditions, capital expenditures, tax credits, our liquidity and our ability to satisfy future liquidity requirements, estimated contractual obligations, the expected capabilities and benefits of new facilities, anticipated benefits and the timeline for execution of our growth plan and initiatives, including our TAG operational and commercial excellence program, and our expectations or beliefs concerning future events. The statements in this presentation that are not historical statements, are forward-looking statements. These forward-looking statements can generally be identified by phrases such as we or our management “expects,” “anticipates,” “believes,” “estimates,” “future,” “intends,” “may,” “plans to,” “ought,” “could,” “will,” “should,” “likely,” “appears,” “projects,” “forecasts,” “outlook” or other similar words or phrases, as well as by discussions of strategy, plans or intentions. Our forward-looking statements are based on management’s expectations and beliefs as of the date of this presentation. Although we believe that our expectations are reasonable, we can give no assurance that these expectations will prove to have been correct, and actual results may vary materially. Except as required by law, we undertake no obligation to update, amend or clarify any forward-looking statements to reflect changed assumptions, the occurrence of anticipated or unanticipated events, new information or circumstances or any other changes. Important factors that could cause actual results to differ materially from our expectations include those described in our filings with the Securities and Exchange Commission, including, but not limited to, in Part I, Item 1A, “Risk Factors” of our annual report on Form 10-K for the fiscal year ended August 31, 2024 and Part II, Item 1A, Risk Factors of our subsequent quarterly reports on Form 10-Q, as well as the following: changes in economic conditions which affect demand for our products or construction activity generally, and the impact of such changes on the highly cyclical steel industry; rapid and significant changes in the price of metals, potentially impairing our inventory values due to declines in commodity prices or reducing the profitability of downstream contracts within our vertically integrated steel operations due to rising commodity pricing; excess capacity in our industry, particularly in China, and product availability from competing steel mills and other steel suppliers including import quantities and pricing; the impact of geopolitical conditions, including political turmoil and volatility, regional conflicts, terrorism and war on the global economy, inflation, energy supplies and raw materials; increased attention to environmental, social and governance (“ESG”) matters, including any targets or other ESG, environmental justice or regulatory initiatives; operating and start-up risks, as well as market risks associated with the commissioning of new projects could prevent us from realizing anticipated benefits and could result in a loss of all or a substantial part of our investments; impacts from global public health crises on the economy, demand for our products, global supply chain and on our operations; compliance with and changes in existing and future laws, regulations and other legal requirements and judicial decisions that govern our business, including increased environmental regulations associated with climate change and greenhouse gas emissions; involvement in various environmental matters that may result in fines, penalties or judgments; evolving remediation technology, changing regulations, possible third-party contributions, the inherent uncertainties of the estimation process and other factors that may impact amounts accrued for environmental liabilities; potential limitations in our or our customers' abilities to access credit and non-compliance with their contractual obligations, including payment obligations; activity in repurchasing shares of our common stock under our share repurchase program; financial and non-financial covenants and restrictions on the operation of our business contained in agreements governing our debt; our ability to successfully identify, consummate and integrate acquisitions and realize any or all of the anticipated synergies or other benefits of acquisitions; the effects that acquisitions may have on our financial leverage; risks associated with acquisitions generally, such as the inability to obtain, or delays in obtaining, required approvals under applicable antitrust legislation and other regulatory and third- party consents and approvals; lower than expected future levels of revenues and higher than expected future costs; failure or inability to implement growth strategies in a timely manner; the impact of goodwill or other indefinite-lived intangible asset impairment charges; the impact of long-lived asset impairment charges; currency fluctuations; global factors, such as trade measures, military conflicts and political uncertainties, including changes to current trade regulations, such as Section 232 trade tariffs and quotas, tax legislation and other regulations which might adversely impact our business; availability and pricing of electricity, electrodes and natural gas for mill operations; our ability to hire and retain key executives and other employees; competition from other materials or from competitors that have a lower cost structure or access to greater financial resources; information technology interruptions and breaches in security; our ability to make necessary capital expenditures; availability and pricing of raw materials and other items over which we exert little influence, including scrap metal, energy and insurance; unexpected equipment failures; losses or limited potential gains due to hedging transactions; litigation claims and settlements, court decisions, regulatory rulings and legal compliance risks, including risks related to the unfavorable judgment against us in the Pacific Steel Group (“PSG”) litigation; risk of injury or death to employees, customers or other visitors to our operations; and civil unrest, protests and riots. This presentation includes financial information that gives effect to the consummation of pending CP&P and Foley acquisitions. Pro forma and combined company financial information is presented for illustrative purposes only and is based on available information and certain assumptions and estimates that we believe are reasonable. The pro forma and combined company financial information may not necessarily reflect what our results of operations and financial position would have been had the transactions occurred during the periods discussed or what our results of operations and financial position will be in the future. 2A
Financial Information of CP&P and Foley; Pro Forma and Combined Company Measures This presentation contains unaudited financial information about CP&P and Foley, some of which reflects preliminary estimates and forecasts based on currently available information and management estimates. This presentation does not contain a comprehensive statement of CP&P’s or Foley’s respective actual financial results or position. Actual results may be different from this preliminary and/or forecasted information and any such changes may be material. Investors should not place undue reliance upon the preliminary estimates and forecasts. Estimates and forecasts are subject to risks and uncertainties, many of which are outside of management’s control. See “Forward-Looking Statements.” This presentation also includes pro forma and combined company forward-looking financial information that gives effect to the consummation of the acquisitions of CP&P and Foley (together, the “Acquisitions”). Pro forma and combined company forward-looking financial information included herein is presented for illustrative purposes only and is based upon available information that is preliminary in nature, as well as certain assumptions and estimates that we believe are reasonable. This pro forma and combined company forward-looking financial information may not necessarily reflect what our results of operations and financial position would have been had the Acquisitions occurred during the periods presented herein or what our results of operations and financial position will be in the future. The pro forma financial information presented herein has not been prepared and presented in accordance with the requirements of Regulation S-X. The assumptions and estimates underlying the combined company forward-looking financial information are inherently uncertain and are subject to a variety of significant business, economic and competitive risks and uncertainties that could cause actual results to differ materially from those contained in the prospective financial information, including the risks and uncertainties described under “Forward-Looking Statements” above. The Company’s auditors have not audited, reviewed, compiled or performed any procedures with respect to the accompanying financial information. Acquisition Risks Although certain information included in this presentation generally assumes consummation of the Acquisitions and we expect that the Acquisitions will result in benefits to the Company, we may be unable to consummate the Acquisitions on a timely basis or at all, and if the Acquisitions are consummated, we may not realize the anticipated benefits because of integration difficulties, increased debt and other challenges. The success of the Acquisitions will depend, in large part, on CMC’s ability to realize the anticipated benefits from the Acquisitions. 2B
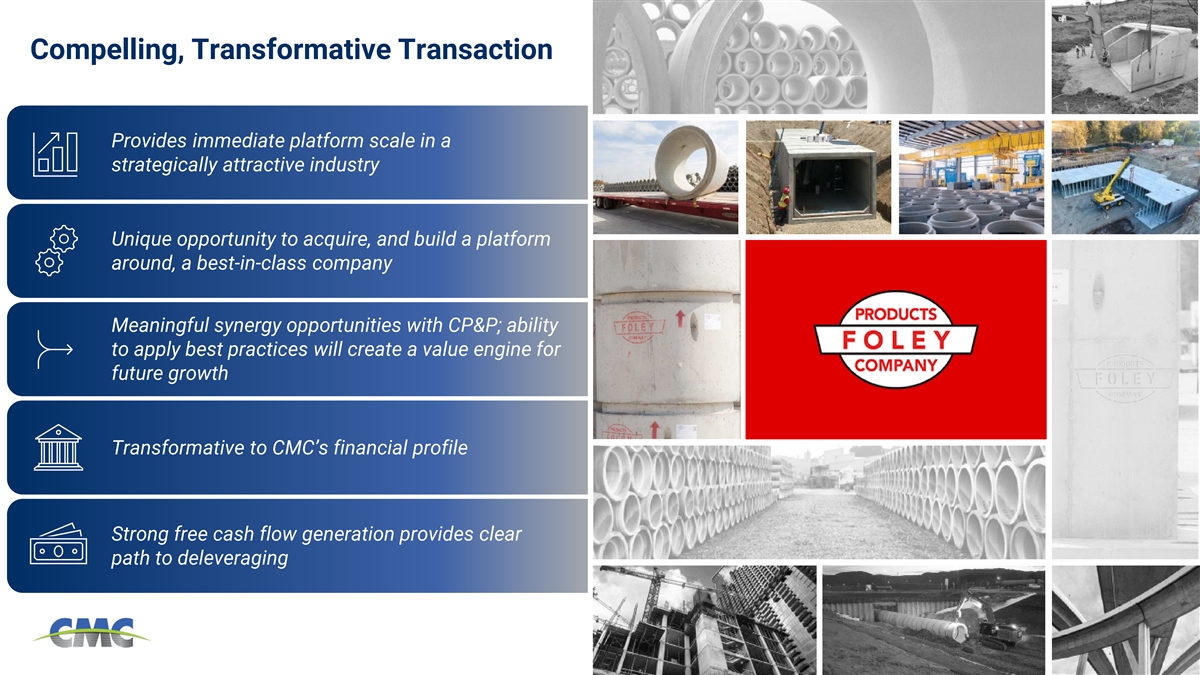
Compelling, Transformative Transaction Provides immediate platform scale in a strategically attractive industry Unique opportunity to acquire, and build a platform around, a best-in-class company Meaningful synergy opportunities with CP&P; ability to apply best practices will create a value engine for future growth Transformative to CMC’s financial profile Strong free cash flow generation provides clear path to deleveraging
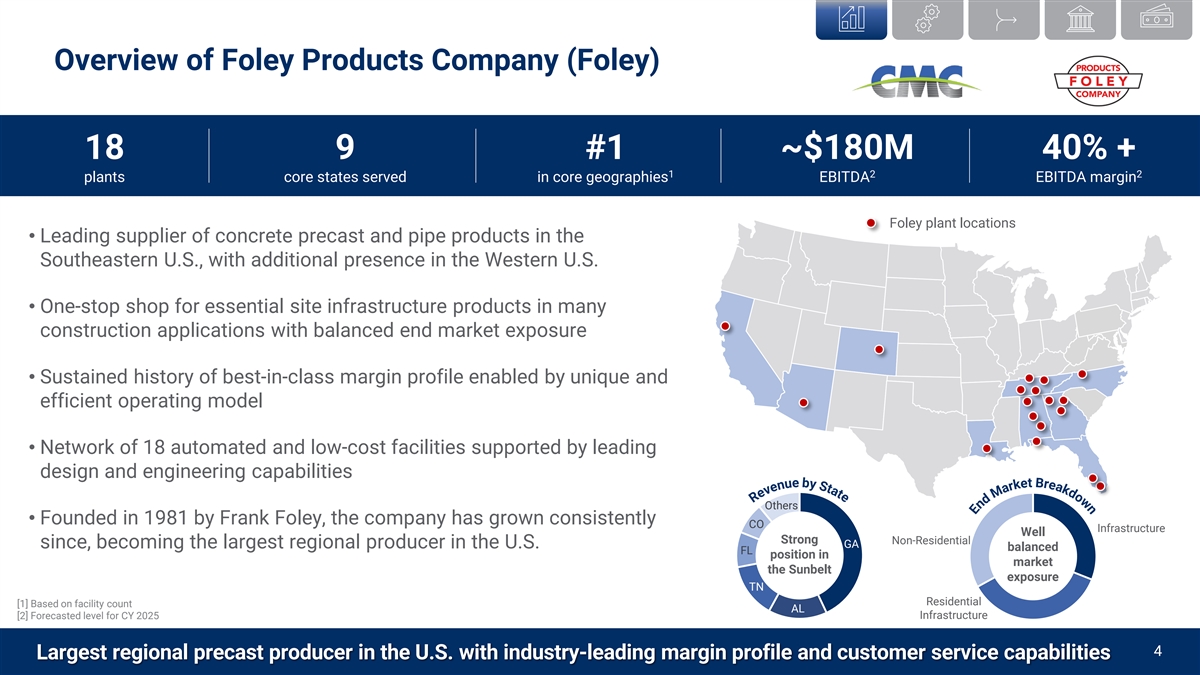
Overview of Foley Products Company (Foley) 18 9 #1 ~$180M 40% + 1 2 2 plants core states served in core geographies EBITDA EBITDA margin Foley plant locations • Leading supplier of concrete precast and pipe products in the Southeastern U.S., with additional presence in the Western U.S. • One-stop shop for essential site infrastructure products in many construction applications with balanced end market exposure • Sustained history of best-in-class margin profile enabled by unique and efficient operating model • Network of 18 automated and low-cost facilities supported by leading design and engineering capabilities Others • Founded in 1981 by Frank Foley, the company has grown consistently CO Infrastructure Well Strong Non-Residential GA since, becoming the largest regional producer in the U.S. balanced FL position in market the Sunbelt exposure TN Residential [1] Based on facility count AL Infrastructure [2] Forecasted level for CY 2025 4 Largest regional precast producer in the U.S. with industry-leading margin profile and customer service capabilities
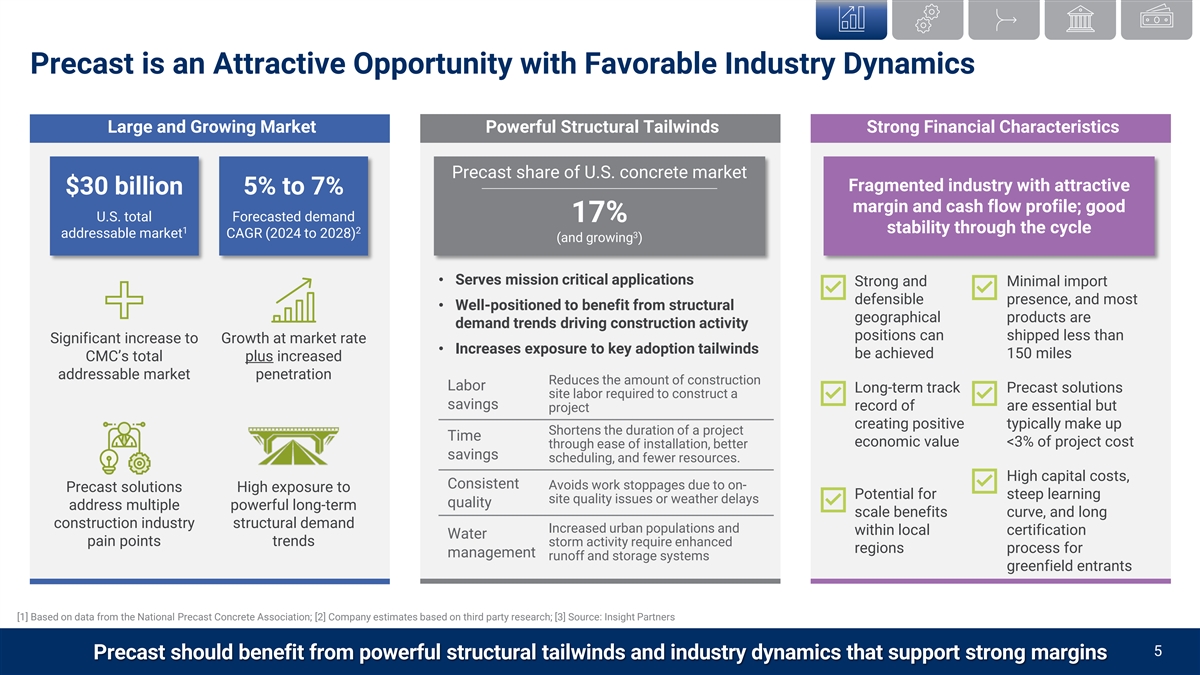
Precast is an Attractive Opportunity with Favorable Industry Dynamics Large and Growing Market Powerful Structural Tailwinds Strong Financial Characteristics Precast share of U.S. concrete market Fragmented industry with attractive $30 billion 5% to 7% margin and cash flow profile; good U.S. total Forecasted demand 17% 1 2 stability through the cycle addressable market CAGR (2024 to 2028) 3 (and growing ) • Serves mission critical applications Strong and Minimal import defensible presence, and most • Well-positioned to benefit from structural geographical products are demand trends driving construction activity positions can shipped less than Significant increase to Growth at market rate • Increases exposure to key adoption tailwinds be achieved 150 miles CMC’s total plus increased addressable market penetration Reduces the amount of construction Labor Long-term track Precast solutions site labor required to construct a savings record of are essential but project creating positive typically make up Shortens the duration of a project Time economic value <3% of project cost through ease of installation, better savings scheduling, and fewer resources. High capital costs, Consistent Avoids work stoppages due to on- Precast solutions High exposure to Potential for steep learning site quality issues or weather delays quality address multiple powerful long-term scale benefits curve, and long construction industry structural demand Increased urban populations and within local certification Water pain points trends storm activity require enhanced regions process for management runoff and storage systems greenfield entrants [1] Based on data from the National Precast Concrete Association; [2] Company estimates based on third party research; [3] Source: Insight Partners CMC Acquires X 5 Precast should benefit from powerful structural tailwinds and industry dynamics that support strong margins
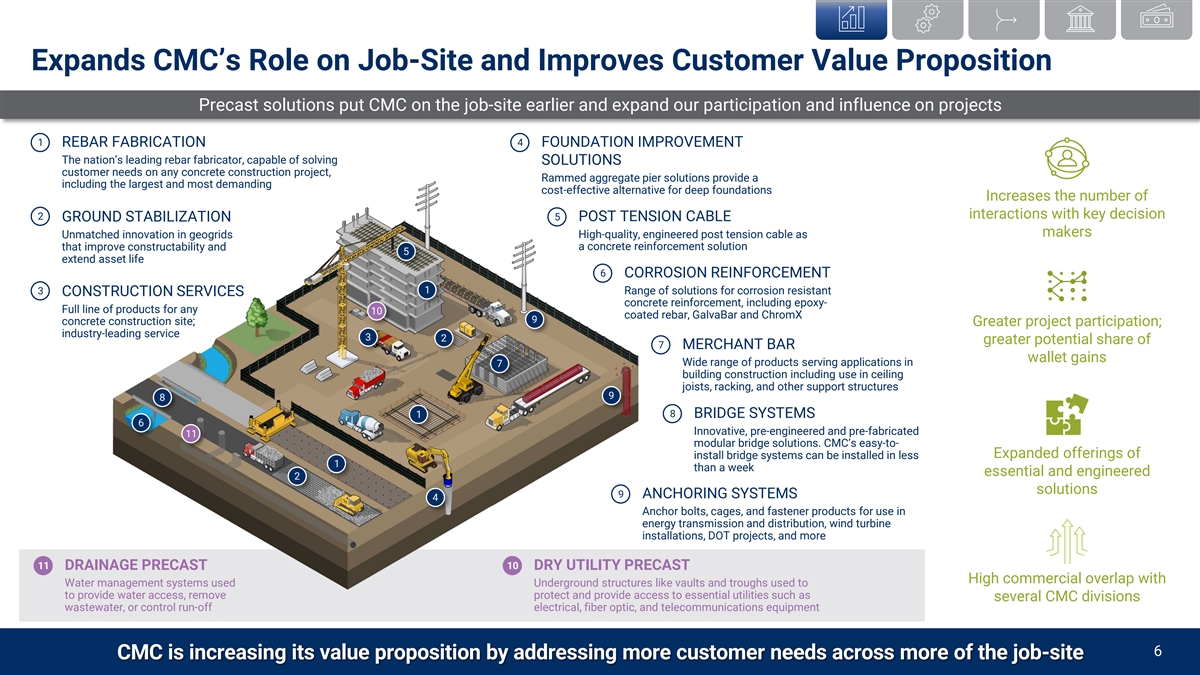
Expands CMC’s Role on Job-Site and Improves Customer Value Proposition Precast solutions put CMC on the job-site earlier and expand our participation and influence on projects 1 4 REBAR FABRICATION FOUNDATION IMPROVEMENT The nation’s leading rebar fabricator, capable of solving SOLUTIONS customer needs on any concrete construction project, Rammed aggregate pier solutions provide a including the largest and most demanding cost-effective alternative for deep foundations Increases the number of interactions with key decision 2 5 GROUND STABILIZATION POST TENSION CABLE makers Unmatched innovation in geogrids High-quality, engineered post tension cable as a concrete reinforcement solution that improve constructability and 5 extend asset life 6 CORROSION REINFORCEMENT 1 3 Range of solutions for corrosion resistant CONSTRUCTION SERVICES concrete reinforcement, including epoxy- Full line of products for any 10 coated rebar, GalvaBar and ChromX 9 concrete construction site; Greater project participation; industry-leading service 3 2 greater potential share of 7 MERCHANT BAR wallet gains Wide range of products serving applications in 7 building construction including use in ceiling joists, racking, and other support structures 9 8 1 8 BRIDGE SYSTEMS 6 Innovative, pre-engineered and pre-fabricated 11 modular bridge solutions. CMC’s easy-to- install bridge systems can be installed in less Expanded offerings of 1 than a week essential and engineered 2 solutions 9 ANCHORING SYSTEMS 4 Anchor bolts, cages, and fastener products for use in energy transmission and distribution, wind turbine installations, DOT projects, and more 11 10 DRAINAGE PRECAST DRY UTILITY PRECAST High commercial overlap with Water management systems used Underground structures like vaults and troughs used to to provide water access, remove protect and provide access to essential utilities such as several CMC divisions wastewater, or control run-off electrical, fiber optic, and telecommunications equipment CMC Acquires X 6 CMC is increasing its value proposition by addressing more customer needs across more of the job-site
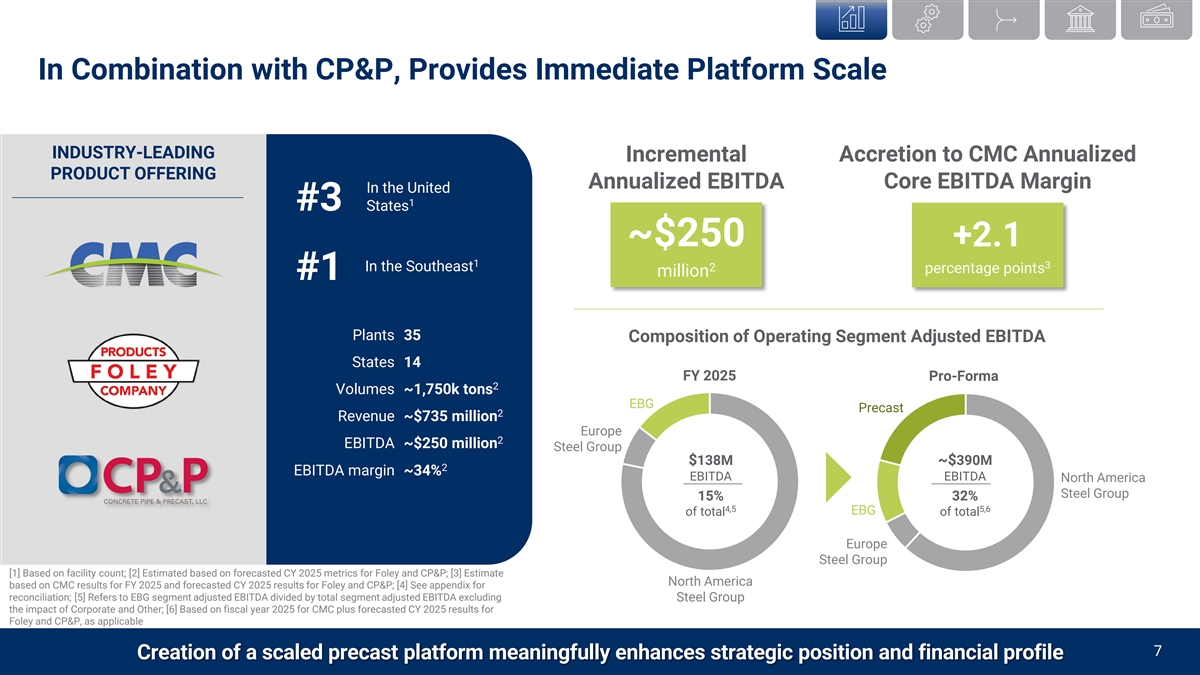
In Combination with CP&P, Provides Immediate Platform Scale INDUSTRY-LEADING Incremental Accretion to CMC Annualized PRODUCT OFFERING Annualized EBITDA Core EBITDA Margin In the United 1 #3 States ~$250 +2.1 1 3 In the Southeast 2 percentage points million #1 Plants 35 Composition of Operating Segment Adjusted EBITDA States 14 FY 2025 Pro-Forma 2 Volumes ~1,750k tons EBG Precast 2 Revenue ~$735 million Europe 2 EBITDA ~$250 million Steel Group $138M ~$390M 2 EBITDA margin ~34% EBITDA EBITDA North America Steel Group 15% 32% 4,5 5,6 EBG of total of total Europe Steel Group [1] Based on facility count; [2] Estimated based on forecasted CY 2025 metrics for Foley and CP&P; [3] Estimate North America based on CMC results for FY 2025 and forecasted CY 2025 results for Foley and CP&P; [4] See appendix for reconciliation; [5] Refers to EBG segment adjusted EBITDA divided by total segment adjusted EBITDA excluding Steel Group the impact of Corporate and Other; [6] Based on fiscal year 2025 for CMC plus forecasted CY 2025 results for Foley and CP&P, as applicable CMC Acquires X 7 Creation of a scaled precast platform meaningfully enhances strategic position and financial profile
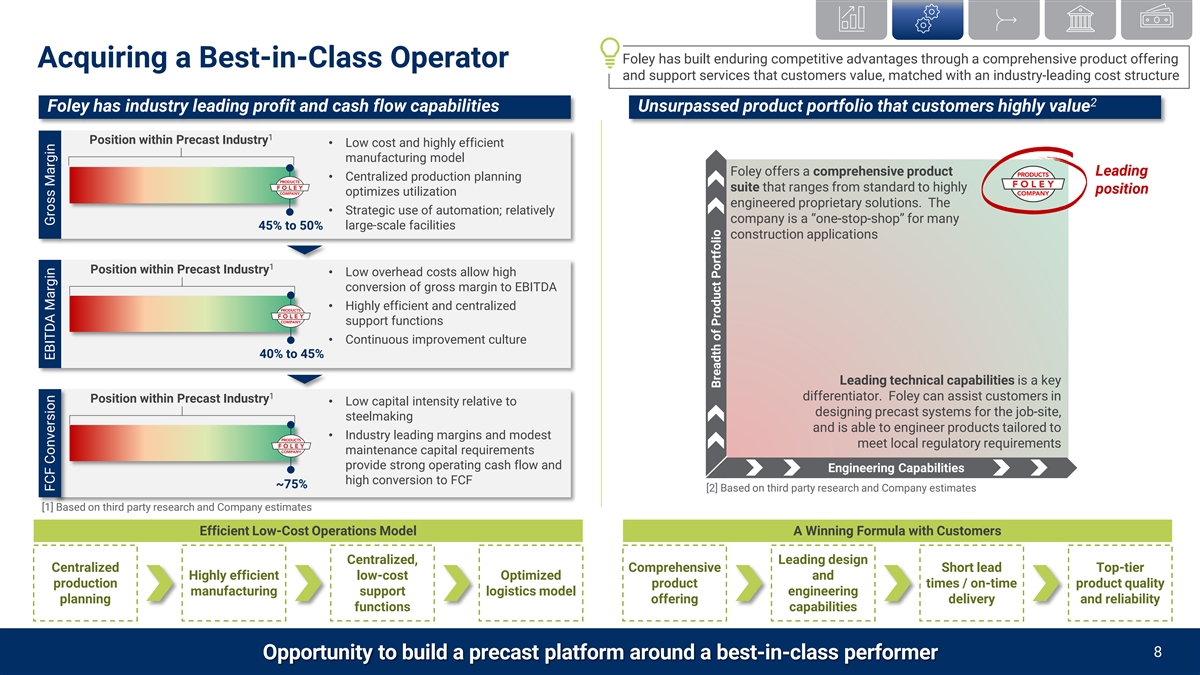
Foley has built enduring competitive advantages through a comprehensive product offering Acquiring a Best-in-Class Operator and support services that customers value, matched with an industry-leading cost structure 2 Foley has industry leading profit and cash flow capabilities Unsurpassed product portfolio that customers highly value 1 Position within Precast Industry • Low cost and highly efficient manufacturing model Foley offers a comprehensive product Leading • Centralized production planning suite that ranges from standard to highly position optimizes utilization engineered proprietary solutions. The • Strategic use of automation; relatively company is a “one-stop-shop” for many 45% to 50% large-scale facilities construction applications 1 Position within Precast Industry • Low overhead costs allow high conversion of gross margin to EBITDA • Highly efficient and centralized support functions • Continuous improvement culture 40% to 45% Leading technical capabilities is a key 1 differentiator. Foley can assist customers in Position within Precast Industry • Low capital intensity relative to designing precast systems for the job-site, steelmaking and is able to engineer products tailored to • Industry leading margins and modest meet local regulatory requirements maintenance capital requirements provide strong operating cash flow and Engineering Capabilities high conversion to FCF ~75% [2] Based on third party research and Company estimates [1] Based on third party research and Company estimates Efficient Low-Cost Operations Model A Winning Formula with Customers Centralized, Leading design Centralized Comprehensive Short lead Top-tier Highly efficient low-cost Optimized and production product times / on-time product quality manufacturing support logistics model engineering planning offering delivery and reliability functions capabilities 8 Opportunity to build a precast platform around a best-in-class performer FCF Conversion EBITDA Margin Gross Margin Breadth of Product Portfolio
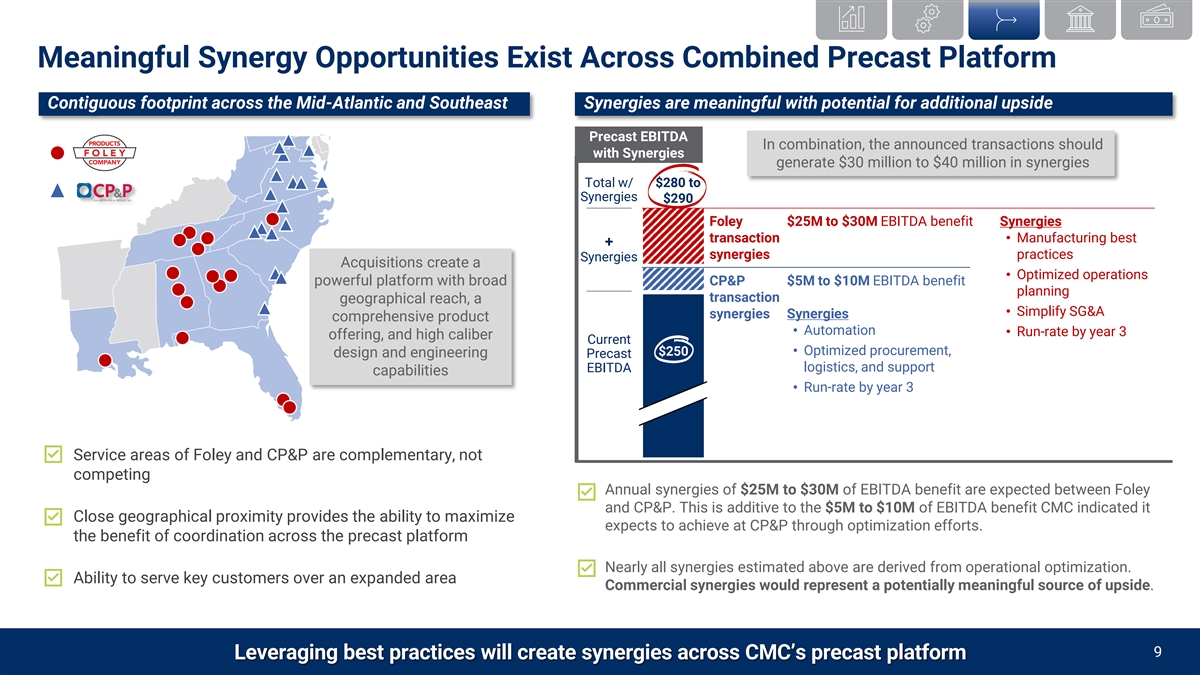
Meaningful Synergy Opportunities Exist Across Combined Precast Platform Contiguous footprint across the Mid-Atlantic and Southeast Synergies are meaningful with potential for additional upside Precast EBITDA In combination, the announced transactions should with Synergies generate $30 million to $40 million in synergies Total w/ $280 to Synergies $290 Foley $25M to $30M EBITDA benefit Synergies transaction • Manufacturing best + synergies practices Synergies Acquisitions create a • Optimized operations powerful platform with broad CP&P $5M to $10M EBITDA benefit planning transaction geographical reach, a • Simplify SG&A synergies Synergies comprehensive product • Automation • Run-rate by year 3 offering, and high caliber Current • Optimized procurement, $250 design and engineering Precast logistics, and support EBITDA capabilities • Run-rate by year 3 Service areas of Foley and CP&P are complementary, not competing Annual synergies of $25M to $30M of EBITDA benefit are expected between Foley and CP&P. This is additive to the $5M to $10M of EBITDA benefit CMC indicated it Close geographical proximity provides the ability to maximize expects to achieve at CP&P through optimization efforts. the benefit of coordination across the precast platform Nearly all synergies estimated above are derived from operational optimization. Ability to serve key customers over an expanded area Commercial synergies would represent a potentially meaningful source of upside. 9 Leveraging best practices will create synergies across CMC’s precast platform
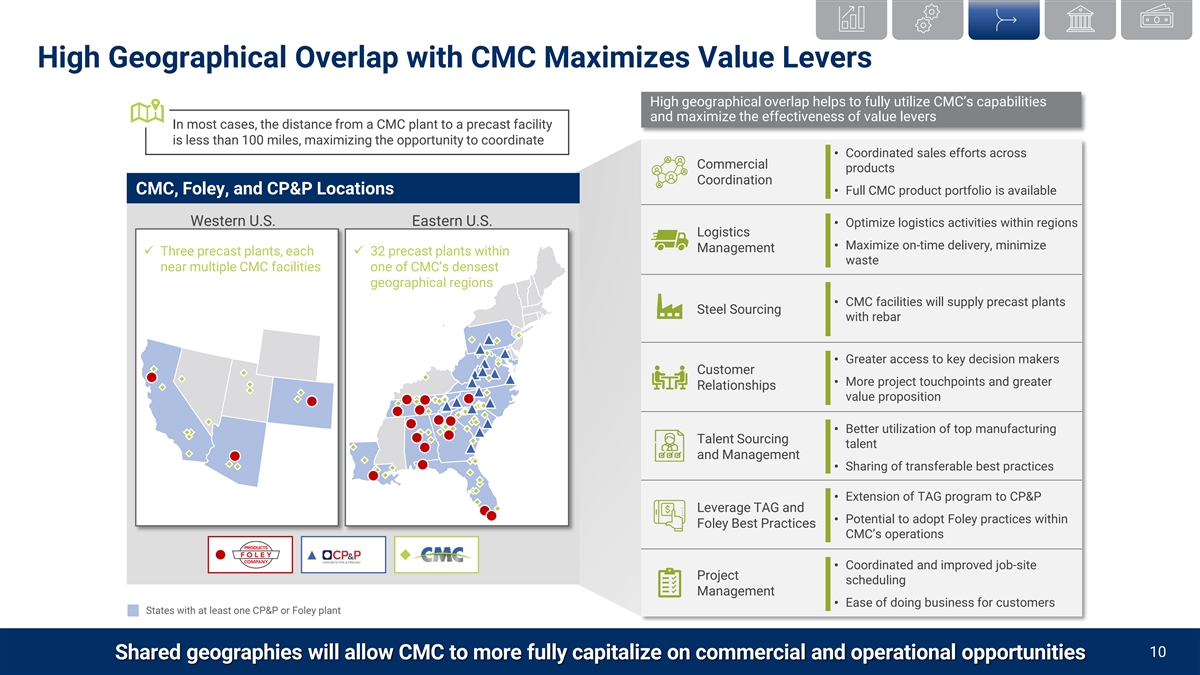
High Geographical Overlap with CMC Maximizes Value Levers High geographical overlap helps to fully utilize CMC’s capabilities and maximize the effectiveness of value levers In most cases, the distance from a CMC plant to a precast facility is less than 100 miles, maximizing the opportunity to coordinate • Coordinated sales efforts across Commercial products Coordination CMC, Foley, and CP&P Locations • Full CMC product portfolio is available Western U.S. Eastern U.S. • Optimize logistics activities within regions Logistics • Maximize on-time delivery, minimize Management ü Three precast plants, each ü 32 precast plants within waste near multiple CMC facilities one of CMC’s densest geographical regions • CMC facilities will supply precast plants Steel Sourcing with rebar • Greater access to key decision makers Customer • More project touchpoints and greater Relationships value proposition • Better utilization of top manufacturing Talent Sourcing talent and Management • Sharing of transferable best practices • Extension of TAG program to CP&P Leverage TAG and • Potential to adopt Foley practices within Foley Best Practices CMC’s operations \ • Coordinated and improved job-site Project scheduling Management • Ease of doing business for customers States with at least one CP&P or Foley plant 10 Shared geographies will allow CMC to more fully capitalize on commercial and operational opportunities
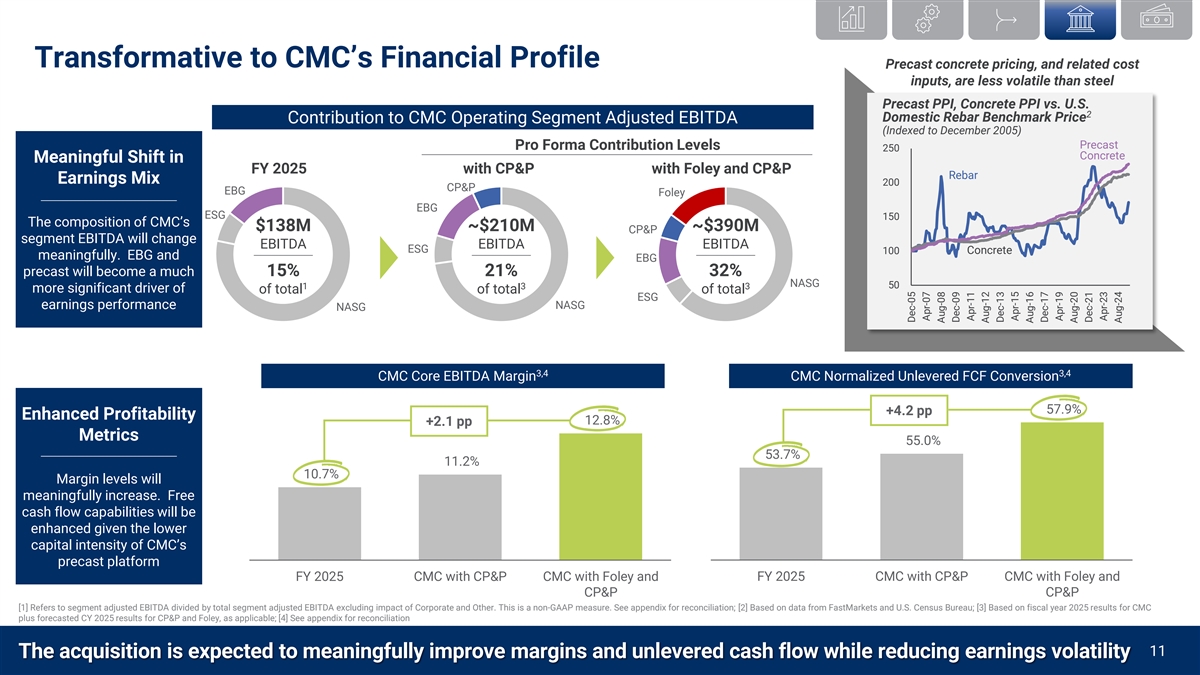
Transformative to CMC’s Financial Profile Precast concrete pricing, and related cost inputs, are less volatile than steel Precast PPI, Concrete PPI vs. U.S. 2 Domestic Rebar Benchmark Price Contribution to CMC Operating Segment Adjusted EBITDA (Indexed to December 2005) Precast Pro Forma Contribution Levels 250 Concrete Meaningful Shift in FY 2025 with CP&P with Foley and CP&P Rebar Earnings Mix 200 CP&P EBG Foley EBG ESG 150 The composition of CMC’s $138M ~$210M ~$390M CP&P segment EBITDA will change EBITDA EBITDA EBITDA ESG 100 Concrete meaningfully. EBG and EBG precast will become a much 15% 21% 32% NASG 50 1 3 3 more significant driver of of total of total of total ESG earnings performance NASG NASG 3,4 3,4 CMC Core EBITDA Margin CMC Normalized Unlevered FCF Conversion 57.9% +4.2 pp Enhanced Profitability 12.8% +2.1 pp Metrics 55.0% 53.7% 11.2% 10.7% Margin levels will meaningfully increase. Free cash flow capabilities will be enhanced given the lower capital intensity of CMC’s precast platform FY 2025 CMC with CP&P CMC with Foley and FY 2025 CMC with CP&P CMC with Foley and CP&P CP&P [1] Refers to segment adjusted EBITDA divided by total segment adjusted EBITDA excluding impact of Corporate and Other. This is a non-GAAP measure. See appendix for reconciliation; [2] Based on data from FastMarkets and U.S. Census Bureau; [3] Based on fiscal year 2025 results for CMC plus forecasted CY 2025 results for CP&P and Foley, as applicable; [4] See appendix for reconciliation 12 CMC Acquires X 11 The acquisition is expected to meaningfully improve margins and unlevered cash flow while reducing earnings volatility Dec-05 Apr-07 Aug-08 Dec-09 Apr-11 Aug-12 Dec-13 Apr-15 Aug-16 Dec-17 Apr-19 Aug-20 Dec-21 Apr-23 Aug-24
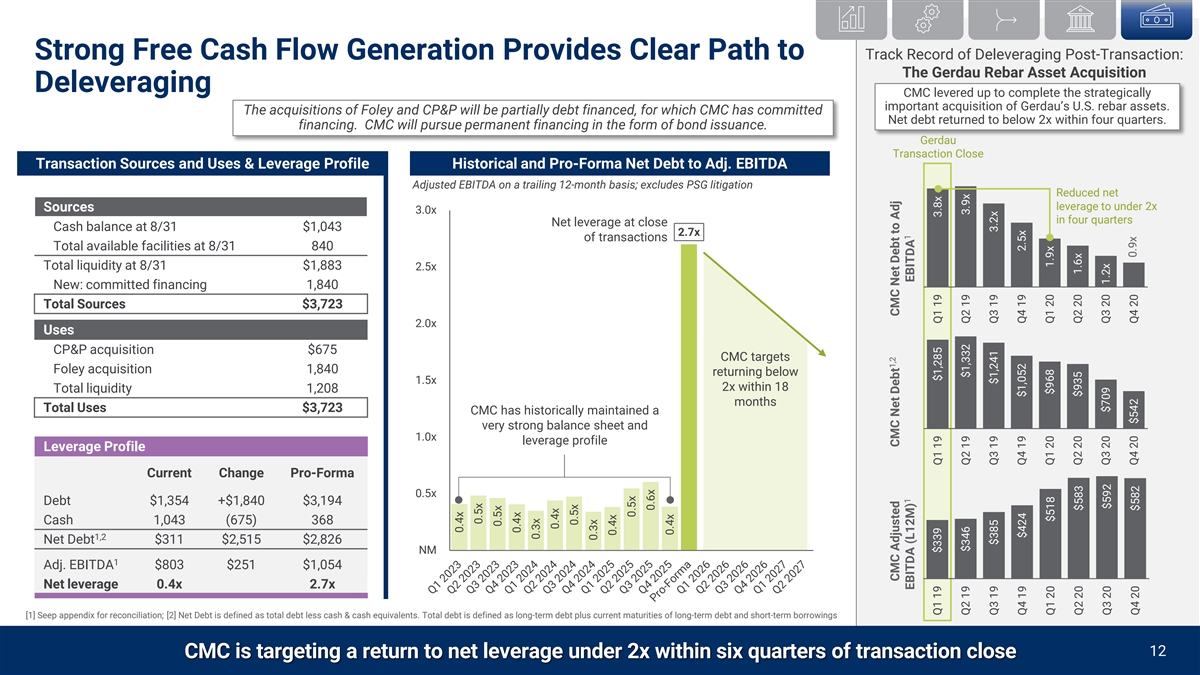
Strong Free Cash Flow Generation Provides Clear Path to Track Record of Deleveraging Post-Transaction: The Gerdau Rebar Asset Acquisition Deleveraging CMC levered up to complete the strategically important acquisition of Gerdau’s U.S. rebar assets. The acquisitions of Foley and CP&P will be partially debt financed, for which CMC has committed Net debt returned to below 2x within four quarters. financing. CMC will pursue permanent financing in the form of bond issuance. Gerdau Transaction Close Transaction Sources and Uses & Leverage Profile Historical and Pro-Forma Net Debt to Adj. EBITDA Adjusted EBITDA on a trailing 12-month basis; excludes PSG litigation Reduced net leverage to under 2x Sources 3.0x in four quarters Net leverage at close Cash balance at 8/31 $1,043 2.7x of transactions Total available facilities at 8/31 840 Total liquidity at 8/31 $1,883 2.5x New: committed financing 1,840 Total Sources $3,723 2.0x Uses CP&P acquisition $675 CMC targets Foley acquisition 1,840 returning below 1.5x 2x within 18 Total liquidity 1,208 months Total Uses $3,723 CMC has historically maintained a very strong balance sheet and 1.0x leverage profile Leverage Profile Current Change Pro-Forma 0.5x Debt $1,354 +$1,840 $3,194 Cash 1,043 (675) 368 1,2 Net Debt $311 $2,515 $2,826 NM 1 Adj. EBITDA $803 $251 $1,054 Net leverage 0.4x 2.7x [1] Seep appendix for reconciliation; [2] Net Debt is defined as total debt less cash & cash equivalents. Total debt is defined as long-term debt plus current maturities of long-term debt and short-term borrowings 13 CMC Acquires X 12 CMC is targeting a return to net leverage under 2x within six quarters of transaction close 0.4x 0.5x 0.5x 0.4x 0.3x 0.4x 0.5x 0.3x 0.4x 0.5x 0.6x 0.4x 1,2 CMC Adjusted CMC Net Debt CMC Net Debt to Adj 1 1 EBITDA (L12M) EBITDA Q1 19 $339 Q1 19 $1,285 Q1 19 3.8x Q2 19 $346 Q2 19 $1,332 Q2 19 3.9x Q3 19 $385 Q3 19 $1,241 Q3 19 3.2x Q4 19 $424 Q4 19 $1,052 Q4 19 2.5x Q1 20 $968 Q1 20 1.9x Q1 20 $518 Q2 20 $583 Q2 20 $935 Q2 20 1.6x Q3 20 $709 Q3 20 1.2x Q3 20 $592 0.9x Q4 20 $542 Q4 20 Q4 20 $582
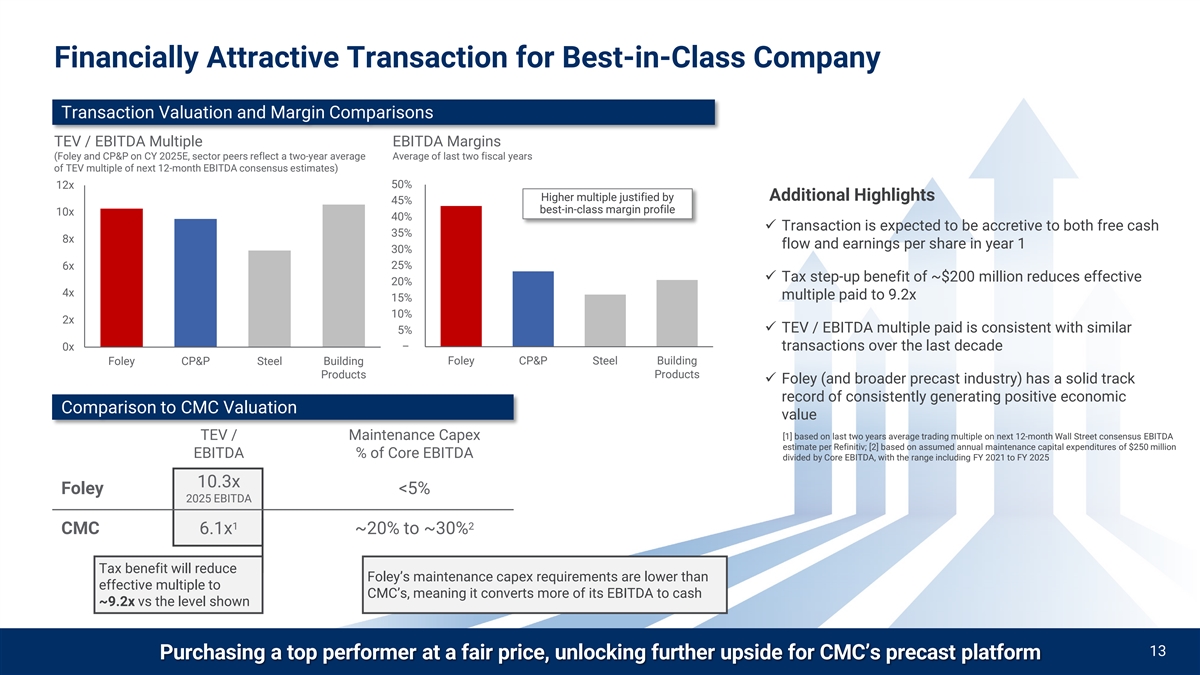
Financially Attractive Transaction for Best-in-Class Company Transaction Valuation and Margin Comparisons TEV / EBITDA Multiple EBITDA Margins (Foley and CP&P on CY 2025E, sector peers reflect a two-year average Average of last two fiscal years of TEV multiple of next 12-month EBITDA consensus estimates) 12x 50% Higher multiple justified by Additional Highlights 45% best-in-class margin profile 10x 40% ü Transaction is expected to be accretive to both free cash 35% 8x flow and earnings per share in year 1 30% 25% 6x ü Tax step-up benefit of ~$200 million reduces effective 20% 4x multiple paid to 9.2x 15% 10% 2x ü TEV / EBITDA multiple paid is consistent with similar 5% – 0x transactions over the last decade Foley CP&P Steel Building Foley CP&P Steel Building Products Products ü Foley (and broader precast industry) has a solid track record of consistently generating positive economic Comparison to CMC Valuation value TEV / Maintenance Capex [1] based on last two years average trading multiple on next 12-month Wall Street consensus EBITDA estimate per Refinitiv; [2] based on assumed annual maintenance capital expenditures of $250 million EBITDA % of Core EBITDA divided by Core EBITDA, with the range including FY 2021 to FY 2025 10.3x Foley <5% 2025 EBITDA 1 2 CMC 6.1x ~20% to ~30% Tax benefit will reduce Foley’s maintenance capex requirements are lower than effective multiple to CMC’s, meaning it converts more of its EBITDA to cash ~9.2x vs the level shown 13 Purchasing a top performer at a fair price, unlocking further upside for CMC’s precast platform
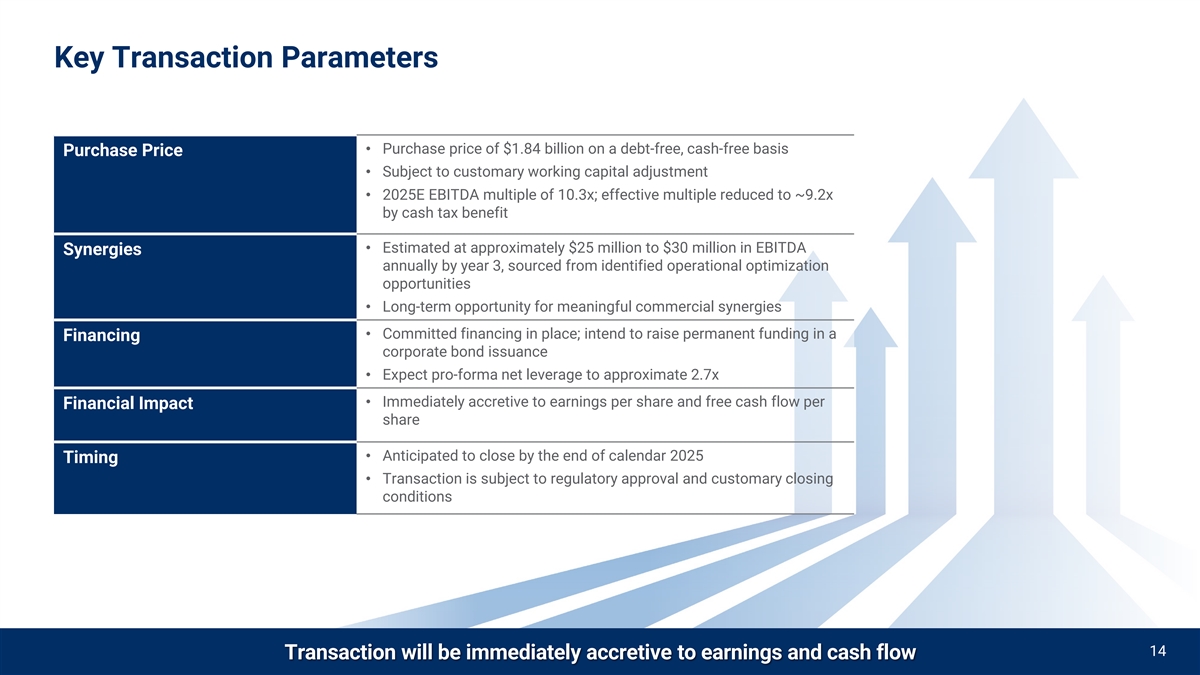
Key Transaction Parameters • Purchase price of $1.84 billion on a debt-free, cash-free basis Purchase Price • Subject to customary working capital adjustment • 2025E EBITDA multiple of 10.3x; effective multiple reduced to ~9.2x by cash tax benefit • Estimated at approximately $25 million to $30 million in EBITDA Synergies annually by year 3, sourced from identified operational optimization opportunities • Long-term opportunity for meaningful commercial synergies • Committed financing in place; intend to raise permanent funding in a Financing corporate bond issuance • Expect pro-forma net leverage to approximate 2.7x • Immediately accretive to earnings per share and free cash flow per Financial Impact share • Anticipated to close by the end of calendar 2025 Timing • Transaction is subject to regulatory approval and customary closing conditions 14 Transaction will be immediately accretive to earnings and cash flow
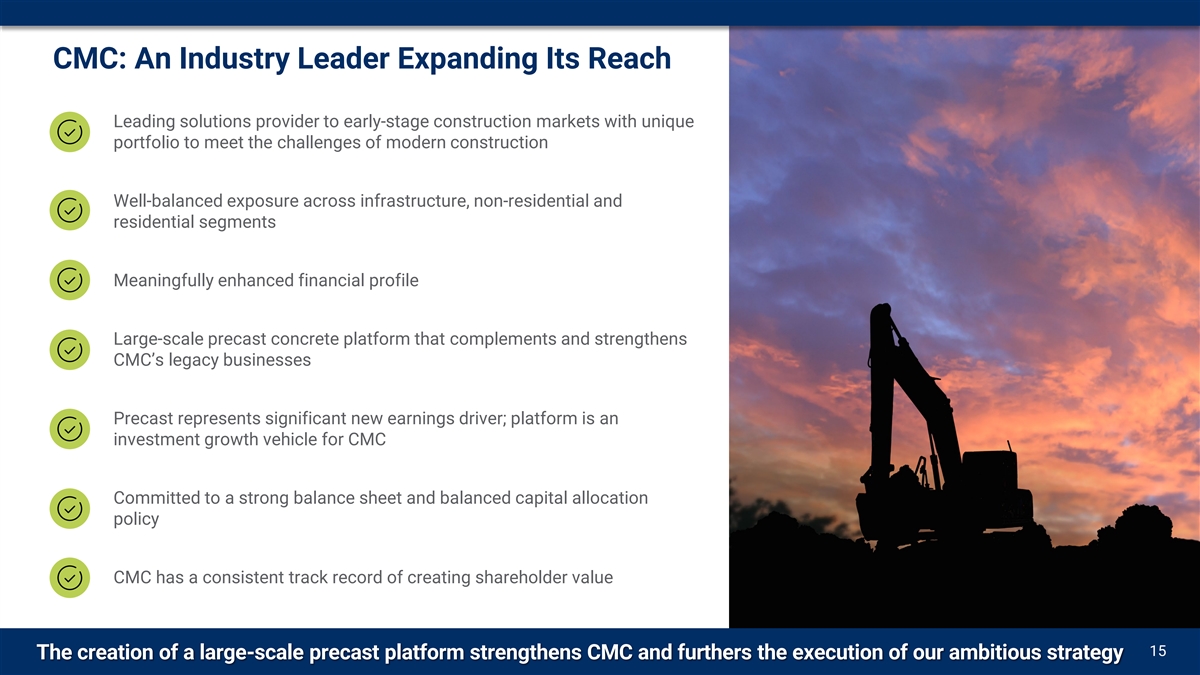
CMC: An Industry Leader Expanding Its Reach Leading solutions provider to early-stage construction markets with unique portfolio to meet the challenges of modern construction Well-balanced exposure across infrastructure, non-residential and residential segments Meaningfully enhanced financial profile Large-scale precast concrete platform that complements and strengthens CMC’s legacy businesses Precast represents significant new earnings driver; platform is an investment growth vehicle for CMC Committed to a strong balance sheet and balanced capital allocation policy CMC has a consistent track record of creating shareholder value 16 15 The creation of a large-scale precast platform strengthens CMC and furthers the execution of our ambitious strategy
Appendix: Non-GAAP Financial Reconciliations
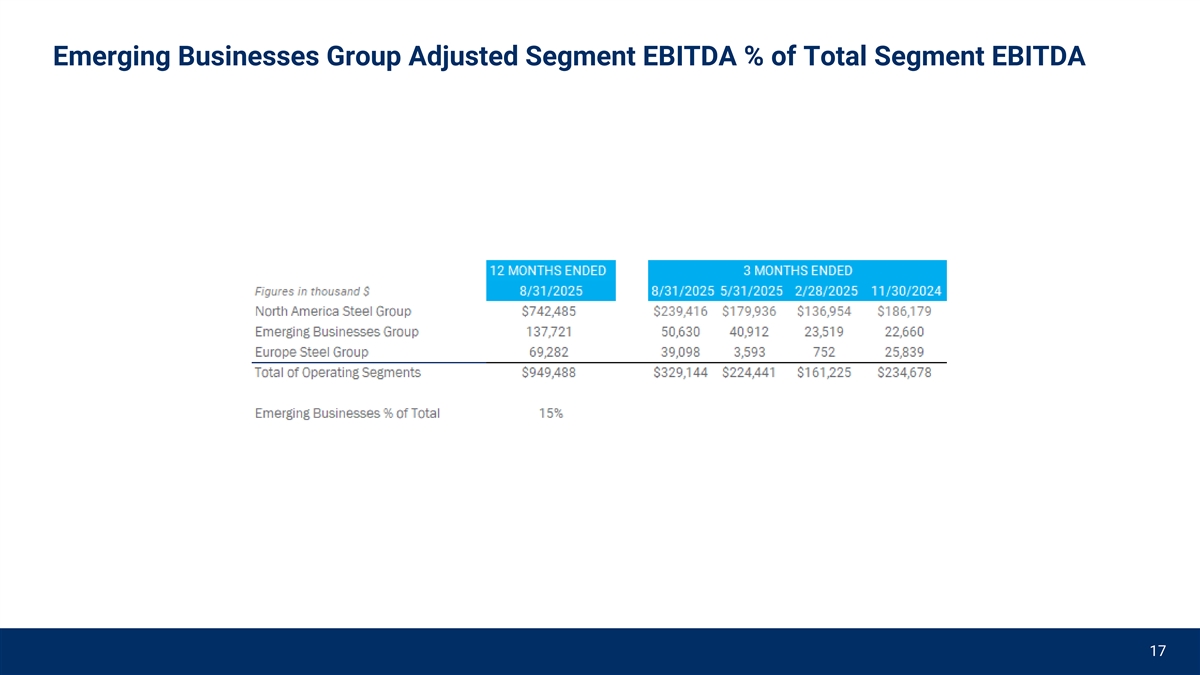
Emerging Businesses Group Adjusted Segment EBITDA % of Total Segment EBITDA 17
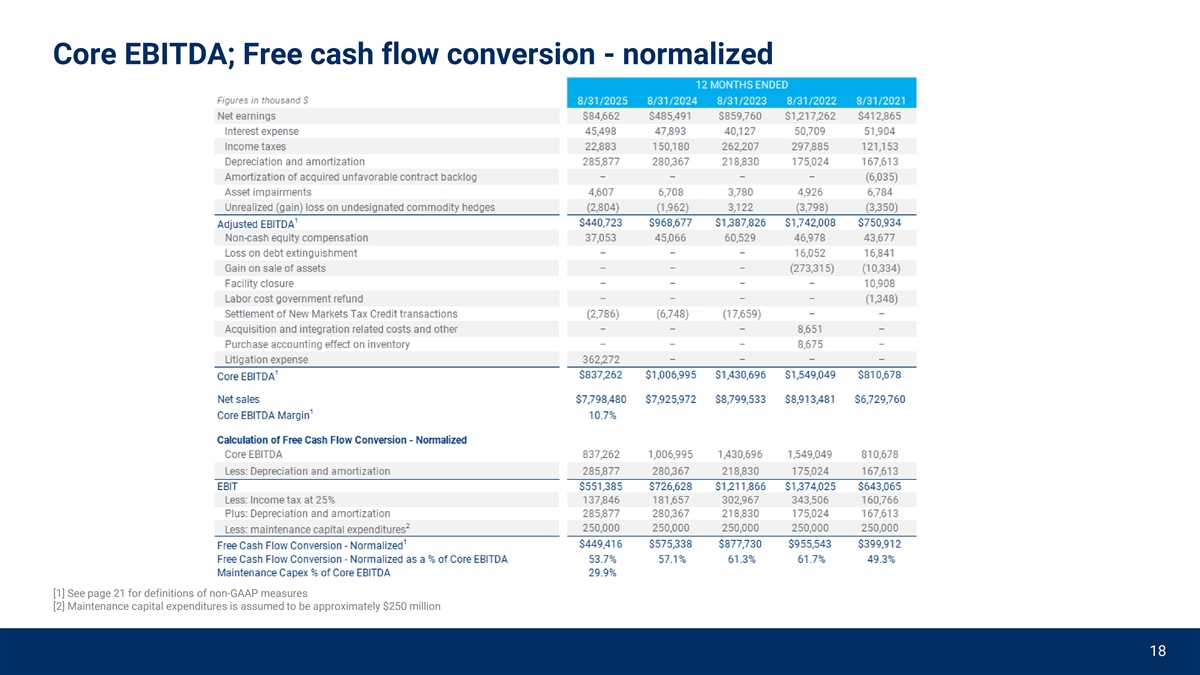
Core EBITDA; Free cash flow conversion - normalized [1] See page 21 for definitions of non-GAAP measures [2] Maintenance capital expenditures is assumed to be approximately $250 million 18
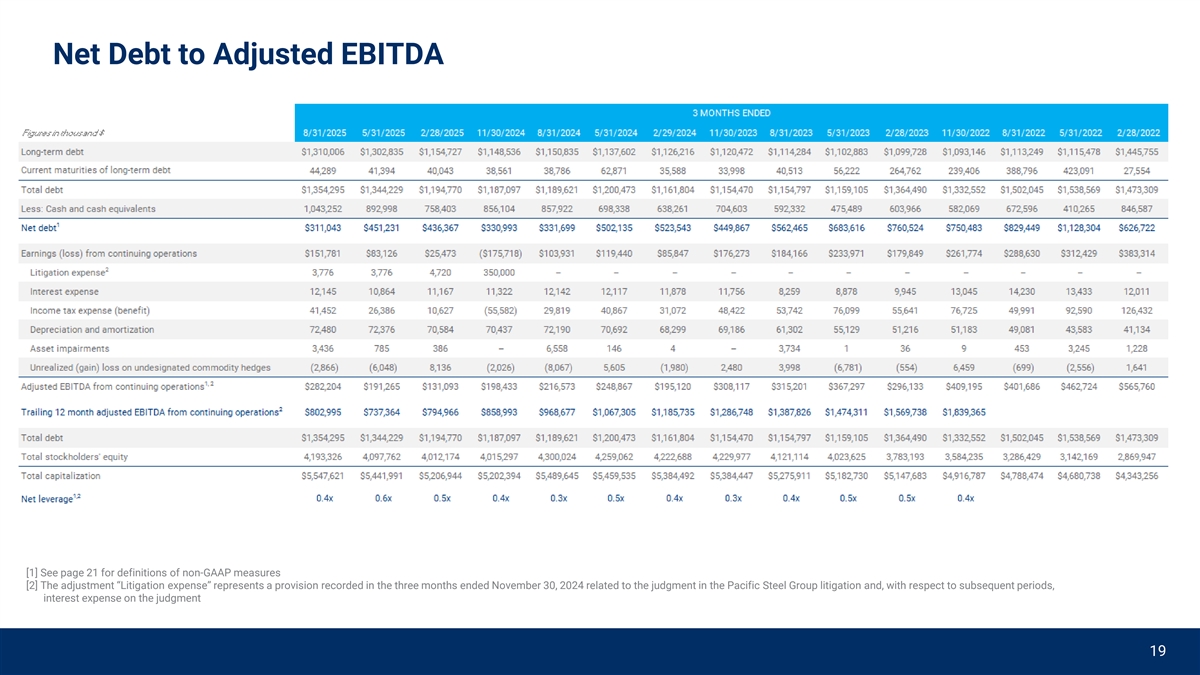
Net Debt to Adjusted EBITDA [1] See page 21 for definitions of non-GAAP measures [2] The adjustment “Litigation expense” represents a provision recorded in the three months ended November 30, 2024 related to the judgment in the Pacific Steel Group litigation and, with respect to subsequent periods, interest expense on the judgment 19
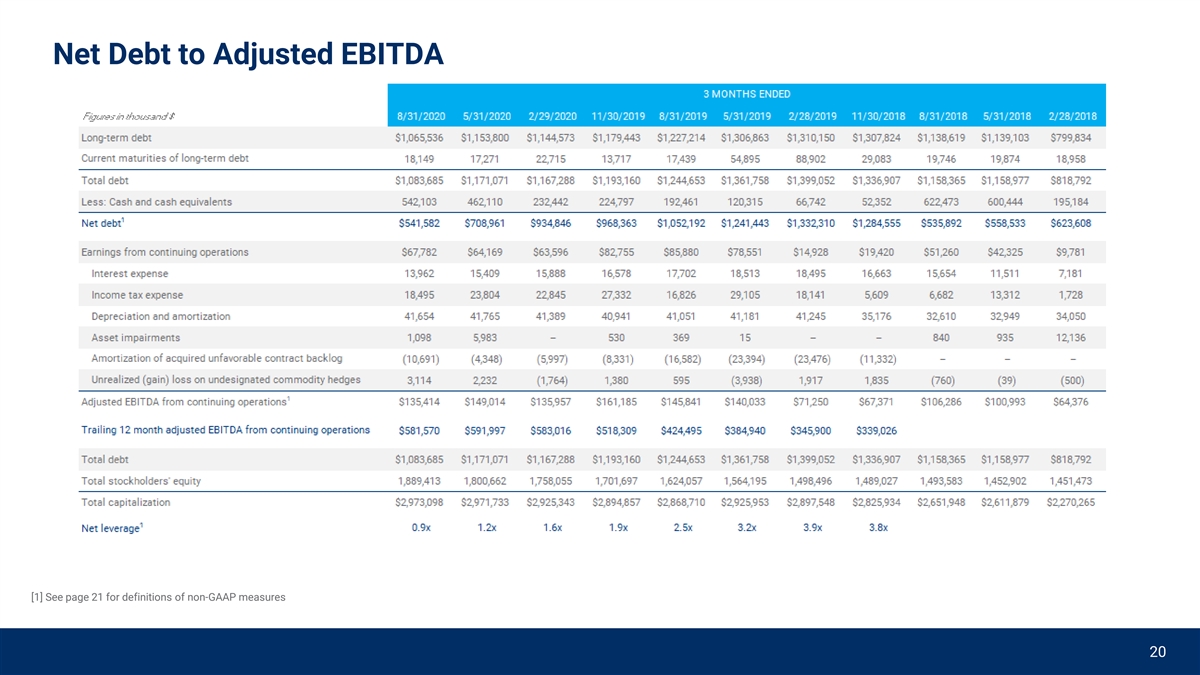
Net Debt to Adjusted EBITDA [1] See page 21 for definitions of non-GAAP measures 20 20
Definitions for non-GAAP financial measures CORE EBITDA Core EBITDA is the sum of net earnings (loss) before interest expense and income taxes. It also excludes recurring non-cash charges for depreciation and amortization, asset impairments, amortization of acquired unfavorable contract backlog, and unrealized (gain) loss on undesignated commodity hedges. Core EBITDA also excludes litigation expense, settlement for New Market Tax Credit transactions, non-cash stock-based compensation, loss on debt extinguishments, gains on sale of assets, acquisition settlements, acquisition and integration related costs, and purchase accounting effect on inventory. The adjustment “litigation expense” represents a provision recorded in the three months ended November 30, 2024 related to the judgment in the Pacific Steel Group litigation and, with respect to subsequent periods, interest expense on the judgment amount. The adjustment “settlement for New Markets Tax Credit transaction” represents the recognition of deferred revenue from 2016 and 2017 resulting from the Company’s participation in the New Markets Tax Credit program provided for in the Community Renewal Tax Relief Act of 2000 during the development of a micro mill, spooler and T-post shop located in eligible zones as determined by the Internal Revenue Service. Core EBITDA should not be considered an alternative to earnings (loss) from continuing operations or net earnings (loss), or as a better measure of liquidity than net cash flows from operating activities, as determined by GAAP. However, we believe that Core EBITDA provides relevant and useful information, which is often used by analysts, creditors and other interested parties in our industry as it allows: (i) comparison of our earnings to those of our competitors; (ii) a supplemental measure of our ongoing core performance; and (iii) the assessment of period-to-period performance trends. Additionally, Core EBITDA is the target benchmark for our annual and long-term cash incentive performance plans for management. Core EBITDA may be inconsistent with similar measures presented by other companies. ADJUSTED EBITDA Adjusted EBITDA is a non-GAAP financial measure. Adjusted EBITDA is the sum of the Company’s net earnings (loss) before interest expense, income taxes, depreciation and amortization expense, asset impairments, amortization of acquired unfavorable contract backlog, and unrealized (gain) loss on undesignated commodity hedges. Adjusted EBITDA should not be considered as an alternative to net earnings (loss), or any other performance measure derived in accordance with GAAP. However, we believe that adjusted EBITDA provides relevant and useful information to investors as it allows: (i) a supplemental measure of our ongoing performance and (ii) the assessment of period-to-period performance trends. Management uses adjusted EBITDA to evaluate our financial performance. Adjusted EBITDA may be inconsistent with similar measures presented by other companies. During the fourth fiscal quarter of 2025, the Company modified its method of calculating adjusted EBITDA to exclude the impact of unrealized gains and losses on undesignated commodity derivatives. This change was primarily driven by heightened volatility in copper forward markets, which introduced significant non-cash fluctuations unrelated to core operations. By removing this volatility, the revised metric provides a more representative view of operating performance and cash-generating capability. Accordingly, the Company evaluated the impact of this change on prior-period disclosures and has recast adjusted EBITDA, core EBITDA, core EBITDA margin, adjusted earnings and adjusted earnings per diluted share for all periods presented in this presentation. FREE CASH FLOW CONVERSION - NORMALIZED Free Cash Flow Conversion – Normalized is a non-GAAP financial measure. It is calculated as Core EBITDA (as defined above) less income tax expense, which is calculated using a 25% assumed tax rate applied to net earnings before interest expense and income taxes, and estimated maintenance capital expenditures. Maintenance capital expenditures represent an estimate of the capital required to sustain ongoing operations and exclude strategic or growth-related investments. Free Cash Flow Conversion – Normalized should not be considered an alternative to net cash flows from operating activities as determined by GAAP. However, we believe this metric provides relevant and useful information to investors and other stakeholders as it reflects the Company’s ability to convert earnings into recurring, sustainable cash flows available for capital allocation. Free Cash Flow Conversion – Normalized may be inconsistent with similar measures presented by other companies. NET DEBT Net debt is defined as total debt less cash and cash equivalents. NET LEVERAGE Net leverage is defined as net debt divided by trailing 12 month adjusted EBITDA from continuing operations. 21