| Third Quarter 2025 Investor Presentation The Collection at Forsyth | Cumming, GA |
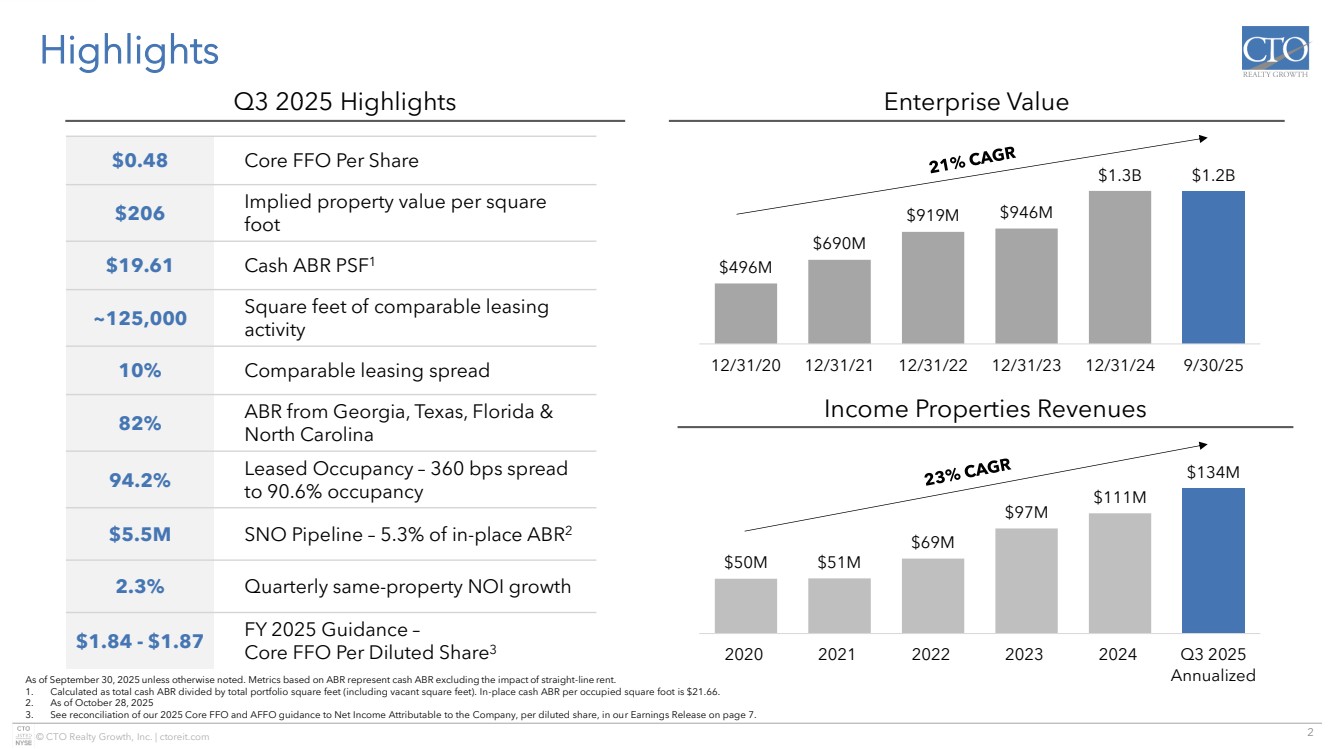
| 2 © CTO Realty Growth, Inc. | ctoreit.com $50M $51M $69M $97M $111M $134M 2020 2021 2022 2023 2024 Q3 2025 Annualized $496M $690M $919M $946M $1.3B $1.2B 12/31/20 12/31/21 12/31/22 12/31/23 12/31/24 9/30/25 Highlights Income Properties Revenues Enterprise Value As of September 30, 2025 unless otherwise noted. Metrics based on ABR represent cash ABR excluding the impact of straight-line rent. 1. Calculated as total cash ABR divided by total portfolio square feet (including vacant square feet). In-place cash ABR per occupied square foot is $21.66. 2. As of October 28, 2025 3. See reconciliation of our 2025 Core FFO and AFFO guidance to Net Income Attributable to the Company, per diluted share, in our Earnings Release on page 7. $0.48 Core FFO Per Share $206 Implied property value per square foot $19.61 Cash ABR PSF1 ~125,000 Square feet of comparable leasing activity 10% Comparable leasing spread 82% ABR from Georgia, Texas, Florida & North Carolina 94.2% Leased Occupancy – 360 bps spread to 90.6% occupancy $5.5M SNO Pipeline – 5.3% of in-place ABR2 2.3% Quarterly same-property NOI growth $1.84 - $1.87 FY 2025 Guidance – Core FFO Per Diluted Share3 Q3 2025 Highlights |
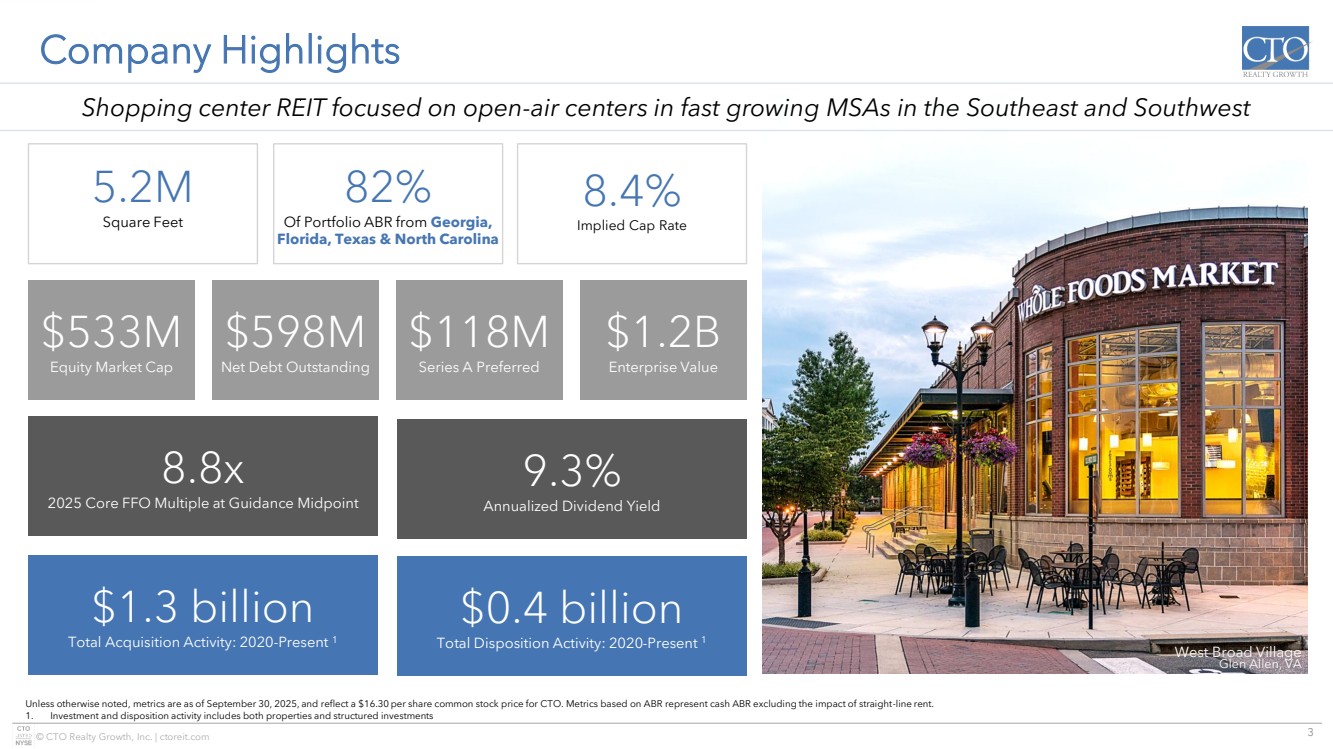
| 3 © CTO Realty Growth, Inc. | ctoreit.com Company Highlights Unless otherwise noted, metrics are as of September 30, 2025, and reflect a $16.30 per share common stock price for CTO. Metrics based on ABR represent cash ABR excluding the impact of straight-line rent. 1. Investment and disposition activity includes both properties and structured investments West Broad Village Glen Allen, VA 5.2M Square Feet 82% Of Portfolio ABR from Georgia, Florida, Texas & North Carolina 8.4% Implied Cap Rate 9.3% Annualized Dividend Yield 8.8x 2025 Core FFO Multiple at Guidance Midpoint $0.4 billion Total Disposition Activity: 2020-Present 1 $1.3 billion Total Acquisition Activity: 2020-Present 1 $598M Net Debt Outstanding $118M Series A Preferred $1.2B Enterprise Value $533M Equity Market Cap Shopping center REIT focused on open-air centers in fast growing MSAs in the Southeast and Southwest |
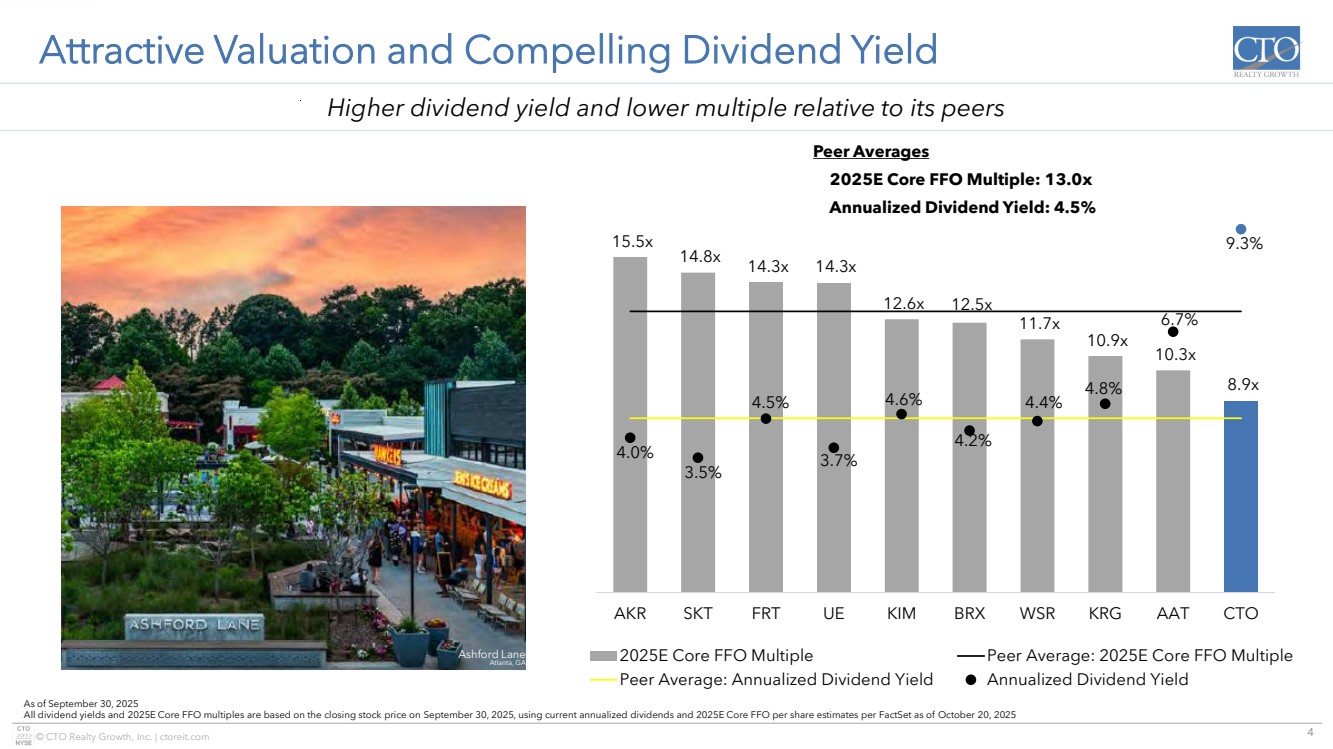
| 4 © CTO Realty Growth, Inc. | ctoreit.com Attractive Valuation and Compelling Dividend Yield As of September 30, 2025 All dividend yields and 2025E Core FFO multiples are based on the closing stock price on September 30, 2025, using current annualized dividends and 2025E Core FFO per share estimates per FactSet as of October 20, 2025 Higher dividend yield and lower multiple relative to its peers Peer Averages 2025E Core FFO Multiple: 13.0x Annualized Dividend Yield: 4.5% Ashford Lane Atlanta, GA 15.5x 14.8x 14.3x 14.3x 12.6x 12.5x 11.7x 10.9x 10.3x 8.9x 4.0% 3.5% 4.5% 3.7% 4.6% 4.2% 4.4% 4.8% 6.7% 9.3% – 1.0% 2.0% 3.0% 4.0% 5.0% 6.0% 7.0% 8.0% 9.0% 10.0% – 2.0x 4.0x 6.0x 8.0x 10.0x 12.0x 14.0x 16.0x 18.0x AKR SKT FRT UE KIM BRX WSR KRG AAT CTO 2025E Core FFO Multiple Peer Average: 2025E Core FFO Multiple Peer Average: Annualized Dividend Yield Annualized Dividend Yield |
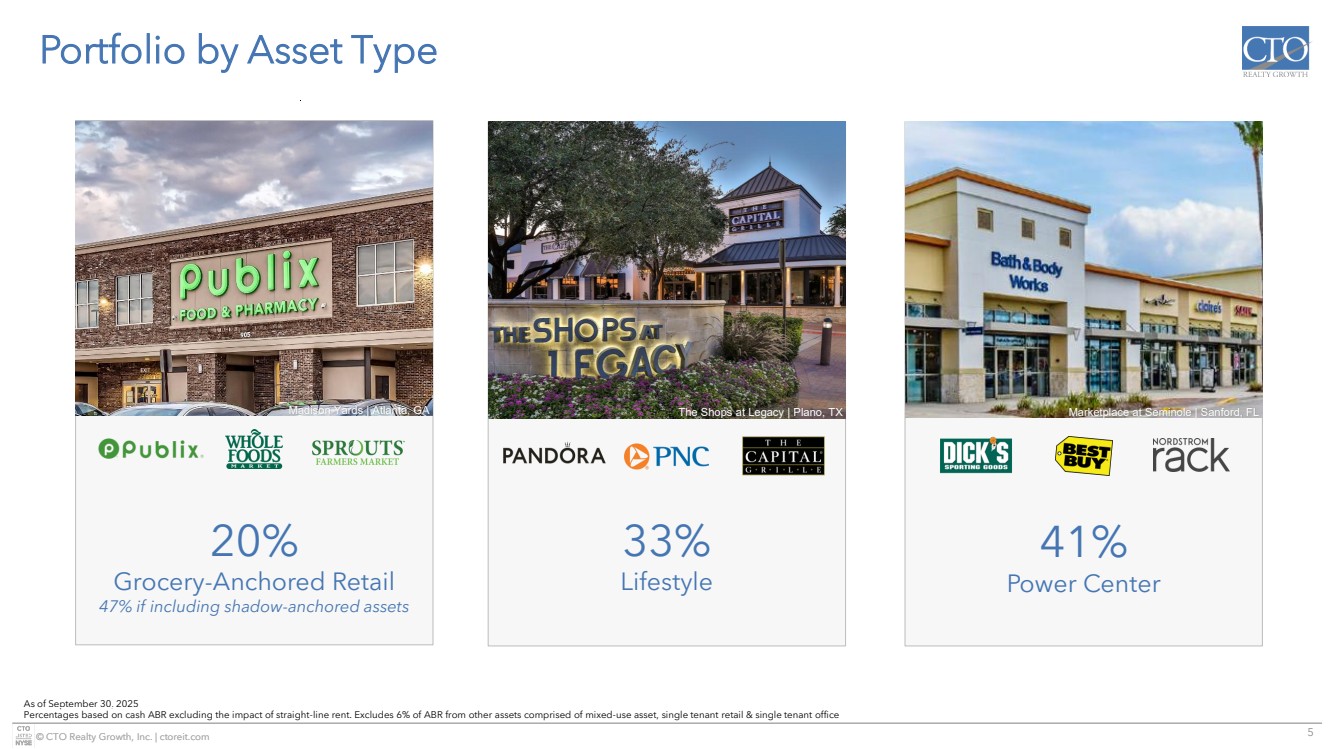
| 5 © CTO Realty Growth, Inc. | ctoreit.com Portfolio by Asset Type 20% Grocery-Anchored Retail 47% if including shadow-anchored assets 33% Lifestyle 41% Power Center As of September 30, 2025 Percentages based on cash ABR excluding the impact of straight-line rent. Excludes 6% of ABR from other assets comprised of mixed-use asset, single tenant retail & single tenant office Madison Yards | Atlanta, GA The Shops at Legacy | Plano, TX Marketplace at Seminole | Sanford, FL |
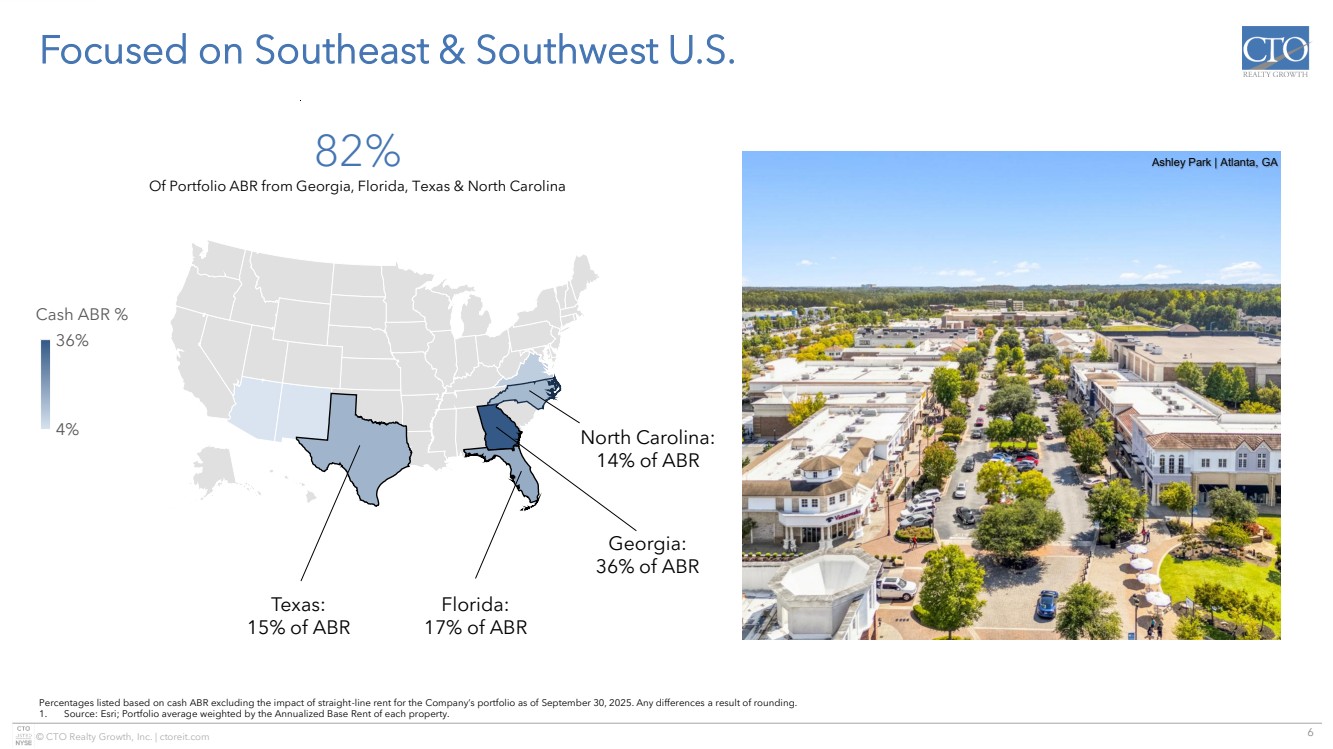
| 6 © CTO Realty Growth, Inc. | ctoreit.com © GeoNames, Microsoft, TomTom Powered by Bing 4% 36% Cash ABR % Focused on Southeast & Southwest U.S. Percentages listed based on cash ABR excluding the impact of straight-line rent for the Company’s portfolio as of September 30, 2025. Any differences a result of rounding. 1. Source: Esri; Portfolio average weighted by the Annualized Base Rent of each property. Texas: 15% of ABR Florida: 17% of ABR Georgia: 36% of ABR North Carolina: 14% of ABR 82% Ashley Park | Atlanta, GA Of Portfolio ABR from Georgia, Florida, Texas & North Carolina |
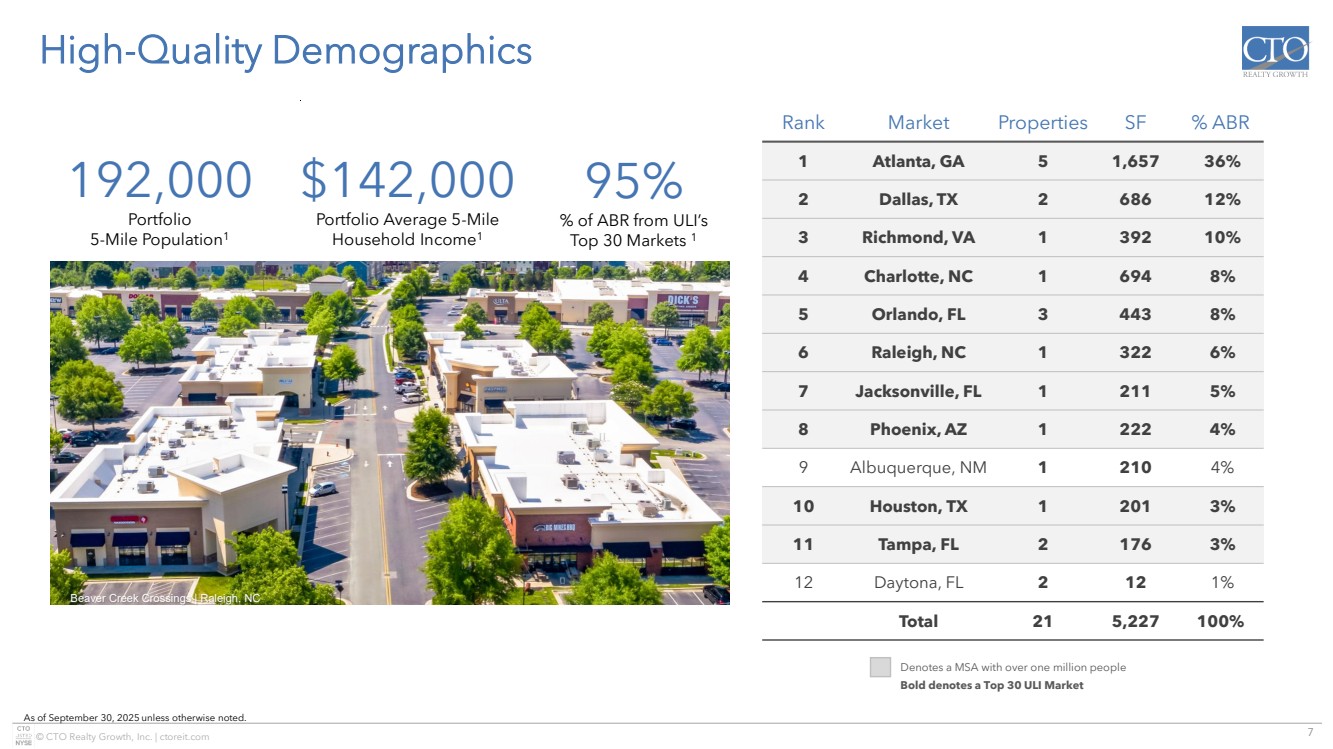
| 7 © CTO Realty Growth, Inc. | ctoreit.com High-Quality Demographics As of September 30, 2025 unless otherwise noted. Rank Market Properties SF % ABR 1 Atlanta, GA 5 1,657 36% 2 Dallas, TX 2 686 12% 3 Richmond, VA 1 392 10% 4 Charlotte, NC 1 694 8% 5 Orlando, FL 3 443 8% 6 Raleigh, NC 1 322 6% 7 Jacksonville, FL 1 211 5% 8 Phoenix, AZ 1 222 4% 9 Albuquerque, NM 1 210 4% 10 Houston, TX 1 201 3% 11 Tampa, FL 2 176 3% 12 Daytona, FL 2 12 1% Total 21 5,227 100% Denotes a MSA with over one million people Bold denotes a Top 30 ULI Market 95% % of ABR from ULI’s Top 30 Markets 1 192,000 Portfolio 5-Mile Population1 $142,000 Portfolio Average 5-Mile Household Income1 Beaver Creek Crossings | Raleigh, NC |
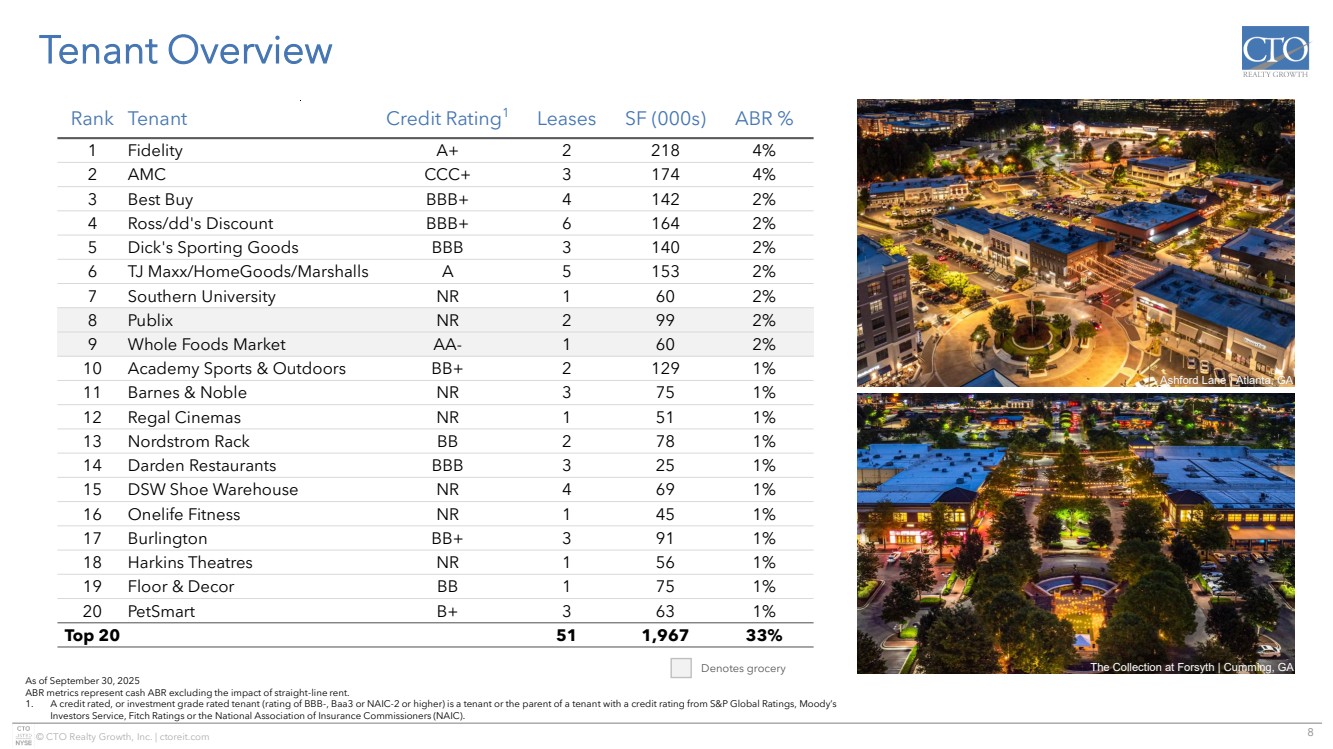
| 8 © CTO Realty Growth, Inc. | ctoreit.com Tenant Overview Rank Tenant Credit Rating1 Leases SF (000s) ABR % 1 Fidelity A+ 2 218 4% 2 AMC CCC+ 3 174 4% 3 Best Buy BBB+ 4 142 2% 4 Ross/dd's Discount BBB+ 6 164 2% 5 Dick's Sporting Goods BBB 3 140 2% 6 TJ Maxx/HomeGoods/Marshalls A 5 153 2% 7 Southern University NR 1 60 2% 8 Publix NR 2 99 2% 9 Whole Foods Market AA- 1 60 2% 10 Academy Sports & Outdoors BB+ 2 129 1% 11 Barnes & Noble NR 3 75 1% 12 Regal Cinemas NR 1 51 1% 13 Nordstrom Rack BB 2 78 1% 14 Darden Restaurants BBB 3 25 1% 15 DSW Shoe Warehouse NR 4 69 1% 16 Onelife Fitness NR 1 45 1% 17 Burlington BB+ 3 91 1% 18 Harkins Theatres NR 1 56 1% 19 Floor & Decor BB 1 75 1% 20 PetSmart B+ 3 63 1% Top 20 51 1,967 33% As of September 30, 2025 ABR metrics represent cash ABR excluding the impact of straight-line rent. 1. A credit rated, or investment grade rated tenant (rating of BBB-, Baa3 or NAIC-2 or higher) is a tenant or the parent of a tenant with a credit rating from S&P Global Ratings, Moody’s Investors Service, Fitch Ratings or the National Association of Insurance Commissioners (NAIC). Denotes grocery Ashford Lane | Atlanta, GA The Collection at Forsyth | Cumming, GA |
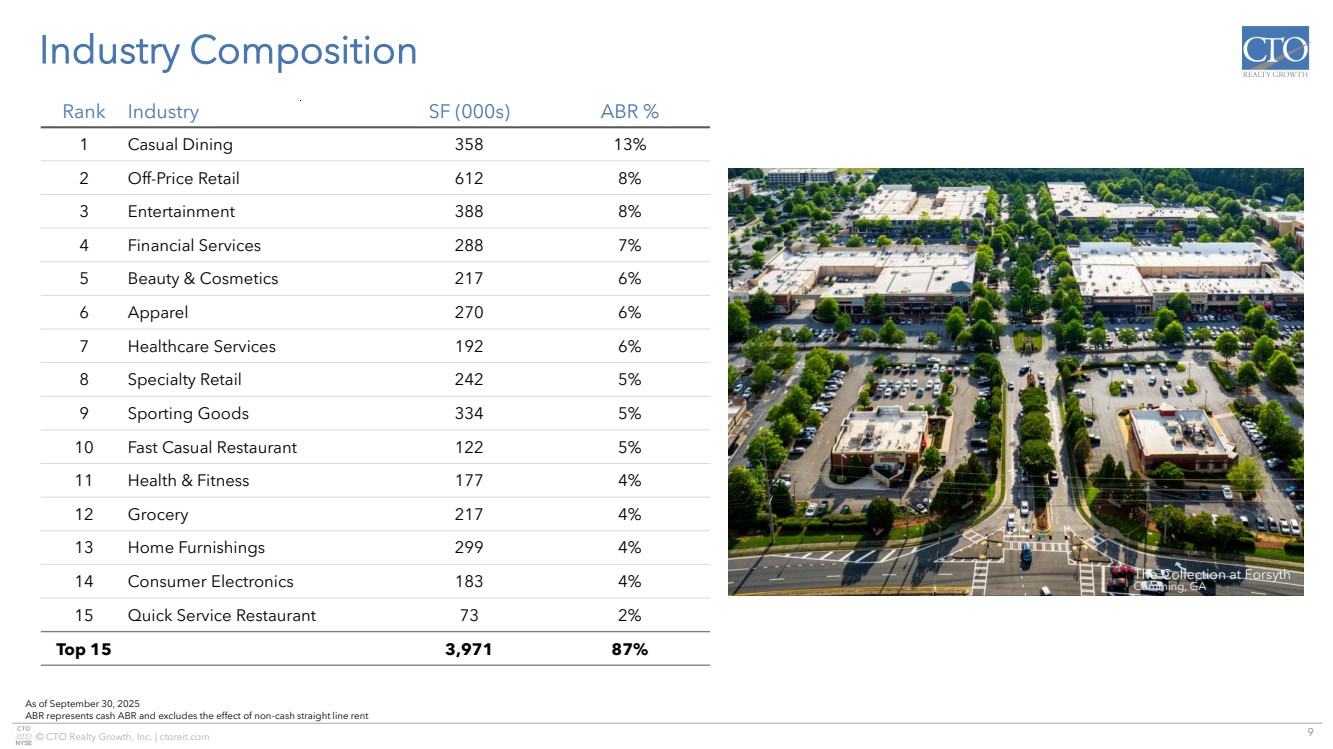
| 9 © CTO Realty Growth, Inc. | ctoreit.com Rank Industry SF (000s) ABR % 1 Casual Dining 358 13% 2 Off-Price Retail 612 8% 3 Entertainment 388 8% 4 Financial Services 288 7% 5 Beauty & Cosmetics 217 6% 6 Apparel 270 6% 7 Healthcare Services 192 6% 8 Specialty Retail 242 5% 9 Sporting Goods 334 5% 10 Fast Casual Restaurant 122 5% 11 Health & Fitness 177 4% 12 Grocery 217 4% 13 Home Furnishings 299 4% 14 Consumer Electronics 183 4% 15 Quick Service Restaurant 73 2% Top 15 3,971 87% Industry Composition As of September 30, 2025 ABR represents cash ABR and excludes the effect of non-cash straight line rent The Collection at Forsyth Cumming, GA |
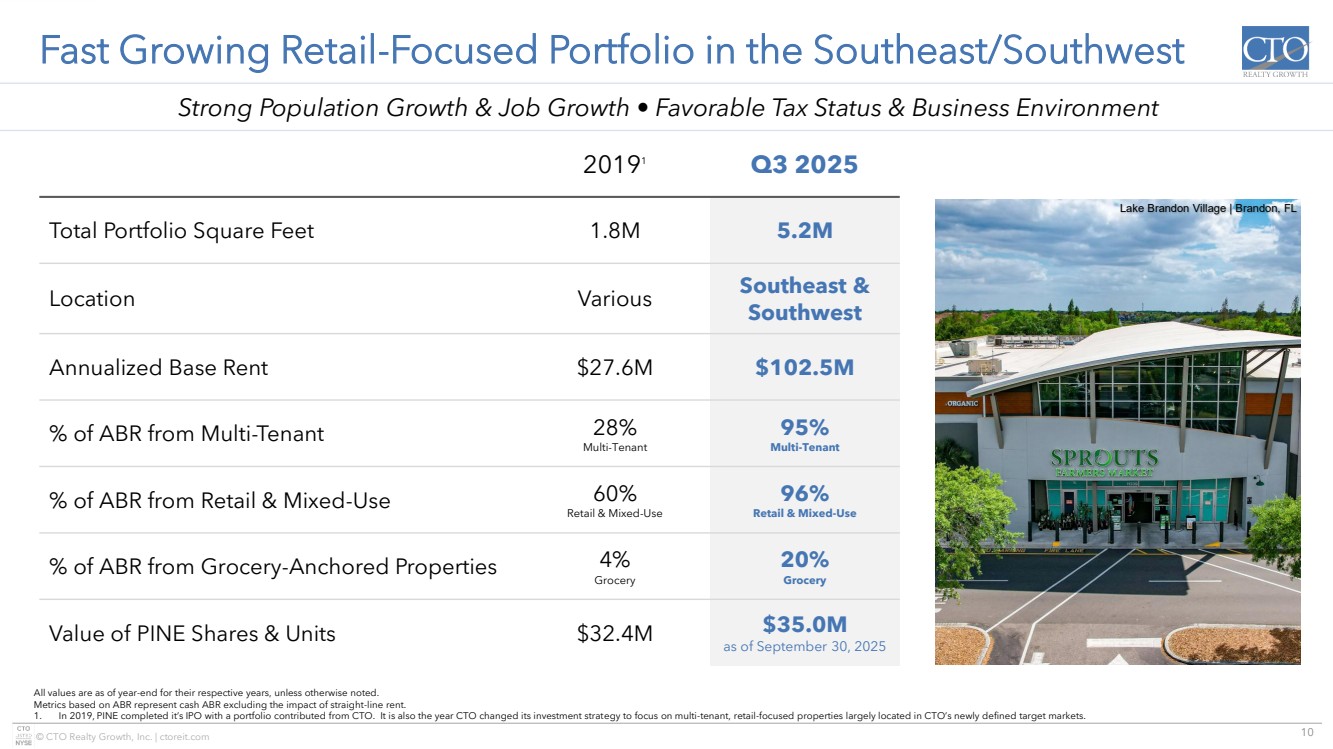
| 10 © CTO Realty Growth, Inc. | ctoreit.com Fast Growing Retail-Focused Portfolio in the Southeast/Southwest All values are as of year-end for their respective years, unless otherwise noted. Metrics based on ABR represent cash ABR excluding the impact of straight-line rent. 1. In 2019, PINE completed it’s IPO with a portfolio contributed from CTO. It is also the year CTO changed its investment strategy to focus on multi-tenant, retail-focused properties largely located in CTO’s newly defined target markets. 20191 Q3 2025 Total Portfolio Square Feet 1.8M 5.2M Location Various Southeast & Southwest Annualized Base Rent $27.6M $102.5M % of ABR from Multi-Tenant 28% Multi-Tenant 95% Multi-Tenant % of ABR from Retail & Mixed-Use 60% Retail & Mixed-Use 96% Retail & Mixed-Use % of ABR from Grocery-Anchored Properties 4% Grocery 20% Grocery Value of PINE Shares & Units $32.4M $35.0M as of September 30, 2025 Strong Population Growth & Job Growth • Favorable Tax Status & Business Environment Lake Brandon Village | Brandon, FL |
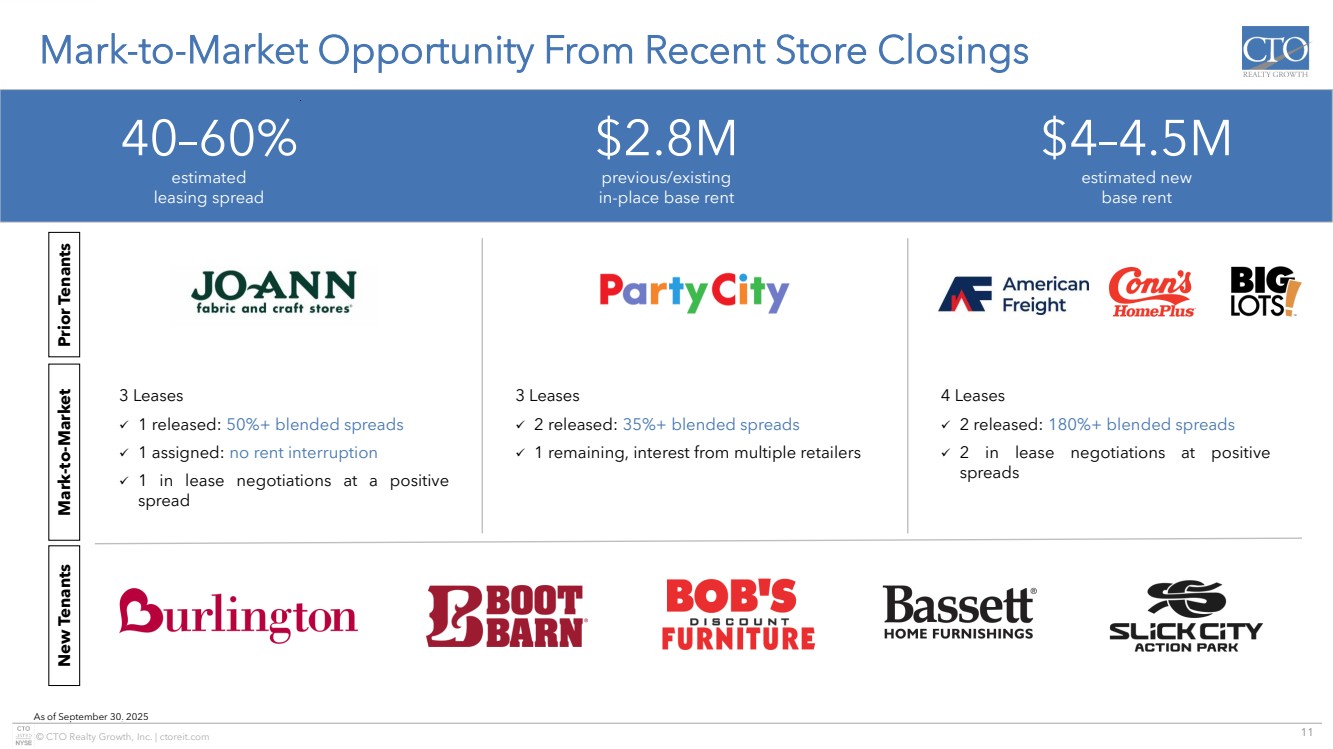
| 11 © CTO Realty Growth, Inc. | ctoreit.com Mark-to-Market Opportunity From Recent Store Closings As of September 30, 2025 $2.8M previous/existing in-place base rent 40–60% estimated leasing spread $4–4.5M estimated new base rent 3 Leases ✓ 1 released: 50%+ blended spreads ✓ 1 assigned: no rent interruption ✓ 1 in lease negotiations at a positive spread 3 Leases ✓ 2 released: 35%+ blended spreads ✓ 1 remaining, interest from multiple retailers 4 Leases ✓ 2 released: 180%+ blended spreads ✓ 2 in lease negotiations at positive spreads New Tenants Prior Tenants Mark-to-Market |
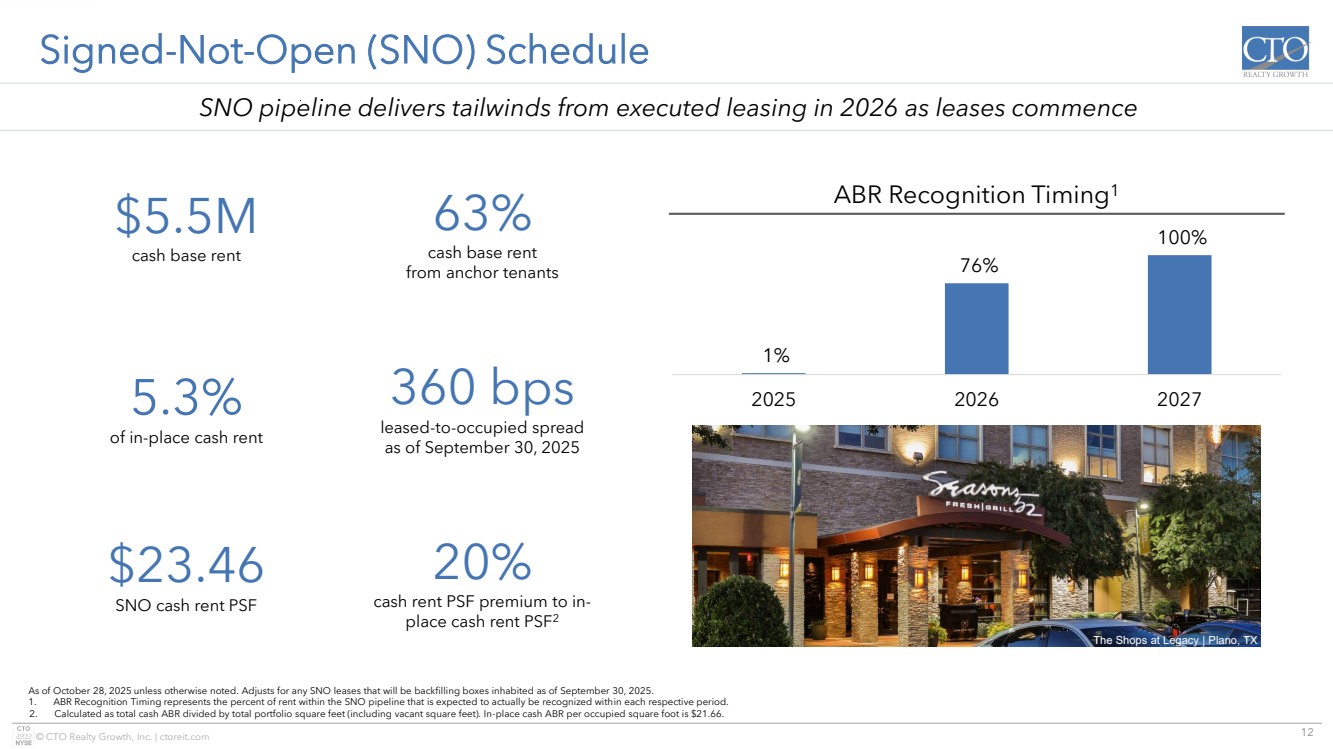
| 12 © CTO Realty Growth, Inc. | ctoreit.com Signed-Not-Open (SNO) Schedule As of October 28, 2025 unless otherwise noted. Adjusts for any SNO leases that will be backfilling boxes inhabited as of September 30, 2025. 1. ABR Recognition Timing represents the percent of rent within the SNO pipeline that is expected to actually be recognized within each respective period. 2. Calculated as total cash ABR divided by total portfolio square feet (including vacant square feet). In-place cash ABR per occupied square foot is $21.66. SNO pipeline delivers tailwinds from executed leasing in 2026 as leases commence ABR Recognition Timing1 $5.5M cash base rent $23.46 SNO cash rent PSF 20% cash rent PSF premium to in-place cash rent PSF2 5.3% of in-place cash rent 63% cash base rent from anchor tenants 360 bps leased-to-occupied spread as of September 30, 2025 1% 76% 100% 2025 2026 2027 The Shops at Legacy | Plano, TX |
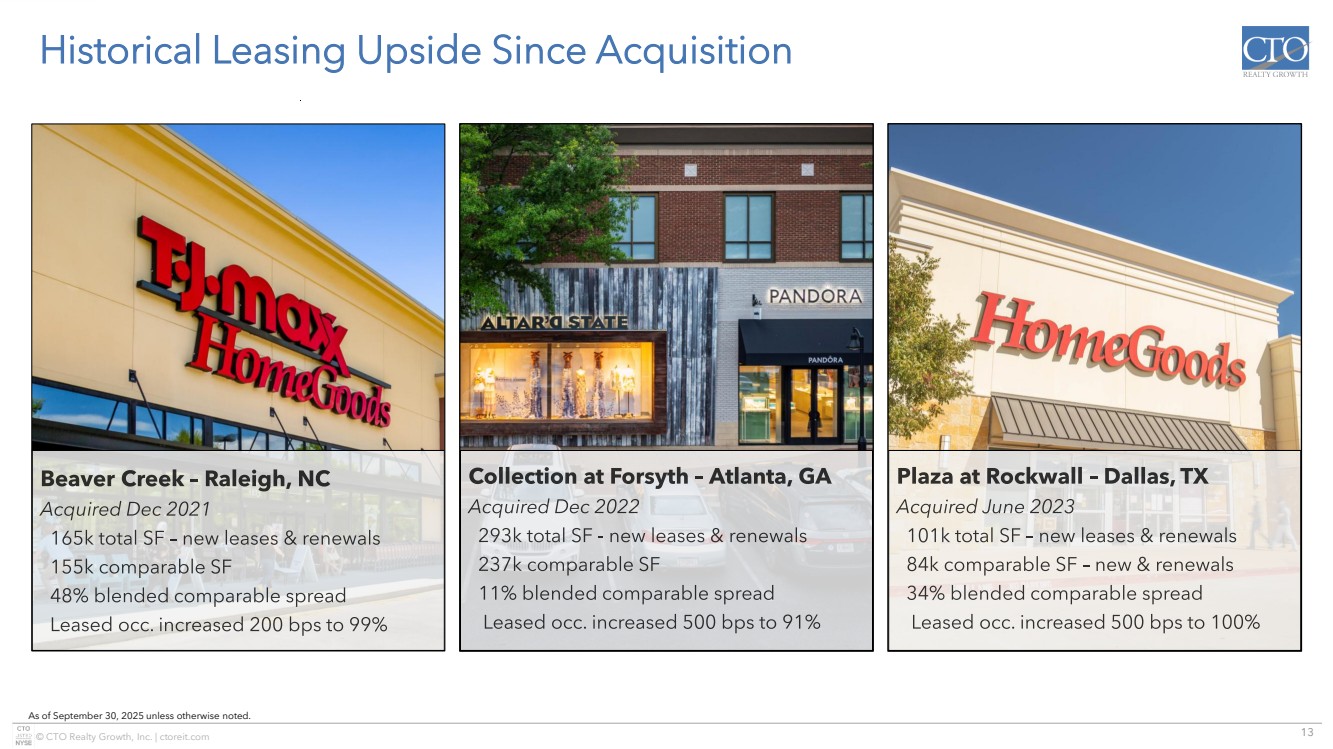
| 13 © CTO Realty Growth, Inc. | ctoreit.com Historical Leasing Upside Since Acquisition As of September 30, 2025 unless otherwise noted. |
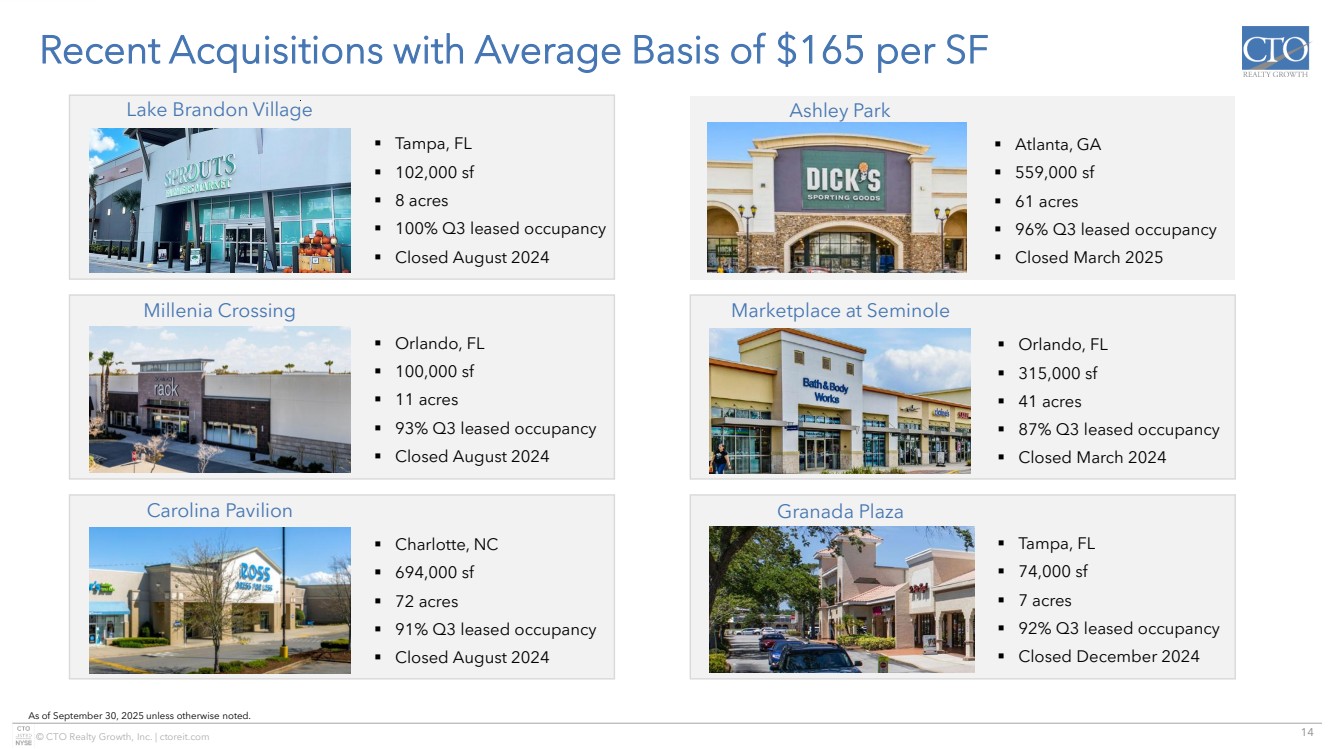
| 14 © CTO Realty Growth, Inc. | ctoreit.com Ashley Park ▪ Atlanta, GA ▪ 559,000 sf ▪ 61 acres ▪ 96% Q3 leased occupancy ▪ Closed March 2025 Lake Brandon Village ▪ Tampa, FL ▪ 102,000 sf ▪ 8 acres ▪ 100% Q3 leased occupancy ▪ Closed August 2024 Recent Acquisitions with Average Basis of $165 per SF As of September 30, 2025 unless otherwise noted. Carolina Pavilion ▪ Charlotte, NC ▪ 694,000 sf ▪ 72 acres ▪ 91% Q3 leased occupancy ▪ Closed August 2024 l Millenia Crossing ▪ Orlando, FL ▪ 100,000 sf ▪ 11 acres ▪ 93% Q3 leased occupancy ▪ Closed August 2024 Granada Plaza ▪ Tampa, FL ▪ 74,000 sf ▪ 7 acres ▪ 92% Q3 leased occupancy ▪ Closed December 2024 ▪ Orlando, FL ▪ 315,000 sf ▪ 41 acres ▪ 87% Q3 leased occupancy ▪ Closed March 2024 Marketplace at Seminole |
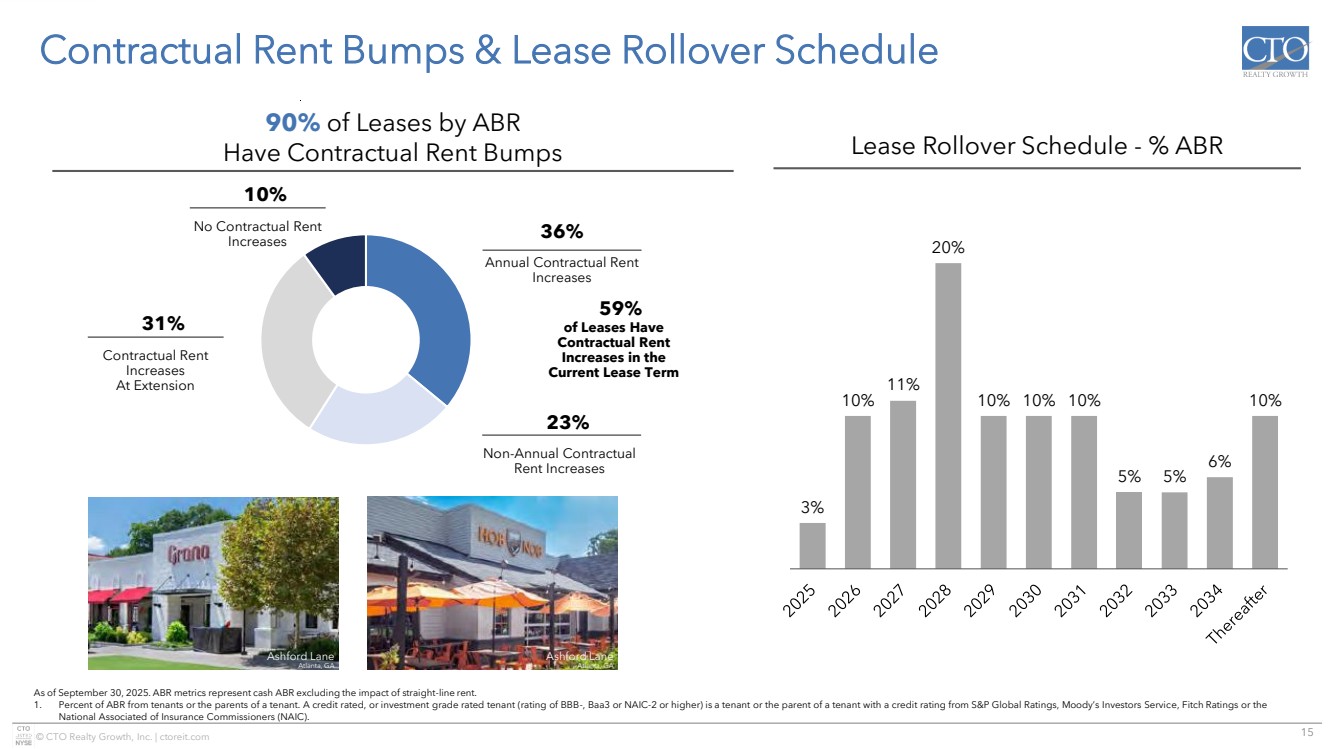
| 15 © CTO Realty Growth, Inc. | ctoreit.com Contractual Rent Bumps & Lease Rollover Schedule As of September 30, 2025. ABR metrics represent cash ABR excluding the impact of straight-line rent. 1. Percent of ABR from tenants or the parents of a tenant. A credit rated, or investment grade rated tenant (rating of BBB-, Baa3 or NAIC-2 or higher) is a tenant or the parent of a tenant with a credit rating from S&P Global Ratings, Moody’s Investors Service, Fitch Ratings or the National Associated of Insurance Commissioners (NAIC). Lease Rollover Schedule - % ABR 3% 10% 11% 20% 10% 10% 10% 5% 5% 6% 10% Non-Annual Contractual Rent Increases 23% Contractual Rent Increases At Extension 31% Annual Contractual Rent Increases 36% of Leases Have Contractual Rent Increases in the Current Lease Term 59% No Contractual Rent Increases 10% 90% of Leases by ABR Have Contractual Rent Bumps Ashford Lane Atlanta, GA Ashford Lane Atlanta, GA |
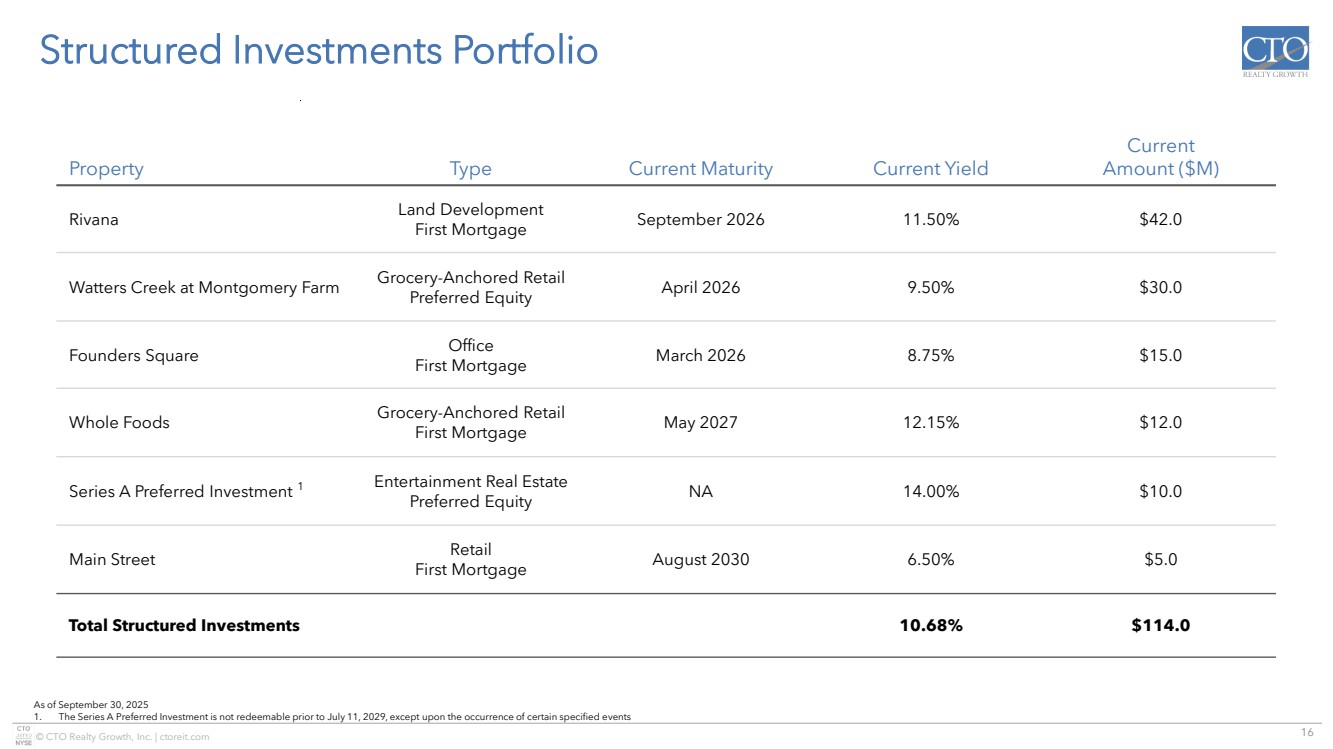
| 16 © CTO Realty Growth, Inc. | ctoreit.com Structured Investments Portfolio Property Type Current Maturity Current Yield Current Amount ($M) Rivana Land Development First Mortgage September 2026 11.50% $42.0 Watters Creek at Montgomery Farm Grocery-Anchored Retail Preferred Equity April 2026 9.50% $30.0 Founders Square Office First Mortgage March 2026 8.75% $15.0 Whole Foods Grocery-Anchored Retail First Mortgage May 2027 12.15% $12.0 Series A Preferred Investment 1 Entertainment Real Estate Preferred Equity NA 14.00% $10.0 Main Street Retail First Mortgage August 2030 6.50% $5.0 Total Structured Investments 10.68% $114.0 As of September 30, 2025 1. The Series A Preferred Investment is not redeemable prior to July 11, 2029, except upon the occurrence of certain specified events |
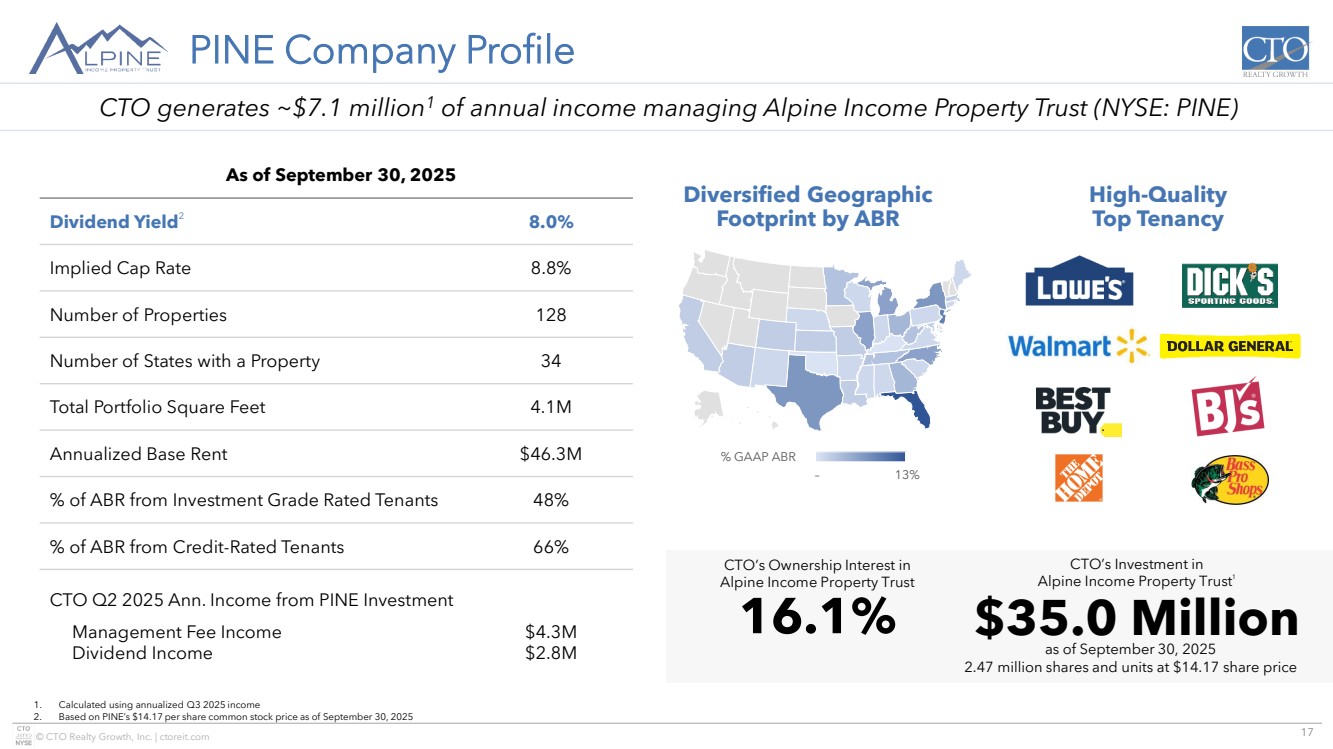
| 17 © CTO Realty Growth, Inc. | ctoreit.com © GeoNames, Microsoft, TomTom Powered by Bing – 13% % GAAP ABR PINE Company Profile 1. Calculated using annualized Q3 2025 income 2. Based on PINE’s $14.17 per share common stock price as of September 30, 2025 As of September 30, 2025 Dividend Yield2 8.0% Implied Cap Rate 8.8% Number of Properties 128 Number of States with a Property 34 Total Portfolio Square Feet 4.1M Annualized Base Rent $46.3M % of ABR from Investment Grade Rated Tenants 48% % of ABR from Credit-Rated Tenants 66% CTO Q2 2025 Ann. Income from PINE Investment Management Fee Income Dividend Income $4.3M $2.8M Diversified Geographic Footprint by ABR High-Quality Top Tenancy 16.1% CTO’s Ownership Interest in Alpine Income Property Trust $35.0 Million CTO’s Investment in Alpine Income Property Trust1 as of September 30, 2025 2.47 million shares and units at $14.17 share price CTO generates ~$7.1 million1 of annual income managing Alpine Income Property Trust (NYSE: PINE) |
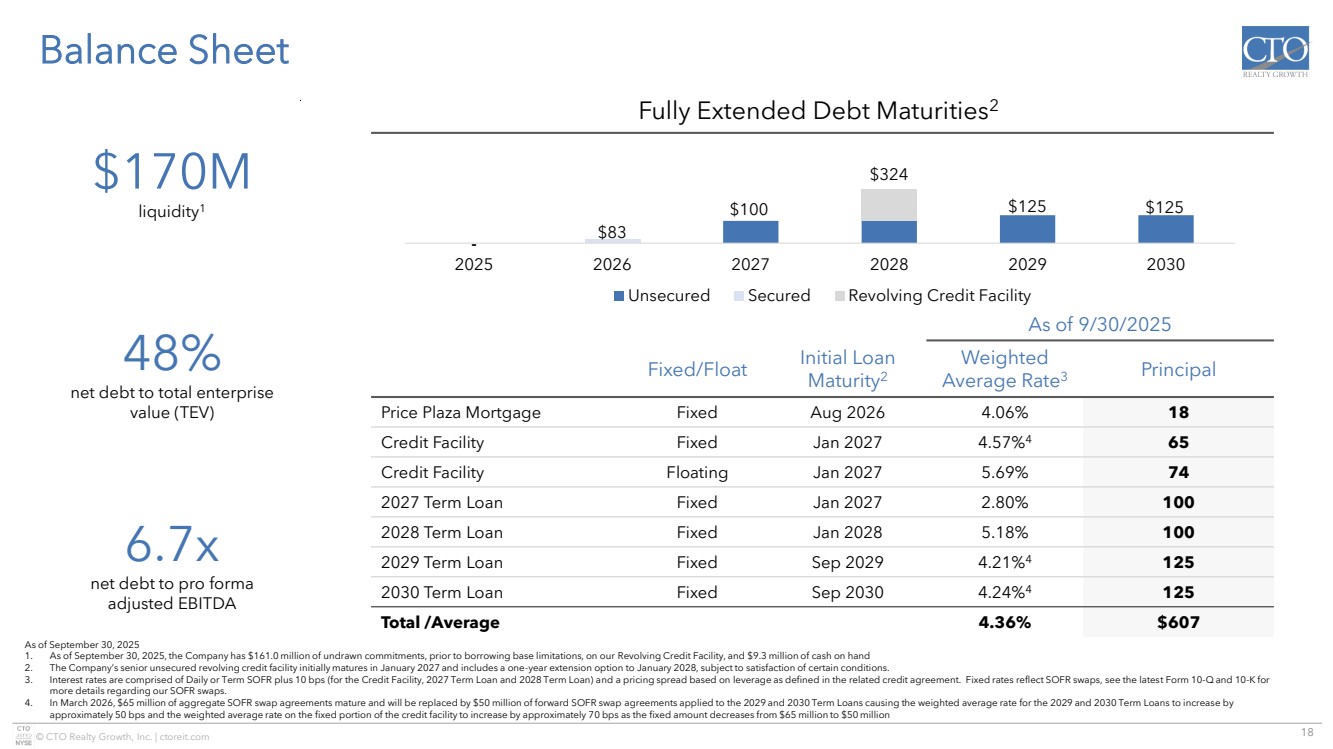
| 18 © CTO Realty Growth, Inc. | ctoreit.com - $100 $125 $125 $83 $324 2025 2026 2027 2028 2029 2030 Unsecured Secured Revolving Credit Facility Balance Sheet Exchange at Gwinnett Buford, GA As of September 30, 2025 1. As of September 30, 2025, the Company has $161.0 million of undrawn commitments, prior to borrowing base limitations, on our Revolving Credit Facility, and $9.3 million of cash on hand 2. The Company’s senior unsecured revolving credit facility initially matures in January 2027 and includes a one-year extension option to January 2028, subject to satisfaction of certain conditions. 3. Interest rates are comprised of Daily or Term SOFR plus 10 bps (for the Credit Facility, 2027 Term Loan and 2028 Term Loan) and a pricing spread based on leverage as defined in the related credit agreement. Fixed rates reflect SOFR swaps, see the latest Form 10-Q and 10-K for more details regarding our SOFR swaps. 4. In March 2026, $65 million of aggregate SOFR swap agreements mature and will be replaced by $50 million of forward SOFR swap agreements applied to the 2029 and 2030 Term Loans causing the weighted average rate for the 2029 and 2030 Term Loans to increase by approximately 50 bps and the weighted average rate on the fixed portion of the credit facility to increase by approximately 70 bps as the fixed amount decreases from $65 million to $50 million As of 9/30/2025 Fixed/Float Initial Loan Maturity2 Weighted Average Rate3 Principal Price Plaza Mortgage Fixed Aug 2026 4.06% 18 Credit Facility Fixed Jan 2027 4.57%4 65 Credit Facility Floating Jan 2027 5.69% 74 2027 Term Loan Fixed Jan 2027 2.80% 100 2028 Term Loan Fixed Jan 2028 5.18% 100 2029 Term Loan Fixed Sep 2029 4.21%4 125 2030 Term Loan Fixed Sep 2030 4.24%4 125 Total /Average 4.36% $607 Fully Extended Debt Maturities2 $170M liquidity1 48% net debt to total enterprise value (TEV) 6.7x net debt to pro forma adjusted EBITDA |
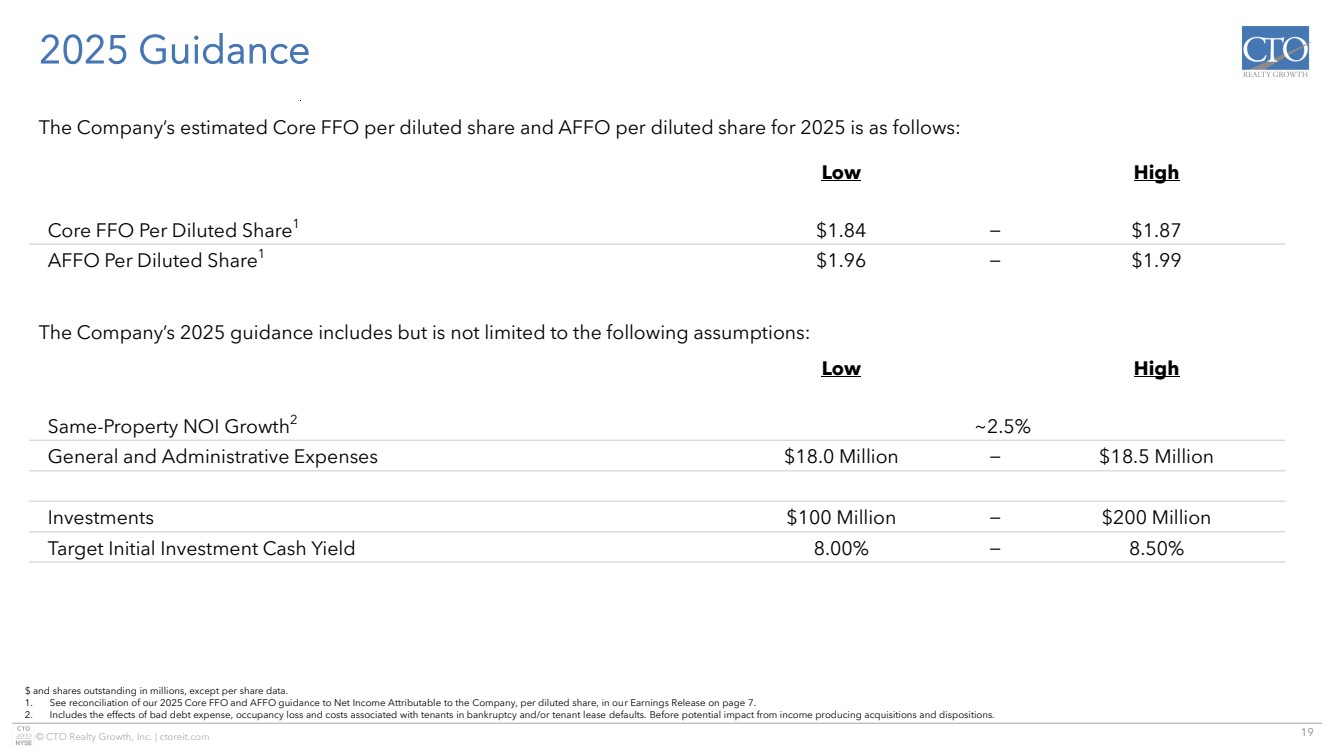
| 19 © CTO Realty Growth, Inc. | ctoreit.com 2025 Guidance Exchange at Gwinnett Buford, GA $ and shares outstanding in millions, except per share data. 1. See reconciliation of our 2025 Core FFO and AFFO guidance to Net Income Attributable to the Company, per diluted share, in our Earnings Release on page 7. 2. Includes the effects of bad debt expense, occupancy loss and costs associated with tenants in bankruptcy and/or tenant lease defaults. Before potential impact from income producing acquisitions and dispositions. Low High Core FFO Per Diluted Share1 $1.84 − $1.87 AFFO Per Diluted Share1 $1.96 − $1.99 The Company’s estimated Core FFO per diluted share and AFFO per diluted share for 2025 is as follows: The Company’s 2025 guidance includes but is not limited to the following assumptions: Low High Same-Property NOI Growth2 ~2.5% General and Administrative Expenses $18.0 Million − $18.5 Million Investments $100 Million − $200 Million Target Initial Investment Cash Yield 8.00% − 8.50% |
| 20 © CTO Realty Growth, Inc. | ctoreit.com Experienced Management Team Exchange at Gwinnett Buford, GA Yonder Yoga John P. Albright President & Chief Executive Officer ▪ Former Co-Head and Managing Director of Archon Capital, a Goldman Sachs Company; Executive Director of Merchant Banking – Investment Management at Morgan Stanley; and Managing Director of Crescent Real Estate (NYSE: CEI) Daniel E. Smith Senior Vice President, General Counsel & Corporate Secretary ▪ Former Vice President and Associate General Counsel of Goldman Sachs & Co. and Senior Vice President and General Counsel of Crescent Real Estate (NYSE: CEI) Philip R. Mays Senior Vice President, Chief Financial Officer & Treasurer ▪ Former Chief Financial Officer & Treasurer of Shadowbox Studios; EVP, Chief Financial Officer & Treasurer of Cedar Realty; and Vice President and Chief Accounting Officer of Federal Realty (NYSE: FRT) Steven R. Greathouse Senior Vice President & Chief Investment Officer ▪ Former Director of Finance for N3 Real Estate; Senior Associate of Merchant Banking – Investment Management at Morgan Stanley; and Senior Associate at Crescent Real Estate (NYSE: CEI) Lisa M. Vorakoun Senior Vice President & Chief Accounting Officer ▪ Former Assistant Finance Director of the City of DeLand, Florida and Audit Manager for James Moore & Company, an Accounting and Consulting Firm Matt J. Trau Vice President, Investments ▪ Former Senior Director of Transactions at ShopCore Properties; Senior Associate of Transactions at DDR Corp (currently Site Centers NYSE: SITC) Alexander M. Gordon Vice President, Leasing & Investments ▪ Former Senior Associate, Brokerage & Retail Advisory Services at CBRE (NYSE: CBRE) |
| 21 © CTO Realty Growth, Inc. | ctoreit.com Corporate Responsibility Exchange at Gwinnett Buford, GA Yonder Yoga Fully committed to sustainability, strong corporate governance, and meaningful corporate social responsibility programs. Social Responsibility Inclusive and Supportive Company Culture ▪ Dedicated to an inclusive and supportive office environment filled with diverse backgrounds and perspectives, with a demonstrated commitment to financial, mental and physical wellness Notable Community Outreach ▪ Numerous and diverse community outreach programs, supporting environmental, artistic, civil and social organizations in the community Corporate Governance ▪ Independent Chairman of the Board and 5 of 6 Directors classified as independent ▪ Annual election of all Directors ▪ Annual Board of Director evaluations ▪ Board oversees risk assessment/management, with oversight for specific areas of risk delegated to Board committees ▪ Stock ownership requirements for all Executive Management and Directors ▪ Prohibition against hedging and pledging CTO Realty Growth stock ▪ Robust policies and procedures for approval of related party transactions ▪ All team members adhere to a comprehensive Code of Business Conduct and Ethics policy |
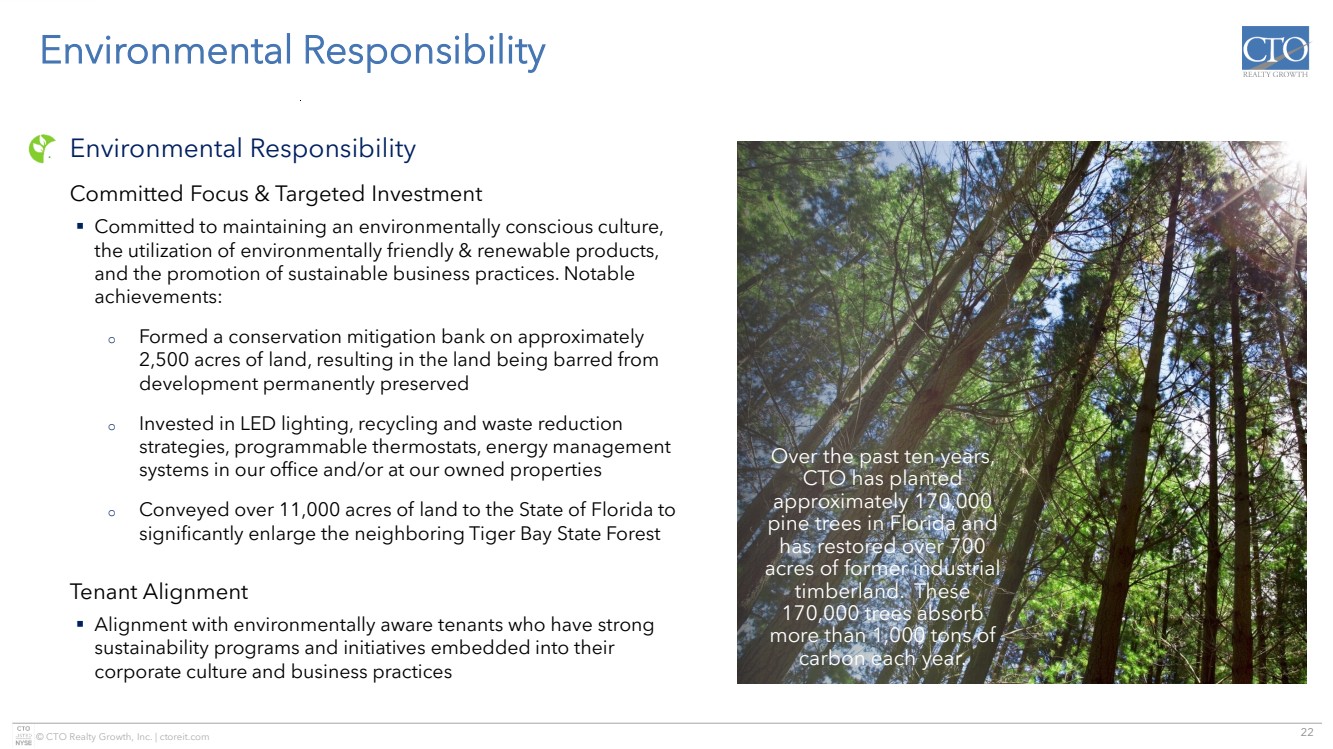
| 22 © CTO Realty Growth, Inc. | ctoreit.com Environmental Responsibility Yonder Yoga Over the past ten years, CTO has planted approximately 170,000 pine trees in Florida and has restored over 700 acres of former industrial timberland. These 170,000 trees absorb more than 1,000 tons of carbon each year. Environmental Responsibility Committed Focus & Targeted Investment ▪ Committed to maintaining an environmentally conscious culture, the utilization of environmentally friendly & renewable products, and the promotion of sustainable business practices. Notable achievements: o Formed a conservation mitigation bank on approximately 2,500 acres of land, resulting in the land being barred from development permanently preserved o Invested in LED lighting, recycling and waste reduction strategies, programmable thermostats, energy management systems in our office and/or at our owned properties o Conveyed over 11,000 acres of land to the State of Florida to significantly enlarge the neighboring Tiger Bay State Forest Tenant Alignment ▪ Alignment with environmentally aware tenants who have strong sustainability programs and initiatives embedded into their corporate culture and business practices |
| 23 © CTO Realty Growth, Inc. | ctoreit.com Forward Looking Statements & Non-GAAP Financial Measures Forward Looking Statements Certain statements contained in this presentation (other than statements of historical fact) are forward-looking statements within the meaning of Section 27A of the Securities Act of 1933, as amended, and Section 21E of the Securities Exchange Act of 1934, as amended. Forward-looking statements can typically be identified by words such as “outlook”, “believe,” “estimate,” “expect,” “intend,” “anticipate,” “will,” “could,” “may,” “should,” “plan,” “potential,” “predict,” “forecast,” “project,” and similar expressions, as well as variations or negatives of these words. Although forward-looking statements are made based upon management’s present expectations and beliefs concerning future developments and their potential effect upon the Company, a number of factors could cause the Company’s actual results to differ materially from those set forth in the forward-looking statements. Such factors may include, but are not limited to: the Company’s ability to remain qualified as a REIT; the Company’s exposure to U.S. federal and state income tax law changes, including changes to the REIT requirements; general adverse economic and real estate conditions; macroeconomic and geopolitical factors, including but not limited to inflationary pressures, interest rate volatility, distress in the banking sector, global supply chain disruptions, and ongoing geopolitical war; credit risk associated with the Company investing in commercial loans and similarly structured investments; the ultimate geographic spread, severity and duration of pandemics such as the COVID-19 Pandemic and its variants, actions that may be taken by governmental authorities to contain or address the impact of such pandemics, and the potential negative impacts of such pandemics on the global economy and the Company’s financial condition and results of operations; the inability of major tenants or borrowers to continue paying their rent or obligations due to bankruptcy, insolvency or a general downturn in their business; the loss or failure, or decline in the business or assets of PINE; the completion of 1031 exchange transactions; the availability of investment properties that meet the Company’s investment goals and criteria; the uncertainties associated with obtaining required governmental permits and satisfying other closing conditions for planned acquisitions and sales; and the uncertainties and risk factors discussed in the Company’s Annual Report on Form 10-K for the fiscal year ended December 31, 2024 and other risks and uncertainties discussed from time to time in the Company’s filings with the U.S. Securities and Exchange Commission. There can be no assurance that future developments will be in accordance with management’s expectations or that the effect of future developments on the Company will be those anticipated by management. Readers are cautioned not to place undue reliance on these forward-looking statements, which speak only as of the date of this presentation. The Company undertakes no obligation to update the information contained in this presentation to reflect subsequently occurring events or circumstances. Non-GAAP Financial Measures Our reported results are presented in accordance with accounting principles generally accepted in the United States of America (“GAAP”). We also disclose Funds From Operations (“FFO”), Core Funds From Operations (“Core FFO”), Adjusted Funds From Operations (“AFFO”), Pro Forma Earnings Before Interest, Taxes, Depreciation and Amortization (“Pro Forma Adjusted EBITDA”), and Same-Property Net Operating Income (“Same-Property NOI”), each of which are non-GAAP financial measures. We believe these non-GAAP financial measures are useful to investors because they are widely accepted industry measures used by analysts and investors to compare the operating performance of REITs. FFO, Core FFO, AFFO, Pro Forma Adjusted EBITDA, and Same-Property NOI do not represent cash generated from operating activities and are not necessarily indicative of cash available to fund cash requirements; accordingly, they should not be considered alternatives to net income as a performance measure or cash flows from operating activities as reported on our statement of cash flows as a liquidity measure and should be considered in addition to, and not in lieu of, GAAP financial measures. We compute FFO in accordance with the definition adopted by the Board of Governors of the National Association of Real Estate Investment Trusts, or NAREIT. NAREIT defines FFO as GAAP net income or loss adjusted to exclude real estate related depreciation and amortization, as well as extraordinary items (as defined by GAAP) such as net gain or loss from sales of depreciable real estate assets, impairment write-downs associated with depreciable real estate assets and impairments associated with the implementation of current expected credit losses on commercial loans and investments at the time of origination, including the pro rata share of such adjustments of unconsolidated subsidiaries. The Company also excludes the gains or losses from sales of assets incidental to the primary business of the REIT which specifically include the sales of mitigation credits, subsurface sales, investment securities, and land sales, in addition to the mark-to-market of the Company’s investment securities and interest related to the 2025 Notes, if the effect is dilutive. |
| 24 © CTO Realty Growth, Inc. | ctoreit.com Non-GAAP Financial Measures Non-GAAP Financial Measures (continued) To derive Core FFO, we modify the NAREIT computation of FFO to include other adjustments to GAAP net income related to gains and losses recognized on the extinguishment of debt, amortization of above- and below-market lease related intangibles, and other unforecastable market- or transaction-driven non-cash items, as well as adding back the interest related to the 2025 Convertible Senior Notes, if the effect is dilutive. To derive AFFO, we further modify the NAREIT computation of FFO and Core FFO to include other adjustments to GAAP net income related to non-cash revenues and expenses such as straight-line rental revenue, non-cash compensation, and other non-cash amortization. Such items may cause short-term fluctuations in net income but have no impact on operating cash flows or long-term operating performance. We use AFFO as one measure of our performance when we formulate corporate goals. To derive Pro Forma Adjusted EBITDA, GAAP net income or loss attributable to the Company is adjusted to exclude real estate related depreciation and amortization, as well as extraordinary items (as defined by GAAP) such as net gain or loss from sales of depreciable real estate assets, impairment write-downs associated with depreciable real estate assets, impairments associated with the implementation of current expected credit losses on commercial loans and investments at the time of origination, including the pro rata share of such adjustments of unconsolidated subsidiaries, non-cash revenues and expenses such as straight-line rental revenue, amortization of deferred financing costs, gains and losses recognized on the extinguishment of debt, above- and below-market lease related intangibles, non-cash compensation, other non-recurring items such as termination fees, forfeitures of tenant security deposits, certain adjustments to reconciliation estimates related to reimbursable revenue for recently acquired properties, and other non-recurring items, and other non-cash income or expense. The Company also excludes the gains or losses from sales of assets incidental to the primary business of the REIT which specifically include the sales of mitigation credits, subsurface sales, investment securities, and land sales, in addition to the mark-to-market of the Company’s investment securities. Cash interest expense is also excluded from Pro Forma Adjusted EBITDA, and GAAP net income or loss is adjusted for the annualized impact of acquisitions, dispositions and other similar activities. To derive Same-Property NOI, GAAP net income or loss attributable to the Company is adjusted to exclude real estate related depreciation and amortization, as well as extraordinary items (as defined by GAAP) such as net gain or loss from sales of depreciable real estate assets, impairment write-downs associated with depreciable real estate assets, impairments associated with the implementation of current expected credit losses on commercial loans and investments at the time of origination, including the pro rata share of such adjustments of unconsolidated subsidiaries, non-cash revenues and expenses such as straight-line rental revenue, amortization of deferred financing costs, gains and losses recognized on the extinguishment of debt, above- and below-market lease related intangibles, non-cash compensation, other non-recurring items such as termination fees, forfeitures of tenant security deposits, certain adjustments to reconciliation estimates related to reimbursable revenue for recently acquired properties, and other non-recurring items, and other non-cash income or expense. Interest expense, general and administrative expenses, investment and other income or loss, income tax benefit or expense, real estate operations revenues and direct cost of revenues, management fee income, and interest income from commercial loans and investments are also excluded from Same-Property NOI. GAAP net income or loss is further adjusted to remove the impact of properties that were not owned for the full current and prior year reporting periods presented. Cash rental income received under the leases pertaining to the Company’s assets that are presented as commercial loans and investments in accordance with GAAP is also used in lieu of the interest income equivalent. FFO is used by management, investors and analysts to facilitate meaningful comparisons of operating performance between periods and among our peers primarily because it excludes the effect of real estate depreciation and amortization and net gains or losses on sales, which are based on historical costs and implicitly assume that the value of real estate diminishes predictably over time, rather than fluctuating based on existing market conditions. We believe that Core FFO and AFFO are additional useful supplemental measures for investors to consider because they will help them to better assess our operating performance without the distortions created by other non-cash revenues or expenses. We also believe that Pro Forma Adjusted EBITDA is an additional useful supplemental measure for investors to consider as it allows for a better assessment of our operating performance without the distortions created by other non-cash revenues, expenses or certain effects of the Company’s capital structure on our operating performance. We use Same-Property NOI to compare the operating performance of our assets between periods. It is an accepted and important measurement used by management, investors and analysts because it includes all property-level revenues from the Company’s properties, less operating and maintenance expenses, real estate taxes and other property-specific expenses (“Net Operating Income” or “NOI”) of properties that have been owned and stabilized for the entire current and prior year reporting periods. Same-Property NOI attempts to eliminate differences due to the acquisition or disposition of properties during the particular period presented, and therefore provides a more comparable and consistent performance measure for the comparison of the Company’s properties. FFO, Core FFO, AFFO, Pro Forma Adjusted EBITDA, and Same-Property NOI may not be comparable to similarly titled measures employed by other companies. |
| 25 © CTO Realty Growth, Inc. | ctoreit.com References References and terms used in this presentation that are in addition to terms defined in the Non-GAAP Financial Measures include: ▪ This presentation was published on October 28, 2025. ▪ All information is as of September 30, 2025, unless otherwise noted. ▪ Any calculation differences are assumed to be a result of rounding. ▪ “2025 Guidance” in this presentation is based on the 2025 Guidance provided in the Company’s Third Quarter 2025 Operating Results press release filed on October 28, 2025. ▪ “Alpine” or “PINE” refers to Alpine Income Property Trust, a publicly traded net lease REIT traded on the New York Stock Exchange under the ticker symbol PINE. ▪ “Annualized Base Rent”, “ABR” or “Rent” and the statistics based on ABR are calculated based on the current portfolio and represent straight-line rent calculated in accordance with GAAP. ▪ “Annualized Cash Base Rent”, “Cash ABR” and the statistics based on Cash ABR are calculated based on the current portfolio and represent the annualized cash base rent calculated in accordance with GAAP due from the tenants at a specific point in time. ▪ “Credit Rated” is a tenant or the parent of a tenant with a credit rating from S&P Global Ratings, Moody’s Investors Service, Fitch Ratings or the National Association of Insurance Commissioners (NAIC) (together, the “Major Rating Agencies”). The Company defines an Investment Grade Rated Tenant as a tenant or the parent of a tenant with a credit rating from S&P Global Ratings, Moody’s Investors Service, Fitch Ratings or the National Association of Insurance Commissioners of Baa3, BBB-, or NAIC-2 or higher. If applicable, in the event of a split rating between S&P Global Ratings and Moody’s Investors Services, the Company utilizes the higher of the two ratings as its reference point as to whether a tenant is defined as an Investment Grade Rated Tenant. ▪ “Dividend” or “Dividends”, subject to the required dividends to maintain the Company’s qualification as a REIT, are set by the Board of Directors and declared on a quarterly basis and there can be no assurances as to the likelihood or number of dividends in the future. ▪ “Investment in Alpine Income Property Trust” or “Alpine Investment” or “PINE Ownership” is calculated based on the 2,471,556 common shares and partnership units CTO owns in PINE and is based on PINE’s closing stock price as of the referenced period on the respective slide. ▪ “Leased Occupancy” refers to space that is currently leased but for which rent payments have not yet commenced. ▪ “MSA” or “Metropolitan Statistical Area” is a region that consists of a city and surrounding communities that are linked by social and economic factors, as established by the U.S. Office of Management and Budget. The names of the MSA have been shortened for ease of reference. ▪ “Net Debt” is calculated as total long-term debt as presented on the face of the balance sheet; plus financing costs, net of accumulated amortization and unamortized convertible debt discount; less cash, restricted cash and cash equivalents. ▪ “Net Operating Income” or “NOI” is revenues from all income properties less operating expense, maintenance expense, real estate taxes and rent expense. ▪ “Total Enterprise Value” is calculated as the Company’s Total Common Shares Outstanding multiplied by the common stock price; plus the par value of the Series A perpetual preferred equity outstanding and Net Debt. |
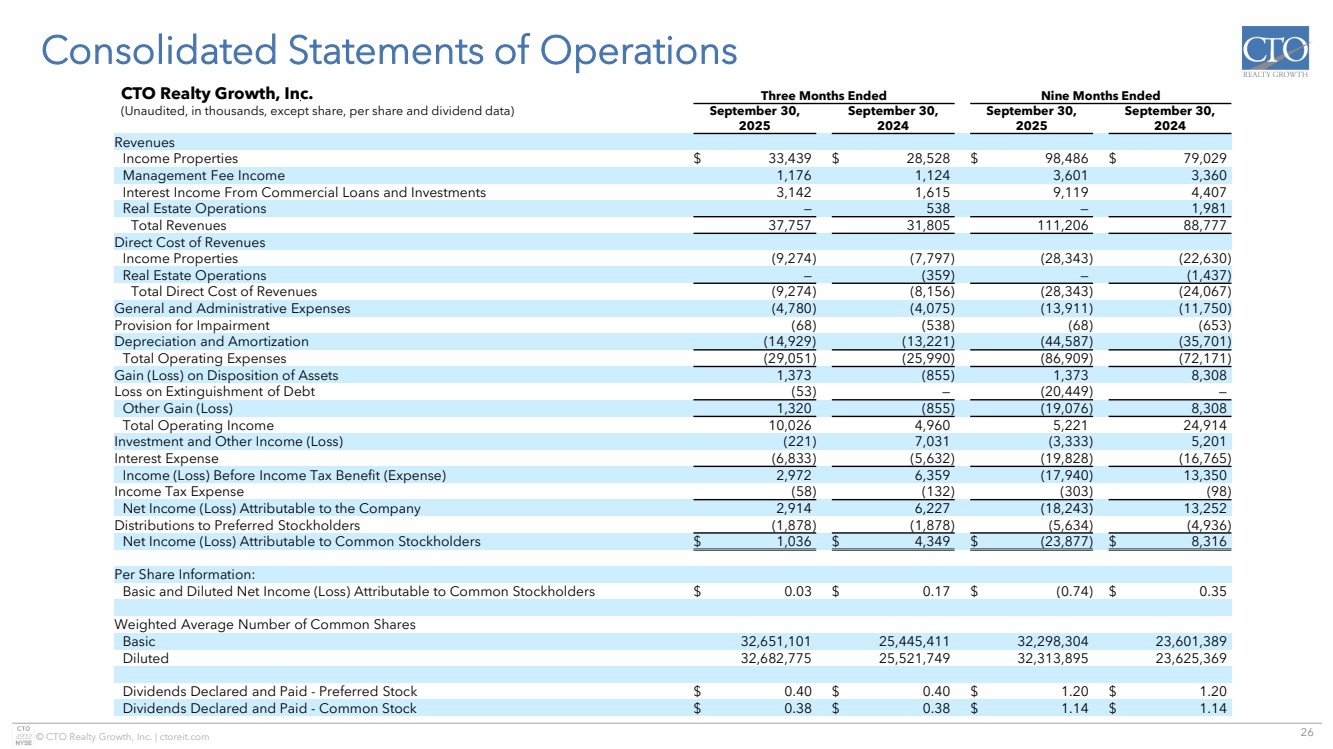
| 26 © CTO Realty Growth, Inc. | ctoreit.com Consolidated Statements of Operations CTO Realty Growth, Inc. Three Months Ended Nine Months Ended (Unaudited, in thousands, except share, per share and dividend data) September 30, September 30, September 30, September 30, 2025 2024 2025 2024 Revenues Income Properties $ 33,439 $ 28,528 $ 98,486 $ 79,029 Management Fee Income 1,176 1,124 3,601 3,360 Interest Income From Commercial Loans and Investments 3,142 1,615 9,119 4,407 Real Estate Operations — 538 — 1,981 Total Revenues 37,757 31,805 111,206 88,777 Direct Cost of Revenues Income Properties (9,274) (7,797) (28,343) (22,630) Real Estate Operations — (359) — (1,437) Total Direct Cost of Revenues (9,274) (8,156) (28,343) (24,067) General and Administrative Expenses (4,780) (4,075) (13,911) (11,750) Provision for Impairment (68) (538) (68) (653) Depreciation and Amortization (14,929) (13,221) (44,587) (35,701) Total Operating Expenses (29,051) (25,990) (86,909) (72,171) Gain (Loss) on Disposition of Assets 1,373 (855) 1,373 8,308 Loss on Extinguishment of Debt (53) — (20,449) — Other Gain (Loss) 1,320 (855) (19,076) 8,308 Total Operating Income 10,026 4,960 5,221 24,914 Investment and Other Income (Loss) (221) 7,031 (3,333) 5,201 Interest Expense (6,833) (5,632) (19,828) (16,765) Income (Loss) Before Income Tax Benefit (Expense) 2,972 6,359 (17,940) 13,350 Income Tax Expense (58) (132) (303) (98) Net Income (Loss) Attributable to the Company 2,914 6,227 (18,243) 13,252 Distributions to Preferred Stockholders (1,878) (1,878) (5,634) (4,936) Net Income (Loss) Attributable to Common Stockholders $ 1,036 $ 4,349 $ (23,877) $ 8,316 Per Share Information: Basic and Diluted Net Income (Loss) Attributable to Common Stockholders $ 0.03 $ 0.17 $ (0.74) $ 0.35 Weighted Average Number of Common Shares Basic 32,651,101 25,445,411 32,298,304 23,601,389 Diluted 32,682,775 25,521,749 32,313,895 23,625,369 Dividends Declared and Paid - Preferred Stock $ 0.40 $ 0.40 $ 1.20 $ 1.20 Dividends Declared and Paid - Common Stock $ 0.38 $ 0.38 $ 1.14 $ 1.14 |
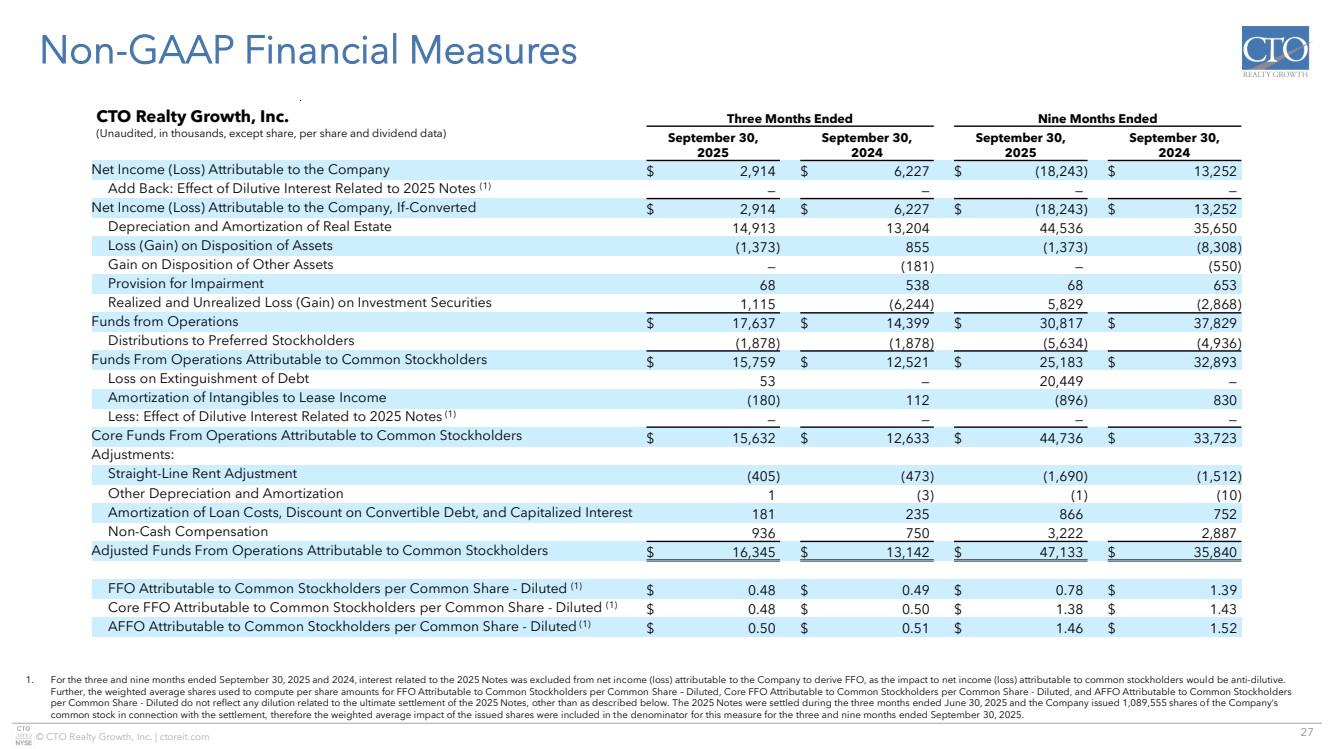
| 27 © CTO Realty Growth, Inc. | ctoreit.com Non-GAAP Financial Measures 1. For the three and nine months ended September 30, 2025 and 2024, interest related to the 2025 Notes was excluded from net income (loss) attributable to the Company to derive FFO, as the impact to net income (loss) attributable to common stockholders would be anti-dilutive. Further, the weighted average shares used to compute per share amounts for FFO Attributable to Common Stockholders per Common Share – Diluted, Core FFO Attributable to Common Stockholders per Common Share - Diluted, and AFFO Attributable to Common Stockholders per Common Share - Diluted do not reflect any dilution related to the ultimate settlement of the 2025 Notes, other than as described below. The 2025 Notes were settled during the three months ended June 30, 2025 and the Company issued 1,089,555 shares of the Company’s common stock in connection with the settlement, therefore the weighted average impact of the issued shares were included in the denominator for this measure for the three and nine months ended September 30, 2025. CTO Realty Growth, Inc. Three Months Ended Nine Months Ended (Unaudited, in thousands, except share, per share and dividend data) September 30, 2025 September 30, 2024 September 30, 2025 September 30, 2024 Net Income (Loss) Attributable to the Company $ 2,914 $ 6,227 $ (18,243) $ 13,252 Add Back: Effect of Dilutive Interest Related to 2025 Notes (1) — — — — Net Income (Loss) Attributable to the Company, If-Converted $ 2,914 $ 6,227 $ (18,243) $ 13,252 Depreciation and Amortization of Real Estate 14,913 13,204 44,536 35,650 Loss (Gain) on Disposition of Assets (1,373) 855 (1,373) (8,308) Gain on Disposition of Other Assets — (181) — (550) Provision for Impairment 68 538 68 653 Realized and Unrealized Loss (Gain) on Investment Securities 1,115 (6,244) 5,829 (2,868) Funds from Operations $ 17,637 $ 14,399 $ 30,817 $ 37,829 Distributions to Preferred Stockholders (1,878) (1,878) (5,634) (4,936) Funds From Operations Attributable to Common Stockholders $ 15,759 $ 12,521 $ 25,183 $ 32,893 Loss on Extinguishment of Debt 53 — 20,449 — Amortization of Intangibles to Lease Income (180) 112 (896) 830 Less: Effect of Dilutive Interest Related to 2025 Notes (1) — — — — Core Funds From Operations Attributable to Common Stockholders $ 15,632 $ 12,633 $ 44,736 $ 33,723 Adjustments: Straight-Line Rent Adjustment (405) (473) (1,690) (1,512) Other Depreciation and Amortization 1 (3) (1) (10) Amortization of Loan Costs, Discount on Convertible Debt, and Capitalized Interest 181 235 866 752 Non-Cash Compensation 936 750 3,222 2,887 Adjusted Funds From Operations Attributable to Common Stockholders $ 16,345 $ 13,142 $ 47,133 $ 35,840 FFO Attributable to Common Stockholders per Common Share - Diluted (1) $ 0.48 $ 0.49 $ 0.78 $ 1.39 Core FFO Attributable to Common Stockholders per Common Share - Diluted (1) $ 0.48 $ 0.50 $ 1.38 $ 1.43 AFFO Attributable to Common Stockholders per Common Share - Diluted (1) $ 0.50 $ 0.51 $ 1.46 $ 1.52 |
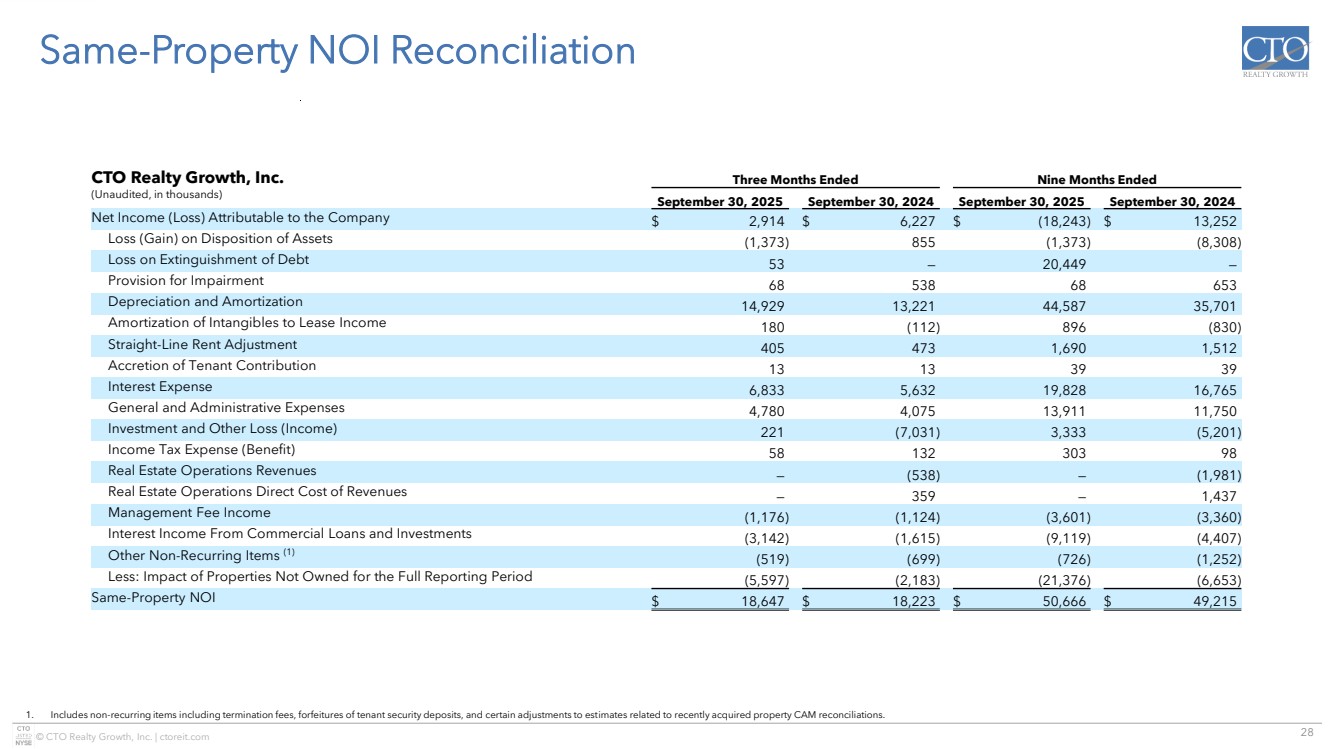
| 28 © CTO Realty Growth, Inc. | ctoreit.com Same-Property NOI Reconciliation 1. Includes non-recurring items including termination fees, forfeitures of tenant security deposits, and certain adjustments to estimates related to recently acquired property CAM reconciliations. CTO Realty Growth, Inc. Three Months Ended Nine Months Ended (Unaudited, in thousands) September 30, 2025 September 30, 2024 September 30, 2025 September 30, 2024 Net Income (Loss) Attributable to the Company $ 2,914 $ 6,227 $ (18,243) $ 13,252 Loss (Gain) on Disposition of Assets (1,373) 855 (1,373) (8,308) Loss on Extinguishment of Debt 53 — 20,449 — Provision for Impairment 68 538 68 653 Depreciation and Amortization 14,929 13,221 44,587 35,701 Amortization of Intangibles to Lease Income 180 (112) 896 (830) Straight-Line Rent Adjustment 405 473 1,690 1,512 Accretion of Tenant Contribution 13 13 39 39 Interest Expense 6,833 5,632 19,828 16,765 General and Administrative Expenses 4,780 4,075 13,911 11,750 Investment and Other Loss (Income) 221 (7,031) 3,333 (5,201) Income Tax Expense (Benefit) 58 132 303 98 Real Estate Operations Revenues — (538) — (1,981) Real Estate Operations Direct Cost of Revenues — 359 — 1,437 Management Fee Income (1,176) (1,124) (3,601) (3,360) Interest Income From Commercial Loans and Investments (3,142) (1,615) (9,119) (4,407) Other Non-Recurring Items (1) (519) (699) (726) (1,252) Less: Impact of Properties Not Owned for the Full Reporting Period (5,597) (2,183) (21,376) (6,653) Same-Property NOI $ 18,647 $ 18,223 $ 50,666 $ 49,215 |
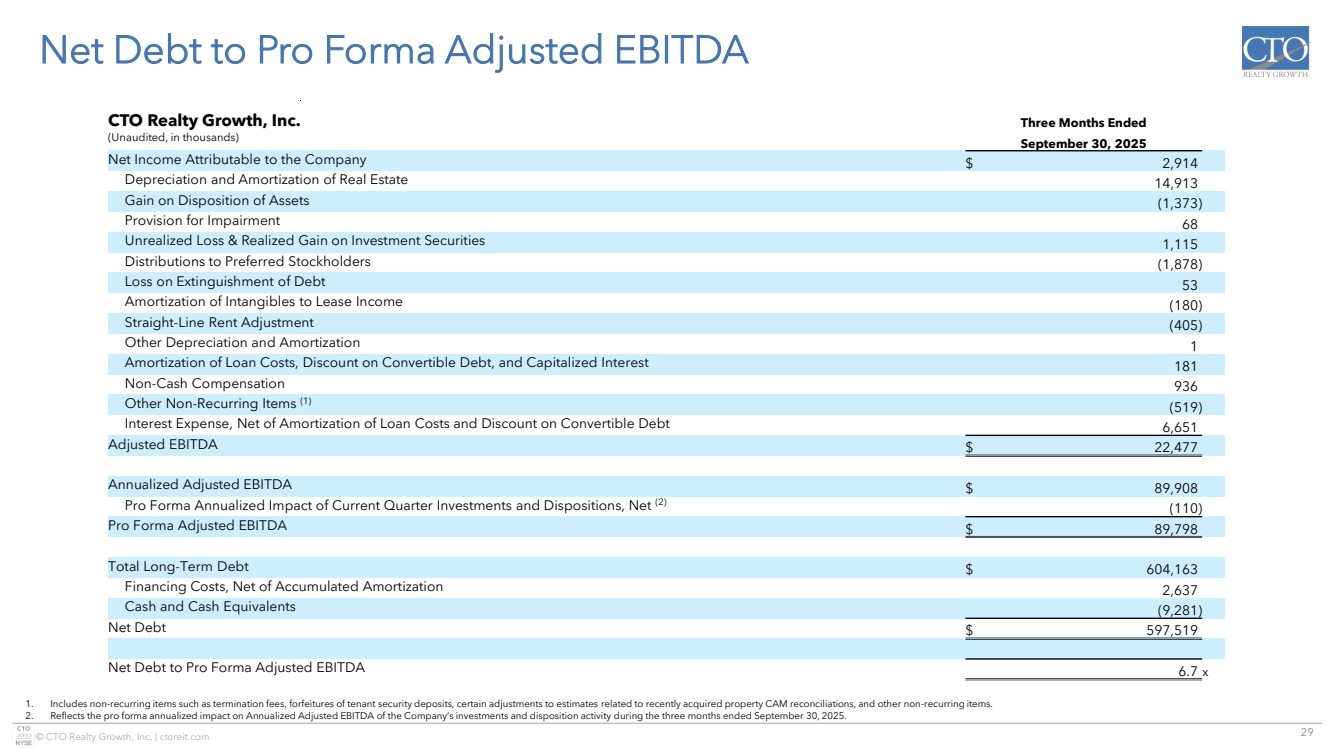
| 29 © CTO Realty Growth, Inc. | ctoreit.com Net Debt to Pro Forma Adjusted EBITDA 1. Includes non-recurring items such as termination fees, forfeitures of tenant security deposits, certain adjustments to estimates related to recently acquired property CAM reconciliations, and other non-recurring items. 2. Reflects the pro forma annualized impact on Annualized Adjusted EBITDA of the Company’s investments and disposition activity during the three months ended September 30, 2025. CTO Realty Growth, Inc. Three Months Ended (Unaudited, in thousands) September 30, 2025 Net Income Attributable to the Company $ 2,914 Depreciation and Amortization of Real Estate 14,913 Gain on Disposition of Assets (1,373) Provision for Impairment 68 Unrealized Loss & Realized Gain on Investment Securities 1,115 Distributions to Preferred Stockholders (1,878) Loss on Extinguishment of Debt 53 Amortization of Intangibles to Lease Income (180) Straight-Line Rent Adjustment (405) Other Depreciation and Amortization 1 Amortization of Loan Costs, Discount on Convertible Debt, and Capitalized Interest 181 Non-Cash Compensation 936 Other Non-Recurring Items (1) (519) Interest Expense, Net of Amortization of Loan Costs and Discount on Convertible Debt 6,651 Adjusted EBITDA $ 22,477 Annualized Adjusted EBITDA $ 89,908 Pro Forma Annualized Impact of Current Quarter Investments and Dispositions, Net (2) (110) Pro Forma Adjusted EBITDA $ 89,798 Total Long-Term Debt $ 604,163 Financing Costs, Net of Accumulated Amortization 2,637 Cash and Cash Equivalents (9,281) Net Debt $ 597,519 Net Debt to Pro Forma Adjusted EBITDA 6.7 x |
| Investor Inquiries: ir@ctoreit.com |