☒ QUARTERLY REPORT PURSUANT TO SECTION 13 OR 15(d) OF THE SECURITIES EXCHANGE ACT OF 1934
For the Quarterly Period Ended March 31, 2026
OR
☐ TRANSITION REPORT PURSUANT TO SECTION 13 OR 15(d) OF THE SECURITIES EXCHANGE ACT OF 1934
For the Transition Period from to
COMMISSION FILE NUMBER: 000-16509
CITIZENS, INC.
(Exact name of registrant as specified in its charter)
Colorado
84-0755371
(State or other jurisdiction of incorporation or organization)
(I.R.S. Employer Identification No.)
11815 Alterra Pkwy, Floor 15, Austin, TX78758
(Current Address)
Registrant's telephone number, including area code: (512) 837-7100
Securities registered pursuant to Section 12(b) of the Act
Class A Common Stock
CIA
NYSE
(Title of each class)
(Trading symbol(s))
(Name of each exchange on which registered)
Indicate by check mark whether the registrant: (1) has filed all reports required to be filed by Section 13 or 15(d) of the Securities Exchange Act of 1934 during the preceding 12 months (or for such shorter period that the registrant was required to file such reports), and (2) has been subject to such filing requirements for the past 90 days.xYeso No
Indicate by check mark whether the registrant has submitted electronically every Interactive Data File required to be submitted pursuant to Rule 405 of Regulation S-T (§232.405 of this chapter) during the preceding 12 months (or for such shorter period that the registrant was required to submit such files). xYesoNo
Indicate by check mark whether the registrant is a large accelerated filer, an accelerated filer, a non-accelerated filer, a smaller reporting company or an emerging growth company. See the definitions of "large accelerated filer," "accelerated filer," "smaller reporting company" and "emerging growth company" in Rule 12b-2 of the Exchange Act:
Large accelerated filer
☐
Accelerated filer
☒
Non-accelerated filer
☐
Smaller reporting company
☒
Emerging growth company
☐
If an emerging growth company, indicate by check mark if the registrant has elected not to use the extended transition period for complying with any new or revised financial accounting standards provided pursuant to Section 13(a) of the Exchange Act. o
Indicate by check mark whether the registrant is a shell company (as defined in Rule 12b-2 of the Exchange Act). ☐ Yes x No
As of May 1, 2026, the Registrant had 50,553,564 shares of Class A common stock outstanding.
Class A, no par value, 100,000,000 shares authorized, 54,662,129 and 54,625,652 shares issued and outstanding in 2026 and 2025, respectively, including shares in treasury of 4,327,810 in 2026 and 2025
272,771
272,294
Class B, no par value, 2,000,000 shares authorized, 1,001,714 shares issued and outstanding in 2026 and 2025, including shares in treasury of 1,001,714 in 2026 and 2025
3,184
3,184
Retained earnings
73,921
71,653
Accumulated other comprehensive income (loss)
(87,483)
(88,421)
Treasury stock, at cost
(23,725)
(23,725)
Total stockholders' equity
238,668
234,985
Total liabilities and stockholders' equity
$
1,739,500
1,754,760
See accompanying Notes to Consolidated Financial Statements.
Net increase (decrease) in cash and cash equivalents
(4,456)
(10,916)
Cash and cash equivalents at beginning of year
22,976
29,271
Cash and cash equivalents at end of period
$
18,520
18,355
SUPPLEMENTAL DISCLOSURES OF NONCASH INVESTING AND FINANCING ACTIVITIES:
During the three months ended March 31, 2025, various fixed maturity issuers exchanged securities with book values of $5.7 million for securities of equal value and none during the three months ended March 31, 2026.
The Company had $1.9 million net unsettled security trades at March 31, 2026 and $0.3 million at March 31, 2025.
See accompanying Notes to Consolidated Financial Statements.
The consolidated financial statements include the accounts and operations of Citizens, Inc. ("Citizens" or the "Company"), a Colorado corporation, and its wholly-owned subsidiaries, CICA Life Insurance Company of America ("CLOA"), CICA Life Ltd. ("CICA Bermuda"), Security Plan Life Insurance Company ("SPLIC"), Magnolia Guaranty Life Insurance Company ("MGLIC"), Computing Technology, Inc. ("CTI"), and Nexo Global Services LLC, a Puerto Rico holding company ("Nexo") and its wholly-owned subsidiaries, CICA Life A.I., a Puerto Rico company ("CICA International") and Nexo Enrollment Services LLC, a Puerto Rico service company ("NES"). All significant inter-company accounts and transactions have been eliminated. Citizens and its wholly-owned subsidiaries are collectively referred to as the "Company," "it," "we," "us" or "our".
The consolidated balance sheet as of March 31, 2026, the consolidated statements of operations and comprehensive income (loss) and stockholders' equity for the three months ended March 31, 2026 and March 31, 2025 and the consolidated statements of cash flows for the three months ended March 31, 2026 and March 31, 2025 have been prepared by the Company without audit and are not subject to audit. In the opinion of management, all normal and recurring adjustments to present fairly the financial position, results of operations, and changes in cash flows at March 31, 2026 and for comparative periods have been made. The consolidated financial statements have been prepared in accordance with U.S. generally accepted accounting principles ("U.S. GAAP") for interim financial information and with the instructions to Form 10-Q adopted by the Securities and Exchange Commission ("SEC"). Accordingly, the consolidated financial statements do not include all the information and footnotes required for complete financial statements and should be read in conjunction with the Company’s consolidated financial statements and notes thereto included in our Annual Report on Form 10-K for the year ended December 31, 2025 ("2025 Form 10-K"). Operating results for the interim periods disclosed herein are not necessarily indicative of the results that may be expected for a full year or any future period.
The Company operates through two segments: International Insurance and Domestic Insurance.
International Insurance. All International policies are issued by CICA International. CICA International offers U.S. dollar-denominated products to non-U.S. residents/citizens internationally, including endowment products, which are principally accumulation contracts that incorporate an element of life insurance protection and whole life insurance. These contracts are designed to provide a fixed amount of insurance coverage over the life of the insured and may utilize rider benefits to provide additional increasing or decreasing coverage and annuity benefits to enhance accumulations.
NES provides services to policyholders of CICA International.
Domestic Insurance. Our Domestic Insurance segment operates through our subsidiaries CLOA, which issues whole life, final expense and life products with living benefits throughout the U.S. and SPLIC and MGLIC, which focus on the life insurance needs of the lower-income markets, primarily in Louisiana, Mississippi and Arkansas. Our products in this segment consist primarily of small face amount whole life, industrial life and pre-need policies, which are designed to fund final expenses for the insured, primarily relating to funeral and burial costs. SPLIC also issues critical illness policies.
CTI provides data processing systems and services to the Company.
USE OF ESTIMATES
The preparation of consolidated financial statements in conformity with U.S. GAAP requires management to make estimates and assumptions that affect the reported amounts of assets and liabilities and disclosure of contingent
assets and liabilities at the date of the consolidated financial statements and the reported amounts of revenues and expenses during the reporting period. Actual results could differ materially from these estimates.
Significant estimates include those used in the evaluation of credit losses on fixed maturity securities, valuation allowances on deferred tax assets, and actuarially determined assets and liabilities. Certain of these estimates are particularly sensitive to market conditions, and deterioration and/or volatility in the worldwide debt or equity markets could have a material impact on the consolidated financial statements.
SIGNIFICANT ACCOUNTING POLICIES
For a description of all significant accounting policies, see Part IV, Item 15, Note 1. Summary of Significant Accounting Policies in the notes to our consolidated financial statements included in our 2025 Form 10-K, which should be read in conjunction with these accompanying consolidated financial statements.
(2) ACCOUNTING PRONOUNCEMENTS
ACCOUNTING STANDARDS NOT YET ADOPTED
In November 2024, the Financial Accounting Standards Board ("FASB") issued Accounting Standards Update ("ASU") 2024-03, "Income Statement - Reporting Comprehensive Income - Expense Disaggregation Disclosures (Subtopic 220-40): Disaggregation of Income Statement Expenses", which is intended to enhance expense disclosures by requiring additional disaggregation of certain costs and expenses, on an interim and annual basis, within the footnotes to the financial statements. ASU 2024-03 is effective for annual periods beginning after December 15, 2026, and interim reporting periods beginning after December 15, 2027. Early adoption is permitted, and the amendments may be applied either prospectively or retrospectively. This ASU will impact only our disclosures and not our financial condition or results of operations. We are currently evaluating the impact of adopting this pronouncement on the notes to the consolidated financial statements.
No other new accounting pronouncements issued or effective during the year had, or is expected to have, a material impact on our consolidated financial statements.
(3) INVESTMENTS
The Company invests primarily in fixed maturity securities as shown below.
The following tables represent the amortized cost, gross unrealized gains and losses and fair value of fixed maturity securities as of the dates indicated.
The Company's investments in equity securities are shown below.
Fair Value
(In thousands)
March 31, 2026
December 31, 2025
Equity securities:
Bond mutual funds
$
217
219
Common stocks
1,227
1,130
Non-redeemable preferred stock
7
7
Total equity securities
$
1,451
1,356
VALUATION OF INVESTMENTS
Available-for-sale ("AFS") fixed maturity securities are reported in the consolidated financial statements at fair value with the change in fair value recorded through other comprehensive income (loss). Equity securities are also measured at fair value in the consolidated financial statements with the change in fair value recorded through net income (loss). The Company recognized net investment related gains of $0.1 million and $47 thousand for the three months ended March 31, 2026 and 2025, respectively, on equity securities held.
The Company considers several factors in its review and evaluation of individual investments, using the process described in Part IV, Item 15, Note 2. Investments in the notes to the consolidated financial statements of our 2025 Form 10-K to determine whether a credit valuation loss exists. For the three months ended March 31, 2026 and 2025, the Company recorded no credit valuation losses on fixed maturity securities.
For fixed maturity security investments that have unrealized losses as of March 31, 2026 and December 31, 2025, the gross unrealized losses and related fair values that have been in a continuous unrealized loss position by timeframe are as follows.
In each category of our fixed maturity securities described above, we do not intend to sell our investments, and it is not more likely than not that the Company will be required to sell the investments before recovery of their amortized cost bases. As of March 31, 2026 and December 31, 2025, 98.8% and 98.7% of the fair value of our fixed maturity securities portfolio, respectively, were rated investment grade. While the losses are currently unrealized, we continue to monitor all fixed maturity securities on an on-going basis as future information may become available which could result in an allowance being recorded.
These unrealized losses on fixed maturity securities are due to noncredit-related factors, including changes in credit spreads and rising interest rates since purchase, which have little bearing on the recoverability of our investments, hence they are not recognized as credit losses. The fair value is expected to recover as the securities approach maturity or if market yields for such investments decline.
The amortized cost and fair value of fixed maturity securities at March 31, 2026 by contractual maturity are shown in the table below. Actual maturities may differ from contractual maturities because borrowers may have the right to call or prepay obligations with or without call or prepayment penalties. Securities not due at a single maturity date have been reflected based upon final stated maturity.
The Company uses the specific identification method of the individual security to determine the cost basis used in the calculation of realized gains and losses related to security sales.
Three Months Ended
March 31,
(In thousands)
2026
2025
Fixed maturity securities, available-for-sale:
Proceeds
$
11,761
65
Gross realized gains
$
55
1
Gross realized losses
$
368
4
(4) FAIR VALUE MEASUREMENTS
Fair value is the price that would be received to sell an asset or paid to transfer a liability in an orderly transaction between market participants at the measurement date. We hold AFS fixed maturity securities, which are carried at fair value with changes in fair value reported through other comprehensive income (loss). We also report our equity securities and certain other long-term investments at fair value with changes in fair value reported through the consolidated statements of operations and comprehensive income (loss).
Fair value measurements are generally based upon observable and unobservable inputs. Observable inputs reflect market data obtained from independent sources, while unobservable inputs reflect our view of market assumptions in the absence of observable market information. We utilize valuation techniques that maximize the use of observable inputs and minimize the use of unobservable inputs. All assets and liabilities carried at fair value are required to be classified and disclosed in one of the following three categories.
•Level 1 - Quoted prices for identical instruments in active markets.
•Level 2 - Quoted prices for similar instruments in active markets; quoted prices for identical or similar instruments in markets that are not active; and model-derived valuations whose inputs or whose significant value drivers are observable.
•Level 3 - Instruments whose significant value drivers are unobservable.
Level 1 primarily consists of financial instruments whose value is based on quoted market prices such as U.S. Treasury securities and actively traded mutual fund and stock investments.
Level 2 includes those financial instruments that are valued by independent pricing services or broker quotes. These pricing models are primarily industry-standard models that consider various inputs, such as interest rates, credit spreads and foreign exchange rates for the underlying financial instruments. All significant inputs are observable or derived from observable information in the marketplace or are supported by observable levels at which transactions are executed in the marketplace. Financial instruments in this category primarily include corporate securities, U.S. Government-sponsored enterprise securities, securities issued by states and political subdivisions and certain mortgage and asset-backed securities.
Level 3 is comprised of financial instruments whose fair value is estimated based on non-binding broker prices utilizing significant inputs not based on or corroborated by readily available market information. We have no investments in this category.
The following tables set forth our assets measured at fair value on a recurring basis as of the dates indicated.
March 31, 2026
Level 1
Level 2
Level 3
Total Fair Value
(In thousands)
Financial assets:
Fixed maturity securities:
U.S. Treasury and U.S. Government-sponsored enterprises
$
5,607
1,335
—
6,942
States and political subdivisions
—
262,058
—
262,058
Corporate
40
862,808
—
862,848
Commercial mortgage-backed
—
9,042
—
9,042
Residential mortgage-backed
—
97,639
—
97,639
Asset-backed
—
32,582
—
32,582
Total fixed maturity securities
5,647
1,265,464
—
1,271,111
Equity securities:
Bond mutual funds
217
—
—
217
Common stocks
1,227
—
—
1,227
Non-redeemable preferred stock
7
—
—
7
Total equity securities
1,451
—
—
1,451
Other long-term investments (1)
—
—
—
86,308
Total financial assets
$
7,098
1,265,464
—
1,358,870
(1) In accordance with Subtopic 820-10, certain investments that are measured at fair value using the net asset value per share (or its equivalent) practical expedient are not classified in the fair value hierarchy. The fair value amounts presented in this table are intended to permit reconciliation of the fair value hierarchy to the amounts presented in the consolidated balance sheets.
U.S. Treasury and U.S. Government-sponsored enterprises
$
5,654
1,354
—
7,008
States and political subdivisions
—
268,792
—
268,792
Corporate
42
866,828
—
866,870
Commercial mortgage-backed
—
8,894
—
8,894
Residential mortgage-backed
—
103,088
—
103,088
Asset-backed
—
33,209
—
33,209
Total fixed maturity securities
5,696
1,282,165
—
1,287,861
Equity securities:
Bond mutual funds
219
—
—
219
Common stocks
1,130
—
—
1,130
Non-redeemable preferred stock
7
—
—
7
Total equity securities
1,356
—
—
1,356
Other long-term investments (1)
—
—
—
85,157
Total financial assets
$
7,052
1,282,165
—
1,374,374
(1) In accordance with Subtopic 820-10, certain investments that are measured at fair value using the net asset value per share (or its equivalent) practical expedient are not classified in the fair value hierarchy. The fair value amounts presented in this table are intended to permit reconciliation of the fair value hierarchy to the amounts presented in the consolidated balance sheets.
FINANCIAL INSTRUMENTS VALUATION
FINANCIAL INSTRUMENTS CARRIED AT FAIR VALUE
Fixed maturity securities, available-for-sale. At March 31, 2026, fixed maturity securities, valued using a third-party pricing source, totaled $1.3 billion for Level 2 assets and comprised 93.1% of total reported fair value of our financial assets. The Level 1 and Level 2 valuations are reviewed and updated quarterly through testing by comparisons to separate pricing models, other third-party pricing services, and back tested to recent trades. In addition, we obtain information annually relative to the third-party pricing models and review model parameters for reasonableness. There were no Level 3 assets as of March 31, 2026. For the three months ended March 31, 2026, there were no material changes to the valuation methods or assumptions used to determine fair values, and no broker or third-party prices were changed from the values received.
Equity securities. Our equity securities are classified as Level 1 assets as their fair values are based upon quoted market prices.
Structured note.At March 31, 2026, the Company held an investment in a structured note, which includes components classified as fixed maturity securities and other long-term investments on the consolidated balance sheets. The partner interest is included in other long-term investments and is measured at its net asset value ("NAV") of $2.6 million as a practical expedient, which approximates fair value. The Company recognized investment related losses of $0.1 million for the three months ended March 31, 2026. These investments are included in other long-term investments on the consolidated balance sheets. As of March 31, 2026, we are committed to funding this structured note investment up to $4.1 million over the next nine years.
Limited partnerships. The Company considers the NAV to represent the value of the investment fund and is measured by the total value of assets minus the total value of liabilities. The following table includes information
related to our investments in limited partnerships that calculate NAV per share. For these investments, which are measured at fair value on a recurring basis, we use the NAV per share to measure fair value. The Company recognized net investment related gains of $1.8 million and losses of $1.5 million on limited partnerships held for the three months ended March 31, 2026 and 2025, respectively. These investments are included in other long-term investments on the consolidated balance sheets.
March 31, 2026
December 31, 2025
(In thousands, except for years)
Fair Value Using NAV Per Share
Unfunded Commit- ments
Range
(In years)
Fair Value Using NAV Per Share
Unfunded Commit- ments
Range
(In years)
Description
Limited partnerships:
Middle market
Investments in privately-originated, performing senior secured debt primarily in North America-based companies
$
29,385
—
2
$
30,956
—
2
Late-stage growth
Investments in private late-stage, established companies seeking capital to accelerate growth prior to an IPO or sale
39,603
1,558
2 to 4
36,623
2,232
2 to 4
Infrastructure
Investments in environmental infrastructure and related technology, focusing on renewable power generation and distribution
14,738
2,638
8
15,013
4,052
8
Total limited partnerships
$
83,726
4,196
$
82,592
6,284
The majority of our limited partnership investments are not redeemable because distributions from the funds will be received when the underlying investments of the funds are liquidated. The life spans indicated above may be shortened or extended at the fund manager's discretion, typically in one or two-year increments.
FINANCIAL INSTRUMENTS NOT CARRIED AT FAIR VALUE
Estimates of fair values are made at a specific point in time, based on relevant market prices and information about the financial instruments. The estimated fair values of financial instruments presented below are not necessarily indicative of the amounts the Company might realize in actual market transactions.
The carrying amount and fair value for the financial assets and liabilities on the consolidated financial statements not otherwise disclosed for the periods indicated were as follows:
March 31, 2026
December 31, 2025
(In thousands)
Carrying Value
Fair Value
Carrying Value
Fair Value
Financial assets:
Policy loans
$
67,217
67,217
67,455
67,455
Residential mortgage loan
22
22
24
24
Cash and cash equivalents
18,520
18,520
22,976
22,976
Financial liabilities:
Annuity - investment contracts
69,134
63,098
68,975
64,066
Policy loans. Policy loans had a weighted average annual interest rate of 7.7% at both March 31, 2026 and December 31, 2025 and no specified maturity dates. Policy loans are an integral part of the life insurance policies we have in force, cannot be valued separately and are not marketable. Therefore, the fair value of policy loans
approximates the carrying value reflected on the consolidated balance sheets are considered Level 3 assets in the fair value hierarchy.
Residential mortgage loan. The mortgage loan is secured by a residential property. The interest rate for this loan was 7.0% at both March 31, 2026 and December 31, 2025. At March 31, 2026, the remaining loan matures in two years. Management estimated the fair value using an annual interest rate of 6.25% at both March 31, 2026 and December 31, 2025. Our mortgage loan is considered a Level 3 asset in the fair value hierarchy and is included in other long-term investments on the consolidated balance sheets.
Cash and cash equivalents. The fair value of cash and cash equivalents approximates carrying value and these assets are characterized as Level 1 assets in the fair value hierarchy.
Annuity liabilities. The fair value of the Company's liabilities under annuity contracts, which are considered Level 3 liabilities, was estimated at March 31, 2026 and December 31, 2025 using discounted cash flows based upon spot rates adjusted for various risk adjustments ranging from 3.63% to 5.10% and 3.31% to 4.98%, respectively. The fair value of liabilities under all insurance contracts are taken into consideration in the overall management of interest rate risk, which seeks to minimize exposure to changing interest rates through the matching of investment maturities with amounts due under insurance contracts.
Other long-term investments.Financial instruments included in other long-term investments are classified in various levels of the fair value hierarchy. The following table summarizes the carrying amounts of these investments.
Carrying Value
(In thousands)
March 31, 2026
December 31, 2025
Other long-term investments:
Limited partnerships
$
83,726
82,592
Structured note
2,582
2,565
FHLB common stock
224
222
All other investments
58
60
Total other long-term investments
$
86,590
85,439
We are a member of the Federal Home Loan Bank ("FHLB") of Dallas and such membership requires members to own stock in the FHLB. Our FHLB stock is carried at amortized cost, which approximates fair value.
(5) DEFERRED POLICY ACQUISITION COSTS AND COST OF INSURANCE ACQUIRED
DAC
The following tables roll forward the deferred policy acquisition costs ("DAC") and cost of insurance acquired ("COIA") balances for the three months ended March 31, 2026 and 2025 by reporting cohort. Our reporting cohorts are Permanent, which summarizes insurance policies with premiums payable over the lifetime of the policy, and
Permanent Limited Pay, which summarizes insurance policies with premiums payable for a limited time after which the policy is fully paid up. Both reporting cohorts include whole life and endowment policies.
The Domestic Insurance segment is the only segment that recognizes COIA; therefore, the balances for the three months ended March 31, 2026 and 2025 on a consolidated basis by reporting cohort are shown below.
(In thousands)
Permanent
Permanent Limited Pay
Other Business
Total
Three Months Ended March 31, 2026
Balance, beginning of year
$
7,036
764
1,195
8,995
Amortization expense
(93)
(9)
(86)
(188)
Balance, end of year
$
6,943
755
1,109
8,807
Three Months Ended March 31, 2025
Balance, beginning of year
$
7,424
809
1,213
9,446
Amortization expense
(99)
(13)
14
(98)
Balance, end of year
$
7,325
796
1,227
9,348
(6) POLICYHOLDERS’ LIABILITIES
LIABILITY FOR FUTURE POLICY BENEFITS
The following tables summarize balances of and changes in the liability for future policy benefits for our reporting cohorts: Permanent, which summarizes insurance policies with premiums payable over the lifetime of the policy,
and Permanent Limited Pay, which summarizes insurance policies with premiums payable for a limited time after which the policy is fully paid up. Both reporting cohorts include whole life and endowment policies.
March 31, 2026
(In thousands)
International Insurance
Domestic Insurance
Permanent
Permanent Limited Pay
Total
Permanent
Permanent Limited Pay
Total
Present Value of Expected Net Premiums:
Balance, beginning of year
$
241,394
20,592
261,986
189,845
13,052
202,897
Beginning balance at original discount rate
$
242,912
20,405
263,317
192,071
13,446
205,517
Effect of actual variances from expected experience
937
11
948
(13,394)
(690)
(14,084)
Adjusted beginning of year balance
243,849
20,416
264,265
178,677
12,756
191,433
Issuances
6,319
782
7,101
24,866
483
25,349
Interest accrual
2,466
201
2,667
2,080
122
2,202
Net premiums collected
(9,853)
(1,460)
(11,313)
(6,646)
(103)
(6,749)
Derecognition and other
190
44
234
(1,462)
(50)
(1,512)
Ending balance at original discount rate
242,971
19,983
262,954
197,515
13,208
210,723
Effect of changes in discount rates
(4,106)
23
(4,083)
(4,967)
(493)
(5,460)
Balance, end of period
$
238,865
20,006
258,871
192,548
12,715
205,263
Present Value of Expected Future Policy Benefits:
Balance, beginning of year
$
910,575
166,327
1,076,902
324,382
139,220
463,602
Beginning balance at original discount rate
$
932,243
174,075
1,106,318
339,821
152,775
492,596
Effect of actual variances from expected experience
1,845
721
2,566
(13,531)
(516)
(14,047)
Adjusted beginning of year balance
934,088
174,796
1,108,884
326,290
152,259
478,549
Issuances
6,433
773
7,206
24,867
482
25,349
Interest accrual
10,158
1,734
11,892
3,813
1,788
5,601
Benefit payments
(25,408)
(4,762)
(30,170)
(5,699)
(1,819)
(7,518)
Derecognition and other
75
168
243
(1,472)
8
(1,464)
Ending balance at original discount rate
925,346
172,709
1,098,055
347,799
152,718
500,517
Effect of changes in discount rates
(34,522)
(10,100)
(44,622)
(20,930)
(16,000)
(36,930)
Balance, end of period
$
890,824
162,609
1,053,433
326,869
136,718
463,587
Net liability for future policy benefits
$
651,959
142,603
794,562
134,321
124,003
258,324
Plus: Flooring impact
2
—
2
—
—
—
Less: Reinsurance recoverable
—
—
—
7,705
—
7,705
Net liability for future policy benefits, after reinsurance recoverable
The following table reconciles the net liability for future policy benefits shown above to the liability for future policy benefits reported in the consolidated balance sheets.
March 31, 2026
March 31, 2025
(In thousands)
International
Insurance
Domestic
Insurance
Consolidated
International
Insurance
Domestic Insurance
Consolidated
Life Insurance:
Permanent
$
651,961
126,616
778,577
675,686
125,167
800,853
Permanent limited pay
142,603
124,003
266,606
143,245
126,640
269,885
Deferred profit liability
27,650
39,332
66,982
25,011
36,878
61,889
Other
30,549
24,672
55,221
27,595
16,864
44,459
Total life insurance
852,763
314,623
1,167,386
871,537
305,549
1,177,086
Accident & Health Insurance:
Other
718
681
1,399
529
584
1,113
Total future policy benefit reserves
$
853,481
315,304
1,168,785
872,066
306,133
1,178,199
The following table provides the amount of undiscounted and discounted expected gross premiums and expected future benefit payments for long-term duration contracts.
The following tables summarize the amount of revenue and interest related to long-term duration contracts recognized in the consolidated statement of operations and comprehensive income (loss).
Three Months Ended March 31,
2026
2025
(In thousands)
Gross Premiums
Interest Expense
Gross Premiums
Interest Expense
International Insurance:
Life Insurance:
Permanent
$
21,242
7,692
21,767
8,081
Permanent Limited Pay
4,771
1,767
4,461
1,764
Other
(584)
—
(336)
—
Less:
Reinsurance
384
—
471
—
Total, net of reinsurance
25,045
9,459
25,421
9,845
Accident & Health Insurance:
Other
153
—
187
—
Total
$
25,198
9,459
25,608
9,845
Domestic Insurance:
Life Insurance:
Permanent
$
15,666
1,733
13,389
1,652
Permanent Limited Pay
1,973
2,133
2,123
2,107
Other
453
—
497
—
Less:
Reinsurance
3,610
—
2,082
—
Total, net of reinsurance
14,482
3,866
13,927
3,759
Accident & Health Insurance:
Other
258
—
262
—
Total
$
14,740
3,866
14,189
3,759
The following table provides the weighted-average durations of the liability for future policy benefits.
The following table provides the weighted-average interest rates for the liability for future policy benefits.
March 31, 2026
March 31, 2025
International
Insurance
Domestic
Insurance
International
Insurance
Domestic
Insurance
Permanent:
Interest rate at original discount rate
4.81
%
4.96
%
4.84
%
4.91
%
Interest rate at current discount rate
5.07
%
5.64
%
5.12
%
5.50
%
Permanent Limited Pay:
Interest rate at original discount rate
4.21
%
4.84
%
4.16
%
4.83
%
Interest rate at current discount rate
5.10
%
5.60
%
5.09
%
5.46
%
LIABILITY FOR POLICYHOLDERS’ ACCOUNT BALANCES
The following table presents the policyholders' account balances by range of guaranteed minimum crediting rates and the related range of the difference, in basis points, between rates being credited and the respective guaranteed minimums.
The following table reconciles policyholders' account balances shown above to the policyholders' account balance liability in the consolidated balance sheets.
As of March 31,
(In thousands)
2026
2025
Annuities:
Supplemental contracts without life contingencies
$
91,260
67,838
Fixed annuity
88,423
88,708
Unearned revenue reserve
1,492
1,488
Total annuities
$
181,175
158,034
Premiums paid in advance:
Premiums paid in advance
$
27,141
29,973
Other
2,539
1,991
Total premiums paid in advance
$
29,680
31,964
(7) REINSURANCE
In the normal course of business, the Company reinsures portions of certain policies that we underwrite to mitigate exposure to potential losses and/or to provide additional capacity for growth. In CICA International, prior to April 1, 2025, we retained up to $100,000 on any one individual life insurance policy and reinsured the death benefit amount. For new policies beginning on such date, we increased our retention amount to $250,000 and reinsure amounts above that. We also reinsure 100% of our accidental death benefit rider coverage. In CLOA, we have a coinsurance agreement with RGA Reinsurance Company ("RGA"). Under this agreement, CLOA has elected RGA to reinsure 50% of its final expense business. The Company remains contingently liable in the event that any of the reinsurers are unable to meet their obligations under any reinsurance agreement.
Our amounts recoverable from reinsurers represent receivables from and reserves ceded to reinsurers. We obtain reinsurance from multiple reinsurers and monitor our reinsurance concentration as well as the financial strength ratings of our reinsurers. Their ratings by A.M. Best Company range from A- (Excellent) to A+ (Superior).
A summary of life insurance in force, along with assumed and ceded reinsurance activity, is summarized below as of the periods indicated.
The Company's reinsurance recoverable on ceded reinsurance was $12.9 million and $10.9 million as of March 31, 2026 and December 31, 2025, respectively. Premiums, claims and surrenders assumed and ceded, and expenses ceded for all lines of business are summarized for the periods indicated below.
Three Months Ended
March 31,
(In thousands)
2026
2025
Premiums from short duration contracts:
Direct
$
412
449
Ceded
(1)
(1)
Net premiums earned
411
448
Premiums from long duration contracts:
Direct
43,520
41,901
Assumed
15
11
Ceded
(4,008)
(2,563)
Net premiums earned
39,527
39,349
Total premiums earned
$
39,938
39,797
Claims and surrenders assumed
$
20
(40)
Claims and surrenders ceded
$
(744)
(677)
Commissions assumed and ceded
$
(2,971)
(3,125)
Other general expenses ceded
$
(803)
(588)
(8) COMMITMENTS AND CONTINGENCIES
LITIGATION AND REGULATORY ACTIONS
From time to time, we are subject to legal and regulatory actions relating to our business. We may incur defense costs, including attorneys' fees, and other direct litigation costs associated with defending claims. If we suffer an adverse judgment as a result of litigation claims, it could have a material adverse effect on our business, results of operations and financial condition. Part I. Item 3. Legal Proceedings and Part IV. Item 1. Note 8. Commitments and Contingencies of our consolidated financial statements and notes thereto included in the 2025 Form 10-K includes a discussion of our legal proceedings. There have been no material developments in the three months ended March 31, 2026 from the legal proceedings described in our consolidated financial statements and notes thereto included in the 2025 Form 10-K.
CONTRACTUAL OBLIGATIONS
As of March 31, 2026, we committed to funding investments up to $8.3 million related to limited partnership and structured note investments previously described.
CREDIT FACILITY
On May 3, 2024, the Company renewed its $20 million senior secured revolving credit facility (the “Credit Facility”) with Regions Bank ("Regions"). The Credit Facility has a three-year term, maturing on May 5, 2027, and allows the Company to borrow up to $20 million for working capital purposes, capital expenditures and other corporate purposes.
Revolving loans may be requested by the Company in aggregate minimum principal amounts of $0.5 million per loan. At the Company's election, the revolving loans may either bear a rate (a fluctuating rate per annum) equal to
the greatest of (a) Regions' prime rate, (b) the federal funds rate plus 0.50%, (c) the index rate plus 1.00% or (d) 0.75%. The Company is required to pay Regions an annual commitment fee of 0.375% of the unused portion of the Credit Facility in quarterly installments, which the Company expenses as it is incurred.
Obligations under the Credit Facility are secured by substantially all of the assets of the Company other than the equity interests in its subsidiaries, real estate owned by the Company, and other limited exceptions. The Credit Facility contains customary events of default and financial, affirmative and negative covenants including, but not limited to, restrictions on indebtedness, liens, investments, asset dispositions and restricted payments. As of March 31, 2026, the Company had not borrowed any funds against the Credit Facility and was not in violation of any covenants.
(9) STOCKHOLDERS' EQUITY AND RESTRICTIONS
STOCK
Our Restated and Amended Articles of Incorporation authorize the issuance of 127,000,000 shares, of which 100,000,000 shares shall be Class A common stock, 2,000,000 shares shall be Class B common stock, and 25,000,000 shall be preferred stock. Both authorized classes of common stock are equal in all respects, except (a) each share of Class A common stock is entitled to receive twice the cash dividends paid on a per share basis to the Class B common stock, if any; and (b) the holders of the Class B common stock have the exclusive right to elect a simple majority of the Board of Directors of Citizens. Citizens currently has no outstanding preferred stock or Class B common stock.
A summary of the change in the number of shares of Class A common stock and treasury stock issued is as follows:
2026
2025
Three Months Ended March 31,
(In thousands)
Common Stock Class A
Treasury Stock
Common Stock Class A
Treasury Stock
Balance at beginning of year
54,626
5,330
54,235
5,330
Stock issued for compensation
36
—
1
—
Balance at end of period
54,662
5,330
54,236
5,330
EARNINGS PER SHARE
The following table sets forth the computation of basic and diluted earnings per share of Class A common stock.
Three Months Ended March 31,
2026
2025
(In thousands, except per share amounts)
Basic and diluted earnings per share:
Net income (loss)
$
2,268
(1,623)
Weighted average shares of Class A outstanding - basic
50,308
49,908
Weighted average shares of Class A outstanding - diluted(1)
51,580
50,912
Basic earnings (loss) per share of Class A common stock
$
0.05
(0.03)
Diluted earnings (loss) per share of Class A common stock
0.04
(0.03)
(1) Because the Company reported a net loss for the three months ended March 31, 2025, the effect of all potentially dilutive securities was excluded from the calculation of diluted earnings per share as it would be anti-dilutive.
Each of our domestic regulated insurance subsidiaries is required to meet stipulated regulatory capital requirements imposed by the U.S. National Association of Insurance Commissioners ("NAIC"). All domestic insurance subsidiaries exceeded the minimum capital requirements at March 31, 2026. On March 27, 2024, Citizens and the Colorado Division of Insurance entered into a capital maintenance agreement that specifies that Citizens will infuse capital as needed to ensure that CLOA's RBC remains above 350%. As CLOA's RBC exceeded 350% at March 31, 2026, no capital contribution was necessary.
CICA International is a Puerto Rico domiciled company. The Insurance Code of Puerto Rico does not specifically set forth minimum capital and surplus standards but rather requires that an insurer submit a business plan for approval to the Office of the Commissioner of Insurance ("OIC") that includes proposed minimum capital and surplus. CICA International is required to maintain a minimum of $750,000 in capital and maintain a premium to surplus ratio of 7 to 1. At March 31, 2026, CICA International's capital exceeds both the required minimum capital and related ratio.
(10) SEGMENT AND OTHER OPERATING INFORMATION
The Company's segments are defined by management's reporting structure and operating activities. The chief operating decision maker ("CODM"), our President and Chief Executive Officer, reviews and analyzes income statement information by segment to make decisions, assess financial performance and allocate resources across the Company in order to meet the overall strategic objectives of the Company. The Company has two reportable segments: International Insurance and Domestic Insurance.
Our International Insurance segment issues endowment contracts, which are principally accumulation contracts that incorporate an element of life insurance protection, and whole life insurance to non-U.S. residents through CICA International. These contracts are designed to provide a fixed amount of insurance coverage over the life of the insured and may utilize rider benefits to provide additional coverage and annuity benefits to enhance accumulations.
Our Domestic Insurance segment operates through our subsidiaries: CLOA, which issues whole life, final expense and life products with living benefits throughout the U.S.; and SPLIC and MGLIC, which focus on the life insurance needs of the lower-income markets, primarily in Louisiana, Mississippi, and Arkansas. SPLIC also issues critical illness policies. Our policies are sold and serviced through independent agents.
The International Insurance and Domestic Insurance portions of the Company constitute separate businesses. In addition to the International Insurance and Domestic Insurance business, the Company also operates other non-insurance portions of the Company ("Other Non-Insurance Enterprises"), which primarily include the Company’s IT and corporate-support functions.
The accounting policies of the reportable segments and Other Non-Insurance Enterprises are presented in accordance with U.S. GAAP and are the same as those described in the summary of significant accounting policies in our 2025 Form 10-K. The CODM evaluates profit and loss performance based on U.S. GAAP income (loss) before federal income tax for its two reportable segments. The Company's Other Non-Insurance Enterprises represents the only reportable difference between segments and consolidated operations.
Increase (decrease) in future policy benefit reserves
(6,856)
3,210
—
(3,646)
Policyholder liability remeasurement (gain) loss
93
(265)
—
(172)
Policyholders' dividends
1,185
110
—
1,295
Total insurance benefits paid or provided
27,456
10,119
—
37,575
Commissions
5,103
6,172
—
11,275
Other general expenses
5,295
5,060
2,338
12,693
Capitalization of deferred policy acquisition costs
(4,787)
(4,062)
—
(8,849)
Amortization of deferred policy acquisition costs
3,466
1,181
—
4,647
Amortization of cost of insurance acquired
—
98
—
98
Total benefits and expenses
36,533
18,568
2,338
57,439
Income (loss) before federal income tax
$
(195)
558
(2,150)
(1,787)
The Company categorizes premiums in two categories - first year premiums are premiums received within the first 12 months of a policy's issuance and any premiums received thereafter are renewal premiums. A summary of the premiums for the International Insurance segment is detailed below.
A summary of the Domestic Insurance segment premium breakout is detailed below.
(In thousands)
Three Months Ended March 31,
2026
2025
Direct premiums:
First year
$
5,680
5,425
Renewal
12,670
10,846
Total direct premiums
18,350
16,271
Reinsurance
(3,610)
(2,082)
Total premiums
$
14,740
14,189
The table below summarizes assets by segment.
(In thousands)
March 31, 2026
December 31, 2025
Assets:
Segments:
International Insurance
$
1,178,768
1,190,736
Domestic Insurance
529,478
529,357
Total Segments
1,708,246
1,720,093
Other Non-Insurance Enterprises
31,254
34,667
Total assets
$
1,739,500
1,754,760
GEOGRAPHIC INFORMATION
The following table sets forth the Company's annual total of earned premiums by country of policyholder residence for the periods indicated.
Three Months Ended March 31,
(In thousands)
2026
2025
Area:
United States
$
18,521
16,500
Colombia
6,825
6,554
Taiwan
3,406
3,886
Venezuela
3,178
3,350
Ecuador
2,996
3,200
Argentina
2,602
2,096
Other foreign countries
9,125
9,702
Reinsurance and change in premium accruals
(6,715)
(5,491)
Total premiums
$
39,938
39,797
(11) INCOME TAXES
The effective tax rate is the ratio of tax expense or tax benefit over pre-tax income. The tax effective rate was 4.5% for the three months ended March 31, 2026, compared to an effective tax benefit rate of 9.2% for the same period in
2025. CICA International is considered a controlled foreign corporation for federal income tax purposes. As a result, the insurance activity of CICA International is subject to Subpart F of the Internal Revenue Code and is included in Citizens’ taxable income. The Government of Puerto Rico approved a tax exemption decree for CICA International which freezes the income tax rate at 0% on taxable earnings up to $1.2 million and 4% on taxable earnings in excess of $1.2 million for a minimum of 15 years. The effective tax rate varies from the prevailing corporate federal income tax rate of 21% mainly due to the impact of Subpart F and the reduced Puerto Rico income tax rate.
At March 31, 2026 and 2025, we determined it was more likely than not that a portion of our capital deferred tax assets would not be realized in their entirety. The Company recorded valuation allowances of $4.7 million at March 31, 2026 and 2025, in accumulated other comprehensive income (loss) on the consolidated balance sheets.
(12) OTHER COMPREHENSIVE INCOME (LOSS)
The changes in the components of other comprehensive income (loss) are reported net of the effects of income taxes of 21% for domestic entities and 4% for Puerto Rican entities for the three months ended March 31, 2026 and 2025. The following table provides a rollforward of accumulated other comprehensive income (loss) for the periods indicated below.
(In thousands)
Unrealized Gains and Losses on Available for Sale Securities
Discount Rate for Liability for Future Policy Benefits
Other Comprehensive Income (Loss)
Balance at December 31, 2025, net of tax
$
(136,344)
47,923
(88,421)
Other comprehensive income (loss) before reclassification, before tax
(16,295)
17,135
840
Amounts reclassified from other comprehensive income (loss), before tax
412
—
412
Income tax benefit (expense)
1,191
(1,505)
(314)
Balance at March 31, 2026, net of tax
$
(151,036)
63,553
(87,483)
Balance at December 31, 2024, net of tax
$
(169,599)
73,634
(95,965)
Other comprehensive income (loss) before reclassification, before tax
18,334
(8,589)
9,745
Amounts reclassified from other comprehensive income (loss), before tax
83
—
83
Income tax benefit (expense)
(1,379)
442
(937)
Balance at March 31, 2025, net of tax
$
(152,561)
65,487
(87,074)
(13) RELATED PARTY TRANSACTIONS
The Company has various routine related party transactions in conjunction with our holding company structure, such as management service agreements related to costs incurred, a tax sharing agreement between entities, and inter-company dividends and capital contributions. There were no changes related to these relationships during the three months ended March 31, 2026. See our 2025 Form 10-K for a comprehensive discussion of related party transactions.
(14) SUBSEQUENT EVENTS
The Company has evaluated the impact of subsequent events as defined by the accounting guidance through the date this report was issued and determined that no other significant subsequent events need to be recognized or disclosed at this time.
Item 2. MANAGEMENT'S DISCUSSION AND ANALYSIS OF FINANCIAL CONDITION AND RESULTS OF OPERATIONS
FORWARD-LOOKING STATEMENTS
This section and other parts of this Quarterly Report on Form 10-Q ("Form 10-Q") contain forward-looking statements, within the meaning of the Private Securities Litigation Reform Act of 1995, that involve risks and uncertainties. Forward-looking statements provide current expectations of future events based on certain assumptions and include any statement that does not directly relate to any historical or current fact. Forward-looking statements can also be identified by words such as “future,” “anticipates,” “believes,” “estimates,” “expects,” “intends,” “plans,” “predicts,” “will,” “would,” “could,” “can,” “may,” and similar terms. Forward-looking statements are not guarantees of future performance and the Company’s actual results may differ significantly from the results discussed in the forward-looking statements. These forward-looking statements are subject to a number of risks, uncertainties and assumptions including those factors discussed in the "Risk Factors" contained in our Annual Report on Form 10-K for the year ended December 31, 2025, which is incorporated herein by reference.
The following discussion should be read in conjunction with the consolidated financial statements and accompanying notes included in Part I, Item 1 of this Form 10-Q, as well as in conjunction with MD&A and the consolidated financial statements and notes thereto that are included in our Form 10-K. The Company assumes no obligation to revise or update any forward-looking statements for any reason, except as required by law.
The U.S. Securities and Exchange Commission ("SEC") maintains a website at www.sec.gov that contains reports, proxy statements, and other information regarding issuers, including the Company, that file electronically with the SEC. Our own website, www.citizensinc.com, provides free access to the Company's Annual Reports on Form 10-K, Quarterly Reports on Form 10-Q, Current Reports on Form 8-K, Section 16 filings made by our executive officers and directors, and any amendments to these reports filed or furnished pursuant to Section 13(a) or 15(d) of the Securities Exchange Act of 1934. These materials are made available on our website as soon as reasonably practicable after we file them with, or furnish them to, the SEC. Information contained on, or accessible through, our website is not incorporating by reference into, and should not be considered part of, this Form 10-Q.
OBJECTIVE OF OUR MANAGEMENT'S DISCUSSION AND ANALYSIS
We refer to our Management’s Discussion and Analysis of Financial Condition and Results of Operations as our “MD&A”. The objective of our MD&A is to provide investors with information in order to assess the material changes in our financial condition from December 31, 2025 to March 31, 2026 and the material changes in our results of operations for the three months ended March 31, 2026 as compared to the same period in 2025. We also discuss in the MD&A any trends that we believe may materially affect our future operations or financial condition.
OVERVIEW
For over 55 years, Citizens has been fulfilling the needs of our policyholders and their families by providing insurance products that offer both living and death benefits. We conduct insurance related operations through our insurance subsidiaries, which provide benefits to policyholders globally. We specialize in offering primarily individual whole life insurance, endowment products and final expense insurance in niche markets where we believe we can optimize our competitive position.
As an insurance provider, we collect premiums on an ongoing basis from our policyholders and invest the majority of the premiums to pay future benefits, including claims, surrenders and policyholder dividends. Accordingly, the Company derives its revenues principally from: (1) life insurance premiums earned for insurance coverages provided to insureds in our two operating segments – International Insurance and Domestic Insurance; and (2) net investment income. In addition to reserving for and paying insurance benefits to our policyholders, our expenses consist primarily of the costs of selling our insurance products (e.g., commissions, underwriting, marketing expenses), operating expenses and income taxes.
We operate in two segments - International Insurance and Domestic Insurance. Our International Insurance segment operates through CICA Life, A.I., a Puerto Rican insurer, referred to as "CICA International". Our Domestic
Insurance segment operates through our subsidiaries CICA Life Insurance Company of America ("CLOA"), Security Plan Life Insurance Company ("SPLIC") and Magnolia Guaranty Life Insurance Company ("MGLIC").
EVENTS THAT IMPACTED OUR BUSINESS
From time-to-time, certain events may affect our business in ways that cause current or future results to differ from past results. See (1) the factors described in Part 1. Item 1A. Risk Factors in our Annual Report on Form 10-K for the period ended December 31, 2025 ("2025 Form 10-K"); and (2) the events described in Part 1. Item 7. "Management's Discussion and Analysis of Financial Condition and Results of Operations - Events that Impacted Our Business" in the 2025 Form 10-K.
FINANCIAL HIGHLIGHTS
Summary
Income before federal income tax increased by $4.2 million in the three months ended March 31, 2026 compared to the same period in 2025, to $2.4 million from a loss of $1.8 million, respectively. The primary factor that drove this was a $3.9 million increase in investment related gains and losses, reflecting the absence of the BlackRock write-down recorded in the prior year period.
Financial Condition at March 31, 2026
•Total assets of $1.7 billion
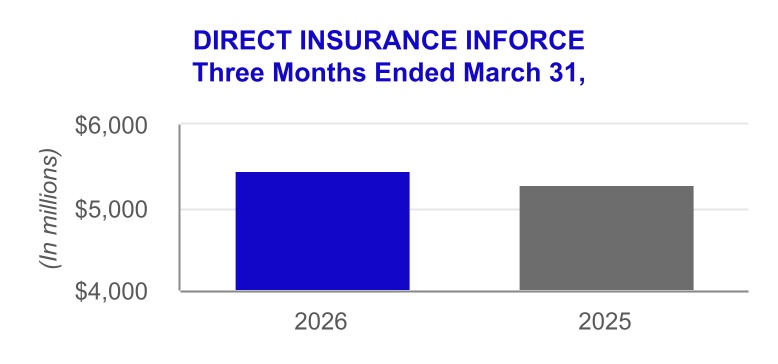
•Total direct insurance in force of $5.5 billion
•Total investments of $1.4 billion; fixed maturity securities comprised 89% of total investments
•No debt
•Book value per share of Class A common stock of $4.74
•Adjusted book value per share of Class A common stock of $6.481
•Diluted earnings per share of Class A common stock for the three months ended of $0.04
The Factors that Drive our Operating Results
We see the following as the primary factors that drive our operating results.
•Sales of our products and the premiums we receive from these sales
•Investments and the income that they generate
•Claims and surrenders
•Operating expenses
•Actuarial assumptions
Sales of our Products. We believe sales statistics are meaningful to gain an understanding of, among other things, the attractiveness of our products, how expansion of our distribution channels affects our revenue, customer retention and the performance of our business from period-to-period. Throughout the MD&A, we describe the actions and initiatives we are taking to increase sales and improve retention, sales performance in each period and as compared to prior year period, and how we view trends with respect to sales and retention.
One sales factor that is key to our profitability is product mix. We offer a competitive product mix designed to meet the needs of our specific customer demographics and actively manage new product margins and in-force profitability. Product mix can have an impact on profitability; when we sell a higher volume of lower-margin products, we may receive more premiums but may not be as profitable as in periods when we sell a greater percentage of higher-margin products. Our product mix has been trending towards sales of our newer whole life products, which have a smaller margin than sales of our international endowment products. We expect this trend in our International
1 Adjusted book value per of Class A common share is a non-GAAP measure that is calculated by dividing actual Class A common stockholders’ equity, excluding AOCI, by the number of Class A common shares outstanding at the end of the period.
Insurance segment to continue due to the anticipated volumes of endowment maturities being replaced by higher volumes of whole life products.
Premium Revenues. Premium revenues consist of all money deposited by customers into new and existing insurance policies. We view these premiums in two categories - first year premiums are premiums received within the first 12 months of a policy's issuance and any premiums received thereafter are renewal premiums.
Throughout the MD&A, we refer to "direct" premiums as all premiums received and "net" or "total" premiums as all premiums received less premiums ceded to our reinsurers. Direct premium revenue increased 4% in the three months ended March 31, 2026 to $43.9 million from $42.4 million in the three months ended March 31, 2025. This increase was driven by sales and renewal premiums in our Domestic Insurance segment.
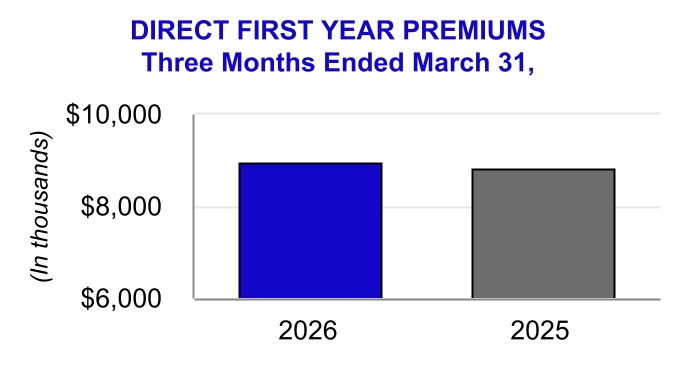
First Year Premiums. Direct first year premiums increased 2% in the three months ended March 31, 2026 to $9.0 million from $8.8 million in the three months ended March 31, 2025, driven by sales in our Domestic Insurance segment and an increased number of producing agents. First year premium growth primarily resulted from our CLOA final expense business.
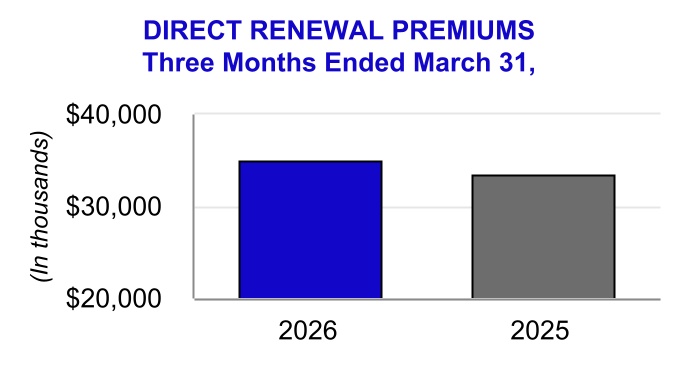
Renewal Premiums. Our direct renewal premiums in the three months ended March 31, 2026 increased primarily due to strong sales in 2025 in our Domestic Insurance segment, leading to higher number of policies paying renewal premiums in the current period. Premium growth was constrained by the high level of surrenders and matured endowments in our International Insurance segment during the last few years, which has lowered the number of policies remaining in force and paying renewal premiums in this segment.
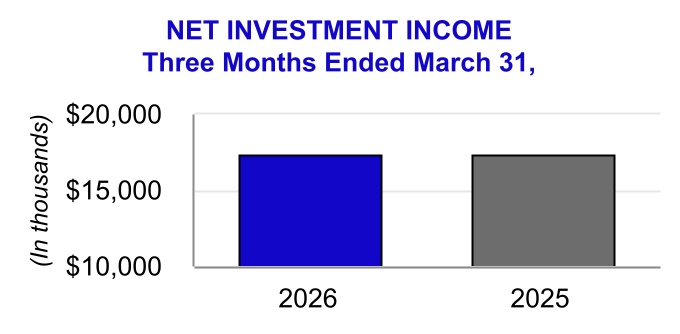
Investment Income. Our net investment income decreased for the three months ended March 31, 2026 compared to the same prior year period. Total investment income increased for the three months ended March 31, 2026 compared to the same prior year period as we began investing in investment grade private placement credit, where we expect higher returns. This increase was outweighed by non-recurring fund fees due to the underperformance of the BlackRock middle market limited partnership. Excluding one time and unanticipated events, we expect our
net investment income to increase, as we have begun investing in investment grade private placement credit, where we expect higher returns.
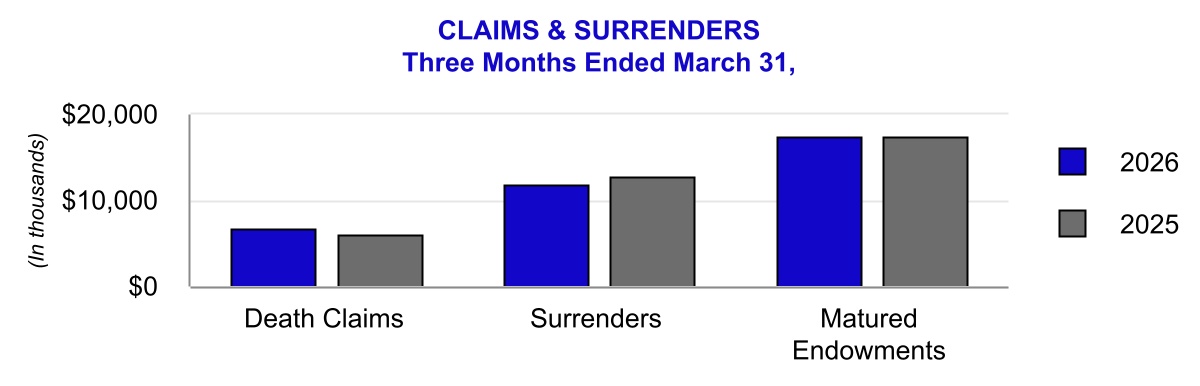
Claims and Surrenders.Payment of policyholder benefits for claims and surrenders is our largest expense and thus key to our profitability. The three largest components of this expense are reflected in the graph below.
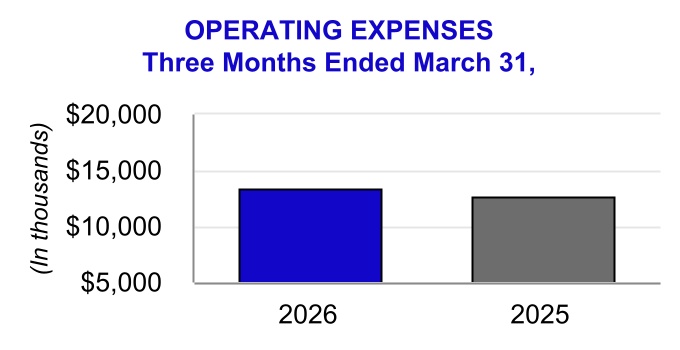
Operating Expenses. Operating expenses are our second largest expense and thus also drive our operating results. These operating expenses are meaningful to gain an understanding of how we manage our business, including among other things, salaries, benefits, and spending on growth initiatives. Our operating expenses increased by $0.7 million in the three months ended March 31, 2026, as compared to the prior year period due to continued investment in supporting the growth of our business.
Actuarial Assumptions. The actuarial assumptions that underlie our reserves are based upon our best estimates of certain factors such as mortality, lapses, morbidity and discount rates. Our results will be affected to the extent there is a variance between our actuarial assumptions and actual experience. This is reflected in our Consolidated Statements of Operations and Comprehensive Income as increase (decrease) in future policy benefit reserves and policyholder liability remeasurement (gain) loss.
Recently, we have experienced a rebalancing in our business mix due to the volume of maturities in our international endowment business and continued growth in the Domestic Insurance segment. Our current profitability is affected by how closely actual experience matches our actuarial assumptions for these shifts, and by the amount of reserves we must hold. Updated assumptions to policyholder liability remeasurement (gain) loss negatively affected our operating results by $1.0 million compared to the same prior year quarter due to unfavorable experience in our International Insurance segment. Actuarial assumptions are continually monitored and updated at least annually to reflect overall experience as well as emerging trends.
INSURANCE ISSUED AND INFORCE
The amount of direct insurance, number of policies, and average face amounts for life policies issued during the periods indicated are shown below.
Three Months Ended March 31,
2026
2025
Amount of Insurance Issued
Number of Policies Issued
Average Policy Face Amount Issued
Amount of Insurance Issued
Number of Policies Issued
Average Policy Face Amount Issued
International
$
88,357,208
870
$
101,560
$
106,875,869
942
$
113,456
Domestic
147,347,717
17,017
8,659
148,285,315
14,819
10,006
Total
$
235,704,925
17,887
$
255,161,184
15,761
In the first three months of 2026, we issued $235.7 million in new direct insurance.
The number of insurance policies issued, average policy face amount and total insurance issued in our International Insurance segment decreased in the three months ended March 31, 2026 as compared to the prior year period due to lower volume and product mix. During the first three months of 2026, a larger proportion of our sales was comprised of our single premium product aimed at replacing maturing endowments, which has a $100,000 maximum face value, as well as other endowment products. Our endowment products generally have lower policy face amounts than our whole life product.
In our Domestic Insurance segment, we continue to experience strong sales and increased number of policies issued of our final expense products. The use of information to enhance underwriting decisions with additional medical and lab data from third parties is resulting in issuance of policies with lower face amounts, as expected. We also believe this segment is being impacted by inflation on the cost of living, which has affected new sales since the customer demographic is primarily lower-income individuals.
The amount of direct insurance inforce for the periods indicated is shown below.
Overall insurance inforce has grown due to the issuance of new business, but growth has been and will be impacted by persistency rates, policy maturities and surrenders.
Our revenues are generated primarily by life insurance premiums and investment income from invested assets.
Three Months Ended
March 31,
(In thousands)
2026
2025
Revenues:
Premiums
$
39,938
39,797
Net investment income
17,304
17,377
Investment related gains (losses), net
984
(2,894)
Other income
1,494
1,372
Total revenues
$
59,720
55,652
Three Months Ended
March 31,
(In thousands)
2026
2025
Direct premiums:
First year
$
8,970
8,817
Renewal
34,962
33,533
Total direct premiums
43,932
42,350
Reinsurance
(3,994)
(2,553)
Total premiums
$
39,938
39,797
Our first year direct premiums increased 2% in the three months ended March 31, 2026 compared to the same period in 2025, due to sales and expanded distribution in our Domestic Insurance segment. Renewal premiums also increased from strong first year sales in 2025 in our Domestic Insurance segment, leading to higher number of policies paying renewal premiums in the current period, which more than offset the impact from the high level of surrenders during the last few years and increasing matured endowment benefits paid in our International Insurance segment which has lowered the number of policies paying renewal premiums in this segment.
Reinsurance premiums ceded increased in the three months ended March 31, 2026 compared to the same period in 2025. We have a coinsurance agreement with RGA Reinsurance Company ("RGA") in order to provide more capacity for growth in our Domestic Insurance segment. Since we cede 50% of the direct premiums we receive for our CLOA final expense products to RGA, as sales of these products increase, reinsurance ceded to RGA also increases.
Net Investment Income. Asummary of our net investment income performance is as follows:
Three Months Ended
March 31,
(In thousands, except for %)
2026
2025
Gross investment income:
Fixed maturity securities
$
16,358
15,428
Equity securities
11
75
Policy loans
1,267
1,369
Other long-term investments
821
1,164
Total investment income
18,457
18,036
Investment expenses
(1,153)
(659)
Net investment income
$
17,304
17,377
Net investment income, annualized
$
70,445
69,508
Average invested assets, at amortized cost
$
1,552,656
1,537,288
Annualized yield on average invested assets
4.54
%
4.52
%
Fixed maturity securities constitute the vast majority, or 89%, of our investment portfolio based on fair value and thus provide the majority of our net investment income. Our fixed maturity investment portfolio, primarily invested in callable securities, has faced challenges due to the sustained low interest rate environment for the 10 years prior to 2021. Many securities were called between 2019 and 2021, which required us to reinvest in lower interest rate fixed maturity assets, which impacts net investment income and yields. In order to enhance yields, we are investing in new opportunities, including investment grade private placement fixed income securities and other asset classes, while maintaining a prudent risk profile. As discussed above, net investment income is down slightly for the three months ended March 31, 2026 as a result of higher investment expenses when compared to prior year quarter.
Investment Related Gains (Losses), Net. We recorded investment related gains of $1.0 million during the three months ended March 31, 2026 compared to investment related losses of $2.9 million during the same prior year period. The losses in the prior year period are primarily related to the non-cash write-down of our BlackRock investment. We did not sell this investment; however, the changes in fair values of our equity securities are reflected as investment related gains or losses in our Consolidated Statements of Operations and Comprehensive Income, in addition to executed transactions that result in a gain or loss.
Other Income. Other income consists primarily of supplemental contracts issued to policyholders in our International Insurance segment upon the surrender or maturity of their original policies. Supplemental contracts offer our policyholders the opportunity to leave their cash with us and be paid interest at a guaranteed rate or receive an annuity, at their option.
Increase (decrease) in future policy benefit reserves
(4,703)
(3,646)
Policyholder liability remeasurement (gain) loss
875
(172)
Policyholders' dividends
1,102
1,295
Total insurance benefits paid or provided
36,927
37,575
Commissions
10,824
11,275
Other general expenses
13,372
12,693
Capitalization of deferred policy acquisition costs
(8,944)
(8,849)
Amortization of deferred policy acquisition costs
4,979
4,647
Amortization of cost of insurance acquired
188
98
Total benefits and expenses
$
57,346
57,439
Payments of claims and surrenders benefits constitute the vast majority of our expenses.
Claims and Surrenders.
Three Months Ended
March 31,
(In thousands)
2026
2025
Claims and surrenders:
Death claim benefits
$
6,669
6,067
Surrender benefits
11,859
12,901
Endowment benefits
1,448
1,679
Matured endowment benefits
17,448
17,351
A&H and other policy benefits
2,229
2,100
Total claims and surrenders
$
39,653
40,098
Death claim benefits increased in the three months ended March 31, 2026 compared to the same period in 2025 due to a higher volume of claims. While we maintain diligent oversight of claims activities, we expect a rise in line with the expansion of our business. Many of these death claims are expected to be partially offset by our reinsurance coverage.
The vast majority of our surrender benefits payments are made on policies surrendered in our International Insurance segment. These policies are generally policies that have been in place for many years, built up cash values, and have little or no surrender charges remaining. Surrender benefits decreased 8% in the three months ended March 31, 2026 compared to the prior year period and can vary from one period to another. We continue to focus efforts on retention initiatives.
Many of our endowment policies are reaching their contractual maturity dates and thus matured endowment benefits increased slightly in the three months ended March 31, 2026 compared to the prior year period. Compared to peak endowment activity in 2025, we expect maturity benefits to decrease throughout 2026.
Increase (Decrease) in Future Policy Benefit Reserves. Future policy benefit reserves reflect the liability established to provide for the future payment of policy benefits and thus they generally increase when we have a larger in force block of business due to higher sales and persistency (i.e., more policies on which we expect to pay future benefits) and decrease when we have lower sales and persistency. In the three months ended March 31, 2026, the change in future policy benefit reserves decreased compared to the prior year period despite the increase in our inforce business, driven by reserves released in connection with policyholder benefits payouts.
Policyholder Liability Remeasurement (Gain) Loss. Most of our products are long-duration contracts that provide a specified, fixed amount of insurance benefit in exchange for a fixed premium. When a policy is initially issued, we establish a "net premium ratio" ("NPR") using assumptions regarding expected premiums and policyholder benefit liabilities. On a quarterly basis, we review actual versus expected experience in such quarter, which is reported as a policyholder liability remeasurement gain (if better performance than assumptions) or loss (if lower performance than assumptions). Additionally, the best estimate assumptions are updated every year in our third quarter and are reflected on our income statement as a policyholder liability remeasurement gain or loss. In the three months ended March 31, 2026, the remeasurement (gain) loss was negatively affected by unfavorable experience in our International Insurance segment.
Commissions. Commission expenses are a cost of acquiring business, as commissions are the primary compensation paid to our independent agents for selling our products. First year commission rates are higher than renewal commission rates and thus commissions fluctuate directly in relation to first year sales. Although first year sales increased in the three months ended March 31, 2026 as compared to the same period in 2025, commissions decreased in the three months ended March 31, 2026 due to more sales of our single premium product offered to policyholders with maturing endowments in the International Insurance segment, which has a lower commission rate than other products.
Other General Expenses. Total general expenses increased $0.7 million in the three months ended March 31, 2026 compared to the same period in 2025 due to continued investment in supporting the growth of our business. We continue to work on managing controllable operating expenses while investing in growth initiatives.
Capitalization of Deferred Policy Acquisition Costs ("DAC"). We capitalize costs related to successful sales of our insurance products, which include certain commissions, policy issuance costs, and underwriting and agency expenses. These costs vary based upon amounts of premiums received and ceded related to new and renewal business.
Amortization of Deferred Policy Acquisition Costs. Our deferred policy acquisition costs (DAC) are amortized on a constant level basis over the expected term of the related contracts to approximate straight-line amortization.
Federal Income Tax. Tax expense increased in the current period as compared to prior year, reflecting higher taxable income. See Part I, Item 1, Note 11. Income Taxes in the notes to our consolidated financial statements herein.
SEGMENT OPERATIONS
We operate in two business segments: International Insurance and Domestic Insurance.
These segments are reported in accordance with U.S. GAAP. The Company evaluates profit and loss performance based on U.S. GAAP income (loss) before federal income tax for these segments. The Company's Other Non-Insurance Enterprises include non-insurance operations such as IT and corporate-support functions, which are
included in the table presented below to properly reconcile the segment information with the consolidated financial statements of the Company.
The following table sets forth income (loss) before federal income tax by segment during the periods indicated.
Three Months Ended
March 31,
(In thousands)
2026
2025
Income (loss) before federal income tax:
Segments:
International Insurance
$
3,605
(195)
Domestic Insurance
1,251
558
Total segments
4,856
363
Other Non-Insurance Enterprises
(2,482)
(2,150)
Total income (loss) before federal income tax
$
2,374
(1,787)
INTERNATIONAL INSURANCE
Detailed results of operations in the International Insurance segment for the periods indicated are as follows:
Three Months Ended
March 31,
(In thousands)
2026
2025
Revenues:
Premiums
$
25,198
25,608
Net investment income
12,004
12,131
Investment related gains (losses), net
1,334
(2,766)
Other income
1,487
1,365
Total revenues
40,023
36,338
Benefits and expenses:
Insurance benefits paid or provided:
Claims and surrenders
32,111
33,034
Increase (decrease) in future policy benefit reserves
(7,264)
(6,856)
Policyholder liability remeasurement (gain) loss
1,125
93
Policyholders' dividends
1,036
1,185
Total insurance benefits paid or provided
27,008
27,456
Commissions
4,489
5,103
Other general expenses
5,602
5,295
Capitalization of deferred policy acquisition costs
(4,233)
(4,787)
Amortization of deferred policy acquisition costs
3,552
3,466
Total benefits and expenses
36,418
36,533
Income (loss) before federal income tax
$
3,605
(195)
In our International Insurance segment, income before federal income tax was $3.6 million in the three months ended March 31, 2026 compared to a loss before federal income tax of $0.2 million in the prior year period. This
was driven by a $4.1 million increase in investment related gains and losses primarily related to the BlackRock write-down in the prior year period.
Premium breakout is detailed below.
Three Months Ended
March 31,
(In thousands)
2026
2025
Direct premiums:
First year
$
3,290
3,392
Renewal
22,292
22,687
Total direct premiums
25,582
26,079
Reinsurance
(384)
(471)
Total premiums
$
25,198
25,608
Premiums. Direct premiums decreased by $0.5 million in the three months ended March 31, 2026 compared to the same period in 2025 mainly due to the impact the matured endowments have had on renewal premiums.
Our International Insurance segment derives its premiums from policyholders residing in over 80 different countries across the globe. The following table sets forth our premiums by location for the three months ended March 31, 2026 and 2025.
Three Months Ended
March 31,
(In thousands)
2026
2025
Premiums:
Colombia
$
6,825
6,554
Taiwan
3,406
3,886
Venezuela
3,178
3,350
Ecuador
2,996
3,200
Argentina
2,602
2,096
Other
9,278
9,911
Reinsurance and change in premium accruals
(3,087)
(3,389)
Total premiums
$
25,198
25,608
Sales in Taiwan have been declining recently due to leadership succession related difficulties within our primary distribution agency in Taiwan and regulatory challenges. We are facing some headwinds in Venezuela that may affect premium revenues due to the strength of the U.S. dollar compared to the local currency and their difficulties to obtain dollars. The recent political instability may cause further decline in this business. We continue to closely monitor emerging trends in our Venezuela business.
Investment Related Gains (Losses), Net. Investment related gains and losses improved in the three months ended March 31, 2026 compared to the prior year period largely due to the BlackRock write-down in 2025. These gains and losses are generally a result of the change in estimated fair market value for our limited partnerships, as previously discussed.
Other Income. Other income consists primarily of supplemental contracts issued to policyholders upon the surrender or maturity of their original policies. Supplemental contracts offer our policyholders the opportunity to
leave their cash with us and be paid interest at a guaranteed rate or receive an annuity, at their option. As our matured endowments have increased, a growing number of policyholders have chosen to enter into a supplemental contract and thus other income has steadily increased over the last few years.
Benefits and Expenses.
Claims and surrender benefits breakout is detailed below.
Three Months Ended
March 31,
(In thousands)
2026
2025
Claims and surrenders:
Death claim benefits
$
959
466
Surrender benefits
10,399
11,850
Endowment benefits
1,446
1,678
Matured endowment benefits
17,239
17,194
A&H and other policy benefits
2,068
1,846
Total claims and surrenders
$
32,111
33,034
As discussed, the majority of our claims and surrender benefits in this segment were related to payment of matured endowment benefits. Surrender benefits are also a large component of this expense; often as surrender charges expire on endowments after certain periods, policyholders surrender their policies to access the cash value. Surrenders decreased in the three months ended March 31, 2026 compared to the prior year period and can vary from one period to another. We continue to focus efforts on retention initiatives.
Commissions. Commissions decreased due to strong sales of our single premium product offered to policyholders with maturing endowments, which product has a lower commission rate than other products.
Detailed results of operations for the Domestic Insurance segment for the periods indicated are as follows:
Three Months Ended
March 31,
(In thousands)
2026
2025
Revenues:
Premiums
$
14,740
14,189
Net investment income
5,113
5,059
Investment related gains (losses), net
(345)
(129)
Other income
7
7
Total revenues
19,515
19,126
Benefits and expenses:
Insurance benefits paid or provided:
Claims and surrenders
7,542
7,064
Increase (decrease) in future policy benefit reserves
2,561
3,210
Policyholder liability remeasurement (gain) loss
(250)
(265)
Policyholders' dividends
66
110
Total insurance benefits paid or provided
9,919
10,119
Commissions
6,335
6,172
Other general expenses
5,106
5,060
Capitalization of deferred policy acquisition costs
(4,711)
(4,062)
Amortization of deferred policy acquisition costs
1,427
1,181
Amortization of cost of insurance acquired
188
98
Total benefits and expenses
18,264
18,568
Income before federal income tax
$
1,251
558
Income before federal income tax in the three months ended March 31, 2026 increased to $1.3 million from $0.6 million in the prior year period. The increase was driven by increased premiums and slightly lower insurance benefits paid or provided.
Total direct premiums increased by $2.1 million in the three months ended March 31, 2026 compared to the same prior year period due to sustained first year sales and increase in renewal year premiums due to strong prior year sales. As a result of these increases, reinsurance premiums ceded also increased.
Benefits and Expenses.
Claims and surrender benefits breakout is detailed below.
Three Months Ended
March 31,
(In thousands)
2026
2025
Claims and surrenders:
Death claim benefits
$
5,710
5,601
Surrender benefits
1,460
1,051
Endowment benefits
2
1
Matured endowment benefits
209
157
A&H and other policy benefits
161
254
Total claims and surrenders
$
7,542
7,064
In our Domestic Insurance segment, the majority of claims and surrender benefits are death claim benefits. Death claim benefits increased slightly in the three months ended March 31, 2026 compared to the same prior year period due primarily to a higher volume of reported claims. The Company carefully tracks mortality experience as an important measure of performance, which can fluctuate from quarter-to-quarter based on reported claims. While we monitor claims activities, we expect a rise in claims corresponding with business expansion. A portion of these death claims should be offset by our reinsurance coverage.
NON-INSURANCE ENTERPRISES
Three Months Ended
March 31,
(In thousands)
2026
2025
Loss before federal income tax
$
(2,482)
(2,150)
This operating unit represents the administrative support functions for the insurance operations. Its revenues are primarily intercompany and have been eliminated in consolidation under U.S. GAAP, which typically results in a loss. Revenue in this operating unit consists primarily of net investment income and investment related gains or losses, while expenses consist of other general expenses related to corporate functions. For the three months ended March 31, 2026, the elevated loss before federal income tax compared to the same period in 2025 is mainly due to higher general expenses.
INVESTMENTS
Our investments are an integral part of our business success, as we invest the majority of premiums collected to pay for future benefits and rely on net investment income for our ongoing operations. Our cash and invested assets at March 31, 2026 were $1.4 billion, of which 88% was invested in fixed maturity securities, all of which are classified as available-for-sale. We closely monitor the duration of our fixed maturity investments, and investment purchases and sales are executed with the objective of having adequate funds available to satisfy our insurance obligations.
The following table shows the carrying value of our investments by investment category and the percentage of each to total cash, cash equivalents and invested assets.
Carrying Value
March 31, 2026
December 31, 2025
(In thousands, except for %)
Amount
%
Amount
%
Cash, cash equivalents and invested assets:
Fixed maturity securities:
U.S. Treasury and U.S. Government-sponsored enterprises
$
6,942
0.5
%
$
7,008
0.5
%
Corporate
862,848
59.7
866,870
59.2
States and political subdivisions (1)
262,058
18.1
268,792
18.3
Mortgage-backed (2)
106,681
7.4
111,982
7.6
Asset-backed
32,582
2.3
33,209
2.3
Total fixed maturity securities
1,271,111
88.0
1,287,861
87.9
Cash and cash equivalents
18,520
1.3
22,976
1.6
Other investments:
Policy loans
67,217
4.7
67,455
4.6
Equity securities
1,451
0.1
1,356
0.1
Other long-term investments
86,590
5.9
85,439
5.8
Total cash, cash equivalents and invested assets
$
1,444,889
100.0
%
$
1,465,087
100.0
%
(1) Includes $100.1 million and $106.9 million of securities guaranteed by third parties at March 31, 2026 and December 31, 2025, respectively.
(2) Includes $95.8 million and $101.1 million of U.S. Government-sponsored enterprises at March 31, 2026 and December 31, 2025, respectively.
The carrying value of the Company’s fixed maturity securities investment portfolio at March 31, 2026 was $1.27 billion compared to $1.29 billion at December 31, 2025. This decrease primarily reflects the impact of interest rate sensitivity on the fair value of our fixed maturity securities. The distribution of the credit ratings of our portfolio of fixed maturity securities by carrying value as of March 31, 2026 did not materially change from December 31, 2025 – the weighted average was “A” at both dates.
Cash and cash equivalents decreased as of March 31, 2026 from December 31, 2025 and fluctuate from period to period primarily due to the timing of operating and investing activities.
As of March 31, 2026, other long-term investments increased by $1.2 million compared to December 31, 2025, primarily due to funding commitments of other investments and the impact of changes in the fair market value of our limited partnership holdings.
Obligations of States and Political Subdivisions
21% of the Company’s fixed maturity securities investment portfolio at March 31, 2026 consists of municipal bonds, which are securities that are obligations of states and political subdivisions. A portion of these municipal bonds
includes third-party guarantees, which enhance a bond's credit rating. A presentation of our municipal bonds by credit rating and third-party guarantee is below.
General Obligation
Special Revenue
Other
Total
% Based on Amortized Cost
(In thousands, except for %)
Fair Value
Amortized Cost
Fair Value
Amortized Cost
Fair Value
Amortized Cost
Fair Value
Amortized Cost
State and political subdivision fixed maturity securities including third-party guarantees:
AAA
$
12,010
11,826
12,653
12,942
3,319
3,235
27,982
28,003
9.7
%
AA
38,053
38,322
112,023
127,998
4,912
5,106
154,988
171,426
59.4
A
2,886
3,149
64,534
73,453
2,133
2,119
69,553
78,721
27.3
BBB
91
93
7,016
7,690
—
—
7,107
7,783
2.7
BB and other
2,428
2,539
—
—
—
—
2,428
2,539
0.9
Total
$
55,468
55,929
196,226
222,083
10,364
10,460
262,058
288,472
100.0
%
State and political subdivision fixed maturity securities excluding third-party guarantees:
AA
$
30,098
30,077
37,193
42,910
1,035
1,068
68,326
74,055
25.7
A
10,438
10,699
74,265
83,152
2,955
3,094
87,658
96,945
33.6
BBB
2,540
2,706
20,524
21,995
45
55
23,109
24,756
8.6
BB and other
12,392
12,447
64,244
74,026
6,329
6,243
82,965
92,716
32.1
Total
$
55,468
55,929
196,226
222,083
10,364
10,460
262,058
288,472
100.0
%
The table below shows the categories in which we held investments in special revenue municipal bonds that were greater than 10% of the fair value of our total municipal bond portfolio at March 31, 2026.
(In thousands, except for %)
Fair Value
Amortized Cost
% of Total Fair Value
Education
$
38,033
44,154
14.5
%
Utilities
41,429
45,152
15.8
Transportation
32,638
39,739
12.5
The Company's municipal bond portfolio consists of bonds from states and political subdivisions in many states; however, as of March 31, 2026, municipal bonds from issuers in Texas and California comprised 22% and 18%, respectively, of the portfolio. There were no other states or individual issuer holdings equal to or greater than 10% of the total municipal bond portfolio as of March 31, 2026.
The table below represents the Company's detailed exposure to municipal fixed maturity securities by credit rating in Texas at March 31, 2026.
General Obligation
Special Revenue
Other
Total
(In thousands)
Fair Value
Amortized Cost
Fair Value
Amortized Cost
Fair Value
Amortized Cost
Fair Value
Amortized Cost
Texas state and political subdivision fixed maturity securities including third-party guarantees:
AAA
$
11,507
11,325
2,474
2,496
—
—
13,981
13,821
AA
13,024
13,030
16,341
18,913
45
55
29,410
31,998
A
—
—
10,723
14,730
—
—
10,723
14,730
BBB
—
—
2,950
2,920
—
—
2,950
2,920
Total
$
24,531
24,355
32,488
39,059
45
55
57,064
63,469
Texas state and political subdivision fixed maturity securities excluding third-party guarantees:
AA
$
20,212
20,040
4,242
4,764
—
—
24,454
24,804
A
3,093
3,090
12,934
14,888
—
—
16,027
17,978
BBB
—
—
6,198
6,282
45
55
6,243
6,337
BB and other
1,226
1,225
9,114
13,125
—
—
10,340
14,350
Total
$
24,531
24,355
32,488
39,059
45
55
57,064
63,469
The table below represents the Company's detailed exposure to municipal fixed maturity securities by credit rating in California at March 31, 2026.
General Obligation
Special Revenue
Other
Total
(In thousands)
Fair Value
Amortized Cost
Fair Value
Amortized Cost
Fair Value
Amortized Cost
Fair Value
Amortized Cost
California state and political subdivision fixed maturity securities including third-party guarantees:
AA
$
2,127
2,115
32,846
39,130
4,555
4,744
39,528
45,989
A
1,330
1,650
6,009
6,805
—
—
7,339
8,455
Total
$
3,457
3,765
38,855
45,935
4,555
4,744
46,867
54,444
California state and political subdivision fixed maturity securities excluding third-party guarantees:
AA
$
457
446
5,414
7,085
724
760
6,595
8,291
A
3,000
3,319
18,724
21,811
1,823
1,976
23,547
27,106
BB and other
—
—
14,717
17,039
2,008
2,008
16,725
19,047
Total
$
3,457
3,765
38,855
45,935
4,555
4,744
46,867
54,444
IMPAIRMENT CONSIDERATIONS RELATED TO INVESTMENTS IN FIXED MATURITY SECURITIES
We analyze our available-for-sale ("AFS") fixed maturity securities that are experiencing unrealized losses to ascertain if there is an expectation of credit related impairments. We did not record any credit valuation allowances on fixed maturity securities in either of the three months ended March 31, 2026 or 2025.
Gross unrealized losses on AFS fixed maturity securities amounted to $167.6 million as of March 31, 2026 and $154.3 million as of December 31, 2025. This increase in gross unrealized losses during 2026 was a result of the decrease in average market interest rates in 2026 as compared to 2025.
Information on both unrealized and realized gains and losses by category is set forth in Part I, Item 1, Note 3. Investments of the notes to our consolidated financial statements herein.
LIQUIDITY AND CAPITAL RESOURCES
Below are our primary capital resources (based on carrying value of each) as of the periods indicated.
(In thousands)
March 31, 2026
December 31, 2025
Fixed maturity securities
$
1,271,111
1,287,861
Cash and cash equivalents
18,520
22,976
Liquidity refers to a company's ability to generate sufficient cash flows to meet the needs of its operations. Cash provided by operating activities is an important liquidity metric because it reflects, during a given period, the amount of cash generated that is available to pay operating expenses, invest in our business or make strategic acquisitions. We manage our insurance operations in order to ensure that we have stable and reliable sources of cash flows to meet our obligations. In the three months ended March 31, 2026, our operations used $0.3 million of net cash due to matured endowment benefit payments, commissions and general expenses supporting our business growth. We expect our business will generate cash the remainder of the year as our level of maturities declines.
Despite using cash in the first quarter of 2026, we anticipate meeting our short-term and long-term cash needs with cash generated by our insurance operations and from our invested assets. 89% of our investments consist of marketable fixed maturity securities classified as available-for-sale that could be readily converted to cash for liquidity needs. Additionally, we may raise capital by selling shares in our SIP (as defined below) and we may also access our Credit Facility if needed (also described below). Citizens had no debt as of March 31, 2026.
We have traditionally also had significant cash flows from both scheduled and unscheduled investment security maturities, redemptions, and prepayments. These cash flows, for the most part, are reinvested in new investments. The investing activities fluctuate from period to period due to timing of securities activities such as calls, maturities and reinvestment of those funds. We purchased $31.0 million of fixed maturity securities and we also used $1.0 million to purchase other long-term investments in the first three months of 2026.
PARENT COMPANY LIQUIDITY AND CAPITAL RESOURCES
Citizens is a holding company and has minimal operations of its own. Our assets consist of the capital stock of our subsidiaries, cash and investments. Our liquidity requirements are met primarily from two sources: cash generated from our operating subsidiaries and our invested assets. Our ability to obtain cash from our insurance subsidiaries depends primarily upon the availability of statutorily permissible payments, including payments we receive from service agreements with our insurance subsidiaries and dividends from the subsidiaries. The ability to make payments to the holding company is limited by applicable laws of the U.S. states of domicile and by the Puerto Rico Office of Commissioner of Insurance, which all subject insurance operations to significant regulatory restrictions. These laws and regulations require, among other things, that our insurance subsidiaries maintain minimum solvency or premium to surplus ratio requirements, which limit the amount of dividends that can be paid to the holding company. The regulations also require approval of our service agreements with the applicable regulatory authority in order to prevent insurance subsidiaries from moving large amounts of cash to the less regulated holding company.
In addition to the above-mentioned sources of cash, we offer a Stock Investment Plan ("SIP"), which allows investors, policyholders, independent contractors and agents, employees and directors to directly purchase our stock. At our option, purchases of stock under the SIP can be made from newly issued or treasury stock, rather than in the open market, in which case, we can raise capital by selling our shares.
We renewed our Credit Facility with Regions Bank on May 3, 2024 for an additional three years. See Part I, Item 1, Note 8. Commitments and Contingencies in the notes to our consolidated financial statements herein for a description of the Credit Facility. The Credit Facility provides additional liquidity to the Company for short-term or longer-term needs. We have not borrowed any money under the Credit Facility.
INSURANCE COMPANY SUBSIDIARY LIQUIDITY AND CAPITAL RESOURCES
The liquidity requirements of our insurance operations are primarily met by premium revenues, investment income and proceeds from investment maturities, calls or sales. Primary cash needs are for payments of policyholder benefits, investment purchases, and operating expenses. We manage our insurance operations in order to ensure that we have stable and reliable sources of cash flow to meet our obligations. As we have discussed, we have been growing our domestic CLOA business by developing new products and expanding our distribution channels, which has led to increases in first year direct premiums (i.e., new sales) in our Domestic Insurance segment in the last couple years. When selling new policies, we incur upfront policy acquisition costs, such as agent commission payments. While historically, cash flows from our operations have been sufficient to meet our cash needs, we entered into a coinsurance reinsurance agreement with RGA to help with some of the costs, and the insurance subsidiaries also have the AFS fixed maturity investment portfolio available to create additional cash flows if required. Two of our insurance subsidiaries are members of the Federal Home Loan Bank ("FHLB") of Dallas. FHLB membership provides the insurance subsidiaries with access to various low-cost collateralized borrowings and funding agreements. While not the only source of additional liquidity, the FHLB could provide the insurance subsidiaries with an additional source of liquidity, if needed.
We believe that we have adequate capital resources and ability to obtain additional capital if needed to support the short-term and longer-term liquidity requirements of our insurance operations. See Contractual Obligations and Off-balance Sheet Arrangements in our 2025 Form 10-K and below for a discussion of known and estimated cash needs. Cash flow projections and cash flow tests under various market interest rate scenarios are performed annually to assist in evaluating liquidity needs and adequacy.
Trends, Demands and Restrictions on our Uses of Cash
Payments of benefits for claims and surrenders and commissions are our largest use of cash. There are three primary components of payments of benefits: matured endowments, surrenders and death claims.
Matured Endowments. Our endowment products have contractual maturity dates and provide the policyholder with alternatives once the policy matures - they can choose to take a lump sum payout or leave the money on deposit at interest with the Company. Approximately 18% of the endowments in force will mature in the next five years, totaling approximately 5% of our in force business as of March 31, 2026. Policyholder election behavior is unknown, but if too many policyholders elect lump sum distributions, the Company could be exposed to liquidity risk in years of high maturities. Meeting these distributions could require the Company to sell its investments at inopportune times to pay policyholder withdrawals. Alternatively, if the policyholders were to leave the money on deposit with the Company at interest, our profitability could be impacted if the product guaranteed rate is higher than the market rate we are earning on our investments. We currently anticipate that our available operating cash flow and capital resources will be adequate to meet our needs for funds, and we are closely monitoring our policyholder behavior patterns, and in 2024, introduced a new product designed to allow policyholders with maturing endowments to purchase a new life insurance policy.
Surrenders. Surrender benefits, which have been high the last several years, slightly decreased during 2025 and continued to decrease the first three months of 2026. In order to mitigate the risk of early policyholder surrenders, we include provisions in our insurance policies, such as surrender charges, that help limit and discourage early withdrawals, but as many of our policies reach the age where surrender charges have expired or significantly decreased, we have experienced high levels of surrenders. We believe that surrenders have been high due to other reasons, including the loss of one of our biggest distributors in Venezuela in 2018, increasing interest rates, which may encourage policyholders to seek higher rates of return in different investment products, post-pandemic beliefs
that life insurance may not be as important as it was during the pandemic, and inflationary pressures, which may cause policyholders to want the cash values of their policies due to decreased purchasing power elsewhere. To the extent that early surrenders are higher than expected, our use of cash could be higher than expected. We continue to monitor surrenders and early withdrawals and focus on our retention initiatives and efforts to retain cash when policyholders surrender their policies.
Our liquidity is also negatively impacted with high matured endowments and surrenders, as they lead to lower renewal premiums.
Death Claims. Our product pricing assumes a certain mortality rate and thus a primary liquidity concern is the risk of higher than expected mortality experience. Our death benefit payments increased in the three months ended March 31, 2026 due to a higher volume of reported claims.
Commissions. Another significant use of cash is payment of commissions. In our Domestic Insurance segment, we pay advance commissions on some of our insurance products, meaning we pay an agent a portion of their first year commission immediately upon sale of a policy, rather than "as earned", or when premiums are received by us. Because of this, another liquidity concern is that rapid growth in first year sales of these products creates a significant increase in commission payments. CLOA sales have increased significantly since the third quarter of 2023. In order to offset some of this strain on our capital, we entered into the coinsurance agreement with RGA in the second quarter of 2024 and elected to cede 50% of our final expense business to RGA. We may also seek other options, such as loans at the holding company level (from the Credit Facility or otherwise) that would allow us to reduce the liquidity risk should required commission payments exceed current resources.
As discussed above, we are subject to regulatory capital requirements that could affect the Company’s ability to access capital from our insurance operations or cause the Company to have to put additional cash in our insurance subsidiaries.
Our domestic companies are subject to minimum capital requirements set by the NAIC in the form of risk-based capital ("RBC"). RBC considers the type of business written by an insurance company, the quality of its assets, and various other aspects of an insurance company's business to develop a minimum level of capital called "Authorized Control Level Risk-Based Capital". This level of capital is then compared to an adjusted statutory capital that includes capital and surplus as reported under statutory accounting principles, plus certain investment reserves. Should the ratio of adjusted statutory capital to control level RBC fall below 200% for our domestic companies, a series of remedial actions by the affected company would be required. Additionally, we have a Capital Maintenance Agreement between Citizens and CLOA, Citizens' wholly-owned subsidiary domiciled in Colorado, that would require Citizens to contribute capital to CLOA in order to maintain an RBC level above 350%. At March 31, 2026, our domestic insurance subsidiaries were above the required minimum RBC levels and CLOA was above 350%.
CICA International is a Puerto Rico domiciled company. The Insurance Code of Puerto Rico does not specifically set forth minimum capital and surplus standards but rather requires that an insurer submit a business plan for approval to the OIC that includes proposed minimum capital and surplus. CICA International is required to maintain a minimum of $750,000 in capital and maintain a premium to surplus ratio of 7 to 1. At March 31, 2026, CICA International exceeded the required minimum capital and related ratio.
Any capital that Citizens is required to contribute to its insurance subsidiaries would negatively impact the holding Company's capital resources and liquidity.
CONTRACTUAL OBLIGATIONS AND OFF-BALANCE SHEET ARRANGEMENTS
As of March 31, 2026, we have no additional contractual obligations or off-balance sheet arrangements other than those described in Part I, Item 1, Note 8. Commitments and Contingencies in the notes to our consolidated financial statements herein and in Part II, Item 7, Contractual Obligations and Off-Balance Sheet Arrangements in our 2025 Form 10-K. We do not utilize special purpose entities as investment vehicles, nor are there any such entities in which we have an investment that engage in speculative activities of any nature, and we do not use such investments to hedge our investment positions.
CRITICAL ACCOUNTING POLICIES
We believe that the accounting policies set forth in Part I, Item 7, Management’s Discussion and Analysis of Financial Condition and Results of Operations - "Critical Accounting Policies" and Part IV, Item 15, Note 1. Summary of Significant Accounting Policies of our consolidated financial statements in our 2025 Form 10-K continue to describe the significant judgments and estimates used in the preparation of our consolidated financial statements.
Item 3.QUANTITATIVE AND QUALITATIVE DISCLOSURES ABOUT MARKET RISK
As a smaller reporting company, we are not required to provide the information required by this Item.
Item 4.CONTROLS AND PROCEDURES
EVALUATION OF DISCLOSURE CONTROLS AND PROCEDURES
We maintain disclosure controls and procedures (as defined in Rules 13a-15(e) and 15d-15(e) under the Securities Exchange Act of 1934, as amended (the "Exchange Act")) that are designed to ensure that information required to be disclosed in our reports filed or submitted under the Exchange Act is recorded, processed, summarized and reported within the time periods specified in the SEC’s rules and forms, and that such information is accumulated and communicated to our management, including our principal executive officer and principal financial officer, to allow timely decisions regarding required disclosures.
Our management, including our principal executive officer and principal financial officer, evaluated the effectiveness of our disclosure controls and procedures pursuant to Rules 13a-15(e) and 15d-15(e) under the Exchange Act as of March 31, 2026. Based on such evaluation, our principal executive officer and principal financial officer concluded that our disclosure controls and procedures were effective as of March 31, 2026 to provide reasonable assurance that information required to be disclosed by us in the reports that we file or submit under the Exchange Act is recorded, processed, summarized and reported within the time periods specified in the rules and forms of the SEC and such information is accumulated and reported to management, including our principal executive and financial officers, as appropriate to allow timely decisions regarding disclosure.
CHANGES IN INTERNAL CONTROL OVER FINANCIAL REPORTING
During the three months ended March 31, 2026, there were no changes in the Company's internal control over financial reporting (as defined in rules 13a-15(f) and 15d-15(f) under the Exchange Act) that materially affected, or are reasonably likely to materially affect, our internal control over financial reporting.
Part I, Item 3. Legal Proceedings of our 2025 Form 10-K includes a discussion of our legal proceedings. There have been no material developments in the three months ended March 31, 2026 from the legal proceedings described in our 2025 Form 10-K.
Item 1A. RISK FACTORS
Part I, Item 1A. Risk Factors of our 2025 Form 10-K includes a discussion of our risk factors. There have been no material changes in the three months ended March 31, 2026 from the risk factors included in our 2025 Form 10-K.
Item 2.UNREGISTERED SALES OF EQUITY SECURITIES AND USE OF PROCEEDS
None.
Item 3. DEFAULTS UPON SENIOR SECURITIES
Not applicable.
Item 4.MINE SAFETY DISCLOSURES
Not applicable.
Item 5.OTHER INFORMATION
Item 5(a)
None.
Item 5(b)
None.
Item 5(c)
During the three months ended March 31, 2026, none of the Company’s directors or executive officers adopted or terminated any contract, instruction or written plan for the purchase or sale of Citizens, Inc. securities that was intended to satisfy the affirmative defense conditions of Rule 10b5-1(c) or any “non-Rule 10b5-1 trading arrangement.” Additionally, Citizens did not adopt or terminate any Rule 10b5-1 trading arrangement during the three months ended March 31, 2026.
Inline XBRL Document Set for the condensed consolidated financial statements and accompanying notes in Part I, Item 1, Financial Statements of this Quarterly Report on Form 10-Q*
104*
Inline XBRL for the cover page of this Quarterly Report on Form 10-Q, included in the Exhibit 101 Inline XBRL Document Set*
† Indicates management contract or compensatory plan or arrangement.
Pursuant to the requirements of the Securities Exchange Act of 1934, the Registrant has duly caused this report to be signed on its behalf by the undersigned thereunto duly authorized.