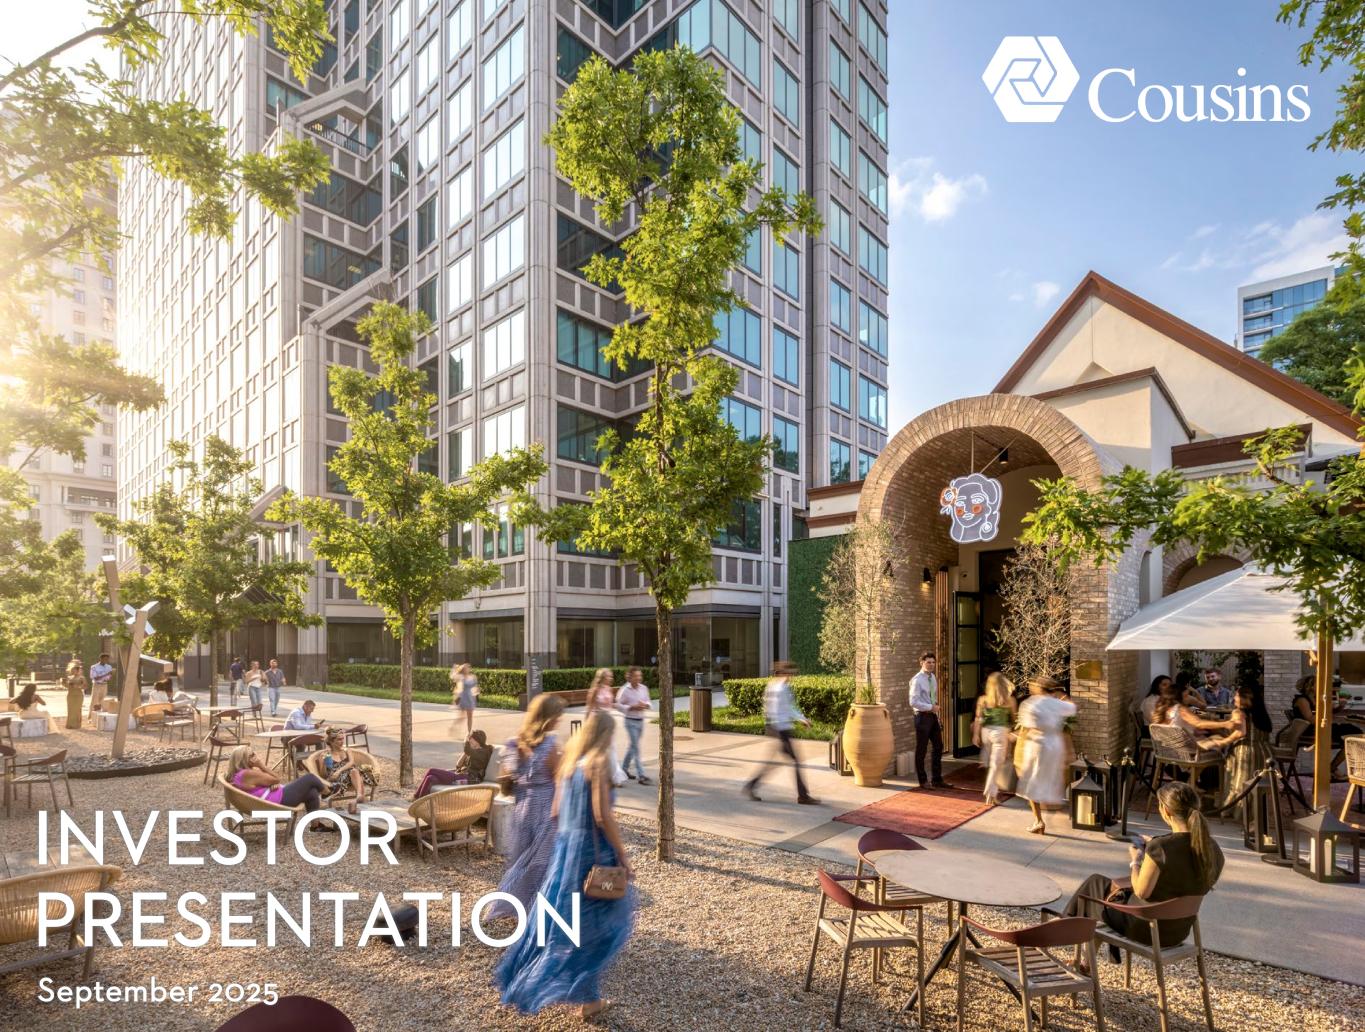
INVESTOR PRESENTATION September 2025
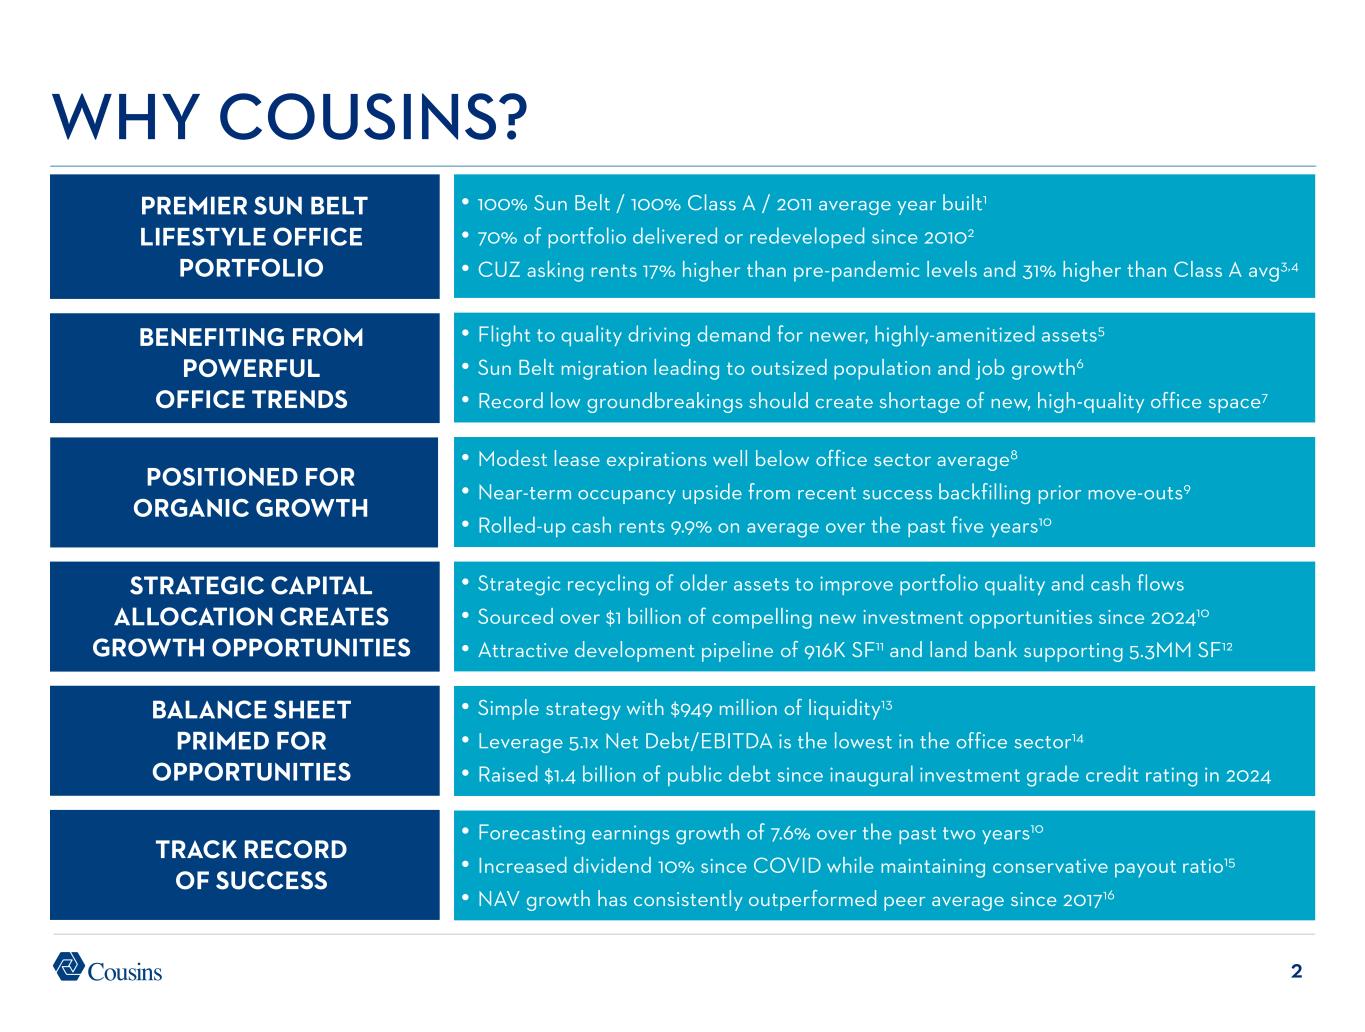
2 BENEFITING FROM POWERFUL OFFICE TRENDS BALANCE SHEET PRIMED FOR OPPORTUNITIES PREMIER SUN BELT LIFESTYLE OFFICE PORTFOLIO TRACK RECORD OF SUCCESS WHY COUSINS? • Flight to quality driving demand for newer, highly-amenitized assets5 • Sun Belt migration leading to outsized population and job growth6 • Record low groundbreakings should create shortage of new, high-quality office space7 • 100% Sun Belt / 100% Class A / 2011 average year built1 • 70% of portfolio delivered or redeveloped since 20102 • CUZ asking rents 17% higher than pre-pandemic levels and 31% higher than Class A avg3,4 • Simple strategy with $949 million of liquidity13 • Leverage 5.1x Net Debt/EBITDA is the lowest in the office sector14 • Raised $1.4 billion of public debt since inaugural investment grade credit rating in 2024 • Forecasting earnings growth of 7.6% over the past two years10 • Increased dividend 10% since COVID while maintaining conservative payout ratio15 • NAV growth has consistently outperformed peer average since 201716 STRATEGIC CAPITAL ALLOCATION CREATES GROWTH OPPORTUNITIES • Strategic recycling of older assets to improve portfolio quality and cash flows • Sourced over $1 billion of compelling new investment opportunities since 202410 • Attractive development pipeline of 916K SF11 and land bank supporting 5.3MM SF12 POSITIONED FOR ORGANIC GROWTH • Modest lease expirations well below office sector average8 • Near-term occupancy upside from recent success backfilling prior move-outs9 • Rolled-up cash rents 9.9% on average over the past five years10
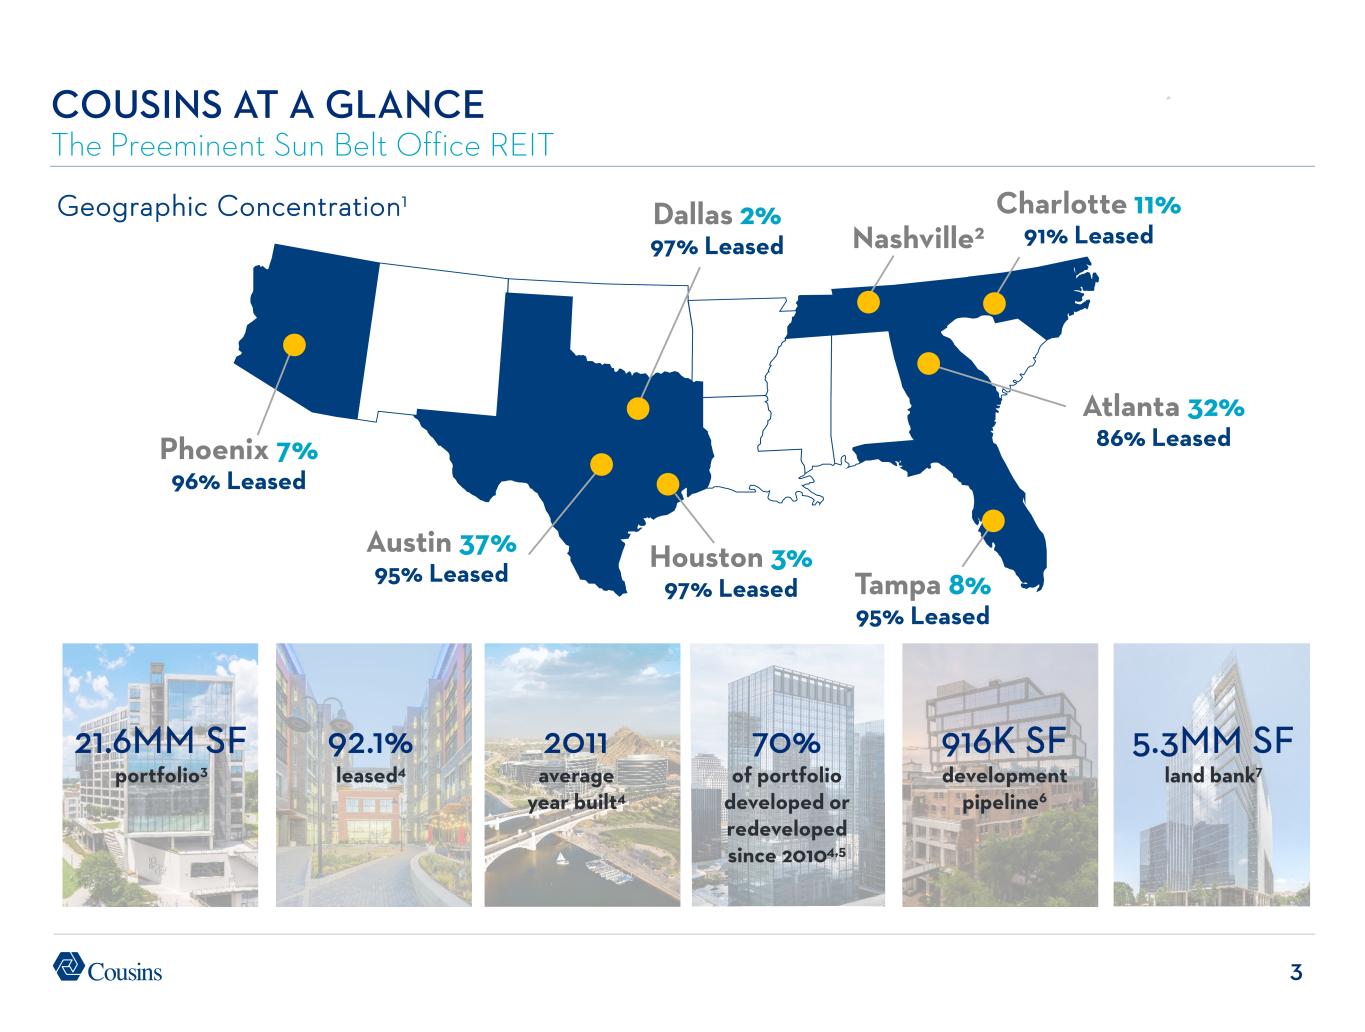
35 COUSINS AT A GLANCE The Preeminent Sun Belt Office REIT Geographic Concentration1 21.6MM SF portfolio3 2011 average year built4 92.1% leased4 70% of portfolio developed or redeveloped since 20104,5 916K SF development pipeline6 5.3MM SF land bank7 Dallas 2% 97% Leased Charlotte 11% 91% Leased Atlanta 32% 86% Leased Houston 3% 97% Leased Phoenix 7% 96% Leased Tampa 8% 95% Leased Nashville2 Austin 37% 95% Leased
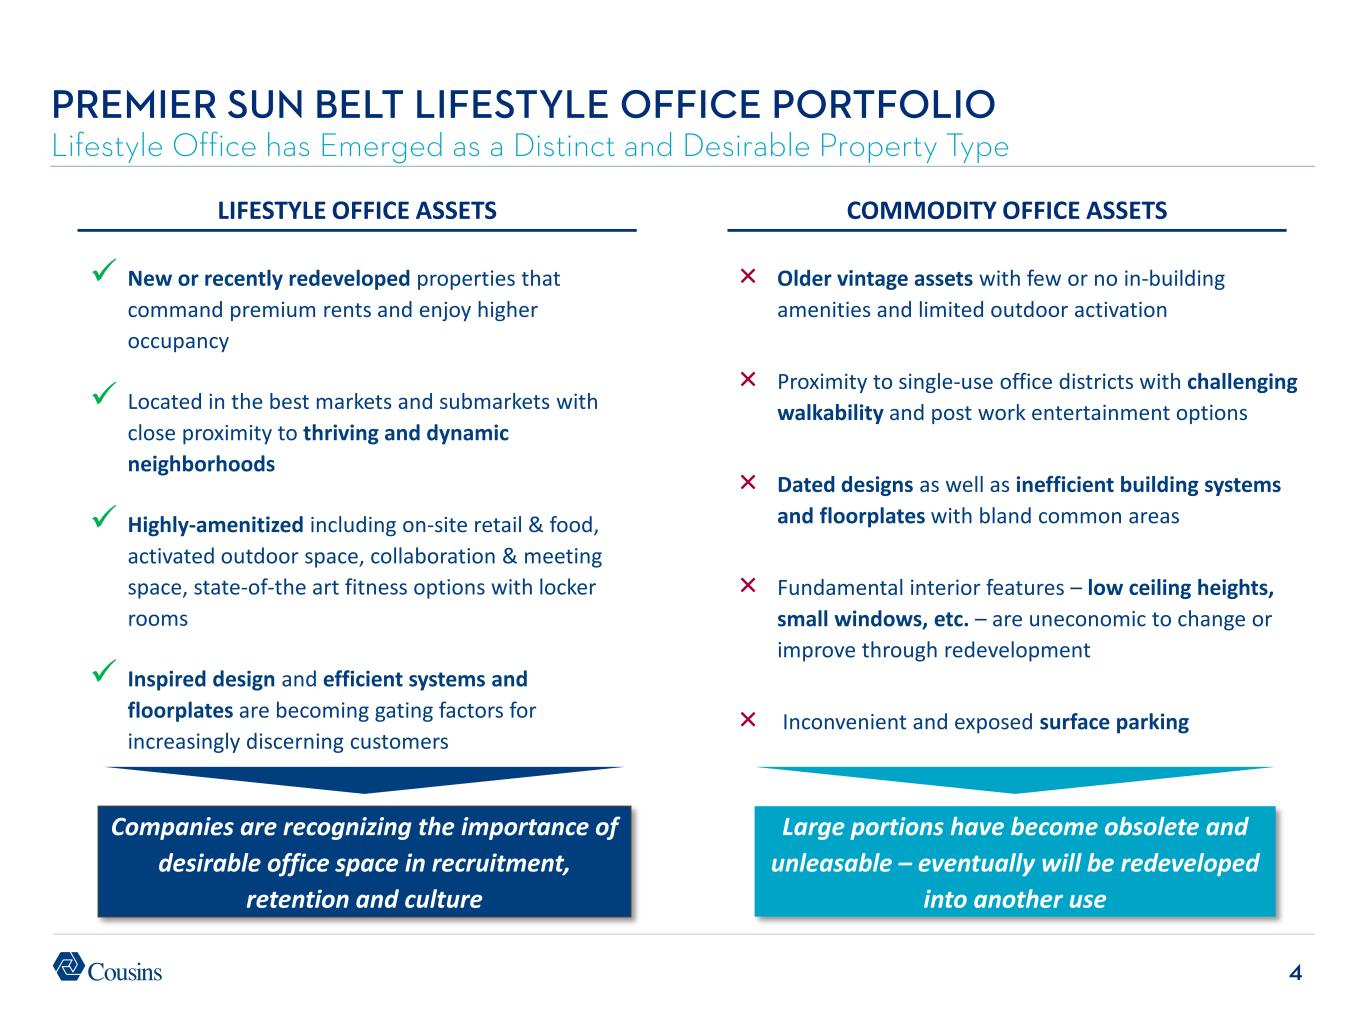
4 PREMIER SUN BELT LIFESTYLE OFFICE PORTFOLIO Lifestyle Office has Emerged as a Distinct and Desirable Property Type COMMODITY OFFICE ASSETS New or recently redeveloped properties that command premium rents and enjoy higher occupancy Located in the best markets and submarkets with close proximity to thriving and dynamic neighborhoods Highly-amenitized including on-site retail & food, activated outdoor space, collaboration & meeting space, state-of-the art fitness options with locker rooms Inspired design and efficient systems and floorplates are becoming gating factors for increasingly discerning customers LIFESTYLE OFFICE ASSETS × Older vintage assets with few or no in-building amenities and limited outdoor activation × Proximity to single-use office districts with challenging walkability and post work entertainment options × Dated designs as well as inefficient building systems and floorplates with bland common areas × Fundamental interior features – low ceiling heights, small windows, etc. – are uneconomic to change or improve through redevelopment × Inconvenient and exposed surface parking Companies are recognizing the importance of desirable office space in recruitment, retention and culture Large portions have become obsolete and unleasable – eventually will be redeveloped into another use
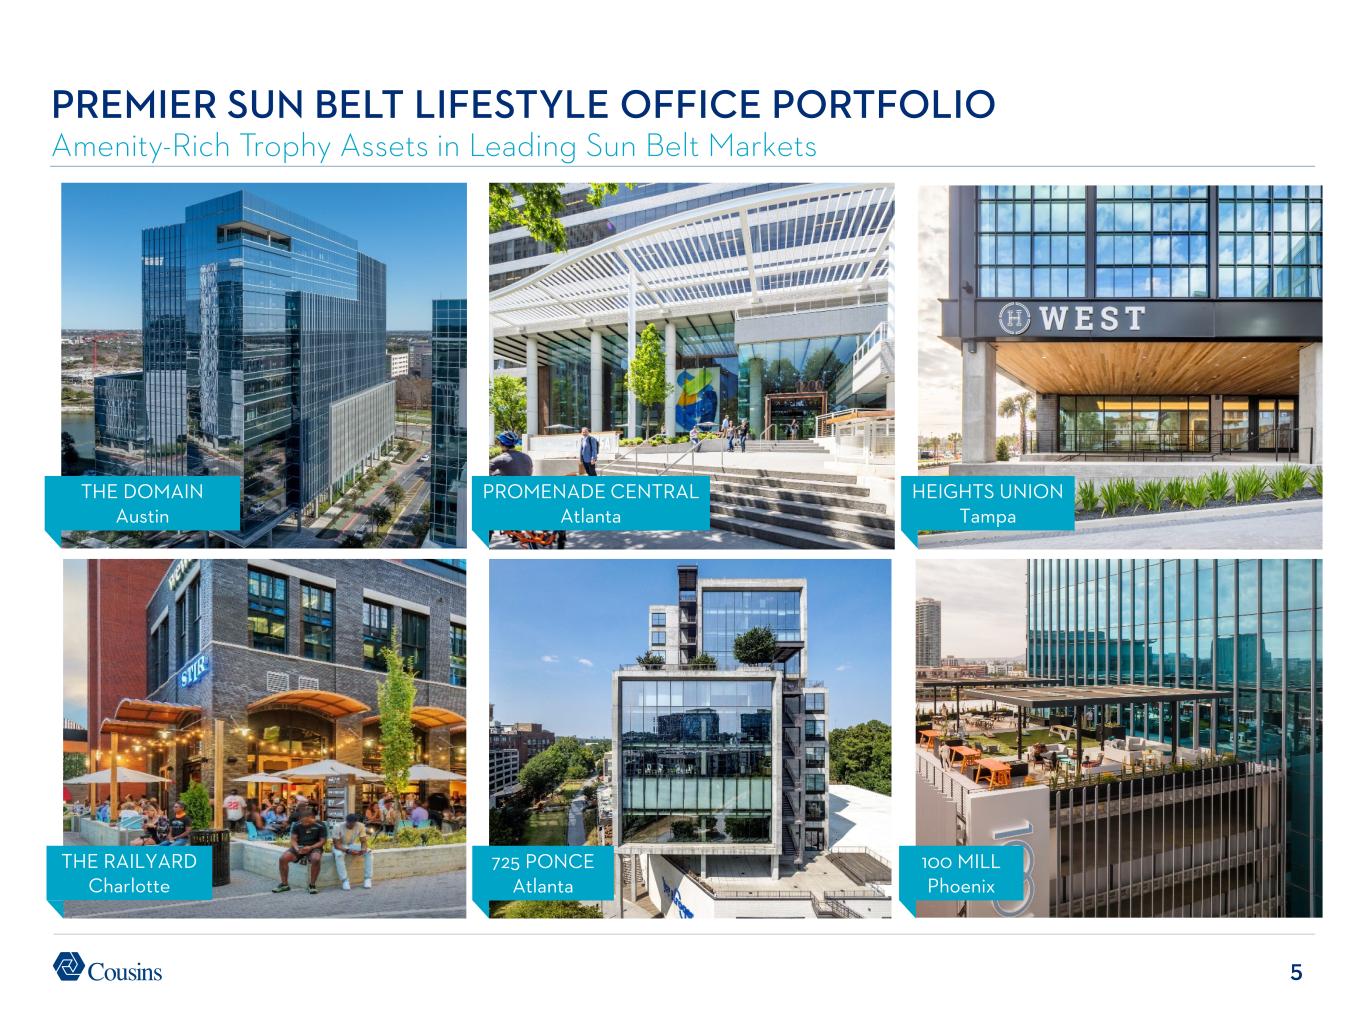
5 PREMIER SUN BELT LIFESTYLE OFFICE PORTFOLIO Amenity-Rich Trophy Assets in Leading Sun Belt Markets 725 PONCE Atlanta HEIGHTS UNION Tampa THE RAILYARD Charlotte 100 MILL Phoenix THE DOMAIN Austin PROMENADE CENTRAL Atlanta
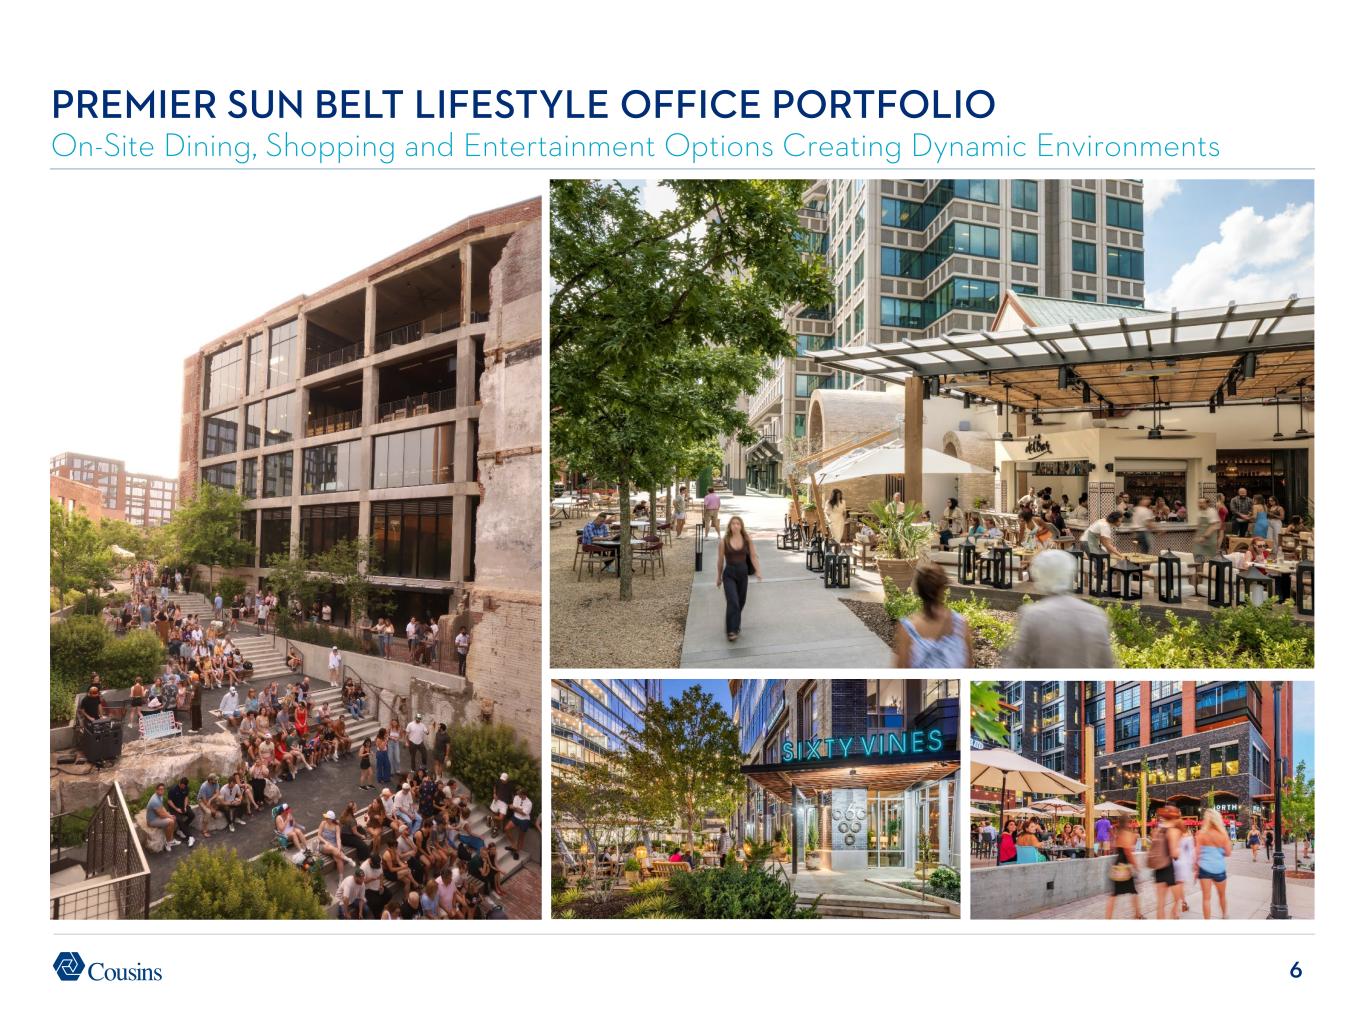
6 PREMIER SUN BELT LIFESTYLE OFFICE PORTFOLIO On-Site Dining, Shopping and Entertainment Options Creating Dynamic Environments
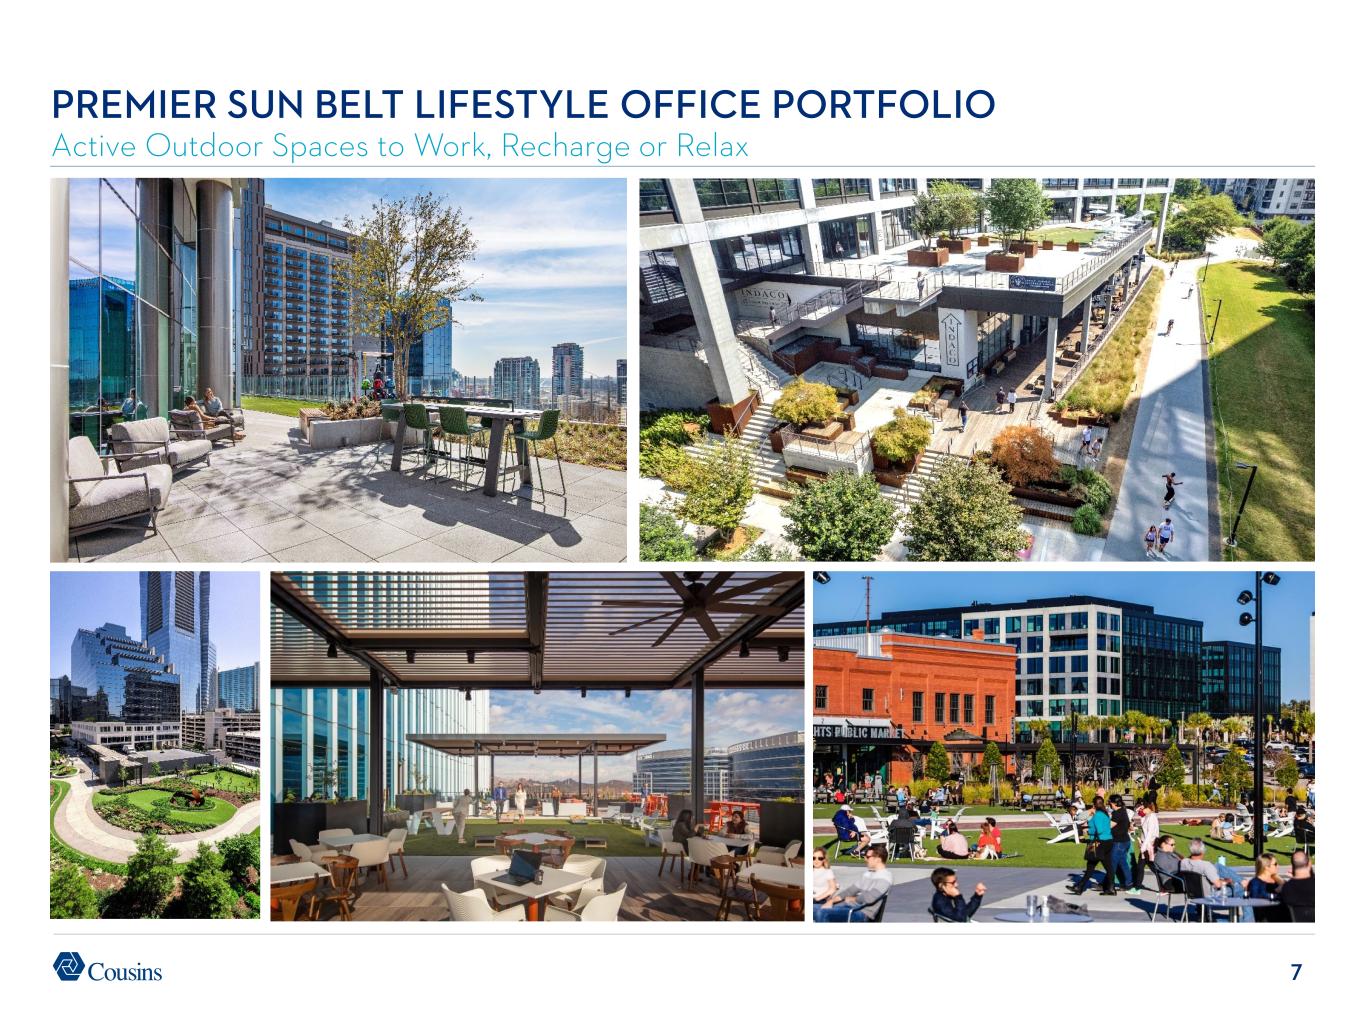
7 PREMIER SUN BELT LIFESTYLE OFFICE PORTFOLIO Active Outdoor Spaces to Work, Recharge or Relax
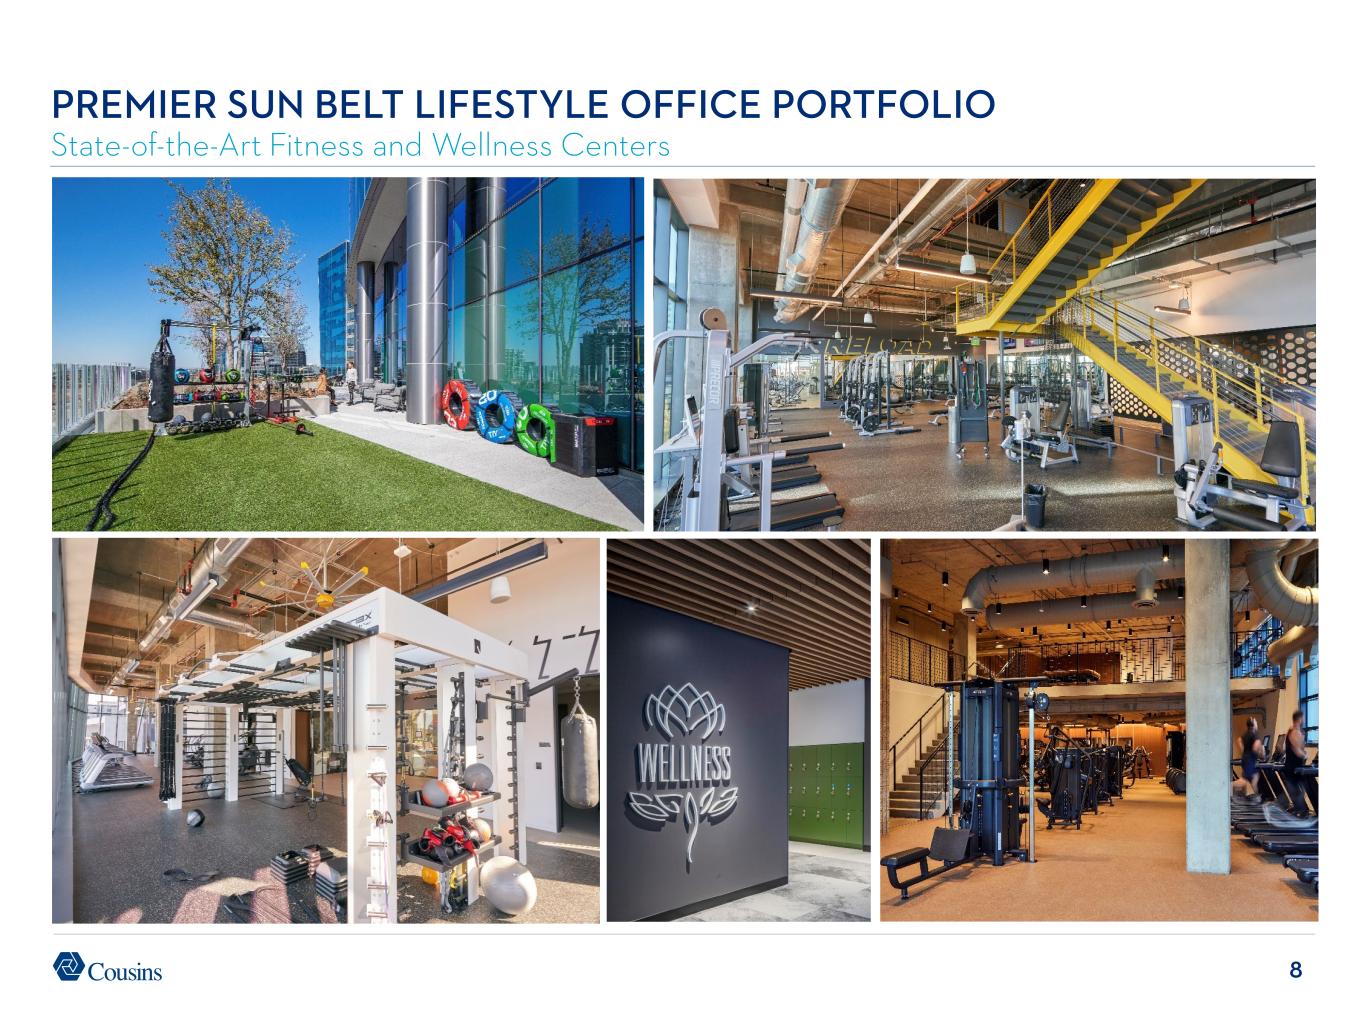
8 PREMIER SUN BELT LIFESTYLE OFFICE PORTFOLIO State-of-the-Art Fitness and Wellness Centers
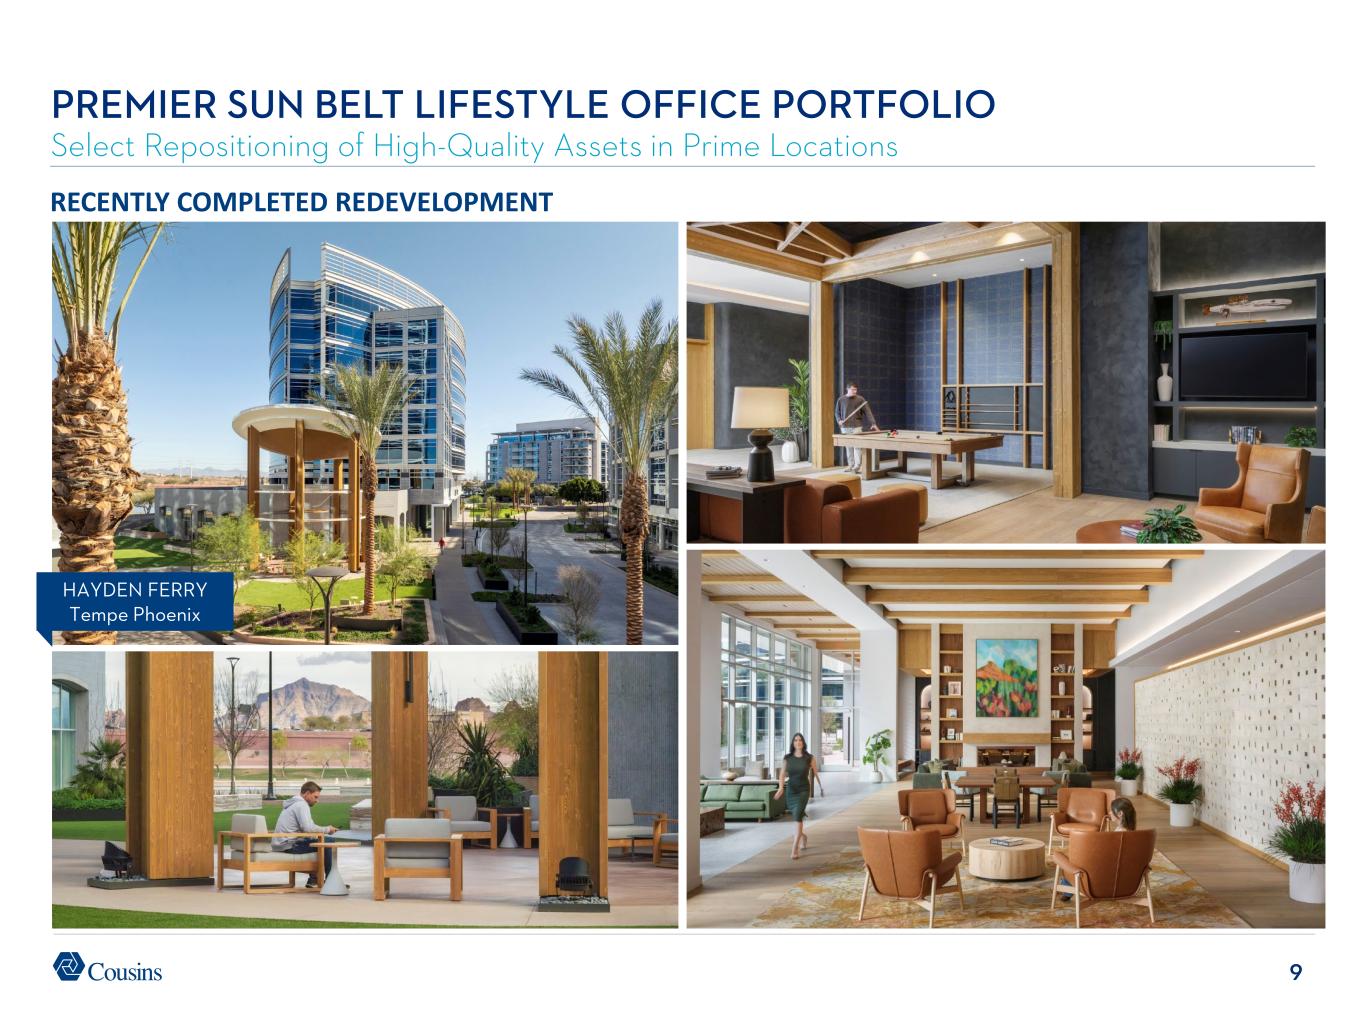
9 PREMIER SUN BELT LIFESTYLE OFFICE PORTFOLIO Select Repositioning of High-Quality Assets in Prime Locations HAYDEN FERRY Tempe Phoenix RECENTLY COMPLETED REDEVELOPMENT
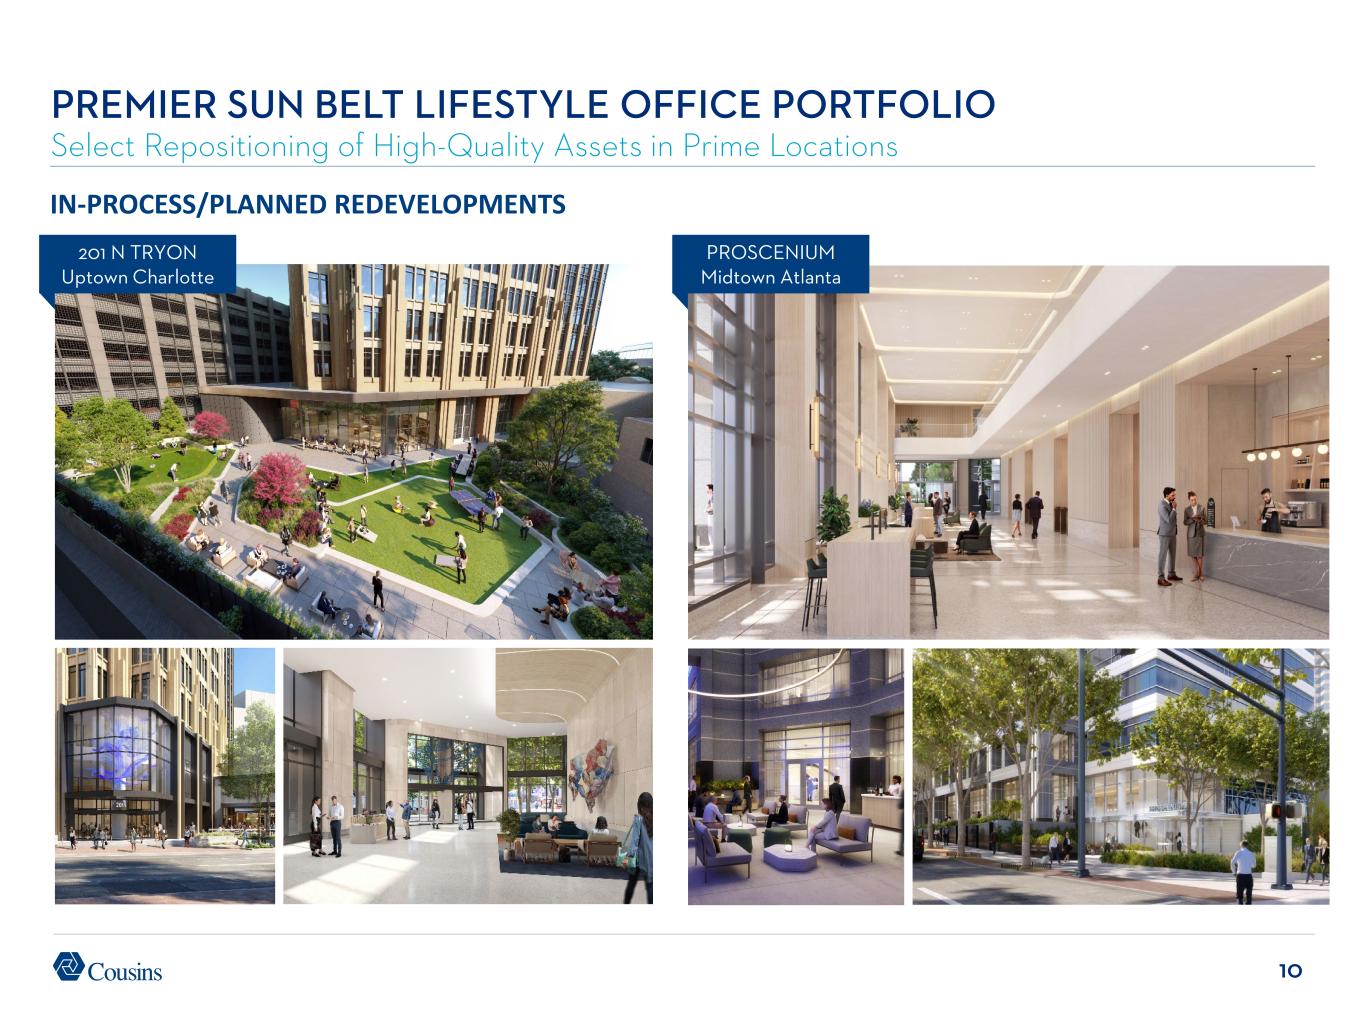
10 PREMIER SUN BELT LIFESTYLE OFFICE PORTFOLIO Select Repositioning of High-Quality Assets in Prime Locations 201 N TRYON Uptown Charlotte IN-PROCESS/PLANNED REDEVELOPMENTS PROSCENIUM Midtown Atlanta
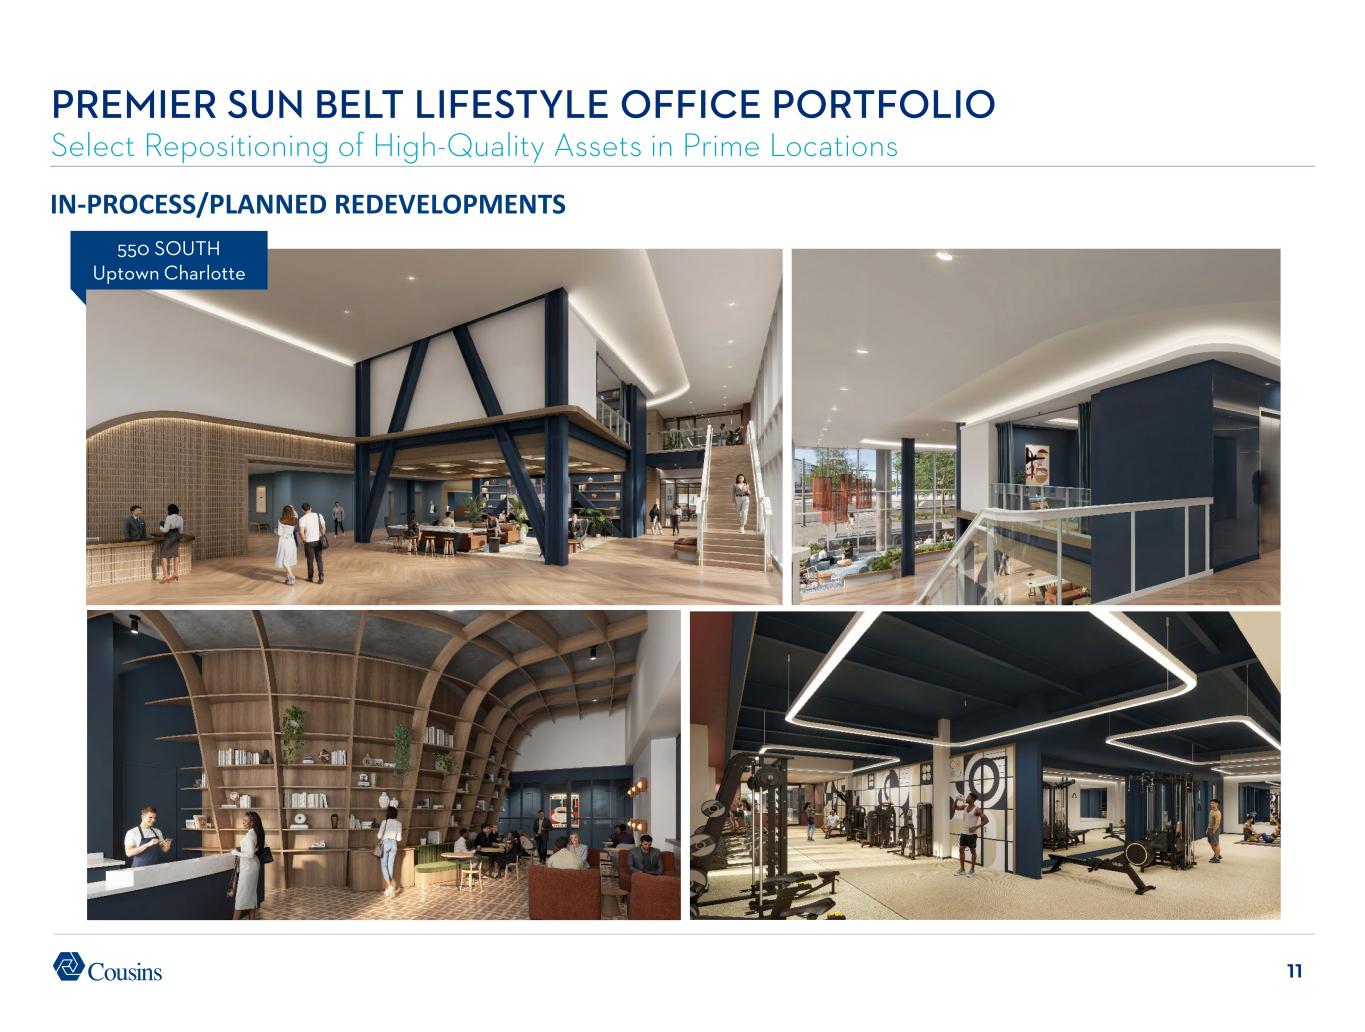
11 PREMIER SUN BELT LIFESTYLE OFFICE PORTFOLIO Select Repositioning of High-Quality Assets in Prime Locations 550 SOUTH Uptown Charlotte IN-PROCESS/PLANNED REDEVELOPMENTS
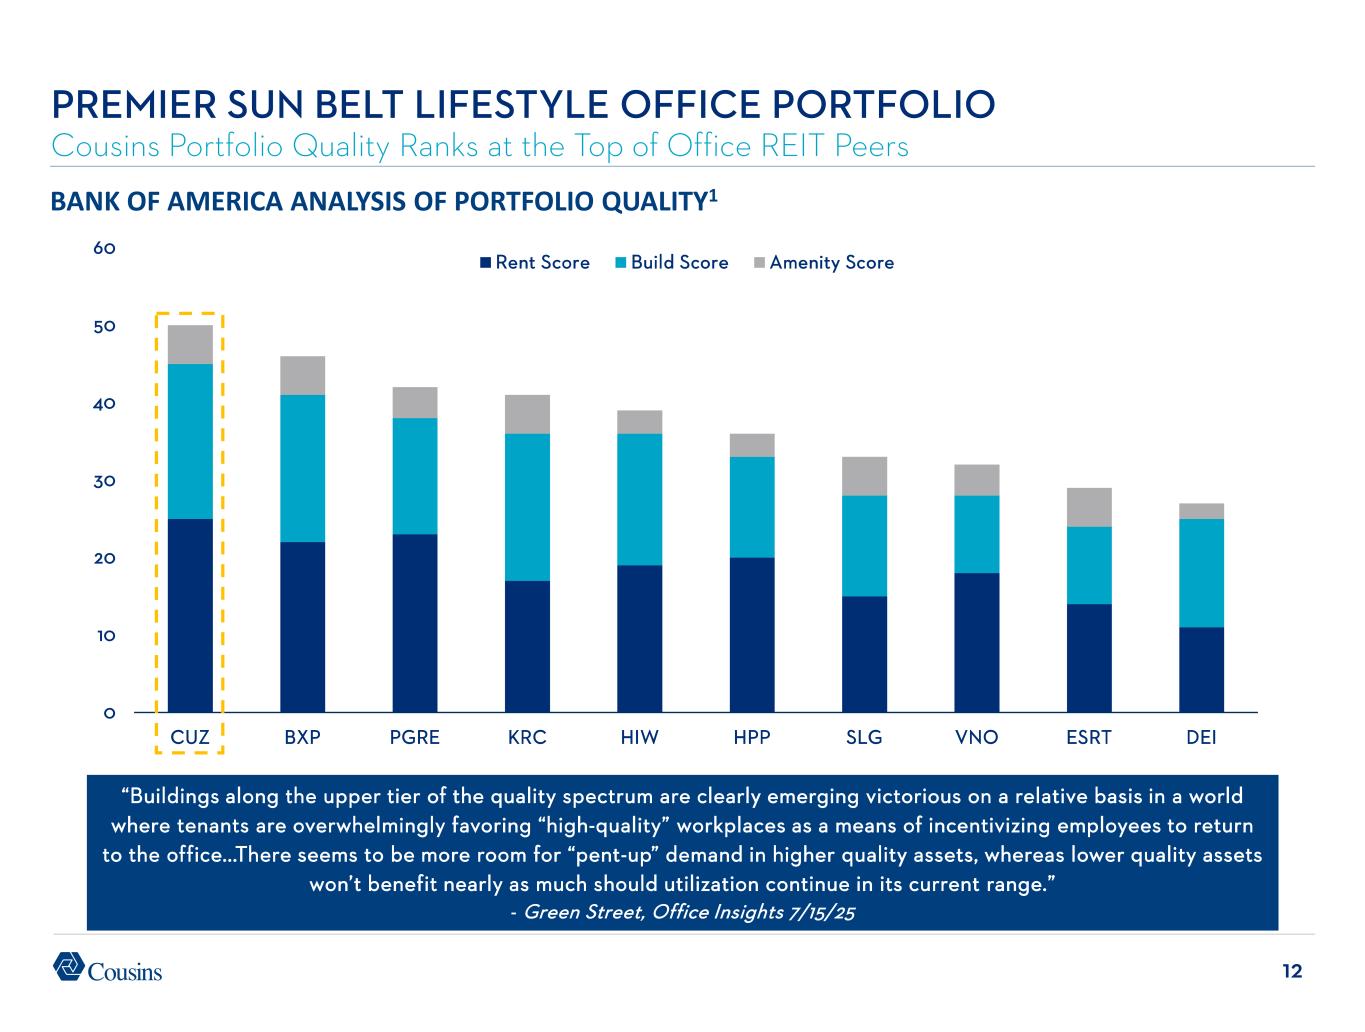
12 PREMIER SUN BELT LIFESTYLE OFFICE PORTFOLIO Cousins Portfolio Quality Ranks at the Top of Office REIT Peers 0 10 20 30 40 50 60 CUZ BXP PGRE KRC HIW HPP SLG VNO ESRT DEI Rent Score Build Score Amenity Score BANK OF AMERICA ANALYSIS OF PORTFOLIO QUALITY1 “Buildings along the upper tier of the quality spectrum are clearly emerging victorious on a relative basis in a world where tenants are overwhelmingly favoring “high-quality” workplaces as a means of incentivizing employees to return to the office...There seems to be more room for “pent-up” demand in higher quality assets, whereas lower quality assets won’t benefit nearly as much should utilization continue in its current range.” - Green Street, Office Insights 7/15/25
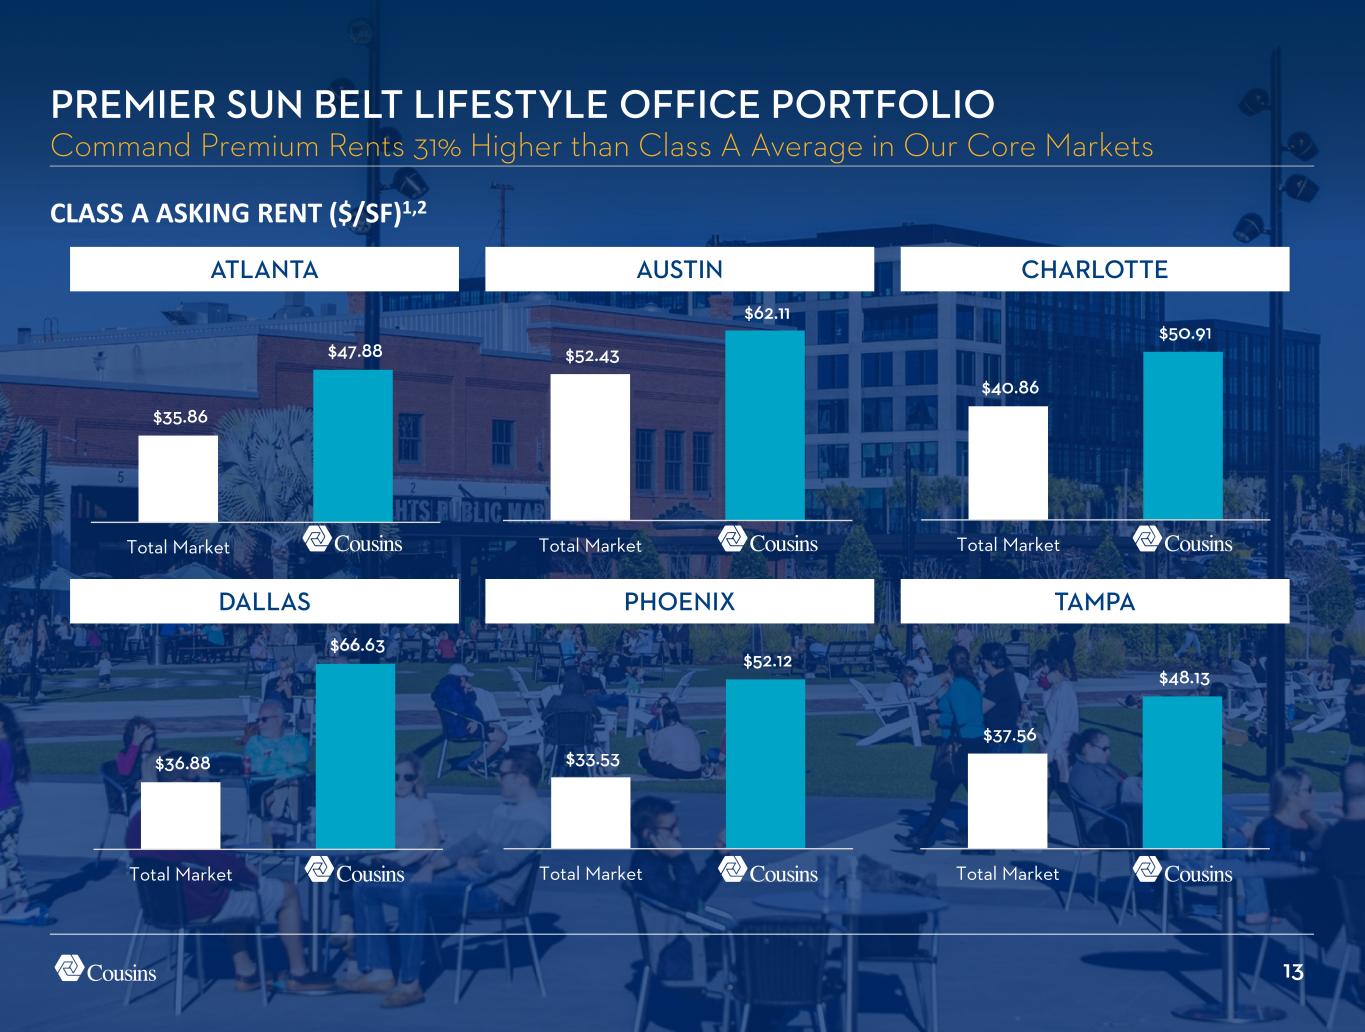
13 ATLANTA AUSTIN CHARLOTTE DALLAS PHOENIX TAMPA CLASS A ASKING RENT ($/SF)1,2 PREMIER SUN BELT LIFESTYLE OFFICE PORTFOLIO Command Premium Rents 31% Higher than Class A Average in Our Core Markets $35.86 $47.88 Total Market $36.88 $66.63 Total Market $33.53 $52.12 Total Market $37.56 $48.13 Total Market $52.43 $62.11 Total Market $40.86 $50.91 Total Market
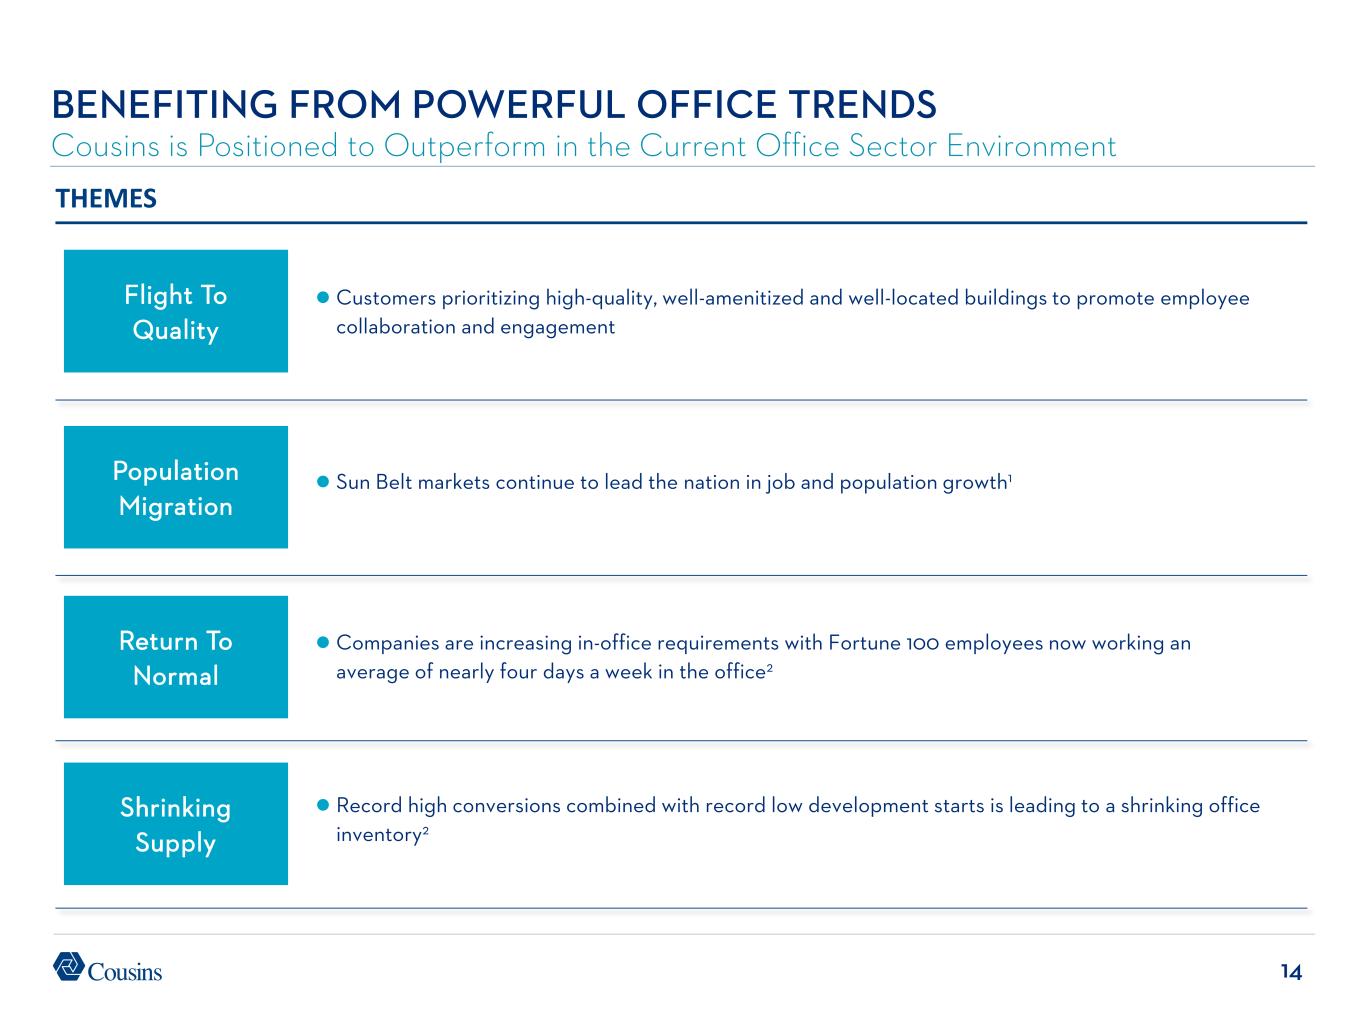
14 BENEFITING FROM POWERFUL OFFICE TRENDS Cousins is Positioned to Outperform in the Current Office Sector Environment Customers prioritizing high-quality, well-amenitized and well-located buildings to promote employee collaboration and engagement Flight To Quality Population Migration Return To Normal Sun Belt markets continue to lead the nation in job and population growth1 Companies are increasing in-office requirements with Fortune 100 employees now working an average of nearly four days a week in the office2 Shrinking Supply Record high conversions combined with record low development starts is leading to a shrinking office inventory2 THEMES
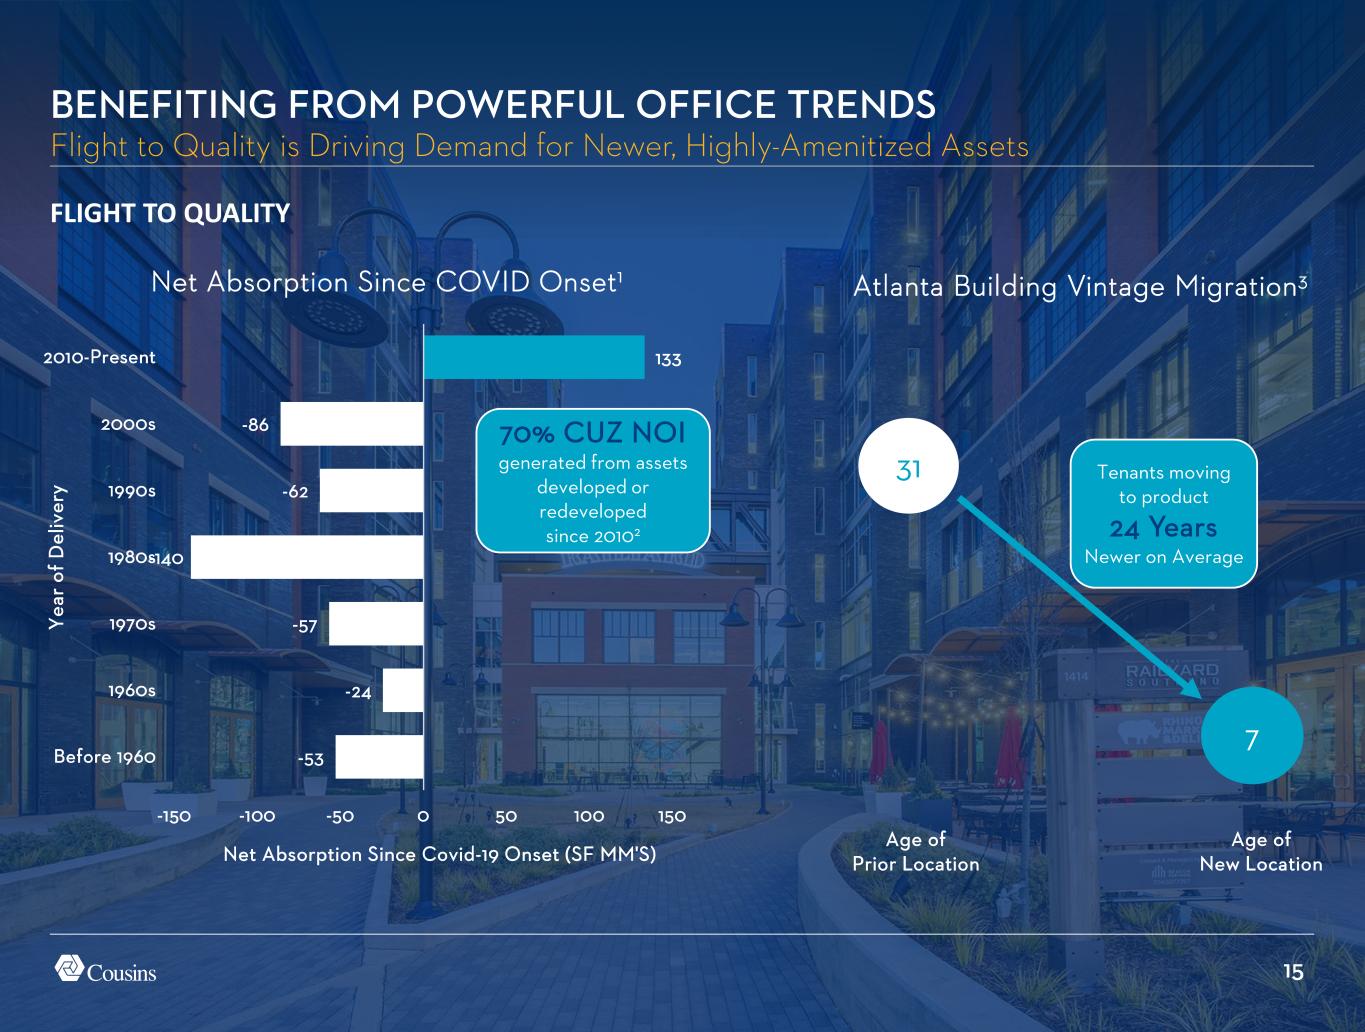
15 -53 -24 -57 -140 -62 -86 133 -150 -100 -50 0 50 100 150 Before 1960 1960s 1970s 1980s 1990s 2000s 2010-Present Net Absorption Since Covid-19 Onset (SF MM'S) Y ea r of D el iv er y FLIGHT TO QUALITY Net Absorption Since COVID Onset1 BENEFITING FROM POWERFUL OFFICE TRENDS Flight to Quality is Driving Demand for Newer, Highly-Amenitized Assets 70% CUZ NOI generated from assets developed or redeveloped since 20102 Atlanta Building Vintage Migration3 31 7 Tenants moving to product 24 Years Newer on Average Age of Prior Location Age of New Location
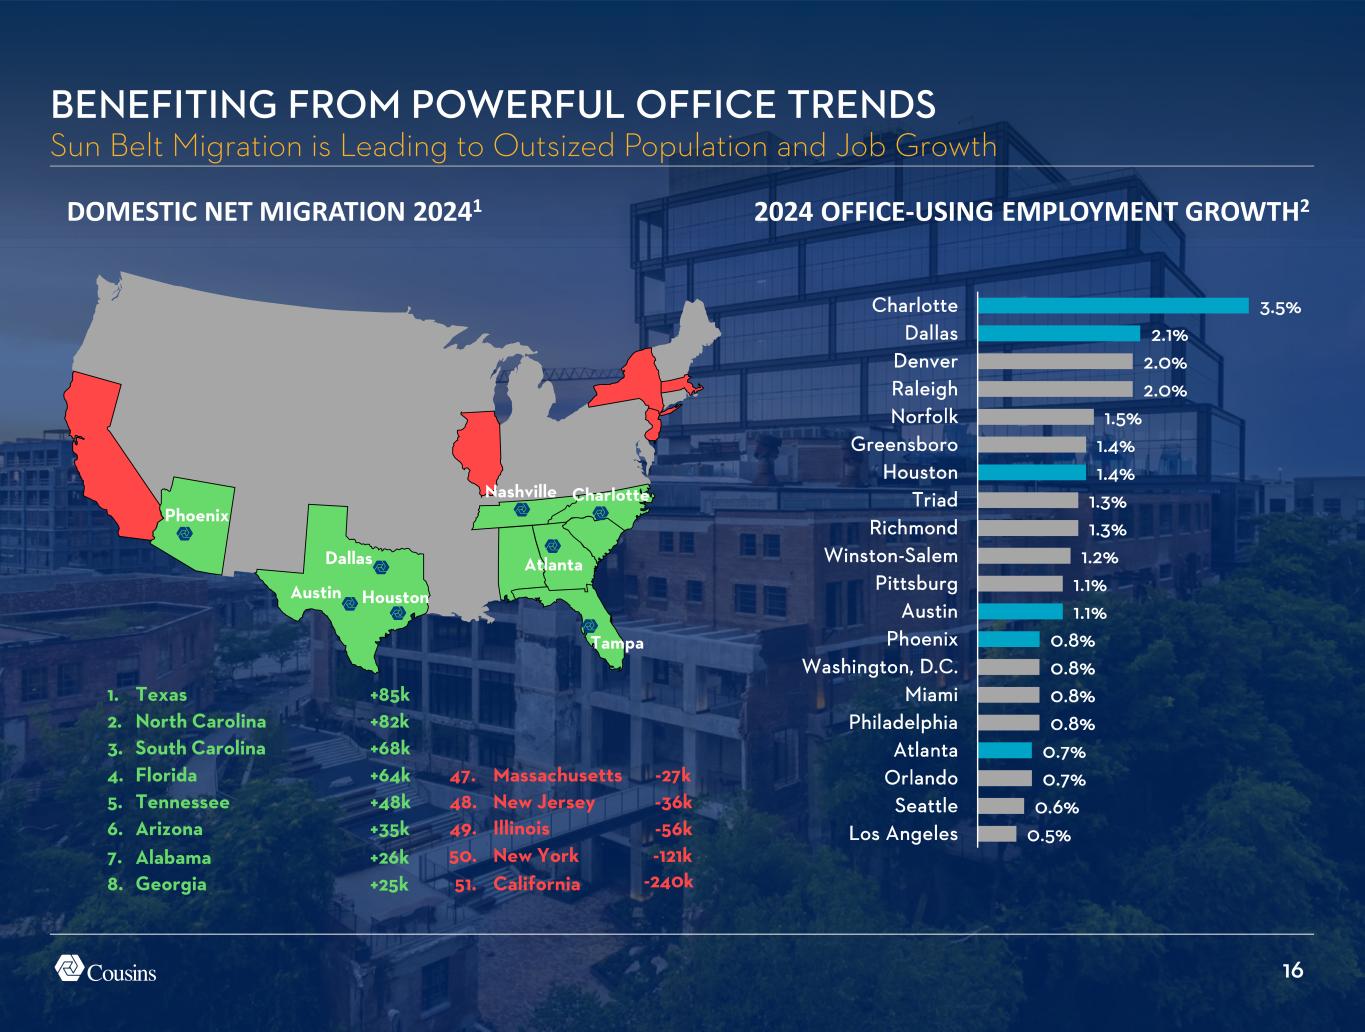
16 DOMESTIC NET MIGRATION 20241 BENEFITING FROM POWERFUL OFFICE TRENDS Sun Belt Migration is Leading to Outsized Population and Job Growth Houston Dallas Austin Nashville Charlotte Atlanta Tampa Phoenix 1. Texas +85k 2. North Carolina +82k 3. South Carolina +68k 47. Massachusetts -27k4. Florida +64k 48. New Jersey -36k5. Tennessee +48k 49. Illinois -56k6. Arizona +35k 50. New York -121k7. Alabama +26k 51. California -240k8. Georgia +25k 0.5% 0.6% 0.7% 0.7% 0.8% 0.8% 0.8% 0.8% 1.1% 1.1% 1.2% 1.3% 1.3% 1.4% 1.4% 1.5% 2.0% 2.0% 2.1% 3.5% Los Angeles Seattle Orlando Atlanta Philadelphia Miami Washington, D.C. Phoenix Austin Pittsburg Winston-Salem Richmond Triad Houston Greensboro Norfolk Raleigh Denver Dallas Charlotte 2024 OFFICE-USING EMPLOYMENT GROWTH2
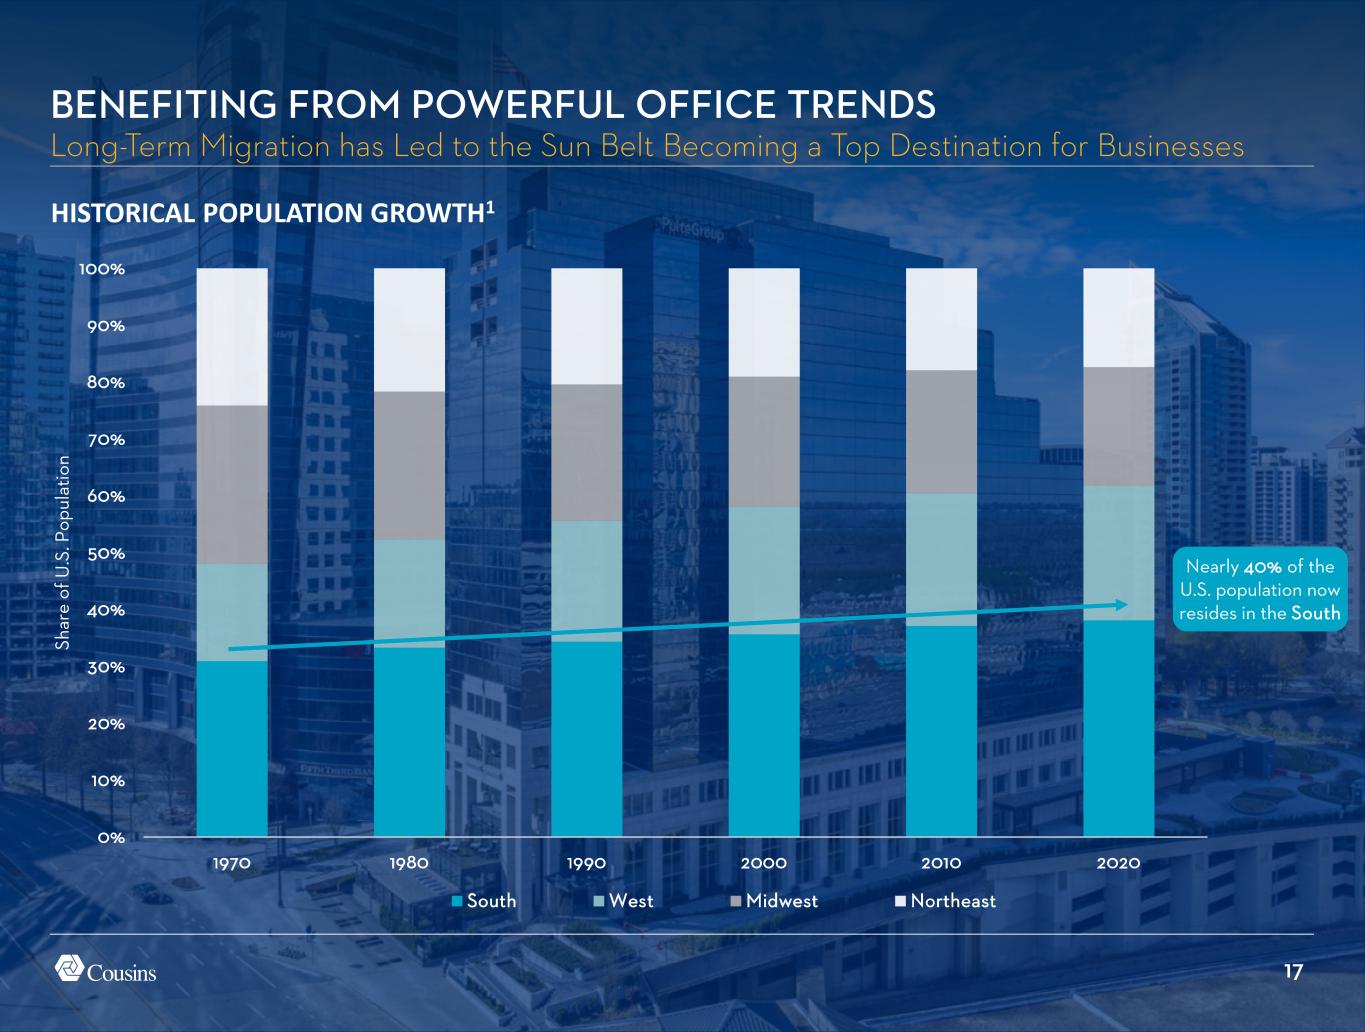
17 BENEFITING FROM POWERFUL OFFICE TRENDS Long-Term Migration has Led to the Sun Belt Becoming a Top Destination for Businesses 0% 10% 20% 30% 40% 50% 60% 70% 80% 90% 100% 1970 1980 1990 2000 2010 2020 Sh ar e of U .S . P op ul at io n South West Midwest Northeast HISTORICAL POPULATION GROWTH1 Nearly 40% of the U.S. population now resides in the South
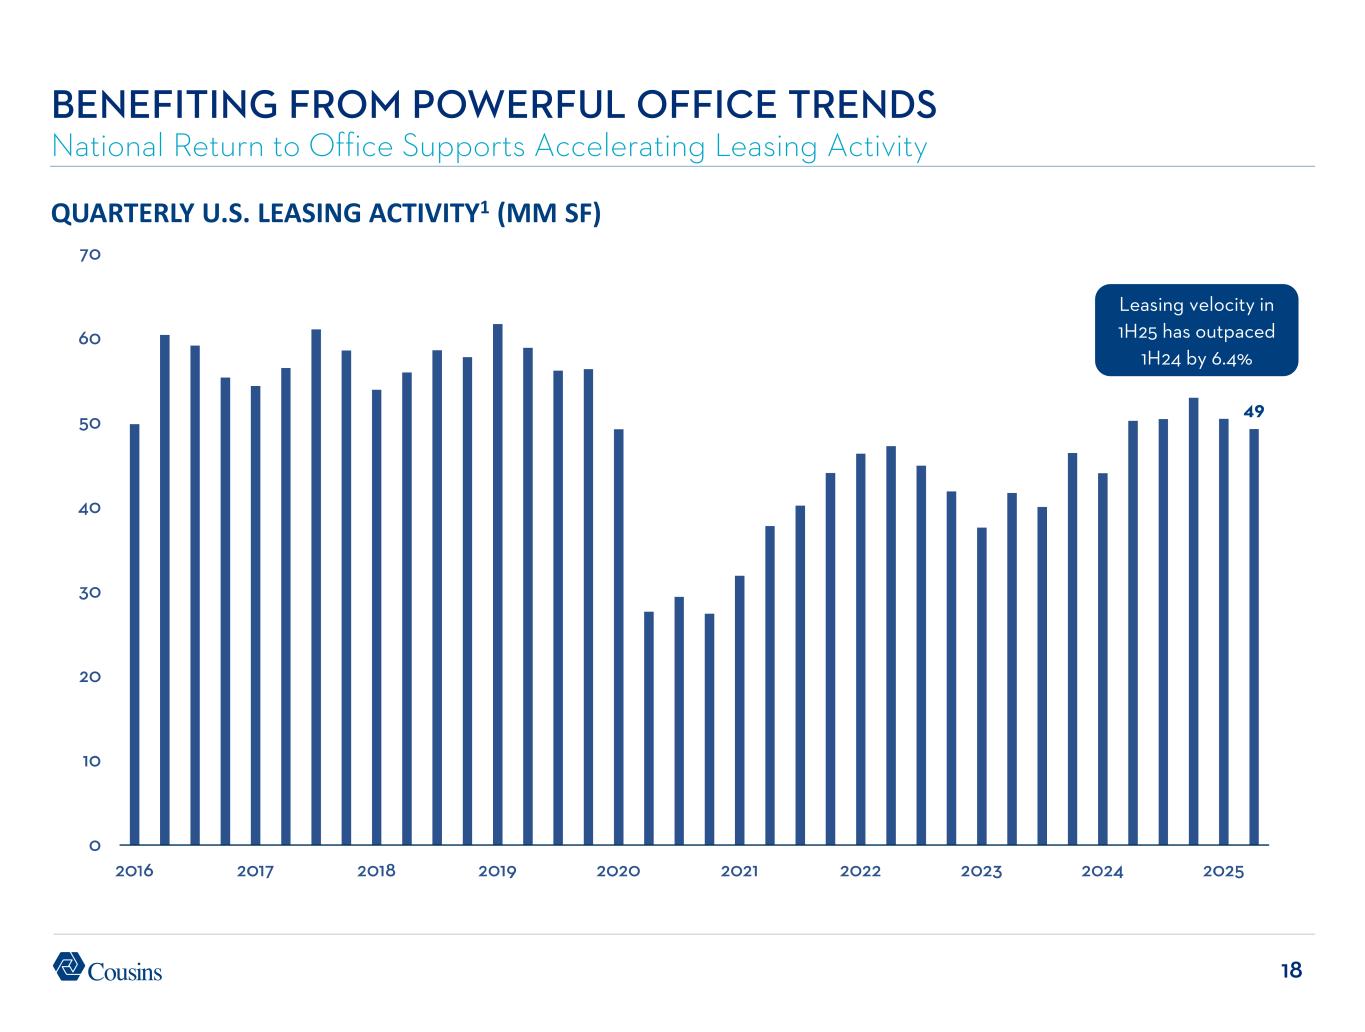
18 49 0 10 20 30 40 50 60 70 2016 2017 2018 2019 2020 2021 2022 2023 2024 2025 QUARTERLY U.S. LEASING ACTIVITY1 (MM SF) BENEFITING FROM POWERFUL OFFICE TRENDS National Return to Office Supports Accelerating Leasing Activity Leasing velocity in 1H25 has outpaced 1H24 by 6.4%
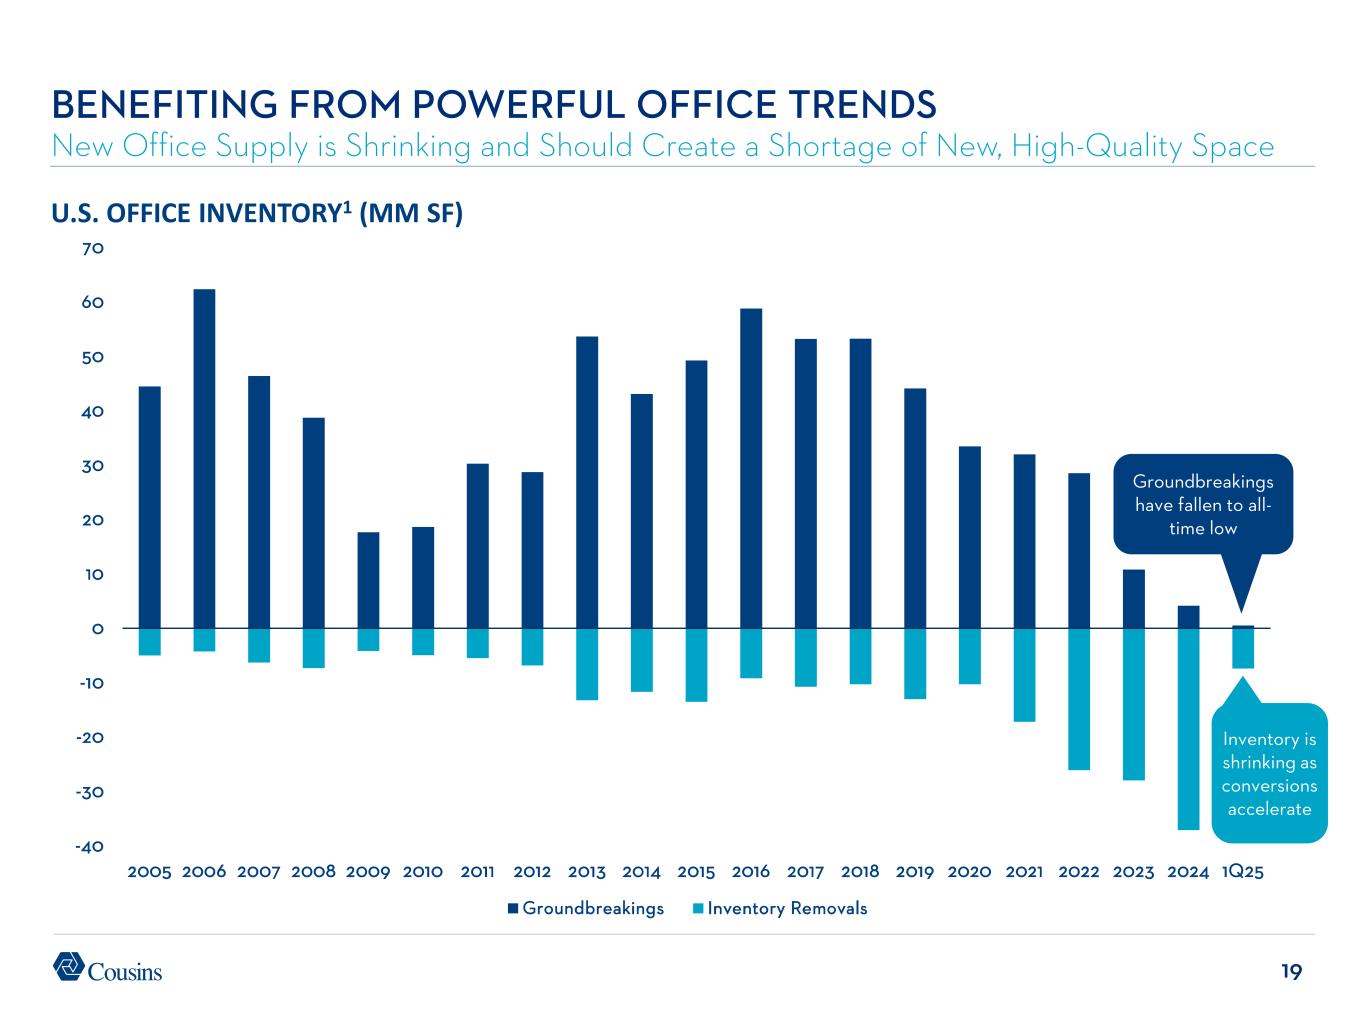
19 -40 -30 -20 -10 0 10 20 30 40 50 60 70 2005 2006 2007 2008 2009 2010 2011 2012 2013 2014 2015 2016 2017 2018 2019 2020 2021 2022 2023 2024 1Q25 Groundbreakings Inventory Removals U.S. OFFICE INVENTORY1 (MM SF) BENEFITING FROM POWERFUL OFFICE TRENDS New Office Supply is Shrinking and Should Create a Shortage of New, High-Quality Space Groundbreakings have fallen to all- time low Inventory is shrinking as conversions accelerate
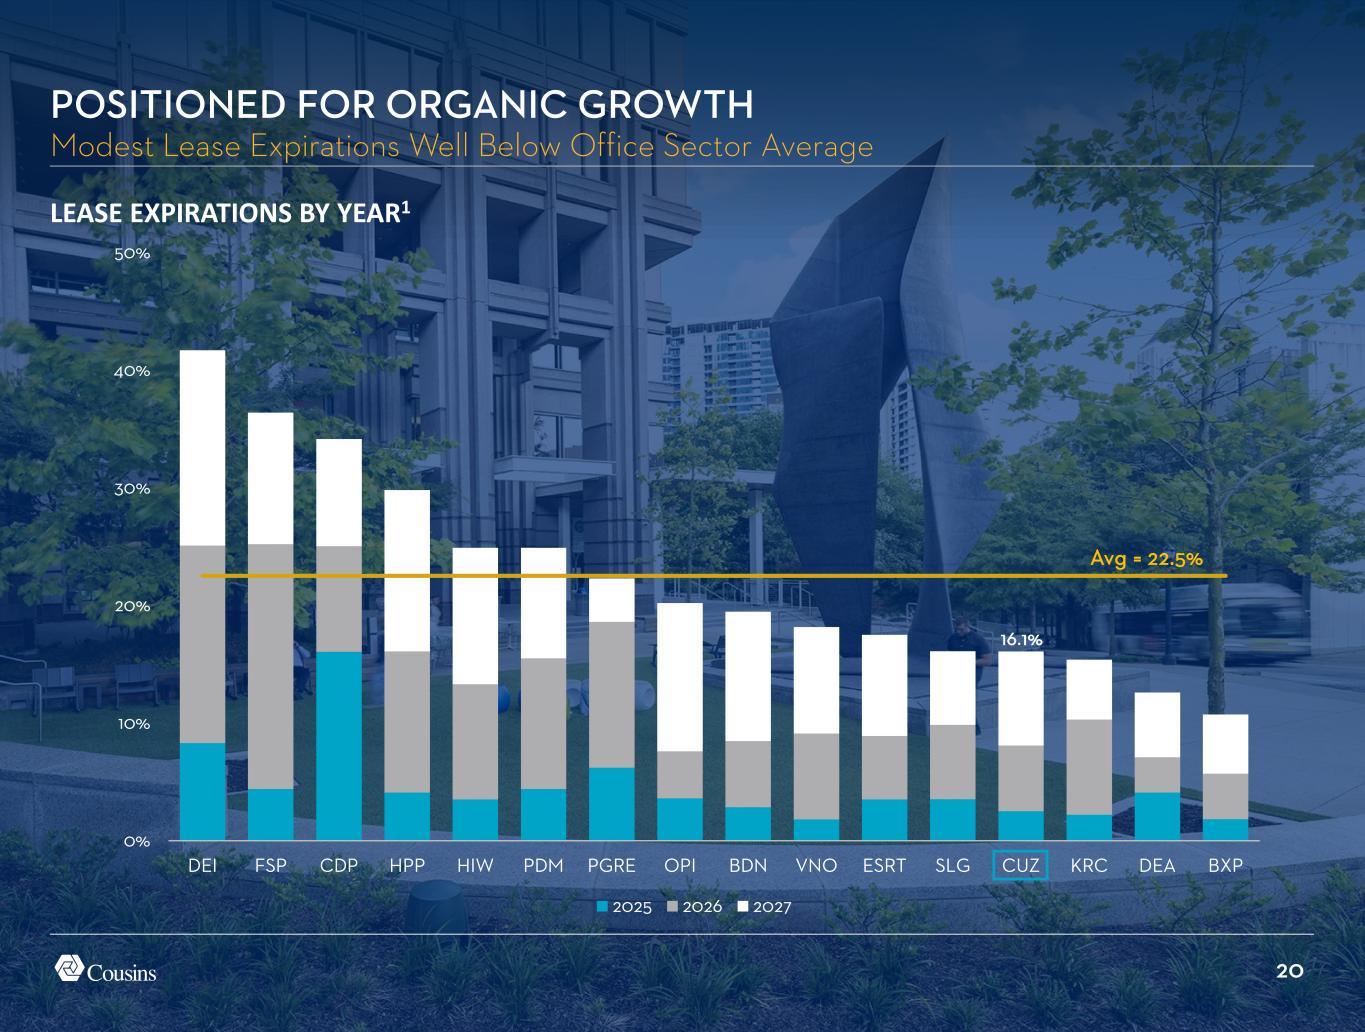
20 0% 10% 20% 30% 40% 50% DEI FSP CDP HPP HIW PDM PGRE OPI BDN VNO ESRT SLG CUZ KRC DEA BXP 2025 2026 2027 LEASE EXPIRATIONS BY YEAR1 POSITIONED FOR ORGANIC GROWTH Modest Lease Expirations Well Below Office Sector Average 16.1% Avg = 22.5%
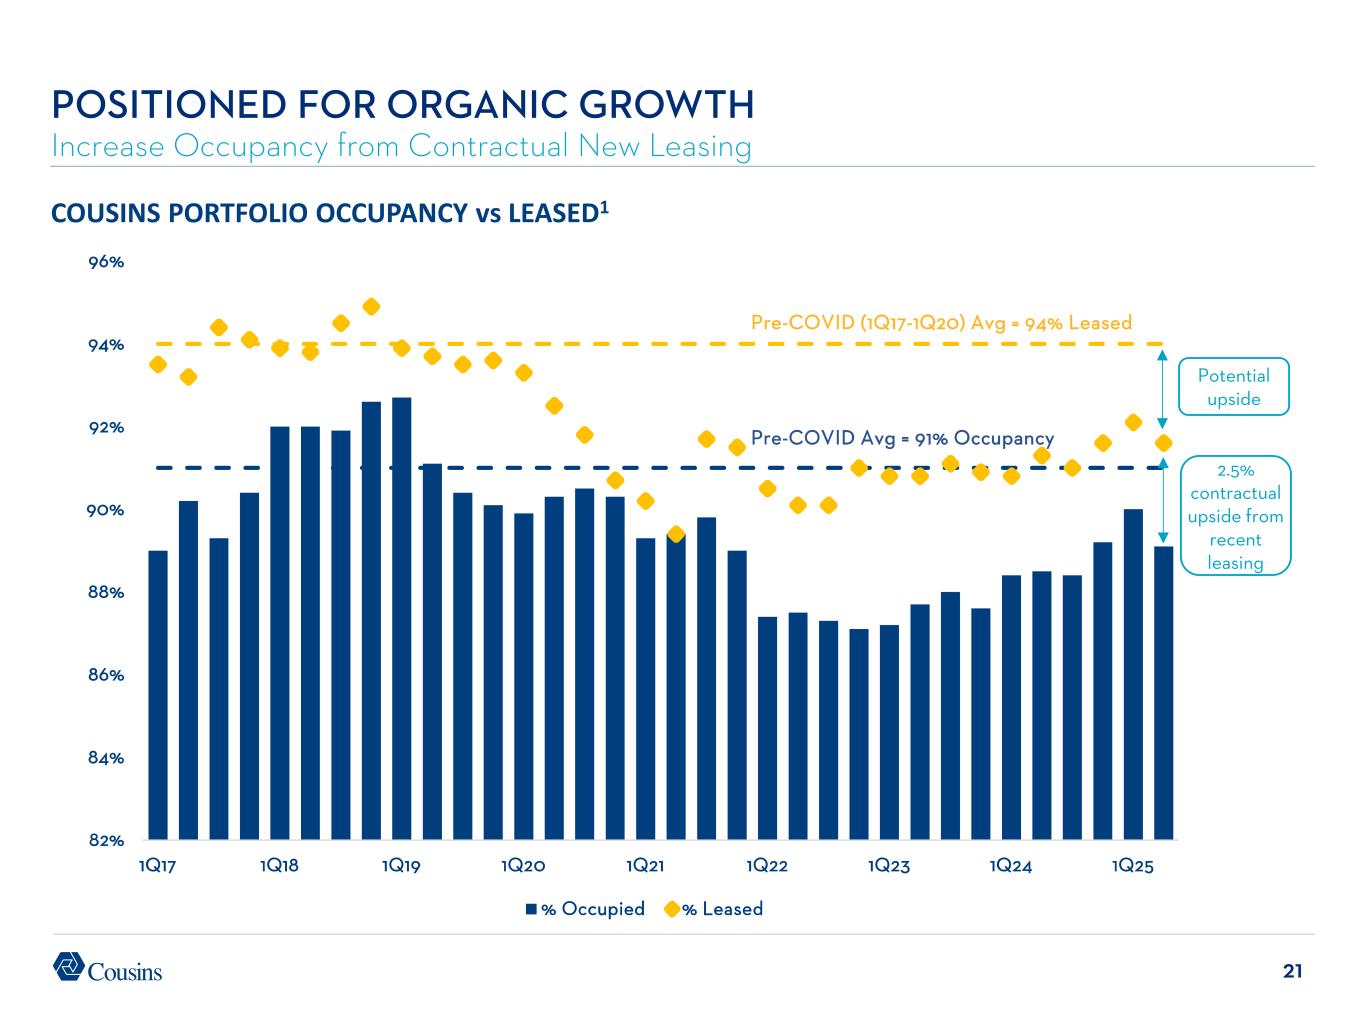
21 82% 84% 86% 88% 90% 92% 94% 96% 1Q17 1Q18 1Q19 1Q20 1Q21 1Q22 1Q23 1Q24 1Q25 % Occupied % Leased COUSINS PORTFOLIO OCCUPANCY vs LEASED1 POSITIONED FOR ORGANIC GROWTH Increase Occupancy from Contractual New Leasing Pre-COVID (1Q17-1Q20) Avg = 94% Leased 2.5% contractual upside from recent leasing Potential upside Pre-COVID Avg = 91% Occupancy
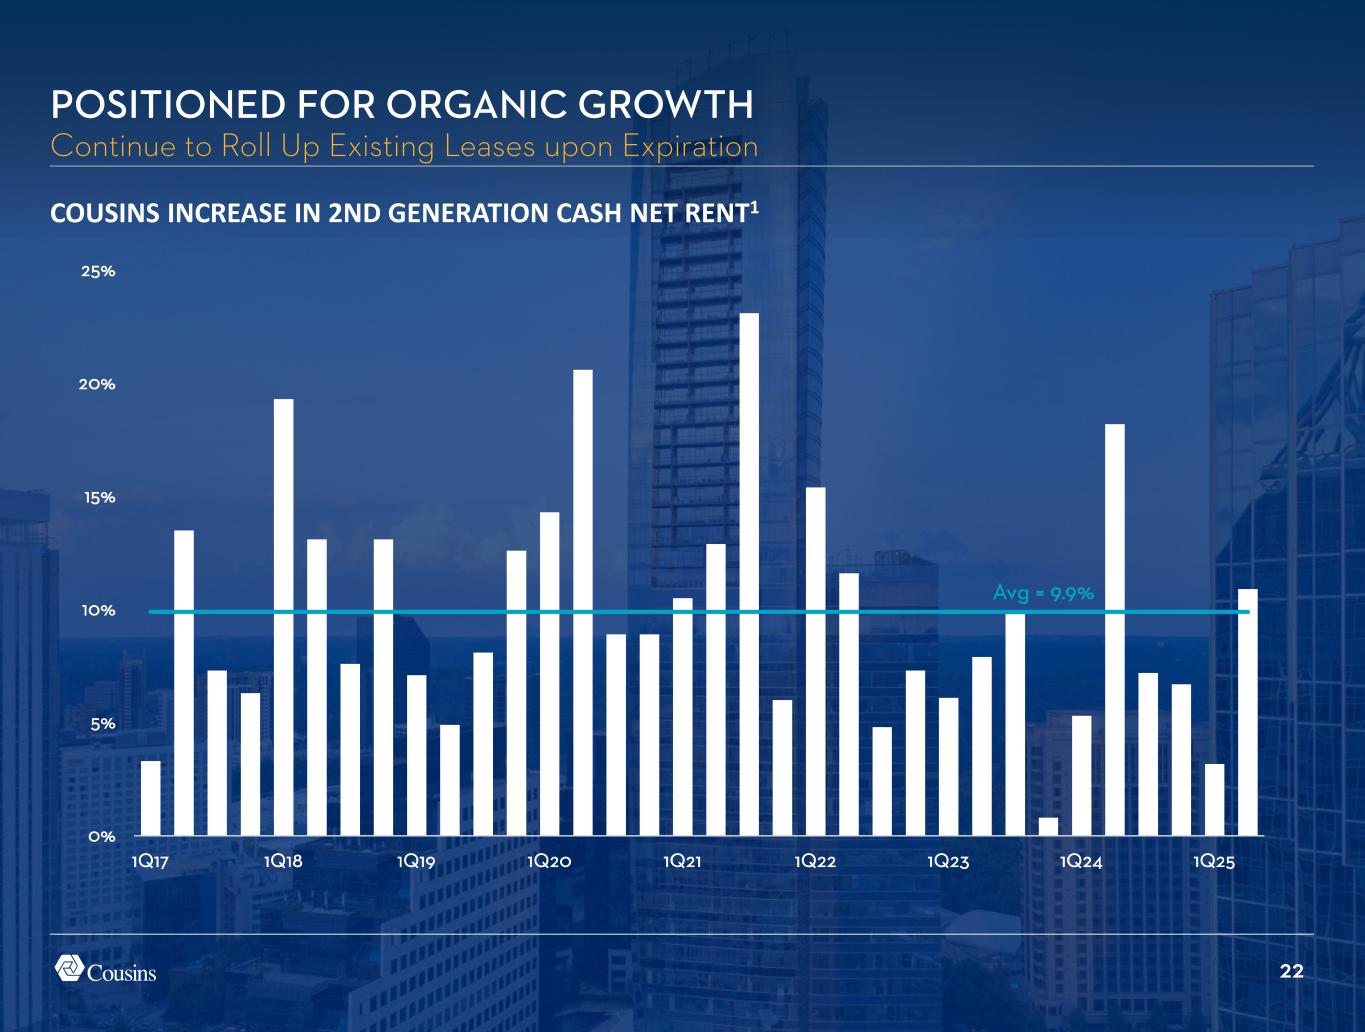
22 0% 5% 10% 15% 20% 25% 1Q17 1Q18 1Q19 1Q20 1Q21 1Q22 1Q23 1Q24 1Q25 POSITIONED FOR ORGANIC GROWTH Continue to Roll Up Existing Leases upon Expiration COUSINS INCREASE IN 2ND GENERATION CASH NET RENT1 Avg = 9.9%
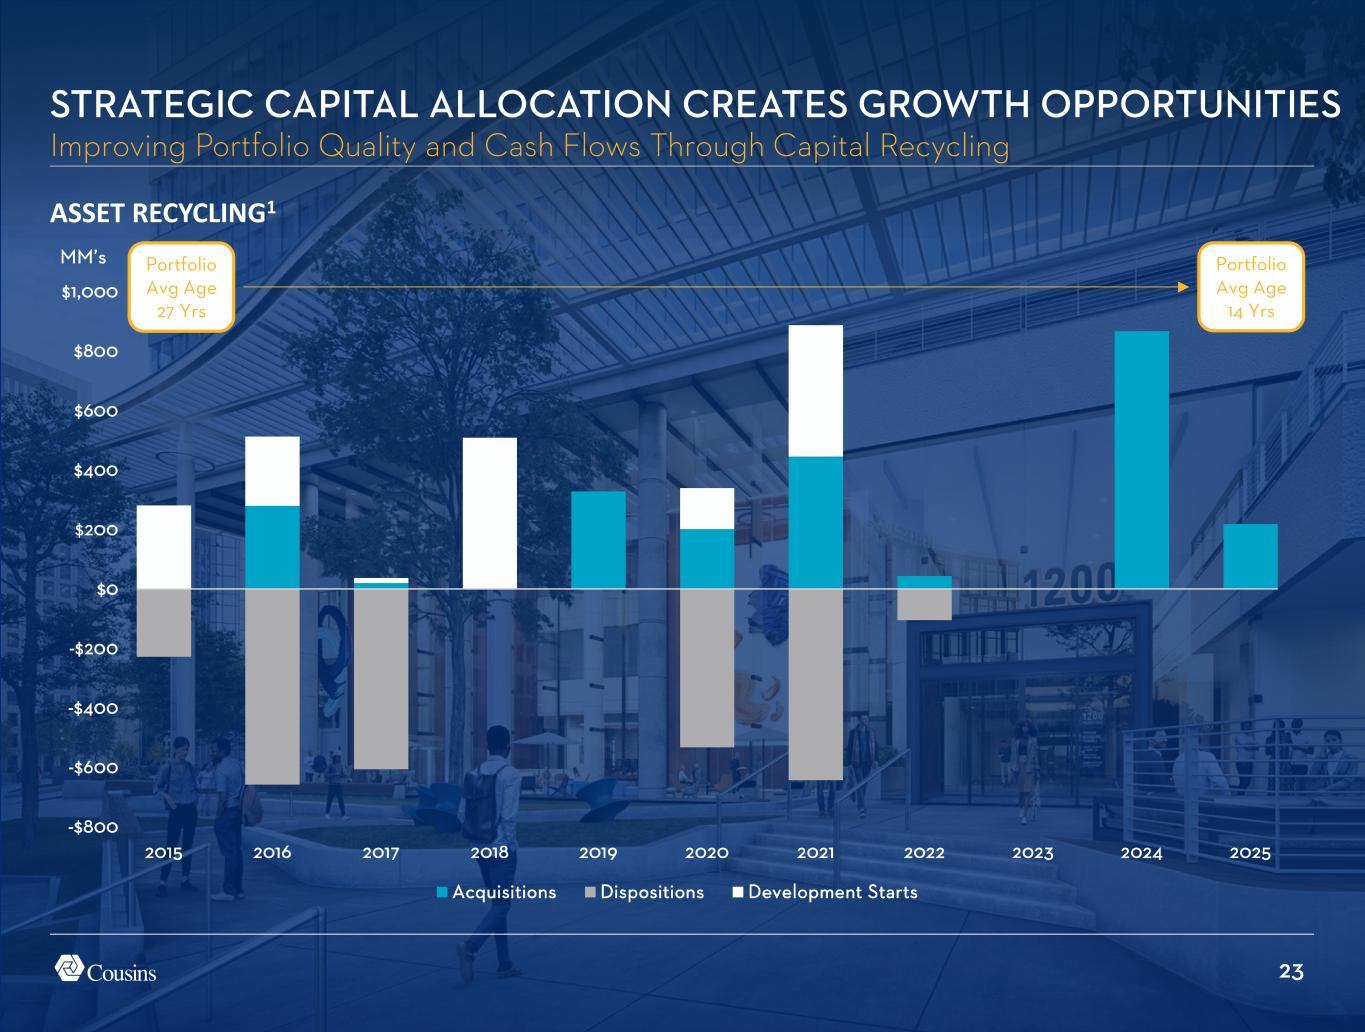
23 -$800 -$600 -$400 -$200 $0 $200 $400 $600 $800 $1,000 2015 2016 2017 2018 2019 2020 2021 2022 2023 2024 2025 Acquisitions Dispositions Development Starts ASSET RECYCLING1 STRATEGIC CAPITAL ALLOCATION CREATES GROWTH OPPORTUNITIES Improving Portfolio Quality and Cash Flows Through Capital Recycling MM’s Portfolio Avg Age 27 Yrs Portfolio Avg Age 14 Yrs
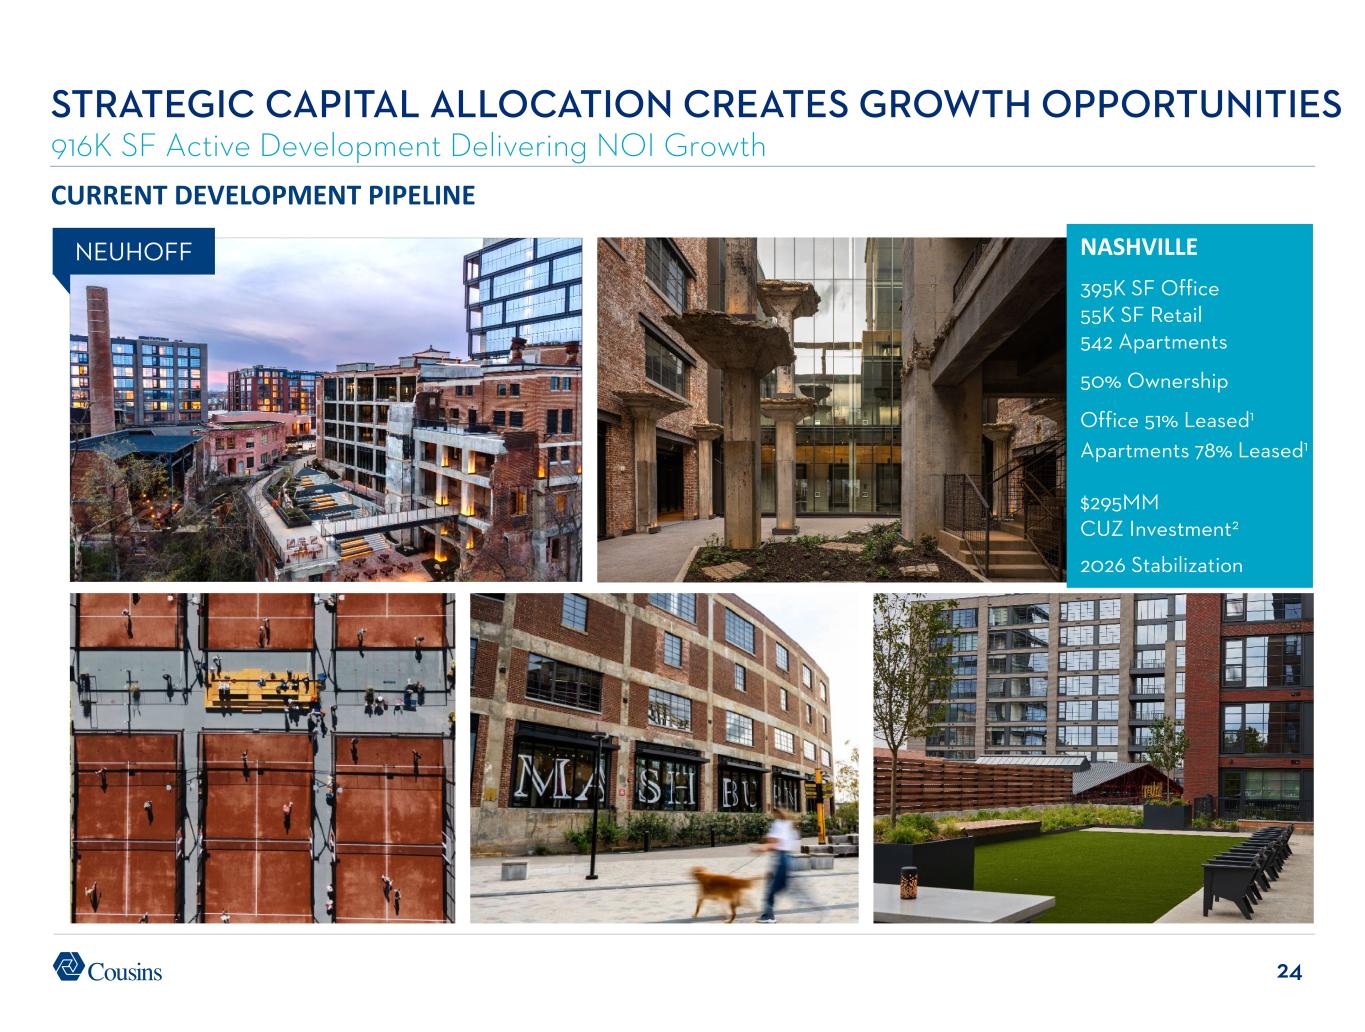
24 STRATEGIC CAPITAL ALLOCATION CREATES GROWTH OPPORTUNITIES 916K SF Active Development Delivering NOI Growth NEUHOFF CURRENT DEVELOPMENT PIPELINE NASHVILLE 395K SF Office 55K SF Retail 542 Apartments 50% Ownership Office 51% Leased1 Apartments 78% Leased1 $295MM CUZ Investment2 2026 Stabilization
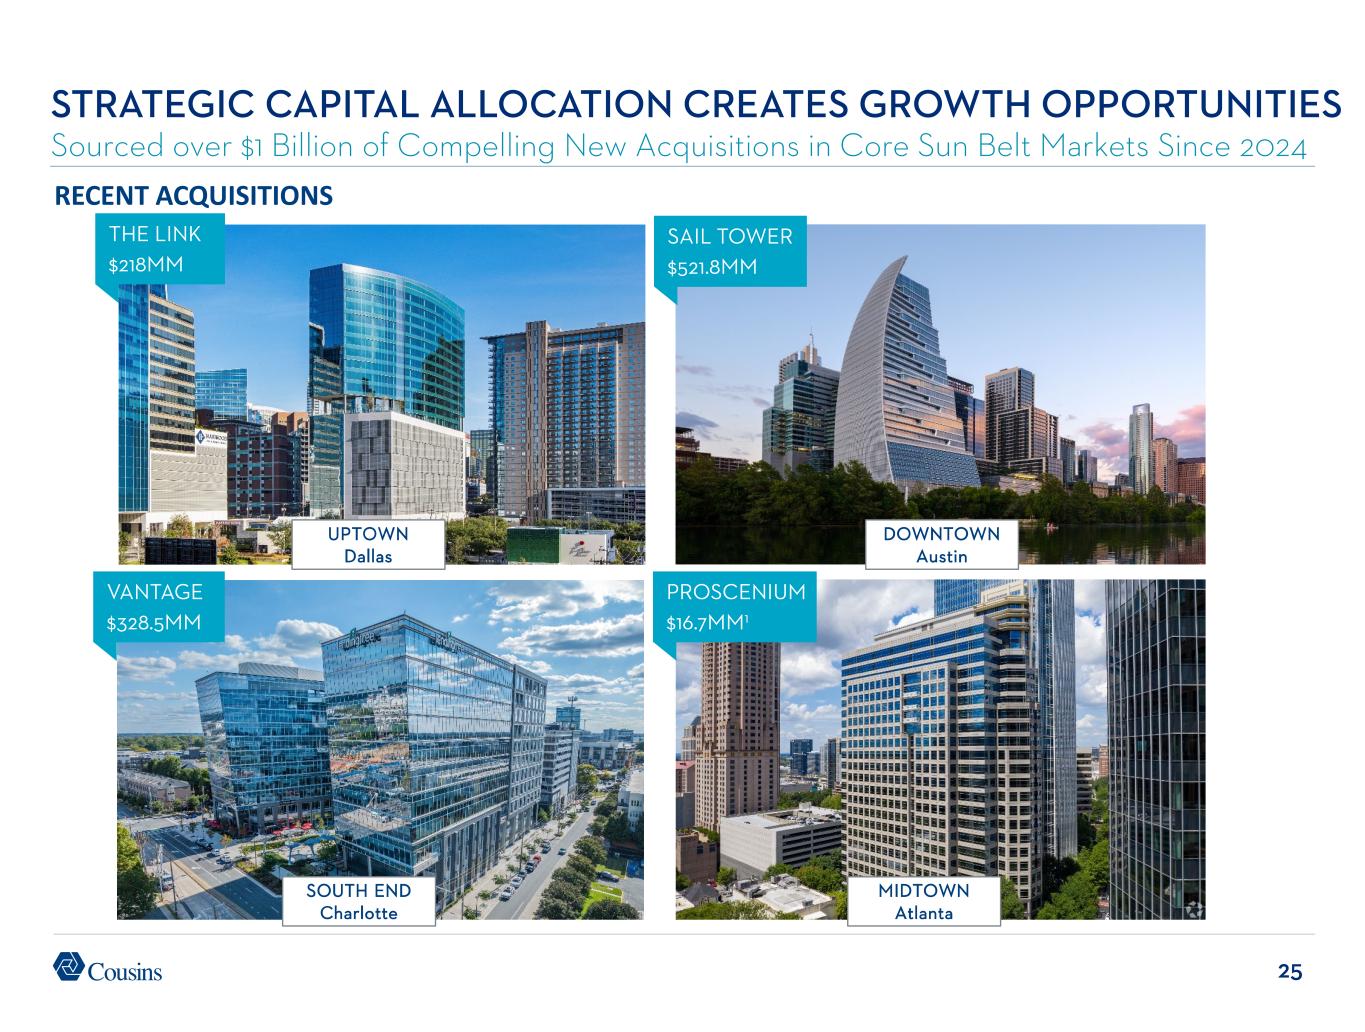
25 STRATEGIC CAPITAL ALLOCATION CREATES GROWTH OPPORTUNITIES Sourced over $1 Billion of Compelling New Acquisitions in Core Sun Belt Markets Since 2024 RECENT ACQUISITIONS MIDTOWN Atlanta PROSCENIUM $16.7MM1 SOUTH END Charlotte VANTAGE $328.5MM UPTOWN Dallas THE LINK $218MM DOWNTOWN Austin SAIL TOWER $521.8MM
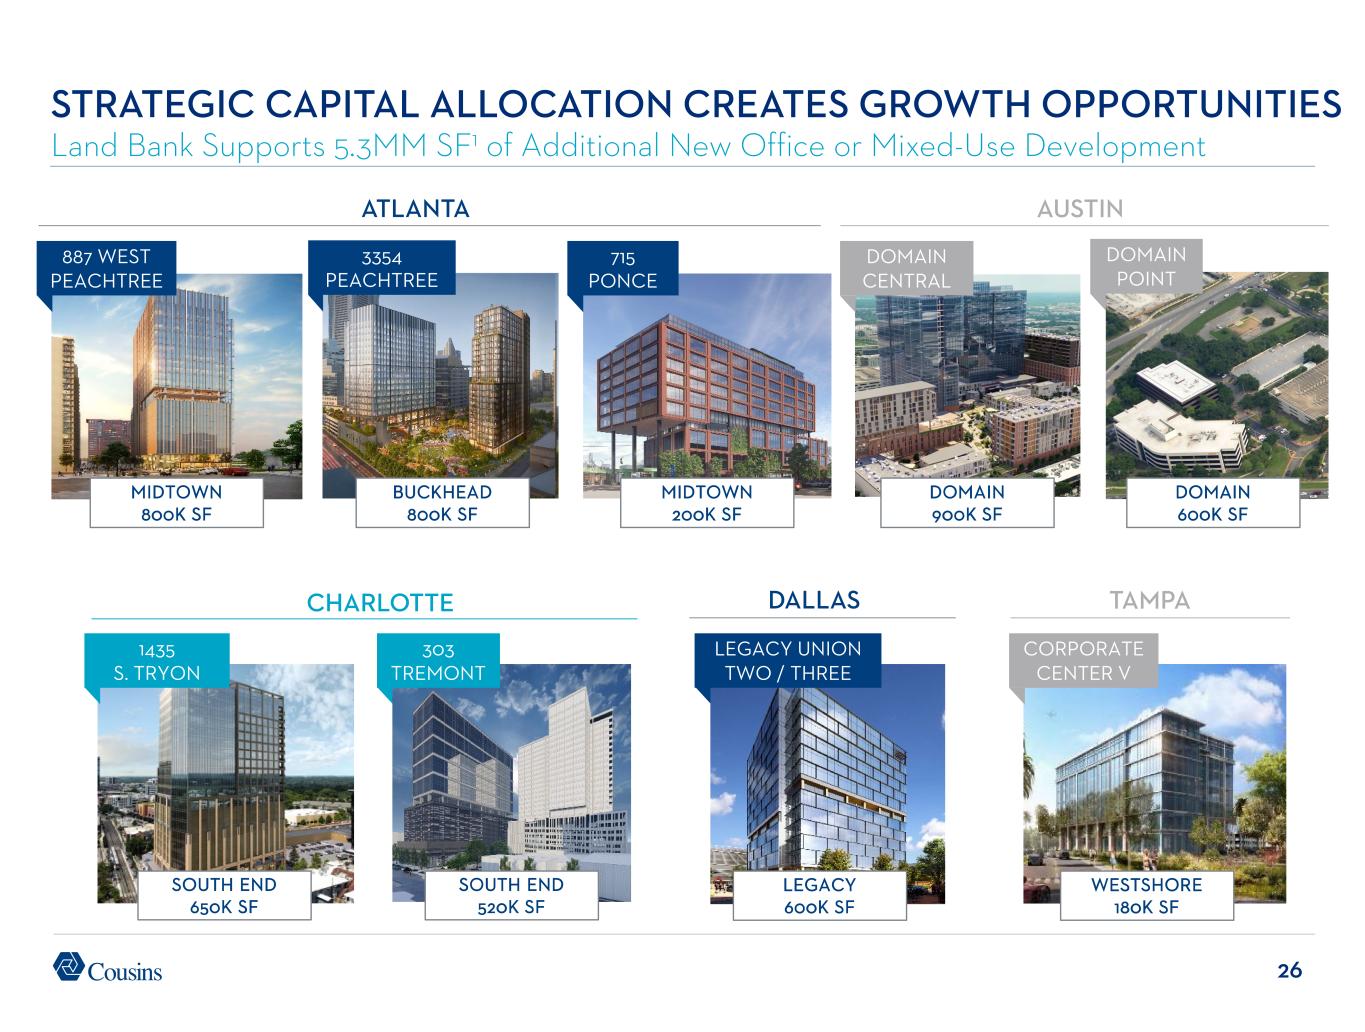
26 DOMAIN POINT LEGACY UNION TWO / THREE LEGACY 600K SF DALLAS MIDTOWN 800K SF 887 WEST PEACHTREE 3354 PEACHTREE ATLANTA AUSTIN 715 PONCE MIDTOWN 200K SF DOMAIN 900K SF TAMPA CORPORATE CENTER V WESTSHORE 180K SF DOMAIN CENTRAL CHARLOTTE 303 TREMONT 1435 S. TRYON SOUTH END 650K SF SOUTH END 520K SF STRATEGIC CAPITAL ALLOCATION CREATES GROWTH OPPORTUNITIES Land Bank Supports 5.3MM SF1 of Additional New Office or Mixed-Use Development BUCKHEAD 800K SF DOMAIN 600K SF
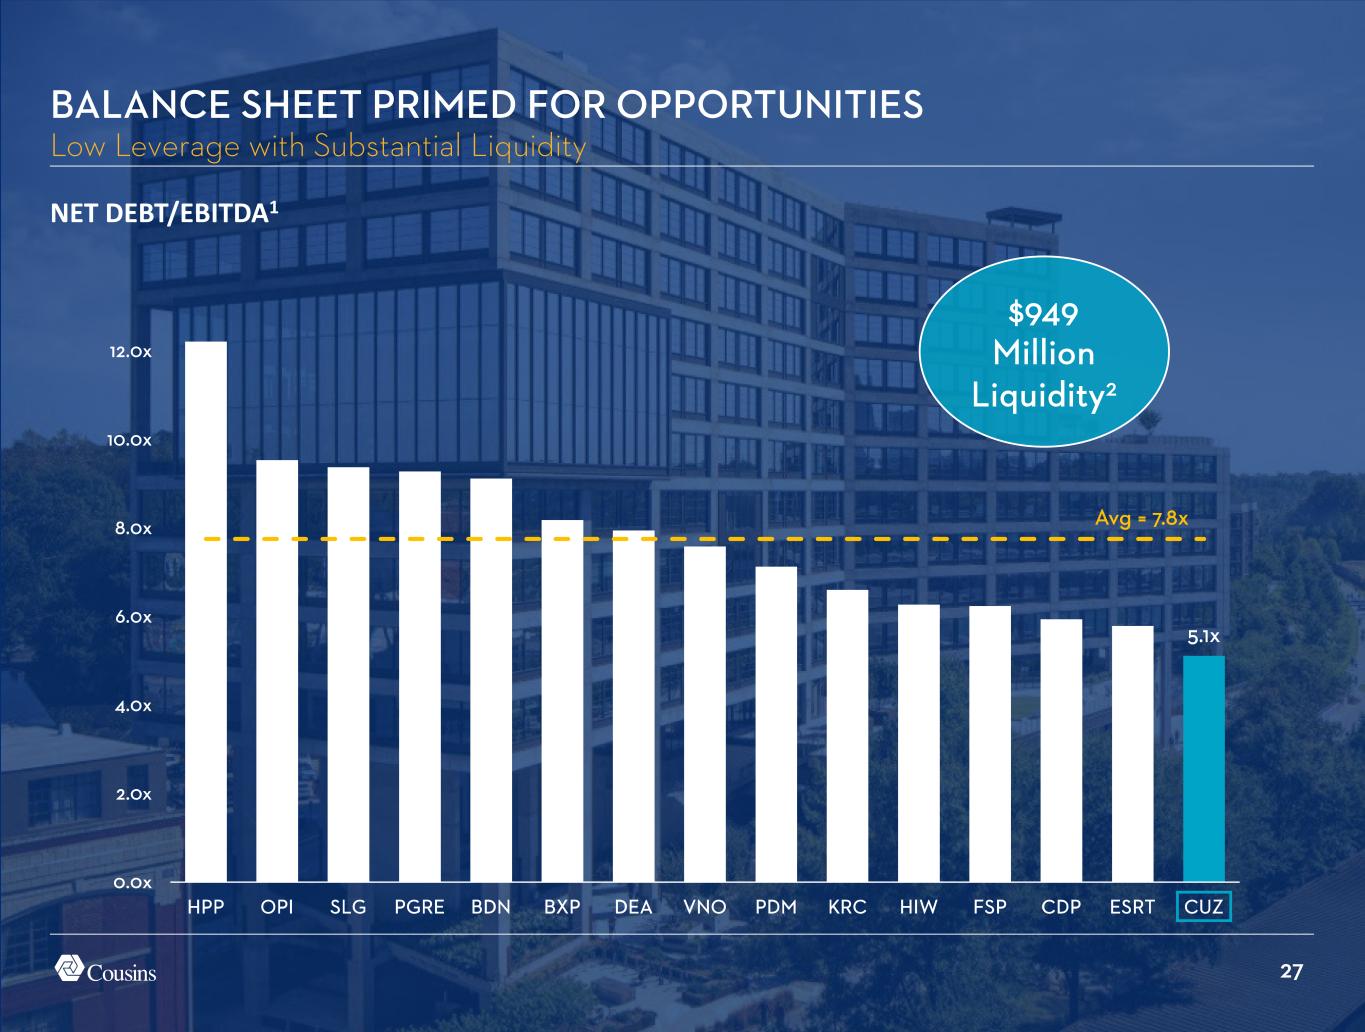
27 5.1x 0.0x 2.0x 4.0x 6.0x 8.0x 10.0x 12.0x HPP OPI SLG PGRE BDN BXP DEA VNO PDM KRC HIW FSP CDP ESRT CUZ NET DEBT/EBITDA1 $949 Million Liquidity2 BALANCE SHEET PRIMED FOR OPPORTUNITIES Low Leverage with Substantial Liquidity Avg = 7.8x
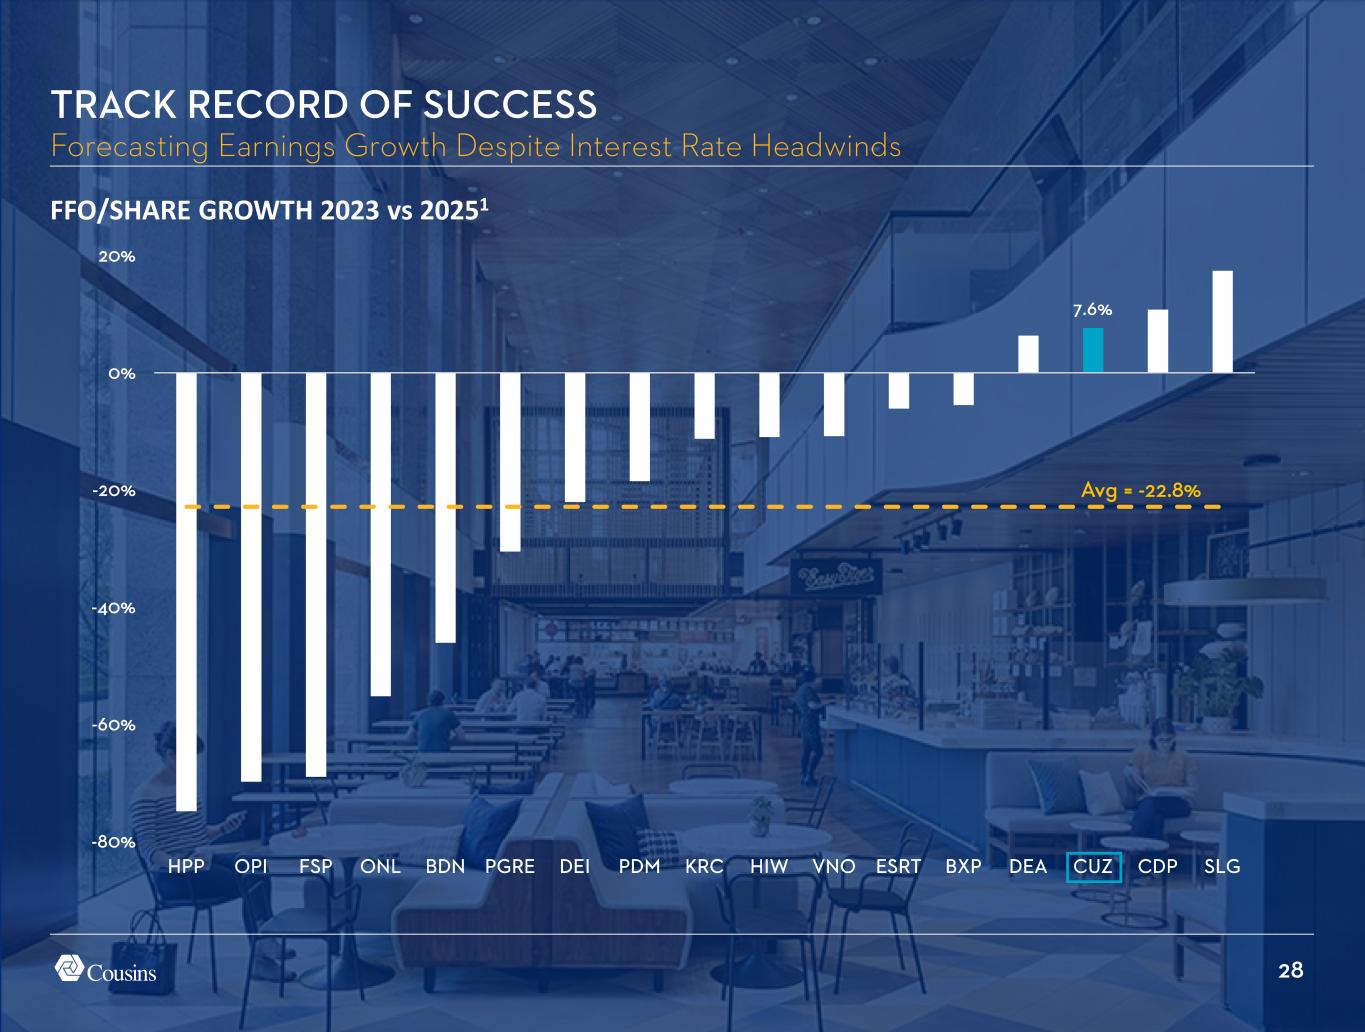
28 7.6% -80% -60% -40% -20% 0% 20% HPP OPI FSP ONL BDN PGRE DEI PDM KRC HIW VNO ESRT BXP DEA CUZ CDP SLG FFO/SHARE GROWTH 2023 vs 20251 TRACK RECORD OF SUCCESS Forecasting Earnings Growth Despite Interest Rate Headwinds Avg = -22.8%
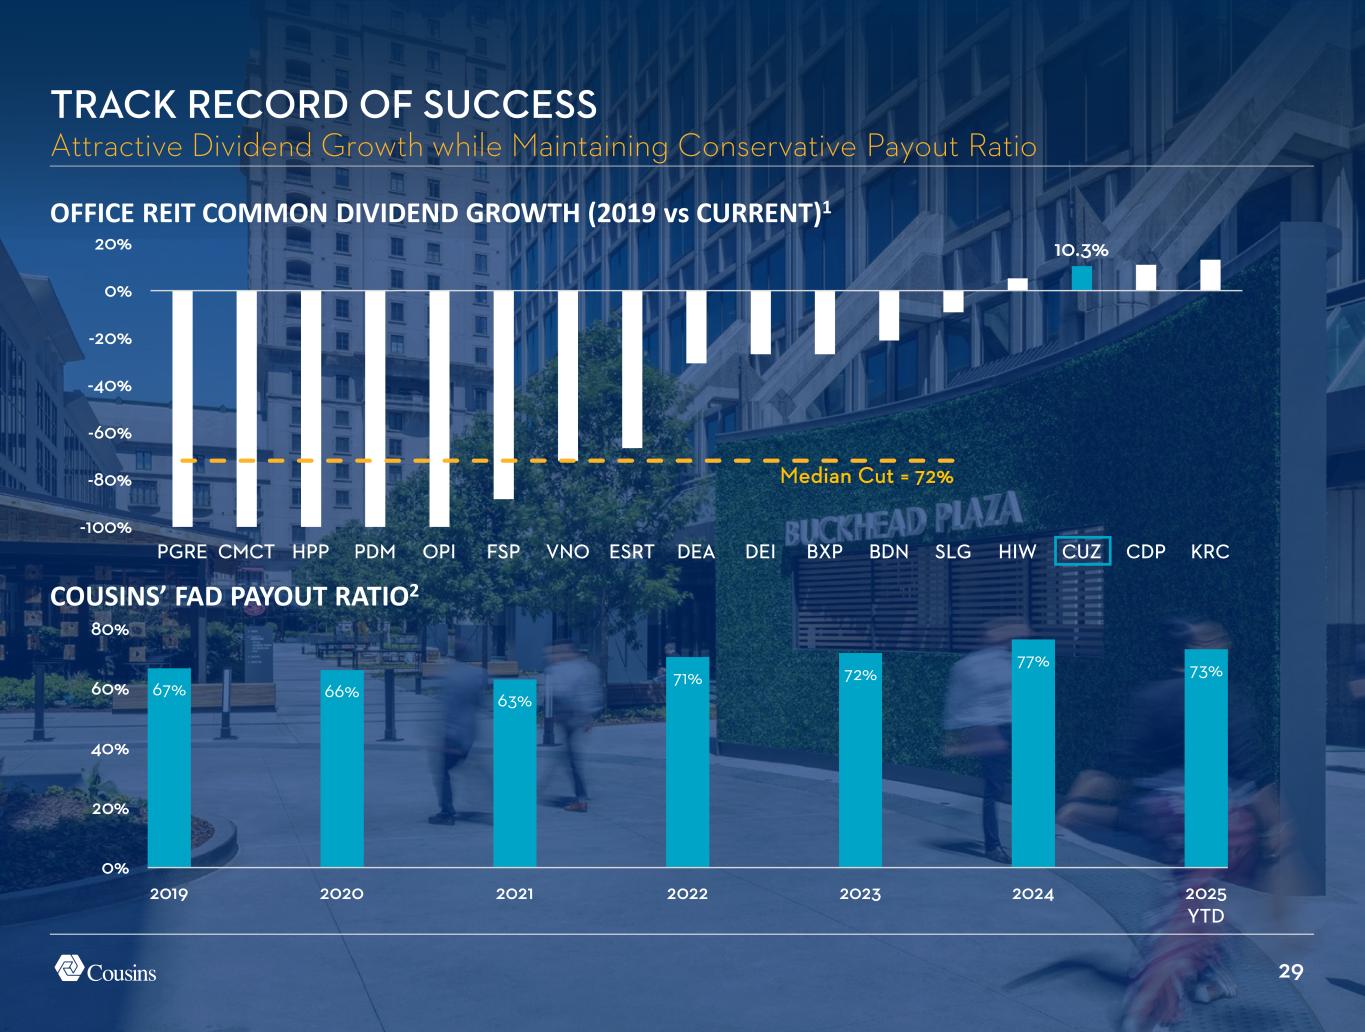
29 10.3% -100% -80% -60% -40% -20% 0% 20% PGRE CMCT HPP PDM OPI FSP VNO ESRT DEA DEI BXP BDN SLG HIW CUZ CDP KRC 67% 66% 63% 71% 72% 77% 73% 0% 20% 40% 60% 80% 2019 2020 2021 2022 2023 2024 2025 YTD TRACK RECORD OF SUCCESS Attractive Dividend Growth while Maintaining Conservative Payout Ratio OFFICE REIT COMMON DIVIDEND GROWTH (2019 vs CURRENT)1 COUSINS’ FAD PAYOUT RATIO2 Median Cut = 72%
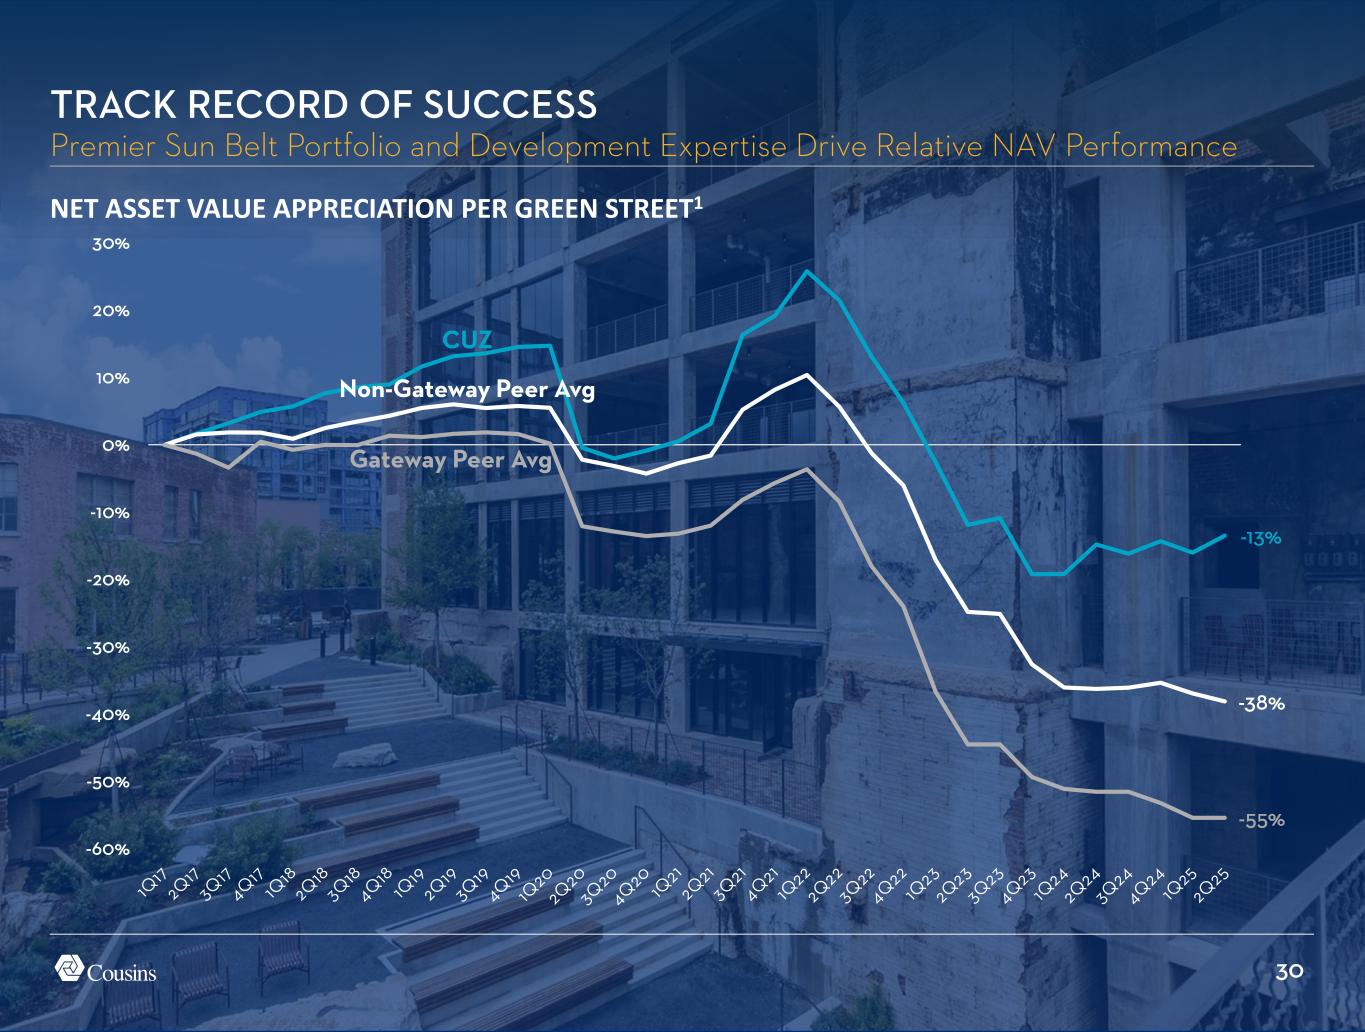
30 -13% -38% -55% -60% -50% -40% -30% -20% -10% 0% 10% 20% 30% NET ASSET VALUE APPRECIATION PER GREEN STREET1 TRACK RECORD OF SUCCESS Premier Sun Belt Portfolio and Development Expertise Drive Relative NAV Performance CUZ Non-Gateway Peer Avg Gateway Peer Avg
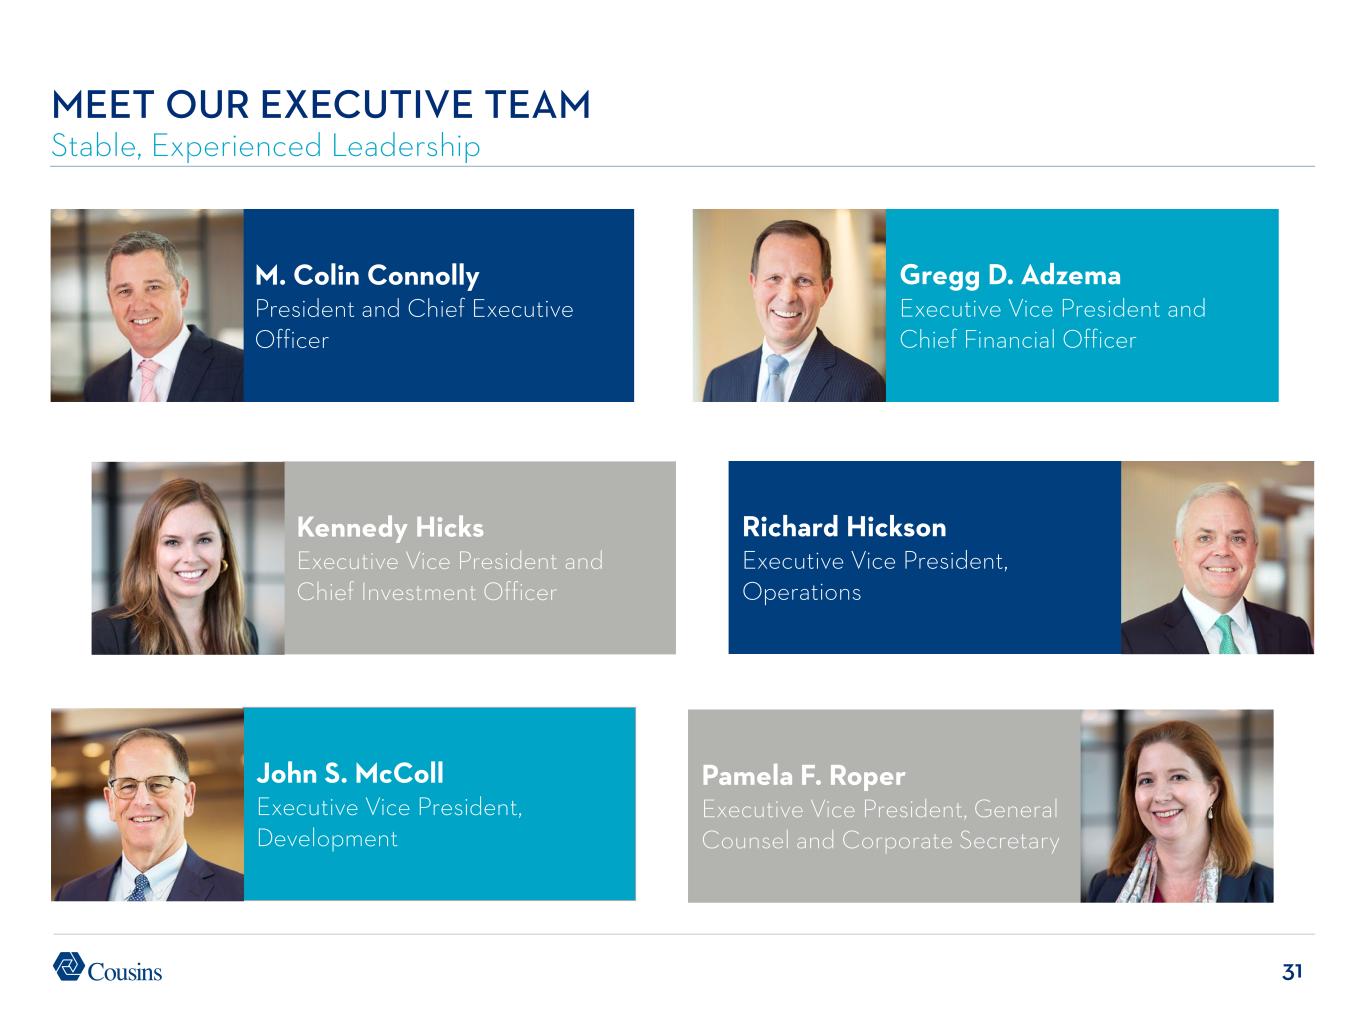
31 Pamela F. Roper Executive Vice President, General Counsel and Corporate Secretary M. Colin Connolly President and Chief Executive Officer John S. McColl Executive Vice President, Development Gregg D. Adzema Executive Vice President and Chief Financial Officer Richard Hickson Executive Vice President, Operations Kennedy Hicks Executive Vice President and Chief Investment Officer MEET OUR EXECUTIVE TEAM Stable, Experienced Leadership
APPENDIX
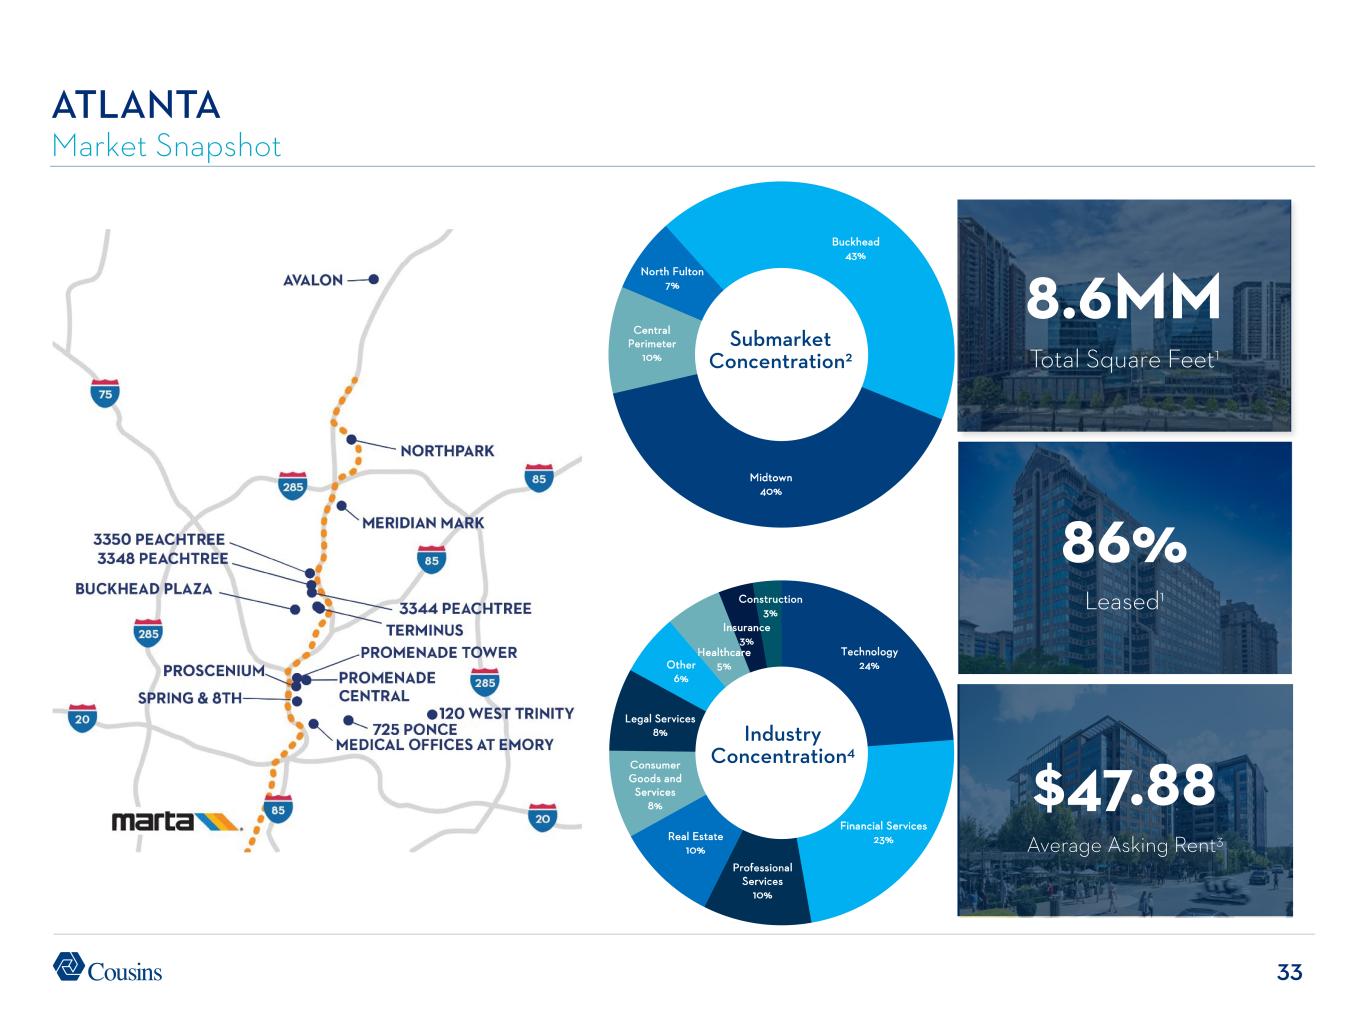
33 Submarket Concentration2 Industry Concentration4 ATLANTA Market Snapshot 8.6MM Total Square Feet1 86% Leased1 $47.88 Average Asking Rent3 Buckhead 43% Midtown 40% Central Perimeter 10% North Fulton 7% Technology 24% Financial Services 23% Professional Services 10% Real Estate 10% Consumer Goods and Services 8% Legal Services 8% Other 6% Healthcare 5% Insurance 3% Construction 3%
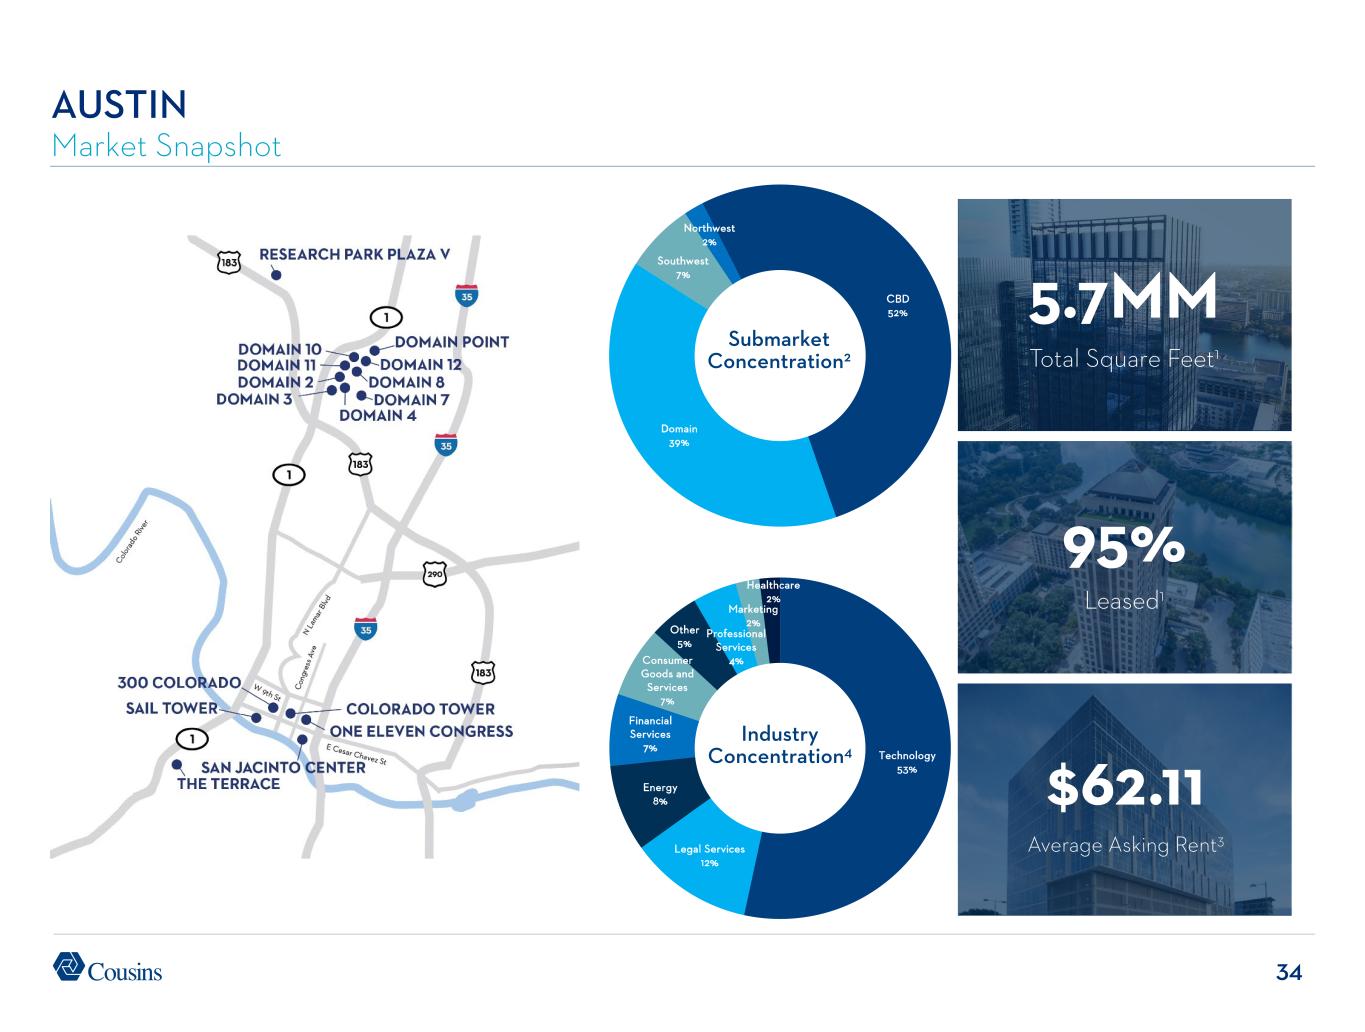
34 AUSTIN Market Snapshot 5.7MM Total Square Feet1 95% Leased1 $62.11 Average Asking Rent3 Industry Concentration4 Submarket Concentration2 Technology 53% Legal Services 12% Energy 8% Financial Services 7% Consumer Goods and Services 7% Other 5% Professional Services 4% Marketing 2% Healthcare 2% CBD 52% Domain 39% Southwest 7% Northwest 2%
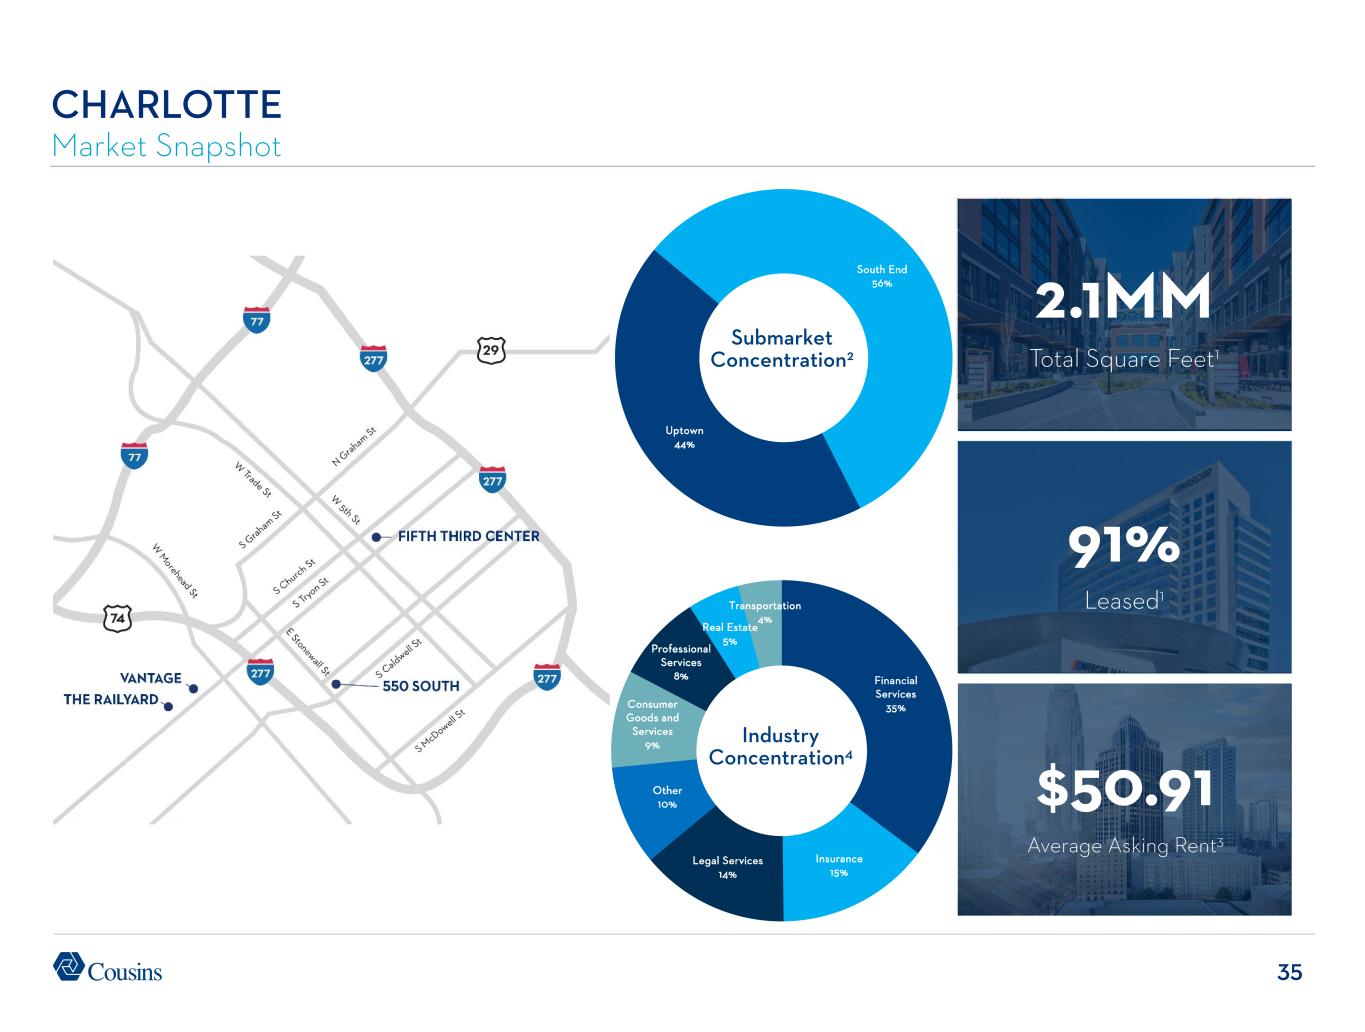
35 CHARLOTTE Market Snapshot 2.1MM Total Square Feet1 91% Leased1 Submarket Concentration2 Industry Concentration4 $50.91 Average Asking Rent3 Financial Services 35% Insurance 15% Legal Services 14% Other 10% Consumer Goods and Services 9% Professional Services 8% Real Estate 5% Transportation 4% Uptown 44% South End 56%
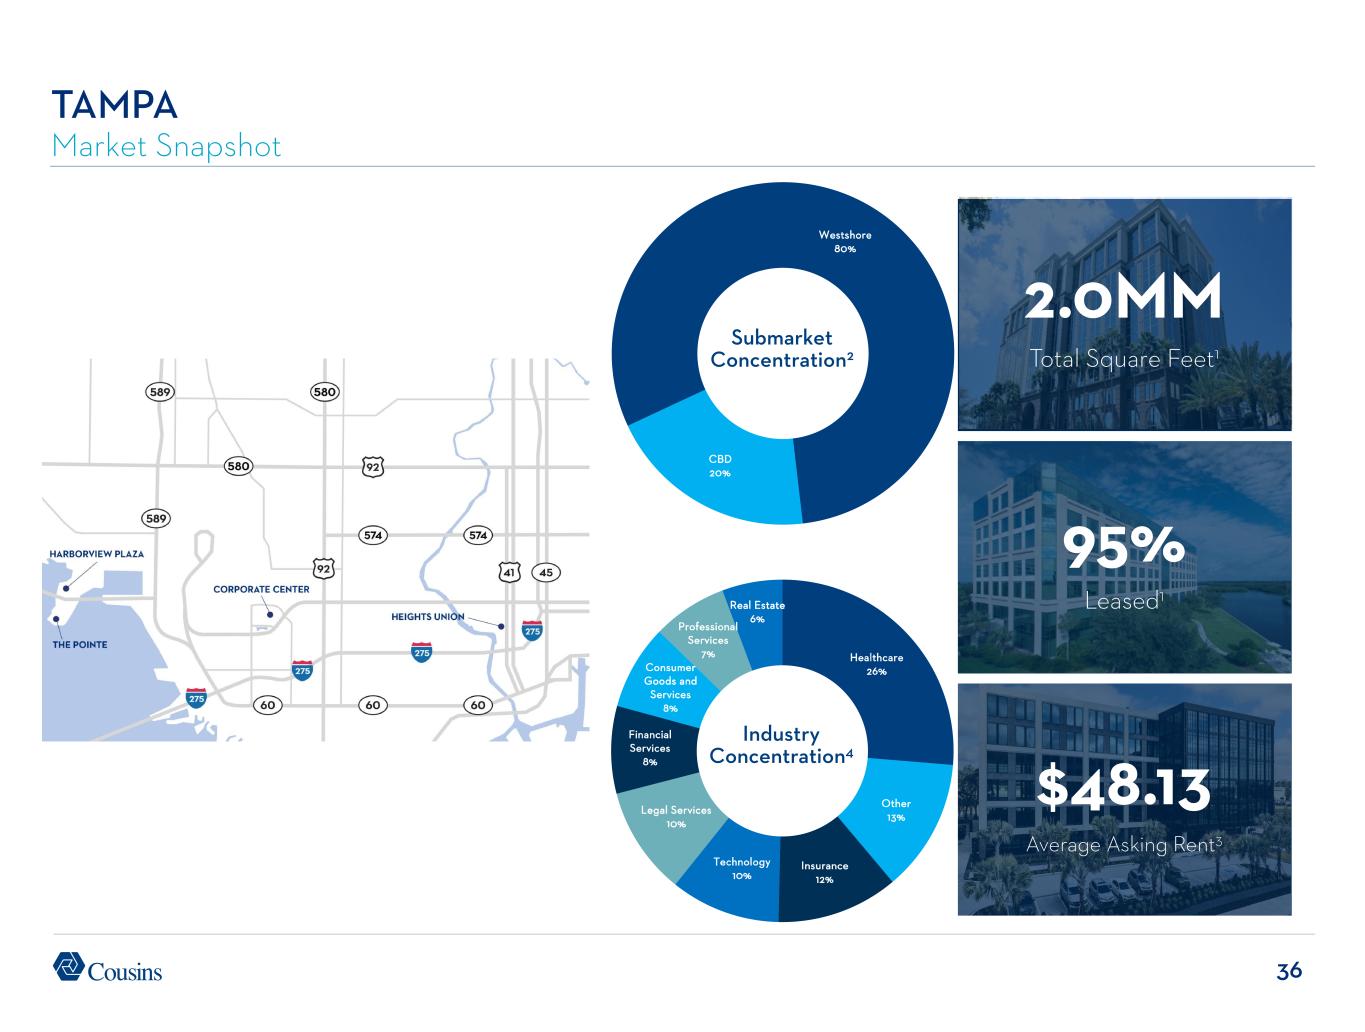
36 95% Leased1 2.0MM Total Square Feet1 $48.13 Average Asking Rent3 TAMPA Market Snapshot Submarket Concentration2 Industry Concentration4 Westshore 80% CBD 20% Healthcare 26% Other 13% Insurance 12% Technology 10% Legal Services 10% Financial Services 8% Consumer Goods and Services 8% Professional Services 7% Real Estate 6%
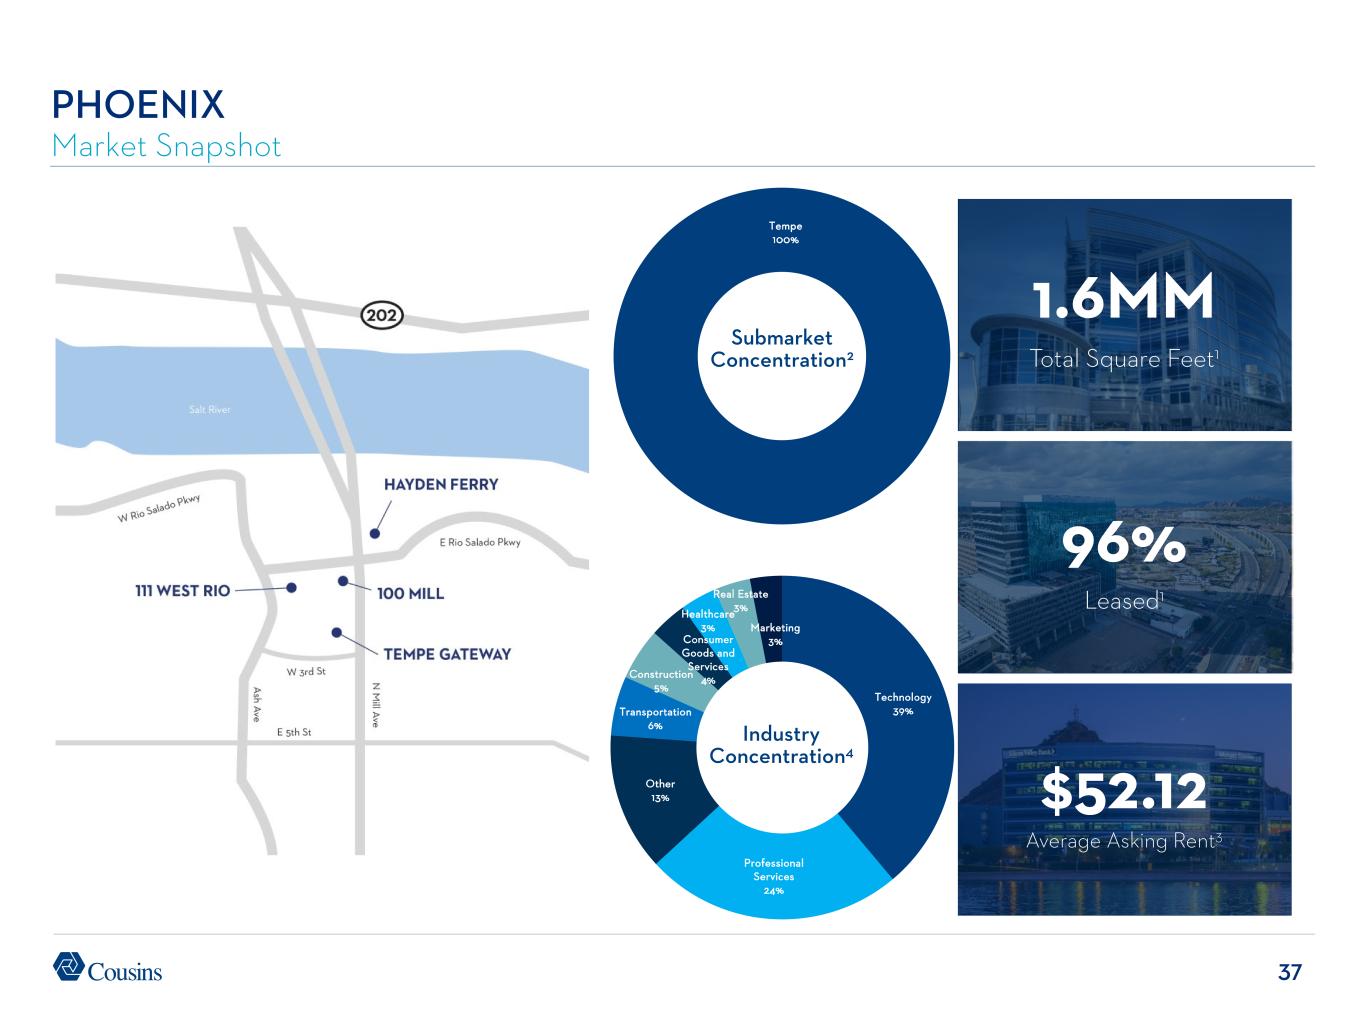
37 Tempe 100% PHOENIX Market Snapshot 96% Leased1 1.6MM Total Square Feet1 Submarket Concentration2 Industry Concentration4 $52.12 Average Asking Rent3 Technology 39% Professional Services 24% Other 13% Transportation 6% Construction 5% Consumer Goods and Services 4% Healthcare 3% Real Estate 3% Marketing 3%
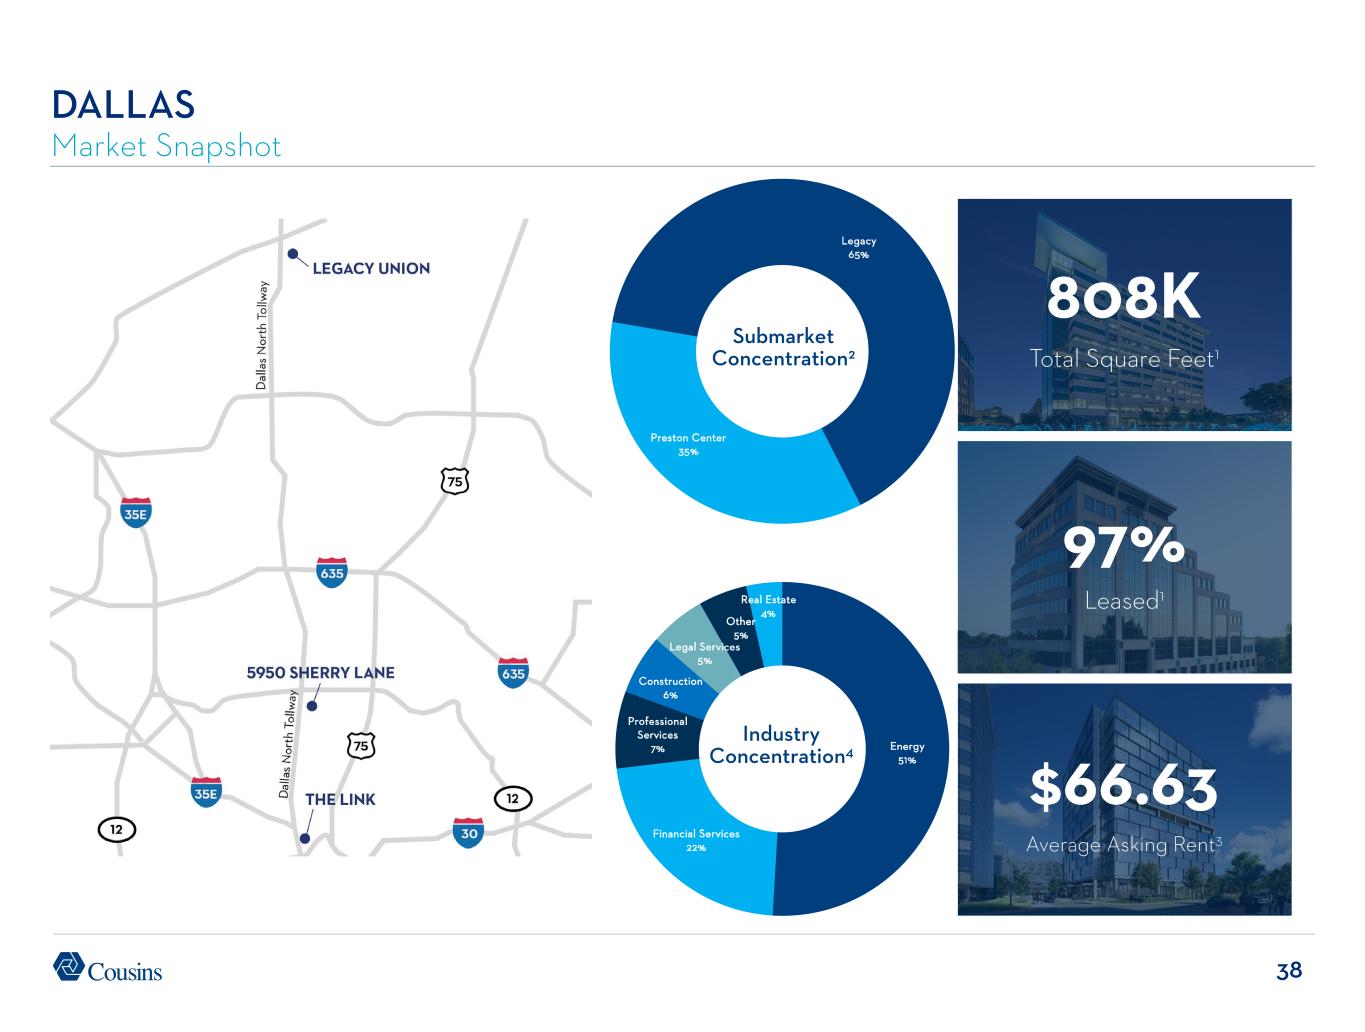
38 DALLAS Market Snapshot 97% Leased1 808K Total Square Feet1 $66.63 Average Asking Rent3 Submarket Concentration2 Industry Concentration4 Energy 51% Financial Services 22% Professional Services 7% Construction 6% Legal Services 5% Other 5% Real Estate 4% Preston Center 35% Legacy 65%
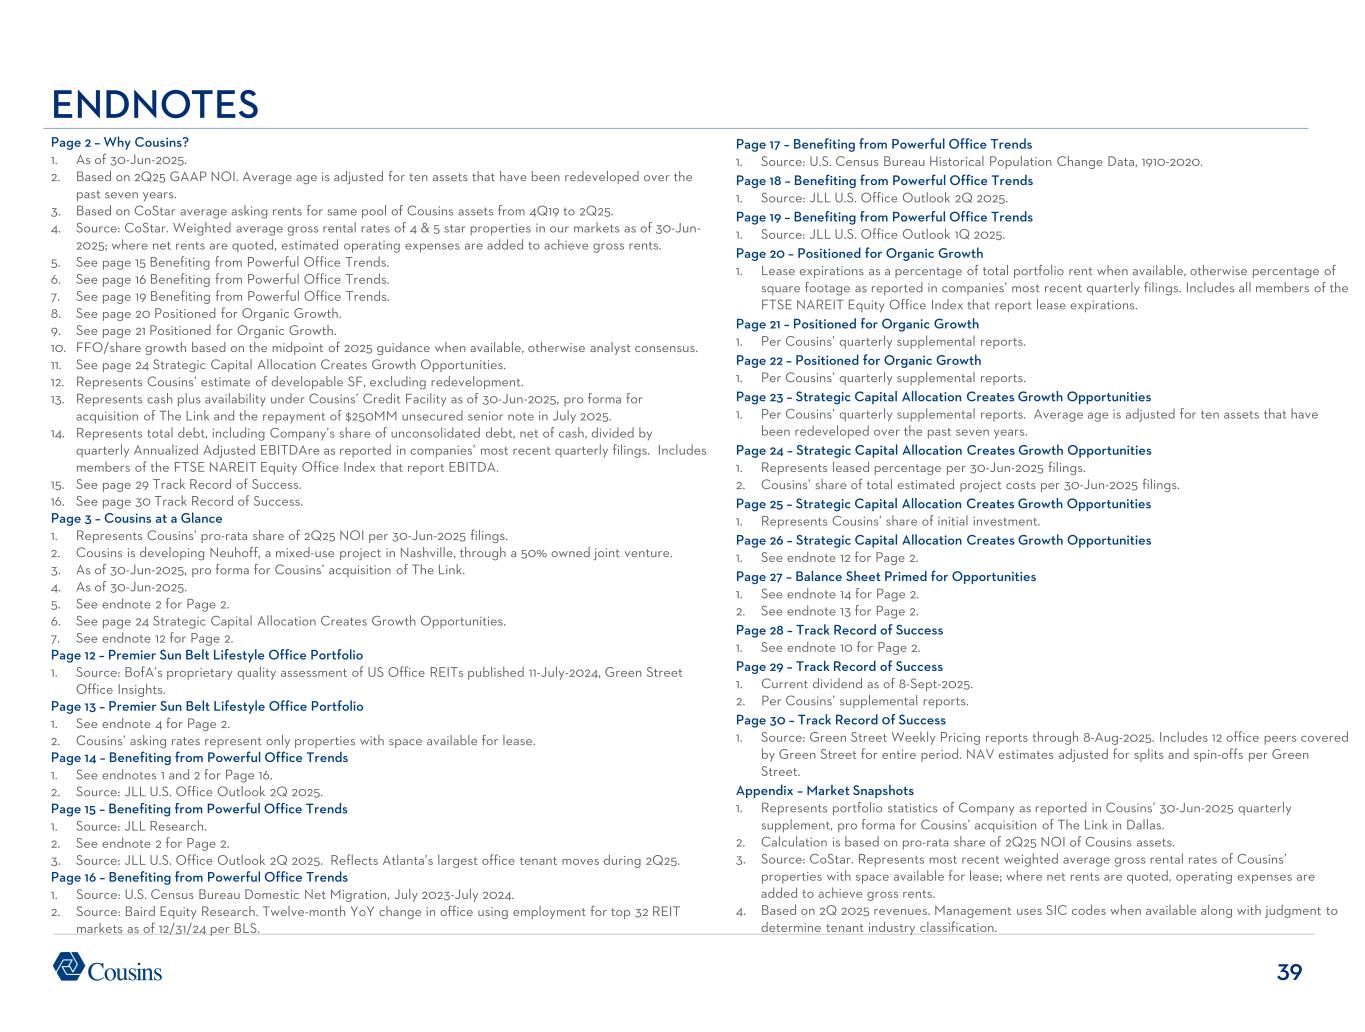
39 Page 17 – Benefiting from Powerful Office Trends 1. Source: U.S. Census Bureau Historical Population Change Data, 1910-2020. Page 18 – Benefiting from Powerful Office Trends 1. Source: JLL U.S. Office Outlook 2Q 2025. Page 19 – Benefiting from Powerful Office Trends 1. Source: JLL U.S. Office Outlook 1Q 2025. Page 20 – Positioned for Organic Growth 1. Lease expirations as a percentage of total portfolio rent when available, otherwise percentage of square footage as reported in companies’ most recent quarterly filings. Includes all members of the FTSE NAREIT Equity Office Index that report lease expirations. Page 21 – Positioned for Organic Growth 1. Per Cousins’ quarterly supplemental reports. Page 22 – Positioned for Organic Growth 1. Per Cousins’ quarterly supplemental reports. Page 23 – Strategic Capital Allocation Creates Growth Opportunities 1. Per Cousins’ quarterly supplemental reports. Average age is adjusted for ten assets that have been redeveloped over the past seven years. Page 24 – Strategic Capital Allocation Creates Growth Opportunities 1. Represents leased percentage per 30-Jun-2025 filings. 2. Cousins’ share of total estimated project costs per 30-Jun-2025 filings. Page 25 – Strategic Capital Allocation Creates Growth Opportunities 1. Represents Cousins’ share of initial investment. Page 26 – Strategic Capital Allocation Creates Growth Opportunities 1. See endnote 12 for Page 2. Page 27 – Balance Sheet Primed for Opportunities 1. See endnote 14 for Page 2. 2. See endnote 13 for Page 2. Page 28 – Track Record of Success 1. See endnote 10 for Page 2. Page 29 – Track Record of Success 1. Current dividend as of 8-Sept-2025. 2. Per Cousins’ supplemental reports. Page 30 – Track Record 0f Success 1. Source: Green Street Weekly Pricing reports through 8-Aug-2025. Includes 12 office peers covered by Green Street for entire period. NAV estimates adjusted for splits and spin-offs per Green Street. Appendix – Market Snapshots 1. Represents portfolio statistics of Company as reported in Cousins’ 30-Jun-2025 quarterly supplement, pro forma for Cousins’ acquisition of The Link in Dallas. 2. Calculation is based on pro-rata share of 2Q25 NOI of Cousins assets. 3. Source: CoStar. Represents most recent weighted average gross rental rates of Cousins’ properties with space available for lease; where net rents are quoted, operating expenses are added to achieve gross rents. 4. Based on 2Q 2025 revenues. Management uses SIC codes when available along with judgment to determine tenant industry classification. Page 2 – Why Cousins? 1. As of 30-Jun-2025. 2. Based on 2Q25 GAAP NOI. Average age is adjusted for ten assets that have been redeveloped over the past seven years. 3. Based on CoStar average asking rents for same pool of Cousins assets from 4Q19 to 2Q25. 4. Source: CoStar. Weighted average gross rental rates of 4 & 5 star properties in our markets as of 30-Jun- 2025; where net rents are quoted, estimated operating expenses are added to achieve gross rents. 5. See page 15 Benefiting from Powerful Office Trends. 6. See page 16 Benefiting from Powerful Office Trends. 7. See page 19 Benefiting from Powerful Office Trends. 8. See page 20 Positioned for Organic Growth. 9. See page 21 Positioned for Organic Growth. 10. FFO/share growth based on the midpoint of 2025 guidance when available, otherwise analyst consensus. 11. See page 24 Strategic Capital Allocation Creates Growth Opportunities. 12. Represents Cousins’ estimate of developable SF, excluding redevelopment. 13. Represents cash plus availability under Cousins’ Credit Facility as of 30-Jun-2025, pro forma for acquisition of The Link and the repayment of $250MM unsecured senior note in July 2025. 14. Represents total debt, including Company’s share of unconsolidated debt, net of cash, divided by quarterly Annualized Adjusted EBITDAre as reported in companies’ most recent quarterly filings. Includes members of the FTSE NAREIT Equity Office Index that report EBITDA. 15. See page 29 Track Record of Success. 16. See page 30 Track Record of Success. Page 3 – Cousins at a Glance 1. Represents Cousins’ pro-rata share of 2Q25 NOI per 30-Jun-2025 filings. 2. Cousins is developing Neuhoff, a mixed-use project in Nashville, through a 50% owned joint venture. 3. As of 30-Jun-2025, pro forma for Cousins’ acquisition of The Link. 4. As of 30-Jun-2025. 5. See endnote 2 for Page 2. 6. See page 24 Strategic Capital Allocation Creates Growth Opportunities. 7. See endnote 12 for Page 2. Page 12 – Premier Sun Belt Lifestyle Office Portfolio 1. Source: BofA’s proprietary quality assessment of US Office REITs published 11-July-2024, Green Street Office Insights. Page 13 – Premier Sun Belt Lifestyle Office Portfolio 1. See endnote 4 for Page 2. 2. Cousins’ asking rates represent only properties with space available for lease. Page 14 – Benefiting from Powerful Office Trends 1. See endnotes 1 and 2 for Page 16. 2. Source: JLL U.S. Office Outlook 2Q 2025. Page 15 – Benefiting from Powerful Office Trends 1. Source: JLL Research. 2. See endnote 2 for Page 2. 3. Source: JLL U.S. Office Outlook 2Q 2025. Reflects Atlanta’s largest office tenant moves during 2Q25. Page 16 – Benefiting from Powerful Office Trends 1. Source: U.S. Census Bureau Domestic Net Migration, July 2023-July 2024. 2. Source: Baird Equity Research. Twelve-month YoY change in office using employment for top 32 REIT markets as of 12/31/24 per BLS. ENDNOTES
40 CAUTIONARY STATEMENT REGARDING FORWARD-LOOKING INFORMATION Certain matters contained in this report are “forward-looking statements” within the meaning of the federal securities laws and are subject to uncertainties and risks, as itemized herein. These forward-looking statements include information about possible or assumed future results of the business and our financial condition, liquidity, results of operations, plans, and objectives. Examples of forward-looking statements in this earnings release and supplemental information include the Company’s guidance and underlying assumptions; projected capital expenditures; industry trends; future occupancy or volume and velocity of leasing activity; and entry into new markets. Any forward-looking statements are based upon management's beliefs, assumptions, and expectations of our future performance, taking into account information that is currently available. These beliefs, assumptions, and expectations may change as a result of possible events or factors, not all of which are known. If a change occurs, our business, financial condition, liquidity, and results of operations may vary materially from those expressed in forward-looking statements. Actual results may vary from forward-looking statements due to, but not limited to, the following: the risks and uncertainties related to the impact of changes in general economic and capital market conditions (on an international or national basis or within the markets in which we operate), including changes in inflation, changes in interest rates, supply chain disruptions, labor market disruptions (including changes in unemployment), dislocation and volatility in capital markets, and potential longer-term changes in consumer and customer behavior resulting from the severity and duration of any downturn, adverse conditions or uncertainty in the U.S. or global economy; risks affecting the real estate industry (including, without limitation, the inability to enter into or renew leases on favorable terms (and on anticipated schedules)); any adverse change in the financial condition or liquidity of one or more of our tenants or borrowers under our real estate debt investments; changes in customer preferences regarding space utilization; changes in customers’ financial condition; the availability, cost, and adequacy of insurance coverage; competition from other developers, investors, owners, and operators of real estate; the failure to achieve anticipated benefits from intended or completed acquisitions, developments, investments, or dispositions; the cost and availability of financing, the effectiveness of any interest rate hedging contracts, and any failure to comply with debt covenants under credit agreements; the effect of common stock, debt, or operating partnership unit issuances; threatened terrorist attacks or sociopolitical unrest such as political instability, civil unrest, armed hostilities, or political activism and the potential impact of the same upon our day-to-day building operations; the immediate and long-term impact of the outbreak of a highly infectious or contagious disease on our and our customers’ financial condition; risks associated with security breaches through cyberattacks, cyber intrusions, or otherwise; changes in senior management, the Board of Directors, or key personnel; the potential liability for existing or future environmental or other applicable regulatory requirements, including the requirements to qualify for taxation as a real estate investment trust; the financial condition and liquidity of, or disputes with, joint venture partners; material changes in dividend rates on common shares or other securities or the ability to pay those dividends; the impact of changes to applicable laws, including the tax laws impacting REITs and the passage of the One Big Beautiful Bill Act, and the impact of newly adopted accounting principles on our accounting policies and on period to period comparison of financial results; risks associated with climate change and severe weather events; and those additional risks and factors discussed in reports filed with the Securities and Exchange Commission ("SEC") by the Company. These forward-looking statements are not exhaustive, speak only as of the date of issuance of this report and are not guarantees of future results, performance, or achievements. Additional risk factors that could adversely affect our business and financial performance can be found in Part 1, Item 1A. Risk Factors, of our Annual Report on Form 10-K, and the Quarterly Report on Form 10-Q for the quarter ended March 31, 2025, including Part II, Item 1A. Risk Factors, and are specifically incorporated by reference herein. The Company does not undertake a duty to update or revise any forward-looking statement, whether as a result of new information, future events, or other matters, except as otherwise required by law.
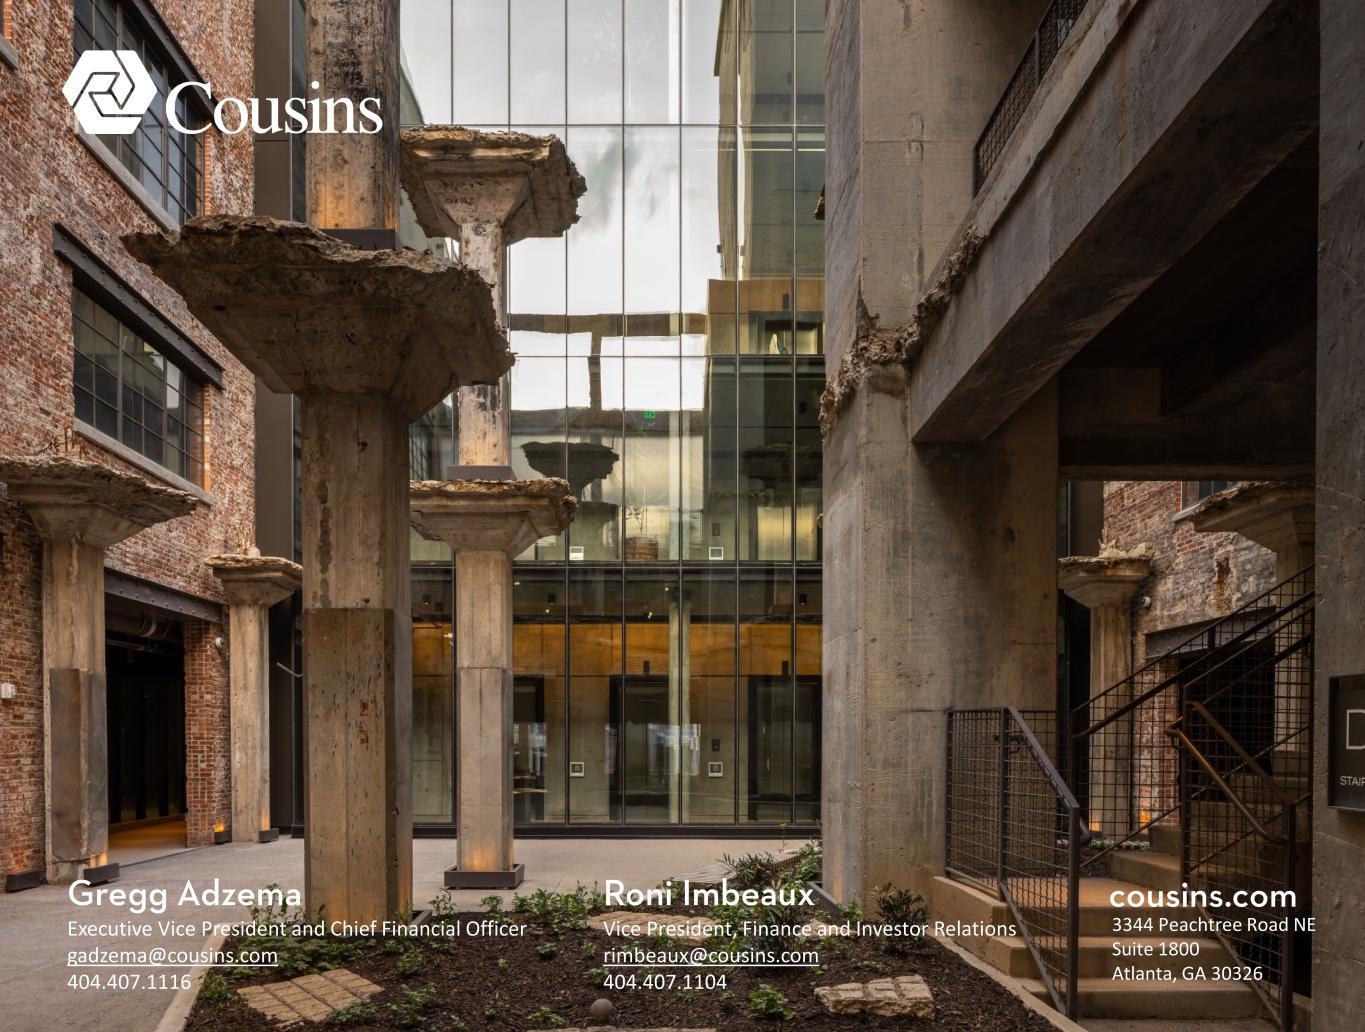
3344 Peachtree Road NE Suite 1800 Atlanta, GA 30326 cousins.comGregg Adzema Executive Vice President and Chief Financial Officer gadzema@cousins.com 404.407.1116 Roni Imbeaux Vice President, Finance and Investor Relations rimbeaux@cousins.com 404.407.1104
