Cousins Properties | 1 | Q1 2026 Supplemental Information |
TABLE OF CONTENTS | ||
Forward-Looking Statements | |
Key Performance Metrics | |
Portfolio Statistics | |
Same Property Performance | |
Office Leasing Activity | |
Top 20 Office Tenants | |
Debt Schedule | |
Pictured Above: 300 Colorado, Austin, TX
Pictured on Cover: 300 South Tryon, Charlotte, NC
Cousins Properties | 2 | Q1 2026 Supplemental Information |
FORWARD-LOOKING STATEMENTS | ||
Certain matters contained in this report are “forward-looking statements” within the meaning of the federal securities laws and are subject to
uncertainties and risks, as itemized herein. These forward-looking statements include information about possible or assumed future results of the
business and our financial condition, liquidity, results of operations, plans, expectations, and objectives. Examples of forward-looking statements in
this earnings release and supplemental information include the Company’s guidance and underlying assumptions; projected capital expenditures;
industry trends; future occupancy or volume and velocity of leasing activity; and entry into new markets.
Any forward-looking statements are based upon management's beliefs, assumptions, and expectations of our future performance, taking into
account information that is currently available. These beliefs, assumptions, and expectations may change as a result of possible events or factors, not
all of which are known. If a change occurs, our business, financial condition, liquidity, and results of operations may vary materially from those
expressed in forward-looking statements. Actual results may vary from forward-looking statements due to, but not limited to, the following: the risks
and uncertainties related to the impact of changes in general economic and capital market conditions (on an international or national basis or within
the markets in which we operate), including changes in inflation, changes in interest rates, supply chain disruptions, labor market disruptions (including
changes in unemployment), dislocation and volatility in capital markets, and potential longer-term changes in consumer and customer behavior
resulting from the severity and duration of any downturn, adverse conditions or uncertainty in the U.S. or global economy; risks affecting the real
estate industry (including, without limitation, the inability to enter into or renew leases on favorable terms and on anticipated schedules); any adverse
change in the financial condition or liquidity of one or more of our tenants or borrowers under our real estate debt investments; changes in customer
preferences regarding space utilization; changes in customers’ financial condition; the availability, cost, and adequacy of insurance coverage;
competition from other developers, investors, owners, and operators of real estate; the failure to achieve anticipated benefits from intended or
completed acquisitions, developments, investments, or dispositions; the cost and availability of financing, the effectiveness of any interest rate
hedging contracts, and any failure to comply with debt covenants under credit agreements; the effect of common stock, debt, or operating
partnership unit issuances; threatened terrorist attacks or sociopolitical unrest such as political instability, civil unrest, armed hostilities, or political
activism and the potential impact of the same upon our day-to-day building operations; the immediate and long-term impact of the outbreak of a
highly infectious or contagious disease on our and our customers’ financial condition; risks associated with security breaches through cyberattacks,
cyber intrusions, or otherwise; risks associated with the adoption and usage of artificial intelligence; changes in senior management, the Board of
Directors, or key personnel; the potential liability for existing or future environmental or other applicable regulatory requirements, including the
requirements to qualify for taxation as a real estate investment trust; the financial condition and liquidity of, or disputes with, joint venture partners;
material changes in dividend rates on common shares or other securities or the ability to pay those dividends; the impact of changes to applicable
laws, including the tax laws impacting REITs and the passage of the One Big Beautiful Bill Act, and the impact of newly adopted accounting principles
on our accounting policies and on period to period comparison of financial results; risks associated with climate change and severe weather events;
and those additional risks and factors discussed in reports filed with the Securities and Exchange Commission ("SEC") by the Company.
These forward-looking statements are not exhaustive, speak only as of the date of issuance of this report and are not guarantees of future
results, performance, or achievements. Additional risk factors that could adversely affect our business and financial performance can be found in Part
1, Item 1A. Risk Factors, of our Annual Report on Form 10-K for the year ended December 31, 2025, and are specifically incorporated by reference
herein. The Company does not undertake a duty to update or revise any forward-looking statement, whether as a result of new information, future
events, or other matters, except as otherwise required by law.
Cousins Properties | 3 | Q1 2026 Supplemental Information |
EARNINGS RELEASE | ||
COUSINS PROPERTIES REPORTS FIRST QUARTER 2026 RESULTS
Updates 2026 Earnings Guidance
ATLANTA, GA (April 29, 2026) - Cousins Properties (NYSE:CUZ) today reported its results of operations for the quarter ended March 31,
2026.
"We had an outstanding start to 2026" said Colin Connolly, President and Chief Executive Officer of Cousins Properties. "The
acceleration in Sun Belt migration drove one of the best office leasing quarters in the history of the company, and our late-stage leasing
pipeline is exceptionally strong. Trophy office fundamentals in the Sun Belt continue to tighten with increasing demand and virtually no
new construction. Our best-in-class portfolio is extraordinarily well-positioned for an emerging shortage of lifestyle office space."
Financial Results
For first quarter 2026:
•Net loss available to common stockholders was $24.9 million, or $0.15 per share, compared to net income of $20.9 million, or
$0.12 per share, for first quarter 2025. The decline in net income is primarily attributable to an impairment charge.
•Funds From Operations ("FFO") was $122.9 million, or $0.73 per share, compared to $124.8 million, or $0.74 per share, for first
quarter 2025. The decline in FFO is primarily attributable to a gain generated by the sale of our bankruptcy claim with SVB
Financial Group in first quarter 2025.
Operations and Leasing Activity
For first quarter 2026:
•Same property net operating income ("NOI") on a cash-basis increased 5.5%.
•Second generation net rent per square foot on a cash-basis increased 15.2%.
•Executed 932,000 square feet of office leases, including 483,000 square feet of new and expansion leases, representing 52% of
total leasing activity.
Investing Activity
For first quarter 2026:
•Acquired 300 South Tryon, a 638,000 square foot office property in Charlotte, for $317.5 million on February 2, 2026.
•Received repayment at par of the $18.2 million mezzanine loan investment secured by an equity interest in 110 East in Charlotte
on February 5, 2026.
•Sold Harborview Plaza, a 206,000 square foot office property in Tampa, for $39.5 million on February 25, 2026.
•Entered into an agreement to sell One Eleven Congress, a 519,000 square foot office property in Austin. The sale is expected to
close early in the third quarter of 2026.
Cousins Properties | 4 | Q1 2026 Supplemental Information |
EARNINGS RELEASE | ||
Financing Activity
For first quarter 2026:
•Issued $500.0 million of 4.875% public unsecured senior notes due 2033 with a yield to maturity of 5.001%, generating net
proceeds of $492.1 million.
•Repurchased 3.9 million shares at a weighted average price of $23.36 per share. Subsequent to quarter end, the Board of
Directors authorized an increase of the Company's share repurchase program from $250 million to $500 million.
•Subsequent to quarter end, closed a new five-year $1.2 billion unsecured credit facility, increasing the prior facility that was
scheduled to mature in April 2027 by $200 million. Also amended our existing $400 million and $100 million unsecured term
loans, adding two six-month extension options to each. The borrowing spread improved by fifteen basis points on both the
credit facility and the $400 million term loan and by thirty basis points on the $100 million term loan.
Earnings Guidance
For year ending December 31, 2026:
•Net income between $0.02 and $0.10 per share, updated from $0.23 and $0.33 per share, primarily driven by a first quarter
impairment charge.
•FFO between $2.90 and $2.98 per share, up from $2.87 and $2.97 per share.
•The increase in FFO per share is primarily driven by share repurchases as well as better than forecasted execution on debt
financings, both discussed above, partially offset by the elimination of a prior mid-year SOFR cut assumption. Our updated
guidance assumes no SOFR cuts during 2026.
•Guidance assumes the 3.9 million share repurchase is funded during the second quarter with proceeds from the settlement of
2.9 million shares previously issued at $30.44 per share on a forward basis under the Company's ATM program.
•Guidance assumes the 300 South Tryon acquisition is funded with proceeds from the Harborview and One Eleven Congress sales
discussed above, as well as the sale of our 303 Tremont land parcel.
•Guidance does not include any speculative property acquisitions, dispositions, or development starts.
•Guidance reflects management’s current plans and assumptions as of the date of this earnings release and are subject to change
as well as the risks and uncertainties more fully described in our SEC filings. Actual results could differ materially from this
guidance.
Investor Conference Call and Webcast
The Company will conduct a conference call at 10:00 a.m. (Eastern Time) on Thursday, April 30, 2026 to discuss the results of the quarter
ended March 31, 2026. The number to call for this interactive teleconference is (800) 836-8184. The live webcast of this call can be
accessed on the Company's website, www.cousins.com, through the “Cousins Properties First Quarter Conference Call” link on the
Investors page. A replay of the conference call will be available for seven days by dialing (888) 660-6345 and entering the passcode
49629#. The playback can also be accessed on the Company's website.
Cousins Properties | 5 | Q1 2026 Supplemental Information |
COMPANY INFORMATION | ||
THE COMPANY
Cousins Properties Incorporated ("Cousins" or the "Company") is a fully integrated, self-administered, and self-managed real estate
investment trust (REIT). The Company, based in Atlanta, GA and acting through its operating partnership, Cousins Properties LP,
primarily invests in Class A office buildings located in high-growth Sun Belt markets. Founded in 1958, Cousins creates shareholder
value through its extensive expertise in the development, acquisition, leasing, and management of high-quality real estate assets. The
Company has a comprehensive strategy in place based on a simple platform, trophy assets, and opportunistic investments. For more
information, please visit www.cousins.com.
MANAGEMENT
M. Colin Connolly | Gregg D. Adzema | Kennedy Hicks | Richard G. Hickson IV |
President & Chief Executive Officer | Executive Vice President & Chief Financial Officer | Executive Vice President & Chief Investment Officer | Executive Vice President, Operations |
John S. McColl | Pamela F. Roper | Jeffrey D. Symes | |
Executive Vice President, Development | Executive Vice President, General Counsel & Corporate Secretary | Senior Vice President & Chief Accounting Officer |
BOARD OF DIRECTORS
Robert M. Chapman | Charles T. Cannada | M. Colin Connolly |
Non-executive Chairman of Cousins Properties, former Chief Executive Officer of Centerpoint Properties Trust | Private Investor | President and Chief Executive Officer of Cousins Properties |
Scott W. Fordham | Susan L. Givens | R. Kent Griffin Jr. |
Former Chief Executive Officer and Director of TIER REIT, Inc. | Former executive with Blackstone | Managing Director of Phicas Investors |
Donna W. Hyland | Dionne Nelson | R. Dary Stone |
President and Chief Executive Officer of Children's Healthcare of Atlanta | President and Chief Executive Officer of Laurel Street Residential | President and Chief Executive Officer of R.D. Stone Interests |
Cousins Properties | 6 | Q1 2026 Supplemental Information |
COMPANY INFORMATION | ||
COMPANY INFORMATION | EQUITY RESEARCH COVERAGE (1) | |||||
Corporate Headquarters | Investor Relations | Barclays | BofA Securities | BMO Capital | ||
3344 Peachtree Road NE Suite 1800 Atlanta GA 30326 404.407.1000 | Roni Imbeaux Senior Vice President, Finance & Investor Relations rimbeaux@cousins.com 404.407.1104 | Brendan Lynch 212.526.9428 | Jana Galan 646.855.5042 | John Kim 212.885.4115 | ||
Evercore ISI | Green Street | Jefferies | ||||
Transfer Agent Equiniti Trust Company equiniti.com 866.627.2649 | Stock Exchange NYSE: CUZ | Steve Sakwa 212.446.9462 | Dylan Burzinski 949.640.8780 | Joe Dickstein 212.778.8771 | ||
J.P. Morgan | KeyBanc | Mizuho Securities | ||||
RATING AGENCIES (1) | Anthony Paolone 212.622.6682 | Upal Rana 917.368.2316 | Vikram Malhotra 212.282.3827 | |||
S&P Global Ratings | Moody's Investors Service | RW Baird | Truist Securities | Wells Fargo | ||
Hannah Gray 212.438.0244 Current Corporate Credit Rating: BBB | Christian Azzi 212.553.9342 Current Corporate Credit Rating: Baa2 | Nicholas Thillman 414.298.5053 | Michael Lewis 212.319.5659 | Blaine Heck 410.662.2556 | ||
Wolfe Research | ||||||
Outlook: Stable | Outlook: Stable | Ally Yaseen 646.582.9253 | ||||
(1) Please note that any opinions, estimates, or forecasts regarding Cousins' performance made by the analysts and rating agencies listed above are theirs alone and do not represent opinions, forecasts, or predictions of Cousins or its management. Cousins does not, by its reference above or distribution, imply its endorsement of, or concurrence with, such information, conclusions, or recommendations. | ||||||

Pictured Above: Sail Tower, Austin, TX
Cousins Properties | 7 | Q1 2026 Supplemental Information |
CONSOLIDATED BALANCE SHEETS | ||
(in thousands, except share and per share amounts)
March 31, 2026 | December 31, 2025 | ||
Assets: | |||
Real estate assets: | |||
Operating properties, net of accumulated depreciation of $1,960,227 and $1,922,394 in 2026 and 2025, respectively | $8,114,853 | $7,894,846 | |
Land | 135,869 | 135,870 | |
8,250,722 | 8,030,716 | ||
Real estate assets and other assets held for sale, net | 23,237 | 61,489 | |
Cash and cash equivalents | 6,296 | 5,720 | |
Investments in real estate debt, at fair value | 19,586 | 37,804 | |
Accounts receivable | 15,946 | 17,578 | |
Deferred rents receivable | 278,450 | 269,282 | |
Investments in unconsolidated joint ventures | 213,988 | 215,301 | |
Intangible assets, net | 183,796 | 164,738 | |
Other assets, net | 95,822 | 87,504 | |
Total assets | $9,087,843 | $8,890,132 | |
Liabilities: | |||
Notes payable | $3,772,182 | $3,340,815 | |
Accounts payable and accrued expenses | 247,716 | 314,317 | |
Deferred income | 297,607 | 301,358 | |
Intangible liabilities, net | 126,841 | 117,085 | |
Other liabilities | 110,409 | 111,506 | |
Liabilities of real estate assets held for sale, net | 39 | 2,849 | |
Total liabilities | 4,554,794 | 4,187,930 | |
Commitments and contingencies | |||
Equity: | |||
Stockholders' investment: | |||
Common stock, $1 par value per share, 300,000,000 shares authorized, 164,541,670 and 167,981,990 issued and outstanding in 2026 and 2025, respectively | 164,542 | 167,982 | |
Additional paid-in capital | 5,885,455 | 5,971,762 | |
Distributions in excess of cumulative net income | (1,539,263) | (1,460,154) | |
Total stockholders' investment | 4,510,734 | 4,679,590 | |
Nonredeemable noncontrolling interests | 22,315 | 22,612 | |
Total equity | 4,533,049 | 4,702,202 | |
Total liabilities and equity | $9,087,843 | $8,890,132 |
Cousins Properties | 8 | Q1 2026 Supplemental Information |
CONSOLIDATED STATEMENTS OF OPERATIONS | ||
(unaudited; in thousands, except per share amounts)
Three Months Ended | |||||
March 31, | |||||
2026 | 2025 | ||||
Revenues: | |||||
Rental property revenues | $261,108 | $243,027 | |||
Fee income | 1,245 | 496 | |||
Other | 756 | 6,805 | |||
263,109 | 250,328 | ||||
Expenses: | |||||
Rental property operating expenses | 82,585 | 77,156 | |||
Reimbursed expenses | 120 | 177 | |||
General and administrative expenses | 11,840 | 10,709 | |||
Interest expense | 45,101 | 36,774 | |||
Operating property impairment | 36,600 | — | |||
Depreciation and amortization | 108,406 | 102,114 | |||
Other | 438 | 422 | |||
285,090 | 227,352 | ||||
Loss from unconsolidated joint ventures | (2,642) | (1,883) | |||
Loss on investment property transaction | (47) | — | |||
Net income (loss) | (24,670) | 21,093 | |||
Net income attributable to noncontrolling interests | (186) | (196) | |||
Net income (loss) available to common stockholders | $(24,856) | $20,897 | |||
Net income (loss) per common share — basic and diluted | $(0.15) | $0.12 | |||
Weighted average common shares — basic | 166,399 | 167,809 | |||
Weighted average common shares — diluted | 166,399 | 168,593 | |||
Cousins Properties | 9 | Q1 2026 Supplemental Information |
KEY PERFORMANCE METRICS (1) | ||
2024 | 2025 1st | 2025 2nd | 2025 3rd | 2025 4th | 2025 | 2026 1st | |
Property Statistics | |||||||
Consolidated Operating Properties | 36 | 36 | 36 | 37 | 37 | 37 | 37 |
Consolidated Rentable Square Feet (in thousands) | 19,877 | 20,081 | 20,081 | 20,373 | 20,373 | 20,373 | 20,805 |
Unconsolidated Operating Properties | 3 | 3 | 3 | 3 | 3 | 3 | 4 |
Unconsolidated Rentable Square Feet (in thousands) | 1,236 | 1,236 | 1,236 | 1,236 | 1,236 | 1,236 | 2,139 |
Total Operating Properties | 39 | 39 | 39 | 40 | 40 | 40 | 41 |
Total Rentable Square Feet (in thousands) | 21,113 | 21,317 | 21,317 | 21,609 | 21,609 | 21,609 | 22,944 |
Office Percent Leased (period end) | 91.6% | 92.1% | 91.6% | 90.0% | 90.7% | 90.7% | 91.8% |
Office Weighted Average Occupancy | 88.6% | 90.0% | 89.1% | 88.3% | 88.3% | 88.8% | 88.9% |
Office Leasing Activity (2) | |||||||
Net Leased during the Period (SF, in thousands) | 2,020 | 539 | 334 | 551 | 700 | 2,125 | 932 |
Net Rent (per SF) | $39.77 | $35.87 | $40.95 | $39.18 | $36.52 | $37.76 | $44.54 |
Net Free Rent (per SF) | (1.97) | (1.77) | (2.08) | (1.97) | (2.40) | (2.07) | (1.86) |
Leasing Commissions (per SF) | (2.81) | (2.81) | (3.18) | (2.69) | (2.76) | (2.82) | (3.26) |
Tenant Improvements (per SF) | (6.82) | (6.23) | (7.34) | (6.15) | (8.18) | (7.01) | (7.14) |
Leasing Costs (per SF) | (11.60) | (10.81) | (12.60) | (10.81) | (13.34) | (11.90) | (12.26) |
Net Effective Rent (per SF) | $28.17 | $25.06 | $28.35 | $28.37 | $23.18 | $25.86 | $32.28 |
Change in Second Generation Net Rent | 28.2% | 18.3% | 27.2% | 23.8% | 19.9% | 21.5% | 28.7% |
Change in Cash-Basis Second Generation Net Rent | 8.5% | 3.2% | 10.9% | 4.2% | 0.2% | 3.5% | 15.2% |
Same Property Information (3) | |||||||
Percent Leased (period end) | 91.2% | 91.7% | 91.1% | 89.3% | 90.1% | 90.1% | 91.5% |
Weighted Average Occupancy | 88.6% | 89.4% | 88.4% | 87.4% | 87.4% | 88.1% | 88.5% |
Change in NOI (over prior year period) | 5.1% | 4.0% | 3.2% | 1.9% | 0.4% | 2.4% | 1.7% |
Change in Cash-Basis NOI (over prior year period) | 4.8% | 2.0% | 1.2% | 0.3% | 0.03% | 0.9% | 5.5% |
Development Pipeline (4) | |||||||
Estimated Project Costs (in thousands) | $441,550 | $294,550 | $294,550 | $294,550 | $294,550 | $294,550 | — |
Estimated Project Costs/Total Undepreciated Assets | 4.1% | 2.7% | 2.6% | 2.7% | 2.6% | 2.6% | — |
Continued on next page | |||||||
Cousins Properties | 10 | Q1 2026 Supplemental Information |
KEY PERFORMANCE METRICS (1) | ||
2024 | 2025 1st | 2025 2nd | 2025 3rd | 2025 4th | 2025 | 2026 1st | |
Market Capitalization | |||||||
Common Stock Price Per Share | $30.64 | $29.50 | $30.03 | $28.94 | $25.78 | $25.78 | $22.57 |
Common Stock/Units Outstanding (in thousands) | 167,685 | 167,933 | 167,992 | 167,990 | 168,007 | 168,007 | 164,566 |
Equity Market Capitalization (in thousands) | $5,137,868 | $4,954,024 | $5,044,800 | $4,861,631 | $4,331,220 | $4,331,220 | $3,714,255 |
Debt (in thousands) | 3,274,388 | 3,203,476 | 3,660,608 | 3,475,120 | 3,507,020 | 3,507,020 | 3,938,750 |
Total Market Capitalization (in thousands) | $8,412,256 | $8,157,500 | $8,705,408 | $8,336,751 | $7,838,240 | $7,838,240 | $7,653,005 |
Credit Ratios | |||||||
Net Debt/Total Market Capitalization | 38.8% | 39.1% | 37.2% | 41.6% | 44.6% | 44.6% | 51.3% |
Net Debt/Total Undepreciated Assets | 30.2% | 29.7% | 28.9% | 31.2% | 31.3% | 31.3% | 34.4% |
Net Debt/Annualized EBITDAre | 5.16 | 4.87 | 5.11 | 5.38 | 5.30 | 5.30 | 5.66 |
Fixed Charges Coverage (EBITDAre) | 4.01 | 4.05 | 3.73 | 3.50 | 3.52 | 3.69 | 3.45 |
Dividend Information | |||||||
Common Dividend per Share | $1.28 | $0.32 | $0.32 | $0.32 | $0.32 | $1.28 | $0.32 |
Funds From Operations (FFO) Payout Ratio | 48.2% | 43.0% | 45.7% | 46.1% | 45.0% | 44.9% | 42.8% |
Funds Available for Distribution (FAD) Payout Ratio | 76.5% | 71.0% | 75.6% | 76.3% | 90.1% | 77.7% | 65.0% |
Operations Ratio | |||||||
Annualized General and Administrative Expenses/ Total Undepreciated Assets | 0.34% | 0.40% | 0.35% | 0.34% | 0.31% | 0.31% | 0.41% |
Additional Information | |||||||
In-Place Gross Rent (per SF) (5) | $47.94 | $48.66 | $49.07 | $49.76 | $49.91 | $49.91 | $50.50 |
Straight-Line Rental Revenue (in thousands) | $24,508 | $12,477 | $11,283 | $9,424 | $6,117 | $39,301 | $9,544 |
Above and Below Market Rents Amortization, Net (in thousands) | $6,167 | $2,845 | $2,828 | $3,422 | $3,514 | $12,609 | $4,104 |
Second Generation Capital Expenditures (in thousands) | $116,093 | $33,281 | $28,636 | $29,981 | $47,457 | $139,355 | $26,625 |
(1) | For Non-GAAP Financial Measures, see the calculations and reconciliations on pages 32 through 38. |
(2) | See Office Leasing Activity on page 20 for additional detail and explanations. |
(3) | Same Property Information is derived from the pool of same office properties that existed in the period as originally reported. See Same Property Performance on page 19 and Non-GAAP Financial Measures - Calculations and Reconciliations starting on page 32 for additional information. |
(4) | The Company's share of estimated project costs. See Development Pipeline on page 26 for additional detail. |
(5) | In-place gross rent equals the annualized cash rent including the tenant's share of estimated operating expenses, if applicable, as of the end of the period divided by occupied square feet. |
Cousins Properties | 11 | Q1 2026 Supplemental Information |
KEY PERFORMANCE METRICS | ||
Total Rentable Square Feet Equity Market Capitalization Net Debt / Annualized EBITDAre
Same Property NOI Change Second Generation Net Rent Change In-Place Gross Rent (per SF) (1)
Cash-Basis (1) Cash-Basis(1)
(1) Office properties only.
Note: See additional information included herein for calculations, definitions, and reconciliations to GAAP financial measures.
Cousins Properties | 12 | Q1 2026 Supplemental Information |
FUNDS FROM OPERATIONS - SUMMARY | ||
(amounts in thousands, except per share amounts) | |||||||
2024 | 2025 1st | 2025 2nd | 2025 3rd | 2025 4th | 2025 | 2026 1st | |
Net Income (Loss) | $46,581 | $21,093 | $14,658 | $8,778 | $(3,277) | $41,252 | $(24,670) |
Fee and Other Income | (12,390) | (10,168) | (2,411) | (2,378) | (3,398) | (18,355) | (3,833) |
General and Administrative Expenses | 36,566 | 10,709 | 9,738 | 9,510 | 8,685 | 38,642 | 11,840 |
Interest Expense | 122,476 | 36,774 | 38,514 | 41,497 | 42,456 | 159,241 | 45,101 |
Operating Property Impairment (1) | — | — | — | — | 13,286 | 13,286 | 36,600 |
Land and Related Predevelopment Cost Impairment (2) | — | — | — | — | 1,034 | 1,034 | — |
Depreciation and Amortization | 365,045 | 102,114 | 100,890 | 105,272 | 107,083 | 415,359 | 108,406 |
Reimbursed and Other Expenses | 2,731 | 600 | 560 | 565 | 619 | 2,344 | 559 |
Loss from Unconsolidated Joint Ventures | 2,796 | 1,883 | 1,587 | 2,682 | 2,007 | 8,159 | 2,642 |
NOI from Unconsolidated Joint Ventures | 6,617 | 2,223 | 3,165 | 3,256 | 3,705 | 12,349 | 3,371 |
Transaction Loss (Gain) | (98) | — | — | — | — | — | 47 |
NOI (3) | $570,324 | $165,228 | $166,701 | $169,182 | $172,200 | $673,311 | $180,063 |
Fee and Other Income (3) | 12,522 | 10,183 | 2,450 | 2,400 | 3,445 | 18,478 | 3,865 |
General and Administrative Expenses | (36,566) | (10,709) | (9,738) | (9,510) | (8,685) | (38,642) | (11,840) |
Interest Expense (3) | (126,960) | (38,763) | (40,753) | (44,327) | (45,106) | (168,949) | (47,834) |
Reimbursed and Other Expenses (3) | (3,047) | (521) | (625) | (659) | (725) | (2,530) | (817) |
Land and Related Predevelopment Cost Impairment (2) | — | — | — | — | (1,034) | (1,034) | — |
Loss on Sales of Undepreciated Investment Properties (3) | (3) | — | — | — | — | — | — |
Depreciation and Amortization of Non-Real Estate Assets | (461) | (117) | (121) | (121) | (129) | (488) | (140) |
Partners' Share of FFO in Consolidated Joint Ventures | (1,717) | (467) | (420) | (429) | (429) | (1,745) | (430) |
FFO (3) | $414,092 | $124,834 | $117,494 | $116,536 | $119,537 | $478,401 | $122,867 |
Weighted Average Common Shares - Diluted | 154,015 | 168,593 | 168,765 | 168,738 | 168,770 | 168,716 | 167,681 |
FFO per Share (3) | $2.69 | $0.74 | $0.70 | $0.69 | $0.71 | $2.84 | $0.73 |
(1) The operating property impairments related to One Eleven Congress and Harborview in the first quarter of 2026 and the fourth quarter of 2025, respectively.
(2) The land and related predevelopment cost impairment in the fourth quarter of 2025 related to a land parcel at 303 Tremont. The bases of the land and predevelopment cost were $18.9 million
and $5.8 million, respectively, prior to impairment charges.
(3) The above amounts include our share of amounts from unconsolidated joint ventures for the respective category. The Company does not control the operations of these unconsolidated joint
ventures but believes including these amounts are meaningful to investors and analysts.
Cousins Properties | 13 | Q1 2026 Supplemental Information |
FUNDS FROM OPERATIONS - DETAIL (1) | ||
(amounts in thousands, except per share amounts) | |||||||
2024 | 2025 1st | 2025 2nd | 2025 3rd | 2025 4th | 2025 | 2026 1st | |
NOI | |||||||
Consolidated Properties | |||||||
The Domain (2) | $78,929 | $20,825 | $21,725 | $22,055 | $22,130 | $86,735 | $22,185 |
Sail Tower | 1,843 | 11,682 | 11,771 | 11,726 | 11,780 | 46,959 | 11,800 |
Corporate Center (2) | 30,284 | 8,094 | 8,458 | 8,468 | 8,603 | 33,623 | 8,790 |
Terminus (2) | 31,910 | 8,252 | 8,566 | 8,644 | 7,919 | 33,381 | 8,472 |
Spring & 8th (2) | 29,471 | 7,375 | 7,369 | 7,412 | 7,380 | 29,536 | 7,344 |
Vantage South End (2) | 2,338 | 7,136 | 7,031 | 7,140 | 7,148 | 28,455 | 7,243 |
300 Colorado | 24,062 | 6,541 | 6,726 | 6,686 | 6,820 | 26,773 | 6,812 |
Buckhead Plaza (2) | 22,380 | 6,471 | 6,223 | 6,537 | 6,480 | 25,711 | 6,796 |
Promenade Tower | 16,714 | 5,433 | 5,501 | 5,761 | 5,984 | 22,679 | 6,657 |
Hayden Ferry (2) | 17,818 | 4,560 | 4,621 | 4,559 | 5,129 | 18,869 | 6,065 |
BriarLake Plaza (2) | 22,363 | 5,686 | 5,533 | 5,660 | 5,627 | 22,506 | 5,558 |
San Jacinto Center | 20,161 | 4,495 | 4,409 | 4,547 | 4,710 | 18,161 | 4,993 |
One Eleven Congress | 17,127 | 4,592 | 5,121 | 4,607 | 4,763 | 19,083 | 4,909 |
300 South Tryon | — | — | — | — | — | — | 4,770 |
The Link | — | — | — | 3,258 | 4,483 | 7,741 | 4,515 |
Avalon (2) | 16,821 | 3,483 | 3,625 | 3,646 | 3,892 | 14,646 | 4,468 |
Colorado Tower | 17,655 | 4,252 | 3,663 | 3,550 | 4,085 | 15,550 | 4,233 |
725 Ponce | 17,913 | 4,162 | 4,146 | 4,156 | 4,121 | 16,585 | 4,186 |
The Terrace (2) | 15,914 | 4,152 | 4,006 | 3,986 | 4,078 | 16,222 | 4,168 |
Northpark (2) | 20,652 | 4,818 | 3,920 | 3,822 | 3,857 | 16,417 | 3,983 |
100 Mill | 15,128 | 3,992 | 3,782 | 3,856 | 3,851 | 15,481 | 3,840 |
3344 Peachtree | 15,652 | 3,745 | 4,051 | 4,006 | 4,141 | 15,943 | 3,831 |
The RailYard | 12,262 | 3,027 | 3,058 | 3,147 | 2,996 | 12,228 | 2,956 |
201 North Tryon | 19,168 | 4,795 | 4,983 | 3,442 | 2,968 | 16,188 | 2,768 |
3350 Peachtree | 6,748 | 1,970 | 2,274 | 2,511 | 2,709 | 9,464 | 2,677 |
Legacy Union One | 9,505 | 2,372 | 2,360 | 2,367 | 2,358 | 9,457 | 2,545 |
Heights Union (2) | 10,606 | 2,623 | 2,677 | 2,614 | 2,657 | 10,571 | 2,506 |
Tempe Gateway | 6,003 | 2,122 | 2,106 | 2,342 | 2,352 | 8,922 | 2,439 |
Promenade Central | 7,157 | 2,349 | 2,333 | 2,255 | 2,332 | 9,269 | 2,382 |
Domain Point (2) | 8,332 | 2,040 | 2,040 | 1,843 | 2,045 | 7,968 | 1,963 |
111 West Rio | 5,648 | 1,419 | 1,400 | 1,408 | 1,424 | 5,651 | 1,396 |
3348 Peachtree | 4,926 | 1,301 | 1,156 | 886 | 1,320 | 4,663 | 1,394 |
5950 Sherry Lane | 4,432 | 1,244 | 1,283 | 1,456 | 1,422 | 5,405 | 1,359 |
The Pointe | 4,906 | 1,316 | 1,251 | 1,223 | 1,317 | 5,107 | 1,351 |
Meridian Mark Plaza | 4,494 | 1,158 | 1,280 | 1,301 | 1,239 | 4,978 | 1,296 |
550 South | 8,396 | 1,875 | 1,859 | 1,861 | 1,505 | 7,100 | 1,284 |
Research Park V | 4,425 | 1,181 | 1,139 | 1,168 | 1,170 | 4,658 | 1,160 |
Other (3) | 11,564 | 2,467 | 2,090 | 2,020 | 1,700 | 8,277 | 1,598 |
Subtotal - Consolidated | 563,707 | 163,005 | 163,536 | 165,926 | 168,495 | 660,962 | 176,692 |
Continued on next page | |||||||
Cousins Properties | 14 | Q1 2026 Supplemental Information |
FUNDS FROM OPERATIONS - DETAIL (1) | ||
(amounts in thousands, except per share amounts) | |||||||
2024 | 2025 1st | 2025 2nd | 2025 3rd | 2025 4th | 2025 | 2026 1st | |
Unconsolidated Properties (4) | |||||||
Neuhoff (5) | 113 | 400 | 1,328 | 1,436 | 2,031 | 5,195 | 1,772 |
Medical Offices at Emory Hospital | 4,661 | 1,176 | 1,188 | 1,227 | 1,198 | 4,789 | 1,205 |
120 West Trinity (2) | 1,100 | 286 | 228 | 244 | 243 | 1,001 | 240 |
Proscenium | 743 | 361 | 421 | 349 | 233 | 1,364 | 154 |
Subtotal - Unconsolidated | 6,617 | 2,223 | 3,165 | 3,256 | 3,705 | 12,349 | 3,371 |
Total Net Operating Income (1) | 570,324 | 165,228 | 166,701 | 169,182 | 172,200 | 673,311 | 180,063 |
Fee and Other Income | |||||||
Management Fees (6) | 1,761 | 496 | 422 | 454 | 423 | 1,795 | 449 |
Termination Fees | 3,405 | 2,866 | — | 512 | 1,709 | 5,087 | 1,831 |
Leasing & Other Fees | — | — | 33 | — | 2 | 35 | 725 |
Development Fees | — | — | 39 | 72 | 102 | 213 | 72 |
Interest Income from Real Estate Debt (7) | 5,772 | 2,149 | 568 | 606 | 1,097 | 4,420 | 727 |
Other Income (8) | 1,452 | 4,656 | 1,350 | 734 | 65 | 6,805 | 29 |
Other Income - Unconsolidated (4) | 132 | 16 | 38 | 22 | 47 | 123 | 32 |
Total Fee and Other Income | 12,522 | 10,183 | 2,450 | 2,400 | 3,445 | 18,478 | 3,865 |
General and Administrative Expenses | (36,566) | (10,709) | (9,738) | (9,510) | (8,685) | (38,642) | (11,840) |
Interest Expense | |||||||
Consolidated Interest Expense | |||||||
Public Senior Notes, Unsecured ($500M) | (11,201) | (7,474) | (7,468) | (7,485) | (7,480) | (29,907) | (7,480) |
Public Senior Notes, Unsecured ($500M) | — | — | (1,798) | (6,724) | (6,742) | (15,264) | (6,749) |
Public Senior Notes, Unsecured ($400M) | (830) | (5,551) | (5,548) | (5,544) | (5,543) | (22,186) | (5,546) |
Term Loan, Unsecured ($400M) | (23,510) | (5,539) | (5,356) | (5,425) | (5,221) | (21,541) | (4,919) |
Credit Facility, Unsecured | (17,324) | (1,725) | (1,390) | (1,353) | (2,331) | (6,799) | (3,646) |
Terminus (2) | (14,055) | (3,514) | (3,514) | (3,514) | (3,513) | (14,055) | (3,514) |
Public Senior Notes, Unsecured ($500M) | — | — | — | — | — | — | (2,881) |
Privately Placed Senior Notes, Unsecured ($275M) | (10,975) | (2,744) | (2,744) | (2,743) | (2,744) | (10,975) | (2,744) |
Privately Placed Senior Notes, Unsecured ($250M) | (9,764) | (2,441) | (2,441) | (2,441) | (2,441) | (9,764) | (2,441) |
Term Loan, Unsecured ($100M) | (17,967) | (3,482) | (3,486) | (3,598) | (3,373) | (13,939) | (2,226) |
Privately Placed Senior Notes, Unsecured ($125M) | (4,789) | (1,197) | (1,198) | (1,197) | (1,197) | (4,789) | (1,197) |
Privately Placed Senior Notes, Unsecured ($100M) | (4,146) | (1,036) | (1,036) | (1,037) | (1,036) | (4,145) | (1,036) |
201 North Tryon | (4,265) | (1,046) | (1,038) | (1,030) | (1,023) | (4,137) | (1,015) |
Colorado Tower | (3,732) | (918) | (911) | (905) | (905) | (3,639) | (899) |
Other (9) | (12,467) | (2,490) | (2,489) | (135) | — | (5,114) | — |
Capitalized (10) | 12,549 | 2,383 | 1,903 | 1,634 | 1,093 | 7,013 | 1,192 |
Subtotal - Consolidated Interest Expense | (122,476) | (36,774) | (38,514) | (41,497) | (42,456) | (159,241) | (45,101) |
Unconsolidated Interest Expense (4) | |||||||
Neuhoff (5) | (2,452) | (1,481) | (1,731) | (2,322) | (2,142) | (7,676) | (2,225) |
Medical Offices at Emory Hospital | (2,032) | (508) | (508) | (508) | (508) | (2,032) | (508) |
Subtotal - Unconsolidated Interest Expense | (4,484) | (1,989) | (2,239) | (2,830) | (2,650) | (9,708) | (2,733) |
Total Interest Expense | (126,960) | (38,763) | (40,753) | (44,327) | (45,106) | (168,949) | (47,834) |
Continued on next page | |||||||
Cousins Properties | 15 | Q1 2026 Supplemental Information |
FUNDS FROM OPERATIONS - DETAIL (1) | ||
(amounts in thousands, except per share amounts) | |||||||
2024 | 2025 1st | 2025 2nd | 2025 3rd | 2025 4th | 2025 | 2026 1st | |
Reimbursed and Other Expenses | |||||||
Reimbursed Expenses (6) | (634) | (177) | (120) | (123) | (124) | (544) | (120) |
Property Taxes and Other Land Holding Costs (4) | (976) | (344) | (386) | (319) | (334) | (1,383) | (359) |
Severance | (44) | (11) | (1) | (1) | — | (13) | (57) |
Predevelopment & Other Costs (4) | (1,393) | 11 | (118) | (216) | (267) | (590) | (281) |
Land and Related Predevelopment Cost Impairment | — | — | — | — | (1,034) | (1,034) | — |
Total Reimbursed and Other Expenses | (3,047) | (521) | (625) | (659) | (1,759) | (3,564) | (817) |
Loss on Sales of Undepreciated Investment Properties | |||||||
Consolidated | (3) | — | — | — | — | — | — |
Total Loss on Sales of Undepreciated Investment Properties | (3) | — | — | — | — | — | — |
— | |||||||
Depreciation and Amortization of Non-Real Estate Assets | (461) | (117) | (121) | (121) | (129) | (488) | (140) |
— | |||||||
Partners' Share of FFO in Consolidated Joint Ventures | (1,717) | (467) | (420) | (429) | (429) | (1,745) | (430) |
FFO | $414,092 | $124,834 | $117,494 | $116,536 | $119,537 | $478,401 | $122,867 |
Weighted Average Shares - Diluted | 154,015 | 168,593 | 168,765 | 168,738 | 168,770 | 168,716 | 167,681 |
FFO per Share | $2.69 | $0.74 | $0.70 | $0.69 | $0.71 | $2.84 | $0.73 |
Note: | Amounts may differ slightly from other schedules contained herein due to rounding. | ||||||||||||||||
(1) See Non-GAAP Financial Measures - Calculations and Reconciliations beginning on page 32. | |||||||||||||||||
(2) Contains multiple buildings that are grouped together for reporting purposes. | |||||||||||||||||
(3) Primarily represents operating properties sold prior to March 31, 2026 and also includes the College Street Garage and Domain 4. The Company plans to hold the Domain 4 site for future development. | |||||||||||||||||
(4) Unconsolidated amounts included in the reconciliation above represent amounts recorded in unconsolidated joint ventures multiplied by the Company's ownership interest. The Company does not control the operations of the unconsolidated joint ventures but believes including these amounts in the categories indicated is meaningful to investors and analysts. | |||||||||||||||||
(5) Represents the initial operations at our Neuhoff property, which is not yet stabilized. | |||||||||||||||||
(6) Reimbursed Expenses include costs incurred by the Company for management services provided to our unconsolidated joint ventures. The reimbursement of these costs by the unconsolidated joint ventures is included in Management Fees. | |||||||||||||||||
(7) Included in Interest Income from Real Estate Debt for the first quarter of 2025 is $858,000 related to a minimum interest guaranty paid by the borrower of the Radius loan upon early repayment. | |||||||||||||||||
(8) Included in Other Income for the first quarter of 2025 is $4.6 million from the sale of our SVB bankruptcy claim. | |||||||||||||||||
(9) Primarily represents interest on consolidated loans repaid prior to March 31, 2026. | |||||||||||||||||
(10) Amounts of consolidated interest expense related to consolidated debt that are capitalized to consolidated development and redevelopment projects as well as to equity in unconsolidated development projects. | |||||||||||||||||
Cousins Properties | 16 | Q1 2026 Supplemental Information |
PORTFOLIO STATISTICS (1) | ||
Office Properties | Rentable Square Feet | Financial Statement Presentation | Company's Ownership Interest | End of Period Leased | Weighted Average Occupancy (2) | % of Total NOI / 1Q26 | |||||||||||
4Q25 | 1Q26 | 4Q25 | 1Q26 | ||||||||||||||
The Domain (3) (4) | 2,080,000 | Consolidated | 100% | 97.9% | 97.6% | 97.9% | 97.9% | 12.4% | |||||||||
Sail Tower | 804,000 | Consolidated | 100% | 100.0% | 100.0% | 100.0% | 100.0% | 6.6% | |||||||||
300 Colorado | 378,000 | Consolidated | 100% | 100.0% | 100.0% | 100.0% | 100.0% | 3.8% | |||||||||
One Eleven Congress | 519,000 | Consolidated | 100% | 86.4% | 90.2% | 82.7% | 82.7% | 2.7% | |||||||||
San Jacinto Center | 399,000 | Consolidated | 100% | 90.3% | 90.3% | 85.9% | 87.6% | 2.7% | |||||||||
Colorado Tower | 373,000 | Consolidated | 100% | 89.7% | 89.7% | 89.7% | 89.7% | 2.4% | |||||||||
The Terrace (3) | 619,000 | Consolidated | 100% | 88.1% | 89.6% | 79.4% | 83.4% | 2.3% | |||||||||
Domain Point (3) | 240,000 | Consolidated | 96.5% | 93.6% | 93.6% | 93.6% | 93.6% | 1.1% | |||||||||
Research Park V | 173,000 | Consolidated | 100% | 93.0% | 97.1% | 93.0% | 94.4% | 0.6% | |||||||||
AUSTIN | 5,585,000 | 94.8% | 95.3% | 93.1% | 93.7% | 34.6% | |||||||||||
Terminus (3) | 1,226,000 | Consolidated | 100% | 83.9% | 83.8% | 81.6% | 81.8% | 4.7% | |||||||||
Spring & 8th (3) | 765,000 | Consolidated | 100% | 100.0% | 100.0% | 100.0% | 100.0% | 4.1% | |||||||||
Buckhead Plaza (3) | 678,000 | Consolidated | 100% | 95.1% | 95.8% | 93.2% | 92.7% | 3.8% | |||||||||
Promenade Tower | 777,000 | Consolidated | 100% | 87.1% | 87.0% | 80.5% | 85.1% | 3.7% | |||||||||
Avalon (3) | 480,000 | Consolidated | 100% | 99.2% | 100.0% | 88.8% | 98.3% | 2.5% | |||||||||
725 Ponce | 372,000 | Consolidated | 100% | 87.6% | 87.6% | 87.6% | 87.6% | 2.3% | |||||||||
Northpark (3) | 1,405,000 | Consolidated | 100% | 82.2% | 83.7% | 69.1% | 69.3% | 2.2% | |||||||||
3344 Peachtree | 484,000 | Consolidated | 100% | 94.5% | 94.5% | 96.7% | 94.5% | 2.1% | |||||||||
3350 Peachtree | 413,000 | Consolidated | 100% | 90.8% | 91.8% | 90.8% | 91.8% | 1.5% | |||||||||
Promenade Central | 367,000 | Consolidated | 100% | 83.2% | 84.3% | 78.4% | 78.7% | 1.3% | |||||||||
3348 Peachtree | 258,000 | Consolidated | 100% | 77.0% | 77.0% | 77.0% | 77.0% | 0.8% | |||||||||
Meridian Mark Plaza | 160,000 | Consolidated | 100% | 100.0% | 100.0% | 100.0% | 100.0% | 0.7% | |||||||||
Medical Offices at Emory Hospital | 358,000 | Unconsolidated | 50% | 99.1% | 99.2% | 99.1% | 99.2% | 0.7% | |||||||||
Proscenium | 525,000 | Unconsolidated | 20% | 44.8% | 61.6% | 46.9% | 44.8% | 0.1% | |||||||||
120 West Trinity Office | 43,000 | Unconsolidated | 20% | 74.2% | 74.2% | 74.2% | 74.2% | 0.1% | |||||||||
ATLANTA | 8,311,000 | 88.5% | 89.3% | 84.2% | 85.2% | 30.6% | |||||||||||
Vantage South End (3) | 639,000 | Consolidated | 100% | 97.4% | 97.4% | 97.4% | 97.4% | 4.0% | |||||||||
300 South Tryon (5) | 638,000 | Consolidated | 100% | N/A | 100.0% | N/A | 100.0% | 2.6% | |||||||||
The RailYard | 329,000 | Consolidated | 100% | 99.0% | 99.0% | 98.1% | 98.1% | 1.6% | |||||||||
201 North Tryon | 692,000 | Consolidated | 100% | 52.6% | 49.0% | 53.1% | 48.8% | 1.5% | |||||||||
550 South | 394,000 | Consolidated | 100% | 55.8% | 77.9% | 61.6% | 55.8% | 0.7% | |||||||||
CHARLOTTE | 2,692,000 | 74.6% | 81.4% | 75.7% | 77.6% | 10.4% | |||||||||||
Hayden Ferry (3) (6) | 792,000 | Consolidated | 100% | 95.4% | 95.4% | 92.2% | 92.2% | 3.4% | |||||||||
100 Mill | 288,000 | Consolidated | 90% | 98.1% | 98.1% | 98.1% | 98.1% | 2.1% | |||||||||
Tempe Gateway | 264,000 | Consolidated | 100% | 95.9% | 98.4% | 95.7% | 95.7% | 1.4% | |||||||||
111 West Rio | 225,000 | Consolidated | 100% | 100.0% | 100.0% | 100.0% | 100.0% | 0.8% | |||||||||
PHOENIX | 1,569,000 | 96.8% | 97.3% | 95.4% | 95.4% | 7.7% | |||||||||||
Continued on next page | |||||||||||||||||
Cousins Properties | 17 | Q1 2026 Supplemental Information |
PORTFOLIO STATISTICS (1) | ||
Office Properties | Rentable Square Feet | Financial Statement Presentation | Company's Ownership Interest | End of Period Leased | Weighted Average Occupancy (2) | % of Total NOI / 1Q26 | |||||||||||
4Q25 | 1Q26 | 4Q25 | 1Q26 | ||||||||||||||
Corporate Center (3) | 1,227,000 | Consolidated | 100% | 97.6% | 96.5% | 94.5% | 95.6% | 4.9% | |||||||||
Heights Union (3) | 294,000 | Consolidated | 100% | 100.0% | 100.0% | 100.0% | 100.0% | 1.4% | |||||||||
The Pointe | 253,000 | Consolidated | 100% | 93.9% | 93.2% | 90.3% | 89.3% | 0.8% | |||||||||
TAMPA | 1,774,000 | 97.5% | 96.6% | 94.8% | 95.5% | 7.1% | |||||||||||
The Link (5) | 292,000 | Consolidated | 100% | 93.6% | 95.8% | 93.6% | 93.6% | 2.5% | |||||||||
Legacy Union One | 319,000 | Consolidated | 100% | 100.0% | 100.0% | 100.0% | 100.0% | 1.4% | |||||||||
5950 Sherry Lane | 197,000 | Consolidated | 100% | 90.2% | 98.5% | 90.6% | 87.3% | 0.8% | |||||||||
DALLAS | 808,000 | 95.3% | 98.1% | 95.4% | 94.6% | 4.7% | |||||||||||
BriarLake Plaza (3) | 835,000 | Consolidated | 100% | 97.4% | 97.0% | 97.4% | 94.1% | 3.1% | |||||||||
HOUSTON | 835,000 | 97.4% | 97.0% | 97.4% | 94.1% | 3.1% | |||||||||||
Neuhoff Office (5) (7) | 396,000 | Unconsolidated | 50% | 55.3% | 84.3% | 49.6% | 50.0% | 0.4% | |||||||||
NASHVILLE | 396,000 | 55.3% | 84.3% | 49.6% | 50.0% | 0.4% | |||||||||||
TOTAL OFFICE | 21,970,000 | 90.8% | 91.8% | 88.5% | 88.9% | 98.6% | |||||||||||
Other Properties (5) | |||||||||||||||||
Neuhoff Apartments - Nashville (542 units) (7) | 454,000 | Unconsolidated | 50% | 91.0% | 92.6% | 85.3% | 87.5% | 0.6% | |||||||||
College Street Garage - Charlotte | N/A | Consolidated | 100% | N/A | N/A | N/A | N/A | 0.5% | |||||||||
120 West Trinity Apartments - Atlanta (330 units) | 310,000 | Unconsolidated | 20% | 96.6% | 96.3% | 96.0% | 95.5% | 0.1% | |||||||||
Neuhoff Retail - Nashville (7) | 53,000 | Unconsolidated | 50% | 45.2% | 46.6% | 43.9% | 46.6% | 0.1% | |||||||||
Domain 4 - Austin (4) | 157,000 | Consolidated | 100% | 33.4% | 33.4% | 33.4% | 33.4% | 0.1% | |||||||||
TOTAL OTHER | 974,000 | 1.4% | |||||||||||||||
TOTAL | 22,944,000 | 100.0% | |||||||||||||||
(1) | Represents the Company's operating properties, excluding properties in the development pipeline and properties sold prior to March 31, 2026. |
(2) | The weighted average occupancy of the property over the period for which the property was available for occupancy during the respective quarters. |
(3) | Contains two or more buildings that are grouped together for reporting purposes. |
(4) | Effective September 1, 2024, Domain 4 was excluded from the office square footage, end of period leased, weighted average occupancy, and Same Property. The Company plans to hold the Domain 4 site for future development. Domain 9 stabilized on March 1, 2025 and was added to the portfolio statistics at that time. Domain 9 is not included in Same Property. |
(5) | Not included in Same Property. |
(6) | Effective October 1, 2023, Hayden Ferry I, a 207,000 square foot building, in this group of buildings was excluded from Same Property, end of period leased, and weighted average occupancy due to commencement of the current full redevelopment of this building. This building will be excluded from the Phoenix and Total Office end of period leased and weighted average occupancy calculations until stabilized. |
(7) | Following substantial completion in the first quarter of 2026, Phase I of our Neuhoff joint venture's development project was removed from our development pipeline and included above. Until stabilization this property will be excluded from the Total Office end of period leased and weighted average occupancy calculations. The joint venture has a construction loan with a capacity of $273.5 million and $251.1 million outstanding as of March 31, 2026, of which our share is $125.6 million, that is secured by the entire project including the commercial office, commercial retail, and residential components. |
Cousins Properties | 18 | Q1 2026 Supplemental Information |
PORTFOLIO STATISTICS | ||
First Quarter 2026 Portfolio NOI by Market
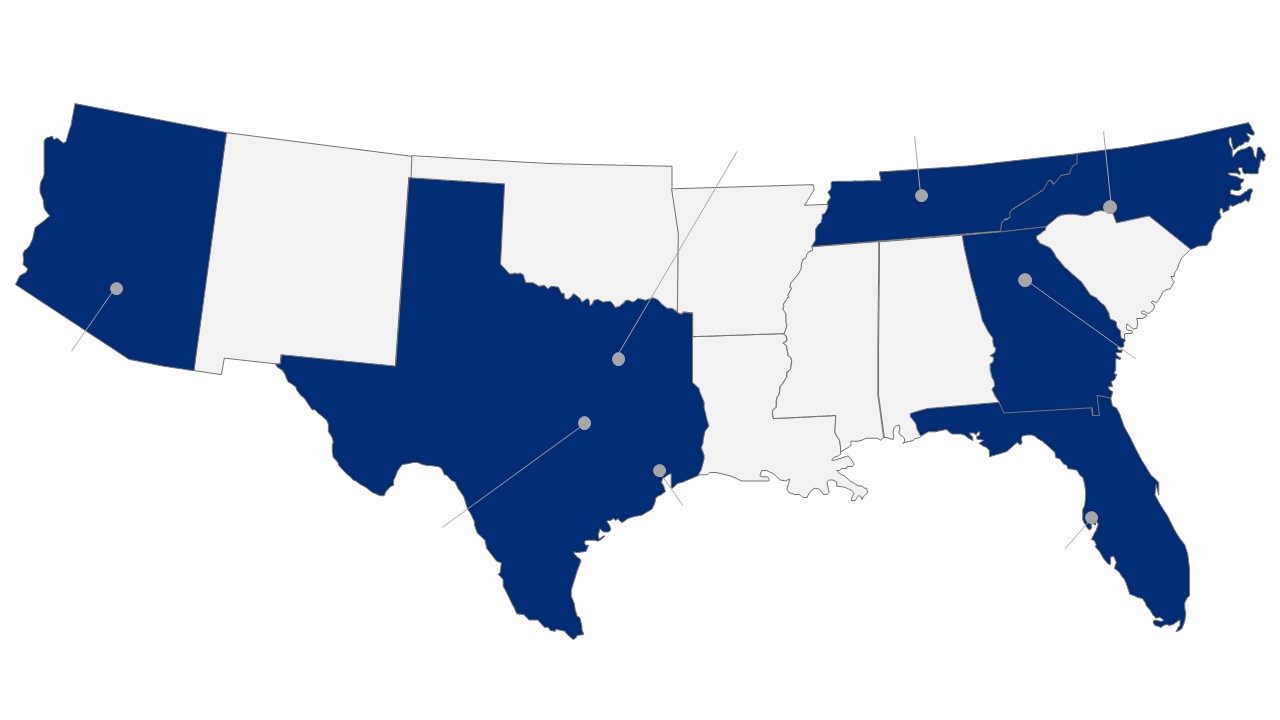
Nashville
1.1%
Charlotte
10.9%
Dallas
4.7%
Atlanta
30.7%
Phoenix
7.7%
Houston
3.1%
Austin
34.7%
Tampa
7.1%
Cousins Properties | 19 | Q1 2026 Supplemental Information |
SAME PROPERTY PERFORMANCE (1) | ||
($ in thousands) | ||||||||
Three Months Ended March 31, | ||||||||
2025 | 2026 | $ Change | % Change | |||||
Rental Property Revenues (2) | $234,097 | $238,791 | $4,694 | 2.0% | ||||
Rental Property Operating Expenses (2) | 75,352 | 77,380 | 2,028 | 2.7% | ||||
Same Property Net Operating Income | $158,745 | $161,411 | $2,666 | 1.7% | ||||
Cash-Basis Rental Property Revenues (3) | $211,754 | $221,326 | $9,572 | 4.5% | ||||
Cash-Basis Rental Property Operating Expenses (4) | 75,168 | 77,218 | 2,050 | 2.7% | ||||
Cash-Basis Same Property Net Operating Income | $136,586 | $144,108 | $7,522 | 5.5% | ||||
End of Period Leased | 92.0% | 91.5% | ||||||
Weighted Average Occupancy | 89.9% | 88.5% | ||||||
(1) | Same Properties include those office properties that were stabilized and owned by the Company for the entirety of all comparable reporting periods presented. See Portfolio Statistics on pages 16 and 17 for footnotes indicating which properties are not included in Same Property. See Non-GAAP Financial Measures - Calculations and Reconciliations beginning on page 32. | ||
(2) | Rental Property Revenues and Operating Expenses include results for the Company and its share of unconsolidated joint ventures and exclude termination fee income. Net operating income for unconsolidated joint ventures is calculated as Rental Property Revenues less termination fee income and Rental Property Operating Expenses at the joint ventures, multiplied by the Company's ownership interest. The Company does not control the operations of the unconsolidated joint ventures but believes that including these amounts with consolidated net operating income is meaningful to investors and analysts. | ||
(3) | Cash-Basis Rental Property Revenues include that of the Company and its share of unconsolidated joint ventures. It represents Rental Property Revenues, excluding termination fee income, straight-line rents, other deferred income amortization, amortization of lease inducements, and amortization of acquired above and below market rents. | ||
(4) | Cash-Basis Rental Property Operating Expenses include that of the Company and its share of unconsolidated joint ventures. It represents Rental Property Operating Expenses, excluding straight-line ground rent expense and amortization of above and below market ground rent expense. | ||
Cousins Properties | 20 | Q1 2026 Supplemental Information |
OFFICE LEASING ACTIVITY | ||
Three Months Ended March 31, 2026 | |||||||
New | Renewal | Expansion | Total | ||||
Net leased square feet (1) | 405,617 | 448,258 | 77,694 | 931,569 | |||
Number of transactions | 18 | 19 | 12 | 49 | |||
Lease term in years (2) | 8.4 | 4.7 | 7.8 | 6.6 | |||
Net effective rent calculation (per square foot per year) (2) | |||||||
Net annualized rent (3) | $43.57 | $44.34 | $50.79 | $44.54 | |||
Net free rent | (3.26) | (0.51) | (2.32) | (1.86) | |||
Leasing commissions | (3.54) | (2.90) | (3.92) | (3.26) | |||
Tenant improvements | (10.54) | (3.97) | (7.66) | (7.14) | |||
Total leasing costs | (17.34) | (7.38) | (13.90) | (12.26) | |||
Net effective rent | $26.23 | $36.96 | $36.89 | $32.28 | |||
Second generation leased square footage (4) | 656,433 | ||||||
Increase in straight-line basis second generation net rent per square foot (5) | 28.7% | ||||||
Increase in cash-basis second generation net rent per square foot (6) | 15.2% | ||||||
(1) | Comprised of total square feet leased, unadjusted for ownership share. Excludes leases approximately one year or less, along with apartment, retail, amenity, storage, and intercompany space leases. |
(2) | Weighted average of net leased square feet. |
(3) | Straight-line net rent per square foot (operating expense reimbursements deducted from gross leases) over the lease term, prior to any deductions for leasing costs. Excludes percent rent leases. |
(4) | Excludes leases executed for spaces that were vacant upon acquisition, new leases in development properties, percentage rent leases, and leases for spaces that have been vacant for one year or more. |
(5) | Increase in second generation straight-line basis net annualized rent on a weighted average basis. |
(6) | Increase in second generation net cash rent at the end of the term paid by the prior tenant compared to net cash rent at the beginning of the term (after any free rent period) paid by the current tenant on a weighted average basis. For early renewals, the final net cash rent paid under the original lease is compared to the first net cash rent paid under the terms of the renewal. Net cash rent is net of any recovery of operating expenses but prior to any deductions for leasing costs. |
Cousins Properties | 21 | Q1 2026 Supplemental Information |
OFFICE LEASE EXPIRATIONS | ||
Lease Expirations by Year (1)
Year of Expiration | Square Feet Expiring | % of Leased Space | Annual Contractual Rent ($ in thousands) (2) | % of Annual Contractual Rent | Annual Contractual Rent/Sq. Ft. | |||||
2026 | 815,548 | 4.3% | $38,325 | 3.5% | $46.99 | |||||
2027 | 1,108,132 | 5.8% | 52,671 | 4.8% | 47.53 | |||||
2028 | 1,737,748 | 9.2% | 89,342 | 8.2% | 51.41 | |||||
2029 | 1,910,457 | 10.1% | 98,121 | 9.0% | 51.36 | |||||
2030 | 1,813,129 | 9.6% | 94,992 | 8.7% | 52.39 | |||||
2031 | 1,551,132 | 8.2% | 88,356 | 8.1% | 56.96 | |||||
2032 | 2,695,603 | 14.2% | 159,797 | 14.7% | 59.28 | |||||
2033 | 1,321,242 | 7.0% | 80,055 | 7.4% | 60.59 | |||||
2034 | 1,267,967 | 6.7% | 73,958 | 6.8% | 58.33 | |||||
2035 & Thereafter | 4,744,298 | 24.9% | 313,192 | 28.8% | 66.01 | |||||
Total | 18,965,256 | 100.0% | $1,088,809 | 100.0% | $57.41 |
(1) Company's share of leases expiring after March 31, 2026. Expiring square footage for which new leases have been executed is reflected based on the expiration date of the new lease. | |||
(2) Annual Contractual Rent is the estimated rent in the year of expiration. It includes the minimum base rent and an estimate of the tenant's share of operating expenses, if applicable, as defined in the respective leases. | |||
Cousins Properties | 22 | Q1 2026 Supplemental Information |
TOP 20 OFFICE TENANTS | ||
Tenant (1) | Number of Properties Occupied | Number of Markets Occupied | Company's Share of Square Footage | Company's Share of Annualized Rent ($ in thousands) (2) | Percentage of Company's Share of Annualized Rent | Weighted Average Remaining Lease Term (Years) | |||||||
1 | Amazon | 5 | 3 | 1,461,805 | $80,093 | 8.6% | 5.4 | ||||||
2 | Alphabet | 1 | 1 | 799,149 | 55,163 | 5.9% | 11.8 | ||||||
3 | NCR Voyix | 2 | 2 | 815,634 | 43,982 | 4.7% | 7.2 | ||||||
4 | ExxonMobil | 1 | 1 | 298,396 | 21,862 | 2.3% | 6.8 | ||||||
5 | IBM | 1 | 1 | 319,863 | 18,669 | 2.0% | 14.4 | ||||||
6 | Expedia | 1 | 1 | 315,882 | 17,344 | 1.8% | 5.0 | ||||||
7 | Apache | 1 | 1 | 362,803 | 14,567 | 1.5% | 12.8 | ||||||
8 | Ovintiv USA (3) | 1 | 1 | 318,582 | 13,868 | 1.5% | 1.0 | ||||||
9 | Barings | 1 | 1 | 203,319 | 9,574 | 1.0% | 6.4 | ||||||
10 | Deloitte | 4 | 3 | 193,751 | 9,199 | 1.0% | 7.6 | ||||||
11 | McGuireWoods LLP | 2 | 2 | 176,498 | 8,553 | 0.9% | 16.2 | ||||||
12 | ADP | 1 | 1 | 225,000 | 8,151 | 0.9% | 2.0 | ||||||
13 | Wells Fargo | 5 | 3 | 159,114 | 7,905 | 0.8% | 3.7 | ||||||
14 | BlackRock | 1 | 1 | 131,656 | 7,898 | 0.8% | 10.2 | ||||||
15 | McKinsey & Company | 3 | 3 | 138,532 | 7,286 | 0.8% | 6.5 | ||||||
16 | Smurfit Westrock | 1 | 1 | 181,351 | 7,041 | 0.7% | 4.1 | ||||||
17 | Amgen | 1 | 1 | 163,169 | 6,980 | 0.7% | 2.6 | ||||||
18 | Rig Up | 1 | 1 | 93,210 | 6,698 | 0.7% | 2.3 | ||||||
19 | International Workplace Group | 4 | 4 | 123,625 | 6,554 | 0.7% | 6.1 | ||||||
20 | Time Warner Cable | 2 | 1 | 119,018 | 6,432 | 0.7% | 2.5 | ||||||
Total | 6,600,357 | $357,819 | 38.0% | 6.7 | |||||||||
(1) | In some cases, the actual tenant may be an affiliate of the entity shown, and the entity shown may not be a guarantor of the obligations of that tenant. | ||||||||||||
(2) | Annualized Rent represents the annualized cash rent including the tenant's share of estimated operating expenses, if applicable, paid by the tenant as of March 31, 2026. If the tenant was in a free rent period as of March 31, 2026, Annualized Rent represents the annualized contractual rent the tenant will pay in the first month it is required to pay full cash rent. | ||||||||||||
(3) | In the third quarter of 2025, the Company proactively entered into an early termination agreement with Ovintiv. Approximately 88% of Ovintiv’s premises is subleased and upon Ovintiv’s expiration the subtenants will become direct tenants. Each subtenant’s remaining lease term is included in the remaining lease term reflected for Ovintiv above. | ||||||||||||
Cousins Properties | 23 | Q1 2026 Supplemental Information |
TENANT INDUSTRY DIVERSIFICATION | ||
(1) Annualized Rent represents the annualized cash rent including the tenant's share of estimated operating expenses, if applicable, paid by the tenant as of
March 31, 2026. If the tenant was in a free rent period as of March 31, 2026, Annualized Rent represents the annualized contractual rent the tenant will pay
in the first month the tenant is required to pay full rent.
Note: Management uses SIC codes when available, along with their judgment, to determine tenant industry classification. This schedule includes leases that
have commenced. Leases that have been signed but have not commenced are excluded.
Cousins Properties | 24 | Q1 2026 Supplemental Information |
INVESTMENT ACTIVITY | ||
Completed Operating Property Acquisitions
Property | Type | Market | Company's Ownership Interest | Timing | Square Feet | Gross Purchase Price ($ in thousands) (1) | ||||||
2026 | ||||||||||||
300 South Tryon | Office | Charlotte | 100% | 1Q | 638,000 | $317,500 | ||||||
2025 | ||||||||||||
The Link | Office | Dallas | 100% | 3Q | 292,000 | 218,000 | ||||||
2024 | ||||||||||||
Proscenium | Office | Atlanta | 20% | 3Q | 525,000 | 83,250 | ||||||
Sail Tower | Office | Austin | 100% | 4Q | 804,000 | 521,800 | ||||||
Vantage South End | Office | Charlotte | 100% | 4Q | 639,000 | 328,500 | ||||||
2022 | ||||||||||||
Avalon (2) | Office | Atlanta | 100% | 2Q | 480,000 | 43,400 | ||||||
2021 | ||||||||||||
725 Ponce | Office | Atlanta | 100% | 3Q | 372,000 | 300,200 | ||||||
Heights Union | Office | Tampa | 100% | 4Q | 294,000 | 144,800 | ||||||
4,044,000 | $1,957,450 |
Completed Property Developments
Project | Type | Market | Company's Ownership Interest | Timing (3) | Square Feet | Total Project Cost ($ in thousands) (1) | ||||||
2026 | ||||||||||||
Neuhoff Commercial - Phase 1 | Mixed | Nashville | 50% | (4) | 450,000 | $306,000 | ||||||
Neuhoff Apartment | Residential | Nashville | 50% | 1Q | 454,000 | 217,000 | ||||||
2025 | ||||||||||||
Domain 9 | Office | Austin | 100% | 1Q | 338,000 | 147,000 | ||||||
2022 | ||||||||||||
300 Colorado | Office | Austin | 100% | 1Q | 369,000 | 193,000 | ||||||
100 Mill | Office | Phoenix | 90% | 4Q | 288,000 | 156,000 | ||||||
2021 | ||||||||||||
10000 Avalon (2) | Office | Atlanta | 90% | 1Q | 251,000 | 96,000 | ||||||
120 West Trinity | Mixed | Atlanta | 20% | 2Q | 353,000 | 89,000 | ||||||
Domain 10 | Office | Austin | 100% | 3Q | 300,000 | 111,000 | ||||||
2,803,000 | $1,315,000 |
(1) Except as otherwise noted, amounts represent total purchase prices, total project costs paid by the Company and, where applicable, its joint venture partner.
(2) Developed 8000 Avalon and 10000 Avalon as the majority partner in 90-10 joint ventures, HICO Avalon LLC and HICO Avalon II LLC, respectively. In 2022, we purchased the outside interest
of 10% in HICO Avalon LLC and HICO Avalon II LLC for $43 million in a transaction that valued the properties at $302 million.
(3) Represents timing of stabilization.
(4) While construction is substantially complete, this operating property has not yet reached stabilization.
Cousins Properties | 25 | Q1 2026 Supplemental Information |
INVESTMENT ACTIVITY | ||
Completed Operating Property Dispositions
Property | Type | Market | Company's Ownership Interest | Timing | Square Feet | Gross Sales Price ($ in thousands) | |||||||
2026 | |||||||||||||
Harborview Plaza | Office | Tampa | 100% | 1Q | 206,000 | $39,500 | |||||||
2022 | |||||||||||||
Carolina Square | Mixed | Charlotte | 50% | 3Q | 468,000 | 105,000 | (1) | ||||||
2021 | |||||||||||||
Burnett Plaza | Office | Fort Worth | 100% | 2Q | 1,023,000 | 137,500 | |||||||
One South at the Plaza | Office | Charlotte | 100% | 3Q | 891,000 | 271,500 | |||||||
Dimensional Place | Office | Charlotte | 50% | 3Q | 281,000 | 60,800 | (1) | ||||||
816 Congress | Office | Austin | 100% | 4Q | 435,000 | 174,000 | |||||||
3,304,000 | $788,300 |
(1) Amount represents proceeds, before debt and other adjustments, received by the Company for the sale of its unconsolidated interest in the joint venture to its partner.
Cousins Properties | 26 | Q1 2026 Supplemental Information |
DEVELOPMENT PIPELINE |
Project | Type | Market | Company's Ownership Interest | Construction Start Date | Square Feet/Units | Estimated Project Cost ($ in thousands) | Company's Share of Estimated Project Cost ($ in thousands) | Project Cost Incurred to Date ($ in thousands) | Company's Share of Project Cost Incurred to Date ($ in thousands) | Percent Leased | Initial Occupancy | Estimated Stabilization | ||||||||||||
The Company had no projects under active development as of March 31, 2026. | |
Cousins Properties | 27 | Q1 2026 Supplemental Information |
LAND INVENTORY | ||
Market | Company's Ownership Interest | Financial Statement Presentation | Total Developable Land (Acres) | ||||||
3354/3356 Peachtree | Atlanta | 95% | Consolidated | 3.2 | |||||
715 Ponce | Atlanta | 50% | Unconsolidated | 1.0 | |||||
887 West Peachtree | Atlanta | 100% | Consolidated | 1.6 | |||||
Domain Point 3 | Austin | 90% | Consolidated | 1.7 | |||||
Domain Central | Austin | 100% | Consolidated | 5.6 | |||||
South End Station | Charlotte | 100% | Consolidated | 3.4 | |||||
303 Tremont (1) | Charlotte | 100% | Consolidated | 2.4 | |||||
Legacy Union 2 & 3 | Dallas | 95% | Consolidated | 4.0 | |||||
Neuhoff Commercial - Phase II (2) | Nashville | 50% | Unconsolidated | 1.4 | |||||
Corporate Center 5 & 6 (3) | Tampa | 100% | Consolidated | 14.1 | |||||
Total | 38.4 | ||||||||
Total Cost Basis of Land ($ in thousands) | $234,286 | ||||||||
Company's Share of Cost Basis of Land ($ in thousands) | $191,742 | ||||||||
(1) | 303 Tremont is under contract for sale and is expected to close in the second half of 2026. |
(2) | The cost basis for the Neuhoff Commercial - Phase II land site of $73 million includes costs related to initial parking and infrastructure work completed during the construction of Phase I, of which the Company's share is 50%. |
(3) | Corporate Center 5 is controlled through a long-term ground lease. |
Cousins Properties | 28 | Q1 2026 Supplemental Information |
DEBT SCHEDULE (1) | ||
Company's Share of Debt Maturities and Principal Payments | ||||||||||||||||||||||||||
($ in thousands) | ||||||||||||||||||||||||||
Description (Interest Rate Base, if not fixed) | Company's Ownership Interest | Rate at End of Quarter (2) | Maturity Date (3) | 2026 | 2027 | 2028 | 2029 | 2030 | Thereafter | Total Principal | Original Issue Discount | Deferred Loan Costs | Total | |||||||||||||
Consolidated Debt | ||||||||||||||||||||||||||
Consolidated Debt - Floating Rate | ||||||||||||||||||||||||||
Term Loan, Unsecured (SOFR + 0.800%) (4) | 100% | 4.430% | 8/11/27 | $— | $100,000 | $— | $— | $— | $— | $100,000 | $— | $(83) | $99,917 | |||||||||||||
Term Loan, Unsecured (SOFR + 0.800%) (5) | 100% | 4.430% | 3/3/28 | — | — | 200,000 | — | — | — | 200,000 | — | (125) | 199,875 | |||||||||||||
Credit Facility, Unsecured (SOFR + 0.725%) (6) | 100% | 4.355% | 4/1/31 | — | — | — | — | — | 206,500 | 206,500 | — | — | 206,500 | |||||||||||||
Total Consolidated Floating Rate Debt | — | 100,000 | 200,000 | — | — | 206,500 | 506,500 | — | (208) | 506,292 | ||||||||||||||||
Consolidated Debt - Fixed Rate | ||||||||||||||||||||||||||
Colorado Tower | 100% | 3.450% | 9/1/26 | 100,463 | — | — | — | — | — | 100,463 | — | (29) | 100,434 | |||||||||||||
201 North Tryon | 100% | 3.370% | 10/1/26 | 117,939 | — | — | — | — | — | 117,939 | — | (25) | 117,914 | |||||||||||||
Privately Placed Senior Notes, Unsecured | 100% | 4.090% | 7/6/27 | — | 100,000 | — | — | — | — | 100,000 | — | (56) | 99,944 | |||||||||||||
Privately Placed Senior Notes, Unsecured | 100% | 3.780% | 7/6/27 | — | 125,000 | — | — | — | — | 125,000 | — | (78) | 124,922 | |||||||||||||
Term Loan, Unsecured (5) | 100% | 4.418% | 3/3/28 | — | — | 200,000 | — | — | — | 200,000 | — | (125) | 199,875 | |||||||||||||
Privately Placed Senior Notes, Unsecured | 100% | 3.860% | 7/6/28 | — | — | 250,000 | — | — | — | 250,000 | — | (254) | 249,746 | |||||||||||||
Privately Placed Senior Notes, Unsecured | 100% | 3.950% | 7/6/29 | — | — | — | 275,000 | — | — | 275,000 | — | (363) | 274,637 | |||||||||||||
Public Senior Notes, Unsecured (7) | 100% | 5.250% | 7/15/30 | — | — | — | — | 500,000 | — | 500,000 | (56) | (3,633) | 496,311 | |||||||||||||
Terminus (8) | 100% | 6.340% | 1/15/31 | — | — | — | — | — | 221,000 | 221,000 | — | (215) | 220,785 | |||||||||||||
Public Senior Notes, Unsecured (9) | 100% | 5.375% | 2/15/32 | — | — | — | — | — | 400,000 | 400,000 | (1,811) | (2,919) | 395,270 | |||||||||||||
Public Senior Notes, Unsecured (10) | 100% | 4.875% | 3/1/33 | — | — | — | — | — | 500,000 | 500,000 | (3,669) | (4,184) | 492,147 | |||||||||||||
Public Senior Notes, Unsecured (11) | 100% | 5.875% | 10/1/34 | — | — | — | — | — | 500,000 | 500,000 | (1,281) | (4,814) | 493,905 | |||||||||||||
Total Consolidated Fixed Rate Debt | 218,402 | 225,000 | 450,000 | 275,000 | 500,000 | 1,621,000 | 3,289,402 | (6,817) | (16,695) | 3,265,890 | ||||||||||||||||
Total Consolidated Debt | 218,402 | 325,000 | 650,000 | 275,000 | 500,000 | 1,827,500 | 3,795,902 | (6,817) | (16,903) | 3,772,182 | ||||||||||||||||
Unconsolidated Debt | ||||||||||||||||||||||||||
Unconsolidated Debt - Floating Rate | ||||||||||||||||||||||||||
Neuhoff (SOFR + 3.000%) (12) | 50% | 6.680% | 9/30/27 | — | 125,563 | — | — | — | — | 125,563 | — | (249) | 125,314 | |||||||||||||
. | ||||||||||||||||||||||||||
Unconsolidated Debt - Fixed Rate | ||||||||||||||||||||||||||
Medical Offices at Emory Hospital | 50% | 4.800% | 6/1/32 | — | — | — | — | — | 41,500 | 41,500 | — | (246) | 41,254 | |||||||||||||
Total Unconsolidated Debt | — | 125,563 | — | — | — | 41,500 | 167,063 | — | (495) | 166,568 | ||||||||||||||||
Total Debt | $218,402 | $450,563 | $650,000 | $275,000 | $500,000 | $1,869,000 | $3,962,965 | $(6,817) | $(17,398) | $3,938,750 | ||||||||||||||||
Total Maturities (13) | $215,159 | $450,563 | $650,000 | $275,000 | $500,000 | $1,869,000 | $3,959,722 | |||||||||||||||||||
% of Maturities | 5% | 11% | 16% | 7% | 13% | 48% | 100% | |||||||||||||||||||
Continued on next page
Cousins Properties | 29 | Q1 2026 Supplemental Information |
DEBT SCHEDULE (1) | ||
Credit Facility
$207M
Construction
Loan
$125M
Mortgage
$71
Unsecured
Senior Notes
$250M
Mortgage $42M
Term Loan
$100M
Credit Facility
$207M
Construction
Loan
$126M
Unsecured
Senior Notes
$400M
Unsecured
Senior Notes
Unsecured
Senior Notes
Unsecured
Senior Notes
Term Loan
$400M
Unsecured
Senior Notes
$225M
Unsecured
Senior Notes
Mortgages
$221M
Mortgages
Continued on next page
Cousins Properties | 30 | Q1 2026 Supplemental Information |
DEBT SCHEDULE (1) | ||
Floating and Fixed Rate Debt Analysis
Total Principal ($ in thousands) | Total Debt (%) | Weighted Average Interest Rate | Weighted Average Maturity (Years) (2) | |||||
Floating Rate Debt | $632,063 | 16% | 4.85% | 2.8 | ||||
Fixed Rate Debt | 3,330,902 | 84% | 4.90% | 4.7 | ||||
Total Debt | $3,962,965 | 100% | 4.89% | 4.4 |
(1) | All amounts are presented at Company share. |
(2) | Rates represent the current rates as of March 31, 2026, except for the term loans and credit facility which represent SOFR as of March 31, 2026, plus applicable spreads under the April 1, 2026 amendments. |
(3) | Maturity dates shown assume the Company exercises all extensions available as of the date of this report. |
(4) | The Company exercised the fourth of its initial four consecutive options to extend the maturity date of this term loan. This extension became effective on February 20, 2026, and extended the maturity date to August 19, 2026. The spread over SOFR at March 31, 2026, was 1.00%. In February of 2026, the Company paid $150 million towards the principal of the term loan. Subsequent to quarter end, on April 1, the Company entered into the fourth amendment of the term loan agreement, which granted two additional 180 day extension options, extending the final maturity date to August 11, 2027, and updated the spread over SOFR of 1.00% to 0.80%. |
(5) | The Company exercised the third of its initial four consecutive options to extend the maturity date of this term loan. This extension became effective March 3, 2026, and extended the maturity date to September 3, 2026. One additional six month extension option remains unexercised. At the time of the third extension the Company elected six month Term SOFR +0.85% for $200 million of the debt outstanding, fixing the underlying SOFR interest rate at 3.618% through September 3, 2026. As of March 31, 2026, the spread over SOFR of the remaining $200 million of the term loan was 0.85%. Subsequent to quarter end, on April 1, 2026, we entered into second amendment to the delayed draw term loan, which granted two additional six month extension options, extending the final maturity date to March 3, 2028, and reducing the spread over SOFR of 0.850% to the spread over SOFR +0.800%. |
(6) | As of March 31, 2026, the spread over SOFR was 0.775% and the Company had the ability to borrow an additional $793.5 million. Subsequent to quarter end, on April 1, 2026, the Company entered into the sixth amendment to the Credit Facility, which increased the facility's capacity to $1.2 billion and extended the maturity date from April 30, 2027 to April 1, 2031. Additionally, the amendment reduced the spread over SOFR of 0.775% to the spread over SOFR of 0.725%. |
(7) | This note has a coupon of 5.25% with an effective rate of 5.251% including the original issue discount. |
(8) | Represents $123.0 million and $98.0 million non-cross collateralized mortgages secured by the Terminus 100 and Terminus 200 buildings, respectively. |
(9) | This note has a coupon of 5.375% with an effective rate of 5.464% including the original issue discount. |
(10) | This note has a coupon of 4.875% with an effective rate of 5.001% including the original issue discount. |
(11) | This note has a coupon of 5.875% with an effective rate of 5.912% including the original issue discount. |
(12) | The Company's share of the total borrowing capacity of the construction loan is approximately $136.8 million. The maturity date of the construction loan is September 30, 2026, and the spread in excess of SOFR is 3.00%. The joint venture has an option to extend the maturity date an additional 12 months, subject to certain conditions. |
(13) | Maturities include principal payments due at the maturity date. Maturities do not include scheduled principal payments due prior to the maturity date. |
Cousins Properties | 31 | Q1 2026 Supplemental Information |
JOINT VENTURE INFORMATION (1) |
Joint Venture | Property | Cash Flows to Cousins (2) | Options | |||
Consolidated: | ||||||
HICO 100 Mill LLC | 100 Mill | 90% of cash flows until return of contributed capital to partners; portions of cash amounts received in excess of contributed capital are paid to our partner as a promote. | Cousins can trigger a sale process, subject to a right of first offer that can be exercised by partner. | |||
TR Domain Point LLC | Domain Point | Preferred return on preferred equity contribution, then 96.5% of remaining cash flows. | Partner has put options under various circumstances. | |||
Unconsolidated: | ||||||
AMCO 120 WT Holdings LLC | 120 West Trinity | 20% of cash flows. | Cousins or partner can trigger a buyout upon which Cousins would receive the office component, and partner would receive the multifamily component, with a net settlement at a then agreed upon value. | |||
Crawford Long-CPI, LLC | Medical Offices at Emory Hospital | 50% of cash flows. | Cousins can put its interest to partner, or partner can call Cousins' interest, at a value determined by appraisal. | |||
Neuhoff Holdings LLC | Neuhoff | 50% of cash flows until return of contributed capital to partners; portions of cash amounts received in excess of contributed capital to equity partners are paid to development partner as a promote. | Cousins or its equity partner can trigger a sale process, subject to a right of first offer that can be exercised by the non-triggering party. | |||
TL CO Proscenium JV LLC | Proscenium | 20% of cash flows. | Cousins' equity partner can trigger a sale process, subject to a right of first offer that can be exercised by Cousins. Additionally, Cousins has a put option under various circumstances. |
(1) | This schedule only contains information related to joint ventures that hold an ownership interest in operating office buildings or projects under active development. |
(2) | Each respective joint venture agreement may contain additional terms that affect the distribution of operating cash flows and capital transaction proceeds that are not yet effective, including the distribution of promoted interest. |
Cousins Properties | 32 | Q1 2026 Supplemental Information |
NON-GAAP FINANCIAL MEASURES - CALCULATIONS AND RECONCILIATIONS | ||
2024 | 2025 1st | 2025 2nd | 2025 3rd | 2025 4th | 2025 | 2026 1st | |
FFO and EBITDAre | |||||||
Net income (loss) available to common stockholders | $45,962 | $20,897 | $14,483 | $8,590 | $(3,467) | $40,503 | $(24,856) |
Depreciation and amortization of real estate assets: | |||||||
Consolidated properties | 364,584 | 101,996 | 100,769 | 105,152 | 106,954 | 414,871 | 108,267 |
Share of unconsolidated joint ventures | 4,745 | 2,212 | 2,489 | 3,034 | 3,004 | 10,739 | 3,053 |
Partners' share of real estate depreciation | (1,106) | (274) | (250) | (241) | (240) | (1,005) | (240) |
Operating property impairment | — | — | — | — | 13,286 | 13,286 | 36,600 |
Loss (gain) on depreciated property transactions: | |||||||
Consolidated properties | (101) | — | — | — | — | — | 47 |
Non-controlling interest related to unitholders | 8 | 3 | 3 | 1 | — | 7 | (4) |
FFO (1) | 414,092 | 124,834 | 117,494 | 116,536 | 119,537 | 478,401 | 122,867 |
Interest Expense | 126,960 | 38,763 | 40,753 | 44,327 | 45,106 | 168,949 | 47,834 |
Non-Real Estate Depreciation and Amortization | 461 | 117 | 121 | 121 | 130 | 489 | 140 |
EBITDAre (1) | 541,513 | 163,714 | 158,368 | 160,984 | 164,773 | 647,839 | 170,841 |
FFO and Net Operating Income from Unconsolidated Joint Ventures | |||||||
Income (loss) from Unconsolidated Joint Ventures | (2,796) | (1,883) | (1,587) | (2,682) | (2,007) | (8,159) | (2,642) |
Depreciation and Amortization of Real Estate Assets | 4,745 | 2,212 | 2,489 | 3,034 | 3,004 | 10,739 | 3,053 |
FFO - Unconsolidated Joint Ventures | 1,949 | 329 | 902 | 352 | 997 | 2,580 | 411 |
Interest Expense | 4,484 | 1,989 | 2,239 | 2,830 | 2,650 | 9,708 | 2,733 |
Other Expense | 316 | (79) | 62 | 99 | 102 | 184 | 259 |
Other Income | (132) | (16) | (38) | (25) | (44) | (123) | (32) |
Net Operating Income - Unconsolidated Joint Ventures | 6,617 | 2,223 | 3,165 | 3,256 | 3,705 | 12,349 | 3,371 |
Market Capitalization | |||||||
Common Stock Price Per Share at Period End | $30.64 | $29.50 | $30.03 | $28.94 | $25.78 | $25.78 | $22.57 |
Number of Common Stock/Units Outstanding at Period End | 167,685 | 167,933 | 167,992 | 167,990 | 168,007 | 168,007 | 164,566 |
Equity Market Capitalization | 5,137,868 | 4,954,024 | 5,044,800 | 4,861,631 | 4,331,220 | 4,331,220 | 3,714,255 |
Consolidated Debt | 3,095,666 | 3,020,741 | 3,476,761 | 3,309,383 | 3,340,815 | 3,340,815 | 3,772,182 |
Share of Unconsolidated Debt | 178,722 | 182,735 | 183,847 | 165,737 | 166,205 | 166,205 | 166,568 |
Debt (1) | 3,274,388 | 3,203,476 | 3,660,608 | 3,475,120 | 3,507,020 | 3,507,020 | 3,938,750 |
Total Market Capitalization | 8,412,256 | 8,157,500 | 8,705,408 | 8,336,751 | 7,838,240 | 7,838,240 | 7,653,005 |
Credit Ratios | |||||||
Debt (1) | 3,274,388 | 3,203,476 | 3,660,608 | 3,475,120 | 3,507,020 | 3,507,020 | 3,938,750 |
Less: Cash and Cash Equivalents | (7,349) | (5,330) | (416,840) | (4,675) | (5,720) | (5,720) | (6,296) |
Less: Share of Unconsolidated Cash and Cash Equivalents (1) | (6,821) | (6,332) | (4,448) | (6,484) | (5,633) | (5,633) | (6,333) |
Net Debt (1) | 3,260,218 | 3,191,814 | 3,239,320 | 3,463,961 | 3,495,667 | 3,495,667 | 3,926,121 |
Total Market Capitalization | 8,412,256 | 8,157,500 | 8,705,408 | 8,336,751 | 7,838,240 | 7,838,240 | 7,653,005 |
Net Debt / Total Market Capitalization | 38.8% | 39.1% | 37.2% | 41.6% | 44.6% | 44.6% | 51.3% |
Continued on next page | |||||||
Cousins Properties | 33 | Q1 2026 Supplemental Information |
NON-GAAP FINANCIAL MEASURES - CALCULATIONS AND RECONCILIATIONS | ||
2024 | 2025 1st | 2025 2nd | 2025 3rd | 2025 4th | 2025 | 2026 1st | |
Total Assets - Consolidated | 8,802,146 | 8,663,360 | 9,051,863 | 8,900,481 | 8,890,132 | 8,890,132 | 9,087,843 |
Accumulated Depreciation - Consolidated | 1,821,559 | 1,893,215 | 1,982,700 | 2,045,711 | 2,120,930 | 2,120,930 | 2,164,229 |
Undepreciated Assets - Unconsolidated (1) | 356,091 | 363,789 | 368,322 | 375,572 | 376,850 | 376,850 | 378,996 |
Less: Investment in Unconsolidated Joint Ventures | (185,478) | (191,505) | (192,420) | (215,507) | (215,301) | (215,301) | (213,988) |
Total Undepreciated Assets (1) | 10,794,318 | 10,728,859 | 11,210,465 | 11,106,257 | 11,172,611 | 11,172,611 | 11,417,080 |
Net Debt (1) | 3,260,218 | 3,191,814 | 3,239,320 | 3,463,961 | 3,495,667 | 3,495,667 | 3,926,121 |
Net Debt / Total Undepreciated Assets (1) | 30.2% | 29.7% | 28.9% | 31.2% | 31.3% | 31.3% | 34.4% |
Coverage Ratios (1) | |||||||
Interest Expense | 126,960 | 38,763 | 40,753 | 44,327 | 45,106 | 168,949 | 47,834 |
Scheduled Principal Payments | 8,222 | 1,667 | 1,681 | 1,696 | 1,710 | 6,754 | 1,725 |
Fixed Charges | 135,182 | 40,430 | 42,434 | 46,023 | 46,816 | 175,703 | 49,559 |
EBITDAre | 541,513 | 163,714 | 158,368 | 160,984 | 164,773 | 647,839 | 170,841 |
EBITDAre / Fixed Charges (1) | 4.01 | 4.05 | 3.73 | 3.50 | 3.52 | 3.69 | 3.45 |
Net Debt | 3,260,218 | 3,191,814 | 3,239,320 | 3,463,961 | 3,495,667 | 3,495,667 | 3,926,121 |
Annualized EBITDAre (2) | 632,139 | 654,856 | 633,472 | 643,936 | 659,092 | 659,092 | 694,096 |
Net Debt / Annualized EBITDAre | 5.16 | 4.87 | 5.11 | 5.38 | 5.30 | 5.30 | 5.66 |
Dividend Information | |||||||
Common Dividends | 199,679 | 53,732 | 53,746 | 53,746 | 53,754 | 214,978 | 52,646 |
FFO | 414,092 | 124,834 | 117,494 | 116,536 | 119,537 | 478,401 | 122,867 |
FFO Payout Ratio | 48.2% | 43.0% | 45.7% | 46.1% | 45.0% | 44.9% | 42.8% |
Operations Ratio | |||||||
Total Undepreciated Assets (1) | 10,794,318 | 10,728,859 | 11,210,465 | 11,106,257 | 11,172,611 | 11,172,611 | 11,417,080 |
General and Administrative Expenses | 36,566 | 10,709 | 9,738 | 9,510 | 8,685 | 38,642 | 11,840 |
Annualized General and Administrative Expenses (2) / Total Undepreciated Assets | 0.34% | 0.40% | 0.35% | 0.34% | 0.31% | 0.31% | 0.41% |
Continued on next page | |||||||
Cousins Properties | 34 | Q1 2026 Supplemental Information |
NON-GAAP FINANCIAL MEASURES - CALCULATIONS AND RECONCILIATIONS | ||
2024 | 2025 1st | 2025 2nd | 2025 3rd | 2025 4th | 2025 | 2026 1st | |
Net income (loss) available to common stockholders | $45,962 | $20,897 | $14,483 | $8,590 | $(3,467) | $40,503 | $(24,856) |
Depreciation and amortization of real estate assets | 368,223 | 103,934 | 103,008 | 107,945 | 109,718 | 424,605 | 111,080 |
Loss on depreciated property transactions | (101) | — | — | — | — | — | 47 |
Operating property impairment | — | — | — | — | 13,286 | 13,286 | 36,600 |
Non-controlling interest related to unitholders | 8 | 3 | 3 | 1 | — | 7 | (4) |
FFO (1) | 414,092 | 124,834 | 117,494 | 116,536 | 119,537 | 478,401 | 122,867 |
Non-Cash Debt Amortization | 4,068 | 1,056 | 997 | 1,290 | 1,188 | 4,531 | 1,229 |
Non-Cash Stock-Based Compensation | 14,782 | 5,993 | 3,746 | 3,379 | 3,356 | 16,474 | 6,013 |
Non-Real Estate Depreciation and Amortization | 461 | 117 | 121 | 121 | 130 | 489 | 140 |
Lease Inducement Amortization | 2,169 | 531 | 267 | 938 | 650 | 2,386 | 431 |
Straight-Line Rent Ground Leases | 470 | 118 | 118 | 72 | 100 | 408 | 99 |
Above and Below Market Ground Rent | 240 | 52 | 53 | 52 | 125 | 282 | 71 |
Deferred Income - Tenant Improvements | (28,598) | (8,472) | (8,947) | (9,147) | (9,353) | (35,919) | (9,522) |
Above and Below Market Rents, Net | (6,167) | (2,845) | (2,828) | (3,422) | (3,514) | (12,609) | (4,104) |
Second Generation Capital Expenditures (CAPEX) | (116,093) | (33,281) | (28,636) | (29,981) | (47,457) | (139,355) | (26,625) |
Straight-Line Rental Revenue | (24,508) | (12,477) | (11,283) | (9,424) | (6,117) | (39,301) | (9,544) |
Land and Related Predevelopment Costs Impairment | — | — | — | — | 1,034 | 1,034 | — |
Loss on Sales of Undepreciated Investment Properties | 3 | — | — | — | — | — | — |
FAD (1) | 260,919 | 75,626 | 71,102 | 70,414 | 59,679 | 276,821 | 81,055 |
Weighted Average Shares - Diluted | 154,015 | 168,593 | 168,765 | 168,738 | 168,770 | 168,716 | 167,681 |
FAD per share | $1.69 | $0.45 | $0.42 | $0.42 | $0.35 | $1.64 | $0.48 |
Common Dividends on outstanding shares | 199,679 | 53,732 | 53,746 | 53,746 | 53,754 | 214,978 | 52,646 |
Common Dividends per share | $1.28 | $0.32 | $0.32 | $0.32 | $0.32 | $1.28 | $0.32 |
FAD Payout Ratio | 76.5% | 71.0% | 75.6% | 76.3% | 90.1% | 77.7% | 65.0% |
2nd Generation CAPEX | |||||||
Second Generation Leasing Related Costs | 86,829 | 24,789 | 21,475 | 18,944 | 36,482 | 101,690 | 16,863 |
Second Generation Building Improvements | 29,264 | 8,492 | 7,161 | 11,037 | 10,975 | 37,665 | 9,762 |
116,093 | 33,281 | 28,636 | 29,981 | 47,457 | 139,355 | 26,625 | |
(1) Includes the Company's share of unconsolidated joint ventures. These amounts are derived from the amounts in the categories indicated that are recorded at the joint venture multiplied by the Company's ownership interest. The Company does not control the operations of the unconsolidated joint ventures but believes that including these amounts in the categories indicated is meaningful to investors and analysts. | |||||||
(2) Amounts represent most recent quarter annualized with the exception of annualized EBITDAre, which includes adjustments to reflect a full year of NOI from operating properties acquired during the most recent quarter. | |||||||
Note: Amounts may differ slightly from other schedules contained herein due to rounding. | |||||||
Cousins Properties | 35 | Q1 2026 Supplemental Information |
NON-GAAP FINANCIAL MEASURES - CALCULATIONS AND RECONCILIATIONS | ||
FUNDS FROM OPERATIONS
(in thousands, except per share amounts) | |||||||||||
Three Months Ended March 31, | |||||||||||
2026 | 2025 | ||||||||||
Dollars | Weighted Average Common Shares | Per Share Amount | Dollars | Weighted Average Common Shares | Per Share Amount | ||||||
Net Income (Loss) Available to Common Stockholders | $(24,856) | 166,399 | $(0.15) | $20,897 | 167,809 | $0.12 | |||||
Noncontrolling interest related to unitholders | — | — | — | 3 | 25 | — | |||||
Conversion of unvested restricted stock units | — | — | — | — | 759 | — | |||||
Net Income (Loss) — Diluted | (24,856) | 166,399 | (0.15) | 20,900 | 168,593 | 0.12 | |||||
Noncontrolling interest related to unitholders | (4) | 25 | — | — | — | — | |||||
Conversion of unvested restricted stock units | — | 846 | — | — | — | — | |||||
Unvested restricted stock | — | 411 | — | — | — | — | |||||
Depreciation and amortization of real estate assets: | |||||||||||
Consolidated properties | 108,267 | — | 0.64 | 101,996 | — | 0.61 | |||||
Share of unconsolidated joint ventures | 3,053 | — | 0.02 | 2,212 | — | 0.01 | |||||
Partners' share of real estate depreciation | (240) | — | — | (274) | — | — | |||||
Loss on investment property transactions | 47 | — | — | — | — | — | |||||
Operating property impairment | 36,600 | — | 0.22 | — | — | — | |||||
Funds From Operations | $122,867 | 167,681 | $0.73 | $124,834 | 168,593 | $0.74 | |||||
The tables above show FFO and the related reconciliation from Net Income Available to Common Stockholders for Cousins Properties Incorporated and Subsidiaries.
See page 39 for definition of FFO.
Cousins Properties | 36 | Q1 2026 Supplemental Information |
NON-GAAP FINANCIAL MEASURES - CALCULATIONS AND RECONCILIATIONS | ||
($ in thousands) | |||
Three Months Ended | |||
Net Operating Income | March 31, 2026 | March 31, 2025 | |
Net income (loss) | $(24,670) | $21,093 | |
Net operating income from unconsolidated joint ventures | 3,371 | 2,223 | |
Fee income | (1,245) | (496) | |
Termination fee income | (1,831) | (2,866) | |
Other income | (756) | (6,805) | |
Reimbursed expenses | 120 | 177 | |
General and administrative expenses | 11,840 | 10,709 | |
Interest expense | 45,101 | 36,774 | |
Operating property impairment | 36,600 | — | |
Depreciation and amortization | 108,406 | 102,114 | |
Other expenses | 438 | 422 | |
Loss from unconsolidated joint ventures | 2,642 | 1,883 | |
Loss on investment property transactions | 47 | — | |
Net Operating Income | 180,063 | 165,228 | |
Less: | |||
Partners' share of NOI from consolidated joint ventures | (453) | (470) | |
Cousins' share of NOI | $179,610 | $164,758 | |
Net Operating Income | $180,063 | $165,228 | |
Non-cash income | (22,764) | (23,752) | |
Non-cash expense | 227 | 273 | |
Cash-Basis Net Operating Income | $157,526 | $141,749 | |
Net Operating Income | |||
Same Property | $161,411 | $158,745 | |
Non-Same Property | 18,652 | 6,483 | |
$180,063 | $165,228 | ||
Cash-Basis Net Operating Income | |||
Same Property | $144,108 | $136,586 | |
Non-Same Property | 13,418 | 5,163 | |
$157,526 | $141,749 | ||
Cousins Properties | 37 | Q1 2026 Supplemental Information |
NON-GAAP FINANCIAL MEASURES - CALCULATIONS AND RECONCILIATIONS | ||
RECONCILIATION OF 2026 PROJECTED NET INCOME AVAILABLE
TO COMMON STOCKHOLDERS TO 2026 PROJECTED FFO
Full Year 2026 Guidance | |||||||||
(in thousands, except per share amounts) | |||||||||
Low | High | ||||||||
Dollars | Per Share Amount (1) | Dollars | Per Share Amount (1) | ||||||
Net Income Available to Common Stockholders | $3,103 | $0.02 | $16,493 | $0.10 | |||||
Add: Noncontrolling interest related to unitholders | 4 | — | 4 | — | |||||
Net Loss | 3,107 | 0.02 | 16,497 | 0.10 | |||||
Add: Depreciation and amortization of real estate assets | 445,645 | 2.66 | 445,645 | 2.66 | |||||
Add: Operating property impairment | 36,600 | 0.22 | 36,600 | 0.22 | |||||
Add: Loss on investment property transactions | 47 | — | 47 | — | |||||
Funds From Operations | $485,399 | $2.90 | $498,789 | $2.98 | |||||
(1) Calculated based on projected weighted average shares outstanding of 167.4 million. | |||||||||
R2 Weight Average Shares | 167,379 | 166,185.95 | |||||||
Cousins Properties | 38 | Q1 2026 Supplemental Information |
NON-GAAP FINANCIAL MEASURES - DEFINITIONS | ||
The Company uses non-GAAP financial measures in its filings and other public
disclosures. The following lists non-GAAP financial measures that the Company
commonly uses, a description for each measure, the reasons that management
believes the measure is useful to investors and, if material, additional uses of the
measure by management of the Company.
“Cash-Basis Net Operating Income” represents Net Operating Income excluding
straight-line rents, amortization of lease inducements, amortization of acquired above
and below market rents, and non-cash ground lease expense.
“EBITDAre” is a supplemental operating performance measure used in the real
estate industry. The Company calculates EBITDAre in accordance with the Nareit
definition, which is net income (loss) available to common stockholders (computed in
accordance with GAAP) plus interest expense, income tax expense, depreciation and
amortization, losses (gains) on the disposition of depreciated property, and
impairment of depreciated property. All additions include the Company's share of
unconsolidated joint ventures. Management believes that EBITDAre provides analysts
and investors with uniform and appropriate information to use in various ratios that
evaluate the Company's level of debt.
"Funds Available for Distribution” (“FAD”) represents FFO adjusted to exclude
the effect of non-cash items and transaction costs and include deductions for second
generation Capital Expenditures ("CAPEX"). Management believes that FAD provides
analysts and investors with information that assists in the comparability of the
Company's dividend policy with other real estate companies.
“Funds From Operations” (“FFO”) is a supplemental operating performance
measure used in the real estate industry. The Company calculates FFO in accordance
with the Nareit definition: net income (loss) available to common stockholders
(computed in accordance with GAAP), excluding depreciation and amortization
related to real estate, gains and losses from sales of depreciable property, gains and
losses from changes in control, impairment of depreciable real estate and after
adjustments for unconsolidated partnerships and joint ventures to reflect FFO on the
same basis. FFO is used by industry analysts and investors as a supplemental measure
of an equity REIT's operating performance. Historical cost accounting for real estate
assets implicitly assumes that the value of real estate assets diminishes predictably
over time. Since real estate values instead have historically risen or fallen with market
conditions, many industry investors and analysts have considered presentation of
operating results for real estate companies that use historical cost accounting to be
insufficient by themselves. Thus, Nareit created FFO as a supplemental measure of
REIT operating performance that excludes historical cost depreciation, among other
items, from GAAP net income. Management believes that the use of FFO, combined
with the required primary GAAP presentations, has been fundamentally beneficial,
improving the understanding of operating results of REITs among the investing public
and making comparisons of REIT operating results more meaningful. Company
management evaluates operating performance in part based on FFO. Additionally,
the Company uses FFO and FFO per share, along with other measures, as a
performance measure for incentive compensation to its officers and other key
employees.
“Net Debt” represents the Company's consolidated debt plus the Company's
share of unconsolidated debt, less consolidated cash and cash equivalents and our
share of unconsolidated cash and cash equivalents. The Company believes excluding
cash and cash equivalents from total debt provides an estimate of the net contractual
amount of borrowed capital to be repaid, which it believes is a beneficial disclosure to
investors and analysts.
“Net Operating Income” ("NOI") is used by industry analysts, investors and
Company management to measure operating performance of the Company's
properties. NOI, which is rental property revenues (excluding termination fee income)
less rental property operating expenses, excludes certain components from net
income in order to provide results that are more closely related to a property's results
of operations. Certain items, such as interest expense, while included in FFO and net
income, do not affect the operating performance of a real estate asset and are often
incurred at the corporate level as opposed to the property level. As a result,
management uses only those income and expense items that are incurred at the
property level to evaluate a property's performance. Depreciation, amortization,
gains or losses on sales of depreciated investment assets, and impairment are also
excluded from NOI for the reasons described under FFO.
“Same Property Net Operating Income” represents Net Operating Income or
Cash-Basis Net Operating Income for those office properties that were stabilized and
owned by the Company for the entirety of all comparable reporting periods
presented. Same Property Net Operating Income or Cash-Basis Same Property Net
Operating Income allows analysts, investors, and management to analyze continuing
operations and evaluate the growth trend of the Company's portfolio.
“Second Generation Tenant Improvements and Leasing Costs and Building
CAPEX” is used in the valuation and analysis of real estate. Because the Company
develops and acquires properties, in addition to operating existing properties, its
property acquisition and development expenditures included in the Statements of
Cash Flows includes both initial costs associated with developing and acquiring
investment assets and those expenditures necessary for operating and maintaining
existing properties at historic performance levels. The latter costs are referred to as
second generation costs and are useful in evaluating the economic performance of
the asset and in valuing the asset. Accordingly, the Company discloses the portion of
its property acquisition and development expenditures that pertain to second
generation space in its operating properties. The Company excludes from second
generation costs amounts incurred to lease vacant space in newly acquired buildings,
leasing costs for spaces that have been vacant for one year or more, building
improvements on newly acquired buildings that management identifies as necessary
to bring the building to the Company's operational standards, and building
improvements associated with properties identified as under redevelopment or
repositioning. In addition, the Company excludes building improvements intended to
attract tenants to increase revenues and/or occupancy rates.