☒ANNUAL REPORT PURSUANT TO SECTION 13 OR 15(d) OF THE SECURITIES EXCHANGE ACT OF 1934
For the fiscal year ended: December 31, 2025
☐TRANSITION REPORT PURSUANT TO SECTION 13 OR 15(d) OF THE SECURITIES EXCHANGE ACT OF 1934
For the transition period from ________ to _________ .
Commission file number 1-1657
CRANE NXT, CO.
(Exact name of Registrant as specified in its charter)
Delaware
88-0706021
State of or other jurisdiction of incorporation or organization:
(I.R.S. Employer identification No.)
950 Winter Street 4th Floor North
Waltham
MA
02451
(Address of principal executive offices)
(Zip Code)
Registrant’s telephone number, including area code: (781) 755-6868
Securities registered pursuant to Section 12(b) of the Act:
Title of each class
Trading Symbol
Name of each exchange on which registered
Common Stock, par value $1.00
CXT
New York Stock Exchange
Securities registered pursuant to Section 12(g) of the Act:
None
Indicate by check mark if the registrant is a well-known seasoned issuer, as defined in Rule 405 of the Securities Act Yes ☒ No ☐
Indicate by check mark if the registrant is not required to file reports pursuant to Section 13 or Section 15 (d) of the Act
Yes ☐ No ☒
Indicate by check mark whether the registrant (1) has filed all reports required to be filed by Section 13 or 15(d) of the Securities Exchange Act of 1934 during the preceding 12 months (or for such shorter period that the registrant was required to file such reports), and (2) has been subject to such filing requirements for the past 90 days.
Yes ☒ No ☐
Indicate by check mark whether the registrant has submitted electronically every Interactive Data File required to be submitted pursuant to Rule 405 of Regulation S-T (§232.405 of this chapter) during the preceding 12 months (or for such shorter period that the registrant was required to submit such files).
Yes ☒ No ☐
Indicate by check mark whether the registrant is a large accelerated filer, an accelerated filer, a non-accelerated filer, a smaller reporting company, or an emerging growth company. See the definitions of “large accelerated filer”, “accelerated filer”, “non-accelerated filer,”, “smaller reporting company” and "emerging growth company" in Rule 12b-2 of the Exchange Act).:
(check one):
Large accelerated filer
☒
Accelerated filer
☐
Non-accelerated filer
☐
Smaller reporting company
☐
Emerging growth company
☐
If an emerging growth company, indicate by check mark if the registrant has elected not to use the extended transition period for complying with any new or revised financial accounting standards provided pursuant to Section 13(a) of the Exchange Act. ☐
If an emerging growth company, indicate by check mark if the registrant has elected not to use the extended transition period for complying with any new or revised financial accounting standards provided pursuant to Section 13(a) of the Exchange Act. ☐
Indicate by check mark whether the Registrant has filed a report on and attestation to its management’s assessment of the effectiveness of its internal control over financial reporting under Section 404(b) of the Sarbanes-Oxley Act (15 U.S.C. 7262(b)) by the registered public accounting firm that prepared or issued its audit report. ☒
If securities are registered pursuant to Section 12(b) of the Act, indicate by check mark whether the financial statements of the registrant included in the filing reflect the correction of an error to previously issued financial statements. ☐
Indicate by check mark whether any of those error corrections are restatements that required a recovery analysis of incentive-based compensation received by any of the registrant’s executive officers during the relevant recovery period pursuant to §240.10D-1(b). ☐
Indicate by check mark whether the registrant is a shell company (as defined in Rule 12b-2 of the Exchange Act). Yes ☐ No ☒
Based on the closing stock price of $53.90 on June 30, 2025, the last business day of the registrant’s most recently completed second fiscal quarter, the aggregate market value of the voting common equity held by non-affiliates of the registrant was $2,639,200,410.
The number of shares outstanding of the registrant’s common stock, par value $1.00, was 57,443,573 at January 31, 2026.
DOCUMENTS INCORPORATED BY REFERENCE
Portions of the registrant's Proxy Statement for the 2025 Annual Meeting of Stockholders are incorporated herein by reference in Part III of this Annual Report on Form 10-K to the extent stated herein. Such proxy statement will be filed with the Securities and Exchange Commission within 120 days of the registrant's fiscal year ended December 31, 2025.
This Annual Report on Form 10-K contains information about Crane NXT, Co., some of which includes “forward-looking statements” within the meaning of the Private Securities Litigation Reform Act of 1995. Forward-looking statements are statements other than historical information or statements about our current condition. You can identify forward-looking statements by the use of terms such as: “intends,” “believes,” “contemplates,” “expects,” “may,” “plans,” “seeks,” “will,” “could,” “should,” “would,” or “anticipates,” other similar phrases, or the negatives of these terms. Any forward-looking statement speaks only as of the date of this report, and we undertake no obligation to update any forward-looking statement, whether as a result of new information, future events or otherwise. You are advised, however, also to consult any further disclosures we make on related subjects in our reports to the Securities and Exchange Commission.
We have based the forward-looking statements relating to our operations on our current expectations, estimates and projections about us and the markets we serve. We caution you that these statements are not guarantees of future performance and involve risks and uncertainties. These statements should be considered in conjunction with the discussion in Part I, the information set forth under Item 1A, “Risk Factors” and with the discussion of the business included in Part II, Item 7, “Management’s Discussion and Analysis of Financial Condition and Results of Operations.” We have based many of these forward-looking statements on assumptions about future events that may prove to be inaccurate. Accordingly, our actual outcomes and results may differ materially from what we have expressed or forecast in the forward-looking statements. Any differences could result from a variety of factors, including the following:
•Macroeconomic fluctuations may harm our business, results of operations and stock price;
•Demand for our products is variable and subject to factors beyond our control, any of which could adversely affect our financial condition, results of operations or cash flow;
•We conduct a substantial portion of our business outside the U.S. and face risks inherent in non-domestic operations, including the risk of tariffs and other trade measures by the U.S. and other countries;
•Information systems and technology networks failures and breaches in data security, personally identifiable and other information, non-compliance with our contractual or other legal obligations regarding such information, or a violation of our privacy and security policies with respect to such information, could adversely affect us;
•We may be unable to identify or to complete acquisitions, or to successfully integrate the businesses we acquire;
•Fluctuation in the prices of, or our ability to source, our components and raw materials, and delays in the distribution of our products could adversely affect our results of operations;
•We compete with other industrial technology businesses for employees in the countries in which we operate, and we may not be able to retain our personnel or hire and retain additional personnel needed for us to sustain and grow our business as planned;
•We may be unable to successfully develop and introduce new products, which would limit our ability to grow and maintain our competitive position and adversely affect our financial condition, results of operations and cash flow;
•Our businesses are subject to governmental regulation; failure to comply with those regulations, as well as changes in those regulations, could adversely affect our financial condition, results of operations, cash flows and reputation;
•Our business could be harmed if we are unable to protect our intellectual property;
•Our operations expose us to the risk of litigation, claims and investigations, including those related to product liability and warranties, and employee, commercial, intellectual property and environmental matters, that could adversely affect our financial condition, results of operations, cash flows and reputation. We may not have sufficient insurance coverage or indemnification rights to cover such claims;
•We may be unable to improve productivity, reduce costs and align manufacturing capacity with customer demand;
•We face significant competition which may adversely impact our financial condition, results of operations, and cash flows in the future;
•Additional tax expense or exposures could adversely affect our financial condition, results of operations and cash flows;
•Our future results of operations and financial condition could be adversely impacted by intangible asset impairment charges;
3
•If our internal controls are found to be ineffective, our financial results or our stock price may be adversely affected; and
•We are subject to risks related to the Separation that could negatively impact our results including not obtaining the intended tax treatment of the Separation transaction, failure of Crane Company to perform under the various transaction agreements and actual or potential conflicts of interest with Crane Company.
While the list of factors presented here and elsewhere in this report is considered representative, no such list should be considered to be a complete statement of all potential risks and uncertainties. Unlisted factors may present significant additional obstacles to the realization of forward-looking statements.
4
Part I
References herein to “Crane NXT,” “we,” “us” and “our” refer to Crane NXT, Co. and its subsidiaries, including when Crane NXT, Co. was named “Crane Holdings, Co.” unless the context implies otherwise. References to the “Business” refer to our business, including prior to the Separation (as defined herein) when it was a business of Crane Holdings, Co. References herein to “Holdings” refer to Crane Holdings, Co. and its subsidiaries prior to the consummation of the Separation unless the context implies otherwise. Amounts in the following discussion are presented in millions, except employee, square feet, number of properties, share and per share data, or unless otherwise stated.
5
Information about our Executive Officers
Name
Position
Business Experience
Age
Executive Officer Since
Aaron W. Saak
President and Chief Executive Officer
President and Chief Executive Officer of Crane NXT since November 2022. President and Chief Executive Officer, Mobility Solutions at Vontier Corporation (a global industrial technology company) from June 2022 to November 2022, and President of Gilbarco Veeder-Root (a subsidiary of Vontier) from February 2018 to June 2022.
52
2022
Christina Cristiano
Senior Vice President and Chief Financial Officer
Senior Vice President and Chief Financial Officer of Crane NXT since March 2023. Vice President, Controller and Principal Accounting Officer from May 2019 to March 2023. Vice President, Controller of Global Accounting and Statutory Reporting of Thomson Reuters (a global technology and information company) from 2009 to May 2019.
53
2023
Paul G. Igoe
Senior Vice President, General Counsel and Secretary
Senior Vice President, General Counsel and Secretary of Crane NXT since March 2023. Executive Vice President, General Counsel, Chief Compliance Officer and Secretary of Excelitas Technologies Corp. (an industrial technology manufacturer) from 2018 to March 2023.
63
2023
Kim DiMaurizio
Senior Vice President, Chief People Officer
Senior Vice President, Chief People Officer of Crane NXT since October 2025. Vice President, Global HR Business Partnering; Organizational & Talent Solutions at Jazz Pharmaceuticals December 2019 to September 2025.
49
2025
Sam Keayes
Senior Vice President, Security and Authentication Technologies
Senior Vice President, Security and Authentication Technologies since May 2024. President, Crane Currency from 2020 to May 2024. Vice President, International Currency from 2019 to 2020.
51
2024
Bianca Shardelow
Vice President, Controller and Chief Accounting Officer
Vice President, Controller and Chief Accounting Officer since April 2023. Chief Audit Executive from October 2019 to April 2023. Global Business Unit Controller of Refinitiv (a global provider of financial markets data and infrastructure) from October 2018 to October 2019.
47
2023
6
Item 1. Business
General
Crane NXT is a premier industrial technology company that provides proprietary and trusted technology solutions to secure, detect, and authenticate what matters most to its customers. The company is a pioneer in advanced, proprietary micro-optics technology for securing physical products, as well as digital authentication, and its sophisticated electronic equipment and associated software leverages proprietary core capabilities with detection and sensing technologies. We are comprised of two reporting segments: Crane Payment Innovations (“CPI”) and Security and Authentication Technologies (“SAT”).
We are committed to delivering shareholder value by focusing on our proprietary and differentiated technology and investing in core businesses to capitalize on opportunities to enhance organic growth. We maintain a strong balance sheet with financial flexibility, allowing us the ability to expand the business through strategic acquisitions into higher-growth adjacencies. We continuously evaluate our portfolio, pursue acquisitions that complement our existing businesses and are accretive to our growth profile, and selectively divest businesses where appropriate. We foster a performance-based culture with clearly defined values and utilize our well-established Crane Business System (CBS) to drive operational excellence and profitable growth.
Separation
On April 3, 2023, Holdings was separated (the “Separation”) into two independent, publicly-traded companies, Crane NXT, Co. and Crane Company (“SpinCo”), through a pro-rata distribution (the “Distribution”) of all the issued and outstanding common stock of SpinCo to the stockholders of Holdings. As part of the Separation, the Aerospace & Electronics, Process Flow Technologies and Engineered Materials businesses of Holdings were spun off to SpinCo. Also, as part of the Separation, Holdings retained the Payment and Merchandising Technologies business and was renamed “Crane NXT, Co.” on April 3, 2023. Following the consummation of the Separation, our common stock is listed under the symbol “CXT” on the New York Stock Exchange.
Reportable Segments
For additional information on recent business developments and other information about us and our business, please refer to the information set forth under the captions, “Management’s Discussion and Analysis of Financial Condition and Results of Operations,” in Part II, Item 7 of this report, as well as in Part II, Item 8 under Note 4, “Segment Information,” in the Notes to Consolidated and Combined Financial Statements for sales, operating profit and assets employed by each segment. Crane NXT, Co. operates through two reportable segments.
In connection with the acquisition of OpSec, we renamed our “Crane Currency” reportable segment to “Security and Authentication Technologies,” which consists of the Crane Currency business and the Crane Authentication business comprised of the acquired OpSec and De La Rue businesses. The CPI segment remains unchanged.
Crane Payment Innovations (CPI)
CPI provides electronic equipment and associated software leveraging extensive and proprietary core capabilities with various detection and sensing technologies for applications including verification and authentication of payment transactions. CPI also provides advanced automation solutions, and processing systems, field service solutions, and remote diagnostics and productivity software solutions. Key research and development and manufacturing facilities are located in the United States, the United Kingdom, Mexico, Japan, and Germany, with additional sales offices across the world.
Security and Authentication Technologies (SAT)
SAT provides advanced security solutions based on proprietary technology for securing physical products, including banknotes, consumer goods, and industrial products. SAT also provides brand protection, authentication solutions, and digital content protection across online marketplaces, social media platforms, and websites. These solutions serve various brands, as well as government agencies and financial institutions. Key research and development and manufacturing facilities are located in the United States, United Kingdom, Sweden and Malta.
7
Other Matters Relating to Our Business as a Whole
Competitive Conditions
Our businesses participate in markets that are highly competitive. Because of the diversity of products manufactured and sold, our businesses typically have a different set of competitors in each geographic area and end market in which they participate. Accordingly, it is not possible to estimate the number of competitors, or precise market share; however, we believe that we are a principal competitor in most of our markets. To compete effectively, we seek to provide high quality products, with technological differentiation, at competitive prices, with superior customer service and timely delivery.
We are a leader in several distinct areas including materials and surface technology applied for anti-counterfeiting applications, differentiated capabilities in the design and manufacturing of detection systems, digital content protection technology, and image recognition software built on advance algorithms to authenticate products. Our products are sold into primary end markets which include payment automation solutions, banknote design and production, along with a wide range of consumer related and financial services end markets. Our revenues depend on numerous unpredictable factors, including changes in market demand, general economic conditions, customer capital spending, timing and amount of contract awards and credit availability. Since our products are sold in such a wide variety of markets, we do not believe that we can reliably quantify or predict the potential effects of changes in any of the aforementioned factors. Our engineering and product development activities are focused on improving existing products, customizing existing products to meet customer requirements, as well as the development of new products. We own numerous patents, trademarks, copyrights, trade secrets and licenses to intellectual property, no one of which is of such importance that termination would materially affect our business.
Raw Materials
Our manufacturing operations employ a wide variety of raw materials, including steel, copper, electronic components, aluminum, plastics, cotton, flax, films and various petroleum-based products. We purchase raw materials from many independent sources around the world. Although market forces have, at times, caused increases in the costs of key raw materials, there have been no raw materials shortages that have had a material adverse impact on our business. We believe that we will generally be able to obtain adequate supplies of major raw material requirements or reasonable substitutes at acceptable costs. For a further discussion of risks related to raw materials, please refer to Item 1A. “Risk Factors.”
Government Contracts
We have agreements relating to the sale of products to government entities, primarily involving products in our Security and Authentication Technologies segment. As a result, we are subject to various statutes and regulations that apply to companies doing business with the government. The laws and regulations governing government contracts differ from those governing private contracts. For example, some government contracts require disclosure of cost and pricing data and impose certain sourcing conditions that are not applicable to private contracts. Our failure to comply with these laws could result in suspension of these contracts, criminal or civil sanctions, administrative penalties and fines or suspension or debarment from government contracting or subcontracting for a period of time. For a further discussion of risks related to compliance with government contracting requirements, please refer to Item 1A. “Risk Factors.”
Environmental Compliance and Climate Change
We are regulated by federal, state and international environmental laws governing our use, transport and disposal of substances and control of emissions. Our manufacturing facilities generally do not produce significant volumes or quantities of byproducts that would be considered hazardous waste or otherwise harmful to the environment if not properly handled or maintained. Accordingly, continued compliance with these existing laws has not had a material impact on our capital expenditures or earnings.
For further discussion of environmental related risks, please refer to Item 1A. “Risk Factors.” For further discussion of our environmental matters, please refer to Part II, Item 8 under Note 13, “Commitments and Contingencies,” in the Notes to Consolidated and Combined Financial Statements.
Human Capital Resources
To remain a premier industrial technology company, it is important that we continue to attract, develop, and retain exceptional talent across our global enterprise. Our associates are critical to our success, and we are committed to sustaining our culture grounded in our core values: people matter, do the right thing, trusted partner, innovate for growth, always improving.
8
The Company has a diverse global workforce located in 35 countries, spanning six continents. At December 31, 2025, we employed approximately 4,800 persons worldwide, of which substantially all were full time employees. In the United States, we employed approximately 2,200 people across 32 locations. Employees based in some foreign countries may, from time to time, be represented by works councils or unions or subject to collective bargaining agreements. We consider our relations with our employees to be good.
To be an employer of choice and maintain the strength of our workforce, we consistently assess the current business environment and labor market to refine our compensation and benefits programs and other resources available to our associates. We are committed to developing our associates personally and professionally by leveraging a structured and disciplined Intellectual Capital (“IC”) process. Our regular IC cadence includes constructive reviews and various talent and leadership development initiatives conducted by the executive management team and provided throughout an associate’s career. We are also committed to an inclusive and high-performance culture at all levels of the organization, based on trust and respect.
The manufacture and production of our products requires the use of a variety of tools, equipment, materials, and supplies. At Crane NXT, we are strongly committed to the health and safety of our associates and strive to continuously adhere to global regulatory safety requirements and to reduce the incidence and severity of job-related injuries. We utilize strict compliance protocols, training programs, effective risk management practices, and sound science in our operations to minimize risk to our associates.
For a discussion of risks related to employee relations, please refer to Item 1A. “Risk Factors.”
Research and Development
Research, development and engineering are of critical importance at Crane NXT to maintain our technological leadership in each segment. Activities support existing products, providing new features and enhancements, as well as the development of new products. For further discussion of our research and development activities, please refer to Part II, Item 8 under Note 1, “Nature of Operations and Significant Accounting Policies,” in the Notes to Consolidated and Combined Financial Statements.
Available Information
We file annual, quarterly and current reports and amendments to these reports, proxy statements and other information with the U.S. Securities and Exchange Commission (“SEC”). The SEC maintains an Internet site that contains reports, proxy and information statements and other information regarding issuers, like us, that file electronically with the SEC. The address of the SEC’s website is www.sec.gov.
We also make our filings available free of charge through our Internet website, as soon as reasonably practicable after filing such material electronically with, or furnishing such material, to the SEC. Also posted on our website are our Corporate Governance Guidelines, Standards for Director Independence, Code of Business Conduct and Ethics and the charters and a brief description of each of the Audit Committee, the Management Organization and Compensation Committee and the Nominating and Governance Committee. These items are available in the “Investors – Corporate Governance” section of our website at www.cranenxt.com. The content of our website is not part of this report.
9
Item 1A. Risk Factors
Our business, financial condition, results of operations and cash flows may be affected by several factors including but not limited to those set forth below.This discussion should be considered in conjunction with the discussion under the caption “Forward-Looking Information” preceding Part I, the information set forth under Item 1, “Business” and with the discussion of the business included in Part II, Item 7, “Management’s Discussion and Analysis of Financial Condition and Results of Operations.” These risks comprise the material risks of which we are aware. If any of the events or developments described below or elsewhere in this Annual Report on Form 10-K, or in any documents that we subsequently file publicly were to occur, it could have a material adverse effect on our business, financial condition, results of operations and cash flows.
Risks Relating to Our Business
Macroeconomic fluctuations may harm our business, results of operations and stock price.
Our business, financial condition, operating results and cash flows may be adversely affected by changes in global economic conditions and geopolitical risks, including credit market conditions, trade policies, levels of consumer and business confidence, commodity prices and availability, inflationary pressures, exchange rates, levels of government spending and deficits, political conditions, market instability, extraordinary public health issues such as large-scale health epidemics or pandemics and other challenges that could affect the global economy including impacts associated with any economic sanctions imposed on countries or regions in which we are doing business. Such conditions could have an adverse impact on our flexibility to react to changing economic and business conditions and on our ability to fund our operations for growth or refinance maturing debt balances at economically favorable interest rates. In addition, such conditions could adversely affect the ability of our customers to obtain financing for significant purchases, result in decreases in or cancellation of orders for our products and services, and impact the ability of our customers to make payments. Similarly, such macroeconomic fluctuations may adversely affect our supplier base and increase the potential for one or more of our suppliers to experience financial distress or bankruptcy.
Demand for our products is variable and subject to factors beyond our control, any of which could adversely affect our financial condition, results of operations or cash flow.
A substantial portion of our sales is concentrated in industries that are subject to market conditions which may cause customer demand for our products to be volatile. Global trends in the use of cash as well as increased durability of banknotes could impact demand. Reductions in demand by these industries would reduce the sales and profitability of our business. Our CPI segment could be affected by sustained weakness in certain geographic markets or certain end markets such as gaming, retail or banking, as well as low employment levels, office occupancy rates and factors affecting vending operator profitability such as higher fuel, food and equipment financing costs; results could also be impacted by unforeseen advances in payment processing technologies. In addition, our results in the SAT segment are subject to significant variability due to the timing and size of contract awards by central banks for banknote production and actual order rates, particularly with the U.S. government. If any of these factors comes to fruition, it could adversely affect our financial condition, results of operation and/or cash flow.
We conduct a substantial portion of our business outside the U.S. and face risks inherent in non-domestic operations.
Net sales by destination outside the U.S. were 50% of our consolidated amounts in 2025. We expect that non-U.S. sales will continue to account for a significant portion of our revenues for the foreseeable future. In addition, our operations outside the U.S. are subject to the risks associated with conducting business internationally, including, but not limited to:
•Economic and political instability, including the risk of geopolitical conflict or territorial incursions, in the countries and regions in which we operate;
•The risks of fluctuations in foreign currency exchange rates, primarily the Japanese yen, the British pound, the euro, and the Swedish krona, could adversely affect our reported results, as amounts earned in other countries are translated into U.S. dollars for reporting purposes; and
10
•Developments in global trade policy, including possible changes to U.S. trade policies and tariffs and retaliatory trade measures taken by other countries. While we continue to expect to be able to largely offset the impact of tariffs on operating profit with pricing and productivity initiatives, the broader economic implications resulting from market volatility may decrease customer demand and negatively impact revenue and profitability. The adoption and expansion of trade restrictions, the occurrence of a trade war, or other governmental action related to tariffs (including in Mexico where our facility operates under the Mexican Maquiladora program, which provides for reduced tariffs and eased import regulations) may adversely impact demand for our products, our costs, our customers, our suppliers, and the U.S. economy, which in turn could have a material adverse effect on our business, financial condition, results of operations and cash flows. U.S. and foreign policy changes and uncertainty about such changes have resulted in increased market volatility and currency exchange rate fluctuations and may have a material adverse effect on our business, financial condition and results of operations.
Information systems and technology networks failures and breaches in data security, personally identifiable and other information, non-compliance with our contractual or other legal obligations regarding such information, or a violation of our privacy and security policies with respect to such information, could adversely affect us.
We are dependent on information technology networks and systems, including the Internet, to process, transmit and store electronic information, and, in the normal course of our business, we collect and retain certain types of personally identifiable and other information pertaining to our customers, stockholders and employees. The legal, regulatory and contractual environment surrounding information security and privacy is constantly evolving. Companies that collect and retain such information are under increasingly sophisticated and severe attack by cyber-criminals around the world. A theft, loss, fraudulent use or misuse of customer, vendor, employee or our proprietary data by cybercrime or otherwise, non-compliance with our contractual or other legal obligations regarding such data or a violation of our privacy and security policies with respect to such data could adversely impact our reputation and could result in costs, fines, litigation or regulatory action against us. Security breaches can create system disruptions and shutdowns that could result in disruptions to our operations. We cannot be certain that advances in criminal capabilities, including the use of artificial intelligence, new vulnerabilities or other developments will not compromise or breach the security solutions protecting our information technology, networks and systems. A successful cyber-attack on our information systems technology or those of our partners, vendors, or suppliers could adversely affect our ability to process orders, maintain proper levels of inventory, collect accounts receivable and pay expenses, all of which could have an adverse effect on our results of operations, financial condition and cash flows. Failure to effectively prevent, detect and recover from security breaches, including attacks on information technology and infrastructure by hackers, viruses, breaches due to employee error or actions, or other disruptions, could seriously harm our operations as well as the operations of our customers and suppliers. Such serious harm can involve, among other things, misuse of our assets, business disruptions, loss of data, unauthorized access to trade secrets and confidential business information, unauthorized access to personal information, legal claims or proceedings, reporting errors, processing inefficiencies, negative media attention, reputational harm, loss of sales, remediation and increased insurance costs, and interference with regulatory compliance. We have experienced and expect to continue to experience cybersecurity threats, which could be material in the future.
We may be unable to identify or to complete acquisitions, or to successfully integrate the businesses we acquire.
We have evaluated, and expect to continue to evaluate, a wide array of potential acquisition transactions. Our acquisition program attempts to address the potential risks inherent in assessing the value, strengths, weaknesses, contingent or other liabilities, systems of internal control and potential profitability of acquisition candidates, as well as other challenges such as retaining the employees and integrating the operations of the businesses we acquire. Integrating acquired operations involves significant risks and uncertainties, including:
•Maintenance of uniform standards, controls, policies and procedures;
•Unplanned expenses associated with the integration efforts;
•Inability to achieve planned facility repositioning savings or related efficiencies from recent and ongoing investments;
•Unidentified issues not discovered in the due diligence process, including legal contingencies;
•Inability of acquired businesses to timely report their results of operations; and
•Challenges in retaining key talent and critical employees from acquired businesses, which could impact operational continuity and the realization of anticipated synergies.
11
There can be no assurance that suitable acquisition opportunities will be available in the future, that we will continue to acquire businesses or that any business acquired will be integrated successfully or prove profitable, which could adversely impact our growth rate. Our ability to achieve our growth goals depends in part upon our ability to identify and successfully acquire, finance and integrate companies and businesses at appropriate prices and realize anticipated cost savings.
Fluctuation in the prices of, or our ability to source, our components and raw materials, and delays in the distribution of our products could adversely affect our results of operations.
Our operations require significant amounts of necessary components and raw materials that are critical to our profitability and can fluctuate in price. We depend on the timely availability of significant quantities of components and raw materials, including metals such as steel and copper, electronic components, and natural fibers such as cotton and flax. The prices of these components and materials are subject to volatility driven by changes in global supply and demand dynamics, trade policies, geopolitical events, and inflationary pressures. In recent periods, we have experienced sustained cost increases for certain materials. Future price escalations, whether due to market conditions or increased tariffs, could negatively impact our cost structure, including margins.
In addition, we rely on single or sole‑source suppliers for certain critical materials and components. If any such supplier encounters financial instability, capacity limitations, quality issues, regulatory impediments, labor shortages, or operational disruptions, we may be unable to obtain alternative sources on a timely basis or at comparable cost. Such circumstances could result in production delays, cost increases, or our inability to meet customer demand or quality specifications.
If we are unable to timely source necessary components or materials, our manufacturing operations may be disrupted, delayed or temporarily stopped, which in turn could adversely affect our results of operations.
We compete with other industrial technology businesses for employees in the countries in which we operate, and we may not be able to retain our personnel or hire and retain additional personnel needed for us to sustain and grow our business as planned.
Our business segments and corporate offices are dependent upon highly qualified personnel, including necessary technical expertise, and we generally are dependent upon the continued efforts of key management employees. Several factors may adversely affect the labor force available to us or increase labor costs, including high employment levels, federal unemployment subsidies, and other government regulations. We have recently observed an overall tightening and increasingly competitive labor market which has, and could continue to result in, higher compensation costs. While we believe we have a robust intellectual capital process, we may have difficulty retaining key personnel or locating and hiring additional qualified personnel. The loss of personnel or our failure to attract and retain other qualified and experienced personnel could impair our ability to successfully sustain and grow our business and develop and introduce new products, which could adversely affect our results of operations and financial condition.
We may be unable to successfully develop and introduce new products, which would limit our ability to grow and maintain our competitive position and adversely affect our financial condition, results of operations and cash flow.
Our growth depends, in part, on continued sales of existing products, as well as the successful development and introduction of new products or technologies, which face the uncertainty of customer acceptance and reaction from competitors. Any delay in the development or launch of a new product could result in our not being the first to market, which could compromise our competitive position. If new products do not meet targeted performance measures, or a successful counterfeit of our security technology products is produced, we could suffer reputational harm and diminished future sales. Further, the development and introduction of new products may require us to make investments in specialized personnel and capital equipment, increase marketing efforts and reallocate resources away from other uses. We also may need to modify our systems and strategy considering new products that we develop. If we are unable to develop and introduce new products in a cost-effective manner or otherwise manage effectively the operations related to new products, our financial condition, results of operations and cash flows could be adversely impacted.
12
Our businesses are subject to governmental regulation; failure to comply with those regulations, as well as changes in those regulations, could adversely affect our financial condition, results of operations, cash flows and reputation.
We are required to comply with various import and export control laws, which may affect our transactions with certain customers. In certain circumstances, export control and economic sanctions, and other trade-related regulations may prohibit the export of certain products, services and technologies. In other circumstances we may be required to obtain an export license before exporting the controlled item. Failure to comply with these requirements might result in suspension of these contracts and suspension or debarment from government contracting or subcontracting. Further, we are subject to the Foreign Corrupt Practices Act, which prohibits U.S. companies and their intermediaries from making improper payments to foreign officials for the purpose of obtaining or retaining business or securing any improper advantage. We are also subject to the anti-bribery laws of other jurisdictions. Moreover, we conduct business with central banks in countries with high corruption indexes. Due to the nature of our businesses, the countries in which we seek to sell products, and robust regulatory regimes, we are at risk of incurring civil and criminal liability, monetary and non-monetary penalties, fines, disruptions to our business, limitations on our ability to export products and services, and damage to our reputation.
Our business is directly and indirectly exposed to changes in government regulations; for example, changes in gaming regulations could influence the spending patterns of our casino operator customers, or changes in anti-money laundering regulations could result in additional technical requirements for our products. We are also subject to investigation and audit for compliance with the requirements governing government contracts, including requirements related to procurement integrity, manufacturing practices and quality procedures, export control, employment practices, the accuracy of records and the recording of costs and information security requirements. A failure to comply with these requirements could result in suspension of these contracts, and suspension or debarment from government contracting or subcontracting. Failure to comply with any of these regulations could result in civil and criminal liability, monetary and non-monetary penalties, fines, disruptions to our business, limitations on our ability to export products and services, and damage to our reputation.
Our business could be harmed if we are unable to protect our intellectual property.
We rely on a combination of trade secrets, patents, trademarks, copyrights and confidentiality practices to protect our products and technology. Existing trade secret, patent, trademark and copyright laws offer only limited protection and in some cases for a limited duration. Further, our patents could be invalidated or circumvented. In addition, others may develop substantially equivalent, or superseding proprietary technology, or competitors may offer equivalent non-infringing products in competition with our products, thereby substantially reducing the value of our proprietary rights and technology position in the market. The laws of some foreign countries in which our products are or may be manufactured or sold may not protect our products or intellectual property rights to the same extent in the U.S. We cannot assure that the steps we take to protect our intellectual property will be adequate to prevent misappropriation of our technology. We could incur significant and/or unexpected costs in our efforts to avoid, manage, defend and litigate intellectual property matters. Our inability to protect our intellectual property could have an adverse effect on our financial condition, results of operations and cash flows.
Our operations expose us to the risk of litigation, claims and investigations, including those related to product liability and warranties, and employee, commercial, intellectual property and environmental matters, that could adversely affect our financial condition, results of operations, cash flows and reputation. We may not have sufficient insurance coverage or indemnification rights to cover such claims.
•Defending lawsuits and becoming involved in investigations may divert our management’s attention and may cause us to incur significant expenses. In addition, we may be required to pay damage awards, penalties or settlements, or become subject to injunctions or other equitable remedies, that could cause reputational harm and have a material adverse effect on our business, financial condition, results of operations and cash flows.
•Our operations are subject to extensive environmental and health and safety laws and regulations, which impose limitations on the discharge of pollutants into the ground, air and water and establish standards for the generation, treatment, use, storage and disposal of solid and hazardous wastes. We must also comply with various health and safety regulations in the U.S. and abroad. The costs of compliance with these regulations may increase over time. Failure to comply with any of these laws could result in civil and criminal liability, substantial monetary and non-monetary penalties and damage to our reputation. In addition, we cannot provide assurance that our costs related to remedial efforts or alleged environmental damage associated with past or current waste disposal practices or other hazardous materials handling practices will not exceed our estimates or adversely affect our financial condition, results of operations and cash flows.
13
•We face an inherent risk of exposure to product liability and other claims if our products are defective or if their use causes harm to persons or property, and we may incur liability if we are unable to successfully defend such claims. Consistent with industry practice, we provide warranties on many of our products, and we could incur costs related to warranty or breach‑of‑contract claims if our products contain manufacturing or design defects or fail to meet contractual or customer specifications. Although we estimate future warranty costs based on historical trends and product sales, these estimates may be inaccurate, resulting in insufficient warranty reserves. Because many of our products are sophisticated and complex and may incorporate or rely on third‑party hardware, software, and data, notwithstanding testing and quality control, defects or errors may still occur. Undetected defects, performance failures, or deviations from customer expectations could lead to loss of customers, contractual liabilities, additional development and operational costs, or delays in customer acceptance. Moreover, because customers deploy our software in diverse and complex environments, including varied hardware, platforms, system management tools, and network configurations, the likelihood of technical issues may increase, and when products are integrated with other components or software, identifying the source of any defect or error may be difficult. If any of these risks materialize, we could face increased costs and expenses, exposure to liability claims, diversion of technical and other resources, loss of customers, or negative publicity, any of which could adversely affect our business and results of operations.
•While we maintain insurance coverage with respect to certain liability claims, that insurance coverage may not be adequate to cover all claims that may arise, or we may not be able to maintain adequate insurance coverage in the future at an acceptable cost. Any liabilities not covered by insurance or that exceed our established reserves could have an adverse effect on our financial condition, results of operations and cash flows.
We may be unable to improve productivity, reduce costs and align manufacturing capacity with customer demand.
We are committed to continuous productivity improvement, and we continue to evaluate opportunities to reduce costs, simplify or improve global processes, and increase the reliability of order fulfillment and satisfaction of customer needs. To operate more efficiently and control costs, from time to time we execute restructuring activities, which include workforce reductions and facility consolidations. For example, we recorded pre-tax restructuring charges in 2025 and 2024. While these proactive actions are intended to increase our productivity and operating effectiveness, if demand for our products exceeds our available manufacturing capacity or we are unable to scale production quickly, we may experience delays in fulfilling orders, increased lead times, and potential loss of sales or customer relationships. Conversely, our inability to adequately and timely respond to potential declines in global demand for our products and services to properly align our cost base could have an adverse effect on our financial condition, results of operations and cash flows.
We face significant competition which may adversely impact our financial condition, results of operations, and cash flows in the future.
While we are a principal competitor in most of our markets, all our markets are highly competitive. The competitors in many of our business segments can be expected to improve technologies, reduce costs and develop and introduce new products. The ability of our business segments to achieve similar advances will be important to our competitive positions. Competitive pressures, including those discussed above, could cause one or more of our business segments to lose market share or could result in significant price erosion, which could have an adverse effect on our financial condition, results of operations and cash flows.
Additional tax expense or exposures could adversely affect our financial condition, results of operations and cash flows.
We are subject to income taxes in the U.S. and various international jurisdictions. Our financial condition, results of operations and cash flow could be adversely affected by changes to any or all the following: tax laws, regulations, accounting principles and judicial rulings, the geographic mix of our earnings, the valuation of our deferred tax assets and liabilities, and the results of audits and examinations of previously filed tax returns.
14
Our future results of operations and financial condition could be adversely impacted by intangible asset impairment charges.
As of December 31, 2025, we had goodwill and other intangible assets, net of accumulated amortization, of $1,721.2 million, which represented approximately 55% of our total assets. Our goodwill is subject to an impairment test on an annual basis and is also tested whenever events and circumstances indicate that goodwill may be impaired. Any excess goodwill resulting from the impairment test must be written off in the period of determination. Intangible assets (other than goodwill) are generally amortized over the useful life of such assets. In addition, from time to time, we may acquire or make an investment in a business that will require us to record goodwill based on the purchase price and the value of the acquired assets. We may subsequently experience unforeseen issues with such business that adversely affect the anticipated returns of the business or value of the intangible assets and trigger an evaluation of the recoverability of the recorded goodwill and intangible assets for such business. Future determinations of significant write-offs of goodwill or intangible assets as a result of an impairment test or any accelerated amortization of other intangible assets could have an adverse effect on our future financial condition and results of operations.
If our internal controls are found to be ineffective, our financial results or our stock price may be adversely affected.
We believe that we have adequate internal control procedures in place for future periods, including processes related to newly acquired businesses; however, increased risk of internal control breakdowns generally exists in any business environment that is decentralized such as ours. In addition, if our internal control over financial reporting is found to be ineffective, investors may lose confidence in the reliability of our financial statements, which may adversely affect our stock price.
We are subject to risks related to the Separation that could negatively impact our results including not obtaining the intended tax treatment of the Separation transaction, failure of Crane Company to perform under the various transaction agreements and actual or potential conflicts of interest with Crane Company.
•In connection with the Separation, we received an Internal Revenue Service (the “IRS”) ruling (the “IRS Ruling”) on certain issues relevant to the qualification of the distribution under sections 368(a)(1)(D) and 355 of the Internal Revenue Code, based on certain facts and representations set forth in such request. The IRS Ruling does not address all of the requirements relevant to the qualification of the distribution for the intended tax treatment. It was a condition to the completion of the distribution that Crane Holdings, Co. receive a tax opinion regarding the tax treatment of the distribution (the “Tax Opinion”). The Tax Opinion relied on certain facts, assumptions, representations and undertakings from us and Crane Company, including those regarding the past and future conduct of the companies’ respective businesses and other matters. Notwithstanding the Tax Opinion, the IRS could determine that the distribution or any such related transaction is taxable if it determines that any of these facts, assumptions, representations or undertakings are not correct or have been violated, or that the distribution should be taxable for other reasons, including if the IRS were to disagree with the conclusions in the Tax Opinion. If the distribution or any of the above referenced related transactions is determined to be taxable for U.S. federal income tax purposes, we could incur significant U.S. federal income tax liabilities.
•We and Crane Company entered into certain agreements in connection with the separation transaction, including a separation and distribution agreement, a transition services agreement, a tax matters agreement, an intellectual property matters agreement and an employee matters agreement, which provide for certain obligations of each company for the benefit of the other for a period of time after the completion of the separation transaction. If Crane Company is unable, or otherwise fails, to satisfy its indemnification obligations, we could incur operational difficulties or losses and experience an adverse impact on our financial condition, results of operations and cash flows.
•Crane Company is not restricted from competing with us. If Crane Company in the future decides to engage in the type of business we conduct, it may have a competitive advantage over us, which may cause our business, financial condition and results of operations to be materially adversely affected.
15
•Because of their positions with us prior to the completion of the separation transaction, certain of our executive officers and directors have a financial interest in shares of Crane Company common stock. Continuing ownership of shares of Crane Company common stock and equity awards could create, or appear to create, potential conflicts of interest if we and Crane Company pursue the same corporate opportunities or face decisions that could have different implications for Crane Company and us.
Item 1B. Unresolved Staff Comments
None
16
Item 1C. Cybersecurity
Risk Management and Strategy
Our enterprise risk management includes a comprehensive cybersecurity risk management program with policies, standards, processes and practices based on recognized industry standards and frameworks such as the National Institute of Standards and Technology (NIST), Cybersecurity Framework (CSF) and the Center for Internet Security (CIS) critical security controls.
Our cybersecurity program includes regular training for personnel, an incident response protocol tested at least annually as part of our enterprise-wide crisis response program, cybersecurity insurance, and regular assessments through activities such as penetration testing, and compliance audits performed on our information technology networks and systems by both our internal cybersecurity teams and external service providers.
Although we have continued to invest in our due diligence, onboarding, and monitoring capabilities over external partners with whom we do business, including our third-party vendors and service providers, our control over the security posture of, and ability to monitor the cybersecurity practices of, such external partners remains limited, and there can be no assurance that we can prevent, mitigate, or remediate the risk of any compromise or failure in the cybersecurity infrastructure owned or controlled by such external partners. When we do become aware that an external partner has experienced such compromise or failure, we attempt to mitigate our risk, including by terminating such external partner’s connection to our information technology networks and systems where appropriate.
For more information on cybersecurity risks and how they affect our business, operating results and financial condition, refer to Item 1A, Risk Factors. As of the date of the filing of this Current Report on Form 10-K, we have not identified any risks from a cybersecurity threat or incident that we believe has materially affected or is reasonably likely to materially affect the Company.
Governance, Oversight and Leadership
Our Board of Directors has charged the Audit Committee with responsibility for monitoring the Company’s processes and procedures for enterprise risk identification, assessment and management, and cybersecurity represents an important component of our overall approach to enterprise risk management.
The Audit Committee receives regular reports at least twice annually from our Chief Information Security Officers (“CISO”) on a wide range of cybersecurity topics, including our cybersecurity program’s performance, results of assessments, emerging threats, capability enhancements, and recent developments and trends.
Our CISO, who reports to our Chief Financial Officer (“CFO”), leads our cybersecurity program and has more than 20 years of cybersecurity experience. The cybersecurity teams reporting to our CISO are staffed by highly skilled cybersecurity professionals, including both internal staff and external partners, with broad knowledge of cybersecurity issues from experience and through training and certifications.Our cybersecurity teams are responsible for detecting, mitigating, and responding to cybersecurity threats through a network of technologies, capabilities, and best practices on a 24/7 basis. Our CISO, in coordination with our cybersecurity teams, and members of our senior leadership team such as our Chief Executive Officer (“CEO”), CFO and General Counsel (“GC”), works collaboratively across the Company to operate a program designed to protect our business from cybersecurity threats and respond to any cybersecurity incidents in accordance with our incident response and recovery plans in real time.
We have established internal reporting processes designed to ensure that our Board of Directors and the Audit Committee receive information regarding any cybersecurity incident that meets established reporting thresholds, as well as ongoing updates regarding any such incident until it has been addressed. In the event of a cybersecurity incident, the materiality of the incident will be evaluated and determined with appropriate input from the CEO, CFO, GC, CISO and other key participants in our cybersecurity program, including external advisors to the extent appropriate.
17
Item 2. Properties
The following is a summary of our principal facilities as of December 31, 2025:
Facilities - Owned
Location
Crane Payment Innovations
Security and Authentication Technologies
Corporate
Total
Number
Area (sq. ft.)
Number
Area (sq. ft.)
Number
Area (sq. ft.)
Number
Area (sq. ft.)
Manufacturing
United States
2
663,558
6
852,773
—
—
8
1,516,331
Europe
2
242,212
1
490,501
—
—
3
732,713
Other international
2
294,666
—
—
—
—
2
294,666
6
1,200,436
7
1,343,274
—
—
13
2,543,710
Non-Manufacturing
United States
3
135,689
3
18,811
—
—
6
154,500
Europe
1
11,000
—
—
—
—
1
11,000
4
146,689
3
18,811
—
—
7
165,500
Facilities - Leased
Location
Crane Payment Innovations
Security and Authentication Technologies
Corporate
Total
Number
Area (sq. ft.)
Number
Area (sq. ft.)
Number
Area (sq. ft.)
Number
Area (sq. ft.)
Manufacturing
United States
—
—
4
380,806
—
—
4
380,806
Europe
—
—
3
339,187
—
—
3
339,187
—
—
7
719,993
—
—
7
719,993
Non-Manufacturing
United States
7
125,074
5
142,902
2
18,253
14
286,229
Canada
2
11,704
—
—
—
—
2
11,704
Europe
2
31,734
6
45,215
—
—
8
76,949
Other international
7
22,127
11
44,059
—
—
18
66,186
18
190,639
22
232,176
2
18,253
42
441,068
In our opinion, these properties have been well maintained, are in good operating condition and contain all necessary equipment and facilities for their intended purposes.
18
Item 3. Legal Proceedings.
Discussion of legal matters is incorporated by reference to Part II, Item 8 under Note 13, “Commitments and Contingencies,” in the Notes to Consolidated and Combined Financial Statements.
Item 4. Mine Safety Disclosures.
Not applicable.
19
Part II
Item 5. Market for the Registrant’s Common Equity, Related Stockholder Matters and Issuer Purchases of Equity Securities
Market Information
Crane NXT, Co. common stock is traded on the New York Stock Exchange (“NYSE”) under the symbol "CXT". As of December 31, 2025, there were 1,393 holders of record of Crane NXT, Co. common stock.
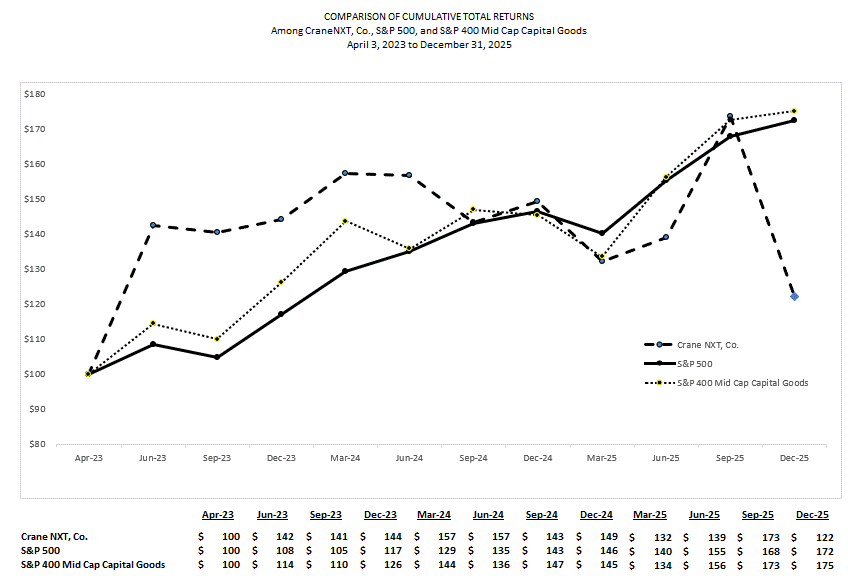
Stock Performance Graph
The following chart compares the total stockholder returns (stock price increase plus reinvested dividends) on our common stock from April 4, 2023, the date our stock commenced regular-way trading on the NYSE, through December 31, 2025 with the total stockholder returns for the S&P 500 Index and the S&P MidCap 400 Capital Goods Index. The graph assumes that the value of the investment in the common stock and each index was $100 on April 4, 2023 and that all dividends were reinvested.
20
Purchases of Equity Securities
None
Equity Compensation Plans
For information regarding equity compensation plans, see Item 12 of this annual report on Form 10-K.
Item 6. [Reserved]
21
MANAGEMENT’S DISCUSSION AND ANALYSIS OF FINANCIAL CONDITION AND RESULTS OF OPERATIONS
Item 7. Management’s Discussion and Analysis of Financial Condition and Results of Operations
The following discussion and analysis of our financial condition and results of operations should be read together with our consolidated and combined financial statements and related notes included under Item 8 of this Annual Report on Form 10-K.
We are a leading provider of trusted technology solutions to secure, detect, and authenticate our customers’ most valuable assets. Our primary end markets include governments and a wide range of consumer-related end markets including convenience merchandising (vending), retail and gaming. Our operations are comprised of two segments, Crane Payment Innovations (“CPI”) and Security and Authentication Technologies (“SAT”):
•CPI provides electronic equipment and software leveraging extensive and proprietary core capabilities with various detection and sensing technologies for applications including verification and authentication of payment transactions. CPI also provides advanced automation solutions, processing systems, field service solutions, remote diagnostics and productivity software solutions.
•SAT provides advanced security solutions based on proprietary technology for securing physical products, including banknotes, consumer goods and industrial products. SAT also provides brand protection, authentication solutions, and digital content protection across online marketplaces, social media platforms, and websites.
We are committed to delivering shareholder value by focusing on our proprietary and differentiated technology and investing in core businesses to capitalize on opportunities to enhance organic growth. We maintain a strong balance sheet with financial flexibility, allowing us the ability to expand the business through strategic acquisitions into higher-growth adjacencies. We continuously evaluate our portfolio, pursue acquisitions that complement our existing businesses and are accretive to our growth profile, and selectively divest businesses where appropriate. We foster a performance-based culture with clearly defined values and utilize our well-established Crane Business System (CBS) to drive operational excellence and profitable growth.
Due to rounding, numbers presented throughout this report may not add up precisely to totals we provide and percentages may not precisely reflect the absolute figures.
Separation
On April 3, 2023, Holdings was separated (the “Separation”) into two independent, publicly-traded companies, Crane NXT, Co. and Crane Company (“SpinCo”) through a pro-rata distribution (the “Distribution”) of all the issued and outstanding common stock of SpinCo to the stockholders of Holdings. As part of the Separation, the Aerospace & Electronics, Process Flow Technologies and Engineered Materials businesses of Holdings were spun off to SpinCo. Also, as part of the Separation, Holdings retained the Payment and Merchandising Technologies business and was renamed “Crane NXT, Co.” on April 3, 2023. Following the consummation of the Separation, our common stock is listed under the symbol “CXT” on the New York Stock Exchange.
Due to SpinCo’s larger operations, greater tangible assets, greater fair value and greater net sales, in each case, relative to ours, among other factors, SpinCo was considered to be the “accounting spinnor” and therefore is the “accounting successor” to Holdings for accounting purposes, notwithstanding the legal form of the Separation. As such, our financial statements for periods prior to the Separation are comprised of combined carve-out financial statements representing only our operations, assets, liabilities and equity on a stand-alone basis derived from the consolidated financial statements and accounting records of Holdings.
Separation Agreements
On April 3, 2023, we entered into definitive agreements with SpinCo in connection with the Separation.The agreements set forth the terms and conditions of the Separation and provide a framework for our relationship with SpinCo following the Separation, including the allocation between us and SpinCo of our and SpinCo’s assets, liabilities and obligations attributable to periods prior to, at and after the Separation. These agreements include the Separation and Distribution Agreement, which contains certain key provisions related to the Separation, as well as a Transition Services Agreement, a Tax Matters Agreement, an Employee Matters Agreement and an Intellectual Property Matters Agreement. As of December 31, 2024, the term of the Transition Services Agreement has expired.
22
MANAGEMENT’S DISCUSSION AND ANALYSIS OF FINANCIAL CONDITION AND RESULTS OF OPERATIONS
Recent Transactions
Credit Facilities
On December 15, 2025, in connection with the closing of the first phase of the Antares Vision acquisition, we amended our Credit Agreement to provide for a €430 million senior secured delayed draw term loan facility (the “Term Loan B”) with a maturity date of December 15, 2032. On December 16, 2025, we drew €112.1 million, or $131.7 million, of the Term Loan B. The remaining Term Loan B will be used to fund the remaining phases of the Antares Vision acquisition. In addition, the amended credit agreement provides for maturity extensions on our existing Term Loan A and Revolving Facility to December 15, 2030 and increased the Revolving Facility to $800 million.
For the year ended December 31, 2025, we drew $406.5 million and repaid $490.5 million on our Revolving Facility to fund working capital requirements. We also drew £300.0 million, or $400.4 million, on the Term Loan A to fund the DLR acquisition and repaid $40.9 million.
In the fourth quarter of 2025 we designated our euro‑denominated Term Loan B as a net investment hedge of certain foreign subsidiaries to mitigate the impact of foreign currency exchange rate fluctuations on the Company’s net investments in those subsidiaries. We recorded $0.2 million gain in Currency Translation Adjustment (“CTA”), a component of Accumulated Other Comprehensive Income (“AOCI”), for the year ended December 31, 2025.
Antares Vision Acquisition
On December 16, 2025, Crane NXT, through a newly formed Italian joint stock company (“ITT”), initiated a multi-phase acquisition of Antares Vision S.p.A. (“Antares Vision”). In the first phase, Crane NXT acquired a 32.3% equity interest in Antares Vision for €117.3 million (approximately $137.8 million), at a purchase price of €5.00 per share. Following the initial investment, Crane NXT launched a mandatory tender offer under applicable Italian law to acquire the remaining publicly traded shares at the same per-share price. Upon completion of the mandatory tender offer Crane NXT will implement steps aimed at delisting Antares Vision and acquire the remaining stake owned by Regolo S.p.A. As a result of the transaction, Antares Vision will become a subsidiary of Crane NXT. We expect the final phase of the transaction to be completed in 2026. The acquisition is funded through the Term Loan B (as described in Note 14, “Financing”).
Antares Vision is a global provider of inspection and detection systems that ensure product safety and quality control, as well as track and trace software solutions that help prevent counterfeiting and provides visibility of products throughout the supply chain. The acquisition advances our strategy and expands the Company’s portfolio in growing end markets, including Life Sciences and Food and Beverage.
DLR Acquisition
On May 1, 2025, we acquired De La Rue Authentication Solutions (“DLR”) for a base purchase price of £300 million. We utilized the Term Loan A to fund the acquisition. DLR is a leading global provider of digital and physical security and authentication technologies to governments and brands, and expands our portfolio of authentication solutions.
De La Rue was combined with OpSec Security to form “Crane Authentication” within the Security and Authentication Technologies segment upon close.
Restructuring
In 2025 we initiated restructuring actions as follows:
•We recorded $12.1 million of restructuring expense in the SAT segment, predominantly related to severance charges, associated with the integration of the DLR and OpSec businesses. Certain remaining actions, including completion of facility‑related exit activities are expected to continue into 2026. Total program costs are expected to be in the range of $15 million to $17 million.
•We recorded $4.7 million of restructuring expense in the CPI segment, predominantly related to severance charges. We continue to evaluate and align CPI’s cost structure with existing economic conditions which could result in additional actions.
23
MANAGEMENT’S DISCUSSION AND ANALYSIS OF FINANCIAL CONDITION AND RESULTS OF OPERATIONS
Trade Policies and Regulations
We continue to monitor developments in global trade policies and tariff regulations. As of February 26, 2026, we expect to mitigate the majority of tariffs on operating profit with pricing and productivity initiatives. The related macroeconomic uncertainty is also affecting demand, primarily in our CPI vending business, which is driving lower sales volumes. See Item 1A, “Risk Factors” for more details.
This section of this Form 10-K generally discusses 2025 and 2024 items and year-to-year comparisons between 2025 and 2024. Discussions of 2023 items and year-to-year comparisons between 2024 and 2023 that are not included in this Form 10-K can be found in “Management’s Discussion and Analysis of Financial Condition and Results of Operations” in Item 7 of our Annual Report on Form 10-K for the year ended December 31, 2024.
24
MANAGEMENT’S DISCUSSION AND ANALYSIS OF FINANCIAL CONDITION AND RESULTS OF OPERATIONS
Results from Operations - For the Years ended December 31, 2025, 2024 and 2023
For the year ended December 31,
2025 vs 2024
Favorable /
(Unfavorable) Change
2024 vs 2023
Favorable /
(Unfavorable) Change
(in millions, except %)
2025
2024
2023
$
%
$
%
Net sales:
Crane Payment Innovations
$
846.6
$
873.2
$
886.4
$
(26.6)
(3.0)
%
$
(13.2)
(1.5)
%
Security and Authentication Technologies
810.1
613.6
504.9
196.5
32.0
%
108.7
21.5
%
Total net sales
$
1,656.7
$
1,486.8
$
1,391.3
$
169.9
11.4
%
$
95.5
6.9
%
Sales growth:
Core sales
$
10.1
0.7
%
$
15.7
1.1
%
Foreign exchange
26.8
1.8
%
(6.2)
(0.4)
%
Acquisitions
133.0
8.9
%
86.0
6.2
%
Total sales growth
$
169.9
11.4
%
$
95.5
6.9
%
Cost of sales
$
952.9
$
821.7
$
737.2
$
(131.2)
(16.0)
%
$
(84.5)
(11.5)
%
Selling, general and administrative
$
440.3
$
386.2
$
366.8
$
(54.1)
(14.0)
%
$
(19.4)
(5.3)
%
Restructuring charges
$
16.8
$
10.1
$
0.5
$
(6.7)
(66.3)
%
$
(9.6)
NM
Operating profit (loss):
Crane Payment Innovations
$
221.6
$
228.4
$
242.8
$
(6.8)
(3.0)
%
$
(14.4)
(5.9)
%
Security and Authentication Technologies
97.4
110.9
116.3
(13.5)
(12.2)
%
(5.4)
(4.6)
%
Corporate
(72.3)
(70.5)
(72.3)
(1.8)
(2.6)
%
1.8
2.5
%
Total operating profit
$
246.7
$
268.8
$
286.8
$
(22.1)
(8.2)
%
$
(18.0)
(6.3)
%
Operating margin:
Crane Payment Innovations
26.2
%
26.2
%
27.4
%
Security and Authentication Technologies
12.0
%
18.1
%
23.0
%
Total operating margin
14.9
%
18.1
%
20.6
%
NON-GAAP FINANCIAL MEASURES
References to "core," such as "core sales," exclude currency effects and, where applicable, the first-year impacts of acquisitions and divestitures. Management believes that non-GAAP financial measures that exclude these items provide investors with an alternative metric that can assist in identifying underlying growth trends in our business and facilitate comparison of our sales performance, for example, with prior and future periods that are complementary to GAAP metrics.
25
MANAGEMENT’S DISCUSSION AND ANALYSIS OF FINANCIAL CONDITION AND RESULTS OF OPERATIONS
Items Affecting Comparability of Reported Results
The comparability of our results for the years ended December 31, 2025, 2024 and 2023 is affected by the following significant items:
The Separation
Our financial statements for periods prior to the Separation are comprised of combined carve-out financial statements representing only our operations, assets, liabilities and equity on a stand-alone basis derived from the consolidated financial statements and accounting records of Holdings.
Transaction Related Expenses
We incurred transaction related expenses of $24.1 million, $19.9 million and $22.0 million for the years ended December 31, 2025, 2024 and 2023, respectively, recorded in “Selling, general and administrative” in the Consolidated and Combined Statements of Operations. These transaction related expenses primarily consist of professional service fees incurred in connection with acquisitions and the Separation. These expenses are predominantly recorded in Corporate expense.
Restructuring Charges
In response to challenging industry conditions and to realign the cost structure with existing economic conditions in the CPI segment, we recorded restructuring charges of $4.7 million, $10.1 million and $0.5 million for the years ended December 31, 2025, 2024 and 2023, respectively. In addition, we recorded restructuring expenses of $12.1 million in the SAT segment during 2025, primarily associated with the integration of the DLR and OpSec businesses.
OVERALL
2025 compared with 2024
Sales increased by $169.9 million, or 11.4%, to $1,656.7 million in 2025. The change in sales included:
•Sales benefit from the De La Rue and OpSec acquisitions of $133.0 million, or 8.9%,
•Core sales growth of $10.1 million, or 0.7%, driven primarily by the Currency business, partially offset by lower volumes in CPI.
•Favorable foreign currency translation of $26.8 million, or 1.8%, driven primarily by the strengthening of the euro, Swedish krona, British pound and Japanese yen against the U.S. dollar.
Cost of sales increased by $131.2 million, or 16.0%, to $952.9 million in 2025. The increase was driven primarily by the impact of acquisitions in SAT, higher material and other manufacturing costs, unfavorable mix and unfavorable foreign currency translation, partially offset by productivity gains and the impact of lower volumes in CPI.
Selling, general and administrative expenses increased by $54.1 million, or 14.0%, to $440.3 million in 2025. The increase was driven primarily by the SAT acquisitions of $45.3 million, or 11.7% and unfavorable foreign currency transaction.
Operating profit decreased by $22.1 million, or 8.2%, to $246.7 million in 2025. The decrease was primarily driven by the dilutive impact of acquisitions, higher material and other manufacturing costs, unfavorable mix and the impact of lower volumes in CPI, partially offset by favorable pricing, cost saving actions and productivity gains.
26
MANAGEMENT’S DISCUSSION AND ANALYSIS OF FINANCIAL CONDITION AND RESULTS OF OPERATIONS
CRANE PAYMENT INNOVATIONS
(in millions, except %) For the year ended December 31,
2025
2024
2023
Net sales by product line:
Payment Acceptance and Dispensing Products
$
709.4
$
739.9
$
758.7
Services
137.2
133.3
127.7
Total net sales
$
846.6
$
873.2
$
886.4
Cost of sales
$
432.3
$
440.4
$
439.4
Selling, general and administrative (a)
$
192.7
$
204.4
$
204.2
Operating profit
$
221.6
$
228.4
$
242.8
Assets
$
1,183.0
$
1,187.1
$
1,279.1
Backlog
$
113.4
$
145.8
$
216.8
Operating margin
26.2
%
26.2
%
27.4
%
(a)
Selling, general and administrative expense includes restructuring charges of $4.7 million, $10.1 million and $0.5 million for the years ended December 31, 2025, 2024 and 2023, respectively.
2025 compared to 2024
Sales decreased by $26.6 million, or 3.0%, to $846.6 million in 2025, driven by lower core sales of $31.7 million, or 3.6%, offset by favorable foreign currency translation of $5.1 million, or 0.6%.
•Sales of Payment Acceptance and Dispensing Products decreased $30.5 million, or 4.1%, to $709.4 million in 2025. The decrease reflected lower core sales of $35.6 million, or 4.8%, as favorable pricing was more than offset by lower volumes primarily in vending. The decrease was partially offset by favorable foreign currency translation of $5.1 million, or 0.7%, primarily reflecting the strengthening of the British pound and Japanese yen against the U.S. dollar.
•Service revenue increased by $3.9 million, or 2.9%, to $137.2 million in 2025, primarily driven by favorable pricing.
Cost of sales decreased by $8.1 million, or 1.8%, to $432.3 million in 2025, driven by the impact of lower sales volumes and productivity gains, partially offset by unfavorable mix, higher material and other manufacturing costs and unfavorable foreign currency translation.
Selling, general and administrative expense decreased by $11.7 million, or 5.7%, to $192.7 million in 2025, primarily due to cost saving actions and lower restructuring charges.
Operating profit decreased by $6.8 million, or 3.0%, to $221.6 million in 2025. The decrease primarily reflected the impact of lower volumes of $27.8 million, or 12.2%, and unfavorable mix of $16.4 million, or 7.2%, partially offset by favorable pricing, net of inflation, productivity gains and cost saving actions of $32.0 million, or 14.0%, and lower restructuring charges of $5.4 million, or 2.4%.
27
MANAGEMENT’S DISCUSSION AND ANALYSIS OF FINANCIAL CONDITION AND RESULTS OF OPERATIONS
SECURITY AND AUTHENTICATION TECHNOLOGIES
(in millions, except %) For the year ended December 31,
2025
2024
2023
Net sales by product line:
Banknotes and Security Products
$
592.4
$
521.9
$
500.4
Authentication Products and Solutions
217.7
91.7
4.5
Total net sales
$
810.1
$
613.6
$
504.9
Cost of sales
$
520.6
$
381.3
$
297.8
Selling, general and administrative
$
192.1
$
121.4
$
90.8
Operating profit
$
97.4
$
110.9
$
116.3
Assets
$
1,734.9
$
1,178.2
$
814.4
Backlog
$
379.4
$
248.3
$
243.0
Operating margin
12.0
%
18.1
%
23.0
%
(a)
Selling, general and administrative expense includes restructuring charges of $12.1 million for the years ended December 31, 2025.
2025 compared to 2024
Sales increased by $196.5 million, or 32.0%, to $810.1 million in 2025, primarily reflecting the sales benefit of acquisitions of $133.0 million, or 21.7%, higher core sales of $41.8 million, or 6.8% and favorable foreign currency translation of $21.7 million, or 3.5%.
•Banknote and security product sales increased by $70.5 million, or 13.5%, to $592.4 million in 2025, driven by higher sales in international markets and favorable foreign currency translation reflecting the strengthening of the Euro and Swedish Krona against the U.S. dollar.
•Authentication products and solutions sales increased by $126.0 million to $217.7 million in 2025, driven by the sales benefit from acquisitions.
Cost of sales increased by $139.3 million, or 36.5%, to $520.6 million in 2025, primarily due to the impact of the SAT acquisitions of $79.4M million, or 20.8%, acquisition related amortization and fair value step-up, higher material and other manufacturing costs, and unfavorable foreign currency translation, partially offset by productivity gains.
Selling, general and administrative expense increased by $70.7 million, or 58.2%, to $192.1 million in 2025, primarily due to the impact of acquisitions and restructuring charges associated with the integration of the De La Rue and OpSec businesses.
Operating profit decreased by $13.5 million, or 12.2%, to $97.4 million in 2025, primarily due to higher material and other manufacturing costs net of favorable pricing of $31.2 million, or 28.1%, higher restructuring charges of $12.1 million, or 10.9%, partially offset by productivity gains and cost saving actions of $26.7 million, or 24.0%. The dilutive impact of acquisitions of $15.0 million, or 13.5%, was offset by the impact of higher volumes.
28
MANAGEMENT’S DISCUSSION AND ANALYSIS OF FINANCIAL CONDITION AND RESULTS OF OPERATIONS
CORPORATE
(in millions) For the year ended December 31,
2025
2024
2023
Corporate expenses
$
72.3
$
70.5
$
72.3
Corporate expenses increased by $1.8 million, or 2.6%, in 2025 compared with 2024, primarily related to higher compensation and benefit costs.
INTEREST AND MISCELLANEOUS INCOME, NET
(in millions) For the year ended December 31,
2025
2024
2023
Interest income
$
1.0
$
1.6
$
1.1
Interest expense
$
(60.3)
$
(47.8)
$
(48.1)
Related party interest expense*
$
—
$
—
$
(2.5)
Equity investment (loss) gain
$
(11.5)
$
0.8
$
—
Miscellaneous income, net
$
5.1
$
3.0
$
2.5
* Related party interest with Crane Company incurred prior to the Separation.
Interest expense increased by $12.5 million, or 26.2%, in 2025 compared with 2024 due to higher debt outstanding in 2025 to fund acquisitions.
Equity investment loss increased by $12.3 million in 2025 compared with 2024 driven by stock-based compensation issued to senior management of Antares Vision, as a result of acquiring a 32.3% equity interest in the fourth quarter of 2025. See Note 3 “Acquisitions”
INCOME TAX
(in millions, except %) For the year ended December 31,
2025
2024
2023
Income before tax — U.S.
$
91.5
$
78.2
$
97.4
Income before tax — non-U.S.
89.5
148.2
142.4
Income before tax — worldwide
$
181.0
$
226.4
$
239.8
Provision for income taxes
$
35.9
$
42.3
$
51.5
Effective tax rate
19.8
%
18.7
%
21.5
%
Our effective tax rate is affected by both recurring and discrete items, including the mix of jurisdictional earnings, acquisitions and dispositions, changes in the valuation of our deferred tax assets and liabilities, changing regulations, the continued availability of statutory tax credits and deductions, and examinations initiated by tax authorities around the world.
Our 2025 effective tax rate of 19.8% is higher than the prior year’s comparable period due to the mix in jurisdictional earnings.
On July 4, 2025, the U.S. government enacted The One Big Beautiful Bill Act of 2025 which includes various changes to the U.S. corporate income tax system including, but not limited to, the immediate expensing of qualifying research and development expenses and the permanent extension of certain provisions initially enacted within the Tax Cuts and Jobs Act. Based on the Company’s evaluation of the provisions, these tax law changes did not have a material impact on the Company’s financial statements.
The Organization for Economic Co-operation and Development (“OECD”) has proposed a global minimum tax of 15% of reported profits (“Pillar 2 tax”) that has been agreed upon by over 140 member jurisdictions including the United States. Pillar 2 addresses the risks associated with profit shifting to entities in low tax jurisdictions. The Pillar 2 tax liability for the Company in 2025 was approximately $1.3 million. On January 5, 2026, the US Treasury Department and OECD have agreed in principle to adopt a side-by-side tax system that will exempt US parented companies from Pillar 2 taxes starting in 2026.
See "Application of Critical Accounting Policies" included later in this Item 7 for additional information about our provision for income taxes. A reconciliation of the statutory U.S. federal tax rate to our effective tax rate is set forth in Item 8 under Note 10, "Income Taxes" in the Notes to Consolidated and Combined Financial Statements.
29
MANAGEMENT’S DISCUSSION AND ANALYSIS OF FINANCIAL CONDITION AND RESULTS OF OPERATIONS
LIQUIDITY AND CAPITAL RESOURCES
(in millions) For the year ended December 31,
2025
2024
2023
Net cash provided by (used for):
Operating activities
$
241.5
$
214.1
$
276.3
Investing activities
(549.0)
(318.0)
(31.1)
Financing activities
363.6
62.1
(252.5)
Effect of exchange rates on cash, cash equivalents and restricted cash
16.7
(12.0)
3.8
Increase (Decrease) in cash, cash equivalents and restricted cash
$
72.8
$
(53.8)
$
(3.5)
Our operating philosophy is to deploy cash provided from operating activities, when appropriate, to provide value to stockholders by reinvesting in existing businesses, by making acquisitions that will strengthen and complement our portfolio; by divesting businesses that are no longer strategic or aligned with our portfolio and where such divestitures can generate capacity for strategic investments and initiatives that further optimize our portfolio; by paying dividends and repaying prepayable debt. At any given time, and from time to time, we may be evaluating one or more of these opportunities.
Our current cash balance, together with cash we expect to generate from future operations along with borrowings available under the Credit Agreement, is expected to be sufficient to finance our short- and long-term capital requirements. In addition, we believe our credit ratings afford us adequate access to public and private debt markets.
We had net proceeds of $126.0 million from the Revolving Facility as of December 31, 2025. As of December 31, 2025, we drew down $532 million on term loans to fund the De La Rue and Antares acquisitions, and repaid $40.9 million. Please see Item 8 under Note 14, “Financing” in the Consolidated and Combined Financial Statements for additional details.
Operating Activities
Cash provided by operating activities was $241.5 million in 2025, compared with $214.1 million in 2024. The increase in cash provided by operating activities was primarily driven by improved working capital management.
Investing Activities
Cash used for investing activities primarily consists of cash used for capital expenditures and acquisitions. Capital expenditures are made primarily for increasing capacity, replacing equipment, supporting new product development, and improving information systems. We expect capital expenditures of approximately $75 million to $80 million in 2026.
Cash used for investing activities was $549.0 million in 2025, compared with $318.0 million in 2024. The increase was primarily driven by the $391.1 million De La Rue acquisition and $116.5 million investment in Antares Vision in 2025, which together were $237.7 million higher than the $269.9 million OpSec acquisition in 2024.
Financing Activities
Cash provided by (used for) financing activities consists primarily of dividend payments to shareholders, repayments of indebtedness, proceeds from our credit facilities and investments from our stakeholders.
Cash provided by financing activities was $363.6 million in 2025, compared with $62.1 million in 2024. The increase was primarily attributable to proceeds from term loan borrowings in 2025 to fund the De La Rue and Antares Vision acquisitions, partially offset by higher repayments on the Revolving Facility.
Financing Arrangements
Total debt was $1,139.5 million and $750.6 million as of December 31, 2025, and 2024, respectively. Our indebtedness as of December 31, 2025 was as follows:
•$126.0 million related to the Revolving Facility;
•$198.8 million of 6.55% notes due 2036;
•$346.9 million of 4.20% notes due 2048; and
•$481.2 million related to the term loan borrowings.
See Item 8 under Note 14, “Financing,” in the Notes to Consolidated and Combined Financial Statements for details regarding our financing arrangements.
30
MANAGEMENT’S DISCUSSION AND ANALYSIS OF FINANCIAL CONDITION AND RESULTS OF OPERATIONS
Credit Ratings
As of December 31, 2025, Crane NXT’s Corporate Rating was BB+ by S&P Global Ratings with a Stable Outlook and Ba1 with a Stable Outlook by Moody’s Investor Services. Our senior secured debt was rated BB+ by S&P Global Ratings with a Stable outlook and Baa3 with a Stable Outlook by Moody’s Investor Service. Our senior unsecured debt was rated BB- by S&P Global Ratings with a Stable outlook and Ba2 with a Stable outlook by Moody’s Investors Service. We believe that these ratings afford us adequate access to the public and private debt markets.
Contractual Obligations
Under various agreements, we are obligated to make future cash payments in fixed amounts. These include payments under our short-term and long-term debt agreements and rent payments required under operating lease agreements. The following table summarizes our cash obligations as of December 31, 2025:
Payment due by Period
(in millions)
Total
2026
2027 -2028
2029 -2030
2031 and after
Debt (a)
$
1,044.2
$
9.1
$
27.2
$
326.3
$
681.6
Fixed interest payments (b)
480.6
27.8
55.6
55.6
341.6
Operating lease payments
102.6
17.7
23.1
13.9
47.9
Purchase obligations
44.8
34.2
7.8
2.8
—
Pension and postretirement benefits (c)
50.2
4.9
10.0
10.1
25.2
Other long-term liabilities reflected on Consolidated Balance Sheets (d)
—
—
—
—
—
Total
$
1,722.4
$
93.7
$
123.7
$
408.7
$
1,096.3
(a) Debt includes scheduled principal payments.
(b) Variable interest payments are excluded because the underlying interest rates will depend on changes in market-based rates and cannot be reasonably estimated.
(c) Pension benefits are funded by the respective pension trusts. The postretirement benefit component of the obligation is approximately $1.0 million per year for which there is no trust and will be directly funded by us. Pension benefits are included through 2035.
(d) As the timing of future cash outflows is uncertain, the following long-term liabilities (and related balances) are excluded from the above table: gross unrecognized tax benefits of $5.5 million and related gross interest and penalties of $1.1 million.
(e) Pursuant to the Antares acquisition agreements, the Company is obligated to initiate a mandatory tender offer for the acquisition of the publicly traded shares of Antares. These contractual obligations are not included in the schedule above due to uncertainty regarding the number of shares that will be tendered. The transaction is expected to be funded through available capacity under the Term Loan B facility. Refer to Note 3, “Acquisition,” and Note 14, “Financing,” for additional information.
31
MANAGEMENT’S DISCUSSION AND ANALYSIS OF FINANCIAL CONDITION AND RESULTS OF OPERATIONS
Capital Structure
The following table sets forth our capitalization:
(in millions, except %) December 31,
2025
2024
Short-term borrowings
$
135.1
$
210.0
Long-term debt
1,004.4
540.6
Total debt
$
1,139.5
$
750.6
Equity
$
1,249.9
$
1,064.9
Capitalization
$
2,389.4
$
1,815.5
Debt to capitalization
47.7
%
41.3
%
Total debt
$
1,139.5
$
750.6
Less cash and cash equivalents
233.8
165.8
Net debt (a)
$
905.7
$
584.8
Equity
$
1,249.9
$
1,064.9
Net capitalization (a)
$
2,155.6
$
1,649.7
Net debt to equity (a)
72.5
%
54.9
%
Net debt to net capitalization (a)
42.0
%
35.4
%
(a)
Net debt, a non-GAAP measure, represents total debt less cash and cash equivalents. Net debt is comprised of components disclosed above which are presented on our Consolidated Balance Sheets. Net capitalization, a non-GAAP measure, represents Net Debt plus Equity. We report our financial results in accordance with U.S. generally accepted accounting principles (U.S. GAAP). However, management believes that certain non-GAAP financial measures, which include the presentation of net debt and net capitalization, provide useful information about our ability to satisfy our debt obligation with currently available funds. Management also uses these non-GAAP financial measures in making financial, operating, planning and compensation decisions and in evaluating our performance. Non-GAAP financial measures, which may be inconsistent with similarly captioned measures presented by other companies, should be viewed in the context of the definitions of the elements of such measures we provide and in addition to, and not as a substitute for, our reported results prepared and presented in accordance with U.S. GAAP.
In 2025, equity increased $185.0 million as a result of net income attributable to common shareholders of $145.1 million, the impact of equity-based awards and related settlement activities of $9.8 million, currency translation adjustment of $72.2 million, and changes in pension and postretirement plan assets and benefit obligations, net of tax of $0.5 million. These increases were partially offset by cash dividends of $39.0 million, and noncontrolling interest of acquired entity of $3.6 million.
32
MANAGEMENT’S DISCUSSION AND ANALYSIS OF FINANCIAL CONDITION AND RESULTS OF OPERATIONS
APPLICATION OF CRITICAL ACCOUNTING ESTIMATES
Our Consolidated and Combined Financial Statements are prepared in accordance with accounting principles generally accepted in the United States. Certain accounting policies require us to make estimates and assumptions that affect the reported amounts of assets and liabilities at the date of the financial statements and the reported amounts of revenue and expense during the reporting period. On an ongoing basis, we evaluate our estimates and assumptions, and the effects of revisions are reflected in the financial statements in the period in which they are determined to be necessary. The accounting estimates described below are those that most frequently require us to make estimates and judgments and, therefore, are critical to understanding our results of operations. We have discussed the development and selection of these accounting estimates and the related disclosures with the Audit Committee of our Board of Directors. Our significant accounting policies are more fully described in Item 8 under Note 1, “Nature of Operations and Significant Accounting Policies” in the Notes to Consolidated and Combined Financial Statements.
Revenue Recognition.We primarily generate revenue through the manufacture and sale of technology solutions including advanced detection and sensing systems, software to authenticate and manage transactions and micro-optics materials technology. Each product within a contract generally represents a separate performance obligation, as we do not provide a significant service of integrating or installing the products, the products do not customize each other, and the products can function independently of each other. Control of products generally transfers to the customer at a point in time, as the customer does not control the products as they are manufactured. We exercise judgment and consider the timing of right to payment, transfer of risk and rewards, transfer of title, transfer of physical possession, and customer acceptance when determining when control transfers to the customer. As a result, revenue from the sale of products is generally recognized at a point in time - either upon shipment or delivery - based on the specific shipping terms in the contract.
When products are customized or products are sold directly to the U.S. government or indirectly to the U.S. government through subcontracts, and under certain international government contracts, revenue is recognized over time because control is transferred continuously to customers, as the contract progresses. We exercise judgment to determine whether the products have an alternative use to us. When an alternative use does not exist for these products and we are entitled to payment for performance completed to date which includes a reasonable profit margin, revenue is recognized over time. When a contract contains clauses indicating that the customer owns any work-in-progress as the contracted product is being built, revenue is recognized over time. The measure of progress applied by us is the cost-to-cost method as this provides the most faithful depiction of the pattern of transfer of control. Under this method, we measure progress by comparing costs incurred to date to the total estimated costs to provide the performance obligation. This method effectively reflects our progress toward completion, as this methodology includes any work-in-process amounts as part of the measure of progress. Costs incurred represent work performed, which corresponds with, and thereby depicts, the transfer of control to the customer. Total revenue recognized and cost estimates are updated monthly. In 2025, the Company recognized approximately $225 million in revenue over time related to products.
These estimates are subject to uncertainties and require judgment. Estimates of contract costs include labor hours and rates, and material costs. These estimates consider historical performance, the complexity of the work to be performed, the estimated time to complete the project, and other economic factors such as inflation and market rates. We update our estimates on a periodic basis and any revisions to such estimates are recorded in earnings in the period in which they are determined. Provisions for estimated losses, if any, on uncompleted long-term contracts, are made in the period in which such losses are determined. We do not believe that any discrete event or adjustment in contract estimates for 2025, 2024 or 2023 was material to the consolidated and combined statements of operations for such annual periods.
Income Taxes.We account for income taxes in accordance with ASC Topic 740 “Income Taxes” (“ASC 740”), which requires an asset and liability approach for the financial accounting and reporting of income taxes. Under this method, deferred income taxes are recognized for the expected future tax consequences of differences between the tax bases of assets and liabilities and their reported amounts in the financial statements. These balances are measured using the enacted tax rates expected to apply in the year(s) in which these temporary differences are expected to reverse. The effect of a change in tax rates on deferred income taxes is recognized in income in the period when the change is enacted.
33
MANAGEMENT’S DISCUSSION AND ANALYSIS OF FINANCIAL CONDITION AND RESULTS OF OPERATIONS
Based on consideration of all available evidence regarding their utilization, we record net deferred tax assets to the extent that it is more likely than not that they will be realized. Where, based on the weight of all available evidence, it is more likely than not that some amount of a deferred tax asset will not be realized, we establish a valuation allowance for the amount that, in our judgment, is sufficient to reduce the deferred tax asset to an amount that is more likely than not to be realized. The evidence we consider in reaching such conclusions includes, but is not limited to; (1) future reversals of existing taxable temporary differences, (2) future taxable income exclusive of reversing taxable temporary differences, (3) taxable income in prior carryback year(s) if carryback is permitted under the tax law, (4) cumulative losses in recent years, (5) a history of tax losses or credit carryforwards expiring unused, (6) a carryback or carryforward period that is so brief it limits realization of tax benefits, and (7) a strong earnings history exclusive of the loss that created the carryforward and support showing that the loss is an aberration rather than a continuing condition.
We account for unrecognized tax benefits in accordance with ASC 740, which prescribes a minimum probability threshold that a tax position must meet before a financial statement benefit is recognized. The minimum threshold is defined as a tax position that is more likely than not to be sustained upon examination by the applicable taxing authority, including resolution of any related appeals or litigation, based solely on the technical merits of the position. The tax benefit recognized is the largest amount of benefit that is greater than 50% likely of being realized upon ultimate settlement.
We recognize interest and penalties related to unrecognized tax benefits within the income tax expense line of the Consolidated and Combined Statement of Operations, while accrued interest and penalties are included within the related tax liability line of the Consolidated Balance Sheets.
Goodwill and Other Intangible Assets.As of December 31, 2025, we had $1,164.0 million of goodwill and $557.2 million of net intangible assets, of which $45.5 million were intangibles with indefinite useful lives included within intellectual property rights. As of December 31, 2024, we had $956.6 million of goodwill and $419.3 million of net intangible assets, of which $45.5 million were intangibles with indefinite useful lives included within intellectual property rights.
Our business acquisitions have typically resulted in the recognition of goodwill and other intangible assets. We follow the provisions under ASC Topic 350, “Intangibles – Goodwill and Other” (“ASC 350”) as it relates to the accounting for goodwill in the Consolidated and Combined Financial Statements. These provisions require that we, on at least an annual basis, evaluate the fair value of the reporting units to which goodwill is assigned and attributed and compare that fair value to the carrying value of the reporting unit to determine if an impairment has occurred. We perform our annual impairment testing during the fourth quarter. Impairment testing takes place more often than annually if events or circumstances indicate a change in status that would indicate a potential impairment. We believe that there have been no events or circumstances which would more likely than not reduce the fair value of our reporting units below its carrying value. A reporting unit is an operating segment unless discrete financial information is prepared and reviewed by segment management for businesses one level below that operating segment (a “component”), in which case the component would be the reporting unit. As of December 31, 2025, we had three reporting units.
When performing our annual impairment assessment, we compare the fair value of each of our reporting units to our respective carrying value. Goodwill is potentially impaired when the net book value of the reporting unit exceeds its estimated fair value. Fair values are established primarily by discounting estimated future cash flows at an estimated cost of capital which varies for each reporting unit and which, as of our most recent annual impairment assessment, ranged between 11.0% and 12.0% (a weighted average of 11.5%), reflecting the respective inherent business risk of each of the reporting units tested. This methodology for valuing our reporting units (commonly referred to as the Income Method) has not changed since the adoption of the provisions under ASC 350. The determination of discounted cash flows is based on the businesses’ strategic plans and long-range planning forecasts, which change from year to year. The revenue growth rates included in the forecasts represent best estimates based on current and forecasted market conditions. Profit margin assumptions are projected by each reporting unit based on the current cost structure and anticipated net cost increases/reductions.
There are inherent uncertainties related to these assumptions, including changes in factors outside management control such as market conditions, and management judgment is necessary in applying them to the analysis of goodwill impairment. In addition to the foregoing, for each reporting unit, market multiples are used to corroborate discounted cash flow results where fair value is estimated based on earnings multiples determined by available public information of comparable businesses. No impairment charges have been required during 2025, 2024 and 2023.
34
MANAGEMENT’S DISCUSSION AND ANALYSIS OF FINANCIAL CONDITION AND RESULTS OF OPERATIONS
Furthermore, to evaluate the sensitivity of the fair value calculations on the goodwill impairment test, we applied a hypothetical, reasonably possible 10% decrease to the fair values of each reporting unit. The effects of this hypothetical 10% decrease would still result in a fair value calculation significantly exceeding our carrying value for each of our reporting units, except for the recently acquired Authentication reporting unit which was less than 10%. Authentication’s goodwill represents 27.9% of the total goodwill of the Company. Due to the nature of acquisitions, these reporting units are inherently more sensitive to fluctuations in projected performance or market conditions. Although we believe our estimates and assumptions are reasonable, actual results may differ due to factors such as market conditions, interest rate changes, or lower than expected business performance. If they do, goodwill and other intangible assets could become impaired, requiring a charge against net earnings.
Intangibles with indefinite useful lives are tested annually for impairment, or when events or changes in circumstances indicate the potential for impairment. If the carrying amount of an indefinite lived intangible asset exceeds its fair value, the intangible asset is written down to its fair value. Fair value is calculated using the relief from royalty method. We amortize the cost of definite-lived intangibles over their estimated useful lives.
We review all our definite-lived intangible assets for impairment whenever events or changes in circumstances indicate the carrying amount of an asset may not be recoverable. Examples of events or changes in circumstances could include, but are not limited to, a prolonged economic downturn, current period operating or cash flow losses combined with a history of losses or a forecast of continuing losses associated with the use of an asset or asset group, or a current expectation that an asset or asset group will be sold or disposed of before the end of its previously estimated useful life. During the year ended December 31, 2025, we impaired software related to a discontinued product line of $1.5 million as a result of the integration of DLR and OpSec businesses within our SAT segment. See Note 16, “Restructuring”. Recoverability is based upon projections of anticipated future undiscounted cash flows associated with the use and eventual disposal of the definite-lived intangible asset (or asset group), as well as specific appraisal in certain instances. Reviews occur at the lowest level for which identifiable cash flows are largely independent of cash flows associated with other long-lived assets or asset groups and include estimated future revenues, gross profit margins, operating profit margins and capital expenditures which are based on the businesses’ strategic plans and long-range planning forecasts, which change from year to year. The revenue growth rates included in the forecasts represent our best estimates based on current and forecasted market conditions, and the profit margin assumptions are based on the current cost structure and anticipated net cost increases or reductions. There are inherent uncertainties related to these assumptions, including changes in market conditions, and management’s judgment in applying them to the analysis. If the future undiscounted cash flows are less than the carrying value, then the definite-lived intangible asset is considered impaired and a charge would be taken against net earnings based on the amount by which the carrying amount exceeds the estimated fair value. Judgments that we make which impact these assessments relate to the expected useful lives of definite lived assets and its ability to realize any undiscounted cash flows in excess of the carrying amounts of such assets and are affected primarily by changes in the expected use of the assets, changes in technology or development of alternative assets, changes in economic conditions, changes in operating performance and changes in expected future cash flows. Since judgment is involved in determining the recoverable amount of definite-lived intangible assets, there is risk that the carrying value of our definite-lived intangible assets may require adjustment in future periods. Historical results to date have generally approximated expected cash flows for the identifiable cash flow generating level. We believe there have been no events, other than described above, or circumstances which would more likely than not reduce the fair value of our indefinite-lived or any of our definite-lived intangible assets below their carrying value. As of the last annual assessment, fair values have been substantially in excess of carrying values.
Recent Accounting Pronouncements
Information regarding new accounting pronouncements is included in Item 8 under Note 1 to the Consolidated and Combined Financial Statements.
35
Item 7A. Quantitative and Qualitative Disclosures About Market Risk.
Our cash flows and earnings are subject to fluctuations from changes in interest rates and foreign currency exchange rates. We manage our exposures to these market risks through internally established policies and procedures and, when deemed appropriate, through the use of interest-rate swap agreements and forward exchange contracts. We do not enter into derivatives or other financial instruments for trading or speculative purposes.
Total debt outstanding was $1,139.5 million as of December 31, 2025, which was at fixed rates of interest ranging from 4.20% to 6.55% and variable rates of interest of:
(a) an adjusted term Secured Overnight Financing Rate (SOFR) plus a credit spread adjustment of 0.10% for the applicable interest period plus a margin ranging from 1.50% to 2.25% on the Revolving Facility, or
(b) a base rate plus a margin ranging from 0.50% to 1.25%, in each case, with such margin determined based on the lower of the ratings issued by Moody’s and S&P of senior, unsecured long-term debt (the “Ratings”) and our total net leverage ratio, and
(c) an adjusted term Sterling Overnight Index Average (SONIA) plus a credit spread adjustment of 0.10% for that applicable interest period plus a margin of 1.50% to 2.25% under Term Loan A, and
(d) a Euro Interbank offered Rate (EURIBOR) plus a credit spread of 2.75% under Term Loan B.
We are required to pay a fee on undrawn commitments under the Revolving Facility at a rate per annum that ranges from 0.20% to 0.35%, based on the lower of the Ratings and our total net leverage ratio.
The following is an analysis of the potential changes in interest rates and currency exchange rates based upon sensitivity analysis that models effects of shifts in rates. These are not forecasts.
•47% of our year-end portfolio is comprised of fixed-rate debt, while the remaining 53% is variable-rate debt and therefore subject to market change in interest rates. As of December 31, 2025, a hypothetical 1% increase in prevailing interest rates would increase our 2025 interest expense by approximately $6.2 million.
•Based on a sensitivity analysis as of December 31, 2025, a 10% change in the foreign currency exchange rates for the year ended December 31, 2025 would have impacted our net earnings by approximately $7.4 million, due primarily to the euro, Japanese yen, British pound and Swedish krona. This calculation assumes that all currencies change in the same direction and proportion relative to the U.S. dollar and there are no indirect effects, such as changes in non-U.S. dollar sales volumes or prices.
To help mitigate foreign currency translation risk on our international operations, in the fourth quarter of 2025 we designated our euro‑denominated Term Loan B as a net investment hedge of certain foreign subsidiaries. This strategy aligns a portion of our debt with the currency of our international investments so that changes in exchange rates affect the debt and the underlying net investment in offsetting directions. As a result, the currency‑related impact of this hedge is recorded in CTA, a component of AOCI, rather than in earnings. This reduces period‑to‑period volatility in our results that would otherwise arise from movements in foreign exchange rates, while providing a more stable reflection of the underlying economic exposure of our international holdings.
36
Item 8. Financial Statements and Supplementary Data
MANAGEMENT’S RESPONSIBILITY FOR FINANCIAL REPORTING
The accompanying consolidated and combined financial statements of Crane NXT, Co. and subsidiaries have been prepared by management in conformity with accounting principles generally accepted in the United States of America and, in the judgment of management, present fairly and consistently the Company’s financial position and results of operations and cash flows. These statements by necessity include amounts that are based on management’s best estimates and judgments and give due consideration to materiality.
Management is responsible for establishing and maintaining adequate internal control over financial reporting. The Company’s internal control system was designed to provide reasonable assurance to the Company’s management and Board of Directors regarding the preparation and fair presentation of published financial statements.
All internal control systems, no matter how well designed, have inherent limitations. Therefore, even those systems determined to be effective can provide only reasonable assurance with respect to financial statement preparation and presentation.
Management assessed the effectiveness of the Company’s internal control over financial reporting as of December 31, 2025. In making its assessment, management has utilized the criteria set forth by the Committee of Sponsoring Organizations of the Treadway Commission in its Internal Control—Integrated Framework, released in 2013. Based on our assessment we believe that, as of December 31, 2025, the Company’s internal control over financial reporting is effective based on those criteria.
The Company completed the acquisition of De La Rue Authentication Solutions (“DRL”) on May 1, 2025. The Company has not yet fully incorporated DLR’s internal controls and procedures into the Company’s internal control over financial reporting and will be completed within the time provided by the applicable rules and regulations of the SEC for a recently acquired business. As such, management excluded DLR from its assessment of the effectiveness of the Company’s internal control over financial reporting as of December 31, 2025. DLR constituted approximately 4% of the Company’s total assets, excluding the preliminary value of goodwill and purchased intangible assets, and approximately 5% of the Company’s total net sales as of and for the year ended December 31, 2025.
Deloitte & Touche LLP, the independent registered public accounting firm that also audited the Company’s consolidated and combined financial statements included in this Annual Report on Form 10-K, audited the internal control over financial reporting as of December 31, 2025, and issued their related attestation report which is included herein.
/s/ Aaron W. Saak
Aaron W. Saak
President and Chief Executive Officer
(Principal Executive Officer)
/s/ Christina Cristiano
Christina Cristiano
Senior Vice President and Chief Financial Officer
(Principal Financial Officer)
The Section 302 certifications of the Company’s Chief Executive Officer and its Chief Financial Officer have been filed as Exhibit 31 to the Company’s Annual Report on Form 10-K for the fiscal year ended December 31, 2025.
37
REPORT OF INDEPENDENT REGISTERED PUBLIC ACCOUNTING FIRM
To the Shareholders and the Board of Directors of Crane NXT, Co.
Opinion on the Financial Statements
We have audited the accompanying consolidated balance sheets of Crane NXT, Co. and subsidiaries (the "Company") as of December 31, 2025, and 2024, the related consolidated and combined statements of operations, comprehensive income, cash flows, and changes in equity, for each of the three years in the period ended December 31, 2025, and the related notes (collectively referred to as the "financial statements"). In our opinion, the financial statements present fairly, in all material respects, the financial position of the Company as of December 31, 2025, and 2024, and the results of its operations and its cash flows for each of the three years in the period ended December 31, 2025, in conformity with accounting principles generally accepted in the United States of America.
We have also audited, in accordance with the standards of the Public Company Accounting Oversight Board (United States) (PCAOB), the Company's internal control over financial reporting as of December 31, 2025, based on criteria established in Internal Control — Integrated Framework (2013) issued by the Committee of Sponsoring Organizations of the Treadway Commission and our report dated February 26, 2026, expressed an unqualified opinion on the Company's internal control over financial reporting.
Basis for Opinion
These financial statements are the responsibility of the Company's management. Our responsibility is to express an opinion on the Company's financial statements based on our audits. We are a public accounting firm registered with the PCAOB and are required to be independent with respect to the Company in accordance with the U.S. federal securities laws and the applicable rules and regulations of the Securities and Exchange Commission and the PCAOB.
We conducted our audits in accordance with the standards of the PCAOB. Those standards require that we plan and perform the audit to obtain reasonable assurance about whether the financial statements are free of material misstatement, whether due to error or fraud. Our audits included performing procedures to assess the risks of material misstatement of the financial statements, whether due to error or fraud, and performing procedures that respond to those risks. Such procedures included examining, on a test basis, evidence regarding the amounts and disclosures in the financial statements. Our audits also included evaluating the accounting principles used and significant estimates made by management, as well as evaluating the overall presentation of the financial statements. We believe that our audits provide a reasonable basis for our opinion.
Emphasis of Matter
As described in Note 1 to the financial statements, the financial statements have been prepared on a stand-alone basis and prior to April 3, 2023 are derived from the consolidated financial statements and accounting records of Crane Holdings, Co. (“Holdings”). Prior to April 3, 2023, the financial statements include expense allocations for certain corporate functions and services historically provided by Holdings. These allocated costs could differ from the actual expense that would have been incurred had the Company operated as an independent, publicly traded company.
Critical Audit Matter
The critical audit matter communicated below is a matter arising from the current-period audit of the financial statements that was communicated or required to be communicated to the audit committee and that (1) relates to accounts or disclosures that are material to the financial statements and (2) involved our especially challenging, subjective, or complex judgments. The communication of critical audit matters does not alter in any way our opinion on the financial statements, taken as a whole, and we are not, by communicating the critical audit matter below, providing a separate opinion on the critical audit matter or on the accounts or disclosures to which it relates.
38
Revenue Recognition – Over Time Basis — Refer to Note 1 to the financial statements
Critical Audit Matter Description
The Company recognizes revenue as they fulfill their performance obligations and transfer control of products to their customers. The Company has certain revenue contracts with the U.S. government. The clauses of those contracts stipulate that any amounts included in work-in-progress are the property of the U.S. government as they own any work-in progress as the contracted product is being built. The Company uses the cost-to-cost method of determining their progress, measuring progress by comparing costs incurred to date to the total estimated costs to provide the performance obligation.
We identified revenue recognized over time on U.S. government contracts as a critical audit matter because of the judgments necessary for management to determine the estimated margin used to recognize over time revenue. This required a high degree of auditor judgment when performing audit procedures to audit management’s estimated margin at completion and evaluating the results of those procedures.
How the Critical Audit Matter Was Addressed in the Audit
Our audit procedures performed related to the recognition of revenue recognized over time included the following, among others:
•We tested the effectiveness of controls related to the revenue recognized over time, including management’s controls over costs incurred to date and estimates of margin at completion, as well as the accurate classification of contracts in the system during the order entry process.
•We selected a sample of revenue transactions that were recognized over time and performed the following:
•Evaluated whether the contracts were properly included in management’s calculation of over time revenue based on the terms and conditions of each contract, including whether continuous transfer of control to the customer occurred as progress was made toward fulfilling the performance obligation.
•Evaluated the appropriateness and consistency of the methods of calculation and assumptions used by management to develop the margin at completion applied to determine the revenue recognized.
•We tested the mathematical accuracy and completeness of management’s calculation of revenue recognized.
•We observed the Company’s physical inventory counts to test the existence of inventory related to the U.S. government.
•We evaluated management’s ability to estimate future costs and margins at completion accurately by comparing actual costs and margins at completion for similar contracts that were previously completed to management’s historical estimates for such contracts.
/s/ Deloitte & Touche LLP
Stamford, Connecticut
February 26, 2026
We have served as the Company's auditor since 2022.
39
CRANE NXT, CO. AND SUBSIDIARIES
CONSOLIDATED AND COMBINED STATEMENTS OF OPERATIONS
For the Years Ended December 31,
(in millions, except per share data)
2025
2024
2023
Net sales
$
1,656.7
$
1,486.8
$
1,391.3
Operating costs and expenses:
Cost of sales
952.9
821.7
737.2
Selling, general and administrative
440.3
386.2
366.8
Restructuring charges
16.8
10.1
0.5
Operating profit
246.7
268.8
286.8
Other income (expense):
Interest income
1.0
1.6
1.1
Interest expense
(60.3)
(47.8)
(48.1)
Related party interest expense
—
—
(2.5)
Equity investment (loss) gain
(11.5)
0.8
—
Miscellaneous income, net
5.1
3.0
2.5
Total other expense, net
(65.7)
(42.4)
(47.0)
Income before income taxes
181.0
226.4
239.8
Provision for income taxes
35.9
42.3
51.5
Net income before allocation to noncontrolling interest
$
145.1
$
184.1
$
188.3
Less: Noncontrolling interest in subsidiaries’ earnings
$
—
$
—
$
—
Net income attributable to common shareholders
$
145.1
$
184.1
$
188.3
Earnings per share:
Basic
$
2.53
$
3.22
$
3.31
Diluted
$
2.50
$
3.19
$
3.28
Average shares outstanding:
Basic
57.4
57.1
56.8
Diluted
58.0
57.8
57.5
See Notes to Consolidated and Combined Financial Statements.
40
CRANE NXT, CO. AND SUBSIDIARIES
CONSOLIDATED AND COMBINED STATEMENTS OF COMPREHENSIVE INCOME
For the Years Ended December 31,
(in millions)
2025
2024
2023
Net income before allocation to noncontrolling interest
$
145.1
$
184.1
$
188.3
Components of other comprehensive income (loss), net of tax
Currency translation adjustment
72.2
(50.9)
18.1
Changes in pension and postretirement plan assets and benefit obligation, net of tax
0.5
(3.1)
(5.2)
Other comprehensive income (loss), net of tax
72.7
(54.0)
12.9
Comprehensive income before allocation to noncontrolling interest
$
217.8
$
130.1
$
201.2
Less: Noncontrolling interest in comprehensive income
—
—
—
Comprehensive income attributable to common shareholders
$
217.8
$
130.1
$
201.2
See Notes to Consolidated and Combined Financial Statements.
41
CRANE NXT, CO. AND SUBSIDIARIES
CONSOLIDATED BALANCE SHEETS
Balance as of December 31,
(in millions, except shares and per share data)
2025
2024
Assets
Current assets:
Cash and cash equivalents
$
233.8
$
165.8
Accounts receivable, net
351.8
265.9
U.S. and foreign taxes on income
12.7
8.6
Inventories, net
169.5
144.8
Other current assets
85.1
57.4
Total current assets
852.9
642.5
Property, plant and equipment, net
303.8
272.3
Long-term deferred tax assets
2.5
2.2
Investment in equity affiliates and joint ventures
139.4
1.3
Intangible assets, net
557.2
419.3
Goodwill
1,164.0
956.6
Other assets
96.6
92.3
Total assets
$
3,116.4
$
2,386.5
Liabilities and equity
Current liabilities:
Short-term borrowings
$
135.1
$
210.0
Accounts payable
132.3
116.6
Accrued liabilities
273.0
211.2
U.S. and foreign taxes on income
28.7
24.6
Total current liabilities
569.1
562.4
Long-term debt
1,004.4
540.6
Accrued pension and postretirement benefits
19.1
19.4
Long-term deferred tax liability
151.0
119.0
Other liabilities
116.0
80.2
Total liabilities
1,859.6
1,321.6
Commitments and contingencies (Note 13)
Redeemable noncontrolling Interests
6.9
—
Equity:
Preferred shares, par value 0.01; 5,000,000 shares authorized
—
—
Common shares, par value $1.00; 200,000,000 shares authorized; 72,441,647 shares issued; 57,441,541 shares and 57,197,147 shares outstanding as of December 31, 2025 and 2024, respectively
72.4
72.4
Capital surplus
1,716.5
1,719.9
Retained earnings
374.5
268.4
Accumulated other comprehensive loss
(99.9)
(172.6)
Treasury stock; 15,000,106 and 15,244,500 treasury shares as of December 31, 2025 and 2024, respectively
(810.5)
(823.2)
Total shareholders’ equity
1,253.0
1,064.9
Nonredeemable noncontrolling interests
(3.1)
—
Total equity
1,249.9
1,064.9
Total liabilities, redeemable noncontrolling interests, and equity
$
3,116.4
$
2,386.5
See Notes to Consolidated and Combined Financial Statements.
42
CRANE NXT, CO. AND SUBSIDIARIES
CONSOLIDATED AND COMBINED STATEMENTS OF CASH FLOWS
For the Years Ended December 31,
(in millions)
2025
2024
2023
Operating activities:
Net income before allocation to noncontrolling interest
$
145.1
$
184.1
$
188.3
Adjustments to reconcile net income to net cash flows provided by operating activities:
Loss (income) from equity investments
11.5
(0.8)
—
Depreciation and amortization
106.6
86.8
77.6
Stock-based compensation expense
12.7
10.6
10.3
(Gain) loss on forward contracts
(4.7)
3.0
—
Defined benefit plans and postretirement credit
(0.8)
(2.1)
(1.1)
Deferred income taxes
(14.8)
(17.6)
7.6
Cash used for operating working capital
(17.0)
(50.6)
—
Other
2.9
0.7
(6.4)
Total provided by operating activities
$
241.5
$
214.1
$
276.3
Investing activities:
Payment for acquisitions, net of cash acquired
$
(391.1)
$
(269.9)
$
—
Purchase of investments1
(116.5)
—
—
Capital expenditures
(43.2)
(45.4)
(31.1)
Settlement of forward contracts
1.7
(2.7)
—
Proceeds from disposition of assets
0.1
—
—
Total used for investing activities
$
(549.0)
$
(318.0)
$
(31.1)
Financing activities:
Dividends paid
$
(39.0)
$
(36.6)
$
(23.7)
Proceeds from share subscriptions
21.4
—
—
Proceeds from stock options exercised
2.6
3.3
5.0
Payment of tax withholding on equity awards vested
(6.2)
(6.9)
(0.6)
Debt issuance costs
(22.3)
(2.7)
(5.7)
Repayment of long-term debt
—
—
(300.0)
Proceeds from revolving credit facility
406.5
448.5
20.0
Repayment of revolving credit facility
(490.5)
(238.5)
(20.0)
Proceeds from term loans
532.0
—
350.0
Repayment of term loan
(40.9)
(105.0)
(245.0)
Net transfers to Crane
—
—
(32.5)
Total provided by (used for) financing activities
$
363.6
$
62.1
$
(252.5)
Effect of exchange rates on cash, cash equivalents and restricted cash
16.7
(12.0)
3.8
Increase (decrease) in cash, cash equivalents and restricted cash
72.8
(53.8)
(3.5)
Cash, cash equivalents and restricted cash at beginning of period
173.4
227.2
230.7
Cash, cash equivalents and restricted cash at end of period
$
246.2
$
173.4
$
227.2
See Notes to Consolidated and Combined Financial Statements.
43
CRANE NXT, CO. AND SUBSIDIARIES
CONSOLIDATED AND COMBINED STATEMENTS OF CASH FLOWS
For the Years Ended December 31,
2025
2024
2023
Detail of cash (used for) provided by operating working capital
Accounts receivable
$
(46.8)
$
(44.4)
$
(6.3)
Inventories
5.2
21.3
(1.0)
Other current assets
(16.4)
(9.0)
—
Accounts payable
5.9
5.7
(6.8)
Accrued liabilities
37.0
(28.4)
(2.5)
U.S. and foreign taxes on income
(1.9)
4.2
16.6
Total
$
(17.0)
$
(50.6)
$
—
Supplemental disclosure of cash flow information:
Interest paid
$
55.6
$
44.1
$
45.1
Income taxes paid, net
$
50.9
$
63.8
$
46.0
Unpaid capital expenditures
$
2.5
$
7.2
$
7.1
1Non-cash investing activities (see Note 1)
$
21.3
$
—
$
—
See Notes to Consolidated and Combined Financial Statements.
44
CRANE NXT, CO. AND SUBSIDIARIES
CONSOLIDATED AND COMBINED STATEMENTS OF CHANGES IN EQUITY
(in millions, except share data)
Common Shares Issued at Par Value
Capital Surplus
Retained Earnings
Accumulated Other Comprehen- sive Loss
Treasury Stock
Crane Net Investment
Total Share-holders’ Equity
Non-controlling Interest
Total Equity
BALANCE DECEMBER 31, 2022
$
—
$
—
$
—
$
(131.5)
$
—
$
915.3
$
783.8
$
—
$
783.8
Net income
—
—
144.6
—
—
43.7
188.3
—
188.3
Cash dividends ($0.42 per share)
—
—
(23.7)
—
—
—
(23.7)
—
(23.7)
Dividend from Crane
—
—
—
—
—
275.0
275.0
—
275.0
Net Transfers to Crane
—
—
—
—
—
(285.2)
(285.2)
—
(285.2)
Reclassification of Crane Net Investment to Common Stock, Treasury Stock and Capital Surplus
72.4
1,726.8
—
—
(848.1)
(951.1)
—
—
—
Exercise of stock options, net of shares reacquired of 158,132 shares
—
—
—
—
5.0
—
5.0
—
5.0
Stock-based compensation
—
6.5
—
—
—
2.3
8.8
—
8.8
Stock-based compensation reclassificationa
—
(0.3)
—
—
—
—
(0.3)
—
(0.3)
Impact from settlement of share-based awards, net of shares acquired
—
(4.9)
—
—
4.3
—
(0.6)
—
(0.6)
Changes in pension and postretirement plan assets and benefit obligation, net of tax
—
—
—
(5.2)
—
—
(5.2)
—
(5.2)
Currency translation adjustment
—
—
—
18.1
—
—
18.1
—
18.1
BALANCE DECEMBER 31, 2023
$
72.4
$
1,728.1
$
120.9
$
(118.6)
$
(838.8)
$
—
$
964.0
$
—
$
964.0
Net income
—
—
184.1
—
—
—
184.1
—
184.1
Cash dividends ($0.64 per share)
—
—
(36.6)
—
—
—
(36.6)
—
(36.6)
Exercise of stock options, net of shares reacquired of 118,896 shares
—
—
—
—
3.3
—
3.3
—
3.3
Stock-based compensation
—
9.8
—
—
—
—
9.8
—
9.8
Impact from settlement of share-based awards, net of shares acquired
—
(18.0)
—
—
12.3
—
(5.7)
—
(5.7)
Changes in pension and postretirement plan assets and benefit obligation, net of tax
—
—
—
(3.1)
—
—
(3.1)
—
(3.1)
Currency translation adjustment
—
—
—
(50.9)
—
—
(50.9)
—
(50.9)
BALANCE DECEMBER 31, 2024
$
72.4
$
1,719.9
$
268.4
$
(172.6)
$
(823.2)
$
—
$
1,064.9
$
—
$
1,064.9
Noncontrolling interest of acquired entity
—
—
—
—
—
—
—
(3.6)
(3.6)
Net income
—
—
145.1
—
—
—
145.1
—
145.1
Cash dividends ($0.68 per share)
—
—
(39.0)
—
—
—
(39.0)
—
(39.0)
Redeemable noncontrolling interest adjustment
(0.5)
—
—
—
—
(0.5)
0.5
—
Exercise of stock options, net of shares reacquired of 86,634 shares
—
—
—
—
2.6
—
2.6
—
2.6
Stock-based compensation
—
12.2
—
—
—
—
12.2
—
12.2
Impact from settlement of share-based awards, net of shares acquired
—
(15.1)
—
—
10.1
—
(5.0)
—
(5.0)
Changes in pension and postretirement plan assets and benefit obligation, net of tax
—
—
—
0.5
—
—
0.5
—
0.5
Currency translation adjustment
—
—
—
72.2
—
—
72.2
—
72.2
BALANCE DECEMBER 31, 2025
$
72.4
$
1,716.5
$
374.5
$
(99.9)
$
(810.5)
$
—
$
1,253.0
$
(3.1)
$
1,249.9
(a)Reclassification of stock-based compensation due to modification resulting from equity award conversions. See Note 8, “Stock-Based Compensation Plans” for additional information.
See Notes to Consolidated and Combined Financial Statements.
45
NOTES TO CONSOLIDATED AND COMBINED FINANCIAL STATEMENTS
Note 1 – Nature of Operations and Significant Accounting Policies
Nature of Operations
Crane NXT, Co. is a leading provider of trusted technology solutions to secure, detect, and authenticate our customers’ most valuable assets. We are comprised of two reporting segments: Crane Payment Innovations (“CPI”) and Security and Authentication Technologies (“SAT”). Our primary end markets include governments, brands, financial institutions and a wide range of consumer related end markets including convenience merchandising (vending), retail and gaming. See Note 4, “Segment Results” for the relative size of these segments in relation to the total company (both net sales and total assets).
References herein to “Crane NXT,” “we,” “us” and “our” refer to Crane NXT, Co. and its subsidiaries, including when Crane NXT, Co. was named “Crane Holdings, Co.” unless the context implies otherwise. References to the “Business” refer to our business, including prior to the Separation (as defined below) when it was a business of Crane Holdings, Co. References herein to “Holdings” refer to Crane Holdings, Co. and its subsidiaries prior to the consummation of the Separation unless the context implies otherwise.
Separation
On April 3, 2023, Holdings was separated (the “Separation”) into two independent, publicly-traded companies, Crane NXT, Co. and Crane Company (“SpinCo”), through a pro-rata distribution (the “Distribution”) of all the issued and outstanding common stock of SpinCo to the stockholders of Holdings. As part of the Separation, the Aerospace & Electronics, Process Flow Technologies and Engineered Materials businesses of Holdings were spun off to SpinCo. Also, as part of the Separation, Holdings retained the Payment and Merchandising Technologies business and was renamed “Crane NXT, Co.” on April 3, 2023. Following the consummation of the Separation, our common stock is listed under the symbol “CXT” on the New York Stock Exchange.
Due to SpinCo’s larger operations, greater tangible assets, greater fair value and greater net sales, in each case, relative to ours, among other factors, SpinCo was considered to be the “accounting spinnor” and therefore is the “accounting successor” to Holdings for accounting purposes, notwithstanding the legal form of the Separation. As such, our financial statements for periods prior to the Separation are comprised of combined carve-out financial statements representing only our operations, assets, liabilities and equity on a stand-alone basis derived from the consolidated financial statements and accounting records of Holdings.
The primary source of the cash on hand as of the date of Separation was due to a transfer from Holdings to us as part of the Separation.
Separation Agreements
On April 3, 2023, we entered into definitive agreements with SpinCo in connection with the Separation.The agreements set forth the terms and conditions of the Separation and provide a framework for our relationship with SpinCo following the Separation, including the allocation between us and SpinCo of our and SpinCo’s assets, liabilities and obligations attributable to periods prior to, at and after the Separation. These agreements include the Separation and Distribution Agreement, which contains certain key provisions related to the Separation, as well as a Transition Services Agreement, a Tax Matters Agreement, an Employee Matters Agreement and an Intellectual Property Matters Agreement. As of December 31, 2024, the term of the Transition Services Agreement has expired.
Significant Accounting Policies
Accounting Principles.Our Consolidated and Combined Financial Statements are prepared in conformity with accounting principles generally accepted in the United States of America (“U.S. GAAP”) and, therefore, reflect all adjustments which are, in the opinion of management, necessary for a fair statement of the results for the years presented. All such adjustments are of a normal recurring nature. The Consolidated and Combined Financial Statements include the accounts of Crane NXT, Co. and our subsidiaries.
Basis of presentation. The Business' financial statements for periods prior to the Separation are prepared on a "carve-out" basis, as described below.Prior to the Separation, the Business operated as Holdings’ Payment & Merchandising Technologies (“P&MT”) segment; consequently, stand-alone financial statements for periods prior to the Separation were not prepared for the Business.
46
NOTES TO CONSOLIDATED AND COMBINED FINANCIAL STATEMENTS
The Consolidated and Combined Financial Statements of Operations include all revenues and costs directly attributable to the Business, including costs for facilities, functions and services used by the Business. Prior to the Separation, costs for certain functions and services performed by centralized Holdings organizations were directly charged to the Business based on specific identification when possible or reasonable allocation methods such as net sales, headcount, usage or other allocation methods. The results of operations include allocations of costs for administrative functions and services performed on behalf of the Business by centralized groups within Holdings (see Note 2, “Related Parties” for a description of the allocation methodologies). All charges and allocations for facilities, functions and services performed by Holdings have been deemed settled in cash by the Business to Holdings in the period in which the cost was recorded in the Consolidated and Combined Statements of Operations. As more fully described in Note 10, “Income Taxes”, current and deferred income taxes have been determined based on the stand-alone results of the Business. However, because the Business filed group tax returns as part of Holdings in certain jurisdictions, the Business’ actual tax balances may differ from those reported. The Business’ portion of income taxes for certain jurisdictions is deemed to have been settled in the period the related tax expense was recorded.
Prior to the Separation, Holdings used a centralized approach to cash management and financing its operations. Accordingly, none of the cash of Holdings has been allocated to the Business in the Consolidated and Combined Financial Statements. However, cash balances primarily associated with certain of our foreign entities that did not participate in Holdings’ cash management program have been included in the Consolidated and Combined Financial Statements. Transactions between Holdings and the Business were deemed to have been settled immediately through “Crane Net Investment.” The net effect of the deemed settled transactions is reflected in the Consolidated and Combined Statements of Cash Flows as “Net transfers to Crane” within financing activities.
All intercompany accounts and transactions within the Business were eliminated in the preparation of the Consolidated and Combined Financial Statements. The Consolidated and Combined Financial Statements of the Business include assets and liabilities that have been determined to be specifically identifiable or otherwise attributable to the Business.
All allocations and estimates in the Consolidated and Combined Financial Statements are based on assumptions that management believes are reasonable. However, for the periods prior to the Separation, the Consolidated and Combined Financial Statements included herein may not be indicative of the financial position, results of operations and cash flows of the Business in the future, or if the Business had been a separate, stand-alone entity during the periods presented.
Due to rounding, numbers presented throughout this report may not add up precisely to totals we provide, and percentages may not precisely reflect the absolute figures.
Use of Estimates.Our accounting principles require management to make estimates and assumptions that affect the reported amounts of assets and liabilities at the date of the financial statements and the reported amounts of revenue and expense during the reporting period. Actual results may differ from those estimated. Estimates and assumptions are reviewed periodically, and the effects of revisions are reflected in the financial statements in the period in which they are determined to be necessary. Estimates are used when accounting for such items as asset valuations, allowance for doubtful accounts, depreciation and amortization, impairment assessments, reserve for excess and obsolete inventory, reserve for warranty provision, restructuring provisions, employee benefits, revenue recognition, taxes and contingencies.
Currency Translation. Assets and liabilities of subsidiaries that prepare financial statements in currencies other than the U.S. dollar are translated at the rate of exchange in effect on the balance sheet date; results of operations are translated at the monthly average rates of exchange prevailing during the year. The related translation adjustments are included in accumulated other comprehensive loss in a separate component of equity.
Non-cash Investing Activities. Total consideration for the Company’s acquisition of a 32.3% equity interest in Antares Vision was $137.8 million, consisting of $116.5 million in cash and $21.3 million of non‑cash consideration. The non‑cash consideration included $6.9 million of ordinary shares issued to Regolo S.p.A. at closing of the first phase and a $14.4 million obligation to issue additional ordinary shares to Regolo S.p.A. upon completion of the mandatory tender offer. See Note 3, “Acquisitions” for further details. The $21.3 million non‑cash component represents a non‑cash investing activity and is excluded from the Consolidated Statements of Cash Flows.
47
NOTES TO CONSOLIDATED AND COMBINED FINANCIAL STATEMENTS
Revenue Recognition.In accordance with Accounting Standards Codification (“ASC”) Topic 606 “Revenue from Contracts with Customers,” we recognize revenue when control of the promised goods or services in a contract transfers to the customer, in an amount that reflects the consideration we expect to be entitled to in exchange for those goods or services. We account for a contract when both parties have approved and committed to the terms, each party’s rights and payment obligations under the contract are identifiable, the contract has commercial substance, and it is probable that we will collect substantially all of the consideration. When shipping and handling activities are performed after the customer obtains control of product, we elect to account for shipping and handling as activities to fulfill the promise to transfer the product. In determining the transaction price of a contract, we exercise judgment to determine the total transaction price when it includes estimates of variable consideration, such as rebates and milestone payments. We generally estimate variable consideration using the expected value method and consider all available information (historical, current, and forecasted) in estimating these amounts. Variable consideration is only included in the transaction price to the extent that it is probable that a significant reversal of cumulative revenue recognized will not occur when the uncertainty associated with the variable consideration is resolved. We elect to exclude from the transaction price all taxes assessed by a governmental authority that are both imposed on and concurrent with a specific revenue-producing transaction and collected by us from a customer.
We primarily generate revenue through the manufacture and sale of technology solutions including advanced detection and sensing systems, software to authenticate and manage transactions, micro-optics materials technology, and anti-counterfeiting technology including micro-optics and micro lithography. Each product within a contract generally represents a separate performance obligation, as we do not provide a significant service of integrating or installing the products, the products do not customize each other, and the products can function independently of each other. Control of products generally transfers to the customer at a point in time, as the customer does not control the products as they are manufactured. We exercise judgment and consider the timing of right to payment, transfer of risk and rewards, transfer of title, transfer of physical possession, and customer acceptance when determining when control transfers to the customer. As a result, revenue from the sale of products is generally recognized at a point in time - either upon shipment or delivery - based on the specific shipping terms in the contract. When products are customized or products are sold directly to the U.S. government and certain foreign governments, revenue is recognized over time because control is transferred continuously to customers, as the contract progresses. We exercise judgment to determine whether the products have an alternative use to us. When an alternative use does not exist for these products and we are entitled to payment for performance completed to date which includes a reasonable profit margin, revenue is recognized over time. When a contract contains clauses indicating that the customer owns any work-in-progress as the contracted product is being built, revenue is recognized over time. The measure of progress applied by us is the cost-to-cost method as this provides the most faithful depiction of the pattern of transfer of control. Under this method, we measure progress by comparing costs incurred to date to the total estimated costs to provide the performance obligation. This method effectively reflects our progress toward completion, as this methodology includes any work-in-process amounts as part of the measure of progress. Costs incurred represent work performed, which corresponds with, and thereby depicts, the transfer of control to the customer. Total revenue recognized and cost estimates are updated monthly. In 2025, the Company recognized approximately $225 million in revenue over time related to products.
When there are multiple performance obligations in a single contract, the total transaction price is allocated to each performance obligation based on their relative standalone selling prices. We maximize the use of observable data inputs and consider all information (including market conditions, segment-specific factors, and information about the customer or class of customer) that is reasonably available. The standalone selling price for our products and services is generally determined using an observable list price, which differs by class of customer.
Revenue recognized from performance obligations satisfied in previous periods (for example, due to changes in the transaction price or estimates), was not material in any period.
Payment for most products is due within a limited time period after shipment or delivery, typically within 30-90 calendar days of the respective invoice dates. Customers generally do not make large upfront payments. Any advanced payments received do not provide us with a significant benefit of financing, as the payments are meant to secure materials used to fulfill the contract, as opposed to providing us with a significant financing benefit.
When an unconditional right to consideration exists, we record these amounts as receivables. When amounts are dependent on factors other than the passage of time for payment from a customer to become due, we record a contract asset. Contract assets represent unbilled amounts that typically arise from contracts for customized products or contracts for products sold directly to the U.S. government. Contract assets are assessed for impairment and recorded at their net realizable value. Contract liabilities represent advance payments from customers. Revenue related to contract liabilities is recognized when control is transferred to the customer.
48
NOTES TO CONSOLIDATED AND COMBINED FINANCIAL STATEMENTS
We pay sales commissions related to certain contracts, which qualify as incremental costs of obtaining a contract. However, the sales commissions generally relate to contracts for products or services satisfied at a point in time or over a period of time less than one year. As a result, we apply the practical expedient that allows an entity to recognize incremental costs of obtaining a contract as an expense when incurred if the amortization period of the asset that would have been recognized is one year or less.
See Note 5, “Revenue” for further details.
Cost of Sales. Cost of sales includes the costs of inventory sold and the related purchase and distribution costs. In addition to material, labor and direct overhead and inventoried cost, cost of sales includes allocations of other expenses that are part of the production process, such as inbound freight charges, purchasing and receiving costs, inspection costs, warehousing costs, amortization of production related intangible assets and depreciation expense. We also include costs directly associated with products sold, such as warranty provisions. We accrue warranty liabilities when it is probable that a liability has been incurred and the amount of the loss can be reasonably estimated.
Selling, General and Administrative Expenses. Selling, general and administrative expenses are recognized as incurred, or as allocated based on methodologies further discussed in Note 2, “Related Parties.” Such expenses include the costs of promoting and selling products and include such items as compensation, advertising, sales commissions and travel. Also included are costs related to compensation for other operating activities such as executive office administrative and engineering functions, as well as general operating expenses such as office supplies, non-income taxes, insurance and office equipment rentals.
Income Taxes. We account for income taxes in accordance with ASC Topic 740 “Income Taxes” (“ASC 740”) which requires an asset and liability approach for the financial accounting and reporting of income taxes. Under this method, deferred income taxes are recognized for the expected future tax consequences of differences between the tax bases of assets and liabilities and their reported amounts in the financial statements. These balances are measured using the enacted tax rates expected to apply in the year(s) in which these temporary differences are expected to reverse. The effect of a change in tax rates on deferred income taxes is recognized in income in the period when the change is enacted.
Based on consideration of all available evidence regarding their utilization, we record net deferred tax assets to the extent that it is more likely than not that they will be realized. Where, based on the weight of all available evidence, it is more likely than not that some amount of a deferred tax asset will not be realized, we establish a valuation allowance for the amount that, in management's judgment, is sufficient to reduce the deferred tax asset to an amount that is more likely than not to be realized. The evidence we consider in reaching such conclusions includes, but is not limited to, (1) future reversals of existing taxable temporary differences, (2) future taxable income exclusive of reversing taxable temporary differences, (3) taxable income in prior carryback year(s) if carryback is permitted under the tax law, (4) cumulative losses in recent years, (5) a history of tax losses or credit carryforwards expiring unused, (6) a carryback or carryforward period that is so brief it limits realization of tax benefits, and (7) a strong earnings history exclusive of the loss that created the carryforward and support showing that the loss is an aberration rather than a continuing condition.
We account for unrecognized tax benefits in accordance with ASC 740, which prescribes a minimum probability threshold that a tax position must meet before a financial statement benefit is recognized. The minimum threshold is defined as a tax position that is more likely than not to be sustained upon examination by the applicable taxing authority, including resolution of any related appeals or litigation, based solely on the technical merits of the position. The tax benefit recognized is the largest amount of benefit that is greater than 50% likely of being realized upon ultimate settlement.
We recognize interest and penalties related to unrecognized tax benefits within the provision for income taxes line of our Consolidated and Combined Statements of Operations, while accrued interest and penalties are included within the related tax liability line of our Consolidated Balance Sheets.
Income taxes as presented herein, for periods prior to the Separation, attribute current and deferred income taxes of Holdings to the Business’ stand-alone financial statements in a manner that is systematic, rational and consistent with the asset and liability method prescribed by ASC 740. Accordingly, the Business’ income tax provision was prepared following the separate return method. The separate return method applies ASC 740 to the stand-alone financial statements of each member of the consolidated group as if the group members were separate taxpayers. As a result, actual transactions included in the consolidated financial statements of Holdings may not be included in the separate Consolidated and Combined Financial Statements of the Business. Similarly, the tax treatment of certain items reflected in the Consolidated and Combined Financial Statements of the Business may not be reflected in the consolidated financial statements and tax returns of Holdings. Therefore, such items as net operating losses, credit carry forwards and valuation allowances may exist in the stand-alone financial statements that may or may not exist in Holdings’ consolidated financial statements. As such, the income taxes of the Business as presented in the Consolidated and Combined Financial Statements may not be indicative of the income taxes that the Business will generate in the future.
49
NOTES TO CONSOLIDATED AND COMBINED FINANCIAL STATEMENTS
Obligations for income taxes in jurisdictions where the Business files a combined tax return with Holdings were deemed settled with Holdings and are reflected within “Net transfers to Crane” as a financing activity in the Consolidated and Combined Statements of Cash Flows.
Research and Development. We conduct research and development activities for the purpose of developing new products and enhancing existing products. Research and development costs are expensed as incurred.
See Note 6, “Research and Development” for further details.
Capitalized Software Development Costs. We sell and market software that is integral to the functionality we provide to customers. Internal and external costs incurred for developing this software are charged to research and development expense until technological feasibility has been established, at which point the development costs are capitalized. Capitalized software development costs primarily include payroll, benefits and other headcount related expenses. Once the services are available for general release to customers, no additional costs are capitalized. Capitalized software development costs, net of impairment and accumulated amortization, were $7.0 million and $3.7 million as of December 31, 2025, and December 31, 2024, respectively, and are included in “Intangible assets, net” in the Consolidated Balance Sheets.
Stock-Based Compensation. We provide long-term incentive compensation through stock options, restricted share units, performance-based restricted share units and deferred stock units.
The Company recognizes stock-based compensation expense at the grant date based on the fair value of the award and recognizes the fair value on a straight-line basis over the vesting period, or as performance goals are achieved.
The Company uses the Black-Scholes option pricing model to estimate the fair value of stock options, with model assumptions including dividend yield, expected volatility, the risk-free interest rate and the expected life of the awards.
See Note 8, “Stock-Based Compensation Plans” for further details.
Earnings Per Share. Our basic earnings per share calculations are based on the weighted average number of common shares outstanding during the year. Potentially dilutive securities include outstanding stock options, restricted share units, deferred stock units and performance-based restricted share units that were issued to Crane NXT and SpinCo employees and directors. The effect of potentially dilutive securities is reflected in diluted earnings per common share by application of the treasury method. Diluted earnings per share gives effect to all potentially dilutive common shares outstanding during the year.
The weighted average number of common shares outstanding for the year ended December 31, 2025, 2024 and 2023, were based on the weighted average number of common shares after the Separation.
(in millions, except per share data) For the year ended December 31,
2025
2024
2023
Net income attributable to common shareholders
$
145.1
$
184.1
$
188.3
Average basic shares outstanding
57.4
57.1
56.8
Effect of dilutive share-based awards
0.6
0.7
0.7
Average diluted shares outstanding
58.0
57.8
57.5
Basic earnings per share
$
2.53
$
3.22
$
3.31
Diluted earnings per share
$
2.50
$
3.19
$
3.28
The computation of diluted earnings per share excludes the effect of the potential exercise of stock options when the average market price of the common stock is lower than the exercise price of the related stock options. During 2025, 2024 and 2023, the number of stock options excluded from the computation was 0.3 million, 0.2 million and 0.4 million, respectively.
50
NOTES TO CONSOLIDATED AND COMBINED FINANCIAL STATEMENTS
Business Combinations. Acquisitions are accounted for in accordance with ASC Topic 805, “Business Combinations” (“ASC 805”). Accordingly, we make an initial allocation of the purchase price at the date of acquisition based upon our understanding of the fair value of the acquired assets and assumed liabilities. We obtain this information during due diligence and through other sources. In the months after closing, as we obtain additional information about these assets and liabilities, including through tangible and intangible asset appraisals, we refine estimates of fair value and more accurately allocate the purchase price. Only items identified as of the acquisition date are considered for subsequent adjustment to the purchase price allocation. We will make appropriate adjustments to the purchase price allocation prior to completion of the measurement period, as required.
To allocate the consideration transferred for our acquisitions, the fair values of all identifiable assets and liabilities must be established. For accounting and financial reporting purposes, fair value is defined under ASC Topic 820, “Fair Value Measurement and Disclosure” as the price that would be received upon sale of an asset or the amount paid to transfer a liability in an orderly transaction between market participants at the measurement date. Market participants are assumed to be buyers and sellers in the principal (most advantageous) market for the asset or liability. Additionally, fair value measurements for an asset assume the highest and best use of that asset by market participants. Use of different estimates and judgments could yield different results.
See Note 3, “Acquisitions” for further details.
Equity Method Investments. The Company accounts for investments in joint ventures or other entities over which it has significant influence but does not have voting control using the equity method. Investments in entities over which the Company does not have significant influence or control are not material and are carried at cost.
Fair Value Measurements. Accounting standards define fair value as the price that would be received to sell an asset or paid to transfer a liability in an orderly transaction between market participants at the measurement date. Fair value measurements are to be considered from the perspective of a market participant that holds the asset or owes the liability. The standards also establish a fair value hierarchy which requires an entity to maximize the use of observable inputs and minimize the use of unobservable inputs when measuring fair value.
The standards describe three levels of inputs that may be used to measure fair value:
Level 1: Quoted prices in active markets for identical or similar assets and liabilities.
Level 2: Quoted prices for identical or similar assets and liabilities in markets that are not active or observable inputs other than quoted prices in active markets for identical or similar assets and liabilities. Level 2 assets and liabilities include over-the-counter derivatives, principally forward foreign exchange contracts, whose value is determined using pricing models with inputs that are generally based on published foreign exchange rates and exchange traded prices, adjusted for other specific inputs that are primarily observable in the market or can be derived principally from or corroborated by observable market data.
Level 3: Unobservable inputs that are supported by little or no market activity and that are significant to the fair value of the assets or liabilities.
Valuation Technique
The carrying value of our financial assets and liabilities, including cash and cash equivalents, accounts receivable and accounts payable approximate fair value, without being discounted, due to the short periods during which these amounts are outstanding.
We are exposed to certain risks related to our ongoing business operations, including market risks related to fluctuation in currency exchange. We use foreign exchange contracts to manage the risk of certain cross-currency business relationships to minimize the impact of currency exchange fluctuations on our earnings and cash flows. We do not hold or issue derivative financial instruments for trading or speculative purposes. We have foreign exchange contracts not designated as hedging instruments that are measured at fair value using internal models based on observable market inputs such as forward rates and interest rates. Based on these inputs, the derivatives are classified within Level 2 of the valuation hierarchy.
As a result of the Separation, all outstanding stock-based compensation awards of Holdings were exchanged for similarly valued stock-based compensation awards of either SpinCo, Crane NXT or both. The modification of the performance-based restricted share units resulted in a liability recorded upon Separation for awards that will be settled in SpinCo’s shares. The amount of the liability is measured at fair value using Level 1 inputs such as the quoted market price of the underlying company’s stock.
Long-term debt rates currently available to us for debt with similar terms and remaining maturities are used to estimate the fair value for debt issues that are not quoted on an exchange. The estimated fair value of long-term debt is measured using Level 2 inputs.
51
NOTES TO CONSOLIDATED AND COMBINED FINANCIAL STATEMENTS
As a result of the OpSec acquisition, we assumed a contingent liability related to a prior OpSec acquisition. The amount of the liability is measured at fair value using Level 3 inputs as the fair value is determined by estimating the net present value of the expected cash flows based on the probability of the achievement of the contingent revenue targets. See Note 3, “Acquisitions” for further details.
See Note 15, “Fair Value Measurements” for further details.
Net Investment Hedges. In December 2025, the Company designated its euro‑denominated Term Loan B debt as a net investment hedge of certain foreign operations. The objective of this designation is to mitigate the impact of foreign currency exchange rate fluctuations on the Company’s net investments in those subsidiaries. For hedges that qualify for net investment hedge accounting, the effective portion of changes in the carrying amount of the designated debt is recorded in Currency Translation Adjustment (“CTA”), a component of Accumulated Other Comprehensive Income (“AOCI”), until the related net investment is sold or substantially liquidated. We recorded $0.2 million gain in CTA for the year ended December 31, 2025.
Cash and Cash Equivalents. Cash and cash equivalents include highly liquid investments with original maturities of three months or less that are readily convertible to cash and are not subject to significant risk from fluctuations in interest rates. As a result, the carrying amount of cash and cash equivalents approximates fair value. Prior to the Separation, the Business participated in Holdings’ centralized cash management and financing programs (see Note 2, “Related Parties” for additional information). The cash reflected on the Consolidated Balance Sheets represents cash on hand at certain foreign entities that did not participate in the centralized cash management program and are specifically identifiable to the Business.
Restricted Cash.Cash that is legally restricted as to its withdrawal or usage is classified as restricted cash. For the years ended December 31, 2025 and 2024, restricted cash is primarily related to guarantees on future obligations. Current restricted cash, included within “Other current assets” in our Consolidated Balance Sheets, was $5.3 million and 0.8 million as of December 31, 2025, and 2024, respectively. Non-current restricted cash, included within “Other assets” in our Consolidated Balance Sheets, was $7.2 million and 6.8 million as of December 31, 2025, and 2024, respectively.
Accounts Receivable, Net. Accounts receivable are carried at net realizable value. The allowance for credit losses was $8.9 million and $7.7 million as of December 31, 2025, and 2024, respectively. The allowance for credit losses activity was not material to our financial results for the years ended December 31, 2025, and 2024. Concentrations of credit risk with respect to accounts receivable are limited due to the large number of customers, the nature of our customers, their credit worthiness, their relatively small account balances within our customer base and their dispersion across different businesses. We periodically evaluate the financial strength of our customers and believe that our credit risk exposure is limited.
Inventories, net.Inventories consist of the following:
(in millions) December 31,
2025
2024
Finished goods
$
26.6
$
19.2
Finished parts and subassemblies
23.8
24.3
Work in process
29.4
14.3
Raw materials
89.7
87.0
Total inventories, net
$
169.5
$
144.8
Inventories, net include the costs of material, labor and overhead and are stated at the lower of cost or net realizable value. The cost for certain inventories in the U.S. is determined using the last-in, first-out (“LIFO”) method and the first-in, first-out (“FIFO”) method is primarily used for all other inventories. If inventories that were valued using the LIFO method had been valued under the FIFO method, they would have been higher by $11.0 million and $12.2 million as of December 31, 2025, and 2024, respectively. The liquidation of LIFO inventory did not have a significant impact on our financial results for the years ended December 31, 2025, and 2024. The reserve for excess and obsolete inventory was $25.3 million and $31.5 million as of December 31, 2025, and 2024, respectively. The reserve for excess and obsolete inventory activity was not material to our financial results for the years ended December 31, 2025, and 2024.
52
NOTES TO CONSOLIDATED AND COMBINED FINANCIAL STATEMENTS
Valuation of Long-Lived Assets.We review our long-lived assets for impairment whenever events or changes in circumstances indicate the carrying amount of an asset may not be recoverable. Recoverability is based upon projections of anticipated future undiscounted cash flows associated with the use and eventual disposal of the long-lived asset (or asset group), as well as specific appraisal in certain instances. Reviews occur at the lowest level for which identifiable cash flows are largely independent of cash flows associated with other long-lived assets or asset groups. If the future undiscounted cash flows are less than the carrying value, then the long-lived asset is considered impaired, and a loss is recognized based on the amount by which the carrying amount exceeds the estimated fair value. For the years ended December 31, 2025, 2024 and 2023, there were no significant impairment charges identified.
Property, Plant and Equipment, net.Property, plant and equipment, net consists of the following:
(in millions) December 31,
2025
2024
Land
$
35.1
$
33.6
Buildings and improvements
146.4
121.4
Machinery and equipment
507.4
444.8
Gross property, plant and equipment
688.9
599.8
Less: accumulated depreciation
385.1
327.5
Property, plant and equipment, net
$
303.8
$
272.3
Property, plant and equipment is stated at cost and depreciation is calculated by the straight-line method over the estimated useful lives of the respective assets, which range from 10 to 25 years for buildings and improvements and 3 to 10 years for machinery and equipment. Depreciation expense was $44.9 million, $37.7 million and $39.6 million for the years ended December 31, 2025, 2024 and 2023, respectively.
Goodwill and Other Intangible Assets.Our business acquisitions have typically resulted in the recognition of goodwill and other intangible assets. We follow the provisions under ASC Topic 350, “Intangibles – Goodwill and Other” (“ASC 350”) and assess the carrying value of goodwill annually during the fourth quarter. Impairment testing takes place more often than annually if events or circumstances indicate a change in status that would indicate a potential impairment.
We determine the fair value of each reporting unit for our goodwill impairment testing. A reporting unit is an operating segment unless discrete financial information is prepared and reviewed by segment management for businesses one level below that operating segment (a “component”), in which case the component would be the reporting unit. As of December 31, 2025, we had three reporting units. The fair value of each reporting unit is determined using a combination of the income approach, using discounted cash flows, and the market approach using comparable public company multiples. Assumptions are reviewed to ensure that the income approach and the market approach do not result in significantly different fair value calculations. Based on the results of our most recent annual impairment test in the fourth quarter of 2025, the reporting unit fair values were higher than their carrying values. No impairment charges have been required during 2025, 2024 and 2023.
Furthermore, to evaluate the sensitivity of the fair value calculations on the goodwill impairment test, we applied a hypothetical, reasonably possible 10% decrease to the fair values of each reporting unit. The effects of this hypothetical 10% decrease would still result in a fair value calculation significantly exceeding our carrying value for each of our reporting units, except for the Crane Authentication reporting unit, which is composed OpSec and De La Rue, acquired in 2024 and 2025, respectively. Goodwill associated with Crane Authentication represents 27.9% of the Company’s total goodwill. While we believe we have made reasonable estimates and assumptions to calculate the fair value of all our reporting units, it is possible a material change could occur. If actual results are not consistent with management’s estimates and assumptions, or if factors outside management control, such as interest rates or other market conditions change, goodwill and other intangible assets may then be determined to be impaired and a charge would need to be taken against net earnings.
The determination of discounted cash flows is based on the businesses’ strategic plans and long-range planning forecasts, which change from year to year. The revenue growth rates included in the forecasts represent best estimates based on current and forecasted market conditions. Profit margin assumptions are projected by each reporting unit based on the current cost structure and anticipated net cost increases/reductions. There are inherent uncertainties related to these assumptions, including changes in factors outside management control such as market conditions, and management judgment is necessary in applying them to the analysis of impairment. The estimated cost of capital used in the discounted cash flow analysis varies for each reporting unit and ranged between 11.0% and 12.0% (a weighted average of 11.5%), at our most recent annual goodwill impairment assessment.
53
NOTES TO CONSOLIDATED AND COMBINED FINANCIAL STATEMENTS
Changes to goodwill are as follows:
(in millions)
Crane Payment Innovations
Security and Authentication Technologies
Total
Balance as of December 31, 2023
$
626.7
$
214.5
$
841.2
Additions (see Note 3)
—
133.7
$
133.7
Currency translation
(17.6)
(0.7)
(18.3)
Balance as of December 31, 2024
$
609.1
$
347.5
$
956.6
Additions (see Note 3)
—
188.5
$
188.5
Currency translation and other
15.1
3.8
18.9
Balance as of December 31, 2025
$
624.2
$
539.8
$
1,164.0
Intangibles with indefinite useful lives, consist of trademarks and tradenames. If the carrying amount of an indefinite lived intangible asset exceeds its fair value, the intangible asset is written down to its fair value. Fair value is calculated using the relief from royalty method.
We amortize the cost of definite-lived intangibles over their estimated useful lives. In addition to an annual assessment for impairment of indefinite-lived intangible assets, we review all our definite-lived intangible assets for impairment whenever events or changes in circumstances indicate the carrying amount of an asset may not be recoverable.No significant impairment charges have been required during 2025, 2024 and 2023.
As of December 31, 2025, we had $557.2 million of net intangible assets, of which $45.5 million were intangibles with indefinite useful lives included within intellectual property rights. As of December 31, 2024, we had $419.3 million of net intangible assets, of which $45.5 million were intangibles with indefinite useful lives included within intellectual property rights.
Changes to intangible assets are as follows:
(in millions) December 31,
2025
2024
2023
Balance at beginning of period, net of accumulated amortization
$
419.3
$
308.9
$
344.9
Additions
191.1
161.8
—
Amortization expense
(59.5)
(47.0)
(35.9)
Currency translation and other
6.3
(4.4)
(0.1)
Balance at end of period, net of accumulated amortization
$
557.2
$
419.3
$
308.9
A summary of intangible assets follows:
(in millions)
Weighted Average Amortization Period of Finite Lived Assets (in years)
December 31, 2025
December 31, 2024
Gross Asset
Accumulated Amortization
Net
Gross Asset
Accumulated Amortization
Net
Intellectual property rights
6.3
$
66.0
$
18.4
$
47.6
$
65.5
$
15.4
$
50.1
Customer relationships and backlog
18.9
767.9
339.2
428.7
610.5
293.9
316.6
Developed Technology
6.0
113.2
42.2
71.0
66.4
26.8
39.6
Other
12.3
75.0
65.1
9.9
71.8
58.8
13.0
Total
18.1
$
1,022.1
$
464.9
$
557.2
$
814.2
$
394.9
$
419.3
Future amortization expense associated with intangibles is expected to be:
Year
(in millions)
2026
$
65.2
2027
$
61.0
2028
$
55.9
2029
$
53.7
2030
$
32.0
2031 and after
$
243.9
54
NOTES TO CONSOLIDATED AND COMBINED FINANCIAL STATEMENTS
Crane Net Investment. Prior to the Separation, the Consolidated and Combined Statements of Changes in Equity include net cash transfers between Holdings and the Business as well as related party receivables and payables between the Business and other Holdings affiliates.
Redeemable Noncontrolling Interests.Noncontrolling interests with redemption features that are not solely within the control of the Company are classified as redeemable noncontrolling interests and presented as temporary equity between total liabilities and total equity in our Consolidated Balance Sheet. The redeemable noncontrolling interest was initially measured at fair value at the date of the acquisition of the 32.3% equity interest in Antares Vision (see Note 3 Acquisitions). At each reporting date after initial recognition, the redeemable noncontrolling interest is subsequently measured to the higher of i) the initial carrying amount, adjusted for the noncontrolling interest’s share of accumulated earnings or losses, contributions and distributions, or ii) the redemption value, assuming it was redeemable at the reporting date. Changes in fair value of redeemable noncontrolling interest are recognized as an adjustment to capital surplus.
The following table presents the reconciliation of changes in the Company’s redeemable noncontrolling interest:
(in millions)
Balance as of December 31, 2024
$
—
Redeemable noncontrolling interest (See Note 3 “Acquisitions”)
6.9
Net loss attributable to redeemable noncontrolling interest
*Adjustment of the carrying value of redeemable noncontrolling interest to the estimated redemption value was recognized in
capital surplus.
Accumulated Other Comprehensive Loss.The tables below provide the accumulated balances for each classification of accumulated other comprehensive loss, as reflected on the Consolidated Balance Sheets.
(in millions)
Defined Benefit Pension and Other Postretirement Items
Currency Translation Adjustment
Total (a)
Balance as of December 31, 2022
$
9.0
$
(140.5)
$
(131.5)
Other comprehensive (loss) income before reclassifications
(3.2)
18.1
14.9
Amounts reclassified from accumulated other comprehensive income
(2.0)
—
(2.0)
Net period other comprehensive (loss) income
(5.2)
18.1
12.9
Balance as of December 31, 2023
3.8
(122.4)
(118.6)
Other comprehensive loss before reclassifications
—
(50.9)
(50.9)
Amounts reclassified from accumulated other comprehensive income
(3.1)
—
(3.1)
Net period other comprehensive loss
(3.1)
(50.9)
(54.0)
Balance as of December 31, 2024
0.7
(173.3)
(172.6)
Other comprehensive income before reclassifications
1.6
72.2
73.8
Amounts reclassified from accumulated other comprehensive income
(1.1)
—
(1.1)
Net period other comprehensive income
0.5
72.2
72.7
Balance as of December 31, 2025
$
1.2
$
(101.1)
$
(99.9)
(a)
Net of tax detriment of $1.1 million, $1.3 million and $1.5 million for December 31, 2025, 2024 and 2023, respectively.
55
NOTES TO CONSOLIDATED AND COMBINED FINANCIAL STATEMENTS
The table below illustrates the amounts reclassified out of each component of accumulated other comprehensive loss for the years ended December 31, 2025, 2024 and 2023. Amortization of pension and postretirement components have been recorded within “Miscellaneous income, net” on the Consolidated and Combined Statements of Operations.
(in millions)
Amount Reclassified from Accumulated Other Comprehensive Loss
December 31,
2025
2024
2023
Amortization of pension items:
Prior service costs
$
(0.7)
$
(0.8)
$
(0.7)
Net loss
0.2
0.3
—
Amortization of postretirement items:
Prior service costs
—
(0.9)
(1.1)
Net gain
(0.8)
(0.9)
(0.7)
Other
—
(1.4)
—
Total before tax
$
(1.3)
$
(3.7)
$
(2.5)
Tax impact
(0.2)
(0.6)
(0.5)
Total reclassifications for the period
$
(1.1)
$
(3.1)
$
(2.0)
Recent Accounting Pronouncements
Recently Adopted Accounting Standards
In December 2023, the FASB issued ASU 2023-09, Income Taxes (Topic 740): Improvements to Income Tax Disclosures which intends to improve the transparency of income tax disclosures. The new standard requires public entities to provide greater disaggregation in their rate reconciliation, including new requirements to present reconciling items on a gross basis within specified categories, to disclose both percentages and dollar amounts, and to disaggregate individual reconciling items by jurisdiction and nature when the effect of the items meets a quantitative threshold. The guidance also includes new requirements to provide users of the financial statements with better information on future cash flow prospects. The standard is effective for all public entities for annual periods beginning after December 15, 2024, on a prospective basis, with a retrospective option, and early adoption permitted for annual financial statements that have not yet been issued. The Company adopted the standard on a prospective basis for the year ended December 31, 2025. See Note 10, “Income Taxes” reflecting the Company’s adoption of this standard.
Recently Issued Accounting Standards
In November 2024, the FASB issued ASU 2024-03, Income Statement - Reporting Comprehensive Income - Expense Disaggregation Disclosures (Subtopic 220-40): Disaggregation of Income Statement Expenses which intends to improve the disclosures about a public business entity’s expenses and address requests from investors for more detailed information about the types of expenses (including purchases of inventory, employee compensation, depreciation, amortization, and depletion) in commonly presented expense captions (such as cost of sales, SG&A, and research and development). The standard requires disclosure of these expenses on an interim and annual basis in the notes to the financial statements. The standard is effective for annual reporting periods beginning after December 15, 2026, and interim reporting periods beginning after December 15, 2027, with early adoption permitted. The Company is currently evaluating the potential impact of this standard on its Financial Statements and Disclosures.
In September 2025, the FASB issued ASU 2025-06, Intangibles—Goodwill and Other—Internal-Use Software (Subtopic 350-40): Improvements to the Accounting for Internal-Use Software. The update eliminates the previous project stage model and introduces a “probable-to-complete” threshold for capitalization. It also consolidates guidance for website development costs under Subtopic 350-40. The ASU is effective for fiscal years beginning after December 15, 2027. The Company is currently evaluating the potential impact of this standard on its Financial Statements and Disclosures.
The Company considered the applicability and impact of other Accounting Standards Updates issued by the Financial Accounting Standards Board (FASB) and determined them to be either not applicable or are not expected to have a material impact on the Company's Consolidated and Combined Statements of Operations, Consolidated Balance Sheets and Consolidated and Combined Cash Flows.
56
NOTES TO CONSOLIDATED AND COMBINED FINANCIAL STATEMENTS
Note 2 - Related Parties
Prior to the Separation, the Business was managed and operated in the normal course of business with other affiliates of Holdings. Accordingly, certain shared costs were allocated to the Business and are reflected as expenses in the Consolidated and Combined Financial Statements.
Allocated Centralized Costs
The Consolidated and Combined Financial Statements were prepared on a stand-alone basis and were derived from the consolidated financial statements and accounting records of Holdings for the periods prior to the Separation.
Prior to the Separation, Holdings incurred corporate costs for services provided to the Business as well as other Holdings businesses. These services included treasury, tax, accounting, human resources, audit, legal, purchasing, information technology and other such services. The costs associated with these services generally included all payroll and benefit costs, as well as overhead costs related to the support functions. Holdings also allocated costs associated with corporate insurance coverage and medical, pension, post-retirement and other health plan costs for employees participating in Holdings sponsored plans. Allocations were based on several utilization measures including headcount, proportionate usage and relative net sales. All such amounts were deemed incurred and settled by the Business in the period in which the costs were recorded.
The allocated centralized costs for the Business were $13.5 million for the year ended December 31, 2023. These costs are included in “Selling, general and administrative” in the Consolidated and Combined Statements of Operations.
In the opinion of our management, the expense and cost allocations have been determined on a basis considered to be a reasonable reflection of the utilization of services provided to or for the benefit received by the Business during periods prior to the Separation. The amounts that would have been or will be incurred on a stand-alone basis could differ from the amounts allocated due to economies of scale, difference in management judgment, a requirement for more or fewer employees or other factors. Management does not believe, however, that it is practicable to estimate what these expenses would have been had the Business operated as an independent entity, including any expenses associated with obtaining any of these services from unaffiliated entities. In addition, the future results of operations, financial position and cash flows could differ materially from the historical results presented herein.
Separation Costs
In connection with the Separation, we have incurred expenses of $0.6 million and $20.9 million for the years ended December 31, 2024, and 2023, respectively, recorded in “Selling, general and administrative” in the Consolidated and Combined Statements of Operations. Expenses primarily consisted of professional service fees. There were no significant Separation related expenses for the year ended December 31, 2025.
Cash Management and Financing. Prior to the Separation, the Business participated in Holdings’ centralized cash management and daily cash sweeps. Disbursements were made through centralized accounts payable systems which were operated by Holdings. Cash receipts were transferred to centralized accounts, which were also maintained by Holdings. As cash was received and disbursed by Holdings, it was accounted for by the Business through “Crane Net Investment.” Historically, Holdings had centrally managed and swept cash for most domestic and certain European entities. However, certain legal entities did not participate in Holdings’ centralized cash management program for a variety of reasons.
As a result of the Separation, a one-time cash dividend of $275 million was issued on April 3, 2023, prior to the Separation, from SpinCo to Holdings, as well as a cash transfer of $84 million from Holdings to us. These contributions of net assets are recorded on the Consolidated and Combined Statements of Changes in Equity through “Crane Net Investment.”
Accounts Receivable and Payable. Certain related party transactions between the Business and Holdings have been included within “Crane Net Investment” in the Consolidated and Combined Statement of Changes in Equity in the historical periods presented when the related party transactions were not settled in cash. We recorded related party interest expense related to the loan activity with Holdings and its affiliates of $2.5 million for the year ended December 31, 2023, which are included in the Business’ results as “Related party interest expense” in the Consolidated and Combined Statements of Operations. The total effect of the settlement of these related party transactions is reflected with “Net transfers to Crane” as a financing activity in the Consolidated and Combined Statements of Cash Flows. There was no related party interest expense for the years ended December 31, 2025 and 2024.
Additionally, after the Separation, SpinCo and its subsidiaries were identified as related parties. As of December 31, 2025, and 2024, we have net outstanding receivables from SpinCo and its subsidiaries of $1.9 million and $0.7 million, respectively, related to indemnification under the tax matters agreement.
57
NOTES TO CONSOLIDATED AND COMBINED FINANCIAL STATEMENTS
Note 3 – Acquisitions
Antares Vision Acquisition
On December 16, 2025, Crane NXT, through a newly formed Italian joint stock company (“ITT”), initiated a multi-phase acquisition of Antares Vision S.p.A. (“Antares Vision”). In the first phase, Crane NXT acquired a 32.3% equity interest in Antares Vision for €117.3 million (approximately $137.8 million), at a purchase price of €5.00 per share.
Antares Vision is a global provider of inspection and detection systems that ensure product safety and quality control. Antares Vision also provides track and trace software solutions that help prevent counterfeiting and provides visibility of products throughout the supply chain. The transaction advances Crane NXT’s strategy to provide trusted technology solutions that secure, detect and authenticate its customers’ most valuable assets, and expands the Company’s portfolio in growing end markets, including Life Sciences and Food and Beverage.
The Company accounts for its investment in Antares Vision in the first phase under equity method accounting since it exercises significant influence over Antares Vision, but does not have a controlling financial interest. The Company recorded its investment at cost of $137.8 million in the Consolidated Balance Sheet at December 31, 2025.
Following the initial investment, Crane NXT will launch a mandatory tender offer under applicable Italian law to acquire the remaining publicly traded shares at the same per-share price. Upon completion of the mandatory tender offer, Crane NXT will implement steps aimed at delisting Antares Vision and acquire the remaining stake owned by Regolo S.p.A. As a result of the transaction, Antares Vision will become a subsidiary of Crane NXT. The final phase of the transaction is anticipated to finalize in 2026. The acquisition is funded through the Term Loan B (as described in Note 14, “Financing”).
Under the terms of the Investor and Shareholders’ Agreement (“ISA”), the Company is required to issue ordinary shares and grant Class B shares of ITT to certain Antares Vision personnel at €5.00 per share in multiple tranches aligned with the acquisition steps (the “Reinvestment”). In connection with the first phase, the Company issued 1,173,379 ordinary shares and granted 1,173,379 Class B shares of ITT for $6.9 million each, or $13.8 million in total.
The ordinary shares are classified as a redeemable noncontrolling interest and are presented in temporary equity in the Consolidated Balance Sheet as “Redeemable noncontrolling interest”.
The Class B shares are accounted for as stock‑based compensation granted to employees of an equity‑method investee under ASC Topic 718 “Compensation - Stock Compensation” (“ASC 718”) and under ASC Topic 323, “Investments - Equity Method and Joint Ventures” (“ASC 323”). Under the ISA, the Class B shares convert into ordinary shares of ITT based on a multiplier dependent on revenue and EBIT target achievement for the year ended December 31, 2028. The multiplier ranges from zero to three depending on the achievement of these targets as of the specified conversion date. Once converted to ordinary shares, the Class B shares are subject to immediately exercisable call and put features and as such, they are liability-classified instruments.
Since Class B shares are subject to performance conditions with no service conditions, they are expensed, when the performance conditions are deemed probable of being achieved and are based on the fair value of the Class B shares at that time. The fair value of Class B shares are based on the estimated fair value of ITT using a market approach and management’s best estimate of the expected performance outcome under the awards’ performance‑based conversion features. Because the number of ordinary shares issuable upon conversion varies based on performance, the estimated fair value incorporates expected performance against these targets. These estimates involve significant judgment and are subject to inherent uncertainty, and actual results may differ from current expectations, which could result in adjustments to compensation expense in future periods.
The liability is remeasured each reporting period until settlement. As of December 31, 2025, the performance condition was considered probable of achievement, and the Company recognized $12.0 million of stock-based compensation expense within “Equity investment (loss) gain” in the Consolidated and Combined Statements of Operations.
58
NOTES TO CONSOLIDATED AND COMBINED FINANCIAL STATEMENTS
De La Rue Acquisition
On May 1, 2025, we acquired De La Rue Authentication Solutions (“DLR”) for a base purchase price of £300 million on a cash-free and debt-free basis, subject to customary purchase price adjustments. The amount paid, net of cash acquired and working capital adjustments, was $394.0 million. We utilized the Term Loan A to fund the acquisition (as described in Note 14, “Financing”). In September 2025, we received $2.9 million related to the final working capital adjustment of the DLR acquisition, resulting in net cash paid of $391.1 million.
DLR is a leading global provider of digital and physical security and authentication technologies to governments and brands, and expands our portfolio of authentication solutions.
DLR is part of a joint venture (the “Joint Venture”) that manufactures and sells tax stamps for the government of Ghana. DLR owns 49% of the share capital but maintains control of the Joint Venture through board governance rights. As such, we have consolidated the Joint Venture and recorded a noncontrolling interest in our Consolidated and Combined Financial Statements.
Allocation of Consideration Transferred to Net Assets Acquired
The following amounts represent the preliminary determination of the fair value of identifiable assets acquired and liabilities assumed from our acquisition of DLR, pending the finalization of certain tangible assets and liabilities to be completed within the measurement period as required by ASC Topic 805 “Business Combination” (“ASC 805”). Potential adjustments are not expected to be material in relation to the preliminary values presented below:
Net assets acquired(in millions)
Accounts receivable, net
$
19.9
Inventories, net
20.8
Other current assets
6.7
Property, plant and equipment
27.5
Other non-current assets
5.3
Intangible assets
184.4
Goodwill
188.5
Total assets acquired
$
453.1
Total current liabilities
$
16.3
Other liabilities
45.7
Total assumed liabilities
$
62.0
Net assets acquired
$
391.1
The amount allocated to goodwill reflects expected sales synergies, manufacturing efficiency and research and development. Goodwill from this acquisition is not deductible for tax purposes.
The amounts allocated to acquired intangible assets, and their associated weighted-average useful lives which were determined based on the period in which the assets are expected to contribute directly or indirectly to our future cash flows, consist of the following:
Intangible Assets (in millions)
Intangible Fair Value
Weighted Average Life (in years)
Customer relationships
$
141.0
18.2
Developed technology
40.7
5.0
Backlog
2.7
0.9
Total acquired intangible assets
$
184.4
59
NOTES TO CONSOLIDATED AND COMBINED FINANCIAL STATEMENTS
The fair values of the customer relationships and backlog intangible assets were determined by using an “income approach”, which is a commonly accepted valuation approach. Under this approach, the net earnings attributable to the asset or liability being measured are isolated using the discounted projected net cash flows. These projected cash flows are isolated from the projected cash flows of the combined asset group over the remaining economic life of the intangible asset or liability being measured. Both the amount and the duration of the cash flows are considered from a market participant perspective. The Company’s estimates of market participant net cash flows considered historical and projected pricing, operational performance including market participant synergies, aftermarket retention, product life cycles, material and labor pricing, and other relevant customer, contractual and market factors. Where appropriate, the net cash flows were adjusted to reflect the potential attrition of existing customers in the future, as existing customers are expected to decline over time. The attrition-adjusted future cash flows are then discounted to present value using an appropriate discount rate. The customer relationship is being amortized on a straight-line basis (which approximates the economic pattern of benefits) over the estimated economic life of 12 to 21 years.
The fair values of the developed technology intangible assets were determined by the relief-from-royalty approach. Similarly, this approach is based on the assumption that in lieu of ownership, a company would be willing to pay a royalty in order to exploit the related benefits of the technology. Therefore, a portion of DLR’s earnings, equal to the after-tax royalty that would have been paid for the use of the technology, can be attributed to the Company’s ownership of the technology. The technology assets are being amortized on a straight-line basis (which approximates the economic pattern of benefits) over the estimated economic life of 5 years.
OpSec Acquisition
On May 3, 2024, we acquired OpSec Security (“OpSec”), for a base purchase price of $270 million on a cash-free and debt-free basis. The amount paid, net of cash acquired, was $268.4 million. We utilized $210.0 million from our Revolving Facility (as defined in Note 14, “Financing”) and cash on hand to fund the acquisition.
OpSec provides authentication solutions, brand and digital content protection serving various commercial brands, government agencies and financial institutions. In connection with the acquisition of OpSec, we renamed our “Crane Currency” reportable segment to “Security and Authentication Technologies,” which consists of the Crane Currency business and the acquired Crane Authentication business comprised of the acquired OpSec and De La Rue businesses.
Allocation of Consideration Transferred to Net Assets Acquired
The following amounts represent the determination of the fair value of identifiable assets acquired and liabilities assumed from our acquisition of OpSec. The fair value of certain assets and liabilities has been completed as required by ASC 805.
Net assets acquired (in millions)
Total current assets
$
33.5
Property, plant and equipment
17.3
Other assets
6.9
Intangible assets
155.5
Goodwill
134.3
Total assets acquired
$
347.5
Total current liabilities
$
37.9
Other liabilities
41.2
Total assumed liabilities
$
79.1
Net assets acquired
$
268.4
The amount allocated to other assumed liabilities includes a contingent liability of $1.5 million related to a prior OpSec acquisition. The amount payable is contingent upon achievement of specific revenue targets and is capped at $2.2 million. The contingency conditions expire at the end of October 2027, an extension from the original expiry date at the end of 2026, at which point if the contingency conditions have not been met, no payment will occur. The contingent liability is measured at fair value. See Note 15, “Fair Value Measurements” for further details.
60
NOTES TO CONSOLIDATED AND COMBINED FINANCIAL STATEMENTS
The amount allocated to goodwill reflects expected sales synergies, manufacturing efficiency and research and development. Goodwill from this acquisition is not deductible for tax purposes.
The amounts allocated to acquired intangible assets, and their associated weighted-average useful lives which were determined based on the period in which the assets are expected to contribute directly or indirectly to our future cash flows, consist of the following:
Intangible Assets (dollars in millions)
Intangible Fair Value
Weighted Average Life
Customer relationships
$
115.5
19.3
Developed technology
36.5
5.7
Backlog
2.0
0.7
Intellectual property rights
1.5
5.0
Total acquired intangible assets
$
155.5
The intellectual property rights intangible asset category consists of trade names. The fair values of the trade names were determined by using an “income approach,” specifically the relief-from-royalty approach, which is a commonly accepted valuation approach. This approach assumes that in lieu of ownership, a company would be willing to pay a royalty to exploit the related benefits of this asset. Therefore, a portion of OpSec’s earnings, equal to the after-tax royalty that would have been paid for the use of the asset, can be attributed to the Company’s ownership. The trade names are being amortized on a straight-line basis (which approximates the economic pattern of benefits) over the estimated economic life of 5 years.
The fair values of the developed technology intangible assets were also determined by the relief-from-royalty approach. Similarly, this approach assumes that in lieu of ownership, a company would be willing to pay a royalty to exploit the related benefits of the technology. Therefore, a portion of OpSec’s earnings, equal to the after-tax royalty that would have been paid for the use of the technology, can be attributed to the Company’s ownership of the technology. The technology assets are being amortized on a straight-line basis (which approximates the economic pattern of benefits) over the estimated economic life of 3 to 6 years.
The fair values of the customer relationships and backlog intangible assets were determined by using an “income approach,” which is a commonly accepted valuation approach. Under this approach, the net earnings attributable to the asset or liability being measured are isolated using the discounted projected net cash flows. These projected cash flows are isolated from the projected cash flows of the combined asset group over the remaining economic life of the intangible asset or liability being measured. Both the amount and the duration of the cash flows are considered from a market participant perspective. The Company’s estimates of market participant net cash flows considered historical and projected pricing, operational performance including market participant synergies, after market retention, product life cycles, material and labor pricing, and other relevant customer, contractual and market factors. Where appropriate, the net cash flows were adjusted to reflect the potential attrition of existing customers in the future, as existing customers are expected to decline over time. The attrition-adjusted future cash flows are then discounted to present value using an appropriate discount rate. The customer relationship is being amortized on a straight-line basis (which approximates the economic pattern of benefits) over the estimated economic life of 16 to 20 years.
Supplemental and Pro Forma Data
DLR results of operations have been included in our financial statements for the period subsequent to the completion of the acquisition on May 1, 2025. OpSec results of operations have been included in our financial statements for the period subsequent to the completion of the acquisition on May 3, 2024.
During the period since acquisition, DLR contributed net sales of $89.4 million, resulting in operating loss of $7.9 million for the year ended December 31, 2025. The operating loss was driven by acquisition related amortization, fair value step-up and transaction costs.
The following unaudited pro forma consolidated and combined information assumes that the DLR acquisition was completed on January 1, 2024 and the OpSec acquisition was completed on January 1, 2023. The unaudited pro forma consolidated and combined information for both acquisitions is provided for illustrative purposes only and is not indicative of our actual consolidated and combined results of operations or consolidated financial position.
(in millions) For the year ended December 31,
2025
2024
2023
Net sales
$
1,699.6
$
1,667.2
$
1,507.7
Net income attributable to common shareholders
$
160.3
$
164.4
$
161.1
61
NOTES TO CONSOLIDATED AND COMBINED FINANCIAL STATEMENTS
Acquisition-Related Costs
For the year ended December 31, 2025 and 2024, we recorded $24.1 million and $17.9 million, respectively, of acquisition-related costs within “Selling, general and administrative” in our Consolidated and Combined Statements of Operations.
Note 4 – Segment Information
In accordance with ASC Topic 280, “Segment Reporting,” for purposes of segment performance measurement, we do not allocate to the business segments items that are of a non-operating nature; or corporate organizational and functional expenses of a governance nature.
The accounting policies of the segments are the same as those described in the summary of significant accounting policies.
We had two reportable segments: Crane Payment Innovations and Security and Authentication Technologies. Assets of the reportable segments exclude general corporate assets, which principally consist of cash, deferred tax assets, certain property, plant and equipment, and certain other assets. Corporate consists of corporate office expenses including compensation and benefits for corporate employees, occupancy, depreciation, and other administrative costs.
A brief description of each of our segments is as follows:
Crane Payment Innovations
CPI provides electronic equipment and associated software leveraging extensive and proprietary core capabilities with various detection and sensing technologies for applications including verification and authentication of payment transactions. CPI also provides advanced automation solutions, and processing systems, field service solutions, and remote diagnostics and productivity software solutions. Key research and development and manufacturing facilities are located in the United States, the United Kingdom, Mexico, Japan, and Germany, with additional sales offices across the world.
Security and Authentication Technologies
SAT provides advanced security solutions based on proprietary technology for securing physical products, including banknotes, consumer goods, and industrial products. SAT also provides brand protection, authentication solutions, and digital content protection across online marketplaces, social media platforms, and websites. These solutions serve various brands, as well as government agencies and financial institutions. Key research and development and manufacturing facilities are located in the United States, United Kingdom, Sweden and Malta.
The chief operating decision maker is our Chief Executive Officer (“CEO”). The CEO assesses the segments’ performance by using each segments’ net sales and operating profit. The CEO uses net sales and operating profit for each segment predominantly in the annual budget and forecasting process. The chief operating decision maker considers budget-to-actual variances on a monthly, quarterly and annual basis for net sales and operating profit when making decisions about the allocation of operating and capital resources to each segment. The CEO also uses segment net sales and operating profit for assessing the performance of each segment by comparing the results of each segment with one another and with prior year’s performance, and in determining the compensation of certain employees directly responsible for segment performance.
62
NOTES TO CONSOLIDATED AND COMBINED FINANCIAL STATEMENTS
Financial information by reportable segment is set forth below:
(in millions) Year ended December 31, 2025
Crane Payment Innovations
Security and Authentication Technologies
Total
Net Sales
$
846.6
$
810.1
$
1,656.7
Less:
Cost of operations
379.1
401.1
Selling and administrative expense
157.8
154.0
Engineering expense
34.9
38.1
Other segment items (a)
53.2
119.5
Segment operating profit
221.6
97.4
319.0
Corporate costs
(72.3)
Operating profit
246.7
Interest income
1.0
Interest expense
(60.3)
Equity investment loss
(11.5)
Miscellaneous income, net
5.1
Income before income taxes
$
181.0
(in millions) Year ended December 31, 2024
Crane Payment Innovations
Security and Authentication Technologies
Total
Net Sales
$
873.2
$
613.6
$
1,486.8
Less:
Cost of operations
394.2
323.6
Selling and administrative expense
160.6
94.2
Engineering expense
43.8
27.2
Other segment items (a)
46.2
57.7
Segment operating profit
228.4
110.9
339.3
Corporate costs
(70.5)
Operating profit
268.8
Interest income
1.6
Interest expense
(47.8)
Equity investment gain
0.8
Miscellaneous income, net
3.0
Income before income taxes
$
226.4
63
NOTES TO CONSOLIDATED AND COMBINED FINANCIAL STATEMENTS
(in millions) Year ended December 31, 2023
Crane Payment Innovations
Security and Authentication Technologies
Total
Net Sales
$
886.4
$
504.9
$
1,391.3
Less:
Cost of operations
373.3
297.6
Selling and administrative expense
152.9
72.1
Engineering expense
51.5
18.7
Other segment items (a)
65.9
0.2
Segment operating profit
242.8
116.3
359.1
Corporate costs
(72.3)
Operating profit
286.8
Interest income
1.1
Interest expense
(48.1)
Related party interest expense
(2.5)
Miscellaneous income, net
2.5
Income before income taxes
$
239.8
(a)
Includes other cost of operations such as manufacturing costs, amortization expenses, shipping and handling costs, and certain overhead expenses, as well as corporate allocations.
(in millions) December 31,
2025
2024
2023
Depreciation and amortization:
Crane Payment Innovations
$
29.1
$
29.3
$
31.2
Security and Authentication Technologies
74.9
55.1
44.2
Corporate
2.6
2.4
2.2
Total
$
106.6
$
86.8
$
77.6
(in millions) December 31,
2025
2024
2023
Capital expenditures
Crane Payment Innovations
$
7.7
$
7.9
$
7.6
Security and Authentication Technologies
30.7
37.5
25.9
Corporate
0.1
0.1
1.6
Total
$
38.5
$
45.5
$
35.1
Net sales by geographic region:
(in millions) December 31,
2025
2024
2023
Net sales (a)
North America
$
829.3
$
804.8
$
787.1
Western Europe
190.2
162.1
196.3
Rest of the World
637.2
519.9
407.9
Total net sales
$
1,656.7
$
1,486.8
$
1,391.3
(a)
Net sales by geographic region are based on the destination of the sale.
64
NOTES TO CONSOLIDATED AND COMBINED FINANCIAL STATEMENTS
Balance sheet items by reportable segment is set forth below:
(in millions) December 31,
2025
2024
Goodwill:
Crane Payment Innovations
$
624.2
$
609.1
Security and Authentication Technologies
539.8
347.5
Total goodwill
$
1,164.0
$
956.6
Assets:
Crane Payment Innovations
$
1,183.0
$
1,187.1
Security and Authentication Technologies
1,734.9
1,178.2
Corporate
198.5
21.2
Total assets
$
3,116.4
$
2,386.5
Long-lived assets by geographic region:
(in millions) December 31,
2025
2024
Long-lived assets (a)
North America
$
186.8
$
187.3
Western Europe
165.9
129.1
Rest of the World
18.4
16.3
Total long-lived assets
$
371.1
$
332.7
(a)
Long-lived assets, net by geographic region are based on the location of the business unit and consist of property, plant and equipment and operating lease assets.
Note 5 - Revenue
Disaggregation of Revenues
The following table presents net sales disaggregated by product line for each segment:
(in millions) December 31,
2025
2024
2023
Crane Payment Innovations
Products
$
709.4
$
739.9
$
758.7
Services
137.2
133.3
127.7
Total Crane Payment Innovations
$
846.6
$
873.2
$
886.4
Security and Authentication Technologies
Banknotes and Security Products
$
592.4
$
521.9
$
500.4
Authentication Products and Solutions
217.7
91.7
4.5
Total Security and Authentication Technologies
$
810.1
$
613.6
$
504.9
Total Net Sales
$
1,656.7
$
1,486.8
$
1,391.3
Remaining Performance Obligations
The transaction price allocated to remaining performance obligations represents the transaction price of firm orders which have not yet been fulfilled, which we also refer to as total backlog. As of December 31, 2025, backlog was $492.8 million. We expect to recognize approximately 98% of our remaining performance obligations as revenue in 2026 and 2% in 2027.
Contract Assets and Contract Liabilities
Contract assets represent unbilled amounts that typically arise from contracts for customized products or contracts for products sold directly to the U.S. government or indirectly to the U.S. government through subcontracts, and certain international government contracts, where revenue recognized using the cost-to-cost method exceeds the amount billed to the customer. Contract assets are assessed for impairment and recorded at their net realizable value. Contract liabilities represent advance payments from customers. Revenue related to contract liabilities is recognized when control is transferred to the customer.
65
NOTES TO CONSOLIDATED AND COMBINED FINANCIAL STATEMENTS
We report contract assets, which are included within “Other current assets”, current contract liabilities, which are included within “Accrued liabilities” and long-term contract liabilities, which are included within “Other liabilities” on our Consolidated Balance Sheets, on a contract-by-contract net basis at the end of each reporting period. Net contract assets and contract liabilities consisted of the following:
(in millions) December 31,
2025
2024
Contract assets
$
56.1
$
37.8
Contract liabilities
$
87.3
$
71.4
Long-term contract liabilities
$
17.0
$
13.5
During 2025 we recognized revenue of $66.6 million related to contract liabilities as of December 31, 2024.
The business had one individually significant customer within the Security and Authentication Technologies segment with net sales of $210.7 million, $209.2 million and $213.1 million for the years ended December 31, 2025, 2024 and 2023, respectively.
Note 6 – Research and Development
Research and development costs are expensed when incurred and are included in “Selling, general and administrative” in our Consolidated and Combined Statements of Operations.
(in millions) December 31,
2025
2024
2023
Research and Development Costs
$
46.0
$
39.5
$
42.8
Note 7 – Pension and Postretirement Benefits
Pension Plan
A number of our non-U.S. subsidiaries sponsor defined benefit pension plans that provide ongoing benefits for approximately 5% of all non-U.S. employees as of December 31, 2025. The benefits are typically based upon years of service and compensation. Most of these plans are funded by company contributions to pension funds, which are held for the sole benefit of plan participants and beneficiaries. Additionally, in the United States, we sponsor a defined benefit pension plan that covers less than 1% of U.S. employees as of December 31, 2025. The benefits are based on years of service and compensation. Charges to expense are based upon costs computed by an independent actuary. The plan is funded on a pay-as-you-go basis.
Postretirement Plans
Postretirement health care benefits are provided for certain employees hired before July 1, 2013, who meet minimum age and service requirements.
A summary of the projected benefit obligations, fair value of plan assets and funded status for the plans is as follows:
66
NOTES TO CONSOLIDATED AND COMBINED FINANCIAL STATEMENTS
Pension Benefits
Postretirement Benefits
(in millions) December 31,
2025
2024
2025
2024
Change in benefit obligation:
Benefit obligation at beginning of year
$
69.1
$
77.6
$
11.5
$
12.7
Service cost
2.2
2.0
0.1
0.1
Interest cost
1.7
1.9
0.6
0.6
Plan participants’ contributions
0.3
0.4
—
—
Actuarial (gain) loss
(1.6)
(1.0)
0.3
(0.4)
Settlements
(10.6)
(2.3)
—
—
Curtailments
(2.3)
—
—
—
Benefits paid
(2.5)
(5.5)
(1.4)
(1.5)
Foreign currency exchange and other
9.1
(3.9)
—
—
Administrative expenses paid
(0.3)
(0.1)
—
—
Benefit obligation at end of year
$
65.1
$
69.1
$
11.1
$
11.5
Change in plan assets:
Fair value of plan assets at beginning of year
$
76.5
$
83.5
$
—
$
—
Actual return on plan assets
2.9
3.8
—
—
Employer contributions
1.2
1.6
1.4
1.5
Plan participants’ contributions
0.3
0.4
—
—
Settlements
(10.6)
(2.3)
—
—
Benefits paid
(2.5)
(5.5)
(1.4)
(1.5)
Foreign currency exchange and other
9.0
(4.2)
—
—
Administrative expenses paid
(0.6)
(0.8)
—
—
Fair value of plan assets at end of year
$
76.2
$
76.5
$
—
$
—
Funded status
$
11.1
$
7.4
$
(11.1)
$
(11.5)
In the U.S., 2025 actuarial gains in the projected benefit obligation were primarily the result of a decrease in the discount rate. Other sources of gains or losses such as plan experience, updated census data and minor adjustments to actuarial assumptions generated combined losses of less than 1% of expected year end obligations. In the non-U.S., countries, 2025 actuarial gains in the projected benefit obligation were primarily the result of increases in discount rates, decreases in UK inflation, and updates to Switzerland withdrawal and lump sum take rates. Other sources of gains or losses such as plan experience, updated census data, and minor adjustments to other actuarial assumptions generated combined losses well under 1% of expected year end obligations.
In the U.S., 2024 actuarial gains in the projected benefit obligation were primarily the result of the loss of one of the participants who had the largest benefit and an increase in the discount rate. Other sources of gains or losses such as plan experience, updated census data and minor adjustments to actuarial assumptions generated combined losses of less than 1% of expected year end obligations. In the non-U.S. countries, 2024 actuarial gains in the projected benefit obligation were primarily the result of decreases in interest crediting rates and the mortality update for a United Kingdom entity, offset by the overall decrease in discount rates and increase in United Kingdom inflation. Other sources of gains or losses such as plan experience, updated census data, and minor adjustments to other actuarial assumptions generated combined losses well under 1% of expected year end obligations.
Amounts recognized on our Consolidated Balance Sheets consist of:
Pension Benefits
Postretirement Benefits
(in millions) December 31,
2025
2024
2025
2024
Other assets
$
15.2
$
13.6
$
—
$
—
Accrued liabilities
(0.2)
(0.4)
(1.2)
(1.3)
Accrued pension and postretirement benefits
(3.9)
(5.8)
(9.9)
(10.2)
Funded status
$
11.1
$
7.4
$
(11.1)
$
(11.5)
67
NOTES TO CONSOLIDATED AND COMBINED FINANCIAL STATEMENTS
Amounts recognized in accumulated other comprehensive loss consist of:
Pension Benefits
Postretirement Benefits
(in millions) December 31,
2025
2024
2025
2024
Net actuarial loss (gain)
$
9.0
$
12.2
$
(6.3)
$
(7.4)
Prior service credit
(3.5)
(5.3)
—
—
Total recognized in accumulated other comprehensive loss (gain)
$
5.5
$
6.9
$
(6.3)
$
(7.4)
The projected benefit obligation, accumulated benefit obligation and fair value of plan assets are as follows:
Pension Obligations/Assets
U.S.
Non-U.S.
Total
(in millions) December 31,
2025
2024
2025
2024
2025
2024
Projected benefit obligation
$
0.3
$
0.5
$
64.8
$
68.6
$
65.1
$
69.1
Accumulated benefit obligation
$
0.3
$
0.5
$
64.0
$
67.1
$
64.3
$
67.6
Fair value of plan assets
$
—
$
—
$
76.2
$
76.5
$
76.2
$
76.5
Information for pension plans with benefit obligation in excess of plan assets is as follows:
(in millions) December 31,
2025
2024
Projected benefit obligation
$
4.1
$
44.0
Accumulated benefit obligation
$
4.1
$
42.5
Components of net periodic (benefit) cost are as follows:
Pension Benefits
Postretirement Benefits
(in millions) For the year ended December 31,
2025
2024
2023
2025
2024
2023
Net Periodic (Benefit) Cost:
Service cost
$
2.2
$
2.0
$
1.9
$
0.1
$
0.1
$
0.1
Interest cost
1.7
1.9
2.1
0.6
0.6
0.8
Expected return on plan assets
(2.9)
(3.0)
(3.2)
—
—
—
Amortization of prior service cost
(0.7)
(0.8)
(0.7)
—
(0.9)
(1.1)
Amortization of net loss (gain)
0.2
0.3
—
(0.8)
(0.9)
(0.7)
Recognized curtailment loss (gain)
(1.7)
—
(0.1)
—
—
—
Settlement loss (gain)
0.5
—
(0.3)
—
—
—
Other
—
(1.4)
—
—
—
—
Net periodic cost (benefit)
$
(0.7)
$
(1.0)
$
(0.3)
$
(0.1)
$
(1.1)
$
(0.9)
The weighted average assumptions used to determine benefit obligations are as follows:
Pension Benefits
Postretirement Benefits
For the year ended December 31,
2025
2024
2023
2025
2024
2023
U.S. Plans:
Discount rate
4.14
%
4.39
%
4.02
%
5.20
%
5.50
%
5.00
%
Rate of compensation increase
N/A
N/A
N/A
N/A
N/A
N/A
Interest credit rate
4.14
%
4.39
%
4.02
%
N/A
N/A
N/A
Non-U.S. Plans:
Discount rate
2.99
%
2.52
%
2.57
%
N/A
N/A
N/A
Rate of compensation increase
1.99
%
2.01
%
2.03
%
N/A
N/A
N/A
Interest credit rate
1.89
%
0.97
%
1.75
%
N/A
N/A
N/A
68
NOTES TO CONSOLIDATED AND COMBINED FINANCIAL STATEMENTS
The weighted-average assumptions used to determine net periodic benefit cost are as follows:
Pension Benefits
Postretirement Benefits
For the year ended December 31,
2025
2024
2023
2025
2024
2023
U.S. Plans:
Discount rate
4.39
%
4.02
%
5.43
%
5.50
%
5.40
%
5.40
%
Expected rate of return on plan assets
N/A
N/A
N/A
N/A
N/A
N/A
Rate of compensation increase
N/A
N/A
N/A
N/A
N/A
N/A
Interest credit rate
4.39
%
4.02
%
3.62
%
N/A
N/A
N/A
Non-U.S. Plans:
Discount rate
2.52
%
2.57
%
3.17
%
N/A
N/A
N/A
Expected rate of return on plan assets
3.62
%
4.19
%
4.07
%
N/A
N/A
N/A
Rate of compensation increase
2.01
%
2.03
%
2.17
%
N/A
N/A
N/A
Interest credit rate
0.97
%
1.86
%
1.81
%
N/A
N/A
N/A
The long-term expected rate of return on plan assets assumptions were determined with input from independent investment consultants and plan actuaries, utilizing asset pricing models and considering historical returns. The discount rates used by us for valuing pension liabilities are based on a review of high-quality corporate bond yields with maturities approximating the remaining life of the projected benefit obligations.
For the non-U.S. plans, the 3.62% expected rate of return on assets assumption for 2025 reflected a weighted average of the long-term asset allocation targets for our various non-U.S. plans. As of December 31, 2025, the actual weighted average asset allocation for the non-U.S. plans was 8% equity securities, 35% fixed income securities, 56% alternative assets/other and 1% cash and cash equivalents.
The assumed health care cost trend rates are as follows:
December 31,
2025
2024
Health care cost trend rate assumed for next year
8.50
%
7.00
%
Rate to which the cost trend rate is assumed to decline (the ultimate trend rate)
4.50
%
4.50
%
Year that the rate reaches the ultimate trend rate
2039
2035
Assumed health care cost trend rates have a significant effect on the amounts reported for our health care plans.
Plan Assets
Our pension plan target allocations and weighted-average asset allocations by asset category are as follows, along with the actual allocation related to the Dedicated Plans:
Target Allocation
Actual Allocation
Asset Category December 31,
2025
2024
Equity securities
5% - 75%
8
%
9
%
Fixed income securities
15% - 75%
35
%
33
%
Alternative assets/Other
0% - 75%
56
%
58
%
Cash and money market
0% - 10%
1
%
—
%
Independent investment consultants are retained to assist in executing the plans’ investment strategies. Several factors are evaluated in determining if an investment strategy will be implemented in our pension trusts. These factors include, but are not limited to, investment style, investment risk, investment manager performance and costs. We periodically review investment managers and their performance in relation to our plans’ investment objectives.
The primary investment objective of our various plan assets is to ensure that there are sufficient assets to pay benefits when they are due while mitigating associated risk and minimizing employer contributions. The plans’ assets are typically invested in a broad range of equity securities, fixed income securities, insurance contracts, alternative assets and cash instruments.
Equity securities include investments in large, mid, and small-capitalization companies located in both developed countries and emerging markets around the world. Fixed income securities include government bonds of various countries, corporate bonds that are primarily investment-grade, and mortgage-backed securities. Alternative assets include investments in real estate, insurance contracts and hedge funds employing a wide variety of strategies.
69
NOTES TO CONSOLIDATED AND COMBINED FINANCIAL STATEMENTS
The fair value of our pension plan assets as of December 31, 2025, by asset category, are as follows:
(in millions)
Active Markets for Identical Assets Level 1
Other Observable Inputs Level 2
Unobservable Inputs Level 3
Net Asset Value ("NAV") Practical Expedient (a)
Total Fair Value
Cash Equivalents and Money Markets
$
0.4
$
—
$
—
$
—
$
0.4
Commingled and Mutual Funds
Non-U.S. Equity Funds
—
—
—
6.5
6.5
Collective Trust
—
—
20.8
13.5
34.3
Non-U.S. Fixed Income, Government and Corporate
—
—
—
26.9
26.9
Alternative Investments
Insurance / Annuity Contract(s)
—
8.1
—
—
8.1
Total Fair Value
$
0.4
$
8.1
$
20.8
$
46.9
76.2
(a)
Investments are measured at fair value using the net asset value per share practical expedient, and therefore, are not classified in the fair value hierarchy.
In 2025, the pension plan's asset classified as Level 3 constitutes an insurance contract valued annually on an actuarial basis.
The fair value of our pension plan assets as of December 31, 2024, by asset category, are as follows:
(in millions)
Active Markets for Identical Assets Level 1
Other Observable Inputs Level 2
Unobservable Inputs Level 3
Net Asset Value ("NAV") Practical Expedient (a)
Total Fair Value
Cash Equivalents and Money Markets
$
0.2
$
—
$
—
$
—
$
0.2
Commingled and Mutual Funds
Non-U.S. Equity Funds
—
—
—
6.6
6.6
Collective Trust
—
—
19.5
18.2
37.7
Non-U.S. Fixed Income, Government and Corporate
—
—
—
25.1
25.1
Alternative Investments
Insurance / Annuity Contract(s)
—
6.9
—
—
6.9
Total Fair Value
$
0.2
$
6.9
$
19.5
$
49.9
$
76.5
(a)
Investments are measured at fair value using the net asset value per share practical expedient, and therefore, are not classified in the fair value hierarchy.
In 2024, the pension plan's asset classified as Level 3 constitutes an insurance contract valued annually on an actuarial basis.
Cash Flows
We expect, based on current actuarial calculations, to contribute cash of approximately $1.2 million to our defined benefit pension plans during 2026. Cash contributions in subsequent years will depend on several factors including the investment performance of plan assets for funded plans.
70
NOTES TO CONSOLIDATED AND COMBINED FINANCIAL STATEMENTS
Estimated Future Benefit Payments
The following benefit payments, which reflect expected future service, as appropriate, are expected to be paid:
Estimated future payments (in millions)
Pension Benefits
Postretirement Benefits
2026
$
3.7
$
1.2
2027
3.8
1.2
2028
4.0
1.0
2029
3.9
1.0
2030
4.2
1.0
2031 to 2035
21.0
4.2
Total payments
$
40.6
$
9.6
Supplemental Executive Retirement Plan
We also have a non-qualified Supplemental Executive Retirement Plan (“SERP”). The SERP, which is not funded, is intended to provide retirement benefits for certain executive officers who were formerly employees of Security and Authentication Technologies prior to the acquisition of Crane Currency in 2018. Benefit amounts are based upon years of service and compensation of the participating employees. We recorded no pre-tax settlement gain or loss in 2025 and 2024. We recorded minimal pre-tax settlement gain and loss in 2023. Accrued SERP benefits, which were recorded in Accrued liabilities and Accrued pension and postretirement benefits in the Consolidated Balance Sheets, were $1.3 million and $1.3 million as of December 31, 2025, and 2024, respectively. Employer contributions made to the SERP were $0.1 million, $0.1 million and $0.7 million in 2025, 2024 and 2023, respectively.
Defined Contribution Plans
We sponsor savings and investment plans that are available to our eligible employees including employees of our subsidiaries. We made contributions to the plans of $5.4 million, $5.1 million and $4.5 million in 2025, 2024 and 2023, respectively.
In addition to participant deferral contributions and company matching contributions on those deferrals, we provide a 3% non-matching contribution to eligible participants. We made non-matching contributions to these plans of $6.3 million, $5.8 million and $5.5 million in 2025, 2024 and 2023, respectively.
Note 8 – Stock-Based Compensation Plans
As a result of the Separation, all outstanding stock-based compensation awards of Holdings were exchanged for similarly valued stock-based compensation awards of either SpinCo, Crane NXT or both. The exchanged awards are subject to the same service vesting requirements as the original awards. Upon the exchange, there were 0.5 million options outstanding related to Crane NXT associates and 0.6 million options outstanding related to SpinCo associates.
The modification of the performance-based restricted share units resulted in a liability recorded upon Separation. The amount of the liability was $1.0 million and $1.6 million as of December 31, 2025, and 2024, respectively.
At December 31, 2025, we had stock-based compensation awards outstanding under the following shareholder-approved plans: the 2013 Stock Incentive Plan (the "2013 Plan"), 2018 Stock Incentive Plan (the "2018 Plan") and 2018 Amended and Restated Stock Incentive Plan (the “2018 Amended & Restated Plan”), applicable to employees and non-employee directors.
The 2013 Plan was approved by the Board of Directors and stockholders at the annual meeting in 2013. The 2013 Plan originally authorized the issuance of up to 9,500,000 shares of stock pursuant to awards under the plan. In 2018, in view of the limited number of shares remaining available under the 2013 Plan, the Board of Directors and stockholders approved the adoption of the 2018 Plan which authorized the issuance of up to 6,500,000 shares of Crane Holdings, Co. stock. In 2021, the Board of Directors and stockholders approved the adoption of the 2018 Amended and Restated Stock Incentive Plan which authorized the issuance of up to 4,710,000 shares of Crane Holdings, Co. stock. No further awards will be made under the 2013 Plan or 2018 Plan.
The stock incentive plans are used to provide long-term incentive compensation through stock options, restricted share units, performance-based restricted share units and deferred stock units.
71
NOTES TO CONSOLIDATED AND COMBINED FINANCIAL STATEMENTS
Stock Options
Options are granted under the Stock Incentive Plan to officers and other key employees at an exercise price equal to the closing price on the date of grant. Unless otherwise determined by the Compensation Committee which administers the plan, options vest in four installments of 25% per year over four years beginning on the first anniversary of the grant date. All options granted to officers and employees after 2014 expire 10 years after the date of grant.
We determine the fair value of each grant using the Black-Scholes option pricing model. The weighted-average assumptions for grants during the years ended December 31, 2025, 2024 and 2023 are as follows:
2025
2024
2023
Dividend yield
1.17
%
1.10
%
1.57
%
Volatility
35.23
%
36.00
%
32.33
%
Risk-free interest rate
4.11
%
4.23
%
3.67
%
Expected lives in years
7.7
7.7
7.7
For 2025 and 2024, expected dividend yield was based on our dividend rate. For 2023, expected dividend yield was based on Holdings’ dividend rate. For 2025 and 2024, expected stock volatility was based on a weighted blend of our available stock price history and the median historical volatility of members of a volatility peer group. For 2023, expected stock volatility was determined based upon Holdings’ historical volatility for the four-year period preceding the date of grant. The risk-free interest rate was based on the yield curve in effect at the time the options were granted, using U.S. constant maturities over the expected life of the option. The expected lives of the awards represented the period of time that options granted are expected to be outstanding.
Activity in Crane NXT’s stock option plans for the year ended December 31, 2025 were as follows:
Option Activity
Number of Shares (in 000’s)
Weighted Average Exercise Price
Weighted Average Remaining Life (Years)
Aggregate Intrinsic Value (in millions) (a)
Options outstanding as of January 1, 2025
464
$
40.82
Granted
106
58.25
Exercised
(39)
26.74
Canceled
(15)
54.78
Options outstanding as of December 31, 2025
516
$
45.06
6.73
$
3.0
Options exercisable as of December 31, 2025
256
$
37.02
5.26
$
2.8
(a) The aggregate intrinsic value is calculated as the difference between the exercise price of the underlying options and the estimated fair value of the common stock for in the money options at December 31, 2025.
Included in our stock-based compensation was expense recognized for our stock option awards of $1.7 million, $1.4 million and $4.8 million for the years ended December 31, 2025, 2024 and 2023, respectively.
During 2025, the weighted-average fair value of options granted was $23.82, the total fair value of shares vested was $1.5 million, and the total intrinsic value of options exercised was $1.2 million.
The total cash received from these option exercises during 2025, 2024 and 2023 was $2.6 million, $3.3 million and $5.0 million, respectively, and is reflected in the Consolidated and Combined Statement of Cash Flows as “Proceeds from stock options exercised” within financing activities. The tax benefit realized for the tax deductions from these option exercises was $0.1 million, $0.4 million and $0.4 million as of December 31, 2025, 2024 and 2023, respectively.
As of December 31, 2025, there was $3.8 million of total future compensation cost related to unvested share-based awards to be recognized over a weighted-average period of 2.07 years.
72
NOTES TO CONSOLIDATED AND COMBINED FINANCIAL STATEMENTS
Restricted Share Units and Performance-Based Restricted Share Units
Restricted share units vest in four installments of 25% per year over four years beginning on the first anniversary of the grant date and are subject to forfeiture restrictions which lapse over time. The vesting of performance-based restricted share units is determined based on relative total shareholder return for Crane NXT, Co. compared to the S&P Midcap 400 Capital Goods Group over a three-year period, with payout potential ranging from 0% to 200% but capped at 100% if our three-year total shareholder return is negative. The fair value of performance-based restricted share units is calculated using a Monte Carlo pricing model on the date of grant.
Included in our stock-based compensation was expense recognized for our restricted share unit and performance-based restricted share unit awards of $11.0 million, $9.2 million and $5.5 million for the years ended December 31, 2025, 2024 and 2023, respectively. The tax benefit for the vesting of the restricted share units was $0.6 million, $0.8 million and $0.5 million as of December 31, 2025, 2024 and 2023, respectively.
As of December 31, 2025, there was $17.7 million of total future compensation cost related to restricted share unit and performance-based restricted share unit awards, to be recognized over a weighted-average period of 1.79 years.
Changes in our restricted share units for the year ended December 31, 2025 were as follows:
Restricted Share Unit Activity
Restricted Share Units (in 000’s)
Weighted Average Grant-Date Fair Value
Restricted share units as of January 1, 2025
461
$
51.07
Restricted share units granted
180
56.96
Restricted share units vested
(159)
46.22
Restricted share units forfeited
(42)
51.07
Performance-based restricted share units granted
89
63.61
Performance-based restricted share units vested
(14)
48.63
Performance-based restricted share units forfeited
(13)
62.08
Restricted share units as of December 31, 2025
502
$
56.73
Note 9 - Leases
Arrangements that explicitly or implicitly relate to property, plant and equipment are assessed at inception to determine if the arrangement is or contains a lease. Generally, we enter operating leases as the lessee and recognize right-of-use assets and lease liabilities based on the present value of future lease payments over the lease term.
We lease certain vehicles, equipment, manufacturing and non-manufacturing facilities. We have leases with both lease components and non-lease components, such as common area maintenance, utilities, or other repairs and maintenance. For all asset classes, we applied the practical expedient to account for each separate lease component and its associated non-lease component(s) as a single lease component.
We identify variable lease payments, such as maintenance payments based on actual activities performed or costs incurred, at lease commencement by assessing the nature of the payment provisions, including whether the payments are subject to a minimum.
Certain leases include options to renew for an additional term or company-controlled options to terminate. We generally determine it is not reasonably certain to assume the exercise of renewal options because there is no economic incentive to renew. As termination options often include penalties, we generally determine it is reasonably certain that termination options will not be exercised because there is an economic incentive not to terminate. Therefore, these options generally do not impact the lease term or the determination or classification of the right-of-use asset and lease liability.
We do not enter arrangements where restrictions or covenants are imposed by the lessor that, for example, relate to incurring additional financial obligations. Furthermore, we also have not entered any significant sublease arrangements.
We use our collateralized incremental borrowing rate based on the information available at commencement date to determine the present value of future payments and the appropriate lease classification. The rate implicit in the lease is generally unknown, as we generally operate in the capacity of the lessee.
73
NOTES TO CONSOLIDATED AND COMBINED FINANCIAL STATEMENTS
Our Consolidated Balance Sheets include the following related to leases:
(in millions) December 31,
Classification
2025
2024
Assets
Operating right-of-use assets
Other assets
$
67.2
$
60.4
Liabilities
Current lease liabilities
Accrued liabilities
$
14.6
$
10.6
Long-term lease liabilities
Other liabilities
55.6
52.7
Total lease liabilities
$
70.2
$
63.3
The components of lease cost were as follows:
(in millions) December 31,
2025
2024
2023
Operating lease cost
$
18.2
$
15.4
$
11.0
Variable lease cost
2.8
2.4
1.8
Total lease cost
$
21.0
$
17.8
$
12.8
The weighted average remaining lease terms and discount rates for our operating leases were as follows:
December 31,
2025
2024
Weighted-average remaining lease term (in years) - operating leases
13.3
13.5
Weighted-average discount rate - operating leases
5.7
%
5.6
%
Supplemental cash flow information related to our operating leases were as follows:
(in millions) December 31,
2025
2024
2023
Cash paid for amounts included in measurement of operating lease liabilities - operating cash flows
$
12.6
$
9.8
$
8.2
Right-of-use assets obtained in exchange for new operating lease liabilities
$
6.8
$
5.3
$
16.5
Future minimum operating lease payments are as follows:
(in millions)
December 31, 2025
2026
$
17.7
2027
14.1
2028
9.1
2029
7.6
2030
6.2
Thereafter
47.9
Total future minimum operating lease payments
$
102.6
Imputed interest
32.4
Present value of lease liabilities reported
$
70.2
Note 10 – Income Taxes
Provision for Income Taxes
Our income before taxes is as follows:
(in millions) December 31,
2025
2024
2023
U.S. operations
$
91.5
$
78.2
$
97.4
Non-U.S. operations
89.5
148.2
142.4
Total income before tax
$
181.0
$
226.4
$
239.8
74
Our provision (benefit) for income taxes consists of:
(in millions) December 31,
2025
2024
2023
Current Tax:
U.S. federal
$
27.8
$
29.2
$
31.3
U.S. state and local
3.7
(0.1)
1.7
Non-U.S.
18.9
28.1
20.6
Total current tax
50.4
57.2
53.6
Deferred Tax:
U.S. federal
(9.2)
(13.4)
(2.8)
U.S. state and local
(0.9)
1.3
(0.4)
Non-U.S.
(4.4)
(2.8)
1.1
Total deferred tax
(14.5)
(14.9)
(2.1)
Total provision for income taxes (a)
$
35.9
$
42.3
$
51.5
(a) Included in the above amounts are excess tax benefits from share-based compensation of $0.7 million, $1.2 million and $0.9 million in 2025, 2024 and 2023, respectively, which were reflected as reductions in our provision for income taxes in 2025, 2024 and 2023.
A reconciliation of the statutory U.S. federal tax rate to our effective tax rate is as follows:
(in millions, except %) December 31,
2025
In USD
Percent of Pre-tax Income
U.S. Federal Statutory Tax Rate
$
38.0
21.0
%
State and Local Income Taxes, Net of Federal Income Tax Effect (a)
3.3
1.8
%
Foreign Tax Effects
Italy
Change in Valuation Allowances
3.1
1.7
%
Other
(0.4)
(0.2)
%
Malta
Statutory tax rate difference between Malta and United States
(2.8)
(1.5)
%
Notional Interest Deduction
(4.5)
(2.5)
%
Other
0.6
0.3
%
United Kingdom
(2.3)
(1.2)
%
Other foreign jurisdictions
2.4
1.3
%
Effects of Changes in Tax Laws or Rates Enacted in the Current Period
—
—
%
Effects of Cross-Border Tax Laws
Global intangible low-taxed income, net of FTC
1.5
0.8
%
Foreign-derived intangible income
(3.8)
(2.1)
%
Subpart F income, net of FTC
4.2
2.3
%
U.S. tax on foreign branches, net of FTC
(4.1)
(2.3)
%
Tax Credits
Research and development tax credits
(1.6)
(0.9)
%
Change in Valuation Allowances
1.7
0.9
%
Nontaxable or Nondeductible Items
3.7
2.0
%
Changes in Unrecognized Tax Benefits
(2.5)
(1.4)
%
Other Adjustments
(0.6)
(0.2)
%
Effective tax rate
$
35.9
19.8
%
(a) As of December 31, 2025, state taxes in Illinois, Massachusetts, Maryland, Texas and Utah made up the majority (greater than 50 percent) of the tax effect in this category.
75
December 31,
2024
2023
Statutory U.S. federal tax rate
21.0
%
21.0
%
Increase (reduction) from:
Income taxed at non-U.S. rates
(1.4)
%
(2.0)
%
Non-U.S. income inclusion, net of tax credits
0.5
%
2.0
%
State and local taxes, net of federal benefit
0.2
%
1.0
%
Changes in reserves for uncertain tax positions
(2.7)
%
(1.3)
%
U.S. deduction for foreign - derived intangible income
(1.0)
%
(0.8)
%
Other
2.1
%
1.6
%
Effective tax rate
18.7
%
21.5
%
On July 4, 2025, the U.S. government enacted The One Big Beautiful Bill Act of 2025 which includes various changes to the U.S. corporate income tax system including, but not limited to, the immediate expensing of qualifying research and development expenses and the permanent extension of certain provisions initially enacted within the Tax Cuts and Jobs Act. Based on the Company’s evaluation of the provisions, these tax law changes did not have a material impact on the Company’s financial statements.
The Organization for Economic Co-operation and Development (“OECD”) has proposed a global minimum tax of 15% of reported profits (“Pillar 2 tax ”) that has been agreed upon by over 140 member jurisdictions including the United States. Pillar 2 addresses the risks associated with profit shifting to entities in low tax jurisdictions. The Pillar 2 tax liability for the Company in 2025 was approximately $1.3 million. On January 5, 2026, the US Treasury Department and OECD have agreed in principle to adopt a side-by-side tax system that will exempt US parented companies from Pillar 2 taxes starting in 2026.
As of December 31, 2025, we have made the following determinations regarding our non-U.S. earnings:
(in millions)
Permanently reinvested
Not permanently reinvested
Amount of earnings
$
679.6
$
107.9
Associated tax
N/A (a)
$
0.1
(a) Determination of U.S. income taxes and non-U.S. withholding taxes due upon repatriation of this $679.6 million of earnings is not practicable because the amount of such taxes depends upon circumstances existing in numerous taxing jurisdictions at the time the remittance occurs.
Tax Related to Comprehensive Income
During 2025, 2024 and 2023, tax provisions of $0.6 million, $0.5 million and $0.5 million, respectively, related to changes in pension and post-retirement plan assets and benefit obligations, were recorded to accumulated other comprehensive loss.
76
Deferred Taxes and Valuation Allowances
The components of deferred tax assets and liabilities included in our Consolidated Balance Sheets are as follows:
(in millions) December 31,
2025
2024
Deferred tax assets:
Tax loss and credit carryforwards
$
53.3
$
46.1
Interest Deduction carryforward
1.5
—
Inventories
5.6
7.6
Capitalized Research and Development
16.9
16.1
Accruals and Reserves
9.0
9.5
Pension and Post Retirement Benefits
1.0
3.3
Other
6.2
5.8
Total
$
93.5
$
88.4
Less: valuation allowance
51.3
43.6
Total deferred tax assets, net of valuation allowance
$
42.2
$
44.8
Deferred tax liabilities:
Basis difference in intangible assets
$
(160.9)
$
(131.1)
Basis difference in fixed assets
(29.7)
(29.7)
Other
(0.1)
(0.8)
Total deferred tax liabilities
$
(190.7)
$
(161.6)
Net deferred tax liability
$
(148.5)
$
(116.8)
Balance sheet classification:
Long-term deferred tax assets
$
2.5
$
2.2
Long-term deferred tax liability
(151.0)
(119.0)
Net deferred tax liability
$
(148.5)
$
(116.8)
As of December 31, 2025, we had U.S. federal, U.S. state and non-U.S. tax loss and credit carryforwards that will expire, if unused, as follows:
(in millions) Year of expiration
U.S. Federal Tax Credits
U.S. Federal Tax Losses
U.S. State Tax Credits
U.S. State Tax Losses
Non-U.S. Tax Credits
Non- U.S. Tax Losses
Total
2026-2030
$
—
$
—
$
0.4
$
141.2
$
—
$
—
After 2030
10.0
0.5
0.7
368.8
—
—
Indefinite
—
—
—
6.5
—
52.1
Total tax carryforwards
$
10.0
$
0.5
$
1.1
$
516.5
$
—
$
52.1
Deferred tax asset on tax carryforwards
$
10.0
$
0.1
$
0.8
$
28.5
$
0.8
$
13.1
$
53.3
Valuation allowance on tax carryforwards
(10.0)
(0.1)
(0.4)
(27.8)
—
(13.0)
(51.3)
Net deferred tax asset on tax carryforwards
$
—
$
—
$
0.4
$
0.7
$
0.8
$
0.1
$
2.0
As of December 31, 2025, and 2024, we determined that it was more likely than not that $51.3 million and $43.6 million, respectively, of our deferred tax assets related to tax loss and credit carryforwards will not be realized.
77
Unrecognized Tax Benefits
A reconciliation of the beginning and ending amount of our gross unrecognized tax benefits, excluding interest and penalties, is as follows:
(in millions)
2025
2024
2023
Balance of liability as of January 1,
$
8.1
$
16.5
$
7.6
Increase (decrease) as a result of:
Tax positions taken during a prior year
(0.5)
(1.0)
(0.2)
Tax positions taken during the current year
0.5
0.4
0.5
Settlements with taxing authorities
—
—
(0.1)
Lapse of the statute of limitations
(2.6)
(7.8)
(5.2)
Other
—
—
13.9
Balance of liability as of December 31,
$
5.5
$
8.1
$
16.5
As of December 31, 2025, 2024 and 2023, the amount of our unrecognized tax benefits that, if recognized, would affect our effective tax rate was $6.1 million, $8.6 million and $18.4 million, respectively. The difference between these amounts and those reflected in the table above relates to (1) offsetting tax effects from other tax jurisdictions, and (2) interest expense, net of deferred taxes. As of December 31, 2025, and 2024, we had gross unrecognized benefits, including interest and penalties of $6.6 million, and $9.4 million, respectively, included in “Other liabilities” in our Consolidated Balance Sheets.
As of December 31, 2023, the Company has recorded a gross unrecognized tax benefit of $13.9 million due to the Separation from SpinCo which is included in the above table as “Other.” As of December 31, 2025, and 2024, the Company had an indemnification receivable of $1.9 million, and $3.1 million, respectively, from SpinCo per the terms of the Tax Matters Agreement described below.
The Tax Matters Agreement specifies the rights, responsibilities, and obligations after the Separation with respect to tax liabilities and benefits. The agreement specifies the portion, if any, of this tax liability for which we and SpinCo will bear responsibility, and we and SpinCo agreed to indemnify each other against any amounts for which they are not responsible.
We recognize interest and penalties related to unrecognized tax benefits as a component of our income tax expense. During the years ended December 31, 2025, 2024 and 2023, we recognized interest and penalty income of $0.2 million, $1.0 million and $0.1 million, respectively, in our Consolidated and Combined Statements of Operations. As of December 31, 2025, and 2024, we had accrued $1.1 million and $1.3 million, respectively, of interest and penalties related to unrecognized tax benefits on our Consolidated Balance Sheets.
Income Taxes Paid
(in millions) December 31,
2025
A breakdown of income taxes paid (net of refunds) is as follows:
U.S. Federal
$
26.2
U.S. State
4.8
Non-U.S.
19.9
Total income taxes paid, net
$
50.9
Income taxes paid (net of refunds) exceeded 5 percent of total income taxes paid (net of refunds) in the following jurisdictions:
U.S. Federal
$
26.2
Foreign
Japan
$
13.7
United Kingdom
$
4.2
78
Income Tax Examinations
Our income tax returns are subject to examination by the U.S. federal, U.S. state and local, and non-U.S. tax authorities. With few exceptions, the years open to examinations are as follows:
Jurisdiction
Year
U.S. federal
2022 - 2024
U.S. state and local
2019 - 2024
Non-U.S.
2018 - 2024
Currently, we and our subsidiaries are under examination in various jurisdictions.
Note 11 – Accrued Liabilities
Accrued liabilities consist of:
(in millions) December 31,
2025
2024
Employee related expenses
$
58.5
$
53.4
Contract liabilities
87.3
71.4
Current lease liabilities
14.6
10.6
Accrued interest
7.6
6.6
Warranty
10.9
6.2
Share deposit liabilities1
14.4
—
Other
79.7
63.0
Total
$
273.0
$
211.2
1Share deposit liabilities represent ordinary shares that the Company is obligated to issue related to the acquisition of Antares Vision. See Note 3, “Acquisitions” for further details.
Note 12 – Other Liabilities
A summary of the other liabilities is as follows:
(in millions) December 31,
2025
2024
Long-term lease liabilities
$
55.6
$
52.7
Long-term contract liabilities
17.0
13.5
Accrued taxes
6.6
9.4
Share deposit liabilities1
21.4
—
Stock-based compensation liabilities1
12.0
—
Other
3.4
4.6
Total
$
116.0
$
80.2
1 Share deposit liabilities represent Class B shares that the Company is obligated to issue related to the acquisition of Antares Vision. The Class B shares that have been granted are accounted for as stock‑based compensation under ASC Topic 718 “Compensation - Stock Compensation” (“ASC 718”). See Note 3, “Acquisitions” for further details.
79
Note 13 - Commitments and Contingencies
We regularly review the status of lawsuits, claims and proceedings that have been or may be asserted against us relating to the conduct of our business, including those pertaining to product liability, patent infringement, commercial, employment, employee benefits, environmental and stockholder matters. We record a provision for a liability for such matters when it is considered probable that a liability has been incurred and the amount of the loss can be reasonably estimated. These provisions, if any, are reviewed quarterly and adjusted as additional information becomes available. If either or both criteria are not met, we assess whether there is at least a reasonable possibility that a loss, or additional losses, may have been incurred. If there is a reasonable possibility that a loss or additional loss may have been incurred for such matters, we disclose the estimate of the amount of loss or range of loss, disclose that the amount is immaterial, or disclose that an estimate of loss cannot be made, as applicable. We believe that as of December 31, 2025, there was no reasonable possibility that a material loss, or any additional material losses, may have been incurred for such matters, and that adequate provision has been made in our Consolidated and Combined Financial Statements for the potential impact of all such matters.
Note 14 – Financing
Our debt as of December 31, 2025, and 2024 consisted of the following:
(in millions) December 31,
2025
2024
Term Loan A
$
9.1
$
—
Revolving Facility
126.0
210.0
Total short-term borrowings (a)
$
135.1
$
210.0
Term Loan A
$
351.4
$
—
Term Loan B
120.7
—
6.55% notes due November 2036
198.8
198.7
4.20% notes due March 2048
346.9
346.8
Other deferred financing costs associated with credit facilities
(13.4)
(4.9)
Total long-term debt (a)
$
1,004.4
$
540.6
(a ) Debt discounts and debt issuance costs totaled $30.7 million and $9.4 million as of December 31, 2025, and 2024, respectively, and have been netted against the aggregate principal amounts of the related debt in the components of the debt table above, where applicable.
Credit Facilities - On March 17, 2023, we became party to a senior secured credit agreement (the “Credit Agreement”) which originally provided for a $500 million, five-year revolving credit facility (the “Revolving Facility”) and we entered into a $350 million, three-year term loan facility (the “Term Facility”). Funding for both facilities became available in connection with the Separation.
On December 9, 2024, we entered into an amendment to the Credit Agreement which increased the Revolving Facility by $200 million to an aggregate $700 million and provided a delayed draw term loan (the “Term Loan A”) of £300 million. On the same day, proceeds from the Revolving Facility were used to repay the outstanding Term Facility.
On December 15, 2025, in connection with the closing of the first phase of the Antares Vision acquisition, we amended our Credit Agreement (the “Fifth Amendment”) to provide for a new €430 million senior secured delayed draw term loan facility (the “Term Loan B”) with a maturity date of December 15, 2032. In addition, the Fifth Amendment provides for maturity extensions on our existing Term Loan A and Revolving Facility to December 15, 2030 and increased the Revolving Facility to $800.0 million.
80
During the year ended December 31, 2025, we borrowed:
•$406.5 million and repaid $490.5 million on the Revolving Facility to fund working capital requirements.
•£300.0 million, or $400.4 million, on the Term Loan A to fund the DLR acquisition and repaid $40.9 million.
• €112.1 million, or $131.6 million, on the Term Loan B to fund the Antares Vision acquisition.
The Revolving Facility allows us to borrow, repay and re-borrow funds from time to time prior to the maturity of the Revolving Facility without any premium or penalty, subject to customary borrowing conditions for facilities of this type and the reimbursement of breakage costs. Borrowings under the Term Loan A are prepayable without premium or penalty, subject to customary breakage costs. Borrowings under the Term Loan B are prepayable (i) prior to June 15, 2026, subject to certain customary exceptions, subject to a 1.00% premium if such prepayment is made in connection with a repricing transaction and (ii) on and after June 15, 2026, without premium or penalty, and, in each case, subject to customary reimbursement of breakage costs. Under the Credit Agreement, variable interest rates apply with respect to (i) the Term Loan B, for which the interest rate is determined as an adjusted term Euro Interbank Offered Rate (“EURIBOR”) for the applicable interest period plus a margin ranging from 2.25% to 2.75%, with such margin determined based on our first lien net leverage ratio, (ii) with respect to the Term Loan A, for which the interest rate is determined as, at our election, either (a) a Sterling Overnight Index Average (“SONIA”) for the applicable interest period plus a margin ranging from 1.50% to 2.25% or (2) a base rate plus a margin ranging from 0.50% to 1.25%, in each case, with such margin as determined by the lower of ratings issued by Moody’s and S&P of senior, unsecured, long-term indebtedness (the “Ratings”) and our total net leverage ratio and (iii) with respect to the Revolving Facility, for which the interest rate is determined as, at our election, either (a) subject to the elected currency, an adjusted Secured Overnight Financing Rate (“SOFR”), EURIBOR or SONIA for the applicable interest period plus a margin ranging from 1.50% to 2.25% or (b) a base rate plus a margin ranging from 0.50% to 1.25%, in each case, with such margin determined based on the lower of the Ratings and our total net leverage ratio, and (iii) with respect to the Revolving Facility, for which the interest rate is determined as, at our election, either (a) subject to the elected currency, an adjusted Secured Overnight Financing Rate (“SOFR”), EURIBOR or SONIA for the applicable interest period plus a margin ranging from 1.50% to 2.25% or (b) a base rate plus a margin ranging from 0.50% to 1.25%, in each case, with such margin determined based on the lower of the Ratings and our total net leverage ratio.
We are required to pay a fee on undrawn commitments under the Revolving Facility at a rate per annum that ranges from 0.20% to 0.35%, based on the lower of the Ratings and our total net leverage ratio. The Credit Agreement contains customary affirmative and negative covenants for credit facilities of this type, including limitations on our and our subsidiaries with respect to indebtedness, liens, mergers, consolidations, liquidations and dissolutions, sales of all or substantially all assets, transactions with affiliates, investments, hedging arrangements and amendments to our organizational documents or to certain subordinated debt agreements. As of the last day of each fiscal quarter, our total net leverage ratio cannot exceed (i) prior to the completion of the Antares Vision acquisition, 3.50 to 1.00 (provided that, at our election, such maximum ratio may be increased to 4.00 to 1.00 for specified periods following our consummation of certain material acquisitions) and (ii) after the completion of the Antares Vision acquisition, for the (1) fiscal quarter in which the Antares Vision acquisition is completed, 5.50 to 1.00, (2) for the first fiscal quarter thereafter, 5.25 to 1.00, (3) for the second fiscal quarter thereafter, 5.00 to 1.00, (4) for the third fiscal quarter thereafter, 4.75 to 1.00, (5) for the fourth fiscal quarter thereafter, 4.50 to 1.00 and (6) for any subsequent fiscal quarter, 4.25 to 1.00 (provided that, at our election, for any period in which the completion of the Antares Vision acquisition occurs or any subsequent period, such maximum ratio may be increased by 0.75 to 1.00, but not in excess of 5.50 to 1.00, for specified periods following our consummation of certain material acquisitions). Prior to the completion of the Antares Vision acquisition, as of the last day of each fiscal quarter, our minimum interest coverage ratio must be at least 3.00 to 1.00. The Credit Agreement also includes customary events of default, including failure to pay principal, interest or fees when due, failure to comply with covenants, any representation or warranty made by us or any of our material subsidiaries being false in any material respect, default under certain other material indebtedness, certain insolvency or receivership events affecting us and our material subsidiaries, certain ERISA events, material judgments and a change in control, in each case, subject to cure periods and thresholds where customary.
81
Bridge Facility - In connection with the Antares Vision acquisition (see note 3 “Acquisition”), on September 15, 2025, the Company entered into a commitment for a senior secured 364-day Bridge Facility (“Bridge Facility”) of $602 million and a backstop facility (the “Backstop Facility”) of $831 million. The Backstop Facility was in place until October 7, 2025 when the amendment to the Credit Agreement was ratified. The Bridge Facility was automatically terminated upon securing the Term Loan B, described above.
6.55% notes due November 2036 - In November 2006, we issued 30-year notes having an aggregate principal amount of $200 million. The notes are secured, senior obligations of us that mature on November 15, 2036, and bear interest at 6.55% per annum, payable semi-annually on May 15 and November 15 of each year. The notes have no sinking fund requirement, but may be redeemed, in whole or in part, at our option. These notes do not contain any material debt covenants or cross default provisions. If there is a change in control of the Company, and if consequently, the notes are rated below investment grade by both Moody’s Investors Service and Standard & Poor’s, then holders of the notes may require us to repurchase them, in whole or in part, for 101% of the principal amount plus accrued and unpaid interest. Debt issuance costs are deferred and included in long-term debt and are amortized as a component of interest expense over the term of the notes. Including debt issuance cost amortization, these notes have an effective annualized interest rate of 6.67%. The notes were issued under an indenture dated as of April 1, 1991. The indentures contain certain restrictions, including a limitation that restricts our ability and the ability of certain of our subsidiaries to create or incur secured indebtedness, enter certain sale and leaseback transactions, and consolidate, merge or transfer all or substantially all of our assets and the assets of our subsidiaries.
4.20% notes due March 2048 - On February 5, 2018, we completed a public offering of $350 million aggregate principal amount of 4.20% Senior Notes due 2048 (the "2048 Notes"). The 2048 Notes bear interest at a rate of 4.20% per annum and mature on March 15, 2048. Interest on the 2048 Notes is payable on March 15 and September 15 of each year, commencing on September 15, 2018. These notes do not contain any material debt covenants or cross default provisions. If there is a change in control of the Company, and if consequently, the notes are rated below investment grade by both Moody’s Investors Service and Standard & Poor’s, then holders of the notes may require us to repurchase them, in whole or in part, for 101% of the principal amount plus accrued and unpaid interest. Debt issuance costs are deferred and included in long-term debt and are amortized as a component of interest expense over the term of the notes. Including debt issuance cost amortization, these notes have an effective annualized interest rate of 4.29%. The notes were issued under an indenture dated as of February 5, 2018. The indentures contain certain restrictions, including a limitation that restricts our ability and the ability of certain of our subsidiaries to create or incur secured indebtedness, enter certain sale and leaseback transactions, and consolidate, merge or transfer all or substantially all of our assets and the assets of our subsidiaries.
Other – As of December 31, 2025, we had open standby letters of credit on our behalf of $97.5 million issued pursuant to a $224.2 million uncommitted Letter of Credit Reimbursement Agreement, and certain other credit lines. As of December 31, 2024, we had open standby letters of credit on our behalf of $38.8 million issued pursuant to a $176.1 million uncommitted Letter of Credit Reimbursement Agreement, and certain other credit lines.
As of December 31, 2025, our total debt to total capitalization ratio was 47.7%, computed as follows:
(in millions)
Short-term borrowings
$
135.1
Long-term debt
1,004.4
Total debt
$
1,139.5
Equity
$
1,249.9
Capitalization
$
2,389.4
Total indebtedness to capitalization
47.7
%
82
Note 15 – Fair Value Measurements
The following tables provide information regarding the Company’s assets and liabilities measured at fair value as of December 31, 2025, and 2024.
December 31, 2025 (in millions)
Location on Consolidated Balance Sheets
Active Markets for Identical Assets and Liabilities Level 1
Other Observable Inputs Level 2
Unobservable Inputs Level 3
Total Fair Value
Liabilities
Foreign exchange contract not designated as hedging instrument1
Accrued Liabilities
$
—
$
—
$
—
$
—
Long-term debt
Long-term debt
$
—
$
440.3
$
—
$
440.3
Performance-based restricted share units
Other Liabilities
$
1.0
$
—
$
—
$
1.0
Contingent Liability
Other Liabilities
$
—
$
—
$
1.3
$
1.3
1 Notional value of $11.7 million
December 31, 2024 (in millions)
Location on Consolidated Balance Sheets
Active Markets for Identical Assets and Liabilities Level 1
Other Observable Inputs Level 2
Unobservable Inputs Level 3
Total Fair Value
Assets
Foreign exchange contract not designated as hedging instrument
Accounts Receivable
$
—
$
0.1
$
—
$
0.1
Liabilities
Foreign exchange contract not designated as hedging instrument1
Accrued Liabilities
$
—
$
3.1
$
—
$
3.1
Long-term debt
Long-term debt
$
—
$
430.1
$
—
$
430.1
Performance-based restricted share units
Other Liabilities
$
1.6
$
—
$
—
$
1.6
Contingent Liability
Other Liabilities
$
—
$
—
$
1.5
$
1.5
1 Notional value of $65.0 million
Note 16 – Restructuring
Overview
2025 Restructuring - In 2025, we initiated restructuring actions as follows:
•We recorded $12.1 million of restructuring expense in the SAT segment, predominantly related to severance charges, associated with the integration of the DLR and OpSec businesses. Certain remaining actions, including completion of facility‑related exit activities are expected to continue into 2026. Total program costs are expected to be in the range of $15 million to $17 million.
•We recorded $4.7 million of restructuring expense in the CPI segment, predominantly related to severance charges. We continue to evaluate and align CPI’s cost structure with existing economic conditions which could result in additional actions in 2026.
2024 Restructuring - In the first and fourth quarters of 2024, in response to challenging industry conditions, we initiated workforce reductions in CPI, incurring $10.1 million of cumulative severance charges, net through December 31, 2025. We do not expect to incur significant additional costs to complete these actions. We have substantially completed the restructuring program in 2025.
2022 Restructuring - In the fourth quarter of 2022, in response to economic uncertainty, we initiated workforce reductions in CPI, incurring $0.5 million of severance charges and other costs for the year ended December 31, 2023. The program was completed in 2025.
83
Restructuring Charges
We recorded restructuring charges which are reflected in the Consolidated and Combined Statements of Operations, as follows:
(in millions) For the year ended December 31,
2025
2024
2023
Crane Payment Innovations
$
4.7
$
10.1
$
0.5
Security and Authentication Technologies
12.1
—
—
Total restructuring charges
$
16.8
$
10.1
$
0.5
The following table summarizes our restructuring charges by program, cost type and segment for the years ended December 31, 2025, 2024 and 2023:
For the years ended December 31,
2025
2024
2023
(in millions)
Severance
Other
Total
Severance
Other
Total
Severance
Other
Total
Crane Payment Innovations
$
4.4
$
0.3
$
4.7
$
—
$
—
$
—
$
—
$
—
$
—
Security and Authentication Technologies
10.4
1.7
12.1
—
—
—
—
—
—
2025 Restructuring
14.8
2.0
16.8
—
—
—
—
—
—
Crane Payment Innovations
$
—
$
—
$
—
$
10.1
$
—
$
10.1
$
—
$
—
$
—
2024 Restructuring
—
—
—
10.1
—
10.1
—
—
—
Crane Payment Innovations
$
—
$
—
$
—
$
—
$
—
$
—
$
0.1
$
0.4
$
0.5
2022 Restructuring
—
—
—
—
—
—
0.1
0.4
0.5
Total
$
14.8
$
2.0
$
16.8
$
10.1
$
—
$
10.1
$
0.1
$
0.4
$
0.5
The following table summarizes the cumulative restructuring charges incurred through December 31, 2025.
Cumulative Restructuring Charges
(in millions)
Severance
Other
Total
Crane Payment Innovations
$
4.4
$
0.3
$
4.7
Security and Authentication Technologies
10.4
1.7
12.1
2025 Restructuring
$
14.8
$
2.0
$
16.8
Crane Payment Innovations
$
10.1
$
—
$
10.1
2024 Restructuring
$
10.1
$
—
$
10.1
Crane Payment Innovations
$
5.8
$
0.9
$
6.7
2022 Restructuring
$
5.8
$
0.9
$
6.7
84
Restructuring Liability
The following table summarizes the accrual balances related to these restructuring charges by program:
(in millions)
2025 Restructuring
2024 Restructuring
2022 Restructuring
Total
Severance:
Balance as of December 31, 2023 (a)
$
—
$
—
$
0.6
$
0.6
Expense (b)
—
10.1
—
10.1
Utilization
—
(2.9)
(0.4)
(3.3)
Balance as of December 31, 2024 (a)
$
—
$
7.2
$
0.2
$
7.4
Expense (b)
14.8
—
—
14.8
Utilization
(7.6)
(6.4)
(0.2)
(14.2)
Balance as of December 31, 2025 (a)
$
7.2
$
0.8
$
—
$
8.0
(a)
Included within Accrued Liabilities in the Consolidated Balance Sheets.
(b)
Included within “Restructuring charges” in the Consolidated and Combined Statements of Operations.
85
Item 9. Changes in and Disagreements with Accountants on Accounting and Financial Disclosure
None
Item 9A. Controls and Procedures
DLR Acquisition. The Company completed the acquisition of De La Rue Authentication Solutions (“DLR”) on May 1, 2025. The Company has not yet fully incorporated DLR’s internal controls and procedures into the Company’s internal control over financial reporting and will be completed within the time provided by the applicable rules and regulations of the SEC for a recently acquired business. As such, management excluded DLR from its assessment of the effectiveness of the Company’s internal control over financial reporting as of December 31, 2025. DLR constituted approximately 4% of the Company’s total assets, excluding the preliminary value of goodwill and purchased intangible assets, and approximately 5% of the Company’s total net sales as of and for the year ended December 31, 2025.
Evaluation of Disclosure Controls and Procedures. The Company’s Chief Executive Officer and Chief Financial Officer evaluated the effectiveness of the design and operation of the Company’s disclosure controls and procedures as of the end of the year covered by this annual report. The Company’s disclosure controls and procedures are designed to ensure that information required to be disclosed by the Company in the reports that are filed or submitted under the Securities Exchange Act of 1934 is recorded, processed, summarized, and reported within the time periods specified in the SEC rules and forms and the information is accumulated and communicated to the Company’s Chief Executive Officer and Chief Financial Officer to allow timely decisions regarding required disclosure. Based on this evaluation, the Company’s Chief Executive Officer and Chief Financial Officer have concluded that these controls are effective as of the end of the year covered by this annual report.
Change in Internal Controls over Financial Reporting. During the fourth quarter ended December 31, 2025, there have been no changes in the Company’s internal control over financial reporting, identified in connection with our evaluation thereof, that have materially affected, or are reasonably likely to materially affect, its internal control over financial reporting.
Design and Evaluation of Internal Control over Financial Reporting. Pursuant to Section 404 of the Sarbanes-Oxley Act of 2002, we included a report of our management’s assessment of the design and effectiveness of our internal controls as part of this Annual Report on Form 10-K for the year ended December 31, 2025. Our independent registered public accounting firm also attested to, and reported on, our management’s assessment of the effectiveness of internal control over financial reporting. Our management’s report and our independent registered public accounting firm’s attestation report are set forth in Item 8 of this Annual Report on Form 10-K under the captions entitled “Management’s Responsibility for Financial Reporting” and “Report of Independent Registered Public Accounting Firm.”
86
REPORT OF INDEPENDENT REGISTERED PUBLIC ACCOUNTING FIRM
To the Shareholders and the Board of Directors of Crane NXT, Co.
Opinion on Internal Control over Financial Reporting
We have audited the internal control over financial reporting of Crane NXT, Co. and subsidiaries (the “Company”) as of December 31, 2025, based on criteria established in Internal Control — Integrated Framework (2013) issued by the Committee of Sponsoring Organizations of the Treadway Commission (COSO). In our opinion, the Company maintained, in all material respects, effective internal control over financial reporting as of December 31, 2025, based on criteria established in Internal Control — Integrated Framework (2013) issued by COSO.
We have also audited, in accordance with the standards of the Public Company Accounting Oversight Board (United States) (PCAOB), the consolidated and combined financial statements as of and for the year ended December 31, 2025, of the Company and our report dated February 26, 2026, expressed an unqualified opinion on those consolidated and combined financial statements.
As described in “Management’s Responsibility for Financial Reporting,” management excluded from its assessment the internal control over financial reporting at De La Rue Authentication, which was acquired on May 1, 2025, and whose financial statements constitute approximately 4% of the Company’s total assets, excluding the preliminary value of goodwill and purchased intangible assets and approximately 5% of the Company’s total net sales as of and for the year ended December 31, 2025. Accordingly, our audit did not include the internal control over financial reporting at De La Rue Authentication.
Basis for Opinion
The Company’s management is responsible for maintaining effective internal control over financial reporting and for its assessment of the effectiveness of internal control over financial reporting, included in the accompanying “Management’s Responsibility for Financial Reporting.” Our responsibility is to express an opinion on the Company’s internal control over financial reporting based on our audit. We are a public accounting firm registered with the PCAOB and are required to be independent with respect to the Company in accordance with the U.S. federal securities laws and the applicable rules and regulations of the Securities and Exchange Commission and the PCAOB.
We conducted our audit in accordance with the standards of the PCAOB. Those standards require that we plan and perform the audit to obtain reasonable assurance about whether effective internal control over financial reporting was maintained in all material respects. Our audit included obtaining an understanding of internal control over financial reporting, assessing the risk that a material weakness exists, testing and evaluating the design and operating effectiveness of internal control based on the assessed risk, and performing such other procedures as we considered necessary in the circumstances. We believe that our audit provides a reasonable basis for our opinion.
Definition and Limitations of Internal Control over Financial Reporting
A company’s internal control over financial reporting is a process designed to provide reasonable assurance regarding the reliability of financial reporting and the preparation of financial statements for external purposes in accordance with generally accepted accounting principles. A company’s internal control over financial reporting includes those policies and procedures that (1) pertain to the maintenance of records that, in reasonable detail, accurately and fairly reflect the transactions and dispositions of the assets of the company; (2) provide reasonable assurance that transactions are recorded as necessary to permit preparation of financial statements in accordance with generally accepted accounting principles, and that receipts and expenditures of the company are being made only in accordance with authorizations of management and directors of the company; and (3) provide reasonable assurance regarding prevention or timely detection of unauthorized acquisition, use, or disposition of the company’s assets that could have a material effect on the financial statements.
Because of its inherent limitations, internal control over financial reporting may not prevent or detect misstatements. Also, projections of any evaluation of effectiveness to future periods are subject to the risk that controls may become inadequate because of changes in conditions, or that the degree of compliance with the policies or procedures may deteriorate.
/s/ Deloitte & Touche LLP
Stamford, Connecticut
February 26, 2026
87
Item 9B. Other Information
During the fiscal quarter ended December 31, 2025, none of our directors or officers (as defined in Rule 16a-1(f) under the Securities Exchange Act of 1934) adopted, modified or terminated any contract, instruction or written plan for the purchase or sale of Company securities that was intended to satisfy the affirmative defense conditions of Rule 10b5-1(c) or any “non-Rule 10b5-1 trading arrangement.”
Item 9C. Disclosure Regarding Foreign Jurisdictions That Prevent Inspections
Not Applicable.
Part III
Item 10. Directors, Executive Officers and Corporate Governance
The information required by Item 10 is incorporated by reference to the definitive proxy statement with respect to the 2026 Annual Meeting of Shareholders which the Company expects to file with the Commission pursuant to Regulation 14A on or about April 7, 2026 except that such information with respect to Executive Officers of the Registrant is included, pursuant to Instruction 3, paragraph (b) of Item 401 of Regulation S-K, under Part I. The Company’s Corporate Governance Guidelines, the charters of its Management Organization and Compensation Committee, its Nominating and Governance Committee and its Audit Committee and its Code of Ethics are available at www.cranenxt.com/governance. Amendments to our Code of Ethics and any grant of a waiver from a provision of our Code of Ethics requiring disclosure under applicable Commission rules will be disclosed on our website at www.cranenxt.com/governance. The information on our website is not part of this report.
The information required by this item regarding our Insider Trading Policy is incorporated by reference into this Report as an exhibit.
Item 11. Executive Compensation
The information required by Item 11 is incorporated by reference to the definitive proxy statement with respect to the 2026 Annual Meeting of Shareholders which the Company expects to file with the Commission pursuant to Regulation 14A on or about April 7, 2026.
Item 12. Security Ownership of Certain Beneficial Owners and Management and Related Stockholder Matters
Except the information required by Section 201(d) of Regulation S-K which is set forth below, the information required by Item 12 is incorporated by reference to the definitive proxy statement with respect to the 2026 Annual Meeting of Shareholders which the Company expects to file with the Commission pursuant to Regulation 14A on or about April 7, 2026.
As of December 31, 2025:
Number of securities to be issued upon exercise of outstanding options, warrants and rights
Weighted average exercise price of outstanding options
Number of securities remaining available for future issuance under equity compensation plans
(a)
(b)
(c)
Equity compensation plans approved by security holders:
2018 Stock Incentive Plan (and predecessor plans)
564,420
a
$
29.96
—
2018 Amended and Restated Stock Incentive Plan
1,316,148
a
$
48.69
9,133,680
Equity compensation plans not approved by security holders
—
$
—
—
Total
1,880,568
$
39.53
9,133,680
aIncludes 341,729 restricted share units (“RSUs”), 189,315 deferred stock units (“DSUs”) and 381,576 performance-based restricted share units (“PRSUs”), assuming the maximum potential payout percentage. Actual numbers of shares may vary, depending on actual performance. If the PRSUs included in this total vest at the target performance level as opposed to the maximum level, the aggregate awards outstanding would be 1,689,780. Column (b) does not take RSUs, PRSUs or DSUs into account because they do not have an exercise price.
88
Item 13. Certain Relationships and Related Transactions, and Director Independence
The information required by Item 13 is incorporated by reference to the definitive proxy statement with respect to the 2026 Annual Meeting of Shareholders which the Company expects to file with the Commission pursuant to Regulation 14A on or about April 7, 2026.
Item 14. Principal Accountant Fees and Services
The information required by Item 14 is incorporated by reference to the definitive proxy statement with respect to the 2026 Annual Meeting of Shareholders which the Company expects to file with the Commission pursuant to Regulation 14A on or about April 7, 2026.
Part IV
Item 15. Exhibits and Financial Statement Schedules
(a) Consolidated and Combined Financial Statements:
Page
Number
Report of Independent Registered Public Accounting Firm (PCAOB ID No. 34)
Financial statement schedules are omitted because they are not applicable, not required, not material or because the required information is included in the Consolidated and Combined Financial Statements of the Company or the Notes thereto.
Pursuant to the requirements of Section 13 or 15 (d) of the Securities Exchange Act of 1934, the registrant has duly caused this report to be signed on its behalf by the undersigned, thereunto duly authorized.
CRANE NXT, CO. (Registrant)
By /s/ AARON W. SAAK
Aaron W. Saak
President and Chief Executive Officer
Date 2/26/2026
Pursuant to the requirements of the Securities Exchange Act of 1934, this report has been signed below by the following persons on behalf of the registrant and in the capacities and on the dates indicated.
Officers
/s/ AARON W. SAAK
/s/ CHRISTINA CRISTIANO
/s/ BIANCA SHARDELOW
Aaron W. Saak President, Chief Executive Officer and Director (Principal Executive Officer)