Dana Incorporated Reports Solid 2025 Third-quarter Financial Results;
Raises 2025 Full-year Profit Guidance
Highlights
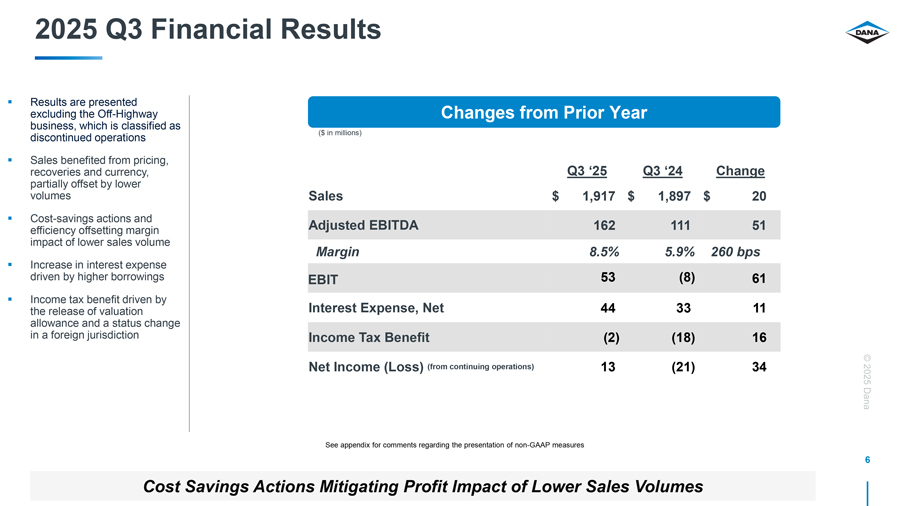
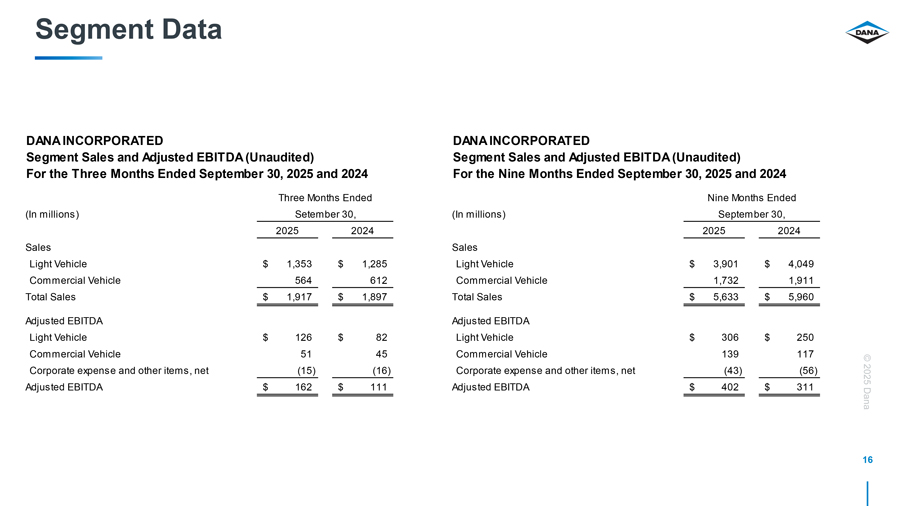
| • |   Sales of $1.9 billion from continuing operations  | 
| • |   Net income was $13 million from continuing operations, a $34 million increase compared to last year  | 
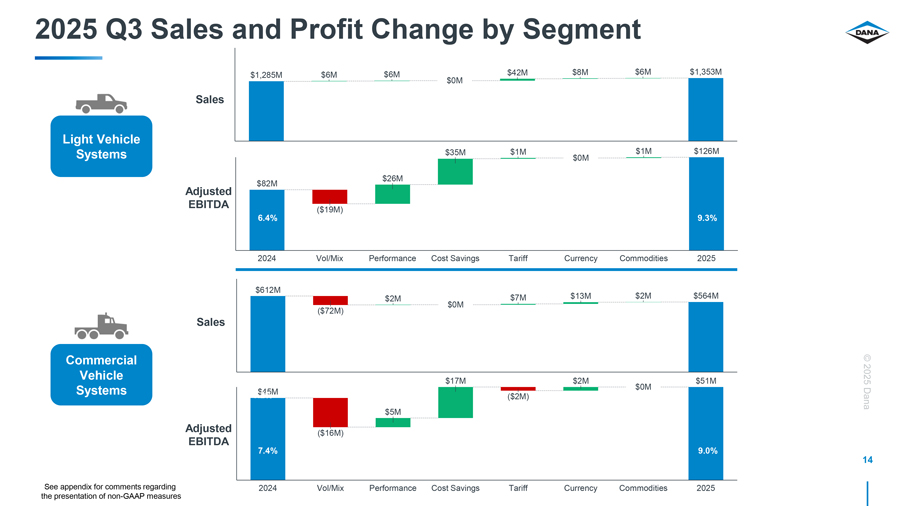
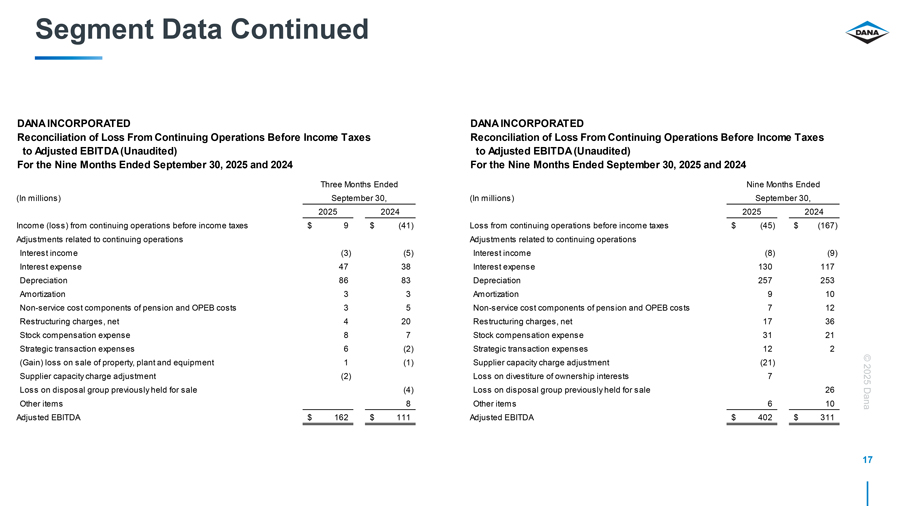
| • |   Adjusted EBITDA of $162 million from continuing operations; 8.5 percent margin, an increase of 260 basis points compared to prior year  | 
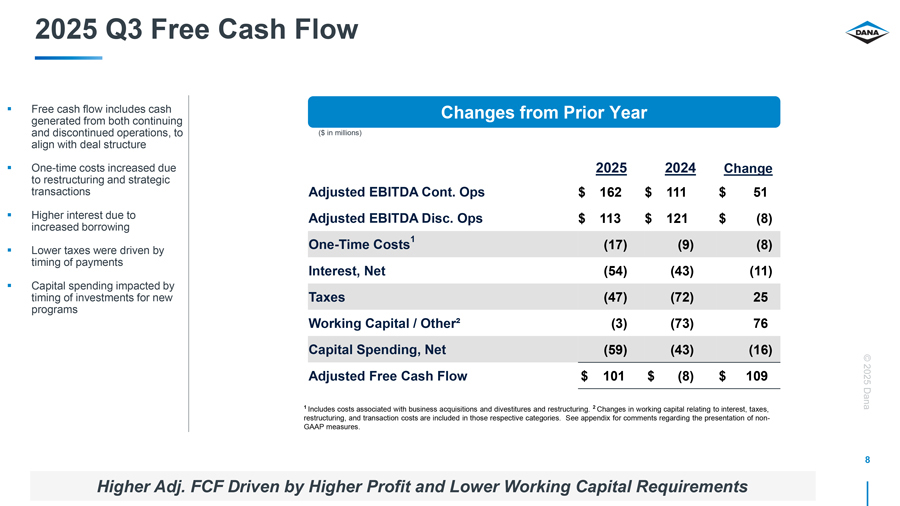
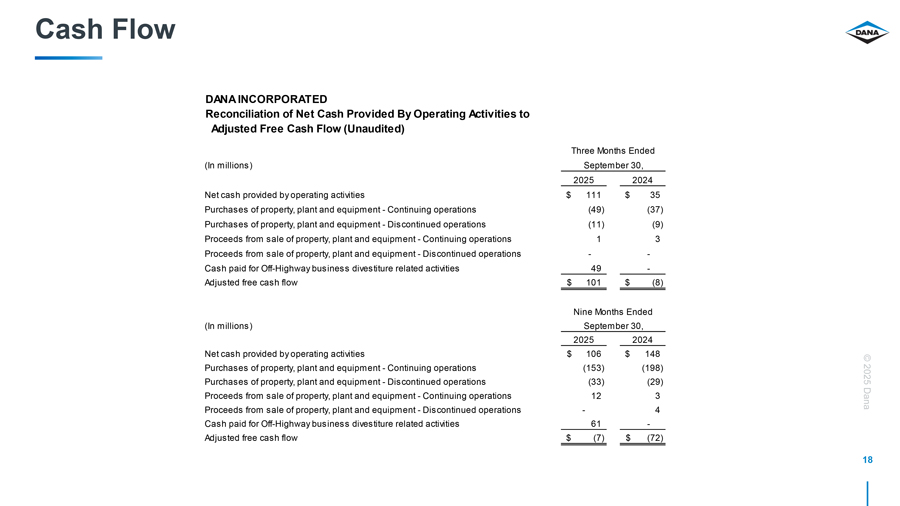
| • |   Operating cash flow* was $111 million, a $76 million increase compared to last year  | 
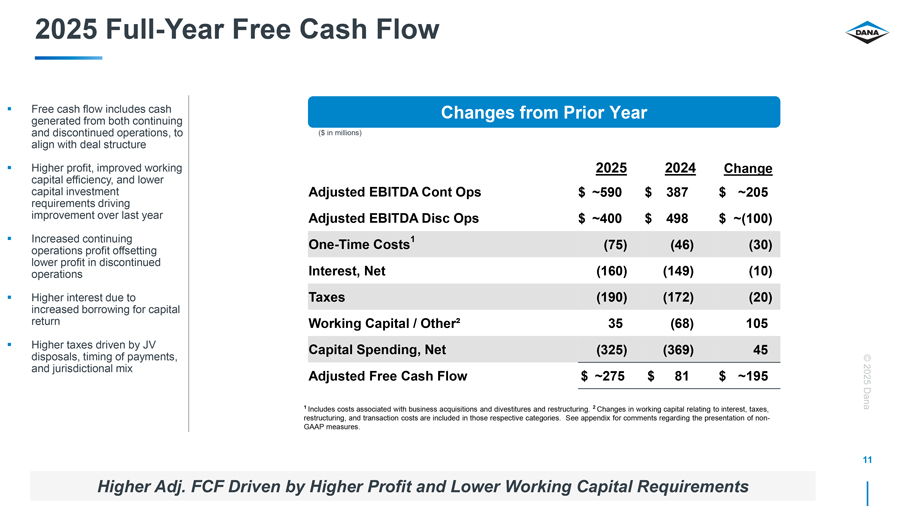
| • |   Adjusted free cash flow* was $101 million, a $109 million increase compared to the prior year  | 
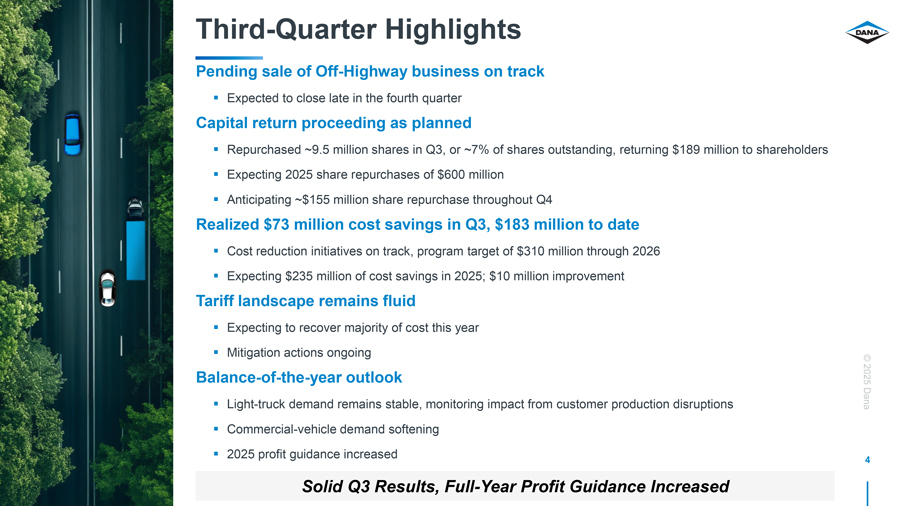
| • |   Sale of Off-Highway business remains on-track for closing in late Q4 2025  | 
| • |   Repurchased 9.5 million shares in Q3, 24.1 million to date  | 
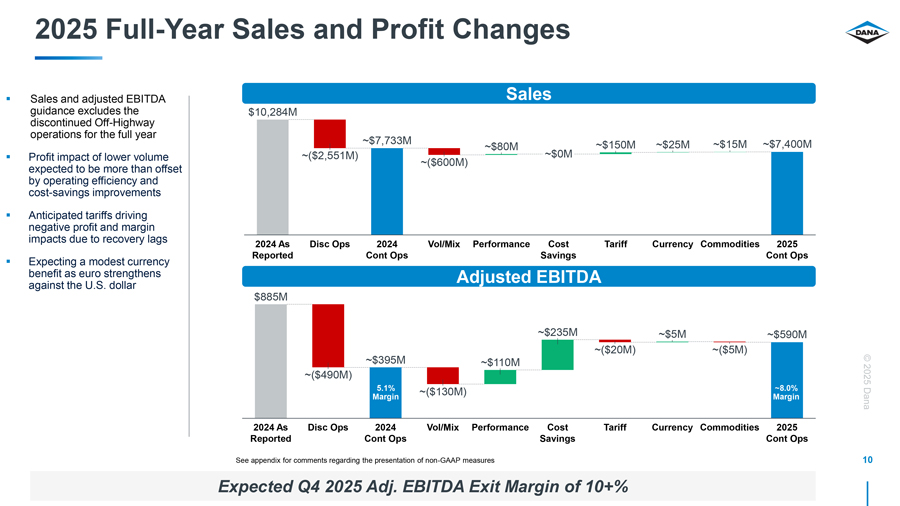
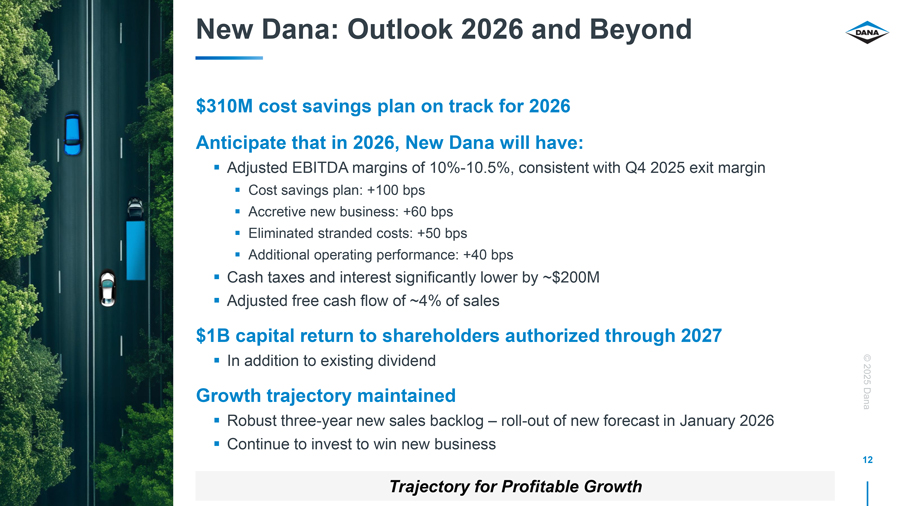
| • |   Realized $73 million in cost savings in Q3, $183 million to date; expecting $235 million in 2025  | 
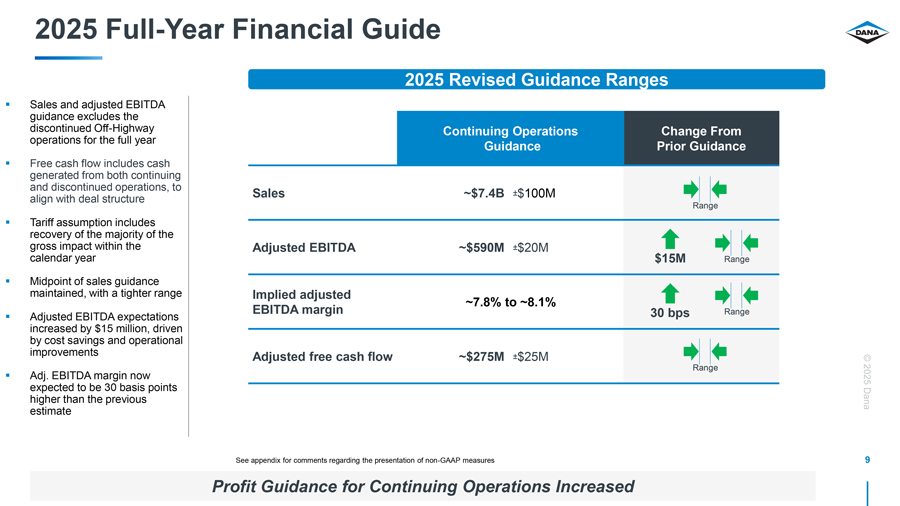
| • |   Raised full-year profit guidance due to accelerated cost savings  | 
| * |   Cash flow includes cash from both continuing and discontinued operations to align with deal structure  | 
MAUMEE, Ohio, October 29, 2025 – Dana Incorporated (NYSE: DAN) today announced financial results for the third quarter of 2025 reflecting the Off-Highway business as a discontinued operation for all periods.
“Our business is performing very well, and we are experiencing minimal impact from market fluctuations and customer production disruptions,” said R. Bruce McDonald, Dana chairman and chief executive officer. “Our $310 million cost-savings initiative is on track, with over $70 million in savings in the third quarter we are exceeding our expectations. We now expect our fourth-quarter adjusted EBITDA margin to be consistent with our forecasted 2026 margin of 10-10.5 percent. We expect to complete the Off-Highway divestiture in the fourth quarter of this year. The benefits of this transaction are already being realized as we execute our $1 billion capital return program, including $189 million in share repurchases during the quarter. We expect to repurchase an additional $155 million in the fourth quarter, bringing the total to $600 million for the year.”
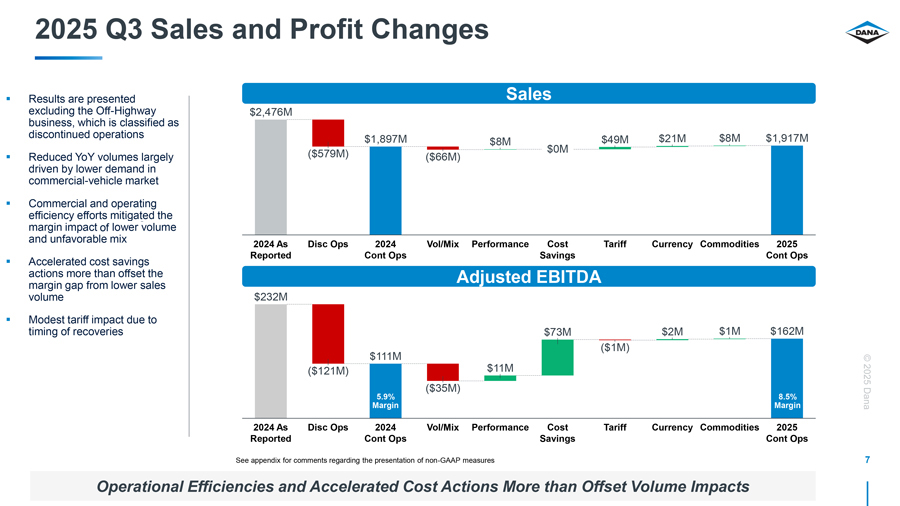
Sales for continuing operations in the third quarter of 2025 totaled $1.92 billion, compared with $1.90 billion in the same period of 2024.
Net income from continuing operations was $13 million compared with a net loss of $21 million in the third quarter of 2024.
Adjusted EBITDA for the third quarter of 2025 was $162 million or 8.5 percent of sales, compared with $111 million or 5.9 percent of sales for the same period in 2024. The company’s cost-savings program has mitigated the margin impact of lower volumes and cost inflation.
Operating cash flow in the third quarter of 2025 was $111 million, compared with $35 million in the same period of 2024. Adjusted free cash flow was $101 million, compared with a use of $8 million in the third quarter of 2024. The improvement was driven by higher profit, lower taxes and working capital requirements.
“The continued execution of our cost-saving plan and operating efficiency improvements are driving our higher profit expectations for this year,” said Timothy Kraus, Dana’s senior vice president and chief financial officer. “Additionally, the tariff recovery mechanisms we have in place are functioning well and we expect to recover the majority of these costs within the year.”
1
2025 Financial Targets for Continuing Operations
Results for the Off-Highway business are reported as discontinued operations. The sales and adjusted EBITDA guidance targets below are for continuing operations for the full year 2025. The cash flow guidance targets below include cash flows from both continuing and discontinued operations to align with the deal structure.
| Guidance | ||
|   Sales  | 
$7.3 to $7.5 billion | |
|   Adjusted EBITDA  | 
$570 to $610 million | |
|   Implied adjusted EBITDA margin  | 
7.8% to 8.1% | |
|   Operating cash flow  | 
$390 to $440 million | |
|   Adjusted free cash flow  | 
$250 to $300 million | 
Dana to Host Conference Call at 9 a.m. Wednesday, October 29
Dana will discuss its third-quarter results in a conference call at 9 a.m. EDT on Wednesday, October 29. The conference call can be accessed by telephone from both domestic and international locations using the information provided below:
Conference ID: 9943139
Participant Toll-Free Dial-In Number: 1 (888) 440-5873
Participant Toll Dial-In Number: 1 (646) 960-0319
Audio streaming and slides will be available online via a link provided on the Dana investor website: www.dana.com/investors. Phone registration will be available beginning at 8:30 a.m. EDT.
A webcast replay can be accessed via Dana’s investor website following the call.
Non-GAAP Financial Information
Adjusted EBITDA is a non-GAAP financial measure which we have defined as net income (loss) before interest, income taxes, depreciation, amortization, equity grant expense, restructuring expense, non-service cost components of pension and other postretirement benefit costs and other adjustments not related to our core operations (gain/loss on debt extinguishment, pension settlements, divestitures, impairment, etc.). Adjusted EBITDA is a measure of our ability to maintain and continue to invest in our operations and provide shareholder returns. We use adjusted EBITDA in assessing the effectiveness of our business strategies, evaluating and pricing potential acquisitions and as a factor in making incentive compensation decisions. In addition to its use by management, we also believe adjusted EBITDA is a measure widely used by securities analysts, investors and others to evaluate financial performance of our company relative to other Tier 1 automotive suppliers. Adjusted EBITDA should not be considered a substitute for earnings (loss) before income taxes, net income (loss) or other results reported in accordance with GAAP. Adjusted EBITDA may not be comparable to similarly titled measures reported by other companies.
Adjusted free cash flow is a non-GAAP financial measure which we have defined as net cash provided by (used in) operating activities less purchases of property, plant and equipment plus proceeds from sale of property, plant and equipment plus cash paid for Off-Highway business divestiture related activities. We believe adjusted free cash flow is useful to investors in evaluating the operational cash flow of the company inclusive of the spending required to maintain the operations. Adjusted free cash flow is not intended to represent nor be an alternative to the measure of net cash provided by (used in) operating activities reported in accordance with GAAP.
2
Adjusted free cash flow may not be comparable to similarly titled measures reported by other companies.
The accompanying financial information provides reconciliations of adjusted EBITDA and adjusted free cash flow to the most directly comparable financial measures calculated and presented in accordance with GAAP. We have not provided a reconciliation of our adjusted EBITDA outlook to the most comparable GAAP measures of net income (loss). Providing net income (loss) guidance is potentially misleading and not practical given the difficulty of projecting event driven transactional and other non-core operating items that are included in net income (loss), including restructuring actions, asset impairments and certain income tax adjustments. The accompanying reconciliations of these non-GAAP measures with the most comparable GAAP measures for the historical periods presented are indicative of the reconciliations that will be prepared upon completion of the periods covered by the non-GAAP guidance.
Forward-Looking Statements
Certain statements and projections contained in this news release are, by their nature, forward-looking within the meaning of the Private Securities Litigation Reform Act of 1995. These forward-looking statements are based on our current expectations, estimates, and projections about our industry and business, management’s beliefs, and certain assumptions made by us, all of which are subject to change. Forward-looking statements can often be identified by words such as “anticipates,” “expects,” “intends,” “plans,” “predicts,” “believes,” “seeks,” “estimates,” “may,” “will,” “should,” “would,” “could,” “potential,” “continue,” “ongoing,” and similar expressions, and variations or negatives of these words. These forward-looking statements are not guarantees of future results and are subject to risks, uncertainties, and assumptions that could cause our actual results to differ materially and adversely from those expressed in any forward-looking statement.
Dana’s Annual Report on Form 10-K, subsequent Quarterly Reports on Form 10-Q, recent Current Reports on Form 8-K, and other Securities and Exchange Commission filings discuss important risk factors that could affect our business, results of operations and financial condition. The forward-looking statements in this news release speak only as of this date. Dana does not undertake any obligation to revise or update publicly any forward-looking statement for any reason.
About Dana Incorporated
Dana is a leader in the design and manufacture of highly efficient propulsion and energy-management solutions that power vehicles and machines in all mobility markets across the globe. The company is shaping sustainable progress through its conventional and clean-energy solutions that support nearly every vehicle manufacturer with drive and motion systems; electrodynamic technologies, including software and controls; and thermal, sealing, and digital solutions.
Based in Maumee, Ohio, USA, the company reported sales of $7.7 billion in 2024 with 28,000 people in 26 countries across six continents. With a history dating to 1904, Dana was named among the “World’s Most Ethical Companies” for 2025 by Ethisphere and as one of “America’s Most Responsible Companies 2025” by Newsweek. The company is driven by a high-performance culture that focuses on valuing others, inspiring innovation, growing responsibly, and winning together, earning it global recognition as a top employer. Learn more at dana.com.
###
Contact: Craig Barber
+1-419-887-5166
craig.barber@dana.com
3
DANA INCORPORATED
Quarterly Financial Information and Reconciliations of Non-GAAP Financial Measures
Non-GAAP Financial Measures
Adjusted EBITDA is a non-GAAP financial measure which we have defined as net income (loss) before interest, income taxes, depreciation, amortization, equity grant expense, restructuring expense, non-service cost components of pension and other postretirement benefit costs and other adjustments not related to our core operations (gain/loss on debt extinguishment, pension settlements, divestitures, impairment, etc.). Adjusted EBITDA is a measure of our ability to maintain and continue to invest in our operations and provide shareholder returns. We use adjusted EBITDA in assessing the effectiveness of our business strategies, evaluating and pricing potential acquisitions and as a factor in making incentive compensation decisions. In addition to its use by management, we also believe adjusted EBITDA is a measure widely used by securities analysts, investors and others to evaluate financial performance of our company relative to other Tier 1 automotive suppliers. Adjusted EBITDA should not be considered a substitute for earnings (loss) before income taxes, net income (loss) or other results reported in accordance with GAAP. Adjusted EBITDA may not be comparable to similarly titled measures reported by other companies.
Adjusted free cash flow is a non-GAAP financial measure which we have defined as net cash provided by (used in) operating activities less purchases of property, plant and equipment plus proceeds from sale of property, plant and equipment plus cash paid for Off-Highway business divestiture related activities. We believe adjusted free cash flow is useful to investors in evaluating the operational cash flow of the company inclusive of the spending required to maintain the operations. Adjusted free cash flow is not intended to represent nor be an alternative to the measure of net cash provided by (used in) operating activities reported in accordance with GAAP. Adjusted free cash flow may not be comparable to similarly titled measures reported by other companies.
The accompanying financial information provides reconciliations of adjusted EBITDA and adjusted free cash flow to the most directly comparable financial measures calculated and presented in accordance with GAAP. We have not provided a reconciliation of our adjusted EBITDA outlook to the most comparable GAAP measures of net income (loss). Providing net income (loss) guidance is potentially misleading and not practical given the difficulty of projecting event driven transactional and other non-core operating items that are included in net income (loss), including restructuring actions, asset impairments and certain income tax adjustments. The accompanying reconciliations of these non-GAAP measures with the most comparable GAAP measures for the historical periods presented are indicative of the reconciliations that will be prepared upon completion of the periods covered by the non-GAAP guidance.
Page 1
DANA INCORPORATED
Consolidated Statement of Operations (Unaudited)
For the Three Months Ended September 30, 2025 and 2024
| Three Months Ended | ||||||||
| (In millions, except per share amounts) | September 30, | |||||||
| 2025 | 2024 | |||||||
|   Net sales  | 
$ | 1,917 | $ | 1,897 | ||||
|   Costs and expenses  | 
||||||||
|   Cost of sales  | 
1,751 | 1,775 | ||||||
|   Selling, general and administrative expenses  | 
87 | 106 | ||||||
|   Amortization of intangibles  | 
2 | 2 | ||||||
|   Restructuring charges, net  | 
4 | 20 | ||||||
|   Loss on disposal group previously held for sale  | 
4 | |||||||
|   Other income (expense), net  | 
(20 | ) | (6 | ) | ||||
|   
  | 
  
  | 
  
  | 
  
  | 
|||||
|   Earnings (loss) from continuing operations before interest and income taxes  | 
53 | (8 | ) | |||||
|   Interest income  | 
3 | 5 | ||||||
|   Interest expense  | 
47 | 38 | ||||||
|   
  | 
  
  | 
  
  | 
  
  | 
|||||
|   Income (loss) from continuing operations before income taxes  | 
9 | (41 | ) | |||||
|   Income tax benefit  | 
(2 | ) | (18 | ) | ||||
|   Equity in earnings of affiliates  | 
2 | 2 | ||||||
|   
  | 
  
  | 
  
  | 
  
  | 
|||||
|   Net income (loss) from continuing operations  | 
13 | (21 | ) | |||||
|   Net income from discontinued operations  | 
74 | 32 | ||||||
|   
  | 
  
  | 
  
  | 
  
  | 
|||||
|   Net income  | 
87 | 11 | ||||||
|   Less: Noncontrolling interests net income from continuing operations  | 
4 | 7 | ||||||
|   
  | 
  
  | 
  
  | 
  
  | 
|||||
|   Net income attributable to the parent company  | 
$ | 83 | $ | 4 | ||||
|   
  | 
  
  | 
  
  | 
  
  | 
|||||
|   Net income per share available to common stockholders  | 
||||||||
|   Basic earnings (loss) per share from continuing operations  | 
$ | 0.07 | $ | (0.19 | ) | |||
|   Basic earnings per share from discontinued operations  | 
0.58 | 0.22 | ||||||
|   
  | 
  
  | 
  
  | 
  
  | 
|||||
|   Basic earnings per share  | 
$ | 0.65 | $ | 0.03 | ||||
|   
  | 
  
  | 
  
  | 
  
  | 
|||||
|   Diluted earnings (loss) per share from continuing operations  | 
$ | 0.07 | $ | (0.19 | ) | |||
|   Diluted earnings per share from discontinued operations  | 
0.57 | 0.22 | ||||||
|   
  | 
  
  | 
  
  | 
  
  | 
|||||
|   Diluted earnings per share  | 
$ | 0.64 | $ | 0.03 | ||||
|   
  | 
  
  | 
  
  | 
  
  | 
|||||
|   Weighted-average shares outstanding - Basic  | 
128.4 | 145.0 | ||||||
|   Weighted-average shares outstanding - Diluted  | 
130.8 | 145.0 | ||||||
Page 2
DANA INCORPORATED
Consolidated Statement of Operations (Unaudited)
For the Nine Months Ended September 30, 2025 and 2024
| Nine Months Ended | ||||||||
| (In millions, except per share amounts) | September 30, | |||||||
| 2025 | 2024 | |||||||
|   Net sales  | 
$ | 5,633 | $ | 5,960 | ||||
|   Costs and expenses  | 
||||||||
|   Cost of sales  | 
5,211 | 5,609 | ||||||
|   Selling, general and administrative expenses  | 
291 | 328 | ||||||
|   Amortization of intangibles  | 
6 | 6 | ||||||
|   Restructuring charges, net  | 
17 | 36 | ||||||
|   Loss on disposal group previously held for sale  | 
(26 | ) | ||||||
|   Other income (expense), net  | 
(31 | ) | (14 | ) | ||||
|   
  | 
  
  | 
  
  | 
  
  | 
|||||
|   Earnings (loss) from continuing operations before interest and income taxes  | 
77 | (59 | ) | |||||
|   Interest income  | 
8 | 9 | ||||||
|   Interest expense  | 
130 | 117 | ||||||
|   
  | 
  
  | 
  
  | 
  
  | 
|||||
|   Loss from continuing operations before income taxes  | 
(45 | ) | (167 | ) | ||||
|   Income tax benefit  | 
(2 | ) | (13 | ) | ||||
|   Equity in earnings of affiliates  | 
27 | 7 | ||||||
|   
  | 
  
  | 
  
  | 
  
  | 
|||||
|   Net loss from continuing operations  | 
(16 | ) | (147 | ) | ||||
|   Net income from discontinued operations  | 
164 | 174 | ||||||
|   
  | 
  
  | 
  
  | 
  
  | 
|||||
|   Net income  | 
148 | 27 | ||||||
|   Less: Noncontrolling interests net income from continuing operations  | 
13 | 17 | ||||||
|   Less: Redeemable noncontrolling interests net loss from continuing operations  | 
— | (13 | ) | |||||
|   
  | 
  
  | 
  
  | 
  
  | 
|||||
|   Net income attributable to the parent company  | 
$ | 135 | $ | 23 | ||||
|   
  | 
  
  | 
  
  | 
  
  | 
|||||
|   Net income per share available to common stockholders  | 
||||||||
|   Basic loss per share from continuing operations  | 
$ | (0.21 | ) | $ | (1.04 | ) | ||
|   Basic earnings per share from discontinued operations  | 
1.18 | 1.20 | ||||||
|   
  | 
  
  | 
  
  | 
  
  | 
|||||
|   Basic earnings per share  | 
$ | 0.97 | $ | 0.16 | ||||
|   
  | 
  
  | 
  
  | 
  
  | 
|||||
|   Diluted loss per share from continuing operations  | 
$ | (0.21 | ) | $ | (1.04 | ) | ||
|   Diluted earnings per share from discontinued operations  | 
1.18 | 1.20 | ||||||
|   
  | 
  
  | 
  
  | 
  
  | 
|||||
|   Diluted earnings per share  | 
$ | 0.97 | $ | 0.16 | ||||
|   
  | 
  
  | 
  
  | 
  
  | 
|||||
|   Weighted-average shares outstanding - Basic  | 
139.2 | 144.9 | ||||||
|   Weighted-average shares outstanding - Diluted  | 
139.2 | 144.9 | ||||||
Page 3
DANA INCORPORATED
Consolidated Statement of Comprehensive Income (Unaudited)
For the Three Months Ended September 30, 2025 and 2024
| Three Months Ended | ||||||||
| (In millions) | September 30, | |||||||
| 2025 | 2024 | |||||||
|   Net income (loss) from continuing operations  | 
$ | 13 | $ | (21 | ) | |||
|   Other comprehensive income (loss) from continuing operations, net of tax:  | 
||||||||
|   Currency translation adjustments  | 
2 | 16 | ||||||
|   Hedging gains and losses  | 
6 | (6 | ) | |||||
|   Defined benefit plans  | 
1 | 1 | ||||||
|   
  | 
  
  | 
  
  | 
  
  | 
|||||
|   Other comprehensive income from continuing operations  | 
9 | 11 | ||||||
|   
  | 
  
  | 
  
  | 
  
  | 
|||||
|   Total comprehensive income (loss) from continuing operations  | 
22 | (10 | ) | |||||
|   
  | 
  
  | 
  
  | 
  
  | 
|||||
|   Net income from discontinued operations  | 
74 | 32 | ||||||
|   Other comprehensive income (loss) from discontinued operations, net of tax:  | 
||||||||
|   Currency translation adjustments  | 
(10 | ) | (2 | ) | ||||
|   Hedging gains and losses  | 
(1 | ) | ||||||
|   
  | 
  
  | 
  
  | 
  
  | 
|||||
|   Other comprehensive loss from discontinued operations  | 
(10 | ) | (3 | ) | ||||
|   
  | 
  
  | 
  
  | 
  
  | 
|||||
|   Total comprehensive income from discontinued operations  | 
64 | 29 | ||||||
|   
  | 
  
  | 
  
  | 
  
  | 
|||||
|   Total comprehensive income  | 
86 | 19 | ||||||
|   Less: Comprehensive income from continuing operations attributable to noncontrolling interests  | 
(3 | ) | (7 | ) | ||||
|   
  | 
  
  | 
  
  | 
  
  | 
|||||
|   Comprehensive income attributable to the parent company  | 
$ | 83 | $ | 12 | ||||
|   
  | 
  
  | 
  
  | 
  
  | 
|||||
Page 4
DANA INCORPORATED
Consolidated Statement of Comprehensive Income (Unaudited)
For the Nine Months Ended September 30, 2025 and 2024
| Nine Months Ended | ||||||||
| (In millions) | September 30, | |||||||
| 2025 | 2024 | |||||||
|   Net loss from continuing operations  | 
$ | (16 | ) | $ | (147 | ) | ||
|   Other comprehensive income (loss) from continuing operations, net of tax:  | 
||||||||
|   Currency translation adjustments  | 
49 | (45 | ) | |||||
|   Hedging gains and losses  | 
47 | (34 | ) | |||||
|   Defined benefit plans  | 
1 | 6 | ||||||
|   
  | 
  
  | 
  
  | 
  
  | 
|||||
|   Other comprehensive income (loss) from continuing operations  | 
97 | (73 | ) | |||||
|   
  | 
  
  | 
  
  | 
  
  | 
|||||
|   Total comprehensive income (loss) from continuing operations  | 
81 | (220 | ) | |||||
|   
  | 
  
  | 
  
  | 
  
  | 
|||||
|   Net income from discontinued operations  | 
164 | 174 | ||||||
|   Other comprehensive income (loss) from discontinued operations, net of tax:  | 
||||||||
|   Currency translation adjustments  | 
(2 | ) | (7 | ) | ||||
|   Hedging gains and losses  | 
1 | (1 | ) | |||||
|   
  | 
  
  | 
  
  | 
  
  | 
|||||
|   Other comprehensive loss from discontinued operations  | 
(1 | ) | (8 | ) | ||||
|   
  | 
  
  | 
  
  | 
  
  | 
|||||
|   Total comprehensive income from discontinued operations  | 
163 | 166 | ||||||
|   
  | 
  
  | 
  
  | 
  
  | 
|||||
|   Total comprehensive income (loss)  | 
244 | (54 | ) | |||||
|   Less: Comprehensive income from continuing operations attributable to noncontrolling interests  | 
(14 | ) | (16 | ) | ||||
|   Less: Comprehensive loss from continuing operations attributable to redeemable noncontrolling interests  | 
— | 17 | ||||||
|   
  | 
  
  | 
  
  | 
  
  | 
|||||
|   Comprehensive income (loss) attributable to the parent company  | 
$ | 230 | $ | (53 | ) | |||
|   
  | 
  
  | 
  
  | 
  
  | 
|||||
Page 5
DANA INCORPORATED
Consolidated Balance Sheet (Unaudited)
As of September 30, 2025 and December 31, 2024
| (In millions, except share and per share amounts) | September 30, 2025  | 
December 31, 2024  | 
||||||
|   Assets  | 
||||||||
|   Current assets  | 
||||||||
|   Cash and cash equivalents  | 
$ | 414 | $ | 494 | ||||
|   Accounts receivable  | 
||||||||
|   Trade, less allowance for doubtful accounts of $16 in 2025 and $13 in 2024  | 
1,184 | 890 | ||||||
|   Other  | 
228 | 220 | ||||||
|   Inventories  | 
1,112 | 1,047 | ||||||
|   Other current assets  | 
151 | 148 | ||||||
|   Current assets of disposal group held for sale  | 
1,040 | 904 | ||||||
|   
  | 
  
  | 
  
  | 
  
  | 
|||||
|   Total current assets  | 
4,129 | 3,703 | ||||||
|   Intangibles  | 
74 | 80 | ||||||
|   Deferred tax assets  | 
541 | 514 | ||||||
|   Other noncurrent assets  | 
96 | 118 | ||||||
|   Investments in affiliates  | 
96 | 125 | ||||||
|   Operating lease assets  | 
310 | 256 | ||||||
|   Property, plant and equipment, net  | 
1,887 | 1,830 | ||||||
|   Noncurrent assets of disposal group held for sale  | 
975 | 876 | ||||||
|   
  | 
  
  | 
  
  | 
  
  | 
|||||
|   Total assets  | 
$ | 8,108 | $ | 7,502 | ||||
|   
  | 
  
  | 
  
  | 
  
  | 
|||||
|   Liabilities, redeemable noncontrolling interests and equity  | 
||||||||
|   Current liabilities  | 
||||||||
|   Short-term debt  | 
$ | 630 | $ | 8 | ||||
|   Current portion of long-term debt  | 
22 | 214 | ||||||
|   Accounts payable  | 
1,206 | 1,120 | ||||||
|   Accrued payroll and employee benefits  | 
201 | 176 | ||||||
|   Taxes on income  | 
64 | 68 | ||||||
|   Current portion of operating lease liabilities  | 
41 | 34 | ||||||
|   Other accrued liabilities  | 
301 | 314 | ||||||
|   Current liabilities of disposal group held for sale  | 
693 | 626 | ||||||
|   
  | 
  
  | 
  
  | 
  
  | 
|||||
|   Total current liabilities  | 
3,158 | 2,560 | ||||||
|   Long-term debt, less debt issuance costs of $17 in 2025 and $19 in 2024  | 
2,565 | 2,387 | ||||||
|   Noncurrent operating lease liabilities  | 
274 | 231 | ||||||
|   Pension and postretirement obligations  | 
257 | 233 | ||||||
|   Other noncurrent liabilities  | 
297 | 321 | ||||||
|   Noncurrent liabilities of disposal group held for sale  | 
219 | 185 | ||||||
|   
  | 
  
  | 
  
  | 
  
  | 
|||||
|   Total liabilities  | 
6,770 | 5,917 | ||||||
|   
  | 
  
  | 
  
  | 
  
  | 
|||||
|   Commitments and contingencies  | 
||||||||
|   Redeemable noncontrolling interests  | 
188 | 189 | ||||||
|   Parent company stockholders’ equity  | 
||||||||
|   Preferred stock, 50,000,000 shares authorized, $0.01 par value, no shares outstanding  | 
— | — | ||||||
|   Common stock, 450,000,000 shares authorized, $0.01 par value, 121,917,210 and 144,993,614 shares outstanding  | 
1 | 2 | ||||||
|   Additional paid-in capital  | 
1,863 | 2,282 | ||||||
|   Retained earnings  | 
297 | 204 | ||||||
|   Treasury stock, at cost (1,330,258 and 837,803 shares)  | 
(21 | ) | (13 | ) | ||||
|   Accumulated other comprehensive loss  | 
(1,047 | ) | (1,142 | ) | ||||
|   
  | 
  
  | 
  
  | 
  
  | 
|||||
|   Total parent company stockholders’ equity  | 
1,093 | 1,333 | ||||||
|   Noncontrolling interests  | 
57 | 63 | ||||||
|   
  | 
  
  | 
  
  | 
  
  | 
|||||
|   Total equity  | 
1,150 | 1,396 | ||||||
|   
  | 
  
  | 
  
  | 
  
  | 
|||||
|   Total liabilities, redeemable noncontrolling interests and equity  | 
$ | 8,108 | $ | 7,502 | ||||
|   
  | 
  
  | 
  
  | 
  
  | 
|||||
Page 6
DANA INCORPORATED
Consolidated Statement of Cash Flows (Unaudited)
For the Three Months Ended September 30, 2025 and 2024
| Three Months Ended | ||||||||
| (In millions) | September 30, | |||||||
| 2025 | 2024 | |||||||
|   Operating activities  | 
||||||||
|   Net income  | 
$ | 87 | $ | 11 | ||||
|   Less: Net income from discontinued operations  | 
74 | 32 | ||||||
|   
  | 
  
  | 
  
  | 
  
  | 
|||||
|   Net loss from continuing operations  | 
13 | (21 | ) | |||||
|   Depreciation  | 
86 | 83 | ||||||
|   Amortization  | 
3 | 3 | ||||||
|   Amortization of deferred financings charges  | 
1 | 1 | ||||||
|   Earnings of affiliates, net of dividends received  | 
21 | (1 | ) | |||||
|   Stock compensation expense  | 
8 | 7 | ||||||
|   Deferred income taxes  | 
(41 | ) | (13 | ) | ||||
|   Pension expense, net  | 
(1 | ) | 6 | |||||
|   Change in working capital  | 
(10 | ) | (38 | ) | ||||
|   Change in other noncurrent assets and liabilities  | 
(43 | ) | (8 | ) | ||||
|   Loss on disposal group previously held for sale  | 
(4 | ) | ||||||
|   Loss on divestiture of ownership interests  | 
(19 | ) | ||||||
|   Other, net  | 
(46 | ) | 9 | |||||
|   
  | 
  
  | 
  
  | 
  
  | 
|||||
|   Net cash provied by (used in) operating activities from continuing operations  | 
(28 | ) | 24 | |||||
|   Net cash provided by operating activities from discontinued operations  | 
139 | 11 | ||||||
|   
  | 
  
  | 
  
  | 
  
  | 
|||||
|   Net cash provided by operating activities  | 
111 | 35 | ||||||
|   
  | 
  
  | 
  
  | 
  
  | 
|||||
|   Investing activities  | 
||||||||
|   Purchases of property, plant and equipment  | 
(49 | ) | (37 | ) | ||||
|   Proceeds from sale of property, plant and equipment  | 
1 | 3 | ||||||
|   Settlements of undesignated derivatives  | 
(9 | ) | (1 | ) | ||||
|   Other, net  | 
(4 | ) | (2 | ) | ||||
|   
  | 
  
  | 
  
  | 
  
  | 
|||||
|   Net cash used in investing activities from continuing operations  | 
(61 | ) | (37 | ) | ||||
|   Net cash provided by (used) in investing activities from discontinued operations  | 
(9 | ) | 9 | |||||
|   
  | 
  
  | 
  
  | 
  
  | 
|||||
|   Net cash used in investing activities  | 
(70 | ) | (28 | ) | ||||
|   
  | 
  
  | 
  
  | 
  
  | 
|||||
|   Financing activities  | 
||||||||
|   Net change in short-term debt  | 
100 | 4 | ||||||
|   Proceeds from long-term debt  | 
1 | |||||||
|   Repayment of long-term debt  | 
(6 | ) | (5 | ) | ||||
|   Dividends paid to common stockholders  | 
(13 | ) | (14 | ) | ||||
|   Repurchases of common stock  | 
(182 | ) | ||||||
|   Distributions to noncontrolling interests  | 
(11 | ) | (12 | ) | ||||
|   
  | 
  
  | 
  
  | 
  
  | 
|||||
|   Net cash used in financing activities  | 
(112 | ) | (26 | ) | ||||
|   
  | 
  
  | 
  
  | 
  
  | 
|||||
|   Net decrease in cash, cash equivalents and restricted cash  | 
(71 | ) | (19 | ) | ||||
|   Cash, cash equivalents and restricted cash - beginning of period  | 
501 | 440 | ||||||
|   Effect of exchange rate changes on cash balances  | 
(1 | ) | 14 | |||||
|   
  | 
  
  | 
  
  | 
  
  | 
|||||
|   Cash, cash equivalents and restricted cash - end of period  | 
$ | 429 | $ | 435 | ||||
|   
  | 
  
  | 
  
  | 
  
  | 
|||||
Page 7
DANA INCORPORATED
Consolidated Statement of Cash Flows (Unaudited)
For the Nine Months Ended September 30, 2025 and 2024
| Nine Months Ended | ||||||||
| (In millions) | September 30, | |||||||
| 2025 | 2024 | |||||||
|   Operating activities  | 
||||||||
|   Net income  | 
$ | 148 | $ | 27 | ||||
|   Less: Net income from discontinued operations  | 
164 | 174 | ||||||
|   
  | 
  
  | 
  
  | 
  
  | 
|||||
|   Net loss from continuing operations  | 
(16 | ) | (147 | ) | ||||
|   Depreciation  | 
257 | 253 | ||||||
|   Amortization  | 
9 | 10 | ||||||
|   Amortization of deferred financings charges  | 
4 | 4 | ||||||
|   Earnings of affiliates, net of dividends received  | 
(4 | ) | (4 | ) | ||||
|   Stock compensation expense  | 
31 | 21 | ||||||
|   Deferred income taxes  | 
(67 | ) | 16 | |||||
|   Pension expense, net  | 
(1 | ) | 6 | |||||
|   Change in working capital  | 
(212 | ) | (219 | ) | ||||
|   Change in other noncurrent assets and liabilities  | 
(56 | ) | (6 | ) | ||||
|   Loss on disposal group previously held for sale  | 
26 | |||||||
|   Loss on divestiture of ownership interests  | 
(12 | ) | ||||||
|   Other, net  | 
8 | (4 | ) | |||||
|   
  | 
  
  | 
  
  | 
  
  | 
|||||
|   Net cash used in operating activities from continuing operations  | 
(59 | ) | (44 | ) | ||||
|   Net cash provided by operating activities from discontinued operations  | 
165 | 192 | ||||||
|   
  | 
  
  | 
  
  | 
  
  | 
|||||
|   Net cash provided by operating activities  | 
106 | 148 | ||||||
|   
  | 
  
  | 
  
  | 
  
  | 
|||||
|   Investing activities  | 
||||||||
|   Purchases of property, plant and equipment  | 
(153 | ) | (198 | ) | ||||
|   Proceeds from sale of property, plant and equipment  | 
12 | 3 | ||||||
|   Proceeds from sales of investments  | 
57 | |||||||
|   Settlements of undesignated derivatives  | 
(15 | ) | (5 | ) | ||||
|   Other, net  | 
2 | |||||||
|   
  | 
  
  | 
  
  | 
  
  | 
|||||
|   Net cash used in investing activities from continuing operations  | 
(99 | ) | (198 | ) | ||||
|   Net cash used in investing activities from discontinued operations  | 
(31 | ) | (7 | ) | ||||
|   
  | 
  
  | 
  
  | 
  
  | 
|||||
|   Net cash used in investing activities  | 
(130 | ) | (205 | ) | ||||
|   
  | 
  
  | 
  
  | 
  
  | 
|||||
|   Financing activities  | 
||||||||
|   Net change in short-term debt  | 
622 | |||||||
|   Proceeds from long-term debt  | 
1 | |||||||
|   Repayment of long-term debt  | 
(216 | ) | (35 | ) | ||||
|   Dividends paid to common stockholders  | 
(42 | ) | (43 | ) | ||||
|   Repurchases of common stock  | 
(439 | ) | ||||||
|   Distributions to noncontrolling interests  | 
(14 | ) | (17 | ) | ||||
|   Collection of note receivable from noncontrolling interest  | 
11 | |||||||
|   Contributions from redeemable noncontrolling interests  | 
18 | |||||||
|   Swap settlements  | 
(14 | ) | ||||||
|   Other, net  | 
(8 | ) | 9 | |||||
|   
  | 
  
  | 
  
  | 
  
  | 
|||||
|   Net cash used in financing activities  | 
(111 | ) | (56 | ) | ||||
|   
  | 
  
  | 
  
  | 
  
  | 
|||||
|   Net decrease in cash, cash equivalents and restricted cash  | 
(135 | ) | (113 | ) | ||||
|   Cash, cash equivalents and restricted cash - beginning of period  | 
512 | 563 | ||||||
|   Effect of exchange rate changes on cash balances  | 
52 | (15 | ) | |||||
|   
  | 
  
  | 
  
  | 
  
  | 
|||||
|   Cash, cash equivalents and restricted cash - end of period  | 
$ | 429 | $ | 435 | ||||
|   
  | 
  
  | 
  
  | 
  
  | 
|||||
Page 8
DANA INCORPORATED
Reconciliation of Net Cash Provided By Operating Activities to Adjusted Free Cash Flow (Unaudited)
| Three Months Ended | ||||||||
| (In millions) | September 30, | |||||||
| 2025 | 2024 | |||||||
|   Net cash provided by operating activities  | 
$ | 111 | $ | 35 | ||||
|   Purchases of property, plant and equipment - Continuing operations  | 
(49 | ) | (37 | ) | ||||
|   Purchases of property, plant and equipment - Discontinued operations  | 
(11 | ) | (9 | ) | ||||
|   Proceeds from sale of property, plant and equipment - Continuing operations  | 
1 | 3 | ||||||
|   Proceeds from sale of property, plant and equipment - Discontinued operations  | 
— | — | ||||||
|   Cash paid for Off-Highway business divestiture related activities  | 
49 | — | ||||||
|   
  | 
  
  | 
  
  | 
  
  | 
|||||
|   Adjusted free cash flow  | 
$ | 101 | $ | (8 | ) | |||
|   
  | 
  
  | 
  
  | 
  
  | 
|||||
| Nine Months Ended | ||||||||
| (In millions) | September 30, | |||||||
| 2025 | 2024 | |||||||
|   Net cash provided by operating activities  | 
$ | 106 | $ | 148 | ||||
|   Purchases of property, plant and equipment - Continuing operations  | 
(153 | ) | (198 | ) | ||||
|   Purchases of property, plant and equipment - Discontinued operations  | 
(33 | ) | (29 | ) | ||||
|   Proceeds from sale of property, plant and equipment - Continuing operations  | 
12 | 3 | ||||||
|   Proceeds from sale of property, plant and equipment - Discontinued operations  | 
— | 4 | ||||||
|   Cash paid for Off-Highway business divestiture related activities  | 
61 | — | ||||||
|   
  | 
  
  | 
  
  | 
  
  | 
|||||
|   Adjusted free cash flow  | 
$ | (7 | ) | $ | (72 | ) | ||
|   
  | 
  
  | 
  
  | 
  
  | 
|||||
Page 9
DANA INCORPORATED
Segment Sales and Adjusted EBITDA (Unaudited)
For the Three Months Ended September 30, 2025 and 2024
| Three Months Ended | ||||||||
| (In millions) | Setember 30, | |||||||
| 2025 | 2024 | |||||||
|   Sales  | 
||||||||
|   Light Vehicle  | 
$ | 1,353 | $ | 1,285 | ||||
|   Commercial Vehicle  | 
564 | 612 | ||||||
|   
  | 
  
  | 
  
  | 
  
  | 
|||||
|   Total Sales  | 
$ | 1,917 | $ | 1,897 | ||||
|   
  | 
  
  | 
  
  | 
  
  | 
|||||
|   Adjusted EBITDA  | 
||||||||
|   Light Vehicle  | 
$ | 126 | $ | 82 | ||||
|   Commercial Vehicle  | 
51 | 45 | ||||||
|   Corporate expense and other items, net  | 
(15 | ) | (16 | ) | ||||
|   
  | 
  
  | 
  
  | 
  
  | 
|||||
|   Adjusted EBITDA  | 
$ | 162 | $ | 111 | ||||
|   
  | 
  
  | 
  
  | 
  
  | 
|||||
Page 10
DANA INCORPORATED
Segment Sales and Adjusted EBITDA (Unaudited)
For the Nine Months Ended September 30, 2025 and 2024
| (In millions) | Nine Months Ended September 30,  | 
|||||||
| 2025 | 2024 | |||||||
|   Sales  | 
||||||||
|   Light Vehicle  | 
$ | 3,901 | $ | 4,049 | ||||
|   Commercial Vehicle  | 
1,732 | 1,911 | ||||||
|   
  | 
  
  | 
  
  | 
  
  | 
|||||
|   Total Sales  | 
$ | 5,633 | $ | 5,960 | ||||
|   
  | 
  
  | 
  
  | 
  
  | 
|||||
|   Adjusted EBITDA  | 
||||||||
|   Light Vehicle  | 
$ | 306 | $ | 250 | ||||
|   Commercial Vehicle  | 
139 | 117 | ||||||
|   Corporate expense and other items, net  | 
(43 | ) | (56 | ) | ||||
|   
  | 
  
  | 
  
  | 
  
  | 
|||||
|   Adjusted EBITDA  | 
$ | 402 | $ | 311 | ||||
|   
  | 
  
  | 
  
  | 
  
  | 
|||||
Page 11
DANA INCORPORATED
Reconciliation of Loss From Continuing Operations Before Income Taxes to Adjusted EBITDA (Unaudited)
For the Nine Months Ended September 30, 2025 and 2024
| (In millions) | Three Months Ended September 30,  | 
|||||||
| 2025 | 2024 | |||||||
|   Income (loss) from continuing operations before income taxes  | 
$ | 9 | $ | (41 | ) | |||
|   Adjustments related to continuing operations  | 
||||||||
|   Interest income  | 
(3 | ) | (5 | ) | ||||
|   Interest expense  | 
47 | 38 | ||||||
|   Depreciation  | 
86 | 83 | ||||||
|   Amortization  | 
3 | 3 | ||||||
|   Non-service cost components of pension and OPEB costs  | 
3 | 5 | ||||||
|   Restructuring charges, net  | 
4 | 20 | ||||||
|   Stock compensation expense  | 
8 | 7 | ||||||
|   Strategic transaction expenses  | 
6 | (2 | ) | |||||
|   (Gain) loss on sale of property, plant and equipment  | 
1 | (1 | ) | |||||
|   Supplier capacity charge adjustment  | 
(2 | ) | ||||||
|   Loss on disposal group previously held for sale  | 
(4 | ) | ||||||
|   Other items  | 
8 | |||||||
|   
  | 
  
  | 
  
  | 
  
  | 
|||||
|   Adjusted EBITDA  | 
$ | 162 | $ | 111 | ||||
|   
  | 
  
  | 
  
  | 
  
  | 
|||||
Page 12
DANA INCORPORATED
Reconciliation of Loss From Continuing Operations Before Income Taxes to Adjusted EBITDA (Unaudited)
For the Nine Months Ended September 30, 2025 and 2024
| (In millions) | Nine Months Ended September 30,  | 
|||||||
| 2025 | 2024 | |||||||
|   Loss from continuing operations before income taxes  | 
$ | (45 | ) | $ | (167 | ) | ||
|   Adjustments related to continuing operations  | 
||||||||
|   Interest income  | 
(8 | ) | (9 | ) | ||||
|   Interest expense  | 
130 | 117 | ||||||
|   Depreciation  | 
257 | 253 | ||||||
|   Amortization  | 
9 | 10 | ||||||
|   Non-service cost components of pension and OPEB costs  | 
7 | 12 | ||||||
|   Restructuring charges, net  | 
17 | 36 | ||||||
|   Stock compensation expense  | 
31 | 21 | ||||||
|   Strategic transaction expenses  | 
12 | 2 | ||||||
|   Supplier capacity charge adjustment  | 
(21 | ) | ||||||
|   Loss on divestiture of ownership interests  | 
7 | |||||||
|   Loss on disposal group previously held for sale  | 
26 | |||||||
|   Other items  | 
6 | 10 | ||||||
|   
  | 
  
  | 
  
  | 
  
  | 
|||||
|   Adjusted EBITDA  | 
$ | 402 | $ | 311 | ||||
|   
  | 
  
  | 
  
  | 
  
  | 
|||||
Page 13
 
2025 Third-Quarter Earnings Conference Call October 29, 2025 Value Others | Inspire Innovation | Grow Responsibly | Win Together
 
Safe Harbor Statement Certain statements and projections contained in this presentation are, by their nature, forward-looking within the meaning of the Private Securities Litigation Reform Act of 1995. These forward-looking statements are based on our current expectations, estimates and projections about our industry and business, management’s beliefs, and certain assumptions made by us, all of which are subject to change. Forward-looking statements can often be identified by words such as “anticipates,” “expects,” “intends,” “plans,” “predicts,” “believes,” “seeks,” “estimates,” “may,” “will,” “should,” “would,” “could,” “potential,” “continue,” “ongoing,” similar expressions, and variations or negatives of these words. These forward-looking statements are not guarantees of future results and are subject to risks, uncertainties and assumptions that could cause our actual results to differ materially and adversely from those expressed in any forward-looking statement. Dana’s Annual Report on Form 10-K, subsequent Quarterly Reports on Form 10-Q, recent Current Reports on Form 8-K, and other Securities and Exchange Commission filings discuss © important risk factors that could affect our business, results of operations and financial 2025 condition. The forward-looking statements in this presentation speak only as of this date. Dana Dana does not undertake any obligation to revise or update publicly any forward-looking statement for any reason. 2
 
Agenda Craig Barber R. Bruce McDonald Timothy Kraus Senior Director, Investor Chairman and Senior Vice President and Relations and Corporate Chief Executive Officer Chief Financial Officer Communications Introduction Business Review Financial Review
 
Third-Quarter Highlights Pending sale of Off-Highway business on track Expected to close late in the fourth quarter Capital return proceeding as planned Repurchased ~9.5 million shares in Q3, or ~7% of shares outstanding, returning $189 million to shareholders Expecting 2025 share repurchases of $600 million Anticipating ~$155 million share repurchase throughout Q4 Realized $73 million cost savings in Q3, $183 million to date Cost reduction initiatives on track, program target of $310 million through 2026 Expecting $235 million of cost savings in 2025; $10 million improvement Tariff landscape remains fluid Expecting to recover majority of cost this year Mitigation actions ongoing © Balance-of-the-year outlook 2025 Light-truck demand remains stable, monitoring impact from customer production disruptions Dana Commercial-vehicle demand softening 2025 profit guidance increased 4 Solid Q3 Results, Full-Year Profit Guidance Increased
 
Financial Review DAN LISTED NYSE
 
2025 Q3 Financial Results Results are presented excluding the Off-Highway Changes from Prior Year business, which is classified as discontinued operations ($ in millions) Sales benefited from pricing, Q3 ‘25 Q3 ‘24 Change recoveries and currency, partially offset by lower volumes Sales $ 1,917 $ 1,897 $ 20 Cost-savings actions and efficiency offsetting margin Adjusted EBITDA 162 111 51 impact of lower sales volume Margin 8.5% 5.9% 260 bps Increase in interest expense driven by higher borrowings EBIT 53 (8) 61 Income tax benefit driven by the release of valuation Interest Expense, Net 44 33 11 allowance and a status change in a foreign jurisdiction Income Tax Benefit (2) (18) 16 © Net Income (Loss) (from continuing operations) 13 (21) 34 2025 Dana See appendix for comments regarding the presentation of non-GAAP measures Cost Savings Actions Mitigating Profit Impact of Lower Sales Volumes
 
2025 Q3 Sales and Profit Changes Results are presented Sales excluding the Off-Highway $2,476M business, which is classified as discontinued operations $1,897M $21M $8M $1,917M $8M $0M $49M Reduced YoY volumes largely ($579M) ($66M) driven by lower demand in commercial-vehicle market Commercial and operating efficiency efforts mitigated the margin impact lower volume and unfavorable mix 2024 As Disc Ops 2024 Vol/Mix Performance Cost Tariff Currency Commodities 2025 Reported Cont Ops Savings Cont Ops Accelerated cost savings actions more than offset the Adjusted EBITDA margin gap from lower sales volume $232M Modest tariff impact due to timing of recoveries $73M $2M $1M $162M ($1M) $111M © $11M ($121M) 2025 ($35M) 5.9% 8.5% Margin Margin Dana 2024 As Disc Ops 2024 Vol/Mix Performance Cost Tariff Currency Commodities 2025 Reported Cont Ops Savings Cont Ops See appendix for comments regarding the presentation of non-GAAP measures 7 Operational Efficiencies and Accelerated Cost Actions More than Offset Volume Impacts
 
2025 Q3 Free Cash Flow Free cash flow includes cash Changes from Prior Year generated from both continuing and discontinued operations, to ($ in millions) align with deal structure One-time costs increased due 2025 2024 Change to restructuring and strategic transactions Adjusted EBITDA Cont. Ops $ 162 $ 111 $ 51 Higher interest due to Adjusted EBITDA Disc. Ops $ 113 $ 121 $ (8) increased borrowing One-Time Costs1 (17) (9) (8) Lower taxes were driven by timing of payments Interest, Net (54) (43) (11) Capital spending impacted by timing of investments for new Taxes (47) (72) 25 programs Working Capital / Other² (3) (73) 76 Capital Spending, Net (59) (43) (16) © Adjusted Free Cash Flow $ 101 $ (8) $ 109 2025 1 Includes costs associated with business acquisitions and divestitures and restructuring. 2 Changes in working capital relating to interest, taxes, Dana restructuring, and transaction costs are included in those respective categories. See appendix for comments regarding the presentation of non-GAAP measures. 8 Higher Adj. FCF Diven by Higher Profit and Lower Working Capital Requirements
 
2025 Full-Year Financial Guide 2025 Revised Guidance Ranges Sales and adjusted EBITDA guidance excludes the discontinued Off-Highway Continuing Operations Change From operations for the full year Guidance Prior Guidance Free cash flow includes cash generated from both continuing and discontinued operations, to Sales ~$7.4B ±$100M align with deal structure Range Tariff assumption includes recovery of the majority of the gross impact within the Adjusted EBITDA ~$590M ±$20M calendar year $15M Range Midpoint of sales guidance maintained, with a tighter range Implied adjusted ~7.8% to ~8.1% EBITDA margin 30 bps Range Adjusted EBITDA expectations increased by $15 million, driven by cost savings and operational improvements Adjusted free cash flow ~$275M ±$25M © Range Adj. EBITDA margin now 2025 expected to be 30 basis points higher than the previous Dana estimate See appendix for comments regarding the presentation of non-GAAP measures 9 Profit Guidance for Continuing Operations Increased
 
2025 Full-Year Sales and Profit Changes Sales and adjusted EBITDA Sales guidance excludes the $10,284M discontinued Off-Highway operations for the full year $7,733M $150M $25M $15M $7,400M $80M Profit impact of lower volume ($2,551M) $0M ($600M) expected to be more than offset by operating efficiency and cost-savings improvements Anticipated tariffs driving negative profit and margin impacts due to recovery lags 2024 As Disc Ops 2024 Vol/Mix Performance Cost Tariff Currency Commodities 2025 Reported Cont Ops Savings Cont Ops Expecting a modest currency benefit as euro strengthens Adjusted EBITDA against the U.S. dollar $885M $235M $5M $590M ($20M) ($5M) $395M $110M© ($490M) 2025 5.1% ($130M) 8.0% Margin Margin Dana 2024 As Disc Ops 2024 Vol/Mix Performance Cost Tariff Currency Commodities 2025 Reported Cont Ops Savings Cont Ops See appendix for comments regarding the presentation of non-GAAP measures 10 Expected Q4 2025 Adj. EBITDA Exit Margin of 10+%
 
2025 Full-Year Free Cash Flow Free cash flow includes cash Changes from Prior Year generated from both continuing and discontinued operations, to ($ in millions) align with deal structure Higher profit, improved working 2025 2024 Change capital efficiency, and lower capital investment Adjusted EBITDA Cont Ops $ ~590 $ 387 $ ~205 requirements driving improvement over last year Adjusted EBITDA Disc Ops $ ~400 $ 498 $ ~(100) Increased continuing One-Time Costs1 (75) (46) (30) operations profit offsetting lower profit in discontinued operations Interest, Net (160) (149) (10) Higher interest due to Taxes (190) (172) (20) increased borrowing for capital return Working Capital / Other² 35 (68) 105 Higher taxes driven by JV Capital Spending, Net (325) (369) 45 disposals, timing of payments, © and jurisdictional mix Adjusted Free Cash Flow $ ~275 $ 81 $ ~195 2025 1 Includes costs associated with business acquisitions and divestitures and restructuring. 2 Changes in working capital relating to interest, taxes, Dana restructuring, and transaction costs are included in those respective categories. See appendix for comments regarding the presentation of non-GAAP measures. 11 Higher Adj. FCF Driven by Higher Profit and Lower Working Capital Requirements
 
New Dana: Outlook 2026 and Beyond $310M cost savings plan on track for 2026 Anticipate that in 2026, New Dana will have: Adjusted EBITDA margins of 10%-10.5%, consistent with Q4 2025 exit margin Cost savings plan: +100 bps Accretive new business: +60 bps Eliminated stranded costs: +50 bps Additional operating performance: +40 bps Cash taxes and interest significantly lower by ~$200M Adjusted free cash flow of ~4% of sales $1B capital return to shareholders authorized through 2027 In addition to existing dividend © 2025 Growth trajectory maintained Dana Robust three-year new sales backlog – roll-out of new forecast in January 2026 Continue to invest to win new business 12 Trajectory for Profitable Growth
 
© 2025 Dana 13 Appendix
 
2025 Q3 Sales and Profit Change by Segment $1,285M $6M $6M $42M $8M $6M $1,353M $0M Sales Light Vehicle Systems $35M $1M $0M $1M $126M $26M $82M Adjusted EBITDA ($19M) 6.4% 5.9% 9.3% 2024 Vol/Mix Performance Cost Savings Tariff Currency Commodities 2025 $612M $2M $7M $13M $2M $564M $0M ($72M) Sales Commercial © Vehicle $17M $2M $51M 2025 Systems $45M $0M 3.2% ($2M) Dana $5M Adjusted EBITDA ($16M) 7.4% 9.0% 14 88911-003 28Oct25 20:19 Page 31 See appendix for comments regarding 2024 Vol/Mix Performance Cost Savings Tariff Currency Commodities 2025
 
Segment Profiles Light Vehicle Commercial Vehicle Drive Systems Drive and Motion Systems Year to Date 9/30/2025 Year to Date 9/30/2025 Other PACCAR 21% 16% Ford SALES 45% Tata Traton 5% Other 12% Renault / 51% Nissan 5% Volvo Toyota 10% 7% Daimler Stellantis* Ford 7% CUSTOMER 17% 4% * Includes sales to systems integrations for driveline products that support Stellantis vehicles Asia Pacific 12% Asia Pacific North 8% America North 39% South America America 4% 70% SALES South America 2025 20% Europe REGIONAL 14% Dana Europe 15 33%
 
Segment Data DANA INCORPORATED DANA INCORPORATED Segment Sales and Adjusted EBITDA (Unaudited) Segment Sales and Adjusted EBITDA (Unaudited) For the Three Months Ended September 30, 2025 and 2024 For the Nine Months Ended September 30, 2025 and 2024 Three Months Ended Nine Months Ended (In millions) Setember 30, (In millions) September 30, 2025 2024 2025 2024 Sales Sales Light Vehicle $ 1,353 $ 1,285 Light Vehicle $ 3,901 $ 4,049 Commercial Vehicle 564 612 Commercial Vehicle 1,732 1,911 Total Sales $ 1,917 $ 1,897 Total Sales $ 5,633 $ 5,960 Adjusted EBITDA Adjusted EBITDA Light Vehicle $ 126 $ 82 Light Vehicle $ 306 $ 250 Commercial Vehicle 51 45 Commercial Vehicle 139 117 © Corporate expense and other items, net (15) (16) Corporate expense and other items, net (43) (56) 2025 Adjusted EBITDA $ 162 $ 111 Adjusted EBITDA $ 402 $ 311Dana 16
 
Segment Data Continued DANA INCORPORATED DANA INCORPORATED Reconciliation of Loss From Continuing Operations Before Income Taxes Reconciliation of Loss From Continuing Operations Before Income Taxes to Adjusted EBITDA (Unaudited) to Adjusted EBITDA (Unaudited) For the Nine Months Ended September 30, 2025 and 2024 For the Nine Months Ended September 30, 2025 and 2024 Three Months Ended Nine Months Ended (In millions) September 30, (In millions) September 30, 2025 2024 2025 2024 Income (loss) from continuing operations before income taxes $ 9 $ (41) Loss from continuing operations before income taxes $ (45) $ (167) Adjustments related to continuing operations Adjustments related to continuing operations Interest income (3) (5) Interest income (8) (9) Interest expense 47 38 Interest expense 130 117 Depreciation 86 83 Depreciation 257 253 Amortization 3 3 Amortization 9 10 Non-service cost components of pension and OPEB costs 3 5 Non-service cost components of pension and OPEB costs 7 12 Restructuring charges, net 4 20 Restructuring charges, net 17 36 Stock compensation expense 8 7 Stock compensation expense 31 21 Strategic transaction expenses 6 (2) Strategic transaction expenses 12 2 © (Gain) loss on sale of property, plant and equipment 1 (1) Supplier capacity charge adjustment (21) Supplier capacity charge adjustment (2) Loss on divestiture of ownership interests 7 2025 Loss on disposal group previously held for sale (4) Loss on disposal group previously held for sale 26 Other items 8 Other items 6 10 Dana Adjusted EBITDA $ 162 $ 111 Adjusted EBITDA $ 402 $ 311 17
 
Cash Flow DANA INCORPORATED Reconciliation of Net Cash Provided By Operating Activities to Adjusted Free Cash Flow (Unaudited) Three Months Ended (In millions) September 30, 2025 2024 Net cash provided by operating activities $ 111 $ 35 Purchases of property, plant and equipment Continuing operations (49) (37) Purchases of property, plant and equipment Discontinued operations (11) (9) Proceeds from sale of property, plant and equipment Continuing operations 1 3 Proceeds from sale of property, plant and equipment Discontinued operations -Cash paid for Off-Highway business divestiture related activities 49 -Adjusted free cash flow $ 101 $ (8) Nine Months Ended (In millions) September 30, 2025 2024 Net cash provided by operating activities $ 106 $ 148 © Purchases of property, plant and equipment Continuing operations (153) (198) 2025 Purchases of property, plant and equipment Discontinued operations (33) (29) Proceeds from sale of property, plant and equipment Continuing operations 12 3 Dana Proceeds from sale of property, plant and equipment Discontinued operations 4 Cash paid for Off-Highway business divestiture related activities 61 -Adjusted free cash flow $ (7) $ (72) 18
 
Non-GAAP Financial Information Adjusted EBITDA is a non-GAAP financial measure which we have defined as net income (loss) before interest, income taxes, depreciation, amortization, equity grant expense, restructuring expense, non-service cost components of pension and other postretirement benefit costs and other adjustments not related to our core operations (gain/loss on debt extinguishment, pension settlements, divestitures, impairment, etc.). Adjusted EBITDA is a measure of our ability to maintain and continue to invest in our operations and provide shareholder returns. We use adjusted EBITDA in assessing the effectiveness of our business strategies, evaluating and pricing potential acquisitions and as a factor in making incentive compensation decisions. In addition to its use by management, we also believe adjusted EBITDA is a measure widely used by securities analysts, investors and others to evaluate financial performance of our company relative to other Tier 1 automotive suppliers. Adjusted EBITDA should not be considered a substitute for earnings (loss) before income taxes, net income (loss) or other results reported in accordance with GAAP. Adjusted EBITDA may not be comparable to similarly titled measures reported by other companies. Adjusted net income (loss) attributable to the parent company is a non-GAAP financial measure which we have defined as net income (loss) attributable to the parent company, excluding any discrete income tax items, restructuring charges, amortization expense and other adjustments not related to our core operations (as used in adjusted EBITDA), net of any associated income tax effects. This measure is considered useful for purposes of providing investors, analysts and other interested parties with an indicator of ongoing financial performance that provides enhanced comparability to net income (loss) attributable to the parent company reported by other companies. Adjusted net income (loss) attributable to the parent company is neither intended to represent nor be an alternative measure to net income (loss) attributable to the parent company reported in accordance with GAAP. Adjusted free cash flow is a non-GAAP financial measure which we have defined as net cash provided by (used in) operating activities less purchases of property, plant and equipment plus proceeds from sale of property, plant and equipment plus cash paid for Off-Highway business divestiture related activities. We believe adjusted free cash flow is useful to investors in evaluating the operational cash flow of the company inclusive of the spending required to maintain the operations. Adjusted free cash flow is not intended to represent nor be an alternative to the measure of net cash provided by (used in) operating activities reported in accordance with GAAP. Adjusted free cash flow may not be comparable to similarly titled measures reported by other companies. The accompanying financial information provides reconciliations of adjusted EBITDA and adjusted free cash flow to the most directly comparable financial measures calculated and presented in accordance with GAAP. We have not provided a reconciliation of our adjusted EBITDA outlook to the most comparable GAAP measures of net income (loss). © Providing net income (loss) guidance is potentially misleading and not practical given the difficulty of projecting event driven transactional and other non-core operating items 2025 that are included in net income (loss), including restructuring actions, asset impairments and certain income tax adjustments. The accompanying reconciliations of these non- GAAP measures with the most comparable GAAP measures for the historical periods presented are indicative of the reconciliations that will be prepared upon completion of the Dana periods covered by the non-GAAP guidance. 19
 
Value Others | Inspire Innovation | Grow Responsibly | Win Together