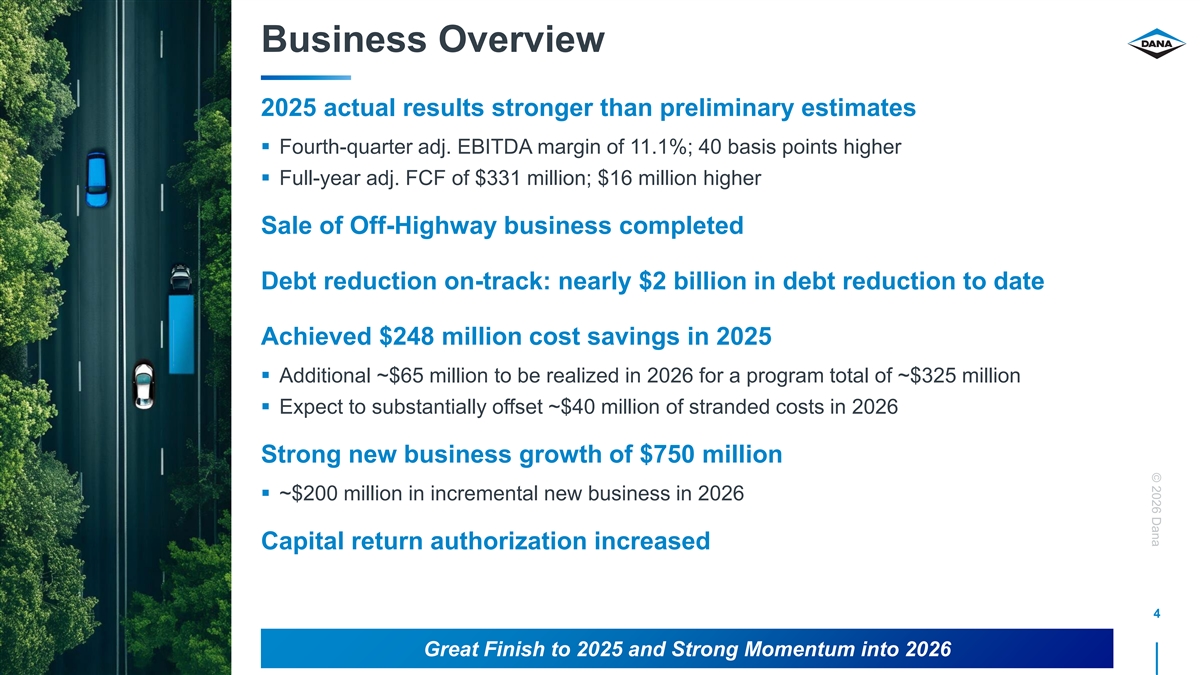
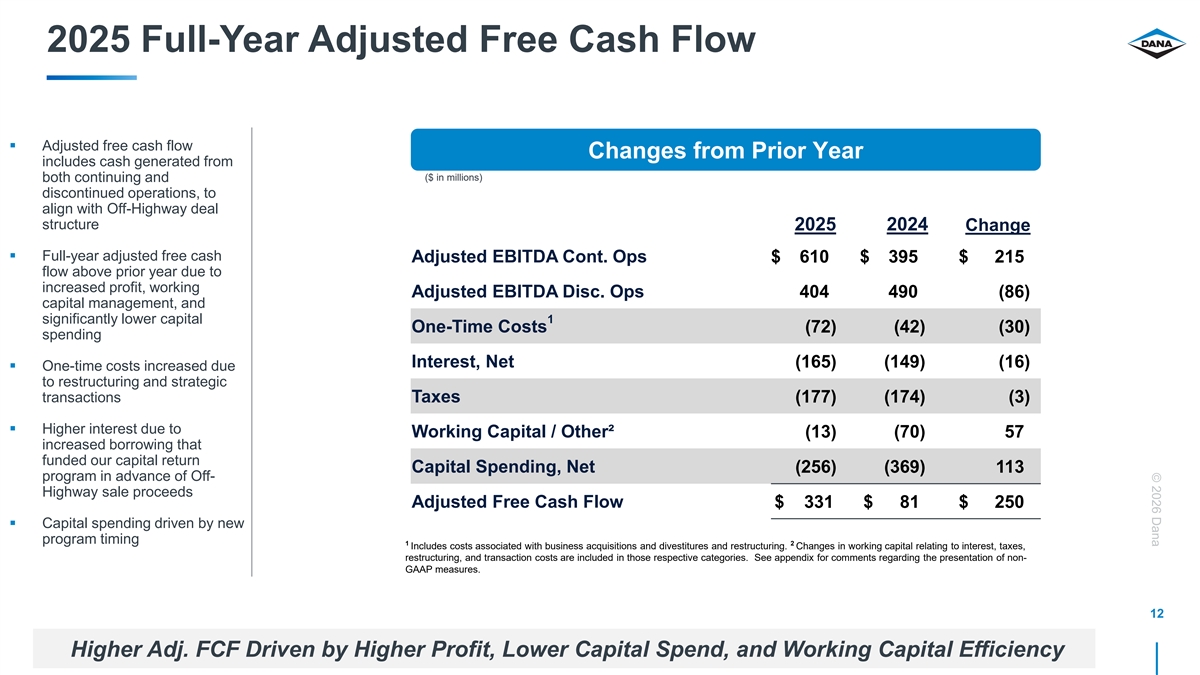
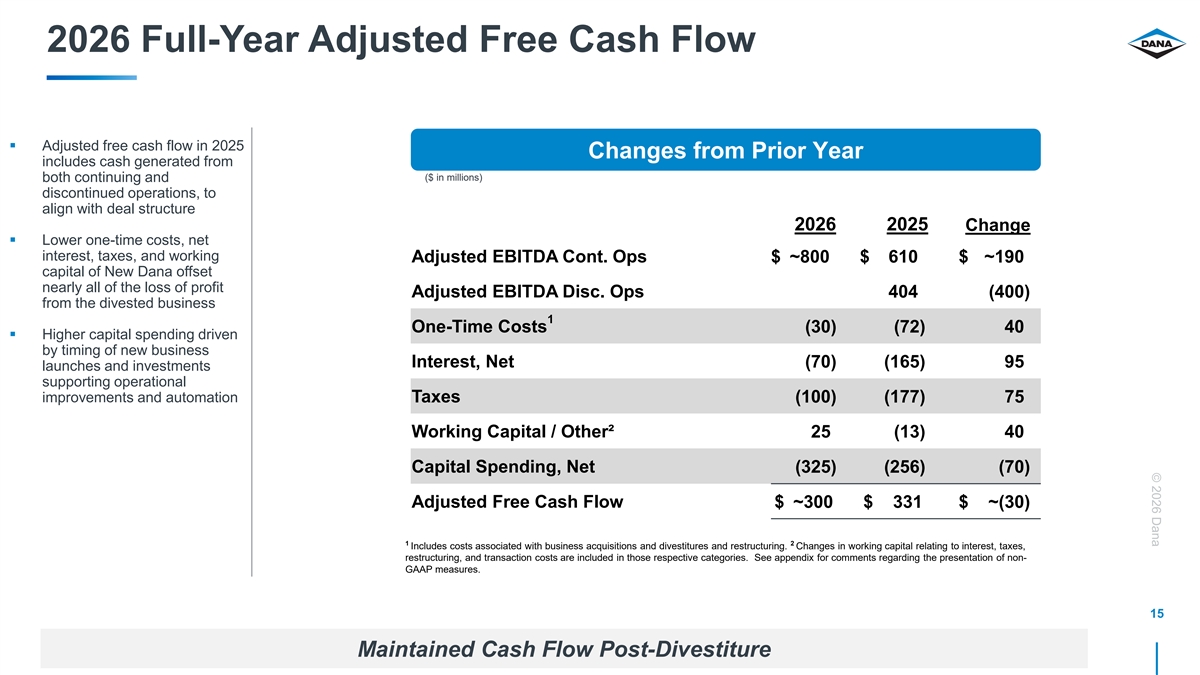
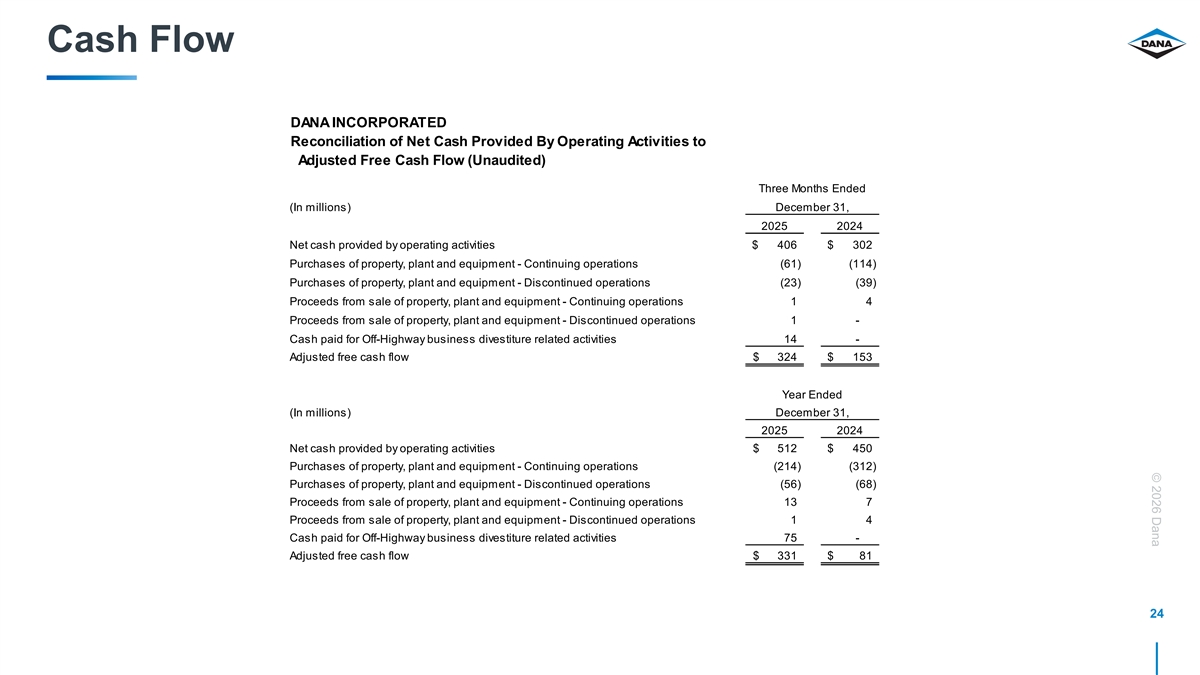
Adjusted free cash flow of $331 million; $16 million higher than
preliminary estimate
•
Completed sale of the Off-Highway business
•
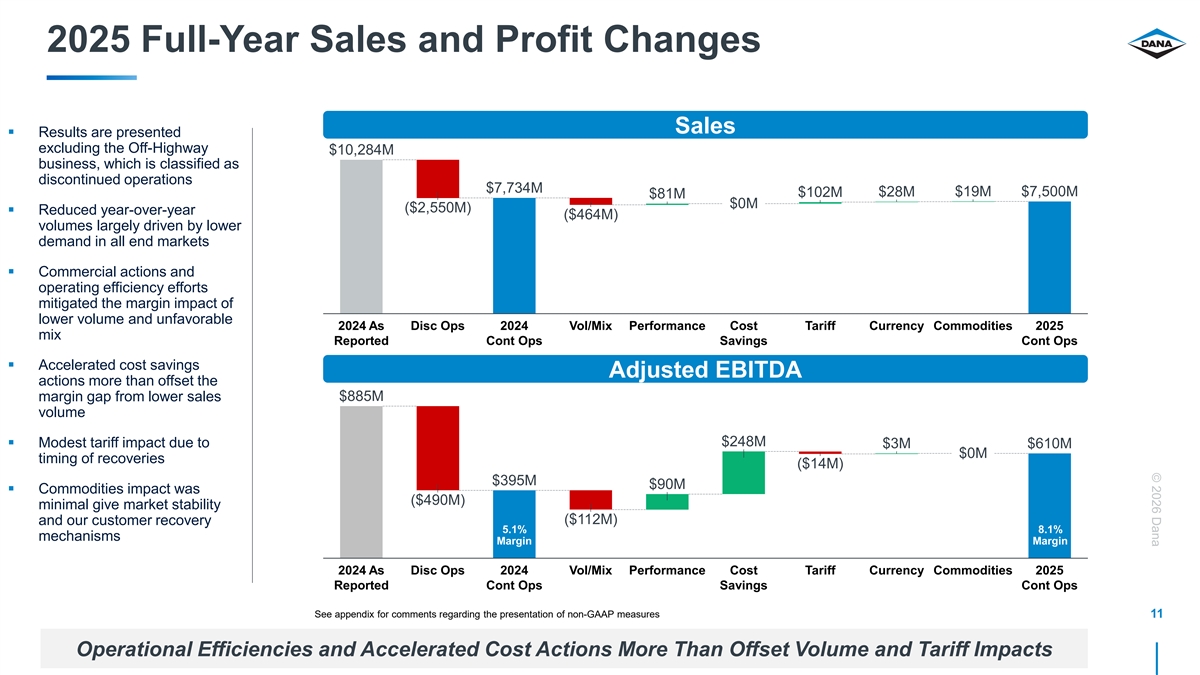
Achieved $248 million in cost savings; in line with our preliminary estimate
•
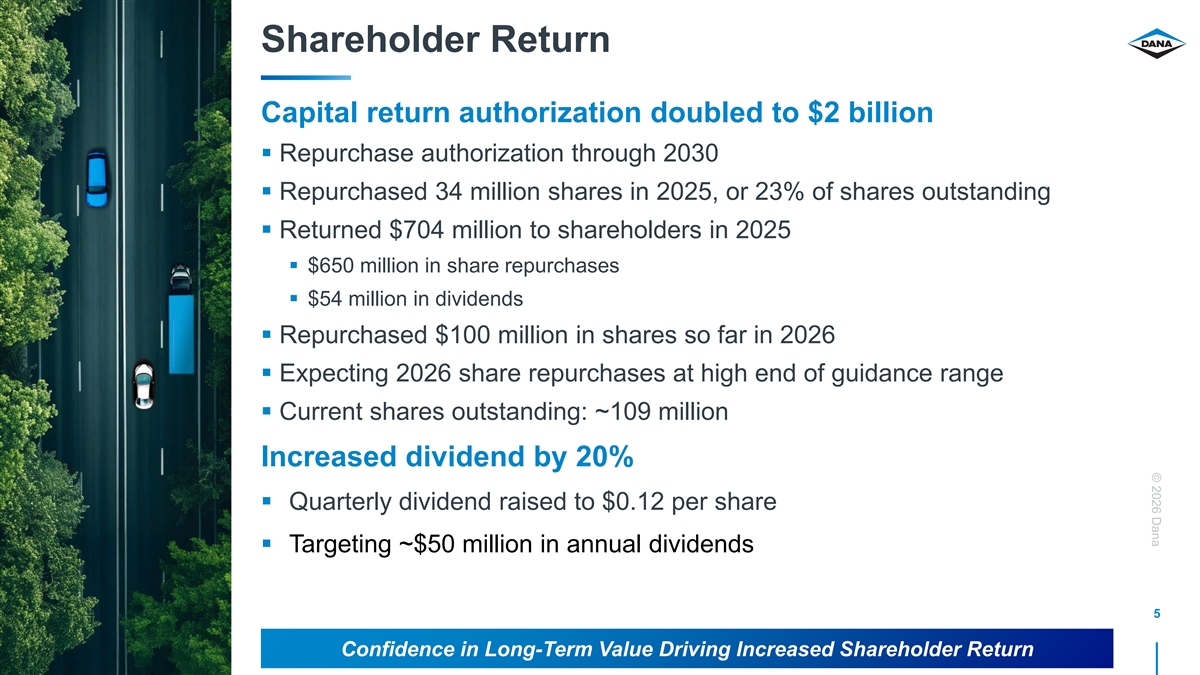
Returned $704 million to shareholders
•
Repurchased 34 million shares, representing 23% of shares outstanding
2026 Highlights:
•
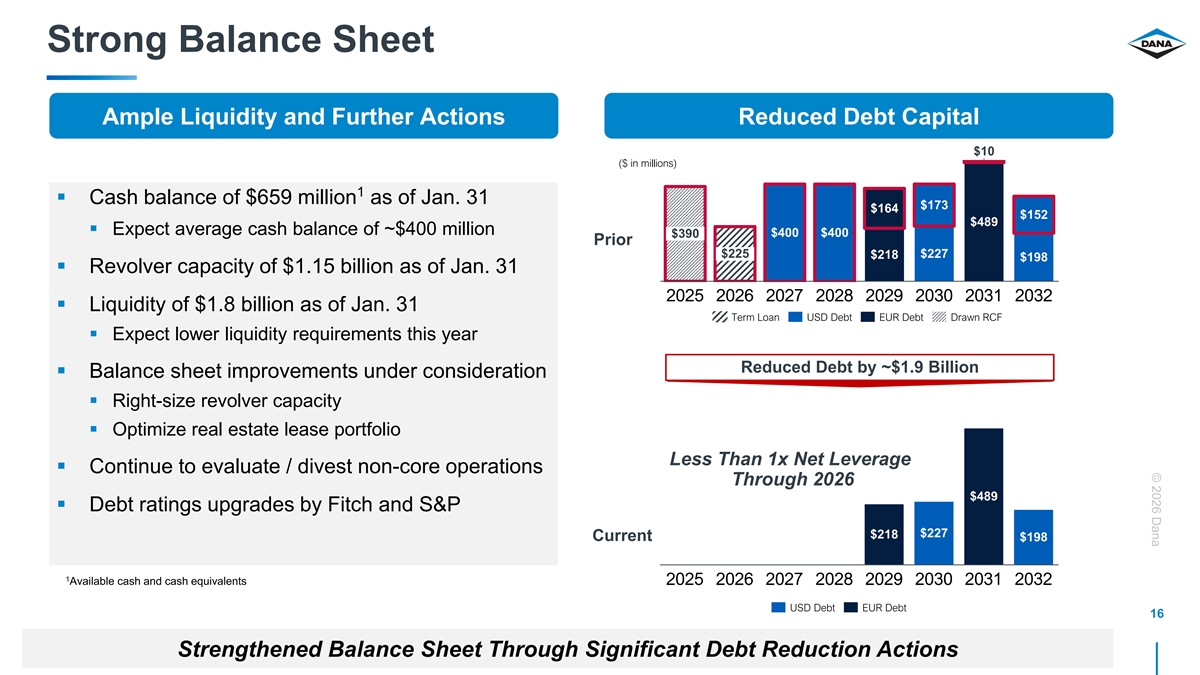
Completed nearly $2 billion in debt reduction, supported by proceeds from the Off-Highway
sale
•
Announced capital return program has been extended and increased from $1 billion to
$2 billion
•
Repurchased $100 million in shares in January; expect repurchases of up to
$300 million in 2026
•
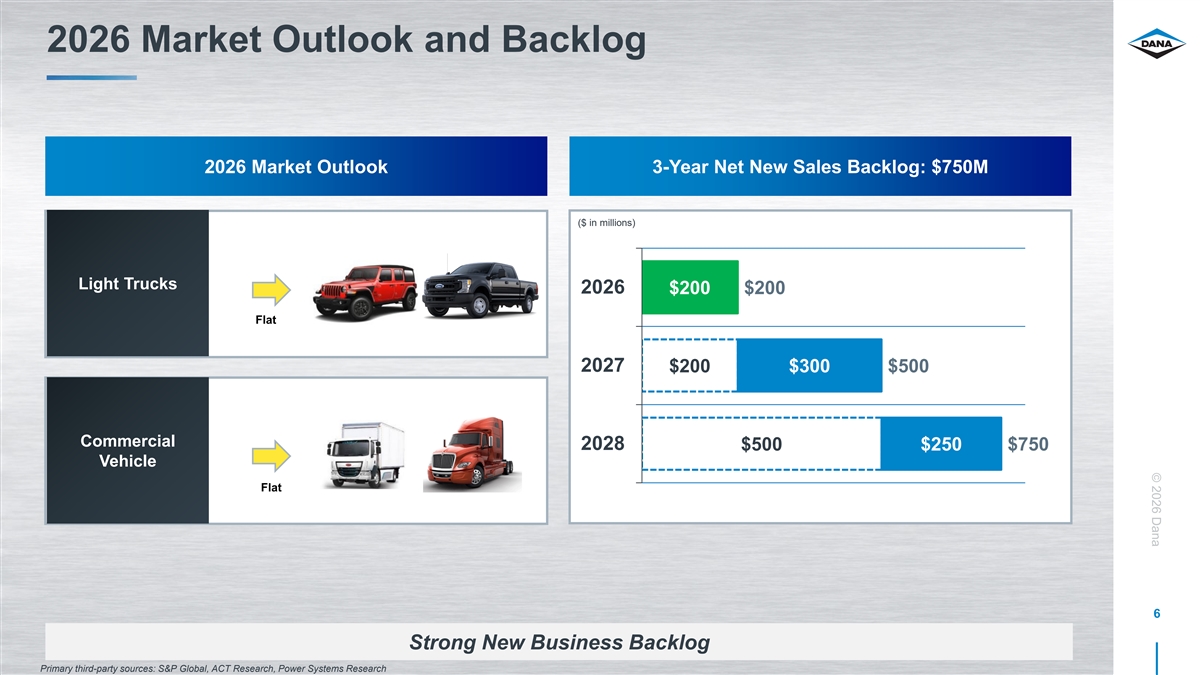
Announced $750 million three-year new business backlog; $200 million
incremental in 2026
•
2026 margin guidance range at a midpoint of 10.7 percent
•
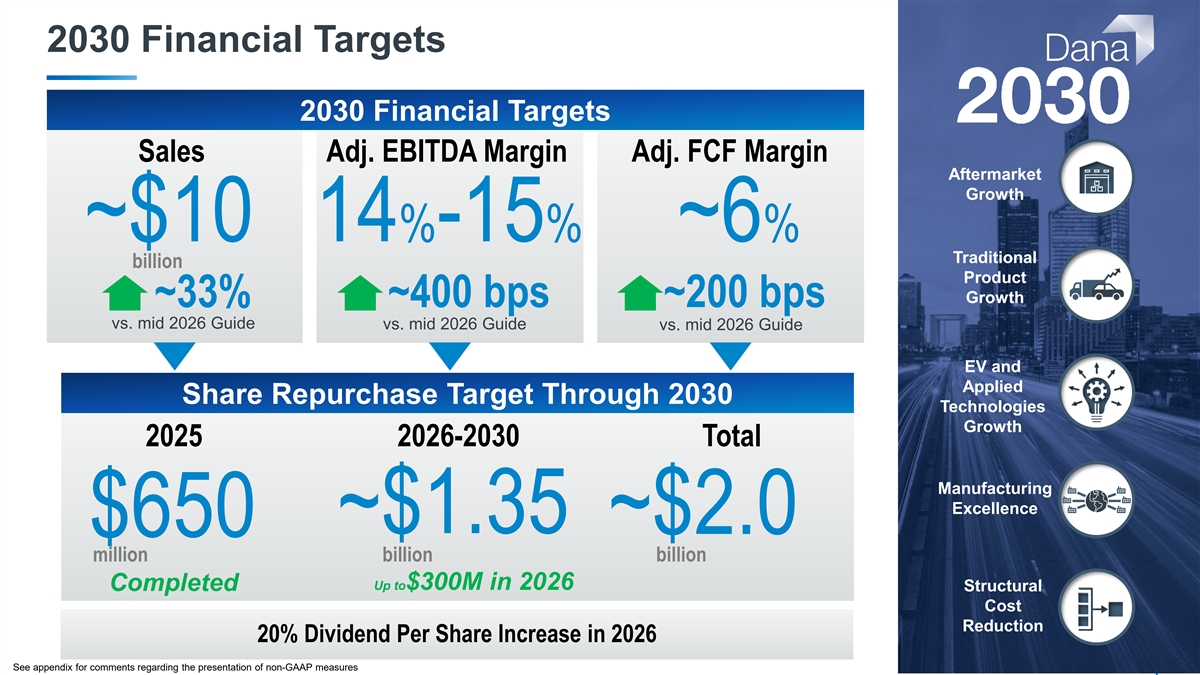
Announced new long-range targets for sales, profitability, and adjusted free cash flow
•
Will host a Capital Markets Day on March 25, 2026
MAUMEE, Ohio, February 18, 2026 – Dana Incorporated today announced its full-year 2025 financial results, with adjusted EBITDA and adjusted free
cash flow above the preliminary results issued in January. Dana also confirmed its outlook for 2026, highlighting stronger profitability, significant cost-reduction progress, increased capital return, and further improvements to its balance sheet.
“Over the past year, Dana made incredible progress on every one of our strategic priorities — from successfully completing the
Off-Highway separation to realizing significant cost efficiencies across the enterprise,” said R. Bruce McDonald, Chairman and Chief Executive Officer. “These actions have reshaped Dana into a more focused, more resilient organization
with improved margins and enhanced financial agility. In 2026, we remain on track to finalize the balance of our $325 million cost-reduction initiative and deliver adjusted EBITDA margins in the 10 to 11 percent range with a stronger balance sheet,
a richer mix of higher-margin programs, a continued focus on disciplined execution and an ongoing commitment to significant capital return in the years ahead.
All results are for continuing operations.
Fourth-quarter 2025 Financial Results
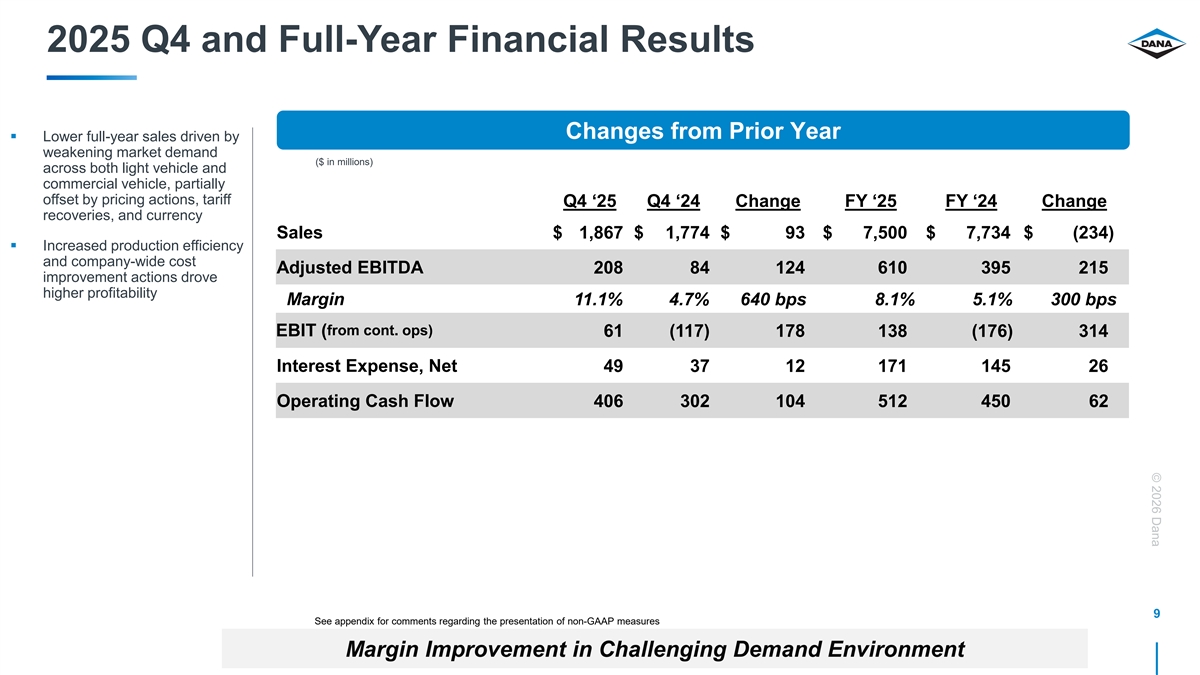
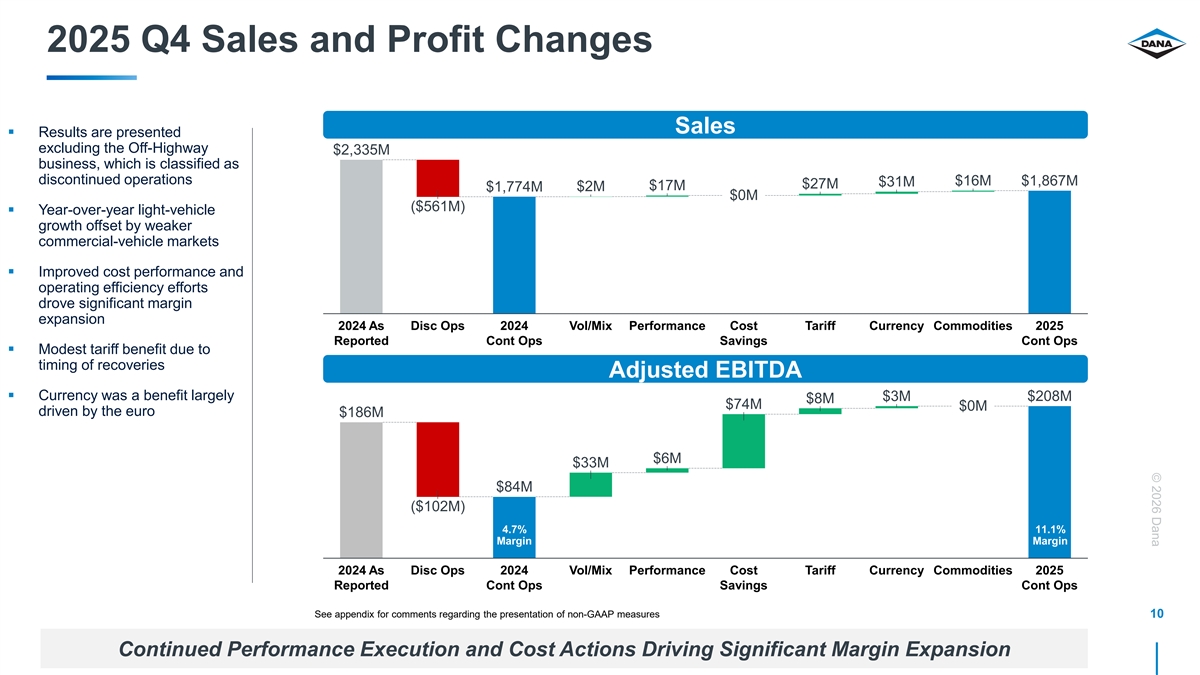
Sales in
the fourth quarter of 2025 totaled $1.9 billion, compared with $1.8 billion in the same period of 2023. The improvement was driven by increased demand for our key light truck programs offsetting lower market demand for commercial trucks.
Customer recovery and currency translation provided a further benefit.
Adjusted EBITDA for the fourth quarter of 2025 was $208 million
representing an 11.1 percent margin, compared with $84 million, or 4.7 percent, for the same period in 2024. Cost-savings actions and efficiency improvements were the primary drivers of the
improvement.
Operating cash flow in the fourth quarter of 2025 was $406 million, compared with $302 million in the same period of
2024. Adjusted free cash flow was $324 million, compared with $153 million in the fourth quarter of 2024.
1
Full-year 2025 Financial Results
Sales for 2025 were $7.5 billion, compared with $7.7 billion in 2024. The decrease was due to lower demand for vehicles in all end
markets partially offset by recoveries from customers and currency translation.
Adjusted EBITDA for 2025 was $610 million, compared with
$395 million in 2024, driven by cost-savings actions and performance improvements that more than offset the margin impact of lower sales and tariffs.
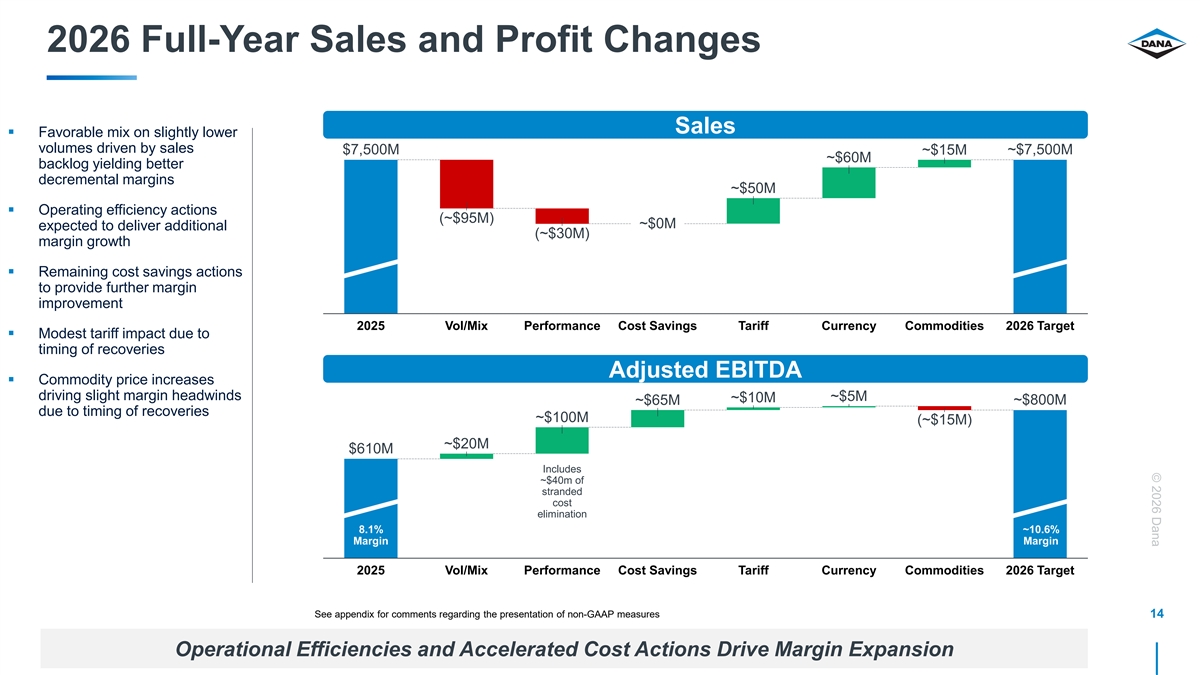
Dana’s three-year, new-business backlog totals $750 million, driven by new program awards, increased content, and expanded vehicle platforms
across both the light-vehicle and commercial-vehicle segments. The company expects $200 million in incremental new business growth in 2026 from next-generation platforms with global OEMs.
“Dana today introduced its long-term financial guidance as part of the company’s Dana 2030 strategy. In 2030, the company expects to generate
approximately $10 billion in sales, reflecting a 33 percent increase over its 2026 outlook,” said Byron Foster Senior Vice President and President, Light Vehicle Systems. “We are also targeting a significant expansion in
profitability, with adjusted EBITDA margins projected to reach 14 to 15 percent—a 45 percent improvement versus our 2026 guidance—and adjusted free cash flow margins of roughly 6 percent, representing a 50 percent
increase. Complementing these financial targets, the company announced a robust capital-return plan that includes a total of approximately $2 billion in share repurchases through 2030, reinforcing its commitment to delivering long-term shareholder
value.”
Join the company for an in-depth discussion of the Dana 2030 strategy at their Capital
Markets Day on March 25, 2026, in New York City.
2026 Financial Targets
Preliminary Guidance
Sales
$7.30 to $7.70 billion
Adjusted EBITDA
$750 to $850 million
Implied adjusted EBITDA margin
10.0% to 11.0%
Diluted Adjusted EPS
$2.00 to $3.00
Adjusted free cash flow
$250 to $350 million
Dana to Host Conference Call at 9 a.m. Wednesday, February 18
Dana will discuss its 2025 results and 2026 outlook in a conference call at 9:00 a.m. EST on Wednesday, February 18. The conference call can be accessed by
telephone from both domestic and international locations using the information provided below:
Audio streaming and slides will be available online via a link provided on the Dana investor website: www.dana.com/investors. Phone registration
will be available beginning at 8:30 a.m. EST. A webcast replay can be accessed via Dana’s investor website following the call.
2
Non-GAAP Financial Information
Adjusted EBITDA is a non-GAAP financial measure which we have defined as net income (loss) before interest, income
taxes, depreciation, amortization, equity grant expense, restructuring expense, non-service cost components of pension and other postretirement benefit costs and other adjustments not related to our core
operations (gain/loss on debt extinguishment, pension settlements, divestitures, impairment, etc.). Adjusted EBITDA is a measure of our ability to maintain and continue to invest in our operations and provide shareholder returns. We use adjusted
EBITDA in assessing the effectiveness of our business strategies, evaluating and pricing potential acquisitions and as a factor in making incentive compensation decisions. In addition to its use by management, we also believe adjusted EBITDA is a
measure widely used by securities analysts, investors and others to evaluate financial performance of our company relative to other Tier 1 automotive suppliers. Adjusted EBITDA should not be considered a substitute for earnings (loss) before income
taxes, net income (loss) or other results reported in accordance with GAAP. Adjusted EBITDA may not be comparable to similarly titled measures reported by other companies.
Adjusted net income (loss) attributable to the parent company is a non-GAAP financial measure which we have defined
as net income (loss) attributable to the parent company, excluding any discrete income tax items, restructuring charges, amortization expense and other adjustments not related to our core operations (as used in adjusted EBITDA), net of any
associated income tax effects. This measure is considered useful for purposes of providing investors, analysts and other interested parties with an indicator of ongoing financial performance that provides enhanced comparability to net income (loss)
attributable to the parent company reported by other companies. Adjusted net income (loss) attributable to the parent company is neither intended to represent nor be an alternative measure to net income (loss) attributable to the parent company
reported in accordance with GAAP.
Diluted adjusted EPS is a non-GAAP financial measure which we have
defined as adjusted net income (loss) attributable to the parent company divided by adjusted diluted shares. We define adjusted diluted shares as diluted shares as determined in accordance with GAAP based on adjusted net income (loss) attributable
to the parent company. This measure is considered useful for purposes of providing investors, analysts and other interested parties with an indicator of ongoing financial performance that provides enhanced comparability to EPS reported by other
companies. Diluted adjusted EPS is neither intended to represent nor be an alternative measure to diluted EPS reported in accordance with GAAP
Adjusted free cash flow is a non-GAAP financial measure which we have defined as net cash provided by (used in)
operating activities less purchases of property, plant and equipment plus proceeds from sale of property, plant and equipment plus cash paid for Off-Highway business divestiture related activities. We believe
adjusted free cash flow is useful to investors in evaluating the operational cash flow of the company inclusive of the spending required to maintain the operations. Adjusted free cash flow is not intended to represent nor be an alternative to the
measure of net cash provided by (used in) operating activities reported in accordance with GAAP. Adjusted free cash flow may not be comparable to similarly titled measures reported by other companies.
Please reference the “Non-GAAP financial information” accompanying our quarterly earnings conference
call presentations on our website at www.dana.com/investors for reconciliations of adjusted EBITDA and free cash flow to the most directly comparable financial measures calculated and presented in accordance with GAAP. We have not provided a
reconciliation of our adjusted EBITDA outlook to the most comparable GAAP measures of net income. Providing net income (loss) guidance is potentially misleading and not practical given the difficulty of projecting event driven transactional and
other non-core operating items that are included in net income, including restructuring actions, asset impairments and income tax valuation adjustments. The reconciliations of these non-GAAP measures with the most comparable GAAP measures for the historical periods presented on our website are indicative of the reconciliations that will be prepared upon completion of the periods covered by the non-GAAP guidance.
3
Forward-Looking Statements
Certain statements and projections contained in this news release are, by their nature, forward-looking within the meaning of the Private Securities
Litigation Reform Act of 1995. These forward-looking statements are based on our current expectations, estimates, and projections about our industry and business, management’s beliefs, and certain assumptions made by us, all of which are
subject to change. Forward-looking statements can often be identified by words such as “anticipates,” “expects,” “intends,” “plans,” “predicts,” “believes,” “seeks,”
“estimates,” “may,” “will,” “should,” “would,” “could,” “potential,” “continue,” “ongoing,” and similar expressions, and variations or
negatives of these words. These forward-looking statements are not guarantees of future results and are subject to risks, uncertainties, and assumptions that could cause our actual results to differ materially and adversely from those expressed in
any forward-looking statement.
Dana’s Annual Report on Form 10-K, subsequent Quarterly Reports on
Form 10-Q, recent Current Reports on Form 8-K, and other Securities and Exchange Commission filings discuss important risk factors that could affect our business,
results of operations and financial condition. The forward-looking statements in this news release speak only as of this date. Dana does not undertake any obligation to revise or update publicly any forward-looking statement for any reason.
About Dana Incorporated
Dana
Incorporated (NYSE: DAN) is a global leader in the design and manufacture of highly efficient propulsion solutions for the light- and commercial-vehicle markets. Guided by its vision to be the
world’s best powertrain company, Dana delivers advanced conventional and clean-energy technologies that help customers improve the performance, efficiency, and durability of their vehicles.
The company supplies leading vehicle manufacturers and related aftermarkets with industry-defining drive systems, electrodynamic technologies, and thermal and sealing solutions.
Headquartered in Maumee, Ohio, USA, Dana reported sales of $7.5 billion in 2025. With a history dating to 1904, the company employs 27,000 people
in 24 countries across six continents. Learn more at dana.com.
###
Contact: Craig Barber
+1-419-887-5166
craig.barber@dana.com
4
DANA INCORPORATED
Reconciliation of Net Cash Provided By Operating Activities to Adjusted Free Cash Flow (Unaudited)
Three Months Ended
(In millions)
December 31,
2025
2024
Net cash provided by operating activities
$
406
$
302
Purchases of property, plant and equipment - Continuing operations
(61
)
(114
)
Purchases of property, plant and equipment - Discontinued operations
(23
)
(39
)
Proceeds from sale of property, plant and equipment - Continuing operations
1
4
Proceeds from sale of property, plant and equipment - Discontinued operations
1
—
Cash paid for Off-Highway business divestiture
related activities
14
—
Adjusted free cash flow
$
324
$
153
Year Ended
(In millions)
December 31,
2025
2024
Net cash provided by operating activities
$
512
$
450
Purchases of property, plant and equipment - Continuing operations
(214
)
(312
)
Purchases of property, plant and equipment - Discontinued operations
(56
)
(68
)
Proceeds from sale of property, plant and equipment - Continuing operations
13
7
Proceeds from sale of property, plant and equipment - Discontinued operations
1
4
Cash paid for Off-Highway business divestiture
related activities
75
—
Adjusted free cash flow
$
331
$
81
5
DANA INCORPORATED
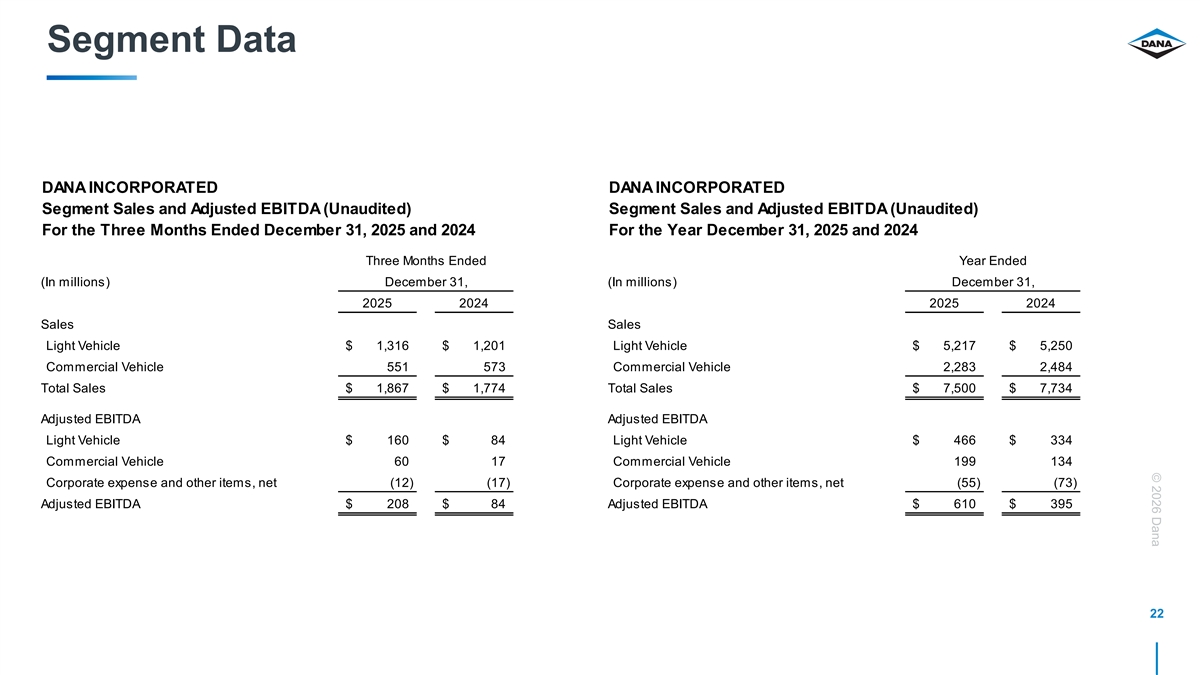
Segment Sales and Adjusted EBITDA (Unaudited)
For the Three Months Ended December 31, 2025 and 2024
Three Months Ended
(In millions)
December 31,
2025
2024
Sales
Light Vehicle
$
1,316
$
1,201
Commercial Vehicle
551
573
Total Sales
$
1,867
$
1,774
Adjusted EBITDA
Light Vehicle
$
160
$
84
Commercial Vehicle
60
17
Corporate expense and other items, net
(12
)
(17
)
Adjusted EBITDA
$
208
$
84
6
DANA INCORPORATED
Segment Sales and Adjusted EBITDA (Unaudited)
For the Year December 31, 2025 and 2024
Year Ended
(In millions)
December 31,
2025
2024
Sales
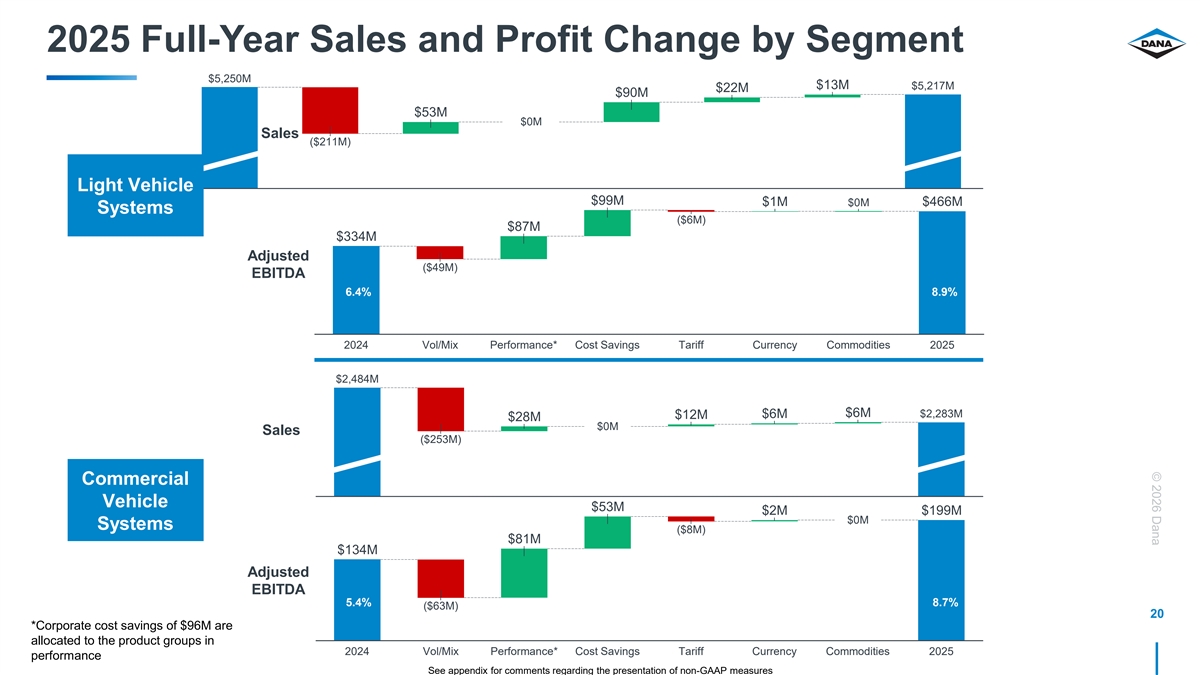
Light Vehicle
$
5,217
$
5,250
Commercial Vehicle
2,283
2,484
Total Sales
$
7,500
$
7,734
Adjusted EBITDA
Light Vehicle
$
466
$
334
Commercial Vehicle
199
134
Corporate expense and other items, net
(55
)
(73
)
Adjusted EBITDA
$
610
$
395
7
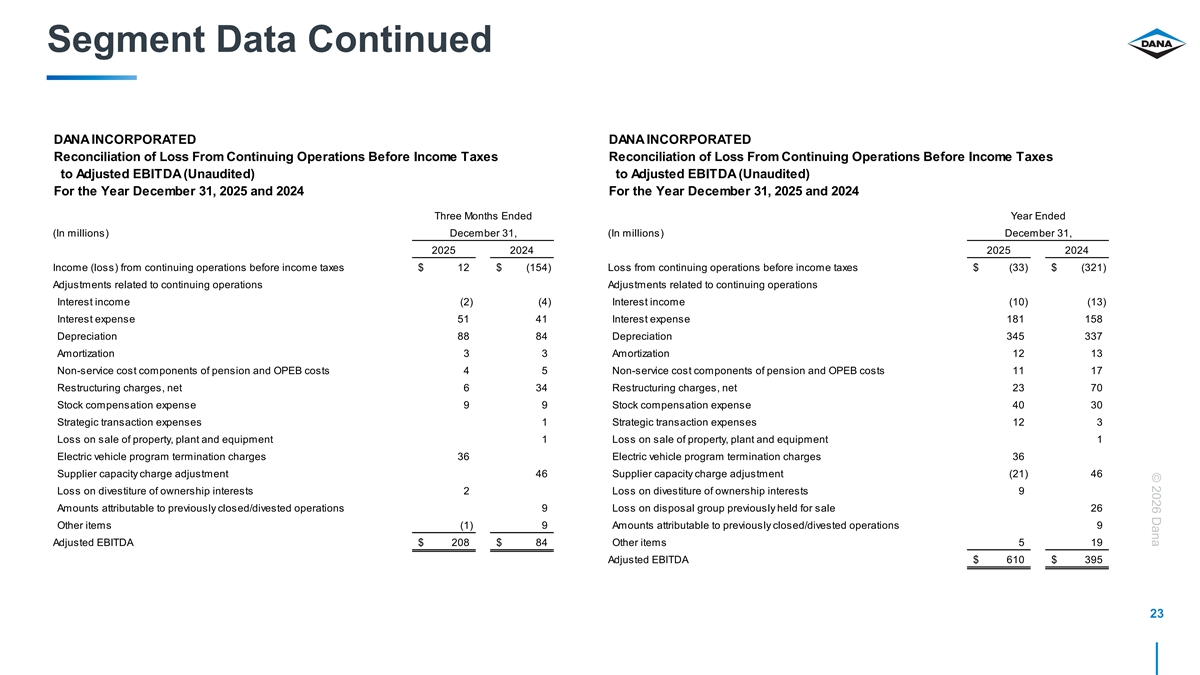
DANA INCORPORATED
Reconciliation of Loss From Continuing Operations Before Income Taxes to Adjusted EBITDA (Unaudited)
For the Year December 31, 2025 and 2024
Three Months Ended
(In millions)
December 31,
2025
2024
Income (loss) from continuing operations before income taxes
$
12
$
(154
)
Adjustments related to continuing operations
Interest income
(2
)
(4
)
Interest expense
51
41
Depreciation
88
84
Amortization
3
3
Non-service cost components of pension and OPEB
costs
4
5
Restructuring charges, net
6
34
Stock compensation expense
9
9
Strategic transaction expenses
1
Loss on sale of property, plant and equipment
1
Electric vehicle program termination charges
36
Supplier capacity charge adjustment
46
Loss on divestiture of ownership interests
2
Amounts attributable to previously closed/divested operations
9
Other items
(1
)
9
Adjusted EBITDA
$
208
$
84
8
DANA INCORPORATED
Reconciliation of Loss From Continuing Operations Before Income Taxes to Adjusted EBITDA (Unaudited)
For the Year December 31, 2025 and 2024
Year Ended
(In millions)
December 31,
2025
2024
Loss from continuing operations before income taxes
$
(33
)
$
(321
)
Adjustments related to continuing operations
Interest income
(10
)
(13
)
Interest expense
181
158
Depreciation
345
337
Amortization
12
13
Non-service cost components of pension and OPEB
costs
11
17
Restructuring charges, net
23
70
Stock compensation expense
40
30
Strategic transaction expenses
12
3
Loss on sale of property, plant and equipment
1
Electric vehicle program termination charges
36
Supplier capacity charge adjustment
(21
)
46
Loss on divestiture of ownership interests
9
Loss on disposal group previously held for sale
26
Amounts attributable to previously closed/divested operations
9
Other items
5
19
Adjusted EBITDA
$
610
$
395
9
2025 Fourth-Quarter & Full-Year Earnings Conference Call February
18, 2026