1 INDUSTRIALS CONFERENCE March 17, 2026
Statements made in this presentation that are not historical facts, including statements regarding our estimates, expectations, beliefs, intentions, projections, goals, aspirations, commitments or strategies for the future, should be considered “forward - looking statements” under the Securities Act of 1933, as amended, the Securities Exchange Act of 1934, as amended, and the Private Securities Litigation Reform Act of 1995. Such statements are not guarantees or promised outcomes and should not be construed as such. All forward - looking statements involve a number of risks and uncertainties that could cause actual results to differ materially from the estimates, expectations, beliefs, intentions, projections, goals, aspirations, commitments and strategies reflected in or suggested by the forward - looking statements. These risks and uncertainties include, but are not limited to, the possible effects of serious accidents involving our aircraft or aircraft of our airline partners; breaches or lapses in the security of technology systems we use and rely on, which could compromise the data stored within them, as well as failure to comply with evolving global privacy and security regulatory obligations or adequately address increasing customer focus on privacy issues and data security; disruptions in our information technology infrastructure; failure of the technology we use or depend on to perform effectively, including new and emerging technologies; increases in the price of aircraft fuel; extended disruptions in the supply of aircraft fuel, including from Monroe Energy, LLC (“Monroe”), our wholly - owned subsidiary that operates the Trainer refinery; failure to achieve expected results or returns from our commercial relationships with airlines in other parts of the world and the investments we have in certain of those airlines; the effects of a significant disruption in the operations or performance of third parties on which we rely; failure to comply with the financial or other covenants in our financing agreements; labor - related disruptions; the effects on our business of seasonality and other factors beyond our control, such as changes in value in our equity investments, severe weather conditions, natural disasters or other environmental events, including from the impact of climate change; failure or inability of insurance to cover a significant liability at Monroe’s refinery; failure to comply with existing and future environmental regulations to which Monroe’s refinery operations are subject, including those relating to the discharge of materials into the environment, waste management, pollution prevention measures and greenhouse gas emissions; significant damage to our reputation and brand, including from exposure to significant adverse publicity or inability to achieve certain sustainability goals; our ability to retain senior management and other key employees, and to maintain our company culture; disease outbreaks or other public health threats, and measures implemented to combat them; the effects of terrorist attacks, geopolitical conflict or security events; competitive conditions in the airline industry; extended interruptions or disruptions in service at major airports where we operate; significant problems associated with types of aircraft or engines we operate; the effects of extensive regulatory and legal compliance requirements we are subject to; the impact of laws and regulations governing environmental protection, including but not limited to regulation of hazardous substances, increased regulation to reduce emissions and other risks associated with climate change, and the cost of compliance with more stringent environmental regulations; and unfavorable economic or political conditions in the markets in which we operate or volatility in currency exchange rates. Additional information concerning risks and uncertainties that could cause differences between actual results and forward - looking statements is contained in our Securities and Exchange Commission (SEC) filings, including our Annual Report on Form 10 - K for the fiscal year ended December 31, 2025 and other filings filed with the SEC from time to time. Caution should be taken not to place undue reliance on our forward - looking statements, which represent our views only as of the date of this presentation, and which we undertake no obligation to update except to the extent required by law. 2 Safe Harbor
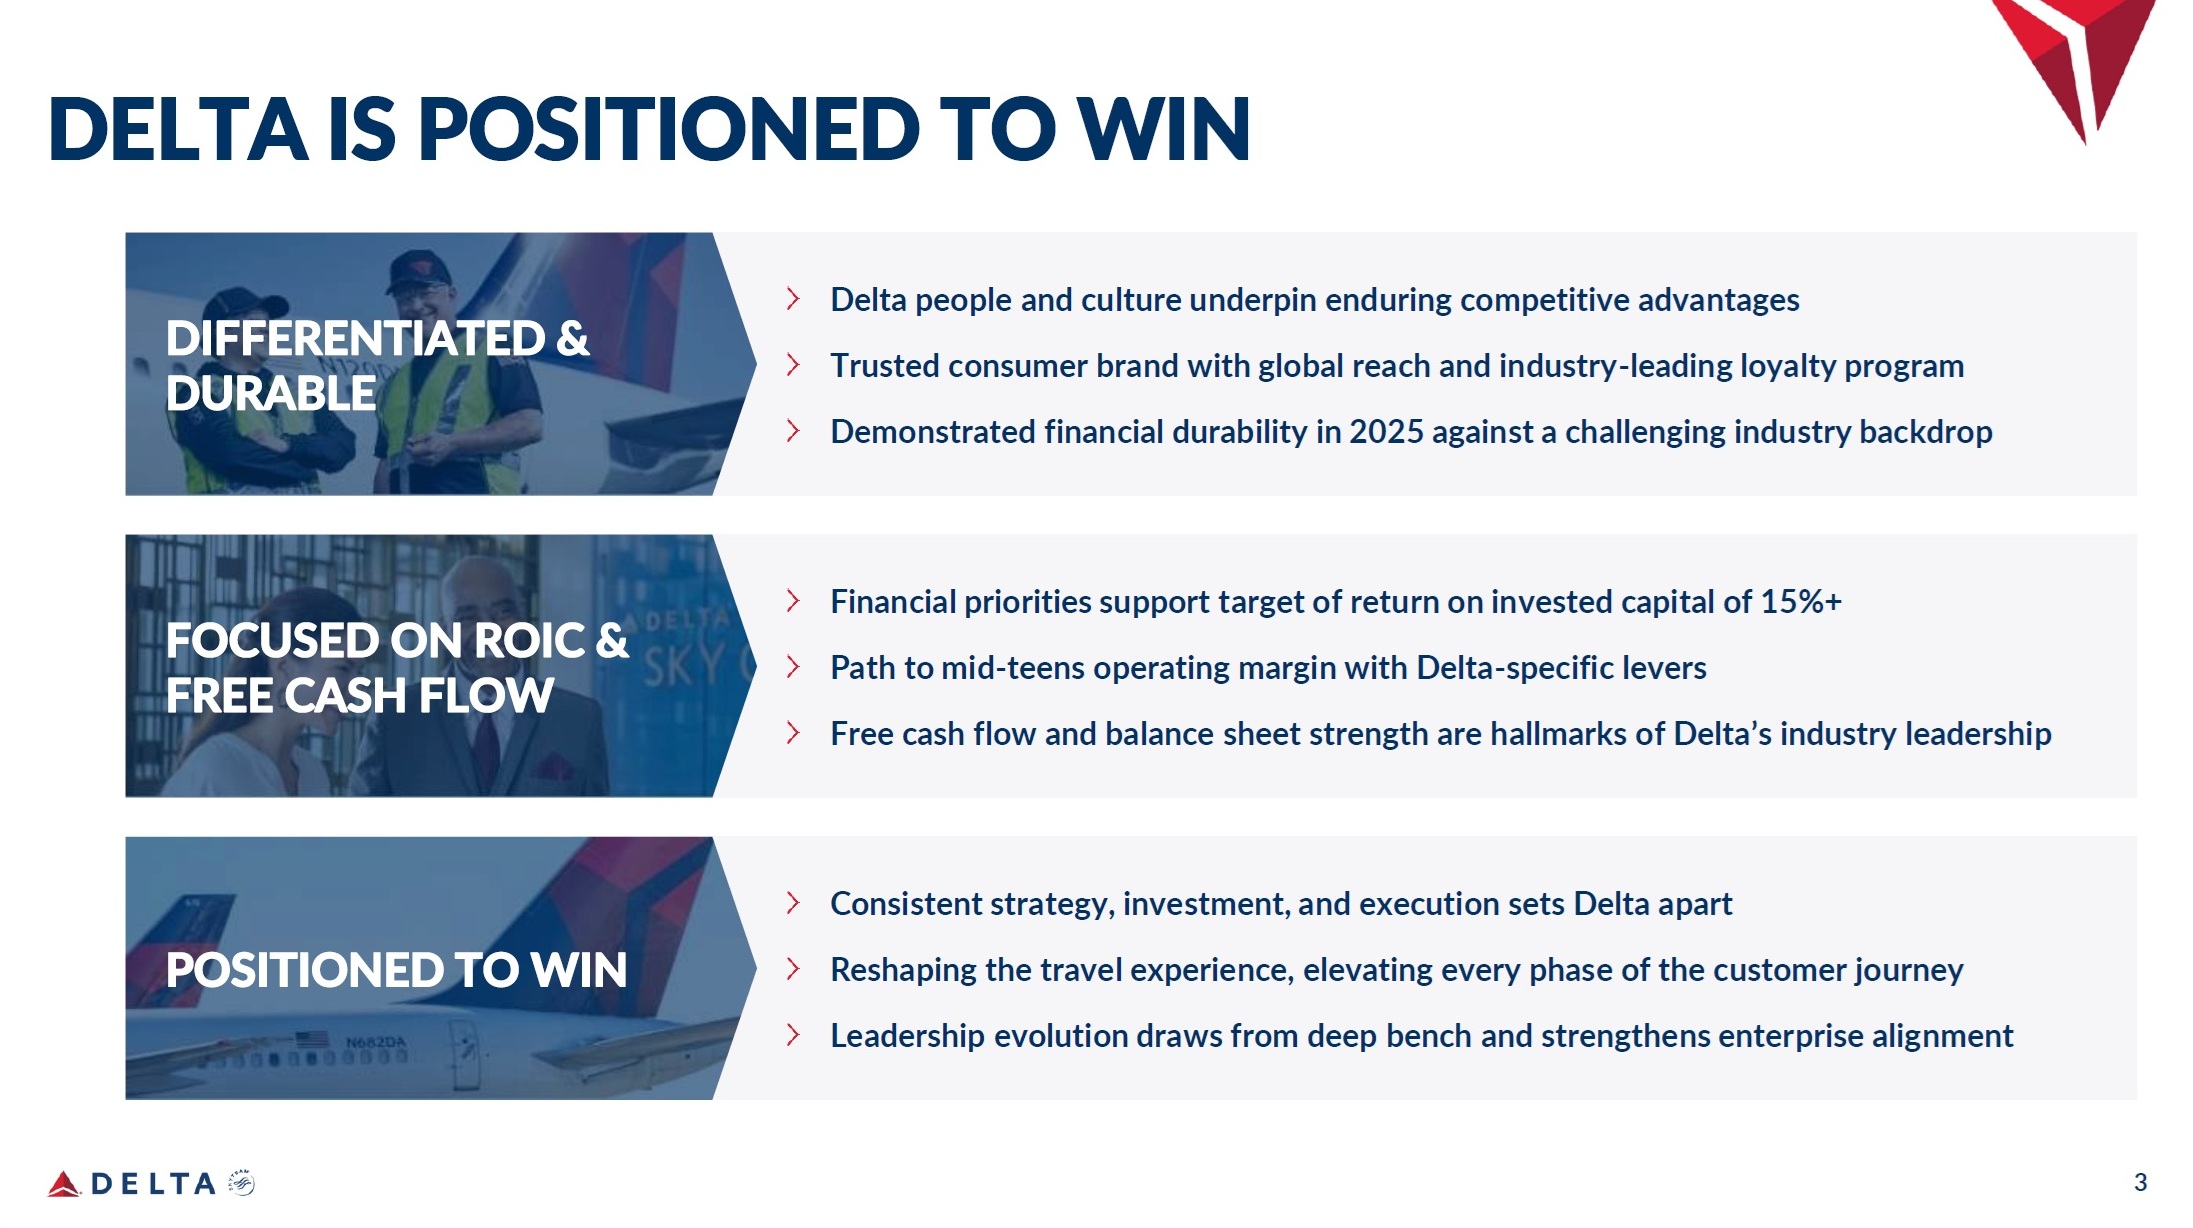
3 Consistent strategy, investment, and execution sets Delta apart Reshaping the travel experience, elevating every phase of the customer journey Leadership evolution draws from deep bench and strengthens enterprise alignment Financial priorities support target of return on invested capital of 15%+ Path to mid - teens operating margin with Delta - specific levers Free cash flow and balance sheet strength are hallmarks of Delta’s industry leadership Delta people and culture underpin enduring competitive advantages Trusted consumer brand with global reach and industry - leading loyalty program Demonstrated financial durability in 2025 against a challenging industry backdrop DELTA IS POSITIONED TO WIN
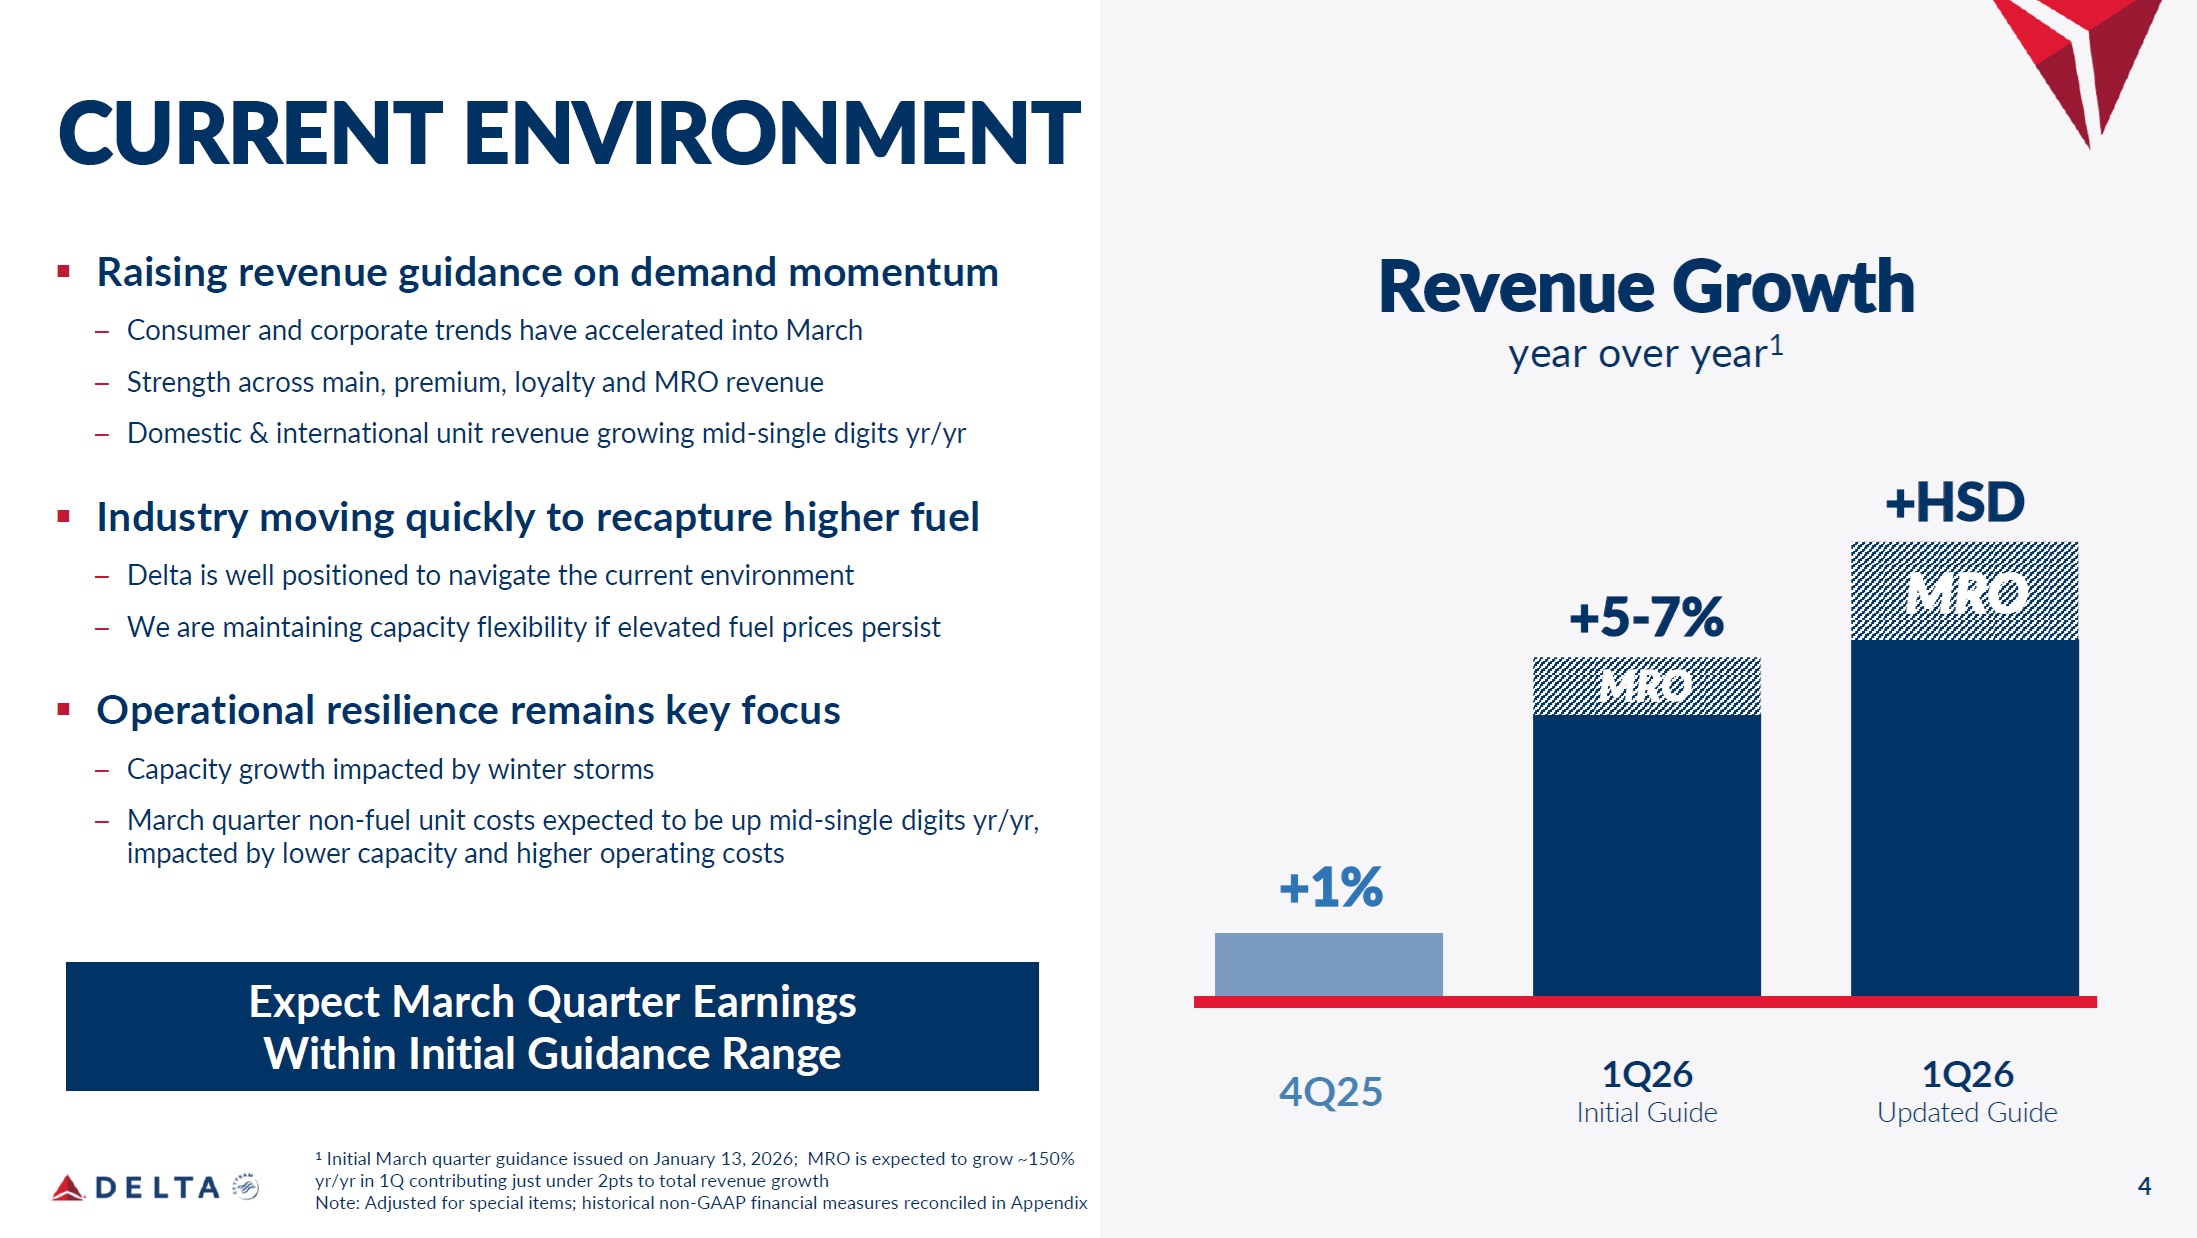
4 CURRENT ENVIRONMENT ▪ Raising revenue guidance on demand momentum – Consumer and corporate trends have accelerated into March – Strength across main, premium, loyalty and MRO revenue – Domestic & international unit revenue growing mid - single digits yr/yr ▪ Industry moving quickly to recapture higher fuel – Delta is well positioned to navigate the current environment – We are maintaining capacity flexibility if elevated fuel prices persist ▪ Operational resilience remains key focus – Capacity growth impacted by winter storms – March quarter non - fuel unit costs expected to be up mid - single digits yr/yr, impacted by lower capacity and higher operating costs Revenue Growth year over year 1 1 Initial March quarter guidance issued on January 13, 2026; MRO is expected to grow ~150% yr/yr in 1Q contributing just under 2pts to total revenue growth Note: Adjusted for special items; historical non - GAAP financial measures reconciled in Appendix 4Q25 1Q26 Initial Guide +1% +5 - 7% 1Q26 Updated Guide +HSD MRO Expect March Quarter Earnings Within Initial Guidance Range MRO
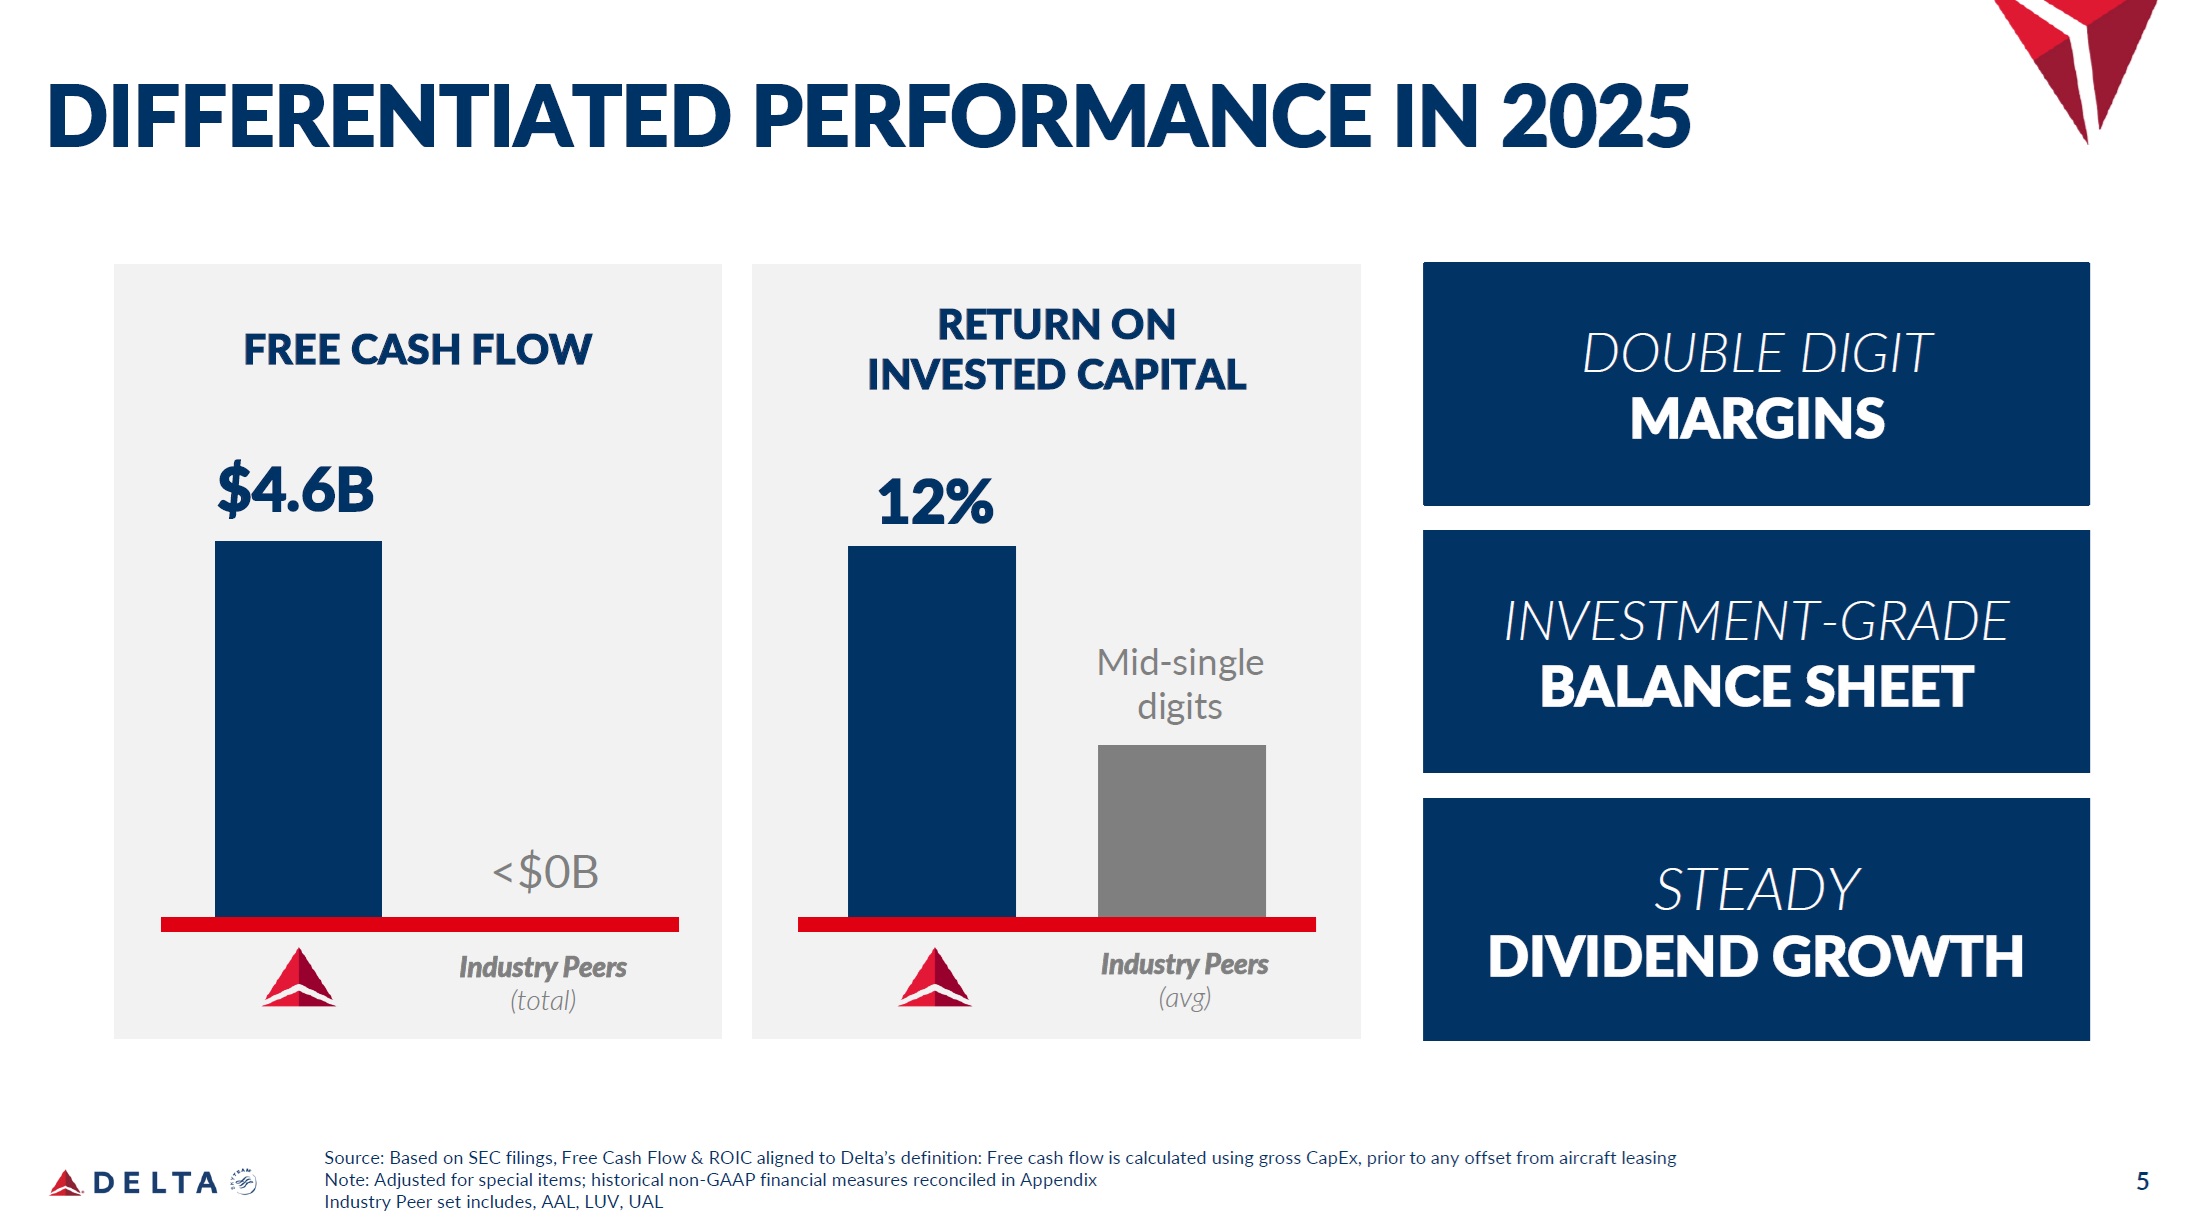
5 DIFFERENTIATED PERFORMANCE IN 2025 FREE CASH FLOW $4.6B <$0B Industry Peers (total) RETURN ON INVESTED CAPITAL 12% Mid - single digits Industry Peers (avg) Source: Based on SEC filings, Free Cash Flow & ROIC aligned to Delta’s definition: Free cash flow is calculated using gross CapEx, prior to any offset from aircraft leasing Note: Adjusted for special items; historical non - GAAP financial measures reconciled in Appendix Industry Peer set includes, AAL, LUV, UAL INVESTMENT - GRADE BALANCE SHEET DOUBLE DIGIT MARGINS STEADY DIVIDEND GROWTH
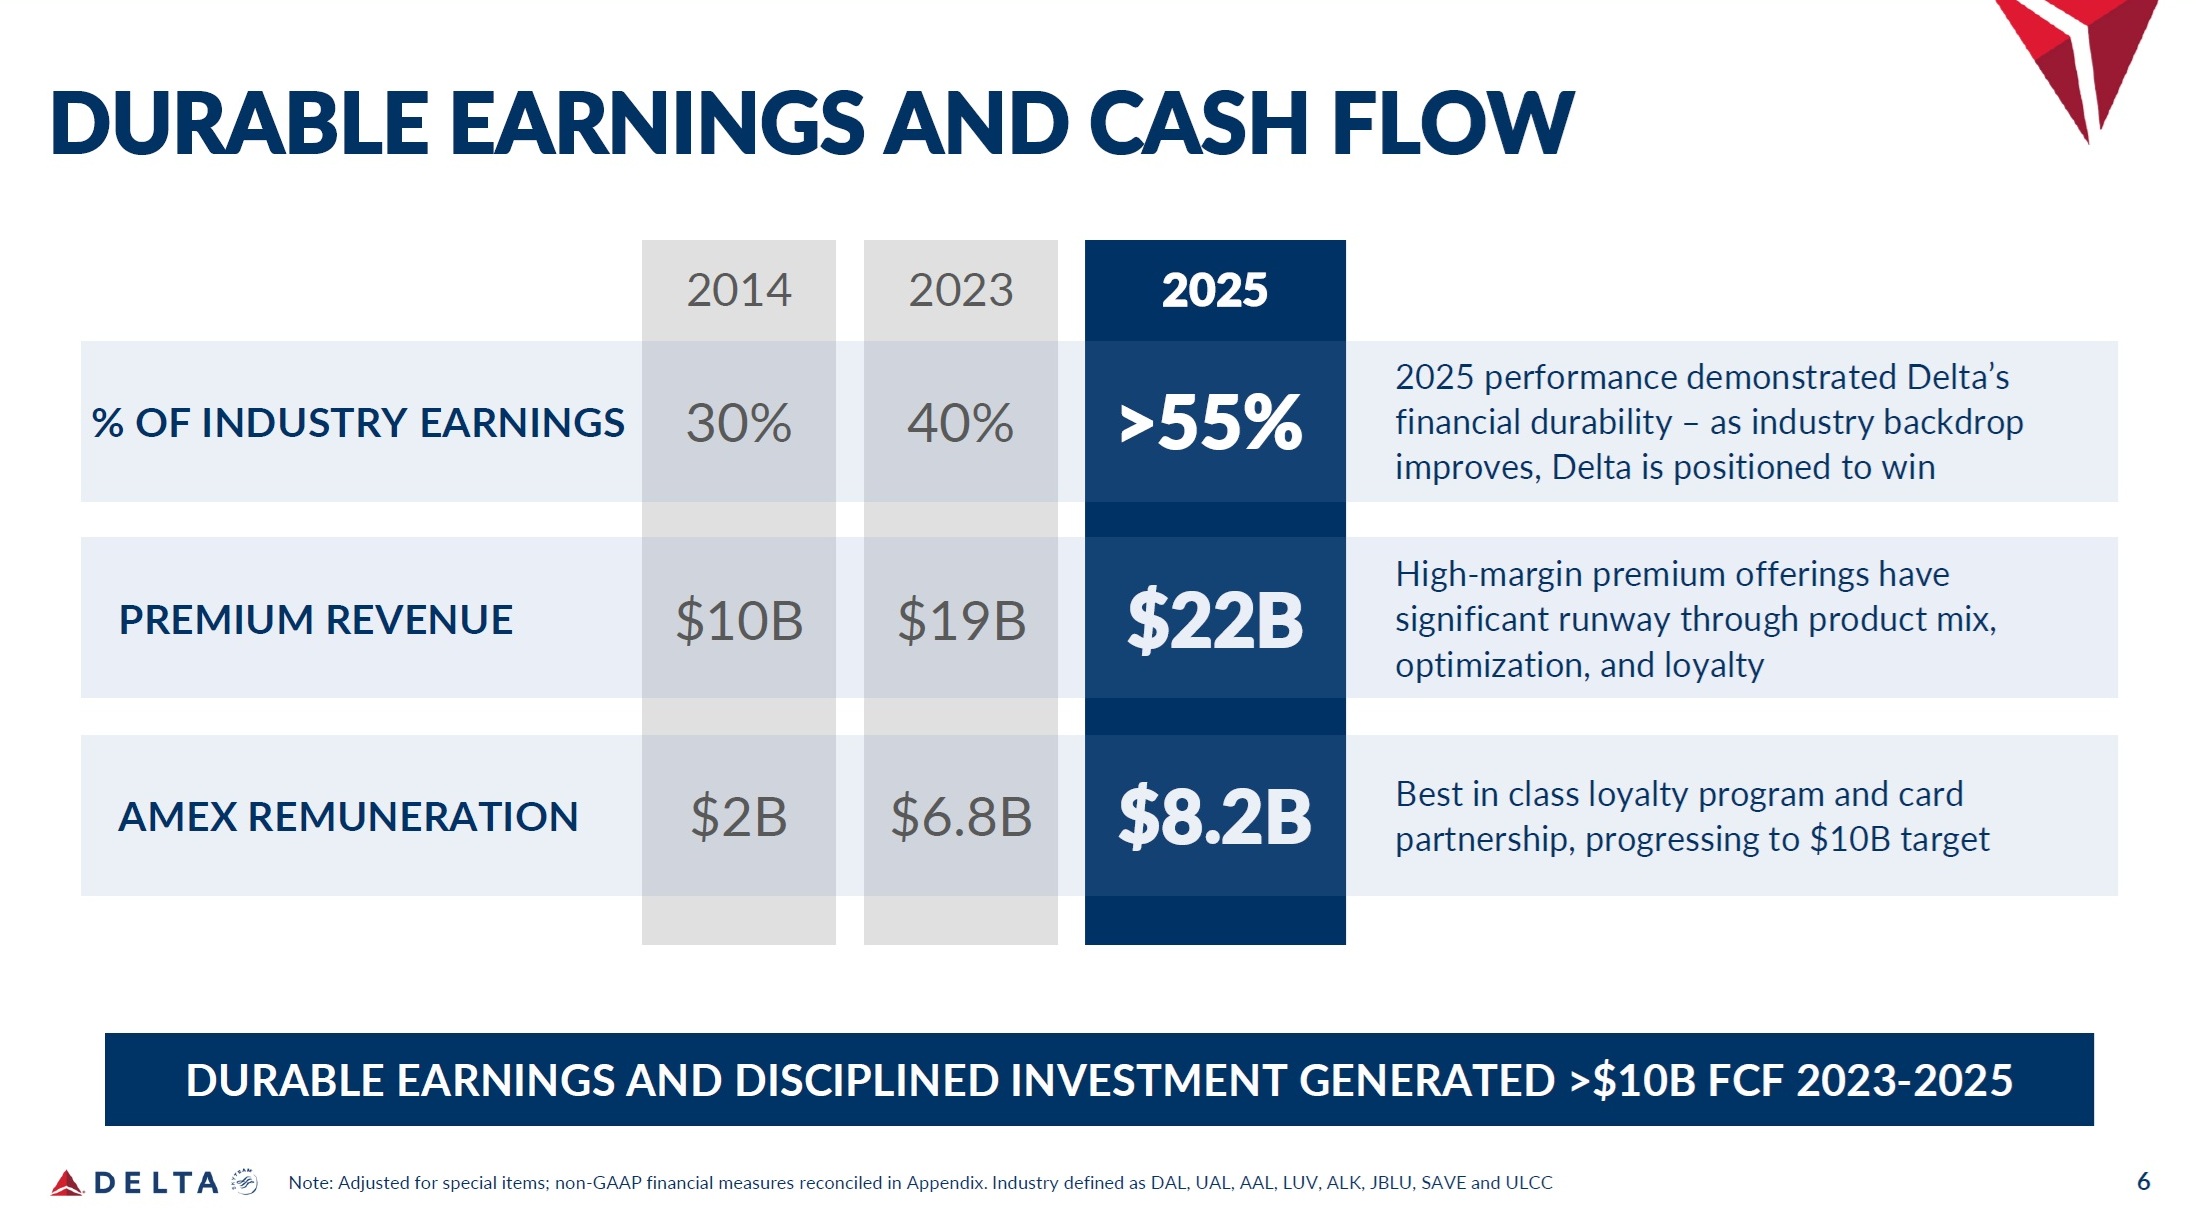
6 DURABLE EARNINGS AND CASH FLOW Note: Adjusted for special items; non - GAAP financial measures reconciled in Appendix. Industry defined as DAL, UAL, AAL, LUV, ALK, JBLU, SAVE and ULCC 2014 2025 $22B 2023 $10B High - margin premium offerings have significant runway through product mix, optimization, and loyalty PREMIUM REVENUE $19B $8.2B Best in class loyalty program and card partnership, progressing to $10B target AMEX REMUNERATION $2B $6.8B 2025 performance demonstrated Delta’s financial durability – as industry backdrop improves, Delta is positioned to win % OF INDUSTRY EARNINGS 30% 40% >55% DURABLE EARNINGS AND DISCIPLINED INVESTMENT GENERATED >$10B FCF 2023 - 2025
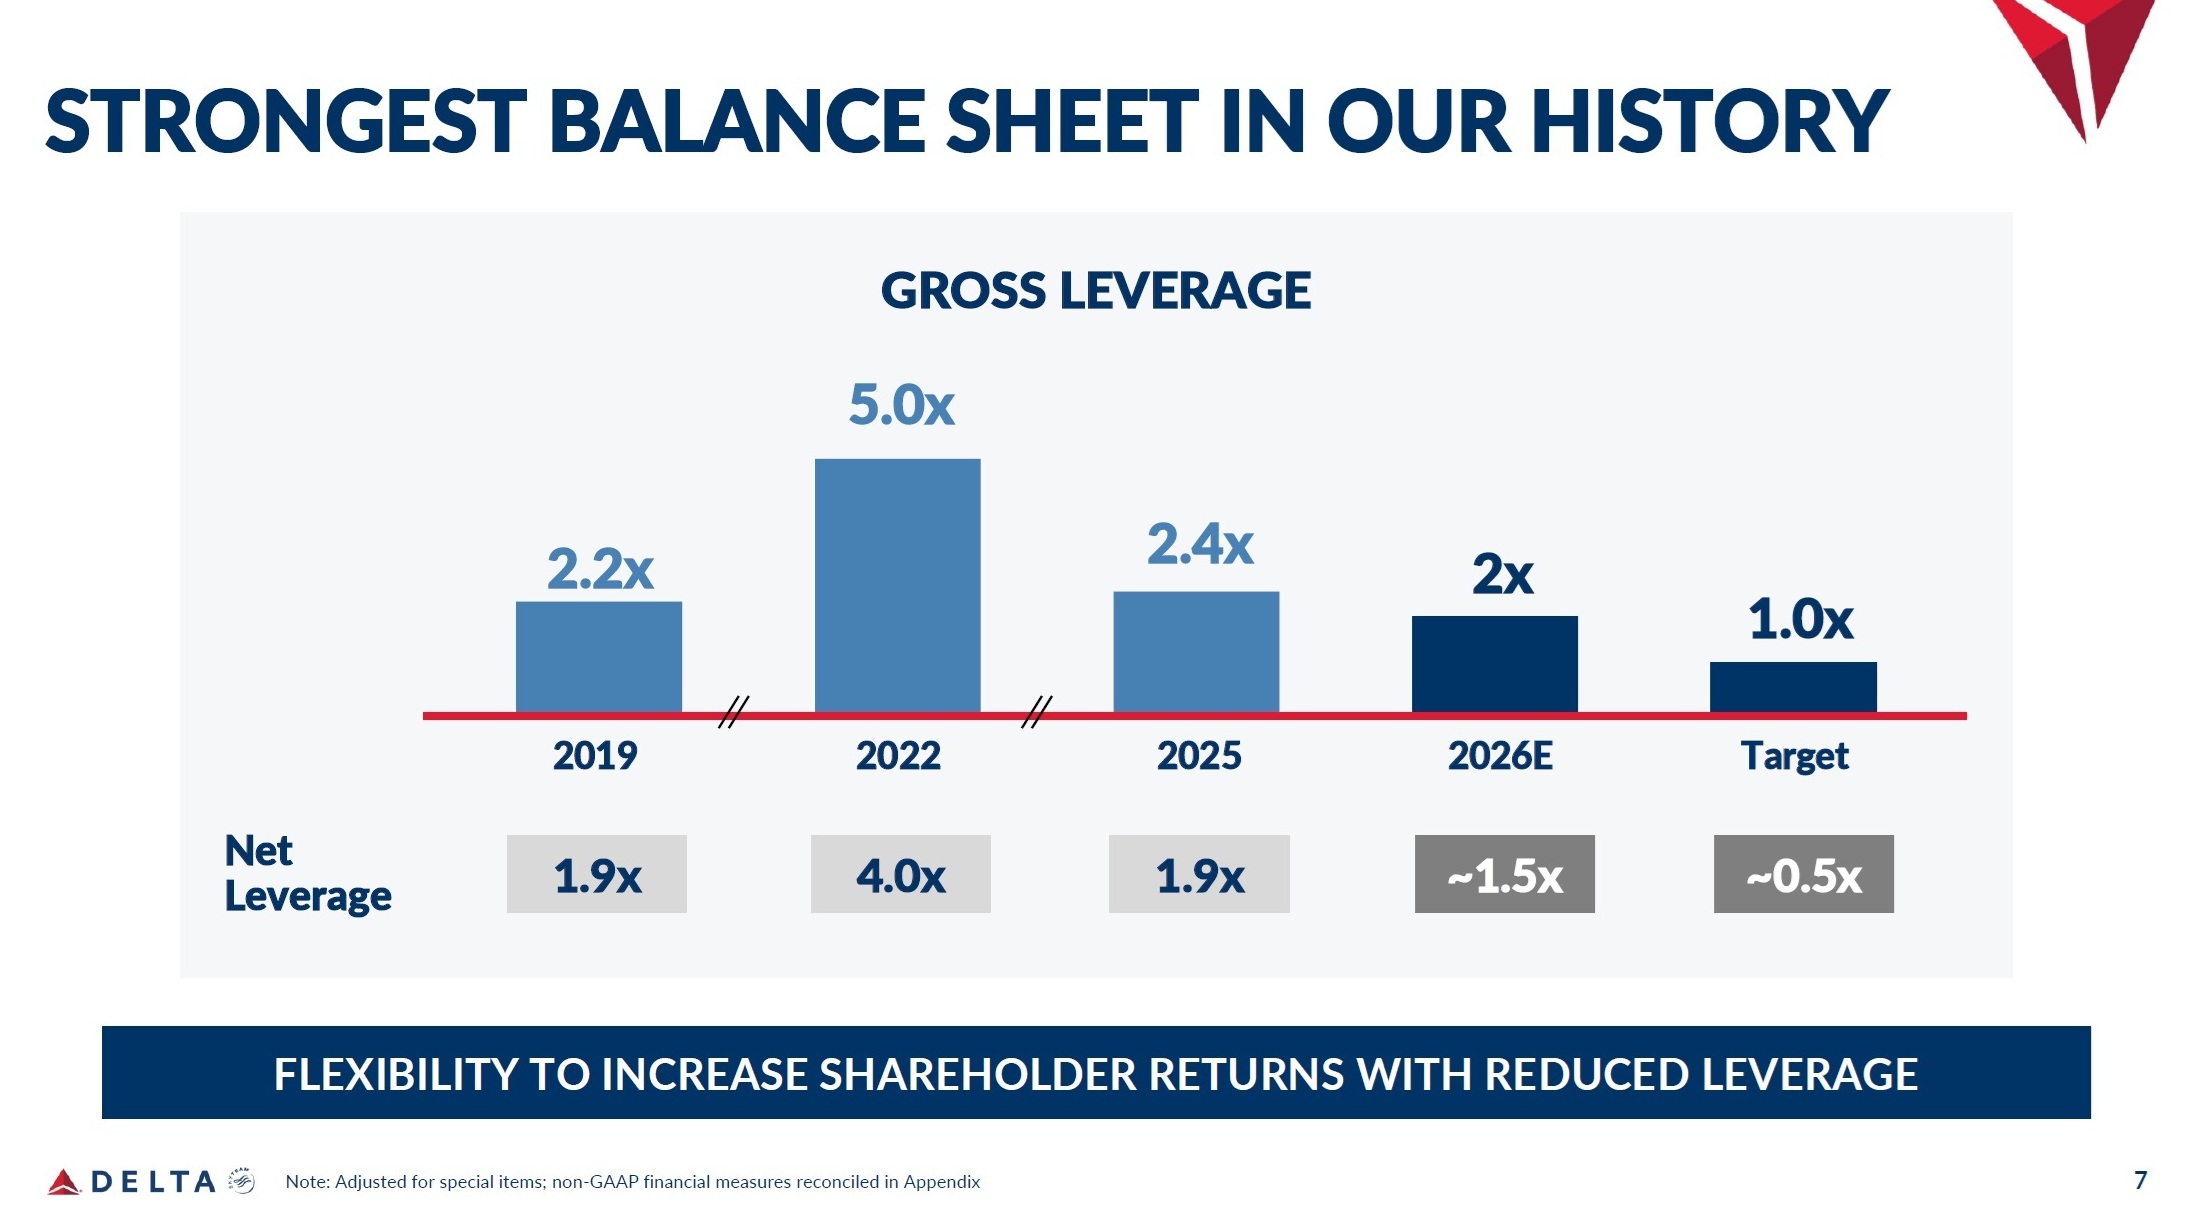
7 STRONGEST BALANCE SHEET IN OUR HISTORY Note: Adjusted for special items; non - GAAP financial measures reconciled in Appendix FLEXIBILITY TO INCREASE SHAREHOLDER RETURNS WITH REDUCED LEVERAGE Net Leverage 1.9x 1.9x ~1.5x 2019 2022 2025 2026E Target 2.4x 1.0x 2x ~0.5x 2.2x 4.0x GROSS LEVERAGE 5.0x

8 Q&A
Delta sometimes uses information ("non - GAAP financial measures") that is derived from the Consolidated Financial Statements, but that is not presented in accordance with accounting principles generally accepted in the U.S. (“GAAP”). Under the U.S. Securities and Exchange Commission rules, non - GAAP financial measures may be considered in addition to results prepared in accordance with GAAP, but should not be considered a substitute for or superior to GAAP results. The tables below shows reconciliations of the non - GAAP financial measures used in this presentation to the most directly comparable GAAP financial measures. The reconciliations may not calculate exactly due to rounding. Delta is not able to reconcile certain forward looking non - GAAP financial measures used in this presentation without unreasonable effort because the adjusting items such as those used in the reconciliations below will not be known until the end of the indicated future periods and could be significant. Adjustments . The following reconciliations include certain adjustments to GAAP measures that are made to provide comparability between the reported periods, if applicable, and for the reasons indicated below: Third - party refinery sales . Refinery sales to third parties, and related expenses, are not related to our airline segment. Excluding these sales therefore provides a more meaningful comparison of our airline operations to the rest of the airline industry. Aircraft fuel and related taxes . The volatility in fuel prices impacts the comparability of year - over - year financial performance. The adjustment for aircraft fuel and related taxes allows investors to better understand and analyze our non - fuel costs and year - over - year financial performance. MRO expense . We adjust for MRO expenses because this adjustment allows investors to better understand and analyze our recurring cost performance and provides a more meaningful comparison of our core operating costs to the airline industry. Profit sharing . We adjust for profit sharing because this adjustment allows investors to better understand and analyze our recurring cost performance and provides a more meaningful comparison of our core operating costs to the airline industry. MTM adjustments and settlements on hedges . Mark - to - market ("MTM") adjustments are defined as fair value changes recorded in periods other than the settlement period. MTM fair value changes are not necessarily indicative of the actual settlement value of the underlying hedge in the contract settlement period. Settlements represent cash received or paid on hedge contracts settled during the applicable period. Restructuring charges . During 2020, we recorded restructuring charges for items such as fleet impairments and voluntary early retirement and separation programs following strategic business decisions in response to the COVID - 19 pandemic. During 2022, we recognized adjustments to certain of those restructuring charges, representing changes in our estimates. 9 NON - GAAP Financial Measures
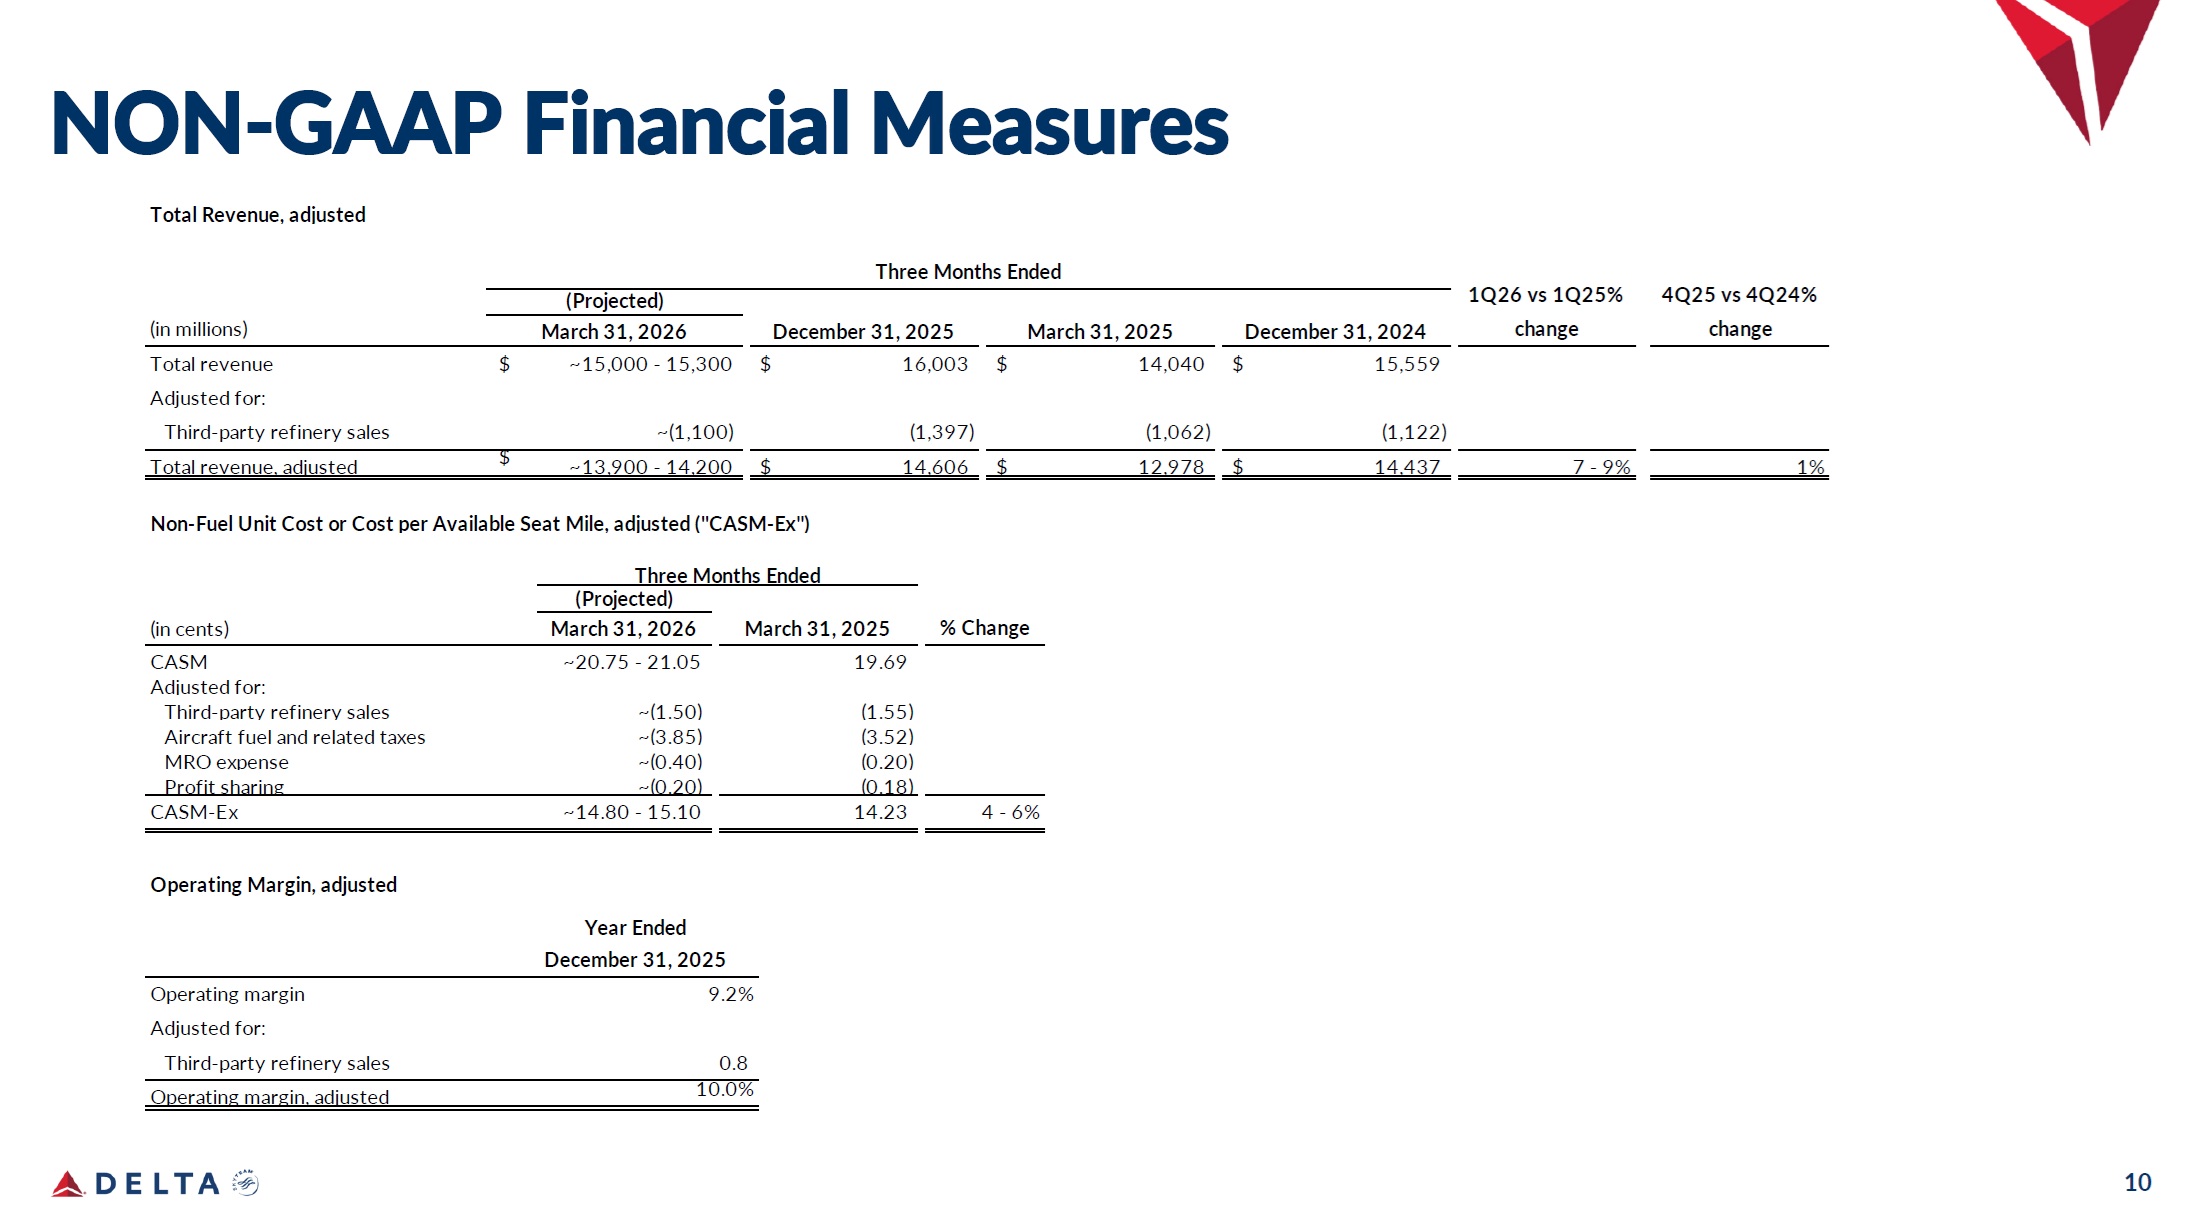
10 NON - GAAP Financial Measures Total Revenue, adjusted (in millions) December 31, 2024 15,559 $ 14,040 $ 16,003 $ $ ~15,000 - 15,300 (1,122) (1,062) (1,397) ~(1,100) $ Total revenue, adjusted ~13,900 - 14,200 $ 14,606 $ 12,978 $ 14,437 7 - 9% 1% Total revenue Adjusted for: Third - party refinery sales March 31, 2026 (Projected) Three Months Ended December 31, 2025 March 31, 2025 1Q26 vs 1Q25% change 4Q25 vs 4Q24% change Non - Fuel Unit Cost or Cost per Available Seat Mile, adjusted ("CASM - Ex") Three Months Ended (Projected) % Change March 31, 2025 March 31, 2026 (in cents) 19.69 (1.55) ~20.75 - 21.05 ~(1.50) CASM Adjusted for: Third - party refinery sales (3.52) ~(3.85) Aircraft fuel and related taxes (0.20) ~(0.40) MRO expense (0.18) ~(0.20) Profit sharing 4 - 6% 14.23 ~14.80 - 15.10 CASM - Ex Operating Margin, adjusted Year Ended December 31, 2025 Operating margin Adjusted for: Third - party refinery sales 9.2% 0.8 10.0% Operating margin, adjusted
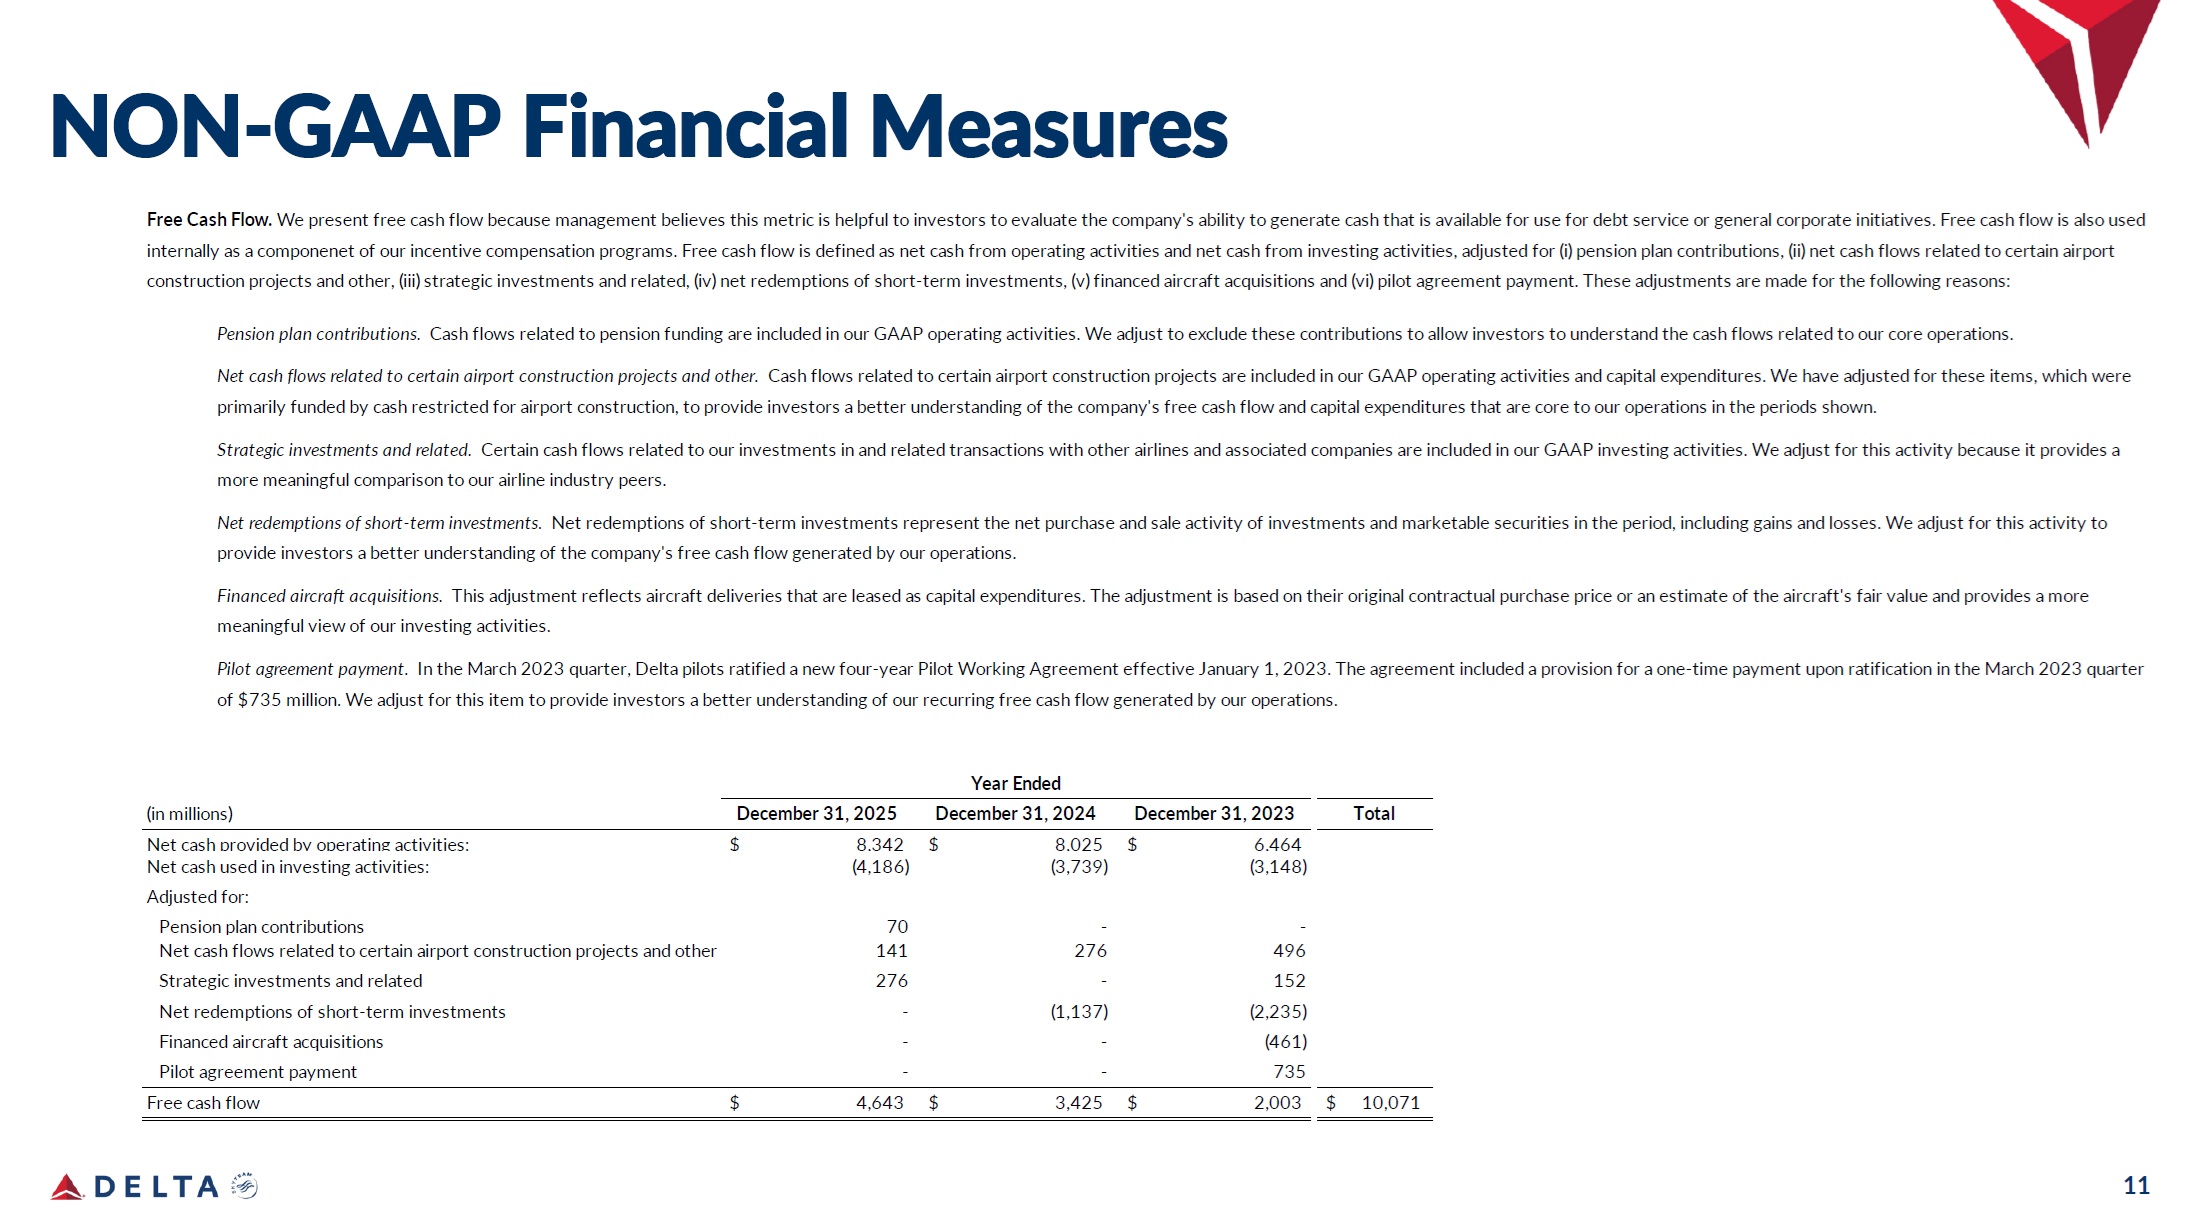
11 NON - GAAP Financial Measures (in millions) December 31, 2025 December 31, 2024 December 31, 2023 Total 6,464 $ 8,025 $ 8,342 $ Net cash provided by operating activities: (3,148) (3,739) (4,186) Net cash used in investing activities: Adjusted for: - - 70 Pension plan contributions 496 276 141 Net cash flows related to certain airport construction projects and other 152 - 276 Strategic investments and related (2,235) (1,137) - Net redemptions of short - term investments (461) - - Financed aircraft acquisitions 735 - - Pilot agreement payment 10,071 2,003 $ $ 3,425 $ 4,643 $ Free cash flow Year Ended Free Cash Flow. We present free cash flow because management believes this metric is helpful to investors to evaluate the company's ability to generate cash that is available for use for debt service or general corporate initiatives. Free cash flow is also used internally as a componenet of our incentive compensation programs. Free cash flow is defined as net cash from operating activities and net cash from investing activities, adjusted for (i) pension plan contributions, (ii) net cash flows related to certain airport construction projects and other, (iii) strategic investments and related, (iv) net redemptions of short - term investments, (v) financed aircraft acquisitions and (vi) pilot agreement payment. These adjustments are made for the following reasons: Pension plan contributions. Cash flows related to pension funding are included in our GAAP operating activities. We adjust to exclude these contributions to allow investors to understand the cash flows related to our core operations. Net cash flows related to certain airport construction projects and other. Cash flows related to certain airport construction projects are included in our GAAP operating activities and capital expenditures. We have adjusted for these items, which were primarily funded by cash restricted for airport construction, to provide investors a better understanding of the company's free cash flow and capital expenditures that are core to our operations in the periods shown. Strategic investments and related. Certain cash flows related to our investments in and related transactions with other airlines and associated companies are included in our GAAP investing activities. We adjust for this activity because it provides a more meaningful comparison to our airline industry peers. Net redemptions of short - term investments. Net redemptions of short - term investments represent the net purchase and sale activity of investments and marketable securities in the period, including gains and losses. We adjust for this activity to provide investors a better understanding of the company's free cash flow generated by our operations. Financed aircraft acquisitions. This adjustment reflects aircraft deliveries that are leased as capital expenditures. The adjustment is based on their original contractual purchase price or an estimate of the aircraft's fair value and provides a more meaningful view of our investing activities. Pilot agreement payment. In the March 2023 quarter, Delta pilots ratified a new four - year Pilot Working Agreement effective January 1, 2023. The agreement included a provision for a one - time payment upon ratification in the March 2023 quarter of $735 million. We adjust for this item to provide investors a better understanding of our recurring free cash flow generated by our operations.
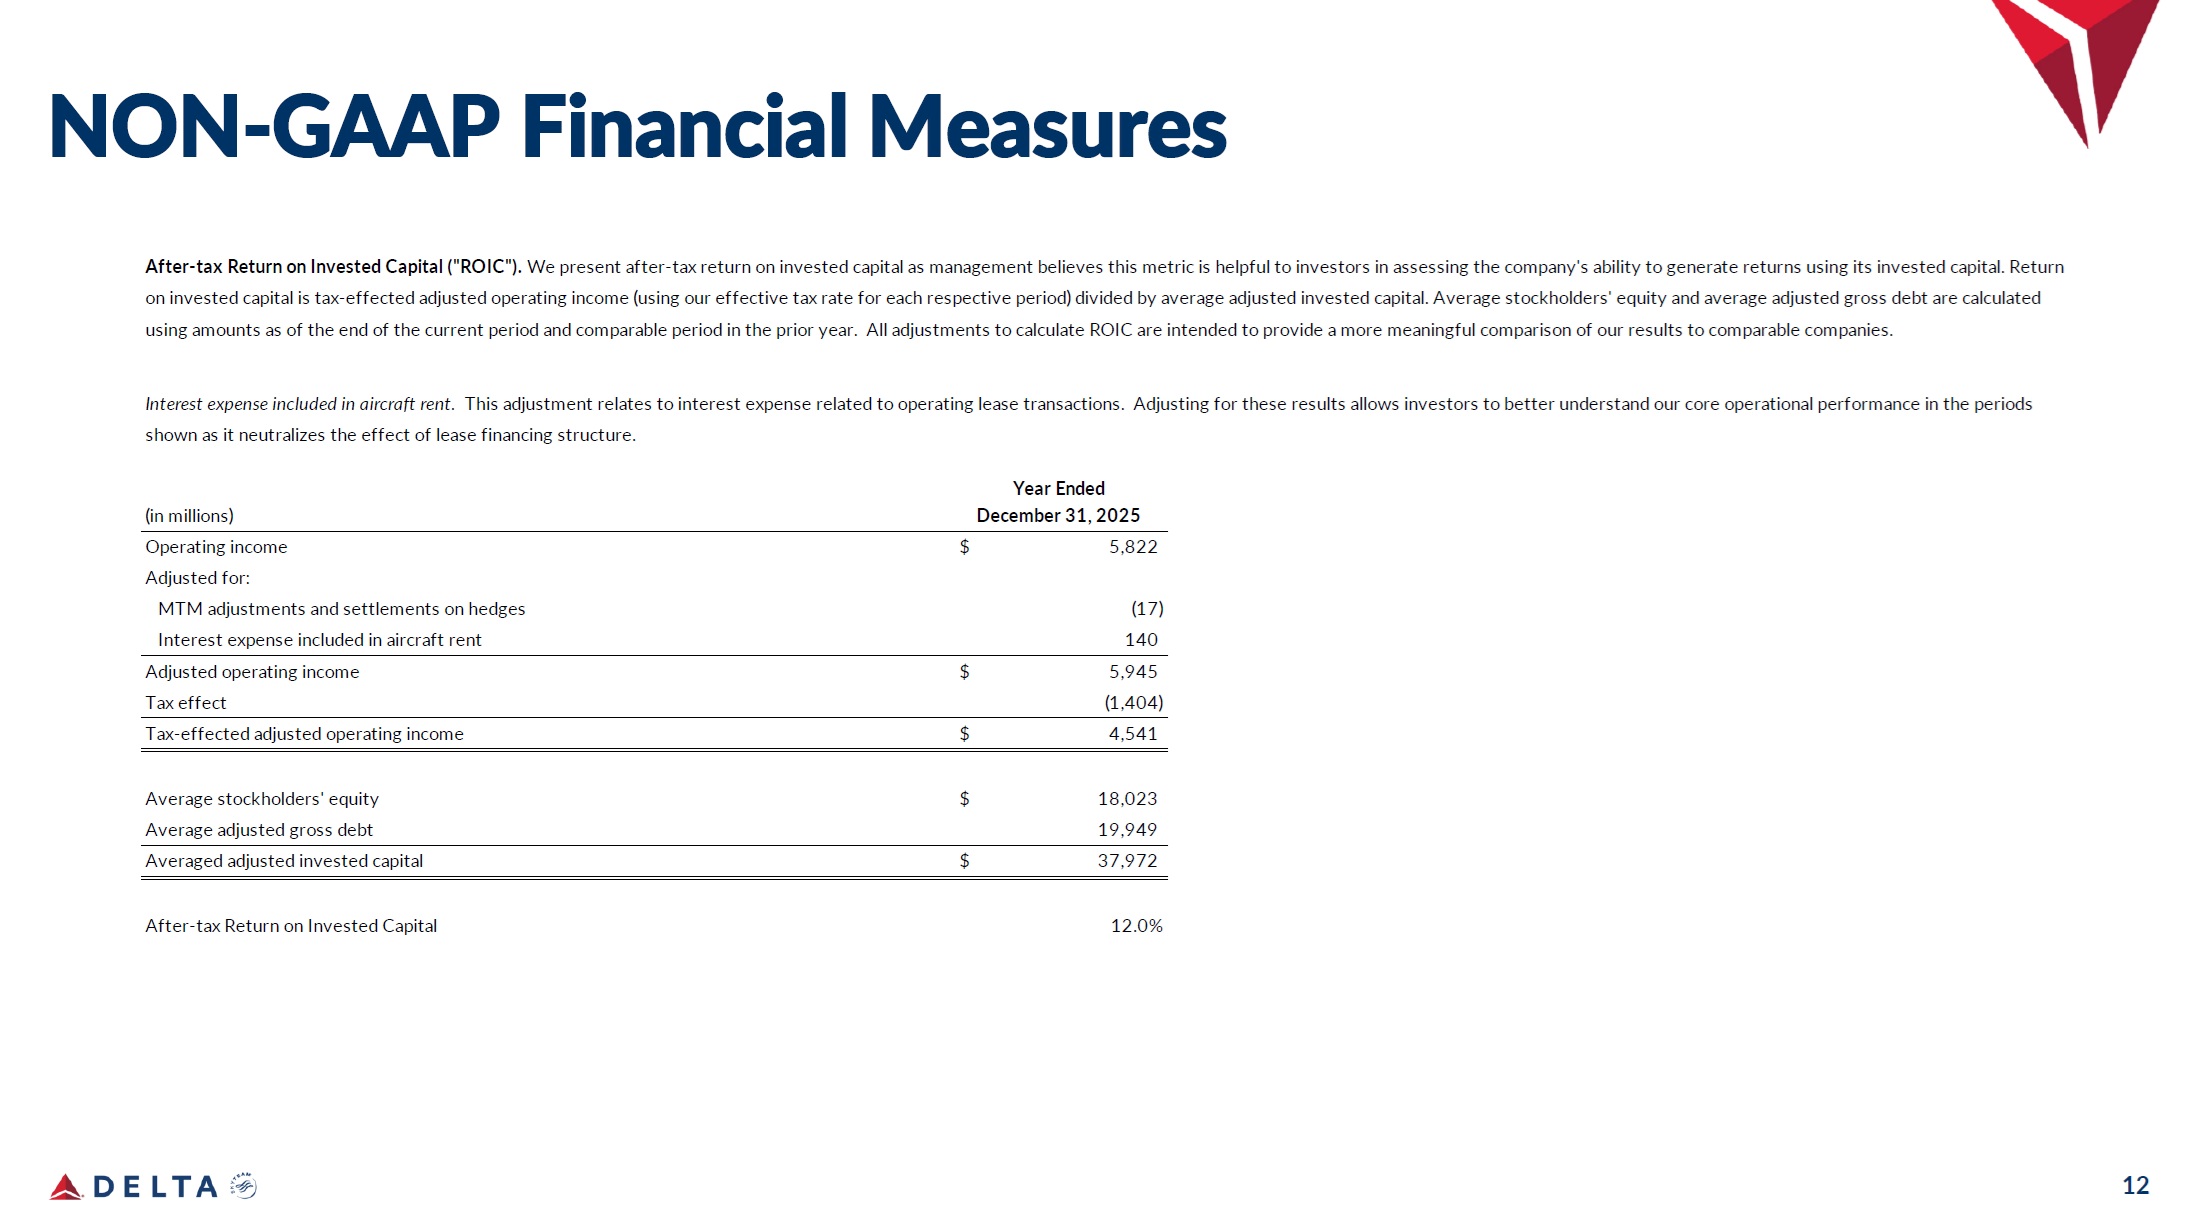
12 NON - GAAP Financial Measures Year Ended December 31, 2025 (in millions) 5,822 (17) $ Operating income Adjusted for: MTM adjustments and settlements on hedges 140 Interest expense included in aircraft rent 5,945 $ Adjusted operating income (1,404) Tax effect 4,541 $ Tax - effected adjusted operating income 18,023 $ Average stockholders' equity 19,949 Average adjusted gross debt 37,972 $ Averaged adjusted invested capital 12.0% After - tax Return on Invested Capital After - tax Return on Invested Capital ("ROIC"). We present after - tax return on invested capital as management believes this metric is helpful to investors in assessing the company's ability to generate returns using its invested capital. Return on invested capital is tax - effected adjusted operating income (using our effective tax rate for each respective period) divided by average adjusted invested capital. Average stockholders' equity and average adjusted gross debt are calculated using amounts as of the end of the current period and comparable period in the prior year. All adjustments to calculate ROIC are intended to provide a more meaningful comparison of our results to comparable companies. Interest expense included in aircraft rent. This adjustment relates to interest expense related to operating lease transactions. Adjusting for these results allows investors to better understand our core operational performance in the periods shown as it neutralizes the effect of lease financing structure.
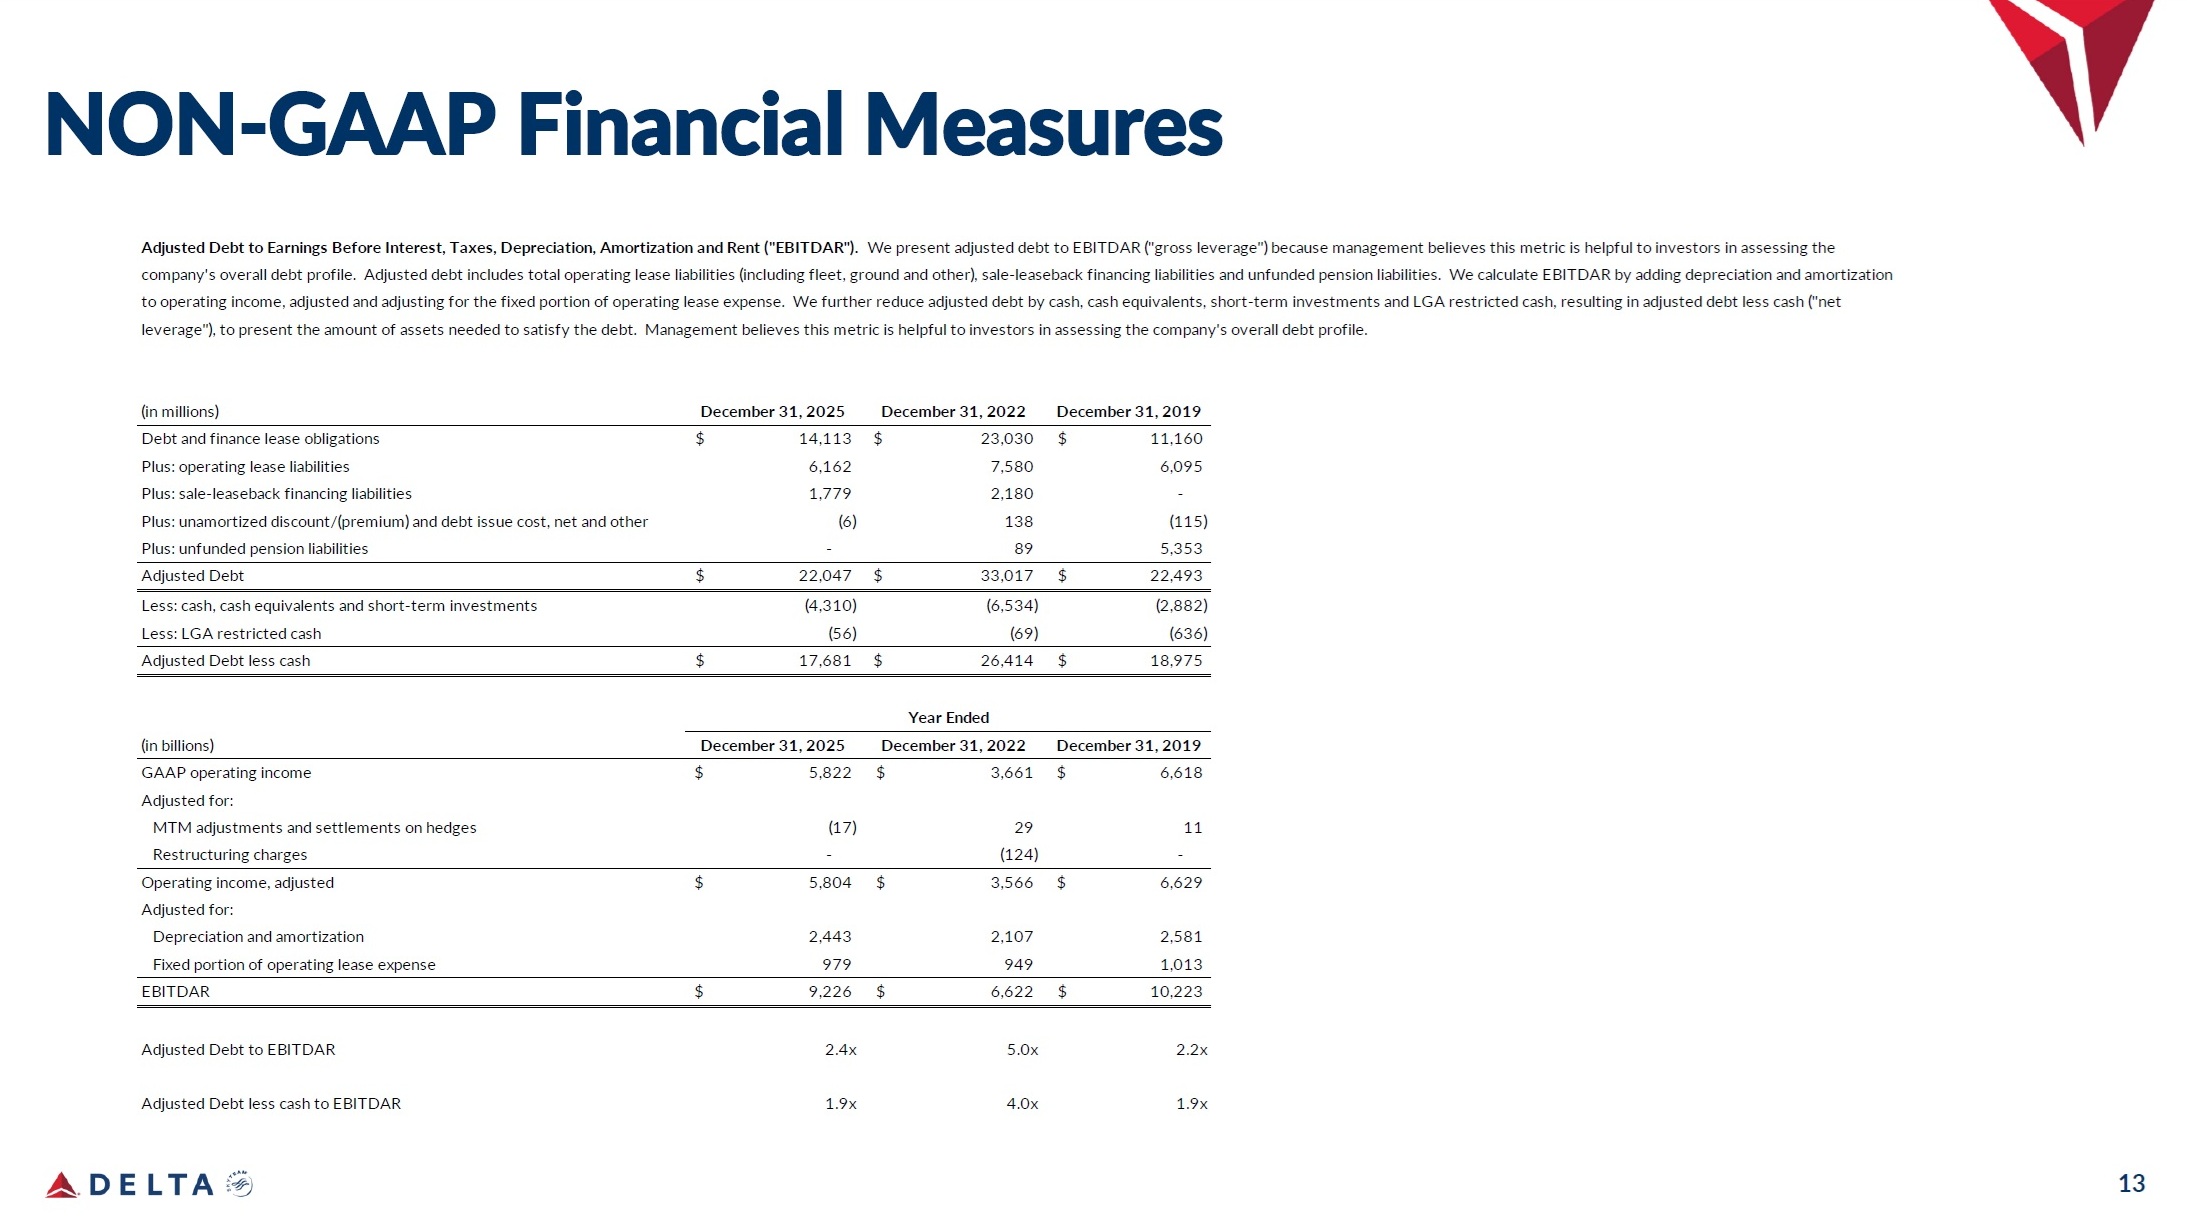
13 NON - GAAP Financial Measures (in millions) December 31, 2025 December 31, 2022 December 31, 2019 $ 11,160 23,030 $ $ 14,113 Debt and finance lease obligations 6,095 7,580 6,162 Plus: operating lease liabilities - 2,180 1,779 Plus: sale - leaseback financing liabilities (115) 138 (6) Plus: unamortized discount/(premium) and debt issue cost, net and other 5,353 89 - Plus: unfunded pension liabilities $ 22,493 33,017 $ $ 22,047 Adjusted Debt (2,882) (6,534) (4,310) Less: cash, cash equivalents and short - term investments (636) (69) (56) Less: LGA restricted cash $ 18,975 26,414 $ $ 17,681 Adjusted Debt less cash (in billions) December 31, 2025 December 31, 2022 December 31, 2019 $ 6,618 11 3,661 29 $ 5,822 (17) GAAP operating income $ Adjusted for: MTM adjustments and settlements on hedges - (124) - Restructuring charges $ 6,629 2,581 3,566 2,107 $ 5,804 2,443 $ Operating income, adjusted Adjusted for: Depreciation and amortization 1,013 949 979 Fixed portion of operating lease expense $ 10,223 6,622 $ 9,226 $ EBITDAR 2.2x 5.0x 2.4x Adjusted Debt to EBITDAR 1.9x 4.0x 1.9x Adjusted Debt less cash to EBITDAR Adjusted Debt to Earnings Before Interest, Taxes, Depreciation, Amortization and Rent ("EBITDAR"). We present adjusted debt to EBITDAR ("gross leverage") because management believes this metric is helpful to investors in assessing the company's overall debt profile. Adjusted debt includes total operating lease liabilities (including fleet, ground and other), sale - leaseback financing liabilities and unfunded pension liabilities. We calculate EBITDAR by adding depreciation and amortization to operating income, adjusted and adjusting for the fixed portion of operating lease expense. We further reduce adjusted debt by cash, cash equivalents, short - term investments and LGA restricted cash, resulting in adjusted debt less cash ("net leverage"), to present the amount of assets needed to satisfy the debt. Management believes this metric is helpful to investors in assessing the company's overall debt profile. Year Ended

14 APPENDIX
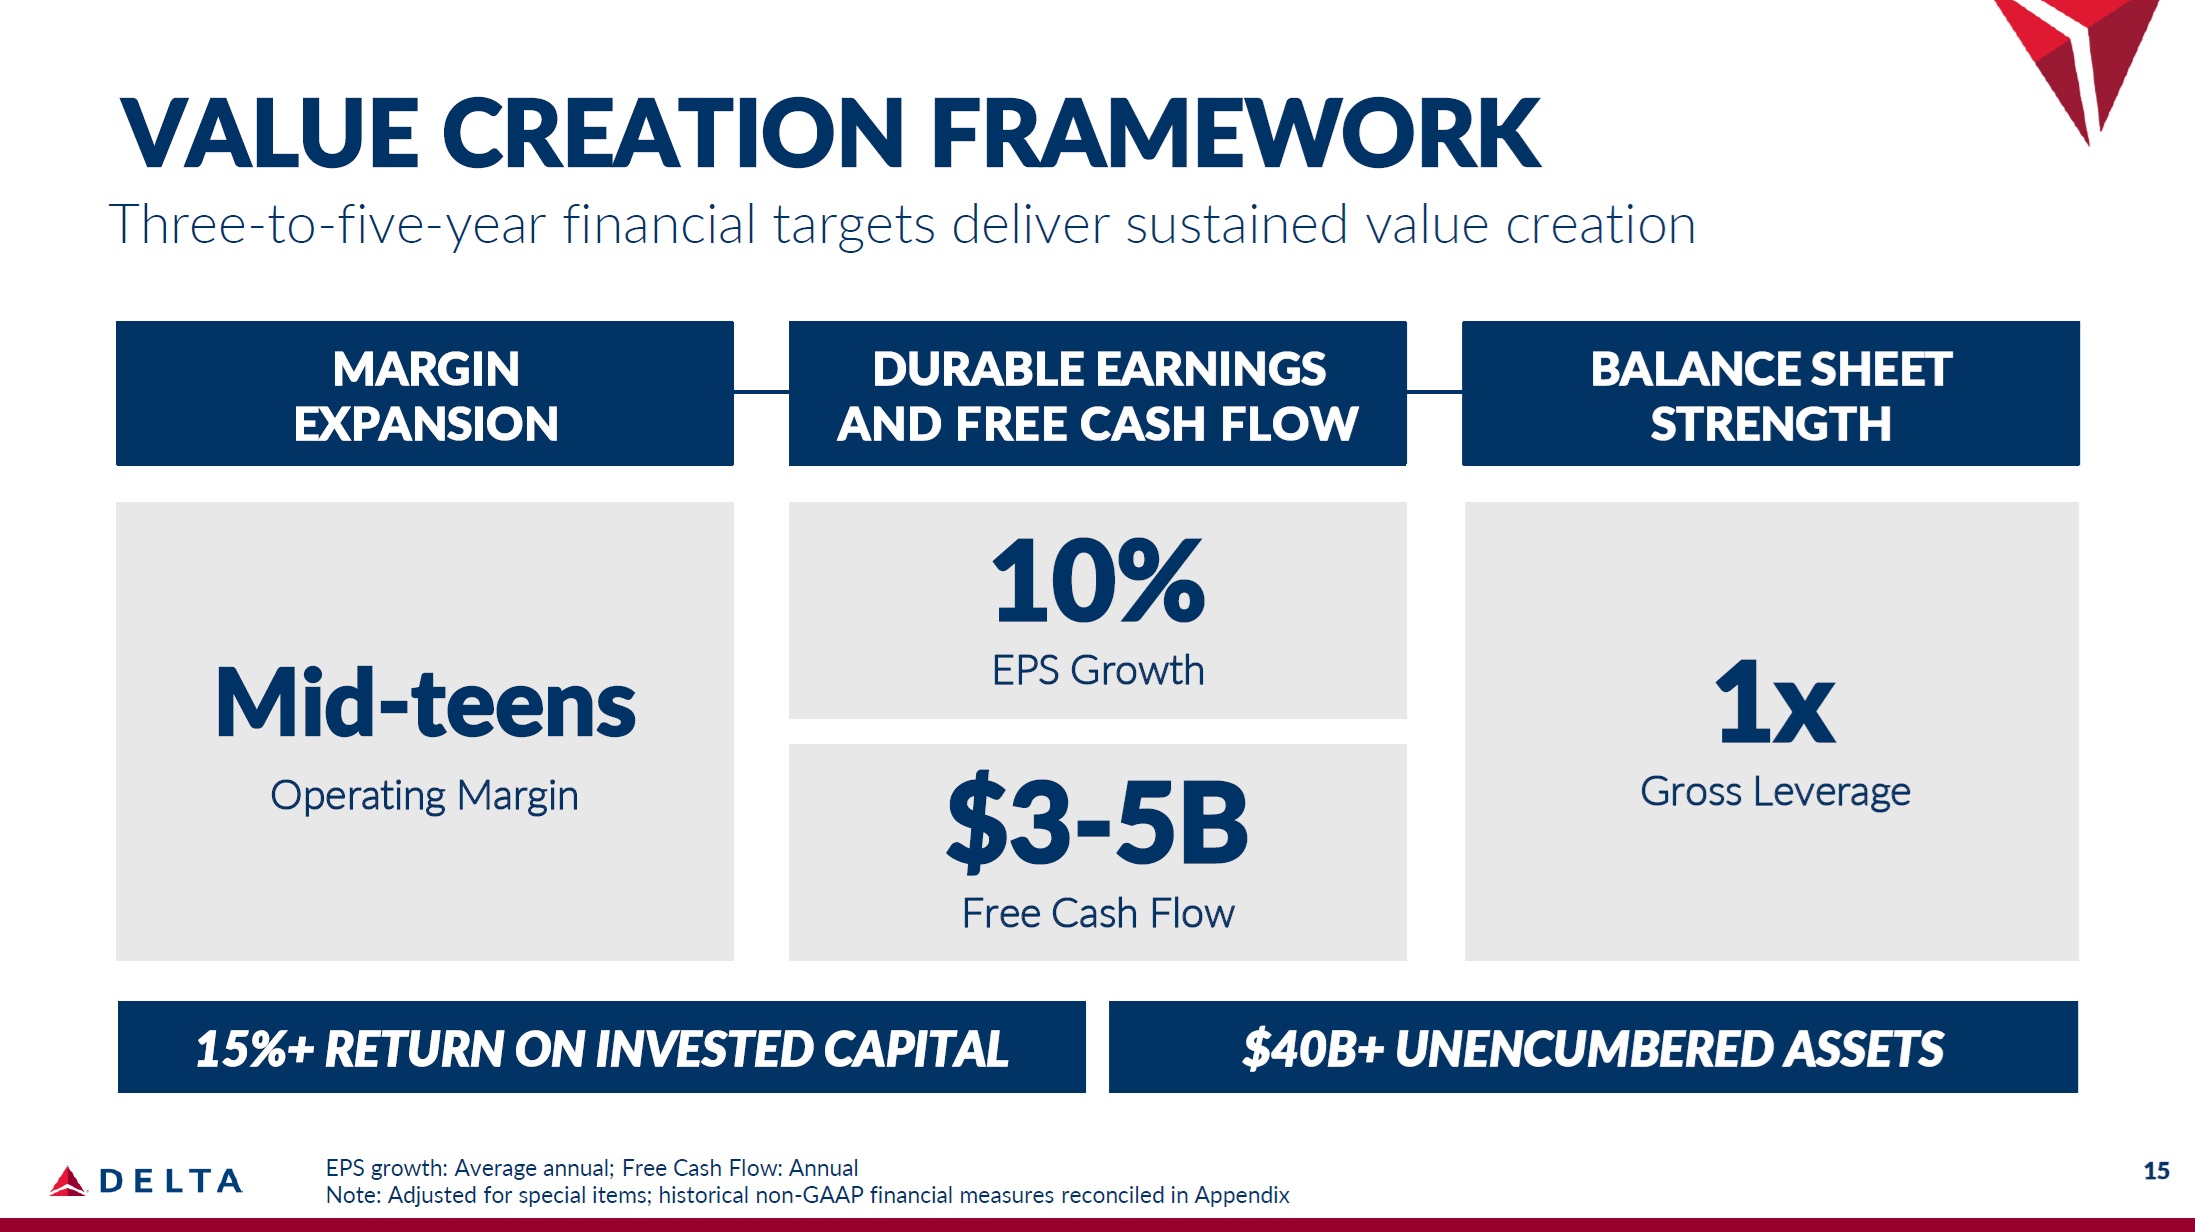
VALUE CREATION FRAMEWORK Three - to - five - year financial targets deliver sustained value creation EPS growth: Average annual; Free Cash Flow: Annual Note: Adjusted for special items; historical non - GAAP financial measures reconciled in Appendix MARGIN DURABLE EARNINGS BALANCE SHEET EXPANSION AND FREE CASH FLOW STRENGTH Mid - teens Operating Margin 1x Gross Leverage 10% EPS Growth $3 - 5B Free Cash Flow 15%+ RETURN ON INVESTED CAPITAL $40B+ UNENCUMBERED ASSETS 15
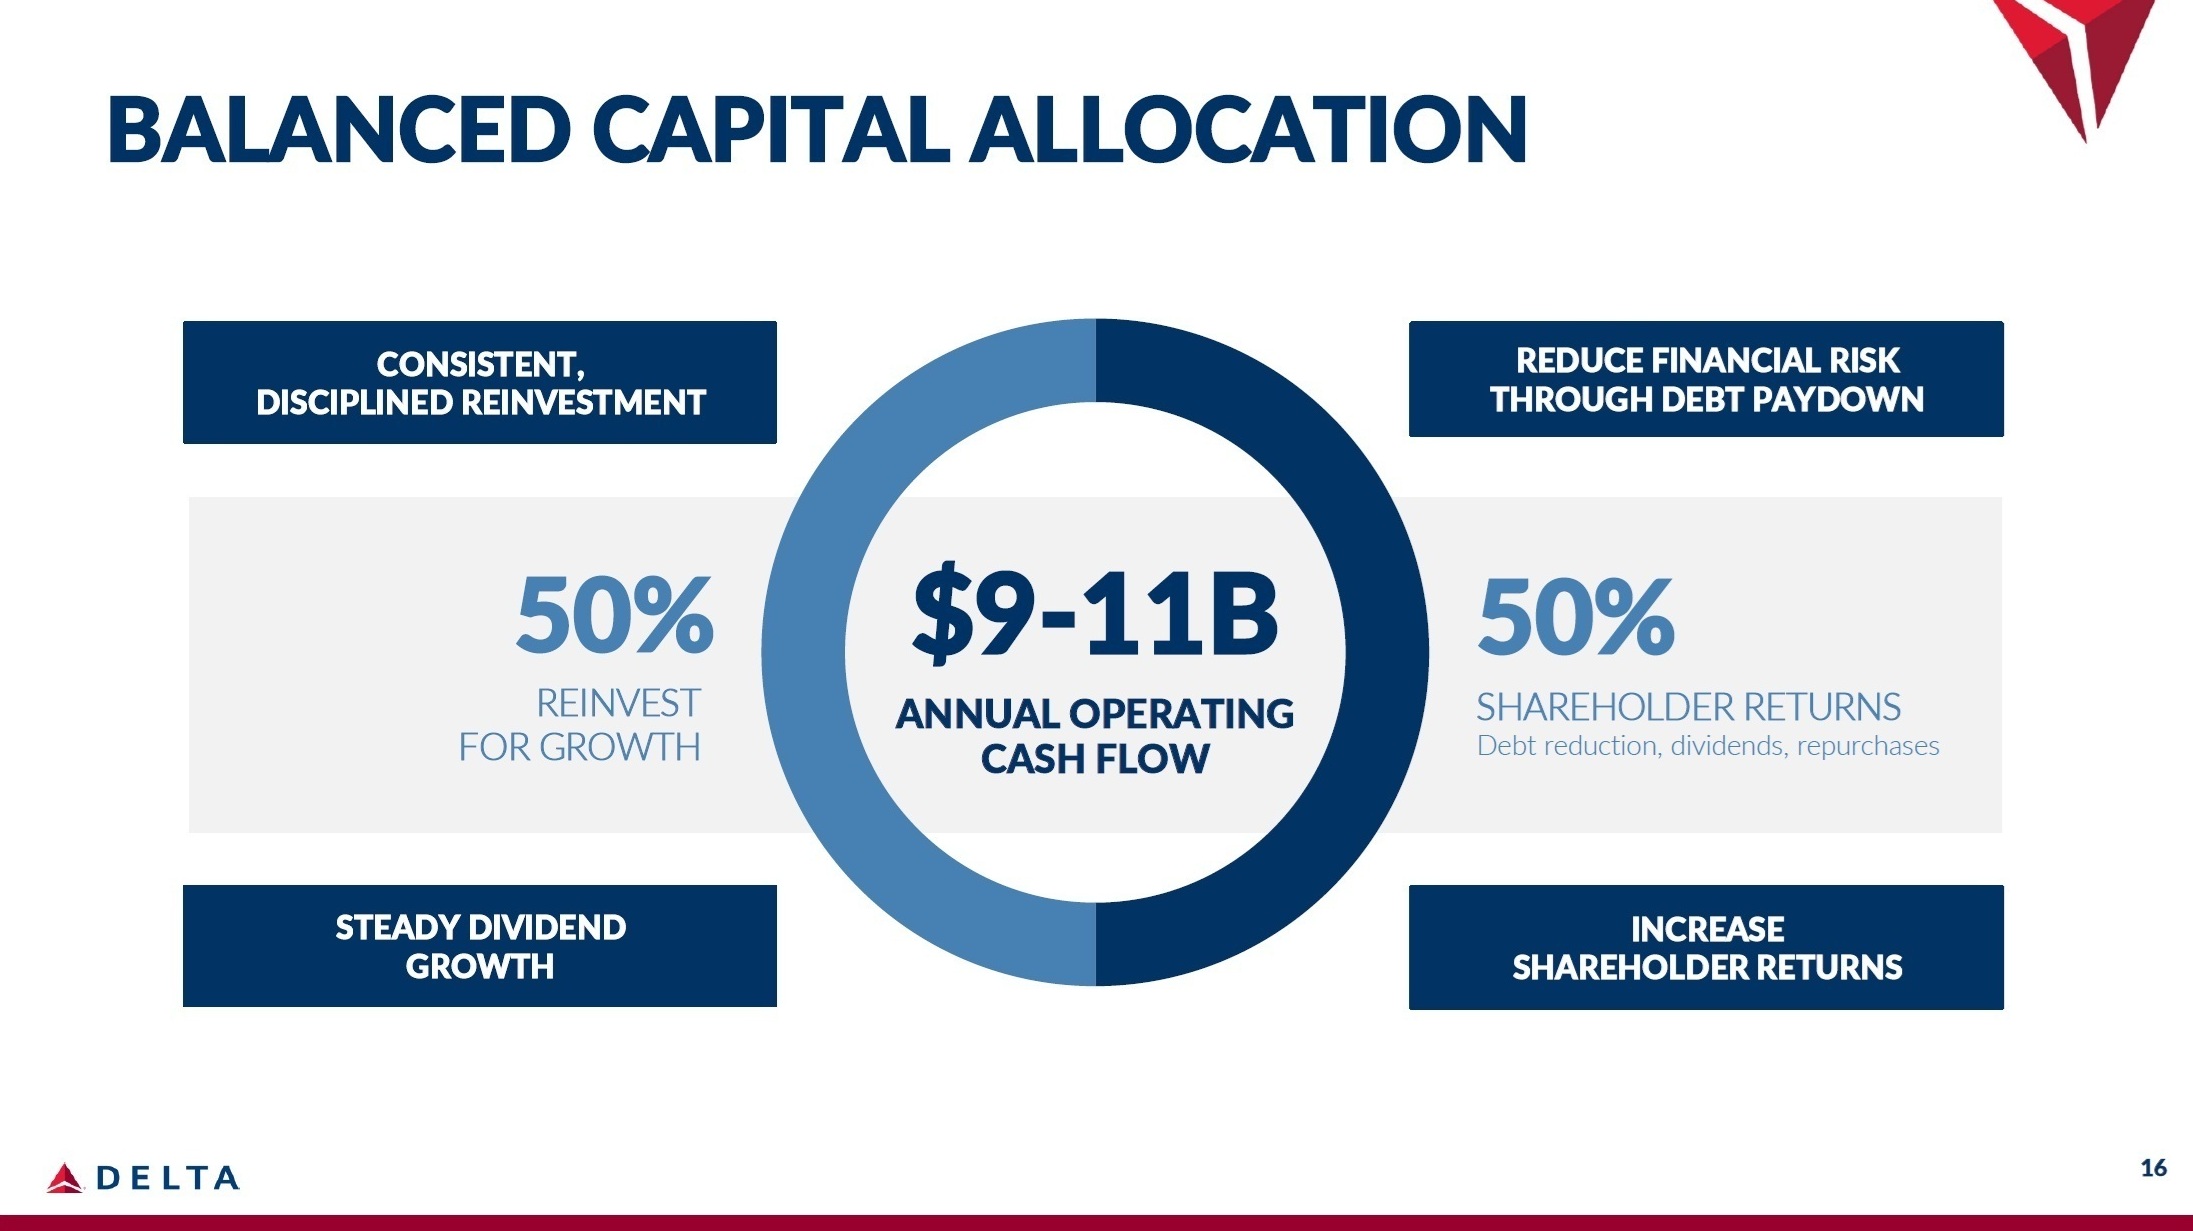
BALANCED CAPITAL ALLOCATION $9 - 11B ANNUAL OPERATING CASH FLOW 50% SHAREHOLDER RETURNS Debt reduction, dividends, repurchases 50% REINVEST FOR GROWTH CONSISTENT, DISCIPLINED REINVESTMENT REDUCE FINANCIAL RISK THROUGH DEBT PAYDOWN STEADY DIVIDEND GROWTH INCREASE SHAREHOLDER RETURNS 16