Comerica Incorporated Barclays Global Financial Services Conference September 9, 2025 Jim Herzog Chief Financial Officer Peter Sefzik Chief Banking Officer Kelly Gage Director of Investor Relations Curt Farmer Chairman & Chief Executive Officer
This presentation contains forward-looking statements within the meaning of the safe harbor provisions of the U.S. Private Securities Litigation Reform Act of 1995. Forward-looking statements can be identified by words such as “achieve,” “anticipate,” “assume,” “believe,” “could,” “deliver,” “drive,” “enhance,” “estimate,” “expect,” “focus,” “future,” “goal,” “grow,” “guidance,” “intend,” “may,” “might,” “plan,” “position,” “opportunity,” “outlook,” “strategy,” “target,” “trajectory,” “trend,” “will,” “would,” and similar expressions or the negative of such terms or other comparable terminology. Forward-looking statements include, but are not limited to, statements about our business strategy, goals and objectives, projected financial and operating results, including outlook for future growth, targeted initiatives and strategic investments across the Commercial Bank, Wealth Management and the Retail Bank and National and Specialty Businesses and Capital Markets. These statements are not historical facts, but instead represent our beliefs regarding future events, many of which, by their nature, are inherently uncertain and outside of our control. Our actual results and financial condition may differ materially from those indicated in these forward-looking statements. Important factors that could cause our actual results and financial condition to differ materially from those indicated in such forward-looking statements include: our ability to take advantage of growth opportunities and implement targeted initiatives in the timeframe and on the terms we currently expect; the extent to which our targeted investments influence our loan growth and non-interest income; the timing and impact of the Direct Express transition; whether loan and deposit trends continue as expected; the impact of macroeconomic factors, such as changes in general economic conditions and monetary and fiscal policy, particularly on interest rates; changes in customer behavior; unfavorable developments concerning credit quality; declines in the businesses or industries of our customers; reductions in our credit ratings; security risks, including cybersecurity and data privacy risks; the outcomes of legal and regulatory proceedings and related financial services industry matters; compliance with regulatory requirements; competitive product and pricing pressures; and the other factors set forth in “Item 1A. Risk Factors” beginning on page 16 of our Annual Report on Form 10-K for the year ended December 31, 2024. Any forward-looking statement made by us in this presentation is based solely on information currently available to us and speaks only as of the date on which it is made. We undertake no obligation to publicly update any forward-looking statement, whether written or oral, that may be made from time to time, whether as a result of new information, future developments or otherwise, except to the extent required by law. Safe Harbor Statement 2©2025, Comerica Inc. All rights reserved.
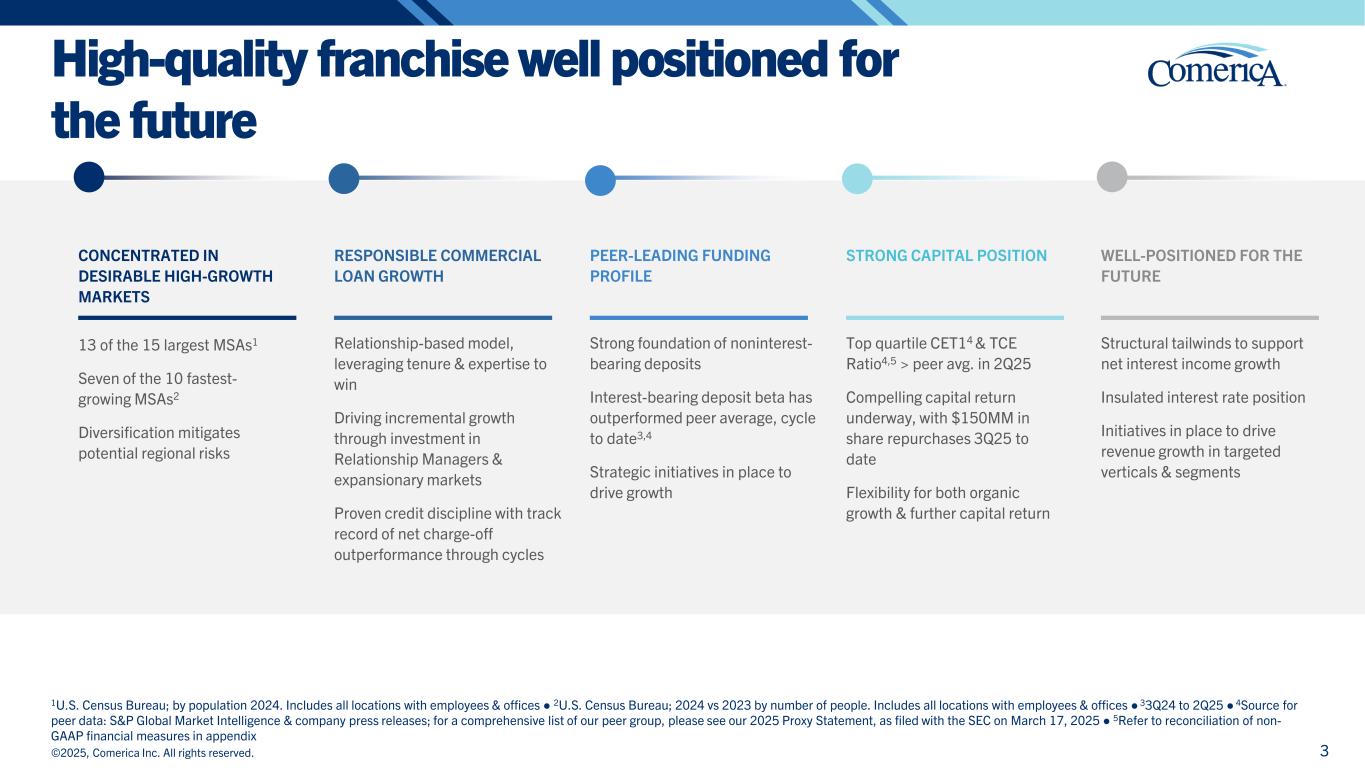
©2025, Comerica Inc. All rights reserved. High-quality franchise well positioned for the future CONCENTRATED IN DESIRABLE HIGH-GROWTH MARKETS 13 of the 15 largest MSAs1 Seven of the 10 fastest- growing MSAs2 Diversification mitigates potential regional risks RESPONSIBLE COMMERCIAL LOAN GROWTH Relationship-based model, leveraging tenure & expertise to win Driving incremental growth through investment in Relationship Managers & expansionary markets Proven credit discipline with track record of net charge-off outperformance through cycles PEER-LEADING FUNDING PROFILE . Strong foundation of noninterest- bearing deposits Interest-bearing deposit beta has outperformed peer average, cycle to date3,4 Strategic initiatives in place to drive growth WELL-POSITIONED FOR THE FUTURE . Structural tailwinds to support net interest income growth Insulated interest rate position Initiatives in place to drive revenue growth in targeted verticals & segments STRONG CAPITAL POSITION . Top quartile CET14 & TCE Ratio4,5 > peer avg. in 2Q25 Compelling capital return underway, with $150MM in share repurchases 3Q25 to date Flexibility for both organic growth & further capital return 3 1U.S. Census Bureau; by population 2024. Includes all locations with employees & offices ● 2U.S. Census Bureau; 2024 vs 2023 by number of people. Includes all locations with employees & offices ● 33Q24 to 2Q25 ● 4Source for peer data: S&P Global Market Intelligence & company press releases; for a comprehensive list of our peer group, please see our 2025 Proxy Statement, as filed with the SEC on March 17, 2025 ● 5Refer to reconciliation of non- GAAP financial measures in appendix
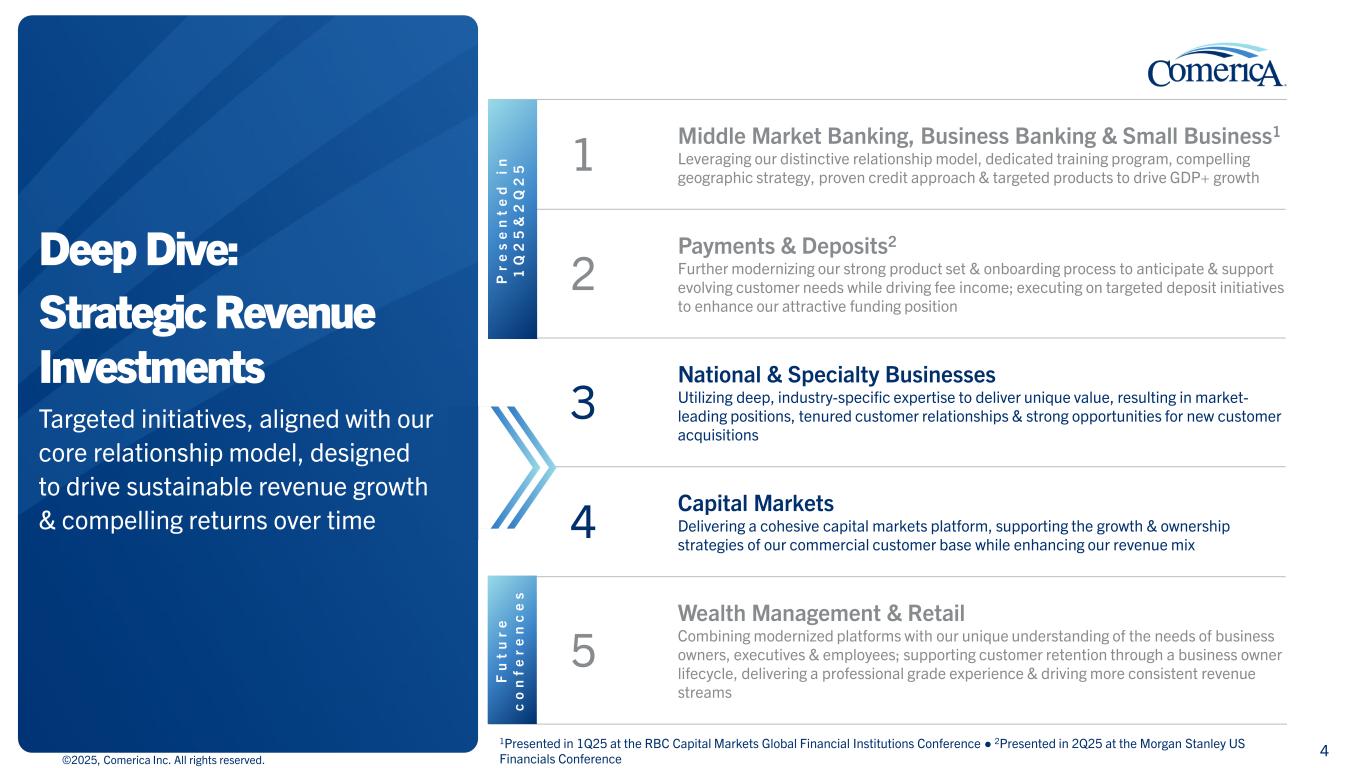
1 Middle Market Banking, Business Banking & Small Business1 Leveraging our distinctive relationship model, dedicated training program, compelling geographic strategy, proven credit approach & targeted products to drive GDP+ growth 2 Payments & Deposits2 Further modernizing our strong product set & onboarding process to anticipate & support evolving customer needs while driving fee income; executing on targeted deposit initiatives to enhance our attractive funding position 3 National & Specialty Businesses Utilizing deep, industry-specific expertise to deliver unique value, resulting in market- leading positions, tenured customer relationships & strong opportunities for new customer acquisitions 4 Capital Markets Delivering a cohesive capital markets platform, supporting the growth & ownership strategies of our commercial customer base while enhancing our revenue mix 5 Wealth Management & Retail Combining modernized platforms with our unique understanding of the needs of business owners, executives & employees; supporting customer retention through a business owner lifecycle, delivering a professional grade experience & driving more consistent revenue streams Deep Dive: Strategic Revenue Investments Targeted initiatives, aligned with our core relationship model, designed to drive sustainable revenue growth & compelling returns over time 4 1Presented in 1Q25 at the RBC Capital Markets Global Financial Institutions Conference ● 2Presented in 2Q25 at the Morgan Stanley US Financials Conference ©2025, Comerica Inc. All rights reserved. P r e s e n t e d i n 1 Q 2 5 & 2 Q 2 5 F u t u r e c o n f e r e n c e s
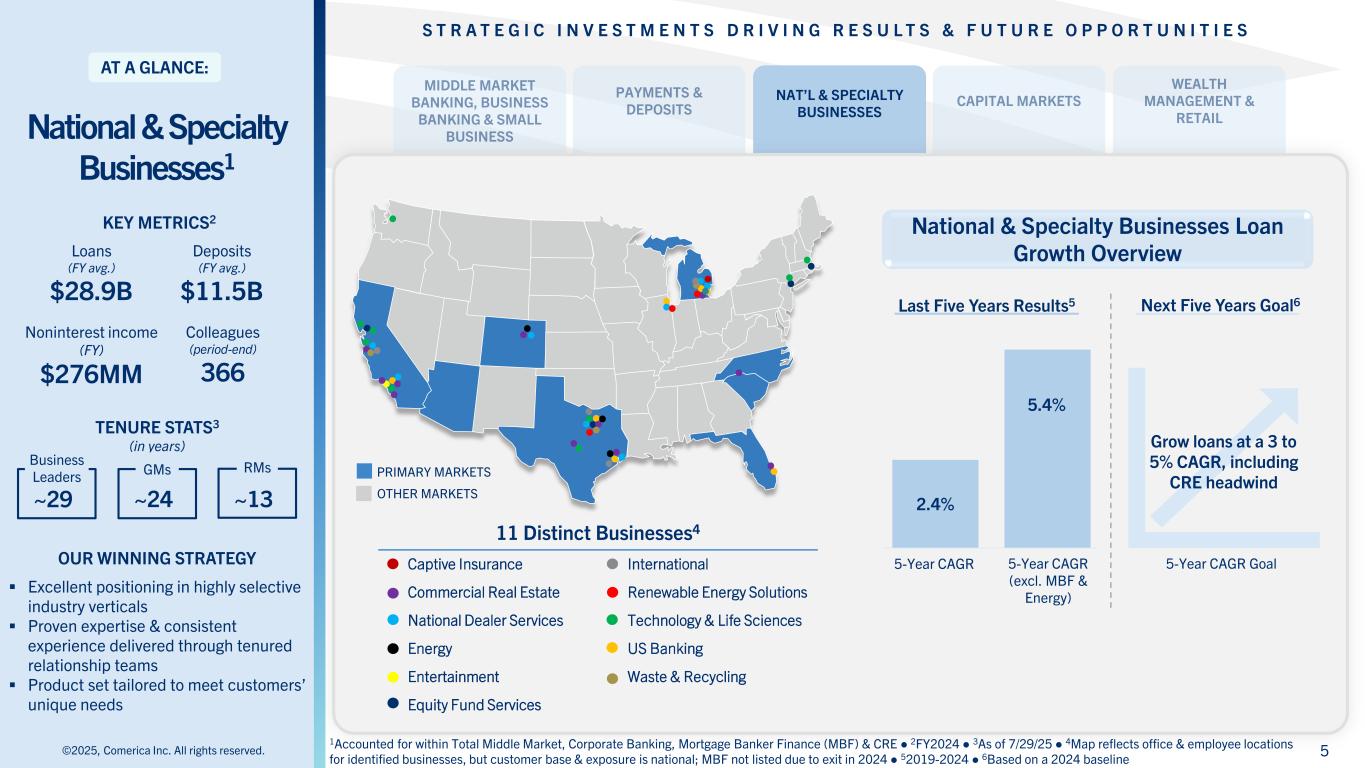
S T R A T E G I C I N V E S T M E N T S D R I V I N G R E S U L T S & F U T U R E O P P O R T U N I T I E S National & Specialty Businesses1 AT A GLANCE: NAT’L & SPECIALTY BUSINESSES TENURE STATS3 (in years) KEY METRICS2 Noninterest income (FY) $276MM Colleagues (period-end) 366 Loans (FY avg.) $28.9B Deposits (FY avg.) $11.5B ©2025, Comerica Inc. All rights reserved. 1Accounted for within Total Middle Market, Corporate Banking, Mortgage Banker Finance (MBF) & CRE ● 2FY2024 ● 3As of 7/29/25 ● 4Map reflects office & employee locations for identified businesses, but customer base & exposure is national; MBF not listed due to exit in 2024 ● 52019-2024 ● 6Based on a 2024 baseline Business Leaders GMs RMs ~29 ~13~24 11 Distinct Businesses4 Captive Insurance International Commercial Real Estate Renewable Energy Solutions National Dealer Services Technology & Life Sciences Energy US Banking Entertainment Waste & Recycling Equity Fund Services OUR WINNING STRATEGY Excellent positioning in highly selective industry verticals Proven expertise & consistent experience delivered through tenured relationship teams Product set tailored to meet customers’ unique needs National & Specialty Businesses Loan Growth Overview Next Five Years Goal6Last Five Years Results5 PRIMARY MARKETS OTHER MARKETS 5-Year CAGR 5-Year CAGR (excl. MBF & Energy) 2.4% 5.4% Grow loans at a 3 to 5% CAGR, including CRE headwind 5-Year CAGR Goal 5
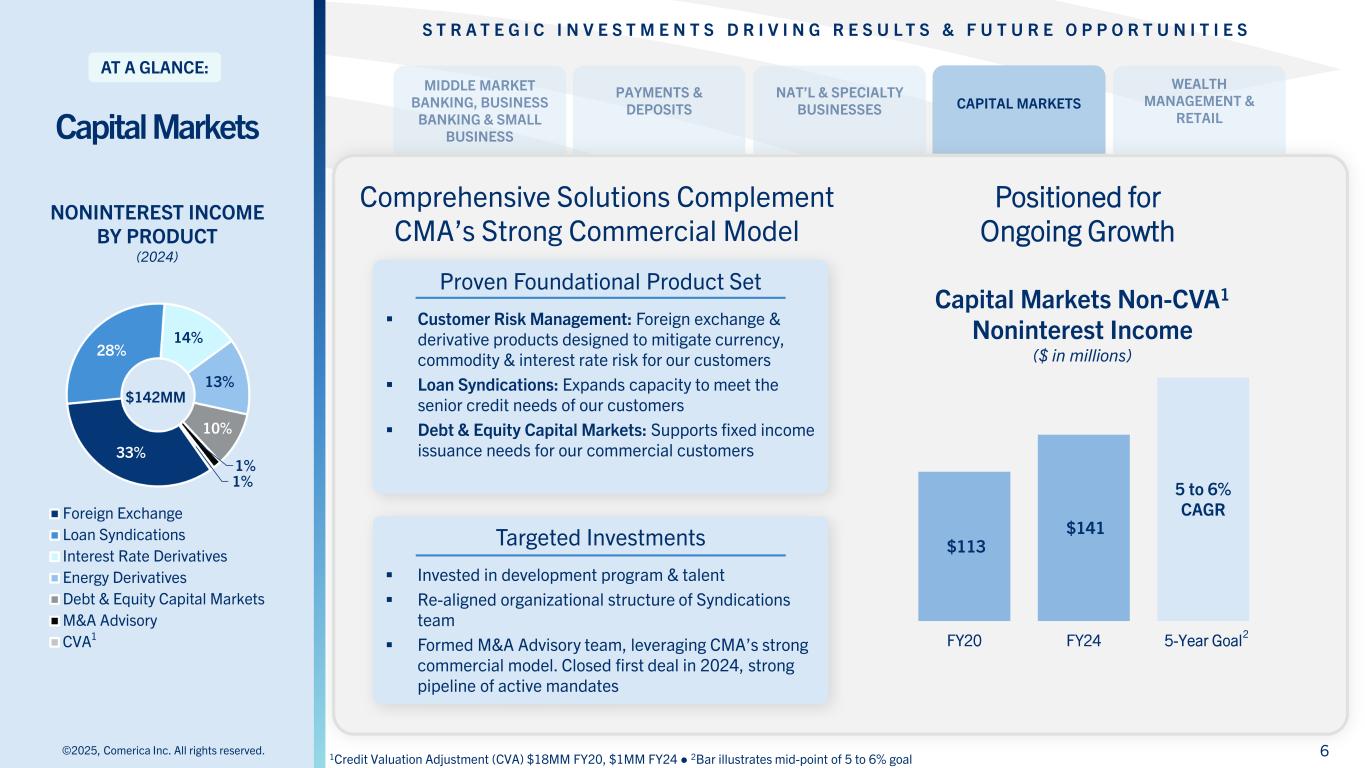
S T R A T E G I C I N V E S T M E N T S D R I V I N G R E S U L T S & F U T U R E O P P O R T U N I T I E S CAPITAL MARKETS ©2025, Comerica Inc. All rights reserved. 33% 28% 14% 13% 10% 1% 1% Foreign Exchange Loan Syndications Interest Rate Derivatives Energy Derivatives Debt & Equity Capital Markets M&A Advisory CVA NONINTEREST INCOME BY PRODUCT (2024) $142MM Capital Markets Non-CVA1 Noninterest Income ($ in millions) Targeted Investments Invested in development program & talent Re-aligned organizational structure of Syndications team Formed M&A Advisory team, leveraging CMA’s strong commercial model. Closed first deal in 2024, strong pipeline of active mandates Proven Foundational Product Set Customer Risk Management: Foreign exchange & derivative products designed to mitigate currency, commodity & interest rate risk for our customers Loan Syndications: Expands capacity to meet the senior credit needs of our customers Debt & Equity Capital Markets: Supports fixed income issuance needs for our commercial customers $113 $141 5 to 6% CAGR FY20 FY24 5-Year Goal Positioned for Ongoing Growth Comprehensive Solutions Complement CMA’s Strong Commercial Model 6 AT A GLANCE: Capital Markets 1Credit Valuation Adjustment (CVA) $18MM FY20, $1MM FY24 ● 2Bar illustrates mid-point of 5 to 6% goal 1 2
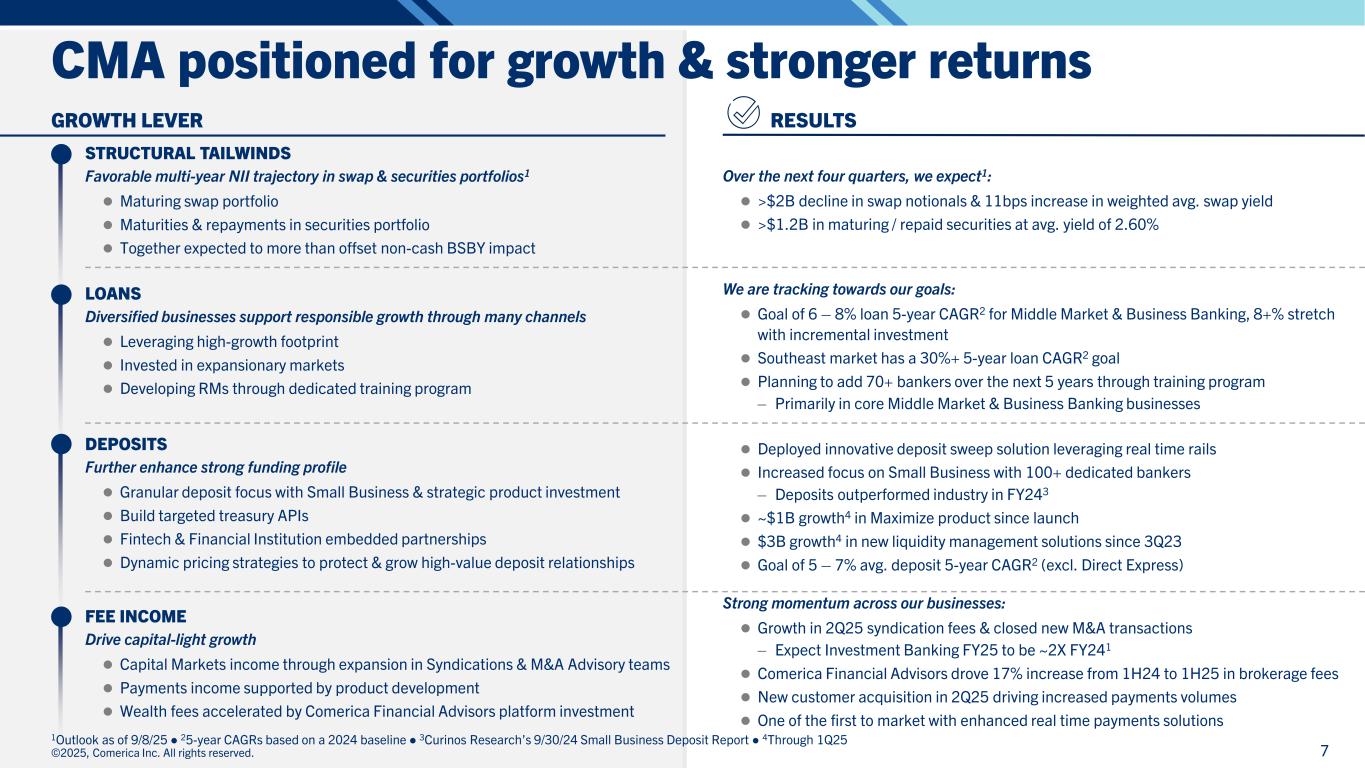
CMA positioned for growth & stronger returns GROWTH LEVER STRUCTURAL TAILWINDS Favorable multi-year NII trajectory in swap & securities portfolios1 Maturing swap portfolio Maturities & repayments in securities portfolio Together expected to more than offset non-cash BSBY impact LOANS Diversified businesses support responsible growth through many channels Leveraging high-growth footprint Invested in expansionary markets Developing RMs through dedicated training program DEPOSITS Further enhance strong funding profile Granular deposit focus with Small Business & strategic product investment Build targeted treasury APIs Fintech & Financial Institution embedded partnerships Dynamic pricing strategies to protect & grow high-value deposit relationships FEE INCOME Drive capital-light growth Capital Markets income through expansion in Syndications & M&A Advisory teams Payments income supported by product development Wealth fees accelerated by Comerica Financial Advisors platform investment RESULTS Over the next four quarters, we expect1: >$2B decline in swap notionals & 11bps increase in weighted avg. swap yield >$1.2B in maturing / repaid securities at avg. yield of 2.60% We are tracking towards our goals: Goal of 6 – 8% loan 5-year CAGR2 for Middle Market & Business Banking, 8+% stretch with incremental investment Southeast market has a 30%+ 5-year loan CAGR2 goal Planning to add 70+ bankers over the next 5 years through training program – Primarily in core Middle Market & Business Banking businesses Deployed innovative deposit sweep solution leveraging real time rails Increased focus on Small Business with 100+ dedicated bankers – Deposits outperformed industry in FY243 ~$1B growth4 in Maximize product since launch $3B growth4 in new liquidity management solutions since 3Q23 Goal of 5 – 7% avg. deposit 5-year CAGR2 (excl. Direct Express) Strong momentum across our businesses: Growth in 2Q25 syndication fees & closed new M&A transactions – Expect Investment Banking FY25 to be ~2X FY241 Comerica Financial Advisors drove 17% increase from 1H24 to 1H25 in brokerage fees New customer acquisition in 2Q25 driving increased payments volumes One of the first to market with enhanced real time payments solutions ©2025, Comerica Inc. All rights reserved. 7 1Outlook as of 9/8/25 ● 25-year CAGRs based on a 2024 baseline ● 3Curinos Research’s 9/30/24 Small Business Deposit Report ● 4Through 1Q25

APPENDIX
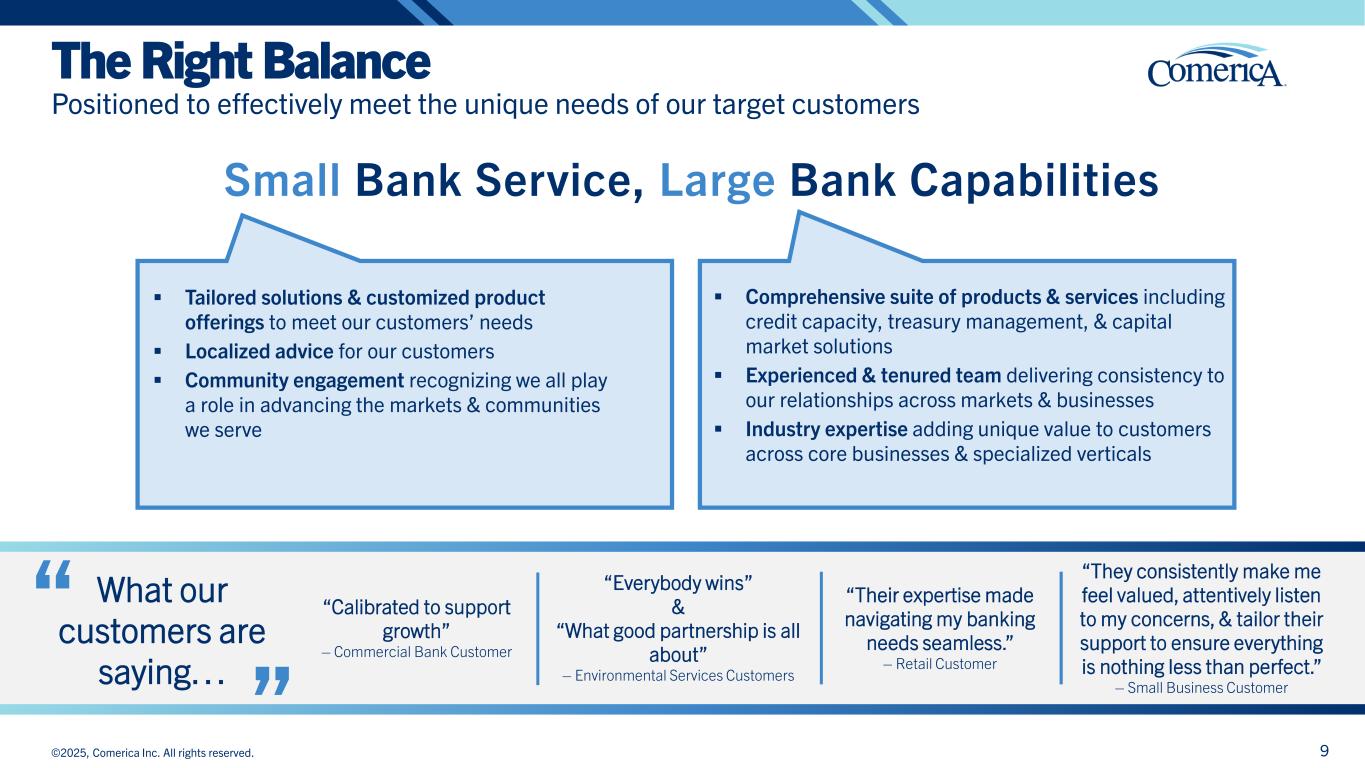
The Right Balance Positioned to effectively meet the unique needs of our target customers “Calibrated to support growth” – Commercial Bank Customer “Everybody wins” & “What good partnership is all about” – Environmental Services Customers Small Bank Service, Large Bank Capabilities Tailored solutions & customized product offerings to meet our customers’ needs Localized advice for our customers Community engagement recognizing we all play a role in advancing the markets & communities we serve Comprehensive suite of products & services including credit capacity, treasury management, & capital market solutions Experienced & tenured team delivering consistency to our relationships across markets & businesses Industry expertise adding unique value to customers across core businesses & specialized verticals 9©2025, Comerica Inc. All rights reserved. What our customers are saying… “ “ “They consistently make me feel valued, attentively listen to my concerns, & tailor their support to ensure everything is nothing less than perfect.” – Small Business Customer “Their expertise made navigating my banking needs seamless.” – Retail Customer
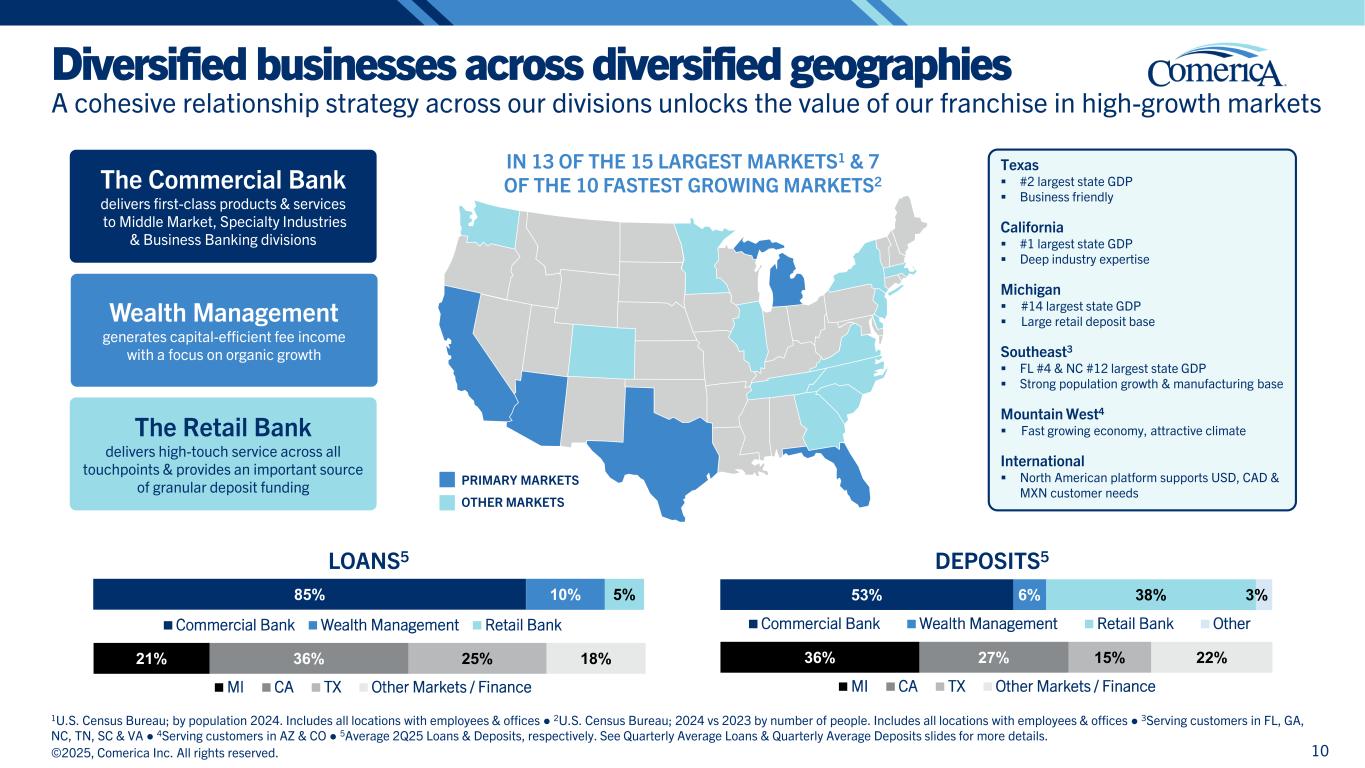
The Commercial Bank delivers first-class products & services to Middle Market, Specialty Industries & Business Banking divisions Wealth Management generates capital-efficient fee income with a focus on organic growth The Retail Bank delivers high-touch service across all touchpoints & provides an important source of granular deposit funding IN 13 OF THE 15 LARGEST MARKETS1 & 7 OF THE 10 FASTEST GROWING MARKETS2 DEPOSITS5LOANS5 ©2025, Comerica Inc. All rights reserved. 85% 10% 5% Commercial Bank Wealth Management Retail Bank 53% 6% 38% 3% Commercial Bank Wealth Management Retail Bank Other 36% 27% 15% 22% MI CA TX Other Markets / Finance 21% 36% 25% 18% MI CA TX Other Markets / Finance PRIMARY MARKETS OTHER MARKETS Texas #2 largest state GDP Business friendly California #1 largest state GDP Deep industry expertise Michigan #14 largest state GDP Large retail deposit base Southeast3 FL #4 & NC #12 largest state GDP Strong population growth & manufacturing base Mountain West4 Fast growing economy, attractive climate International North American platform supports USD, CAD & MXN customer needs 1U.S. Census Bureau; by population 2024. Includes all locations with employees & offices ● 2U.S. Census Bureau; 2024 vs 2023 by number of people. Includes all locations with employees & offices ● 3Serving customers in FL, GA, NC, TN, SC & VA ● 4Serving customers in AZ & CO ● 5Average 2Q25 Loans & Deposits, respectively. See Quarterly Average Loans & Quarterly Average Deposits slides for more details. 10 Diversified businesses across diversified geographies A cohesive relationship strategy across our divisions unlocks the value of our franchise in high-growth markets
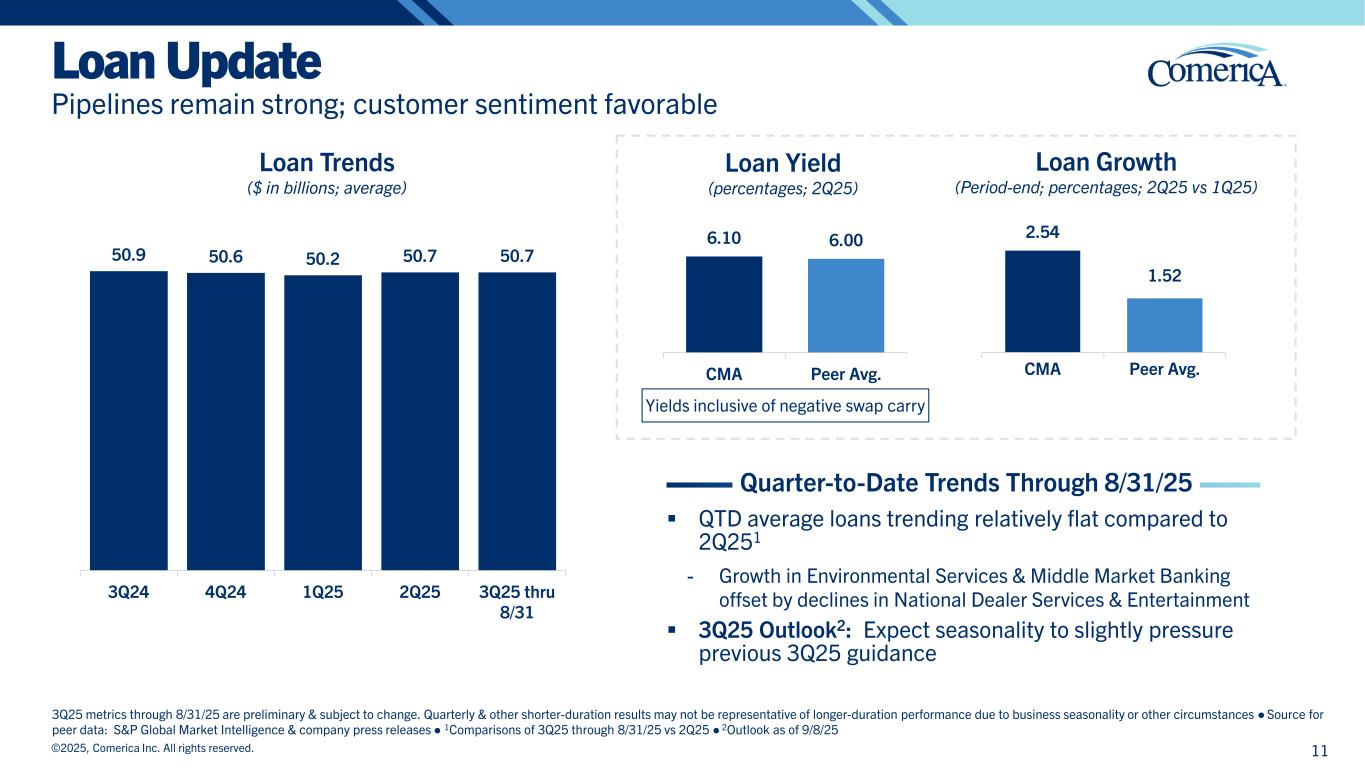
50.9 50.6 50.2 50.7 50.7 3Q24 4Q24 1Q25 2Q25 3Q25 thru 8/31 Loan Update Pipelines remain strong; customer sentiment favorable 3Q25 metrics through 8/31/25 are preliminary & subject to change. Quarterly & other shorter-duration results may not be representative of longer-duration performance due to business seasonality or other circumstances ● Source for peer data: S&P Global Market Intelligence & company press releases ● 1Comparisons of 3Q25 through 8/31/25 vs 2Q25 ● 2Outlook as of 9/8/25 11©2025, Comerica Inc. All rights reserved. Loan Trends ($ in billions; average) Quarter-to-Date Trends Through 8/31/25 QTD average loans trending relatively flat compared to 2Q251 - Growth in Environmental Services & Middle Market Banking offset by declines in National Dealer Services & Entertainment 3Q25 Outlook2: Expect seasonality to slightly pressure previous 3Q25 guidance Loan Yield (percentages; 2Q25) 6.10 6.00 CMA Peer Avg. Yields inclusive of negative swap carry 2.54 1.52 CMA Peer Avg. Loan Growth (Period-end; percentages; 2Q25 vs 1Q25)
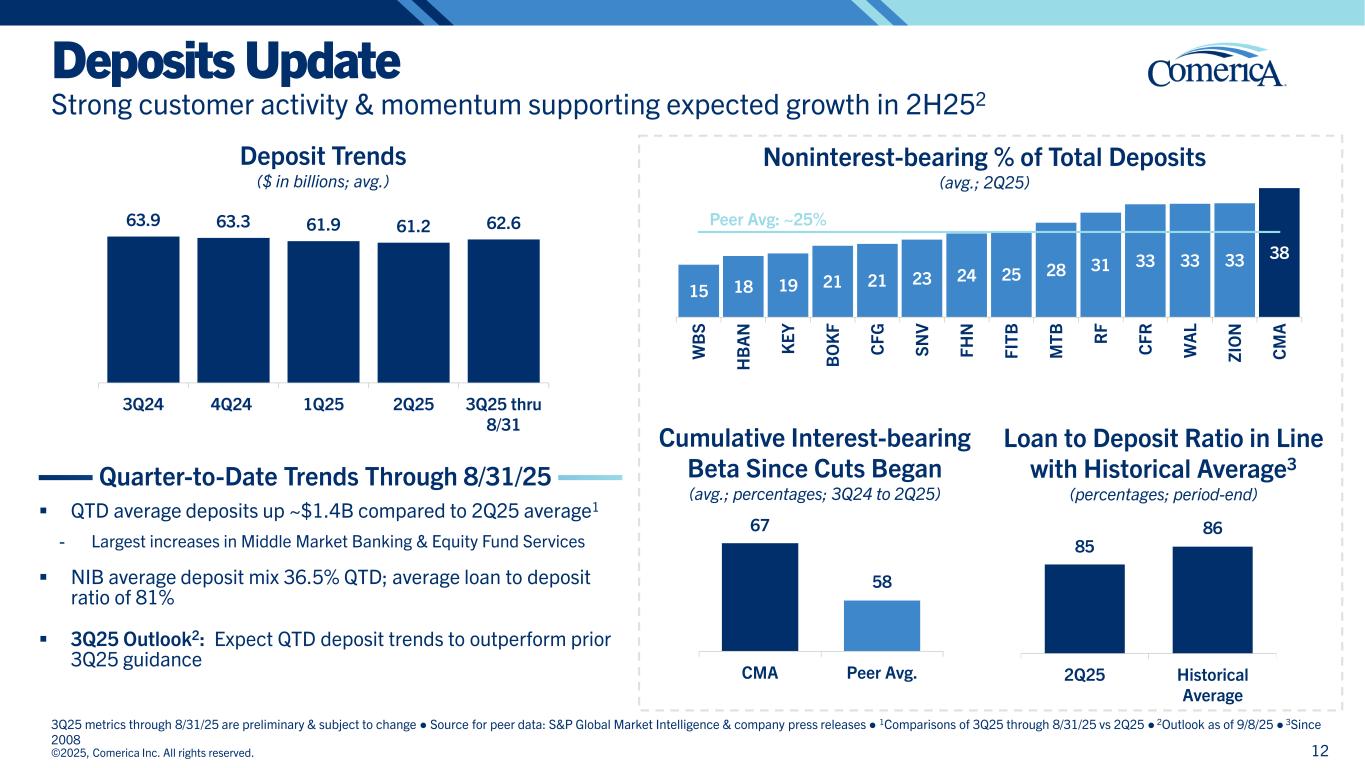
©2025, Comerica Inc. All rights reserved. 3Q25 metrics through 8/31/25 are preliminary & subject to change ● Source for peer data: S&P Global Market Intelligence & company press releases ● 1Comparisons of 3Q25 through 8/31/25 vs 2Q25 ● 2Outlook as of 9/8/25 ● 3Since 2008 12 Deposits Update Strong customer activity & momentum supporting expected growth in 2H252 Loan to Deposit Ratio in Line with Historical Average3 (percentages; period-end) Noninterest-bearing % of Total Deposits (avg.; 2Q25) 63.9 63.3 61.9 61.2 62.6 3Q24 4Q24 1Q25 2Q25 3Q25 thru 8/31 Deposit Trends ($ in billions; avg.) Quarter-to-Date Trends Through 8/31/25 QTD average deposits up ~$1.4B compared to 2Q25 average1 - Largest increases in Middle Market Banking & Equity Fund Services NIB average deposit mix 36.5% QTD; average loan to deposit ratio of 81% 3Q25 Outlook2: Expect QTD deposit trends to outperform prior 3Q25 guidance Cumulative Interest-bearing Beta Since Cuts Began (avg.; percentages; 3Q24 to 2Q25) 67 58 CMA Peer Avg. 85 86 2Q25 Historical Average 15 18 19 21 21 23 24 25 28 31 33 33 33 38 Peer Avg: ~25% W B S H B A N K EY B O K F C FG S N V FH N FI TB M TB R F C FR W A L ZI O N C M A
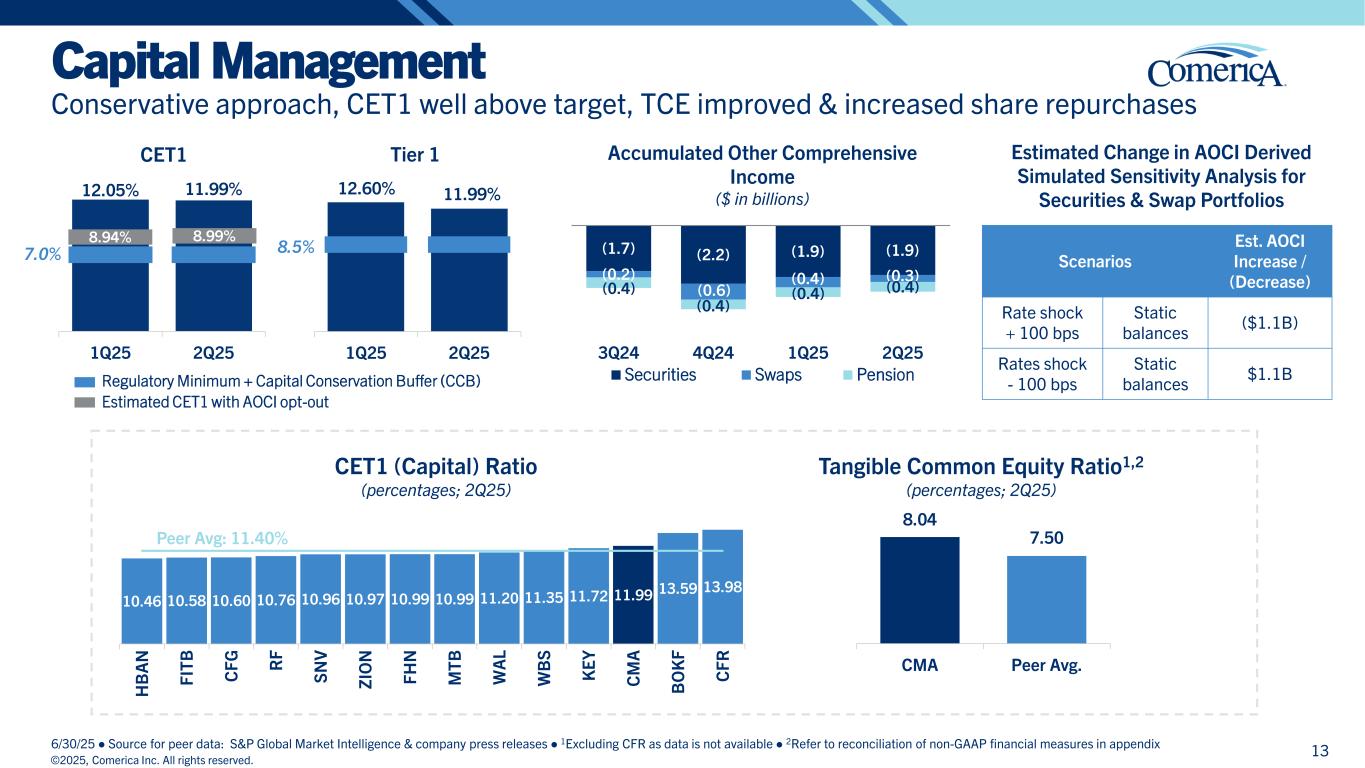
Regulatory Minimum + Capital Conservation Buffer (CCB) (1.7) (2.2) (1.9) (1.9) (0.2) (0.6) (0.4) (0.3) (0.4) (0.4) (0.4) (0.4) 3Q24 4Q24 1Q25 2Q25 Securities Swaps Pension Capital Management Conservative approach, CET1 well above target, TCE improved & increased share repurchases 6/30/25 ● Source for peer data: S&P Global Market Intelligence & company press releases ● 1Excluding CFR as data is not available ● 2Refer to reconciliation of non-GAAP financial measures in appendix 12.05% 11.99% 7.0% 1Q25 2Q25 CET1 Tier 1 12.60% 11.99% 8.5% 1Q25 2Q25 ©2025, Comerica Inc. All rights reserved. Accumulated Other Comprehensive Income ($ in billions) Scenarios Est. AOCI Increase / (Decrease) Rate shock + 100 bps Static balances ($1.1B) Rates shock - 100 bps Static balances $1.1B Estimated Change in AOCI Derived Simulated Sensitivity Analysis for Securities & Swap Portfolios 8.94% Estimated CET1 with AOCI opt-out 8.99% 13 CET1 (Capital) Ratio (percentages; 2Q25) 10.46 10.58 10.60 10.76 10.96 10.97 10.99 10.99 11.20 11.35 11.72 11.99 13.59 13.98 Peer Avg: 11.40% H B A N FI TB C FG R F S N V ZI O N FH N M TB W A L W B S K EY C M A B O K F C FR 8.04 7.50 CMA Peer Avg. Tangible Common Equity Ratio1,2 (percentages; 2Q25)
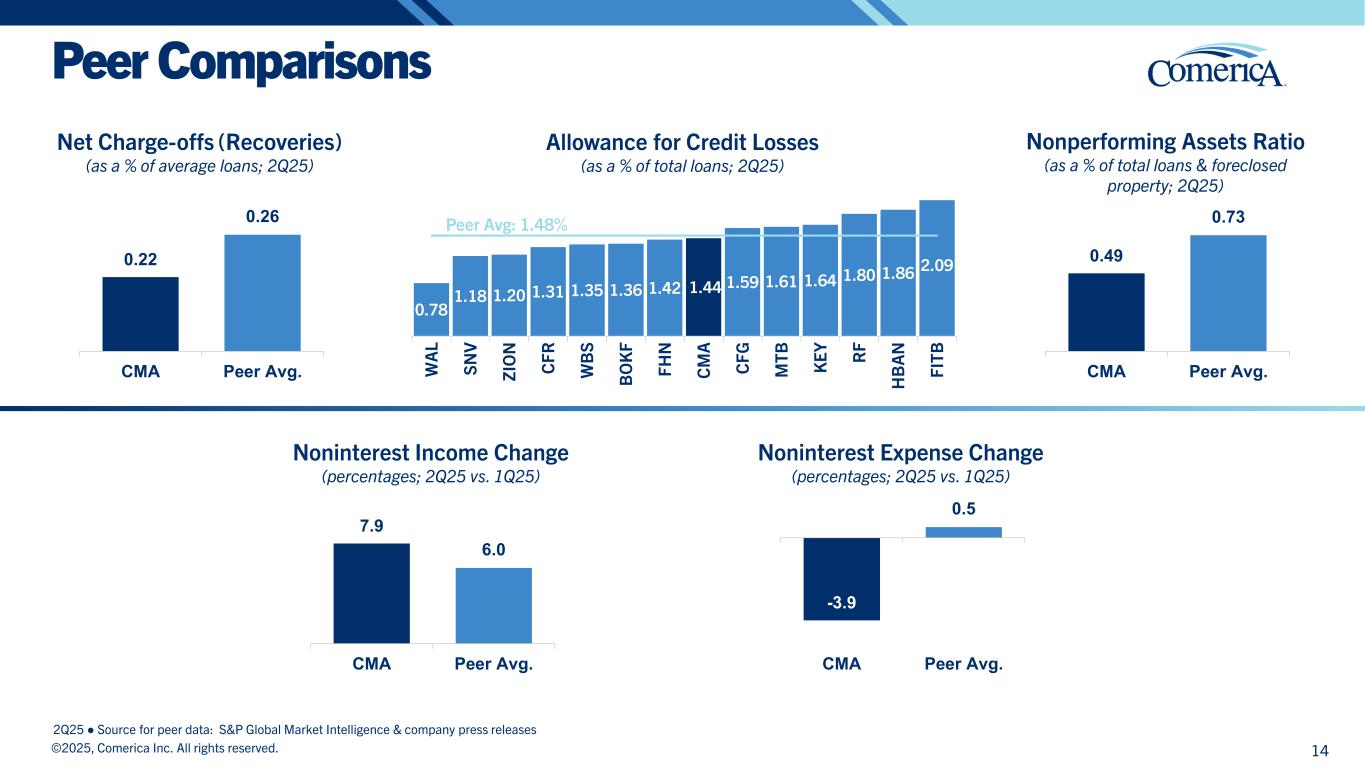
Peer Comparisons 2Q25 ● Source for peer data: S&P Global Market Intelligence & company press releases ©2025, Comerica Inc. All rights reserved. 14 Net Charge-offs (Recoveries) (as a % of average loans; 2Q25) Nonperforming Assets Ratio (as a % of total loans & foreclosed property; 2Q25) Allowance for Credit Losses (as a % of total loans; 2Q25) 0.78 1.18 1.20 1.31 1.35 1.36 1.42 1.44 1.59 1.61 1.64 1.80 1.86 2.09 Peer Avg: 1.48% W A L S N V ZI O N C FR W B S B O K F FH N C M A C FG M TB K EY R F H B A N FI TB -3.9 0.5 CMA Peer Avg. Noninterest Expense Change (percentages; 2Q25 vs. 1Q25) 7.9 6.0 CMA Peer Avg. Noninterest Income Change (percentages; 2Q25 vs. 1Q25) 0.49 0.73 CMA Peer Avg. 0.22 0.26 CMA Peer Avg.
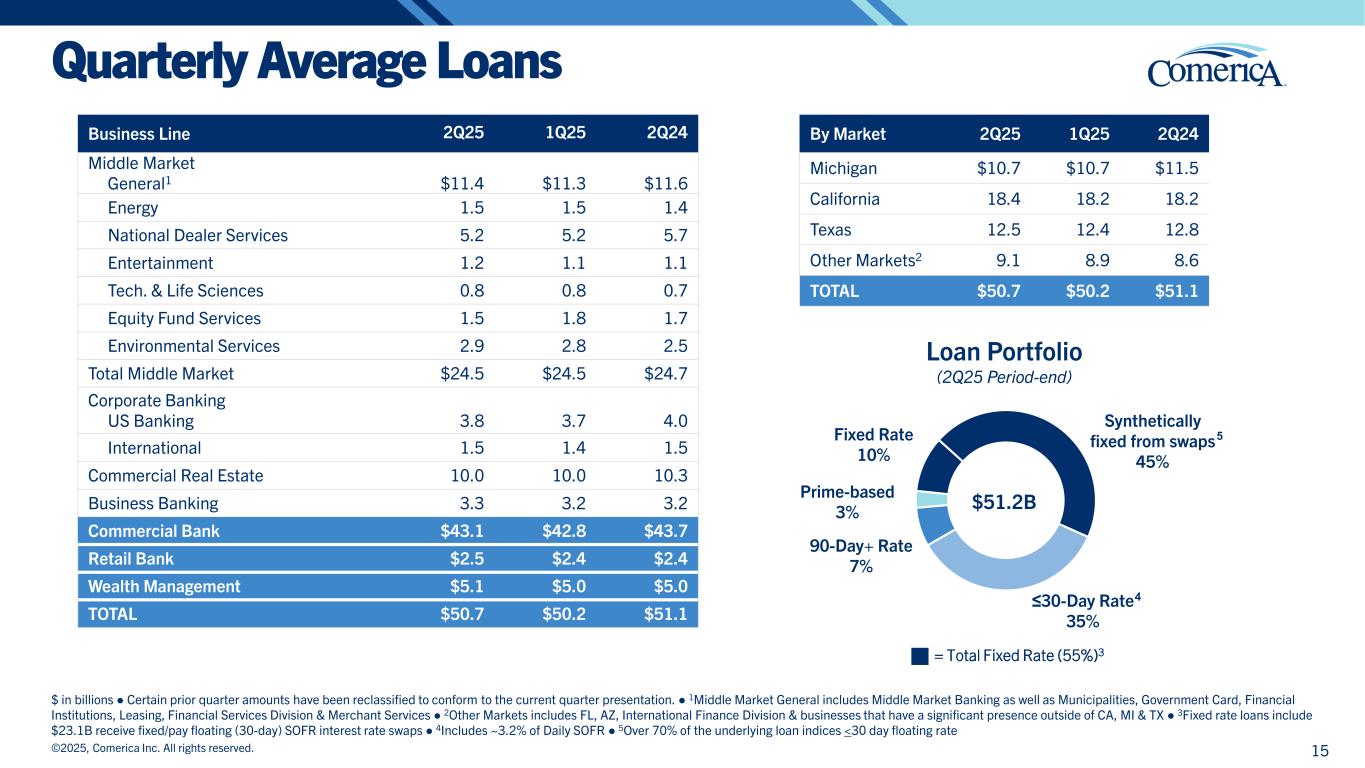
= Total Fixed Rate (55%)3 Business Line 2Q25 1Q25 2Q24 Middle Market General1 $11.4 $11.3 $11.6 Energy 1.5 1.5 1.4 National Dealer Services 5.2 5.2 5.7 Entertainment 1.2 1.1 1.1 Tech. & Life Sciences 0.8 0.8 0.7 Equity Fund Services 1.5 1.8 1.7 Environmental Services 2.9 2.8 2.5 Total Middle Market $24.5 $24.5 $24.7 Corporate Banking US Banking 3.8 3.7 4.0 International 1.5 1.4 1.5 Commercial Real Estate 10.0 10.0 10.3 Business Banking 3.3 3.2 3.2 Commercial Bank $43.1 $42.8 $43.7 Retail Bank $2.5 $2.4 $2.4 Wealth Management $5.1 $5.0 $5.0 TOTAL $50.7 $50.2 $51.1 Quarterly Average Loans $ in billions ● Certain prior quarter amounts have been reclassified to conform to the current quarter presentation. ● 1Middle Market General includes Middle Market Banking as well as Municipalities, Government Card, Financial Institutions, Leasing, Financial Services Division & Merchant Services ● 2Other Markets includes FL, AZ, International Finance Division & businesses that have a significant presence outside of CA, MI & TX ● 3Fixed rate loans include $23.1B receive fixed/pay floating (30-day) SOFR interest rate swaps ● 4Includes ~3.2% of Daily SOFR ● 5Over 70% of the underlying loan indices <30 day floating rate By Market 2Q25 1Q25 2Q24 Michigan $10.7 $10.7 $11.5 California 18.4 18.2 18.2 Texas 12.5 12.4 12.8 Other Markets2 9.1 8.9 8.6 TOTAL $50.7 $50.2 $51.1 ©2025, Comerica Inc. All rights reserved. 15 Fixed Rate 10% Synthetically fixed from swaps 45% ≤30-Day Rate 35% 90-Day+ Rate 7% Prime-based 3% Loan Portfolio (2Q25 Period-end) 4 $51.2B 5
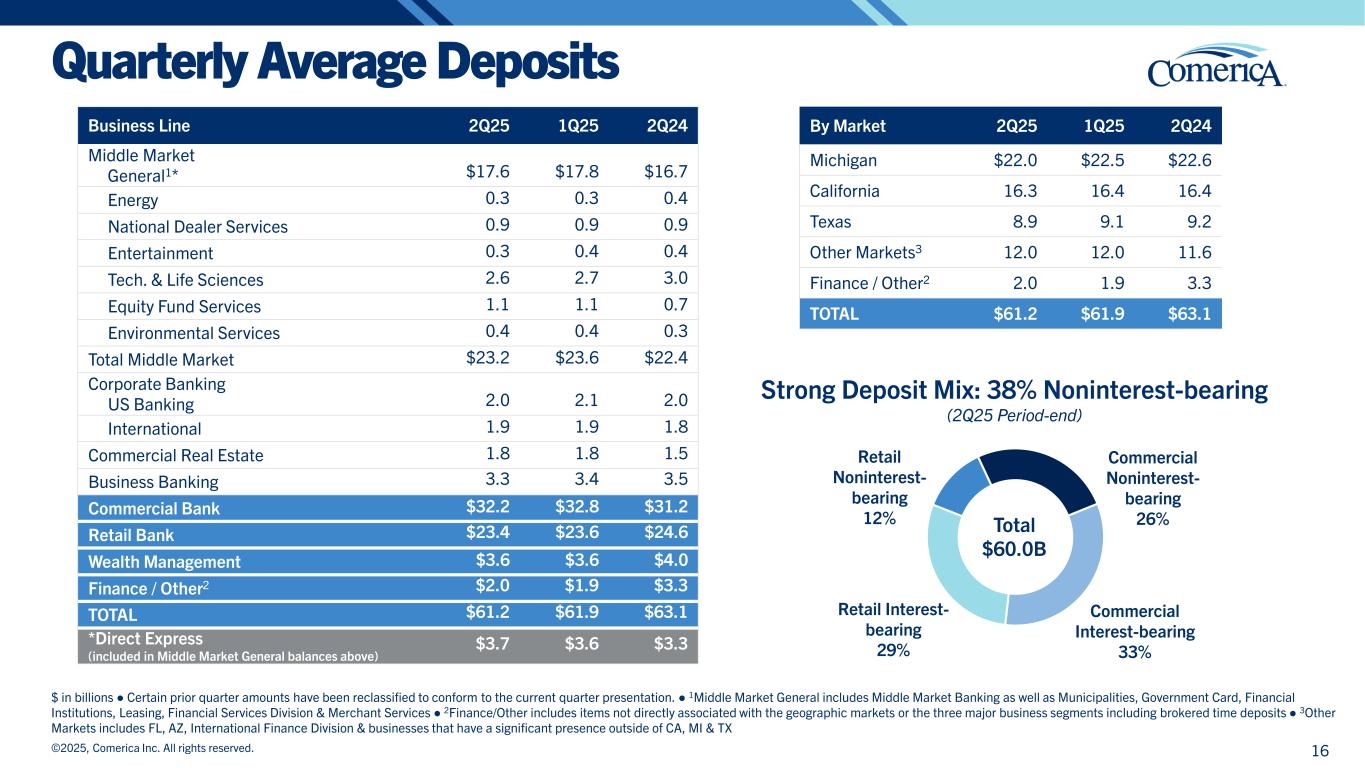
Quarterly Average Deposits $ in billions ● Certain prior quarter amounts have been reclassified to conform to the current quarter presentation. ● 1Middle Market General includes Middle Market Banking as well as Municipalities, Government Card, Financial Institutions, Leasing, Financial Services Division & Merchant Services ● 2Finance/Other includes items not directly associated with the geographic markets or the three major business segments including brokered time deposits ● 3Other Markets includes FL, AZ, International Finance Division & businesses that have a significant presence outside of CA, MI & TX Business Line 2Q25 1Q25 2Q24 Middle Market General1* $17.6 $17.8 $16.7 Energy 0.3 0.3 0.4 National Dealer Services 0.9 0.9 0.9 Entertainment 0.3 0.4 0.4 Tech. & Life Sciences 2.6 2.7 3.0 Equity Fund Services 1.1 1.1 0.7 Environmental Services 0.4 0.4 0.3 Total Middle Market $23.2 $23.6 $22.4 Corporate Banking US Banking 2.0 2.1 2.0 International 1.9 1.9 1.8 Commercial Real Estate 1.8 1.8 1.5 Business Banking 3.3 3.4 3.5 Commercial Bank $32.2 $32.8 $31.2 Retail Bank $23.4 $23.6 $24.6 Wealth Management $3.6 $3.6 $4.0 Finance / Other2 $2.0 $1.9 $3.3 TOTAL $61.2 $61.9 $63.1 *Direct Express (included in Middle Market General balances above) $3.7 $3.6 $3.3 By Market 2Q25 1Q25 2Q24 Michigan $22.0 $22.5 $22.6 California 16.3 16.4 16.4 Texas 8.9 9.1 9.2 Other Markets3 12.0 12.0 11.6 Finance / Other2 2.0 1.9 3.3 TOTAL $61.2 $61.9 $63.1 ©2025, Comerica Inc. All rights reserved. 16 Commercial Noninterest- bearing 26% Commercial Interest-bearing 33% Retail Interest- bearing 29% Retail Noninterest- bearing 12% Strong Deposit Mix: 38% Noninterest-bearing (2Q25 Period-end) Total $60.0B

Driving strong core deposit growth Target Client Segments Consumer & Small Business Commercial Banks & Non-Bank FIs1 Grow deposits with Comerica Maximize®, making cash management easy for small business & business banking clients Drive account openings within Wealth & Retail through tailored offerings focused on client needs Leverage investment in talent to penetrate the market & drive new relationship opportunities Expand high-value client base through evolving pricing strategies that attract & retain significant Commercial deposits Simplify clients’ liquidity management while gaining assurances against risk Develop new partnerships within key verticals that grow deposits & drive fee income Empower other FIs1 to easily manage their liquidity directly with Comerica Partner with embedded finance companies to deliver value to both our clients & our clients’ clients Optimizing high-growth verticals through customized deposit sweeps & key client partnerships 17©2025, Comerica Inc. All rights reserved. 1Financial Institutions
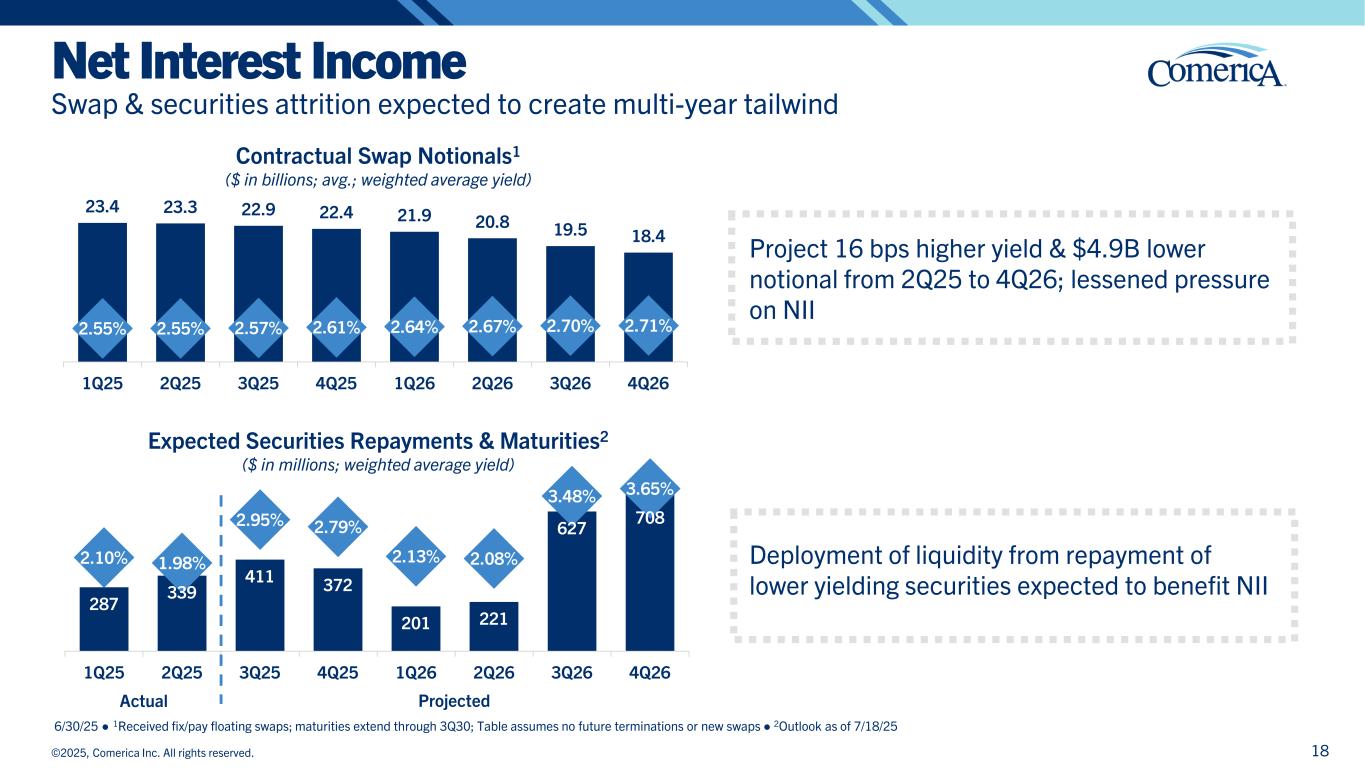
©2025, Comerica Inc. All rights reserved. Net Interest Income Expected Securities Repayments & Maturities2 ($ in millions; weighted average yield) 287 339 411 372 201 221 627 708 2.10% 1.98% 2.95% 2.79% 2.13% 2.08% 3.48% 3.65% 1Q25 2Q25 3Q25 4Q25 1Q26 2Q26 3Q26 4Q26 Contractual Swap Notionals1 ($ in billions; avg.; weighted average yield) Swap & securities attrition expected to create multi-year tailwind Project 16 bps higher yield & $4.9B lower notional from 2Q25 to 4Q26; lessened pressure on NII Deployment of liquidity from repayment of lower yielding securities expected to benefit NII 6/30/25 ● 1Received fix/pay floating swaps; maturities extend through 3Q30; Table assumes no future terminations or new swaps ● 2Outlook as of 7/18/25 23.4 23.3 22.9 22.4 21.9 20.8 19.5 18.4 2.55% 2.55% 2.57% 2.61% 2.64% 2.67% 2.70% 2.71% 1Q25 2Q25 3Q25 4Q25 1Q26 2Q26 3Q26 4Q26 Actual Projected 18
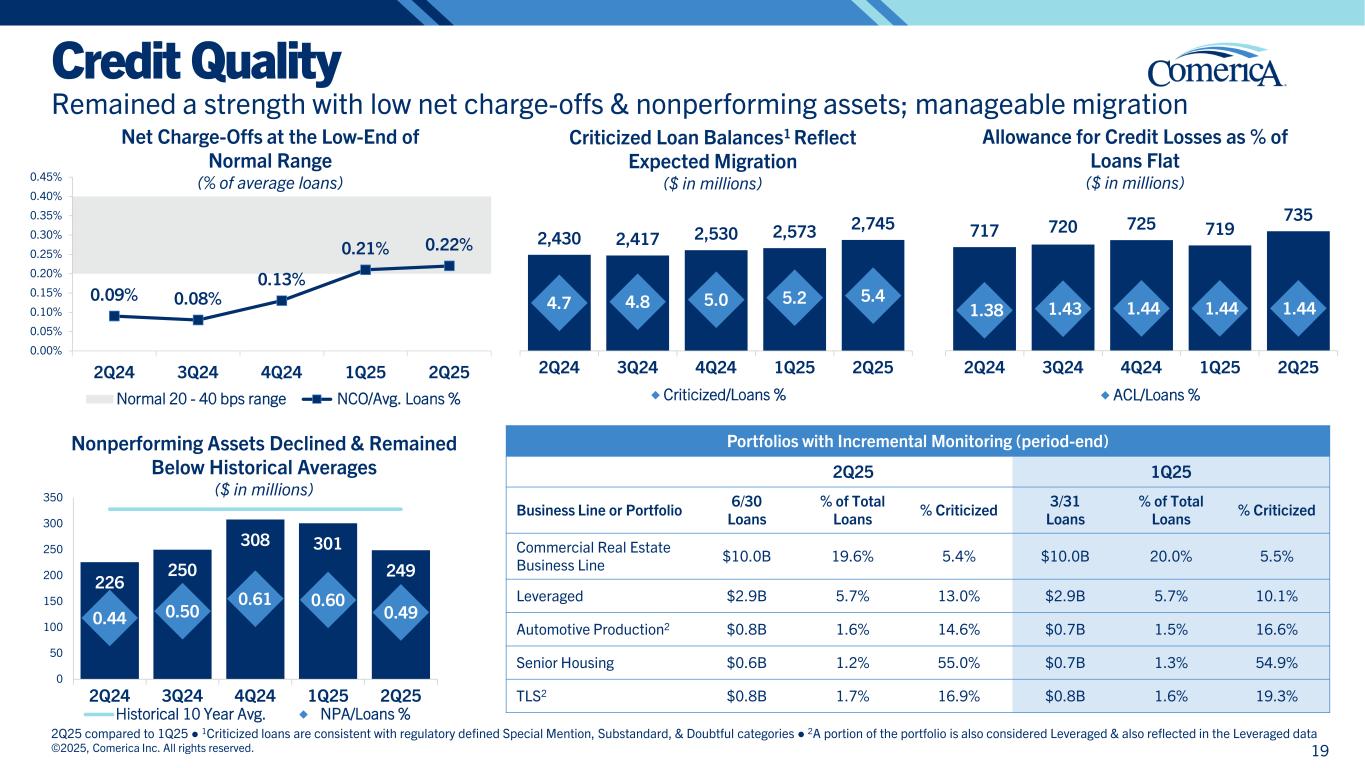
0.09% 0.08% 0.13% 0.21% 0.22% 0.00% 0.05% 0.10% 0.15% 0.20% 0.25% 0.30% 0.35% 0.40% 0.45% 2Q24 3Q24 4Q24 1Q25 2Q25 Normal 20 - 40 bps range NCO/Avg. Loans % Credit Quality Remained a strength with low net charge-offs & nonperforming assets; manageable migration 2Q25 compared to 1Q25 ● 1Criticized loans are consistent with regulatory defined Special Mention, Substandard, & Doubtful categories ● 2A portion of the portfolio is also considered Leveraged & also reflected in the Leveraged data Nonperforming Assets Declined & Remained Below Historical Averages ($ in millions) Criticized Loan Balances1 Reflect Expected Migration ($ in millions) 717 720 725 719 735 1.38 1.43 1.44 1.44 1.44 - 1.00 2.00 3.00 4.00 5.00 6.00 2Q24 3Q24 4Q24 1Q25 2Q25 ACL/Loans % Allowance for Credit Losses as % of Loans Flat ($ in millions) 2,430 2,417 2,530 2,573 2,745 4.7 4.8 5.0 5.2 5.4 - 2.00 4.00 6.00 8.00 10.00 12.00 2Q24 3Q24 4Q24 1Q25 2Q25 Criticized/Loans % ©2025, Comerica Inc. All rights reserved. Net Charge-Offs at the Low-End of Normal Range (% of average loans) Portfolios with Incremental Monitoring (period-end) 2Q25 1Q25 Business Line or Portfolio 6/30 Loans % of Total Loans % Criticized 3/31 Loans % of Total Loans % Criticized Commercial Real Estate Business Line $10.0B 19.6% 5.4% $10.0B 20.0% 5.5% Leveraged $2.9B 5.7% 13.0% $2.9B 5.7% 10.1% Automotive Production2 $0.8B 1.6% 14.6% $0.7B 1.5% 16.6% Senior Housing $0.6B 1.2% 55.0% $0.7B 1.3% 54.9% TLS2 $0.8B 1.7% 16.9% $0.8B 1.6% 19.3% 226 250 308 301 249 0.44 0.50 0.61 0.60 0.49 (0.10) 0.10 0.30 0.50 0.70 0.90 1.10 1.30 1.50 0 50 100 150 200 250 300 350 2Q24 3Q24 4Q24 1Q25 2Q25 Historical 10 Year Avg. NPA/Loans % 19
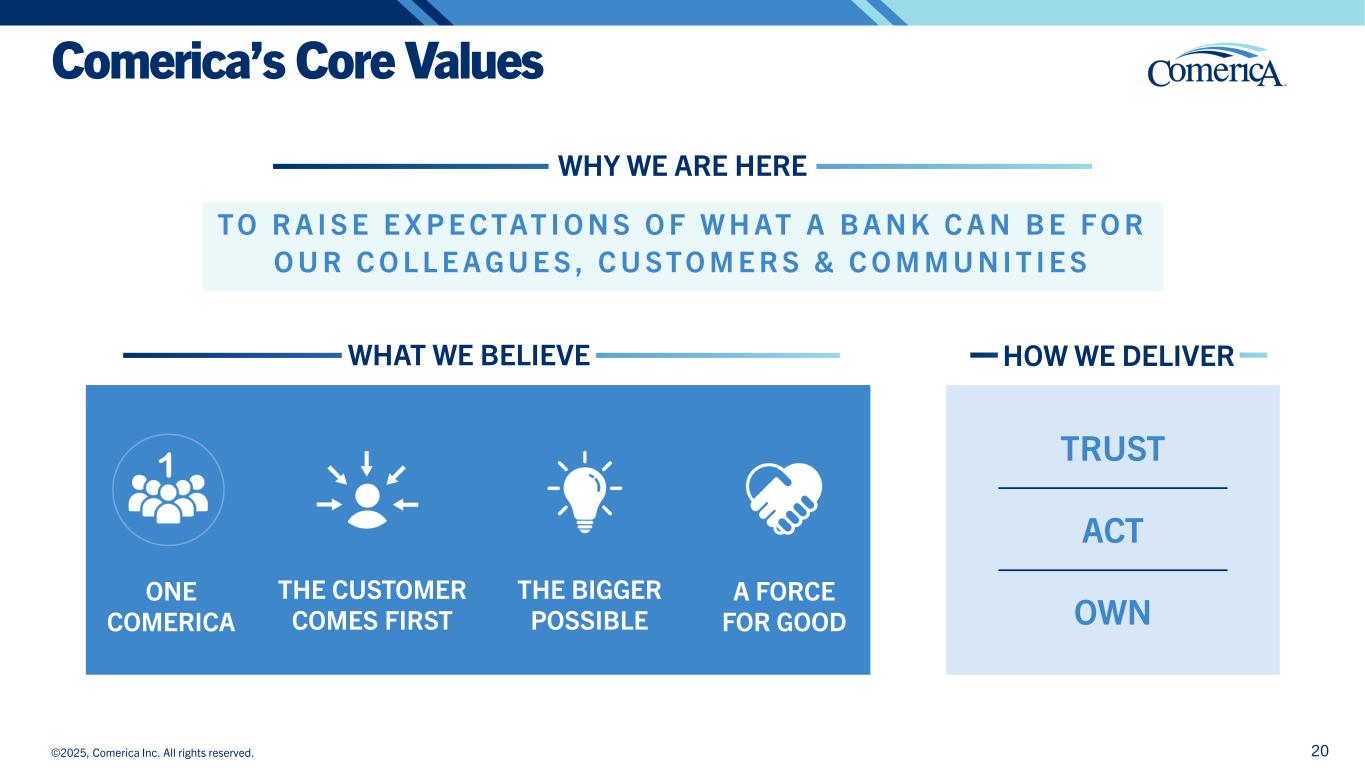
©2025, Comerica Inc. All rights reserved. Comerica’s Core Values 20 T O R A I S E E X P E C TAT I O N S O F W H AT A B A N K C A N B E F O R O U R C O L L E A G U E S , C U S T O M E R S & C O M M U N I T I E S ONE COMERICA THE BIGGER POSSIBLE THE CUSTOMER COMES FIRST A FORCE FOR GOOD TRUST ACT OWN WHAT WE BELIEVE WHY WE ARE HERE HOW WE DELIVER
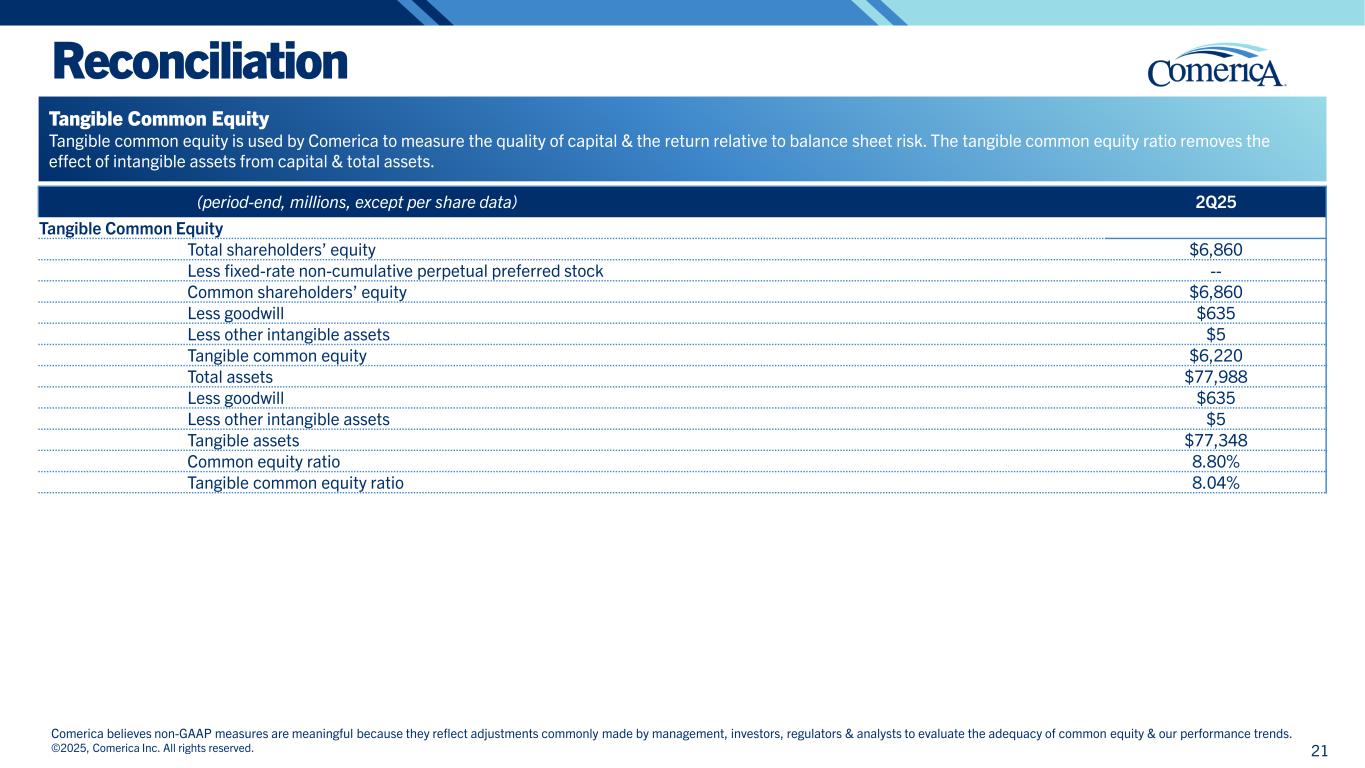
Reconciliation ©2025, Comerica Inc. All rights reserved. 21 (period-end, millions, except per share data) 2Q25 Tangible Common Equity Total shareholders’ equity $6,860 Less fixed-rate non-cumulative perpetual preferred stock -- Common shareholders’ equity $6,860 Less goodwill $635 Less other intangible assets $5 Tangible common equity $6,220 Total assets $77,988 Less goodwill $635 Less other intangible assets $5 Tangible assets $77,348 Common equity ratio 8.80% Tangible common equity ratio 8.04% Tangible Common Equity Tangible common equity is used by Comerica to measure the quality of capital & the return relative to balance sheet risk. The tangible common equity ratio removes the effect of intangible assets from capital & total assets. Comerica believes non-GAAP measures are meaningful because they reflect adjustments commonly made by management, investors, regulators & analysts to evaluate the adequacy of common equity & our performance trends.
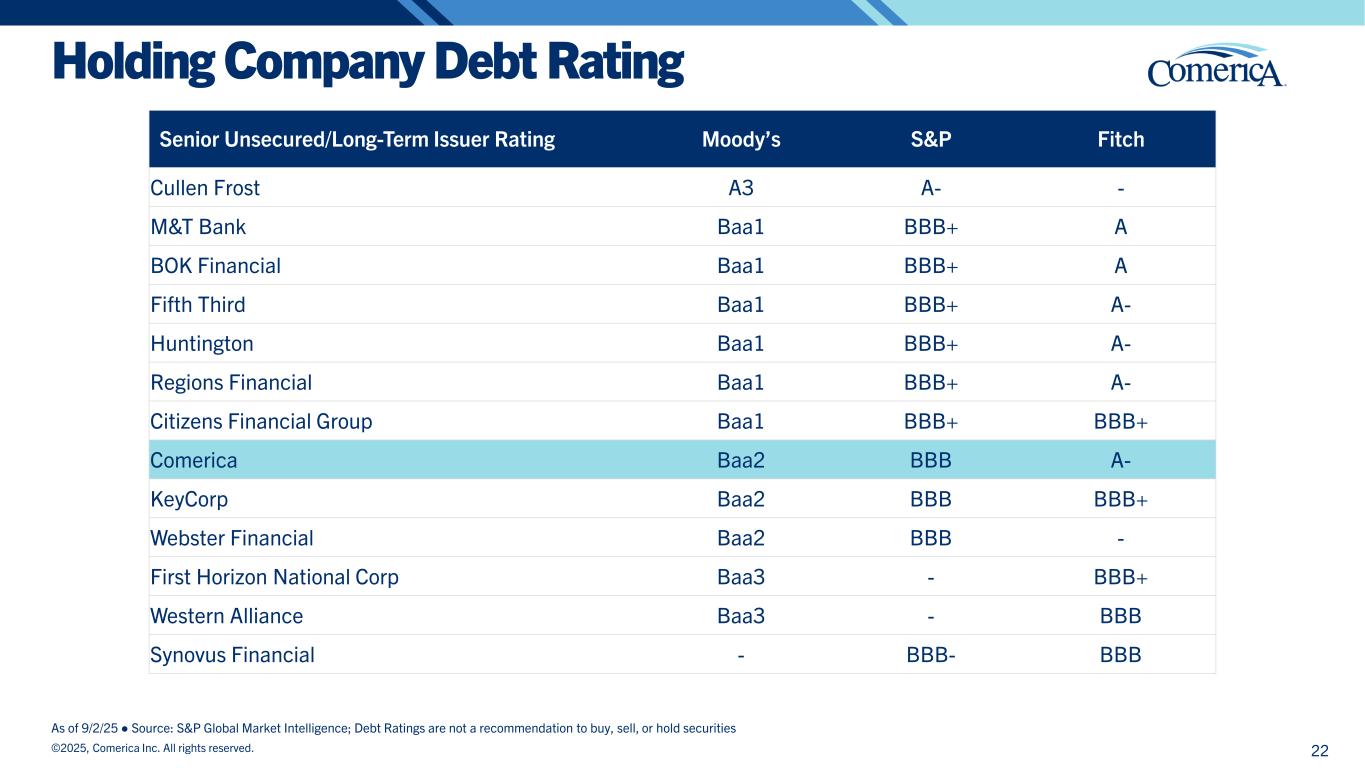
Holding Company Debt Rating As of 9/2/25 ● Source: S&P Global Market Intelligence; Debt Ratings are not a recommendation to buy, sell, or hold securities Senior Unsecured/Long-Term Issuer Rating Moody’s S&P Fitch Cullen Frost A3 A- - M&T Bank Baa1 BBB+ A BOK Financial Baa1 BBB+ A Fifth Third Baa1 BBB+ A- Huntington Baa1 BBB+ A- Regions Financial Baa1 BBB+ A- Citizens Financial Group Baa1 BBB+ BBB+ Comerica Baa2 BBB A- KeyCorp Baa2 BBB BBB+ Webster Financial Baa2 BBB - First Horizon National Corp Baa3 - BBB+ Western Alliance Baa3 - BBB Synovus Financial - BBB- BBB ©2025, Comerica Inc. All rights reserved. 22
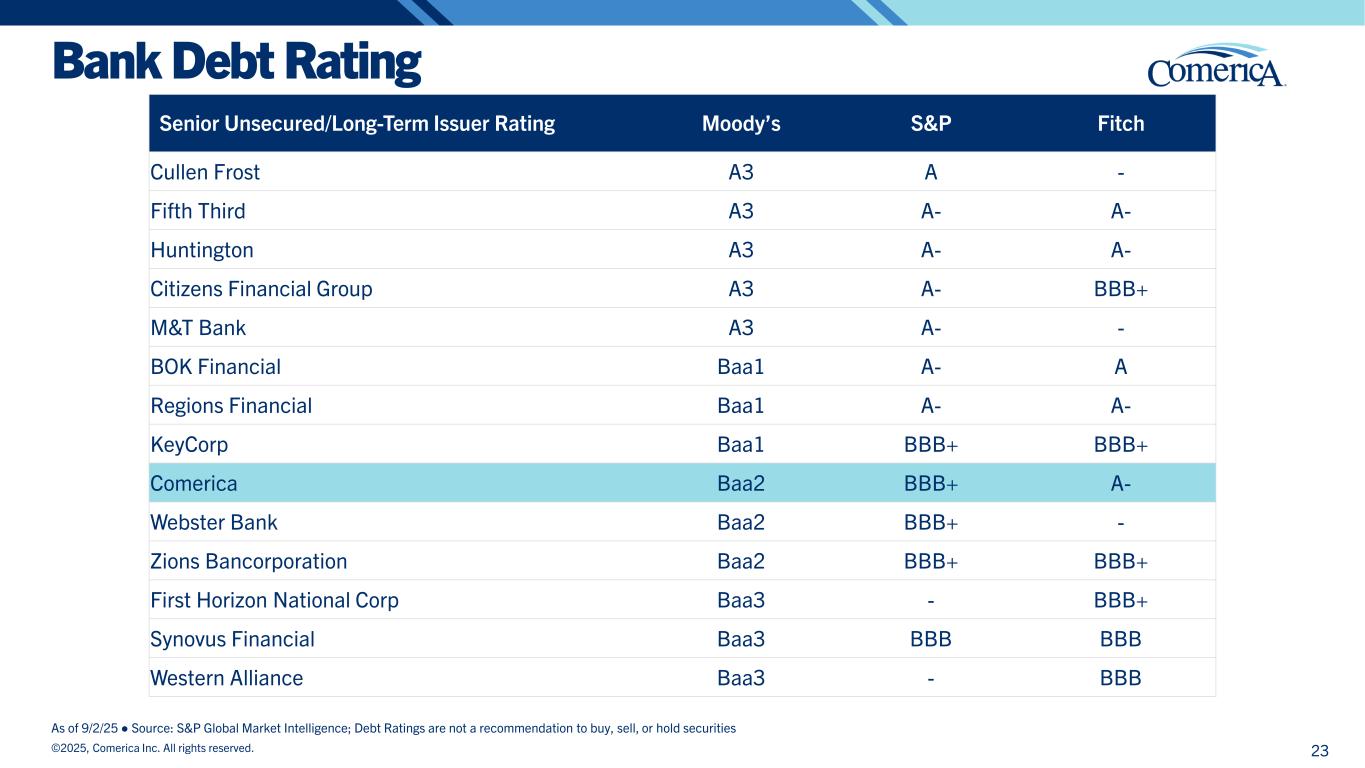
Bank Debt Rating As of 9/2/25 ● Source: S&P Global Market Intelligence; Debt Ratings are not a recommendation to buy, sell, or hold securities Senior Unsecured/Long-Term Issuer Rating Moody’s S&P Fitch Cullen Frost A3 A - Fifth Third A3 A- A- Huntington A3 A- A- Citizens Financial Group A3 A- BBB+ M&T Bank A3 A- - BOK Financial Baa1 A- A Regions Financial Baa1 A- A- KeyCorp Baa1 BBB+ BBB+ Comerica Baa2 BBB+ A- Webster Bank Baa2 BBB+ - Zions Bancorporation Baa2 BBB+ BBB+ First Horizon National Corp Baa3 - BBB+ Synovus Financial Baa3 BBB BBB Western Alliance Baa3 - BBB ©2025, Comerica Inc. All rights reserved. 23
Thank You ©2025, Comerica Inc. All rights reserved.