2025 Investor Day February 26, 2025 dieboldnixdorf.com
Forward-looking Statements 2 This presentation may contain statements that are not historical information and are "forward-looking statements" within the meaning of the Private Securities Litigation Reform Act of 1995. Forward- looking statements give current expectations or forecasts of future events and are not guarantees of future performance. These forward-looking statements include, but are not limited to, projections, statements regarding the Company's expected future performance (including expected results of operations and financial guidance), future financial condition, anticipated operating results, strategy plans, future liquidity and financial position. Statements can generally be identified as forward looking because they include words such as “believes,” “anticipates,” “expects,” “intends,” “plans,” “will,” “estimates,” “potential,” “target,” “predict,” “project,” “seek,” and variations thereof or “could,” “should” or words of sim ilar meaning. Statements that describe the Company's future plans, objectives or goals are also forward-looking statements, which reflect the current views of the Company with respect to future events and are subject to assumptions, risks and uncertainties that could cause actual results to differ materially. Although the Company believes that these forward-looking statements are based upon reasonable assumptions regarding, among other things, the economy, its knowledge of its business, and key performance indicators that impact the Company, these forward-looking statements involve risks, uncertainties and other factors that may cause actual results to differ materially from those expressed in or implied by the forward-looking statements. Readers are cautioned not to place undue reliance on these forward-looking statements, which speak only as of the date hereof. The factors that may affect the Company's results include, among others: the significant variance of our actual financial results from the projections that were filed with the U.S. Bankruptcy Court and Dutch Court; the success of the Company’s new products and services, including its DN Series line and EASY family of retail checkout solutions, and electronic vehicle charging service business; the Company’s ability to successfully execute on its digitally enabled hardware, services and software strategy; the Company’s ability to generate sufficient cash flows to refinance its indebtedness, fund its operations and make adequate capital investments; the ultimate benefits of the Company’s continuous improvement programs and other cost savings plans; risks related to our international operations, including geopolitical instability and wars; developments from recent and potential changes in U.S. trade policies and trade policies of other countries; the impact of the proliferation of payment options other than cash, which could result in a reduced need for cash in the marketplace and a resulting decline in the usage of ATMs; the impact of general economic conditions, cyclicality and uncertainty; the impact of increased energy, raw material and labor costs; the impact of competitive pressures, including pricing pressures and the introduction of new products and services by our competitors; the impact of a cybersecurity incident or operational failure on the Company’s business; challenges associated with the use of artificial intelligence in the Company’s business; the Company’s reliance on suppliers, subcontractors and availability of raw materials and other components; the Company’s reliance on third parties, including to provide security systems and systems integration as well as outsourced business processes and other financial services; the Company’s ability to attract, retain and motivate key employees; the impact of additional tax expense or exposures; the potential for additional pension liability or expense associated with low investment performance by the Company’s pension plan assets; the Company’s success in executing potential acquisitions, investments or partnerships and divestitures; the ultimate outcome of the appeals for the appraisal proceedings initiated in connection with the implementation of the Domination and Profit Loss Transfer Agreement with the former Diebold Nixdorf AG (which was dismissed in the Company’s favor at the lower court level in 2022) and the merger/squeeze-out (which was dismissed in the Company's favor at the lower court level in 2023); the impact of market and economic conditions, including the bankruptcies, restructuring or consolidations of financial institutions, which could reduce the Company’s customer base and/or adversely affect its customers' ability to make capital expenditures, as well as adversely impact the availability and cost of credit; changes in political, economic or other factors such as currency exchange rates, inflation rates (including the impact of possible currency devaluations in countries experiencing high inflation rates), recessionary or expansive trends, disruption in energy supply, taxes and regulations and laws affecting the worldwide business in each of the Company’s operations; the Company’s ability to maintain effective internal controls; the impact of regulatory and financial risks related to climate change; the impact of an adverse determination that that the Company's services, products or manufacturing processes infringe the intellectual property rights of others, or the Company’s failure to enforce its intellectual property rights; the Company’s exposure to liabilities under the FCPA or other worldwide anti-bribery laws; the effect of changes in law and regulations or the manner of enforcement in the U.S. and internationally and the Company’s ability to comply with applicable laws and regulations; and other factors included in the Company’s filings with the Securities and Exchange Commission (the "SEC"), including its Annual Report on Form 10-K. Except to the extent required by applicable law or regulation, the Company undertakes no obligation to update these forward-looking statements to reflect future events or circumstances or to reflect the occurrence of unanticipated events. You should consider these factors carefully in evaluating forward- looking statements and are cautioned not to place undue reliance on such statements.
Use of Non-GAAP Financial Information 3 To supplement our condensed consolidated financial information presented in accordance with GAAP, the Company considers certain financial measures that are not prepared in accordance with GAAP, including Non-GAAP results, Non-GAAP operating profit margin, adjusted diluted earnings per share, free cash flow (use) and free cash flow conversion, net debt, EBITDA, adjusted EBITDA, adjusted EBITDA margin and constant currency results. The Company calculates constant currency by translating the prior year results at current year exchange rates. The Company uses these Non-GAAP financial measures, in addition to GAAP financial measures, to evaluate our operating and financial performance and to compare such performance to that of prior periods and to the performance of our competitors. Also, the Company uses these Non-GAAP financial measures in making operational and financial decisions and in establishing operational goals. The Company also believes providing these Non-GAAP financial measures to investors, as a supplement to GAAP financial measures, helps investors evaluate our operating and financial performance and trends in our business, consistent with how management evaluates such performance and trends. The Company also believes these Non-GAAP financial measures may be useful to investors in comparing its performance to the performance of other companies, although its Non-GAAP financial measures are specific to the Company and the Non-GAAP financial measures of other companies may not be calculated in the same manner. We provide EBITDA, Adjusted EBITDA and adjusted EBITDA margin because we believe that investors and securities analysts will find EBITDA, adjusted EBITDA and adjusted EBITDA margin to be useful measures for evaluating our operating performance and comparing our operating performance with that of similar companies that have different capital structures and for evaluating our ability to meet our future debt service, capital expenditure and working capital requirements. We consider free cash flow (use) to be a liquidity measure that provides useful information to management and investors about the amount of cash generated by the business that, after the purchase of property and equipment and capitalized software development and changes in cash of assets held for sale and the use of cash for M&A, and excluding the use/proceeds of cash for the settlement of foreign exchange derivative instruments, can be used for debt servicing, strategic opportunities, including investing in the business, making strategic acquisitions, strengthening the balance sheet and paying dividends. Free Cash Flow Conversion is a liquidity ratio that measures the Company's ability to convert operating profits into free cash flow and is calculated as Free Cash Flow over Adjusted EBITDA. For more information, please refer to the section, "Notes for Non-GAAP Measures." With respect to the company’s adjusted EBITDA, free cash flow and free cash flow conversion (free cash flow / adjusted EBITDA) estimated outlook for 2025-2027, it is not providing reconciliations to the most directly comparable GAAP financial measures because it is unable to predict with reasonable certainty those items that may affect such measures calculated and presented in accordance with GAAP without unreasonable effort. These measures primarily exclude future restructuring and refinancing actions and net non-routine items. These reconciling items are uncertain, depend on various factors and could significantly impact, either individually or in the aggregate, operating profit and net income calculated and presented in accordance with GAAP.
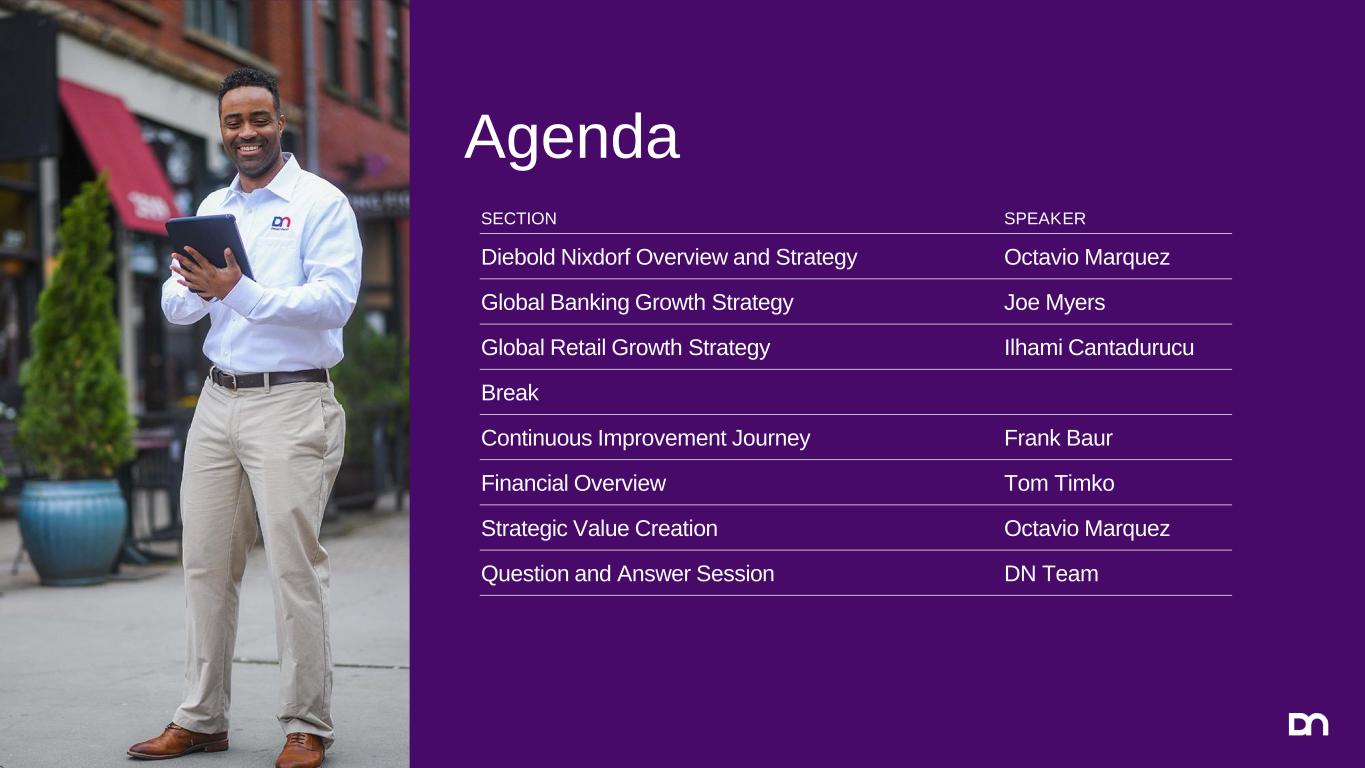
Agenda SECTION SPEAKER Diebold Nixdorf Overview and Strategy Octavio Marquez Global Banking Growth Strategy Joe Myers Global Retail Growth Strategy Ilhami Cantadurucu Break Continuous Improvement Journey Frank Baur Financial Overview Tom Timko Strategic Value Creation Octavio Marquez Question and Answer Session DN Team

Diebold Nixdorf Overview and Strategy Octavio Marquez President & Chief Executive Officer
Diebold Nixdorf Overview
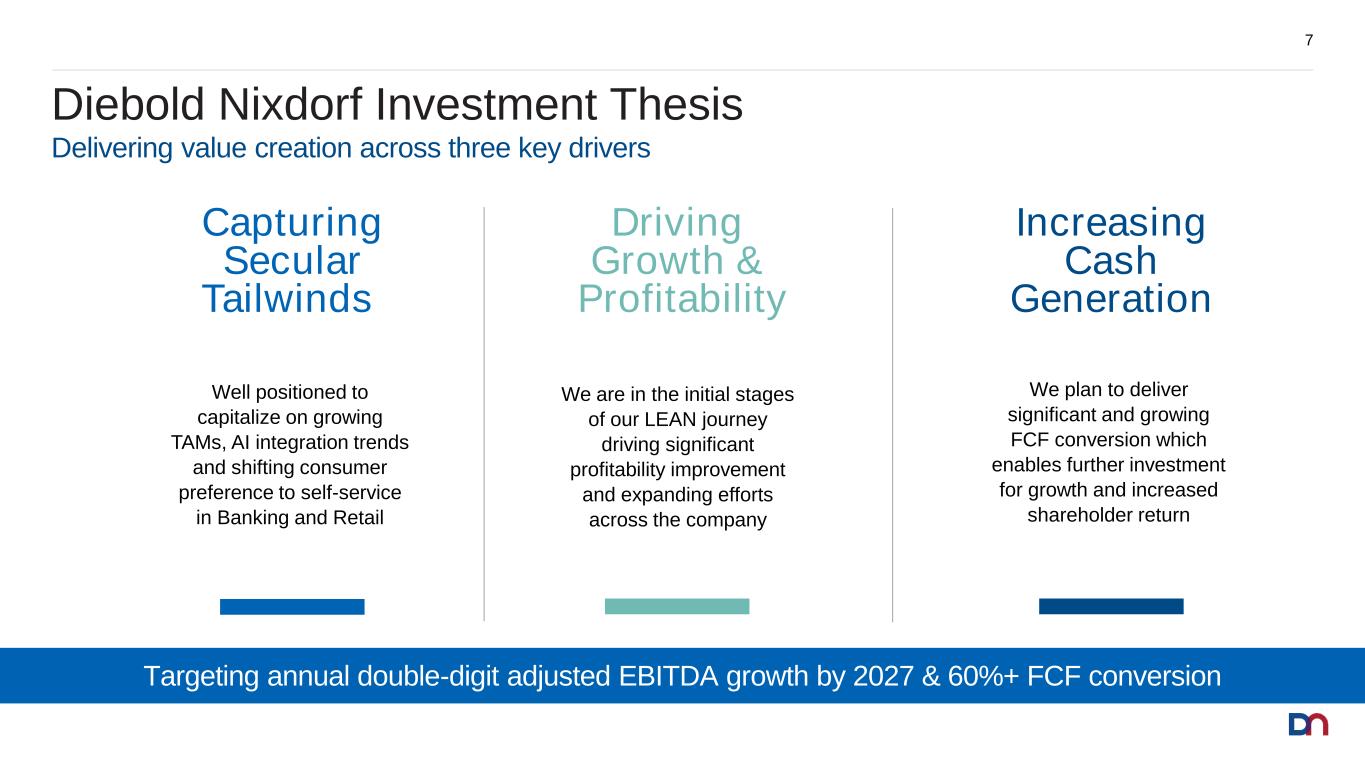
Diebold Nixdorf Investment Thesis 7 Delivering value creation across three key drivers Well positioned to capitalize on growing TAMs, AI integration trends and shifting consumer preference to self-service in Banking and Retail Capturing Secular Tailwinds We are in the initial stages of our LEAN journey driving significant profitability improvement and expanding efforts across the company Driving Growth & Profitability We plan to deliver significant and growing FCF conversion which enables further investment for growth and increased shareholder return Increasing Cash Generation Targeting annual double-digit adjusted EBITDA growth by 2027 & 60%+ FCF conversion
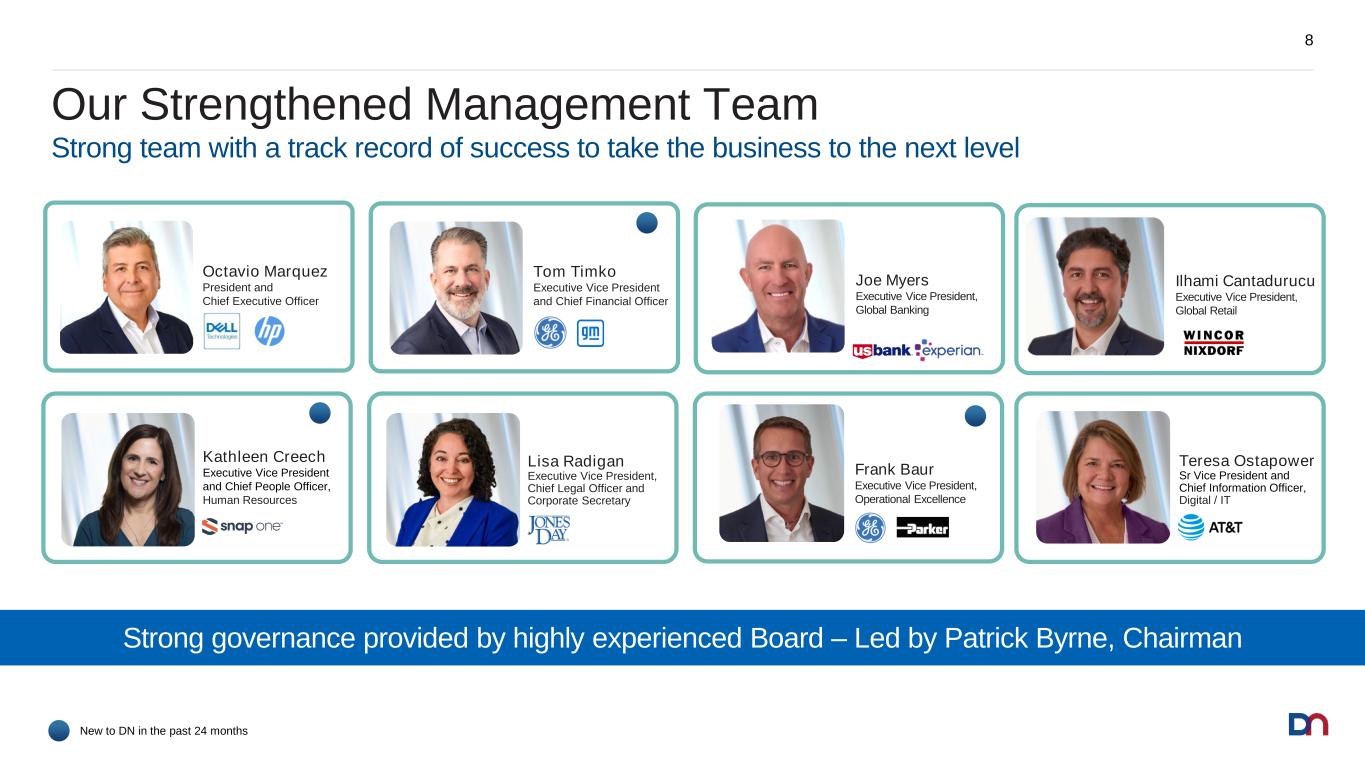
Our Strengthened Management Team 8 Strong team with a track record of success to take the business to the next level Teresa Ostapower Sr Vice President and Chief Information Officer, Digital / IT Lisa Radigan Executive Vice President, Chief Legal Officer and Corporate Secretary Octavio Marquez President and Chief Executive Officer Ilhami Cantadurucu Executive Vice President, Global Retail New to DN in the past 24 months Frank Baur Executive Vice President, Operational Excellence Kathleen Creech Executive Vice President and Chief People Officer, Human Resources Tom Timko Executive Vice President and Chief Financial Officer Joe Myers Executive Vice President, Global Banking Strong governance provided by highly experienced Board – Led by Patrick Byrne, Chairman
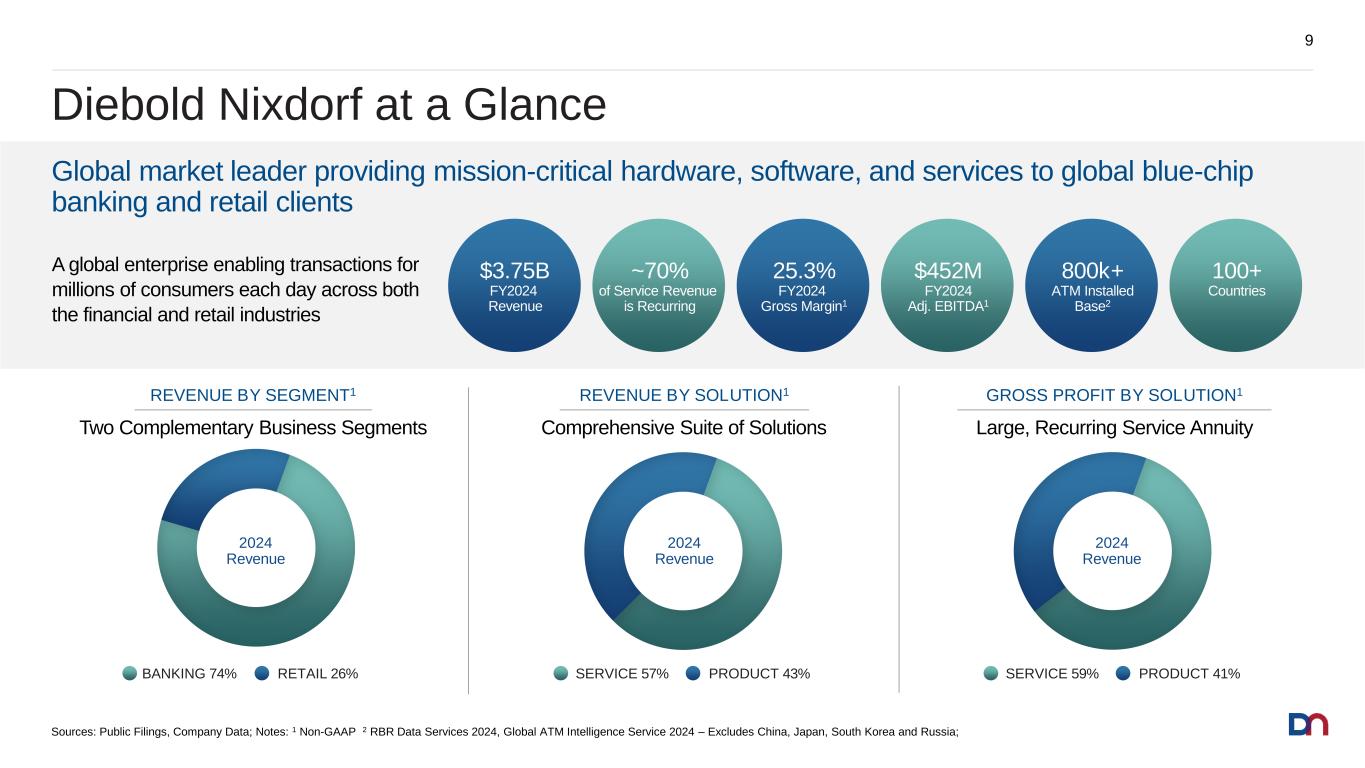
Diebold Nixdorf at a Glance 9 800k+ ATM Installed Base2 $452M FY2024 Adj. EBITDA1 25.3% FY2024 Gross Margin1 ~70% of Service Revenue is Recurring $3.75B FY2024 Revenue Global market leader providing mission-critical hardware, software, and services to global blue-chip banking and retail clients A global enterprise enabling transactions for millions of consumers each day across both the financial and retail industries 2024 Revenue RETAIL 26%BANKING 74% REVENUE BY SEGMENT1 2024 Revenue PRODUCT 43%SERVICE 57% REVENUE BY SOLUTION1 2024 Revenue GROSS PROFIT BY SOLUTION1 Sources: Public Filings, Company Data; Notes: 1 Non-GAAP 2 RBR Data Services 2024, Global ATM Intelligence Service 2024 – Excludes China, Japan, South Korea and Russia; 100+ Countries Two Complementary Business Segments Comprehensive Suite of Solutions Large, Recurring Service Annuity PRODUCT 41%SERVICE 59%
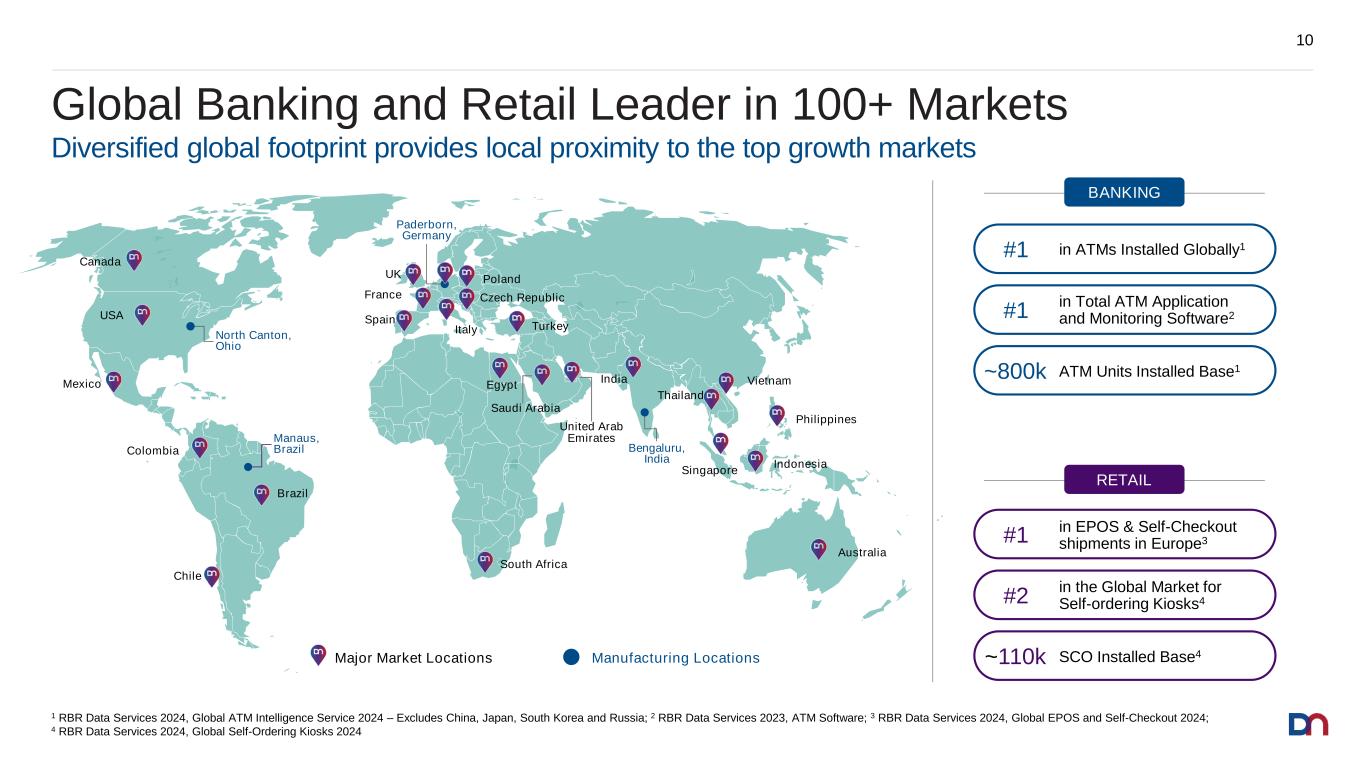
Global Banking and Retail Leader in 100+ Markets 10 RETAIL SCO Installed Base4~110k in the Global Market for Self-ordering Kiosks4#2 in EPOS & Self-Checkout shipments in Europe3#1 BANKING ATM Units Installed Base1~800k in Total ATM Application and Monitoring Software2#1 in ATMs Installed Globally1#1 BANKING 1 RBR Data Services 2024, Global ATM Intelligence Service 2024 – Excludes China, Japan, South Korea and Russia; 2 RBR Data Services 2023, ATM Software; 3 RBR Data Services 2024, Global EPOS and Self-Checkout 2024; 4 RBR Data Services 2024, Global Self-Ordering Kiosks 2024 Canada USA Mexico Colombia Brazil Chile Australia Indonesia Philippines Vietnam Thailand India Singapore United Arab Emirates Poland Czech Republic Turkey UK France Spain Italy South Africa Egypt Saudi Arabia Diversified global footprint provides local proximity to the top growth markets North Canton, Ohio Manaus, Brazil Paderborn, Germany Major Market Locations Manufacturing Locations Bengaluru, India
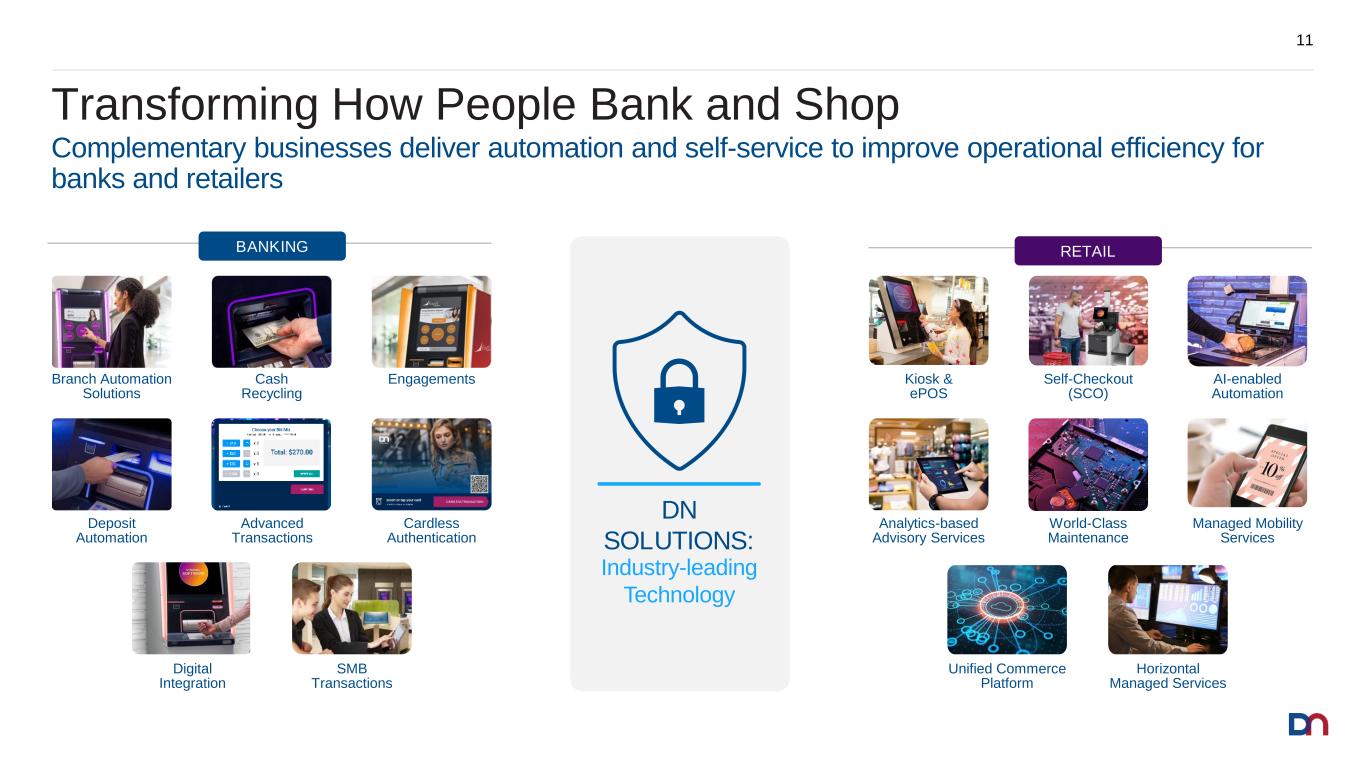
Transforming How People Bank and Shop 11 Complementary businesses deliver automation and self-service to improve operational efficiency for banks and retailers DN SOLUTIONS: Industry-leading Technology BANKING SMB Transactions Digital Integration Cardless Authentication Deposit Automation Advanced Transactions Cash Recycling EngagementsBranch Automation Solutions RETAIL Horizontal Managed Services Unified Commerce Platform World-Class Maintenance Analytics-based Advisory Services Managed Mobility Services Kiosk & ePOS Self-Checkout (SCO) AI-enabled Automation
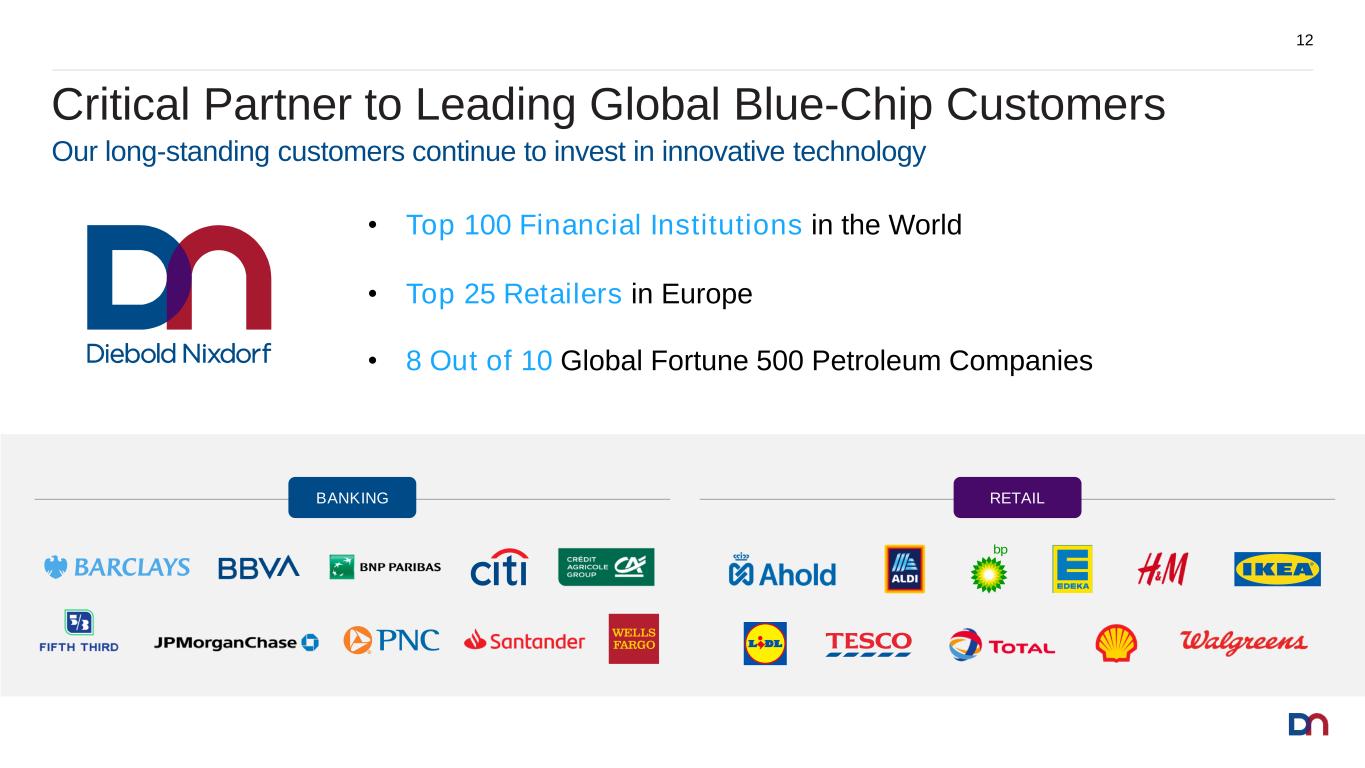
Critical Partner to Leading Global Blue-Chip Customers 12 • Top 100 Financial Institutions in the World • Top 25 Retailers in Europe • 8 Out of 10 Global Fortune 500 Petroleum Companies Our long-standing customers continue to invest in innovative technology BANKING RETAIL
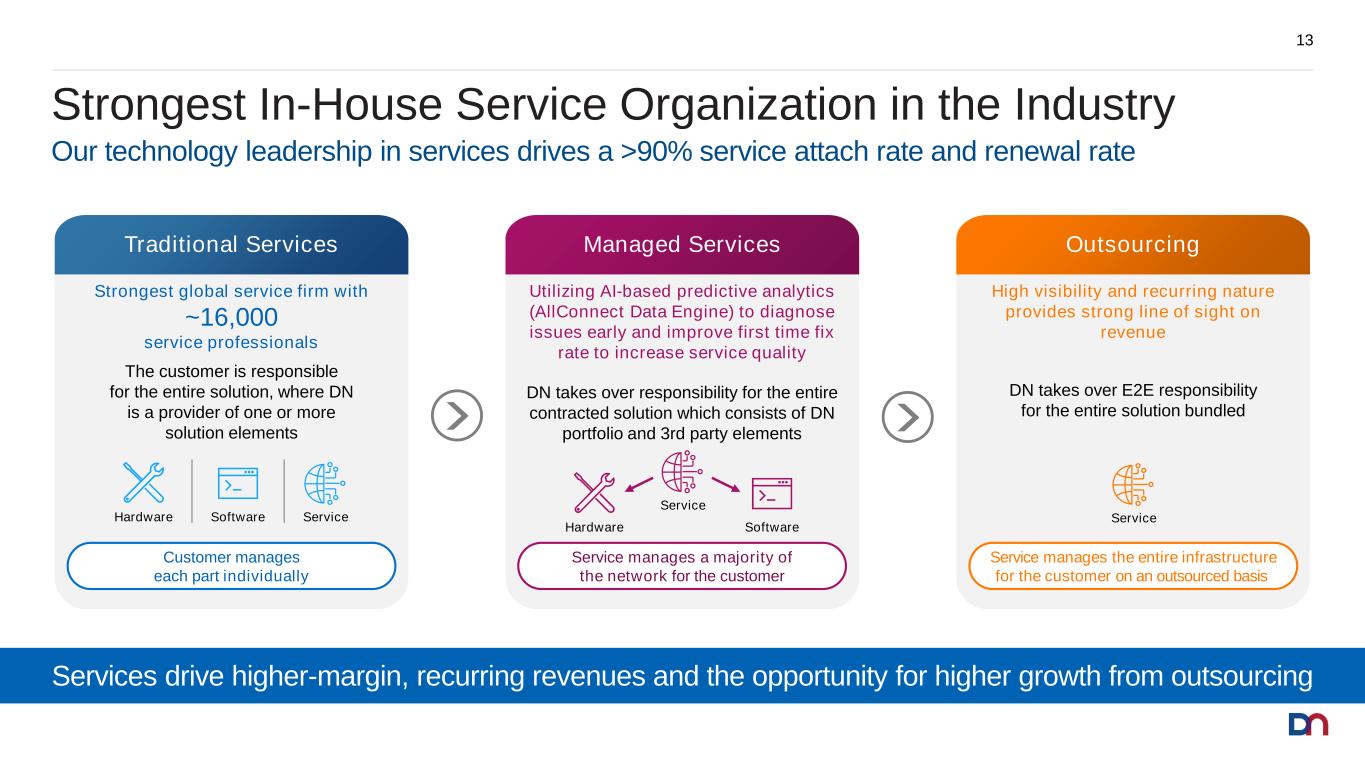
Strongest In-House Service Organization in the Industry 13 Our technology leadership in services drives a >90% service attach rate and renewal rate Service manages a majority of the network for the customer Managed Services Utilizing AI-based predictive analytics (AllConnect Data Engine) to diagnose issues early and improve first time fix rate to increase service quality DN takes over responsibility for the entire contracted solution which consists of DN portfolio and 3rd party elements Service SoftwareHardware Customer manages each part individually Traditional Services Strongest global service firm with ~16,000 service professionals The customer is responsible for the entire solution, where DN is a provider of one or more solution elements ServiceSoftwareHardware Service manages the entire infrastructure for the customer on an outsourced basis Outsourcing High visibility and recurring nature provides strong line of sight on revenue DN takes over E2E responsibility for the entire solution bundled Service Services drive higher-margin, recurring revenues and the opportunity for higher growth from outsourcing
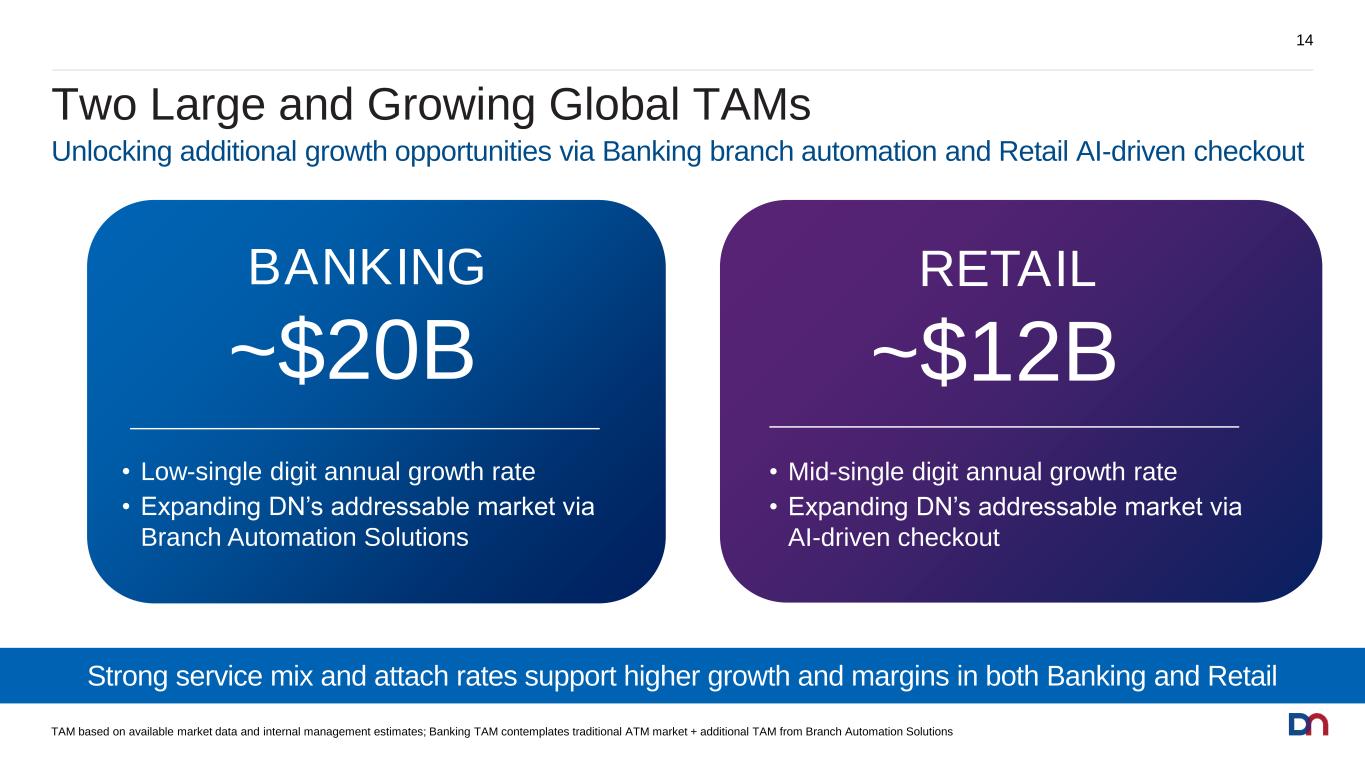
Two Large and Growing Global TAMs 14 Unlocking additional growth opportunities via Banking branch automation and Retail AI-driven checkout TAM based on available market data and internal management estimates; Banking TAM contemplates traditional ATM market + additional TAM from Branch Automation Solutions BANKING ~$20B • Low-single digit annual growth rate • Expanding DN’s addressable market via Branch Automation Solutions RETAIL ~$12B • Mid-single digit annual growth rate • Expanding DN’s addressable market via AI-driven checkout Strong service mix and attach rates support higher growth and margins in both Banking and Retail
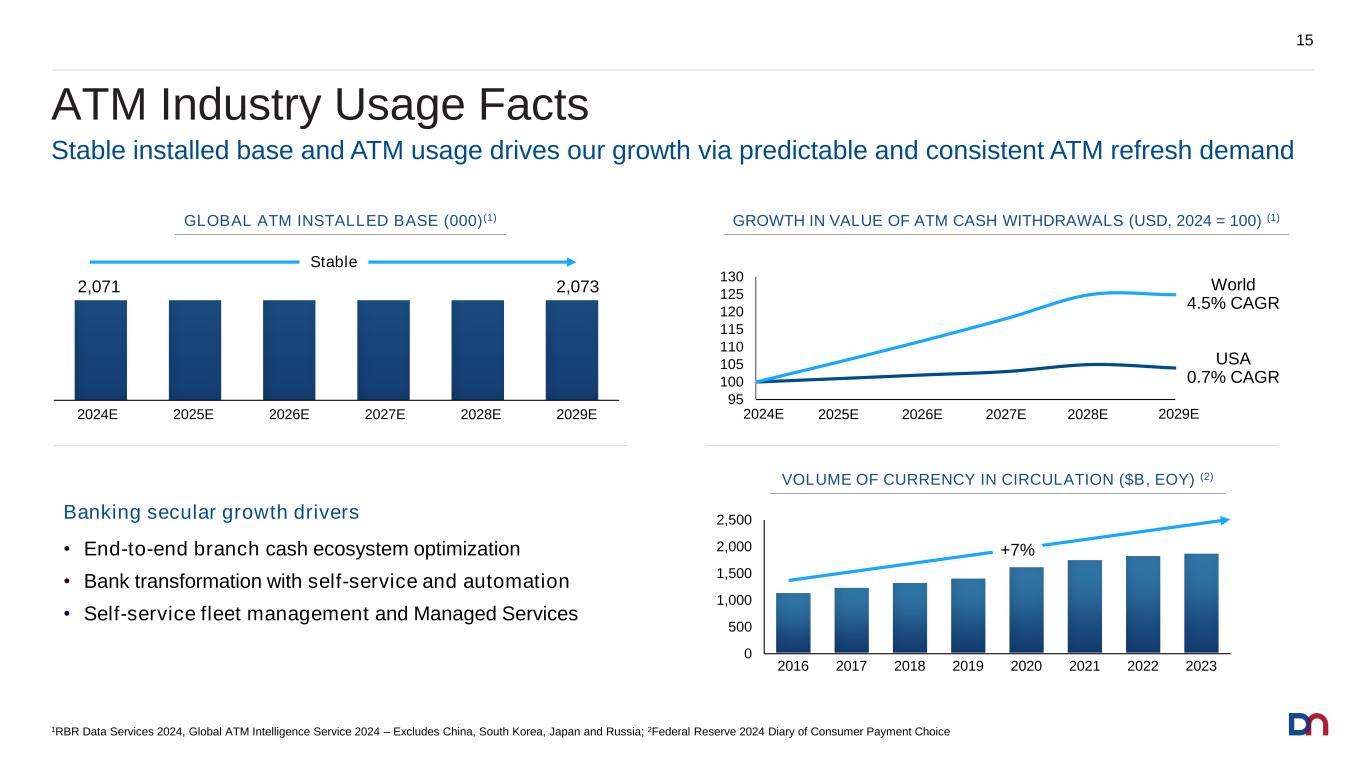
ATM Industry Usage Facts 15 Stable installed base and ATM usage drives our growth via predictable and consistent ATM refresh demand 2024E 2025E 2026E 2027E 2,071 2,073 Stable Banking secular growth drivers • End-to-end branch cash ecosystem optimization • Bank transformation with self-service and automation • Self-service fleet management and Managed Services 2028E 2029E 1RBR Data Services 2024, Global ATM Intelligence Service 2024 – Excludes China, South Korea, Japan and Russia; 2Federal Reserve 2024 Diary of Consumer Payment Choice 0 500 1,000 1,500 2,000 2,500 USA 0.7% CAGR World 4.5% CAGR +7% GLOBAL ATM INSTALLED BASE (000)(1) GROWTH IN VALUE OF ATM CASH WITHDRAWALS (USD, 2024 = 100) (1) VOLUME OF CURRENCY IN CIRCULATION ($B, EOY) (2) 2017 2018 2019 2020 2021 2022 20232016 95 100 105 110 115 120 125 130 2024 2025 2026 2027 2028 20292024E 2025E 2026E 2027E 2028E E
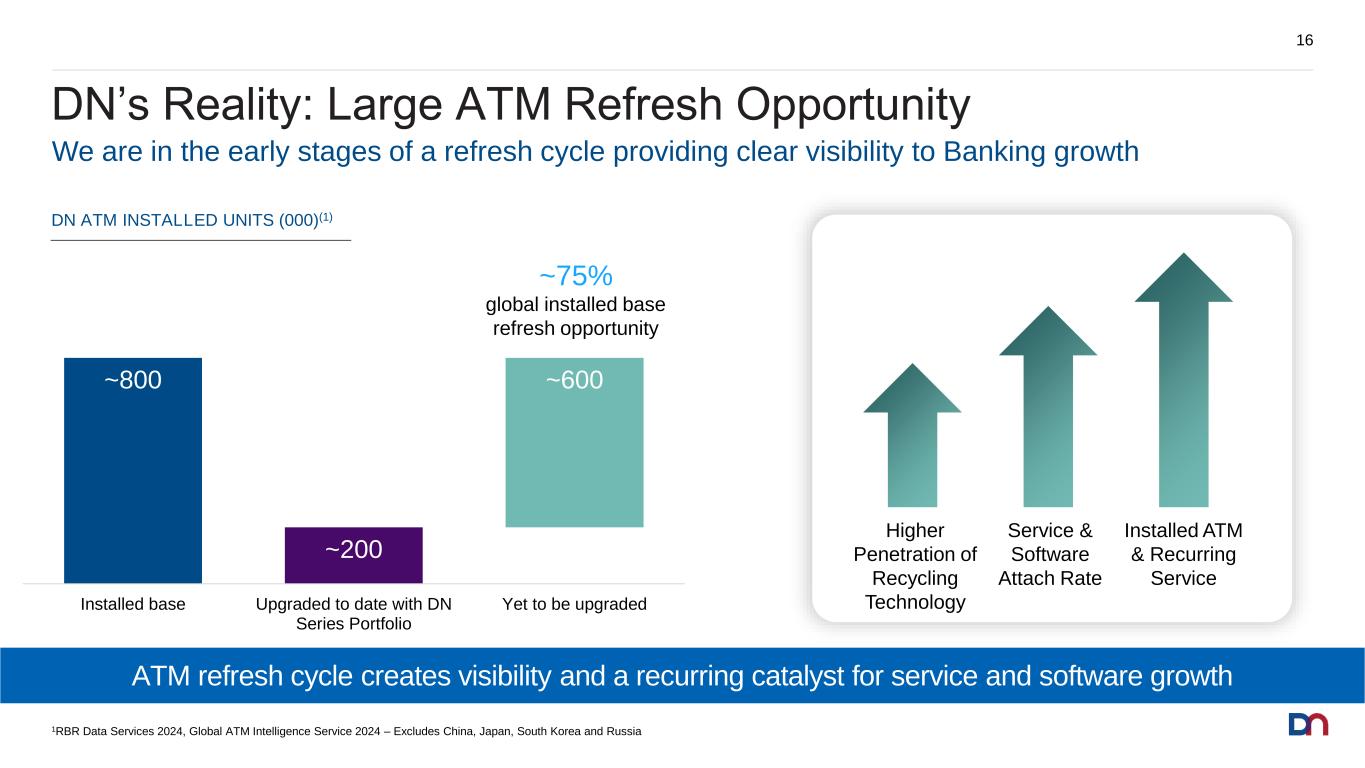
~200 ~800 ~600 Installed base Upgraded to date with DN Series Portfolio Yet to be upgraded DN’s Reality: Large ATM Refresh Opportunity 16 DN ATM INSTALLED UNITS (000)(1) Higher Penetration of Recycling Technology Service & Software Attach Rate Installed ATM & Recurring Service 1RBR Data Services 2024, Global ATM Intelligence Service 2024 – Excludes China, Japan, South Korea and Russia We are in the early stages of a refresh cycle providing clear visibility to Banking growth ~75% global installed base refresh opportunity ATM refresh cycle creates visibility and a recurring catalyst for service and software growth
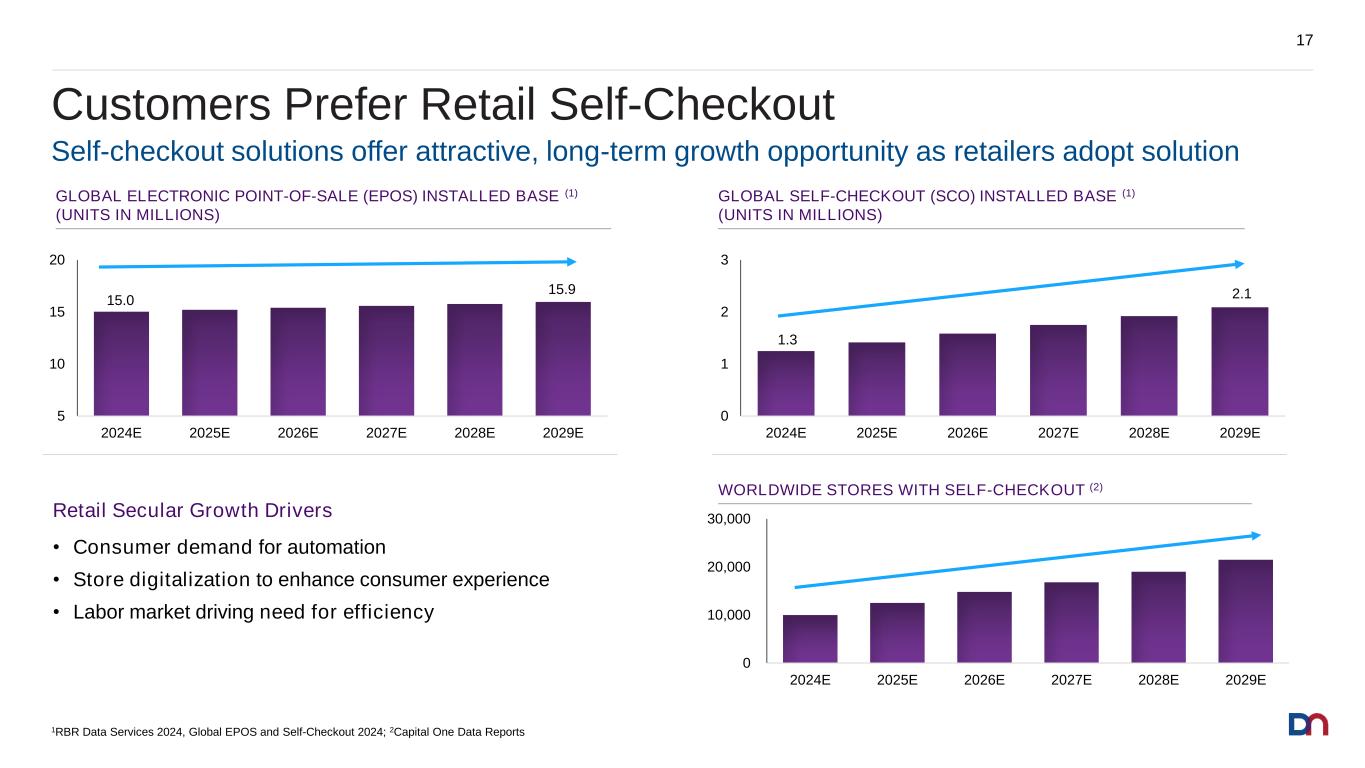
Customers Prefer Retail Self-Checkout 17 0 10,000 20,000 30,000 2024E 2025E 2026E 2027E 2028E 2029E Self-checkout solutions offer attractive, long-term growth opportunity as retailers adopt solution Retail Secular Growth Drivers • Consumer demand for automation • Store digitalization to enhance consumer experience • Labor market driving need for efficiency WORLDWIDE STORES WITH SELF-CHECKOUT (2) 1RBR Data Services 2024, Global EPOS and Self-Checkout 2024; 2Capital One Data Reports 5 10 15 20 2024E 2025E 2026E 2027E 2028E 2029E GLOBAL ELECTRONIC POINT-OF-SALE (EPOS) INSTALLED BASE (1) (UNITS IN MILLIONS) 15.0 15.9 0 1 2 3 2024E 2025E 2026E 2027E 2028E 2029E GLOBAL SELF-CHECKOUT (SCO) INSTALLED BASE (1) (UNITS IN MILLIONS) 1.3 2.1
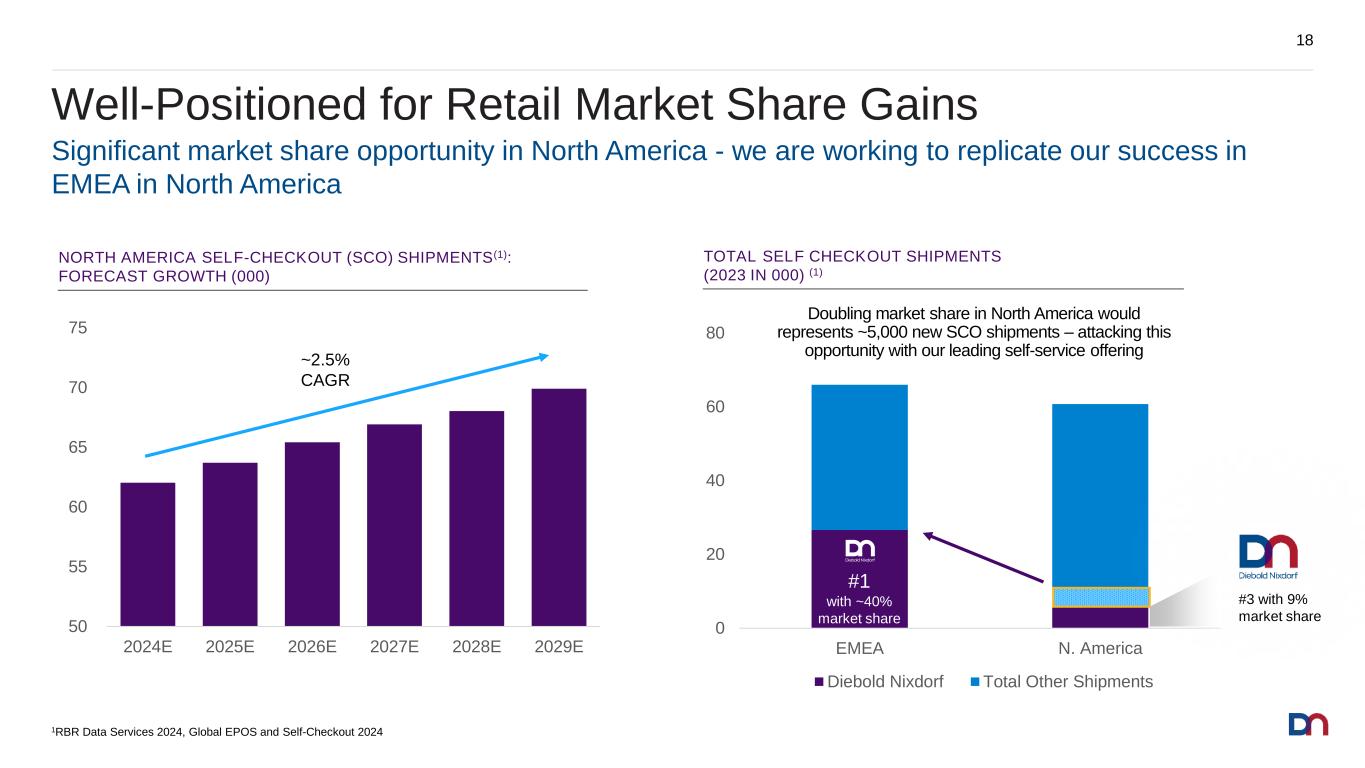
Well-Positioned for Retail Market Share Gains 18 0 20 40 60 80 EMEA N. America Diebold Nixdorf Total Other Shipments #1 with ~40% market share #3 with 9% market share 50 55 60 65 70 75 2024E 2025E 2026E 2027E 2028E 2029E ~2.5% CAGR TOTAL SELF CHECKOUT SHIPMENTS (2023 IN 000) (1) NORTH AMERICA SELF-CHECKOUT (SCO) SHIPMENTS(1): FORECAST GROWTH (000) Significant market share opportunity in North America - we are working to replicate our success in EMEA in North America 1RBR Data Services 2024, Global EPOS and Self-Checkout 2024 Doubling market share in North America would represents ~5,000 new SCO shipments – attacking this opportunity with our leading self-service offering
Diebold Nixdorf Strategy
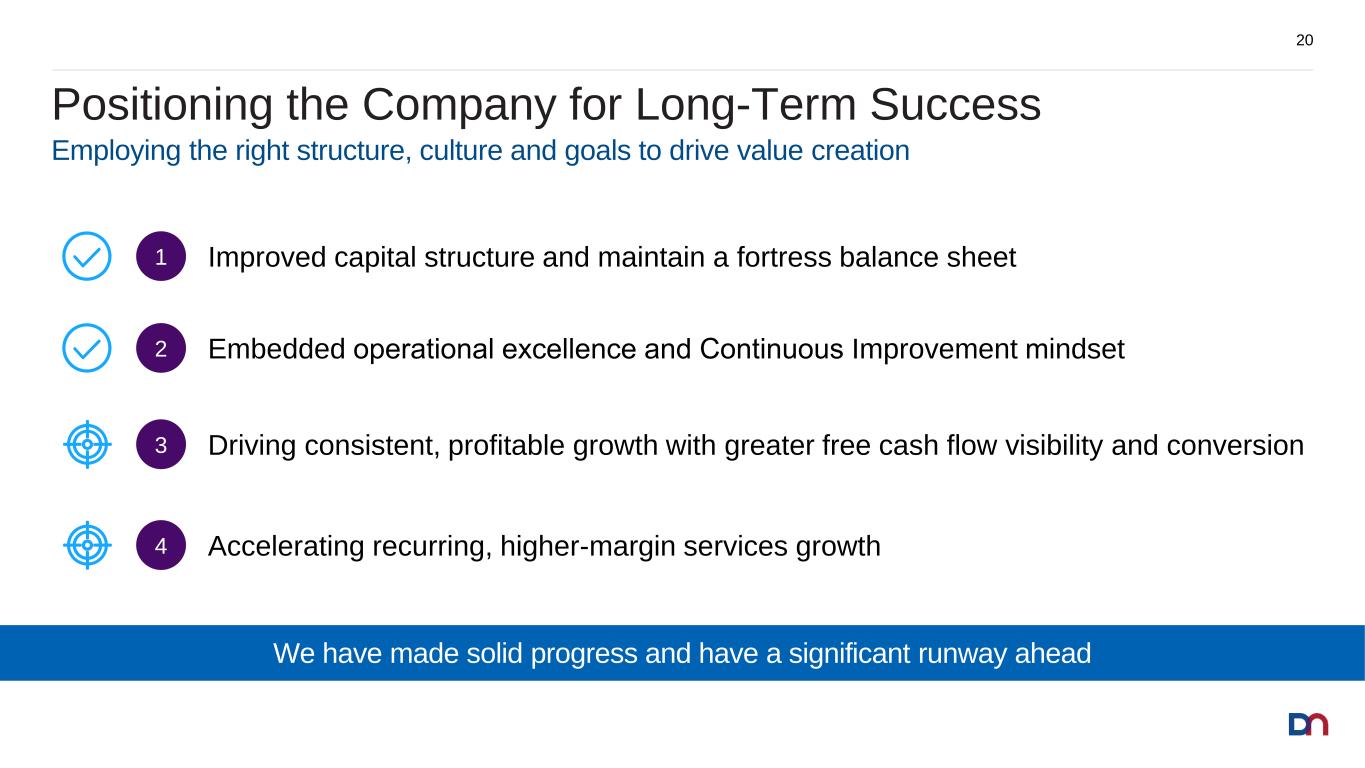
Driving consistent, profitable growth with greater free cash flow visibility and conversion3 Embedded operational excellence and Continuous Improvement mindset2 Accelerating recurring, higher-margin services growth4 Improved capital structure and maintain a fortress balance sheet1 Positioning the Company for Long-Term Success 20 We have made solid progress and have a significant runway ahead Employing the right structure, culture and goals to drive value creation
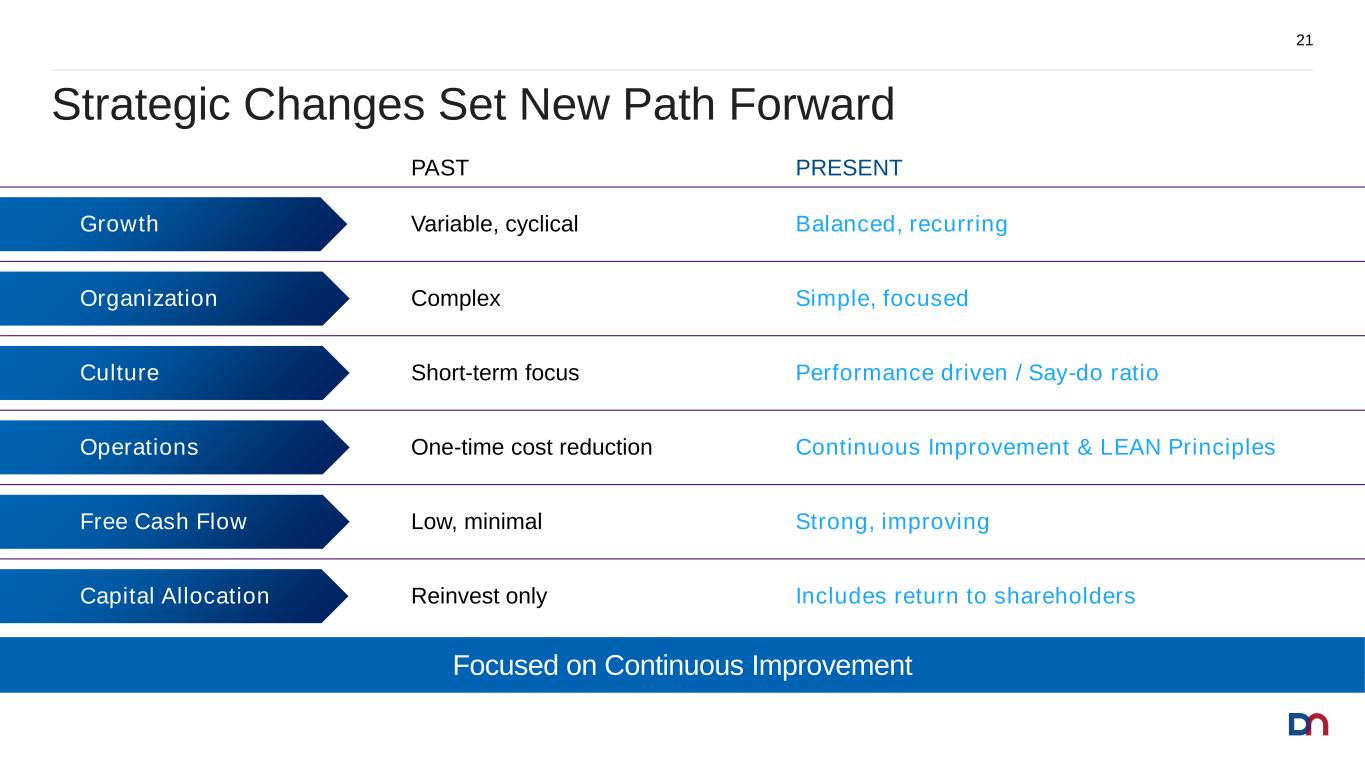
Strategic Changes Set New Path Forward 21 PAST PRESENT Complex Simple, focusedOrganization One-time cost reduction Continuous Improvement & LEAN PrinciplesOperations Variable, cyclical Balanced, recurringGrowth Low, minimal Strong, improvingFree Cash Flow Short-term focus Performance driven / Say-do ratioCulture Reinvest only Includes return to shareholdersCapital Allocation Focused on Continuous Improvement
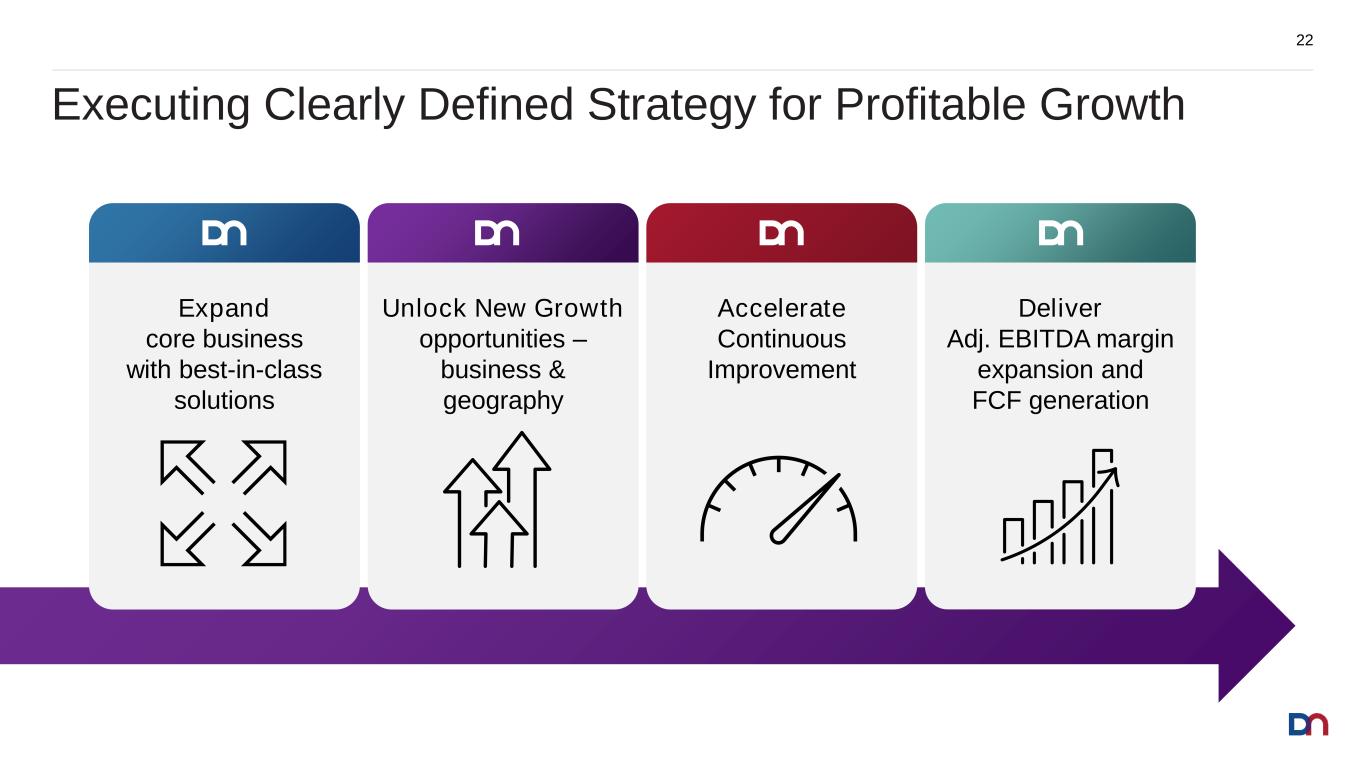
Executing Clearly Defined Strategy for Profitable Growth 22 Unlock New Growth opportunities – business & geography Accelerate Continuous Improvement Expand core business with best-in-class solutions Deliver Adj. EBITDA margin expansion and FCF generation
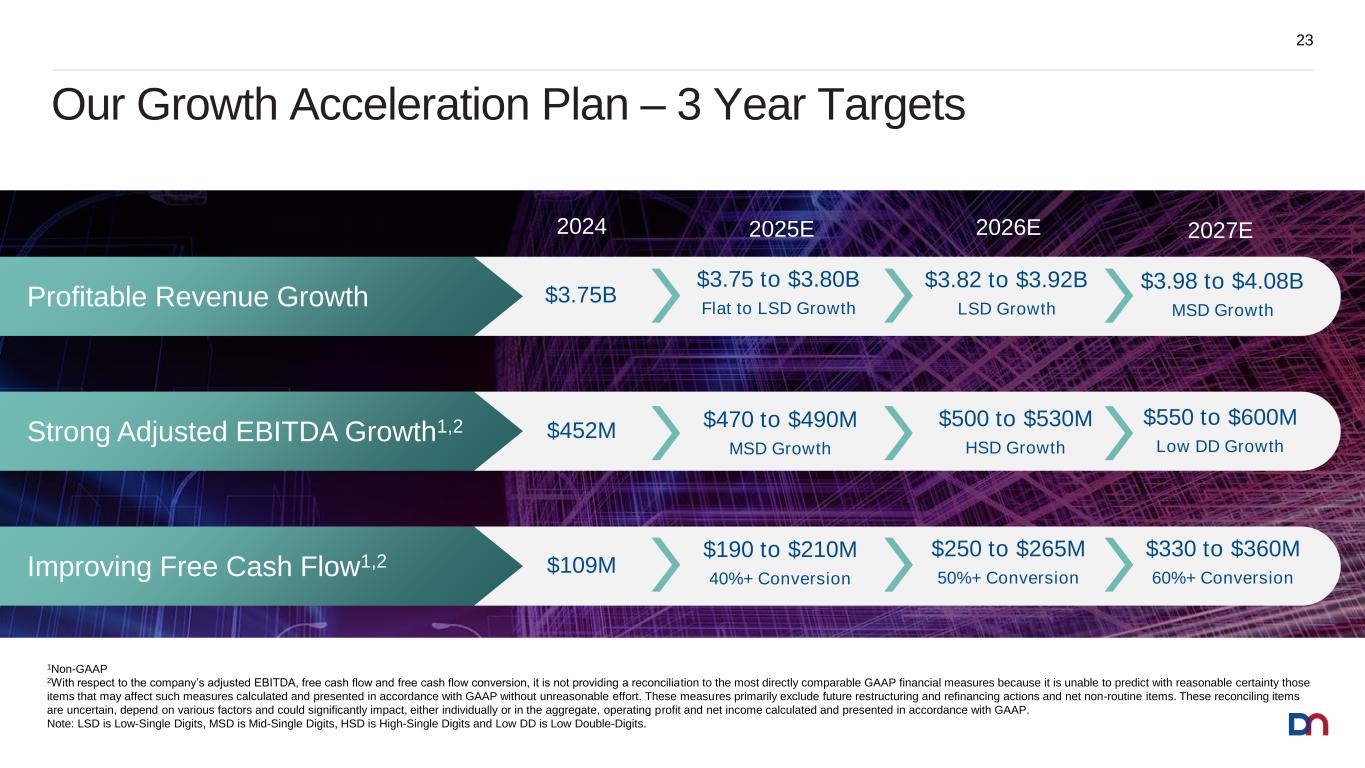
23 Our Growth Acceleration Plan – 3 Year Targets 1Non-GAAP 2With respect to the company’s adjusted EBITDA, free cash flow and free cash flow conversion, it is not providing a reconciliation to the most directly comparable GAAP financial measures because it is unable to predict with reasonable certainty those items that may affect such measures calculated and presented in accordance with GAAP without unreasonable effort. These measures primarily exclude future restructuring and refinancing actions and net non-routine items. These reconciling items are uncertain, depend on various factors and could significantly impact, either individually or in the aggregate, operating profit and net income calculated and presented in accordance with GAAP. Note: LSD is Low-Single Digits, MSD is Mid-Single Digits, HSD is High-Single Digits and Low DD is Low Double-Digits. $3.75 to $3.80B Flat to LSD Growth $3.75BProfitable Revenue Growth 2027E2025E2024 Strong Adjusted EBITDA Growth1,2 $470 to $490M MSD Growth $452M Improving Free Cash Flow1,2 $190 to $210M 40%+ Conversion $109M 2026E $3.82 to $3.92B LSD Growth $3.98 to $4.08B MSD Growth $500 to $530M HSD Growth $550 to $600M Low DD Growth $330 to $360M 60%+ Conversion $250 to $265M 50%+ Conversion
Global Banking Growth Strategy Joe Myers Executive Vice President, Global Banking
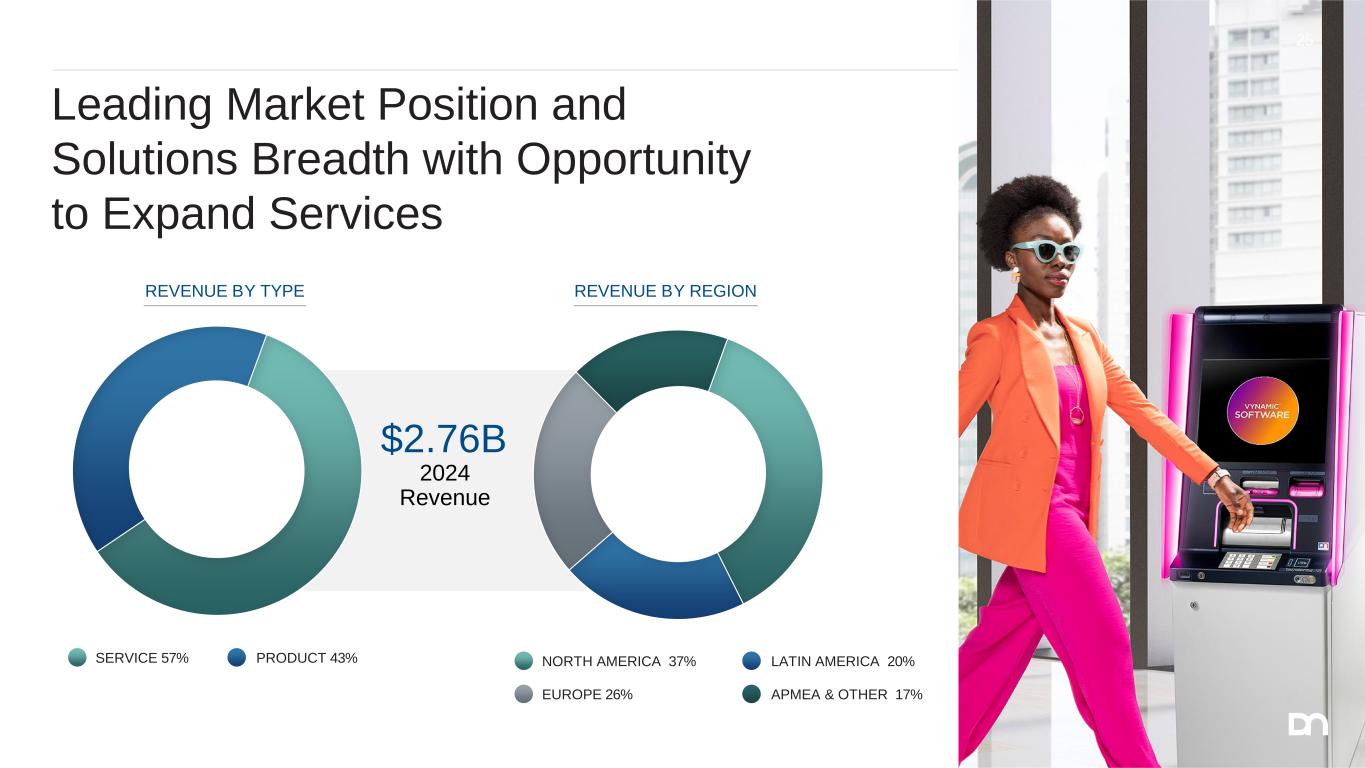
Leading Market Position and Solutions Breadth with Opportunity to Expand Services 25 $2.76B 2024 Revenue PRODUCT 43%SERVICE 57% LATIN AMERICA 20%NORTH AMERICA 37% APMEA & OTHER 17%EUROPE 26% REVENUE BY TYPE REVENUE BY REGION
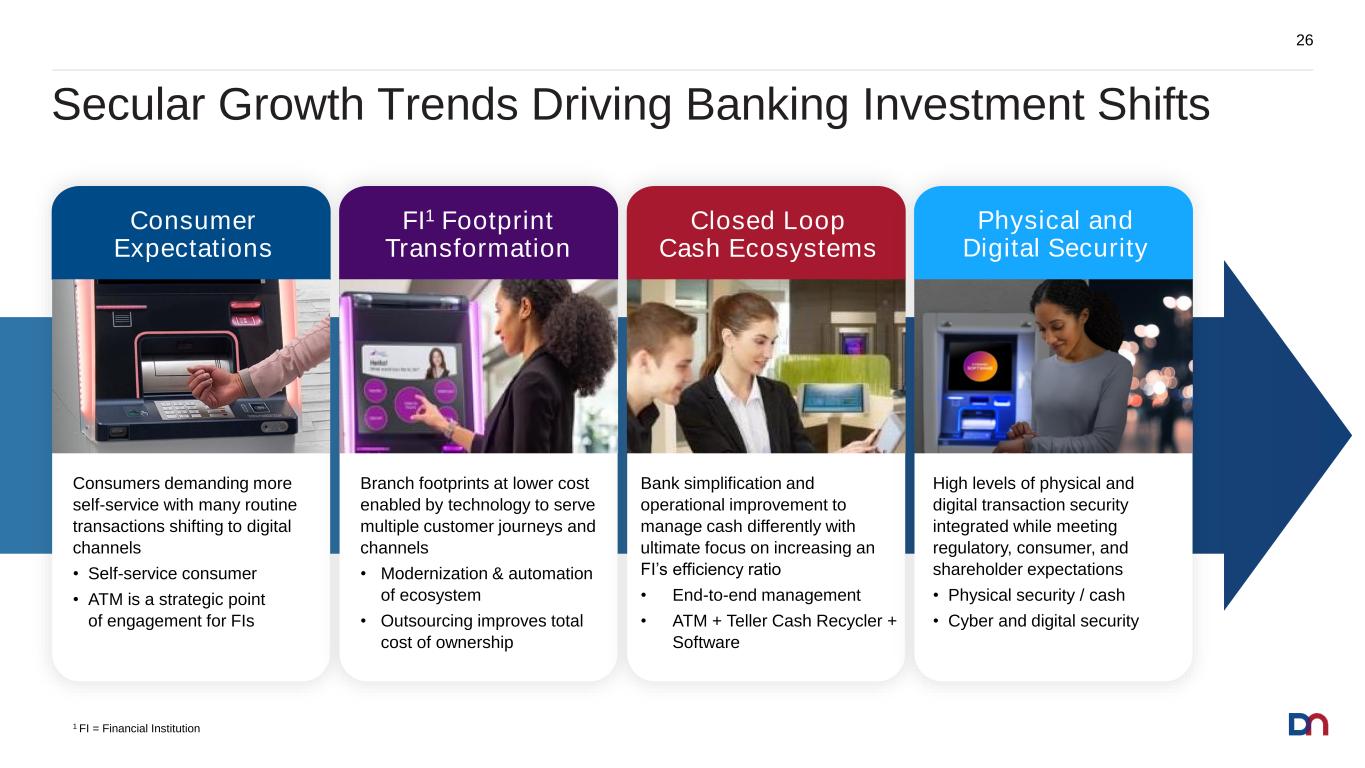
Secular Growth Trends Driving Banking Investment Shifts 26 Consumer Expectations Consumers demanding more self-service with many routine transactions shifting to digital channels • Self-service consumer • ATM is a strategic point of engagement for FIs FI1 Footprint Transformation Branch footprints at lower cost enabled by technology to serve multiple customer journeys and channels • Modernization & automation of ecosystem • Outsourcing improves total cost of ownership Closed Loop Cash Ecosystems Bank simplification and operational improvement to manage cash differently with ultimate focus on increasing an FI’s efficiency ratio • End-to-end management • ATM + Teller Cash Recycler + Software Physical and Digital Security High levels of physical and digital transaction security integrated while meeting regulatory, consumer, and shareholder expectations • Physical security / cash • Cyber and digital security 1 FI = Financial Institution
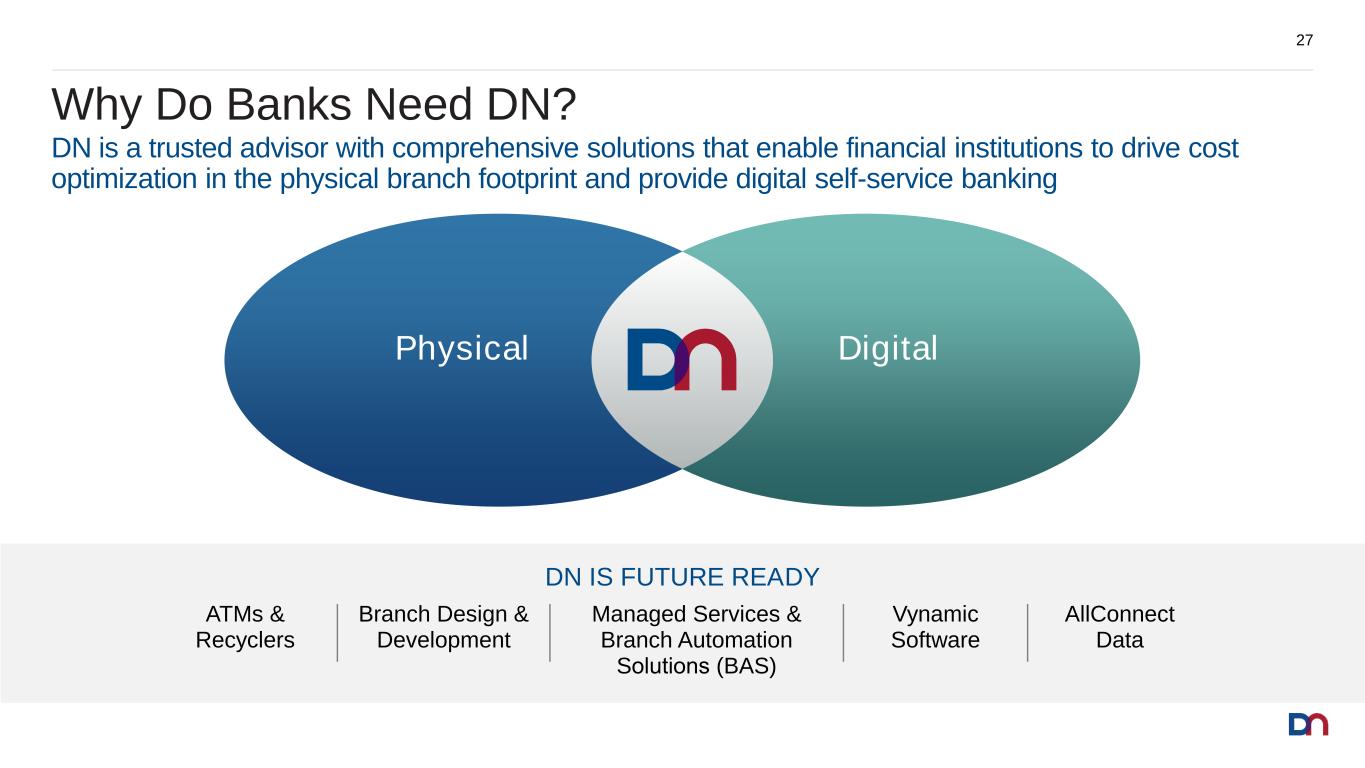
Why Do Banks Need DN? 27 DN IS FUTURE READY ATMs & Recyclers Branch Design & Development Managed Services & Branch Automation Solutions (BAS) Vynamic Software AllConnect Data DN is a trusted advisor with comprehensive solutions that enable financial institutions to drive cost optimization in the physical branch footprint and provide digital self-service banking Physical Digital
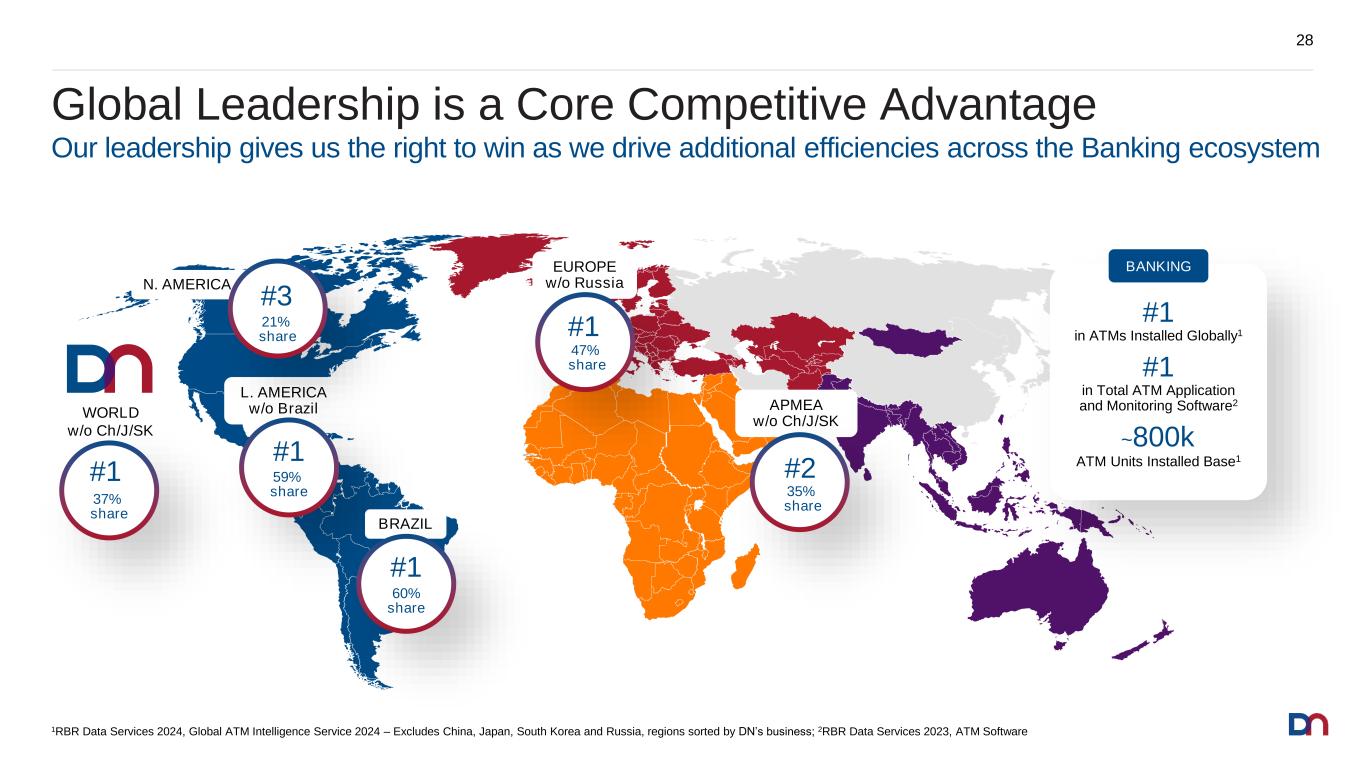
Global Leadership is a Core Competitive Advantage 28 #2 L. AMERICA w/o Brazil #1 59% share EUROPE w/o Russia #1 47% share N. AMERICA #3 21% share BRAZIL #1 60% share WORLD w/o Ch/J/SK #1 37% share APMEA w/o Ch/J/SK #2 35% share #1 in ATMs Installed Globally1 #1 in Total ATM Application and Monitoring Software2 ~800k ATM Units Installed Base1 BANKING 1RBR Data Services 2024, Global ATM Intelligence Service 2024 – Excludes China, Japan, South Korea and Russia, regions sorted by DN’s business; 2RBR Data Services 2023, ATM Software Our leadership gives us the right to win as we drive additional efficiencies across the Banking ecosystem
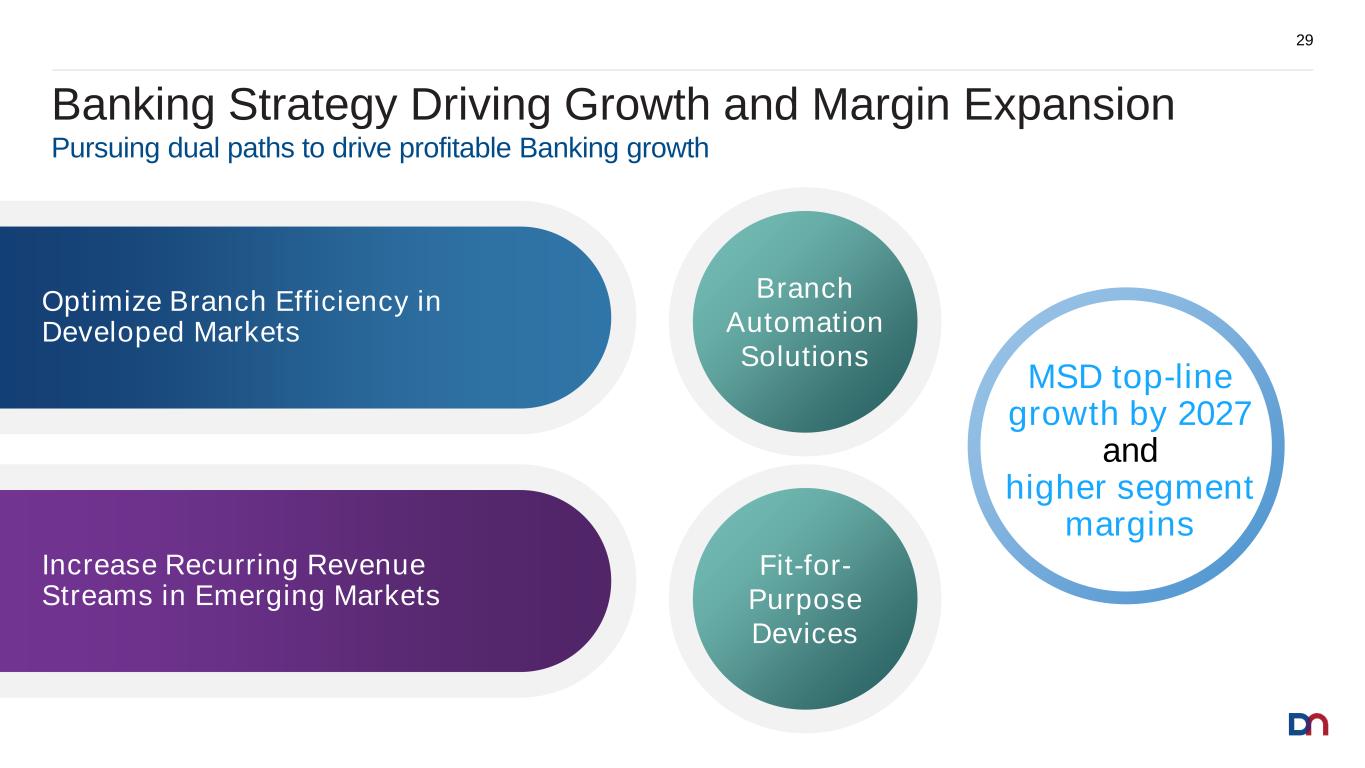
Banking Strategy Driving Growth and Margin Expansion 29 Branch Automation Solutions Increase Recurring Revenue Streams in Emerging Markets Optimize Branch Efficiency in Developed Markets Pursuing dual paths to drive profitable Banking growth MSD top-line growth by 2027 and higher segment margins Fit-for- Purpose Devices
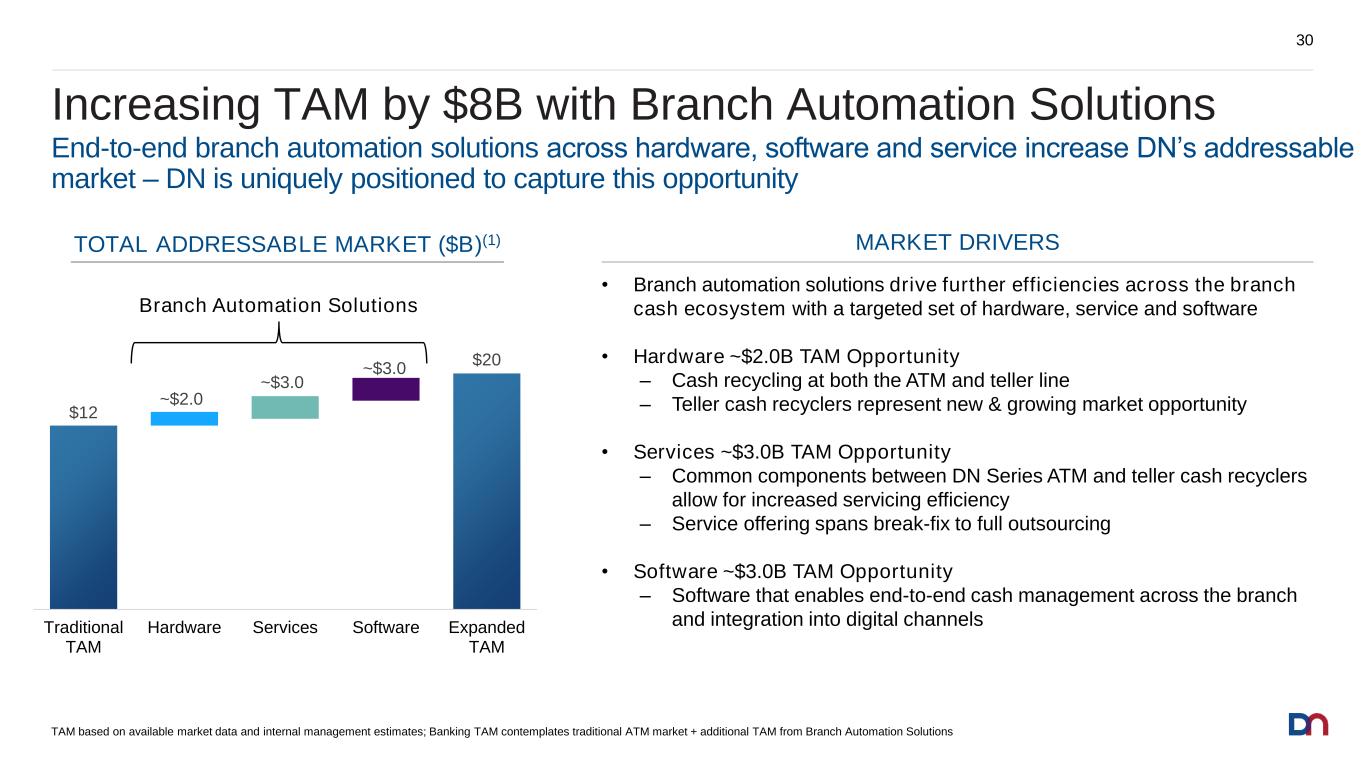
Increasing TAM by $8B with Branch Automation Solutions $12 $20 ~$2.0 ~$3.0 ~$3.0 Traditional TAM Hardware Services Software Expanded TAM TOTAL ADDRESSABLE MARKET ($B)(1) MARKET DRIVERS End-to-end branch automation solutions across hardware, software and service increase DN’s addressable market – DN is uniquely positioned to capture this opportunity • Branch automation solutions drive further efficiencies across the branch cash ecosystem with a targeted set of hardware, service and software • Hardware ~$2.0B TAM Opportunity ‒ Cash recycling at both the ATM and teller line ‒ Teller cash recyclers represent new & growing market opportunity • Services ~$3.0B TAM Opportunity ‒ Common components between DN Series ATM and teller cash recyclers allow for increased servicing efficiency ‒ Service offering spans break-fix to full outsourcing • Software ~$3.0B TAM Opportunity ‒ Software that enables end-to-end cash management across the branch and integration into digital channels 30 Branch Automation Solutions TAM based on available market data and internal management estimates; Banking TAM contemplates traditional ATM market + additional TAM from Branch Automation Solutions
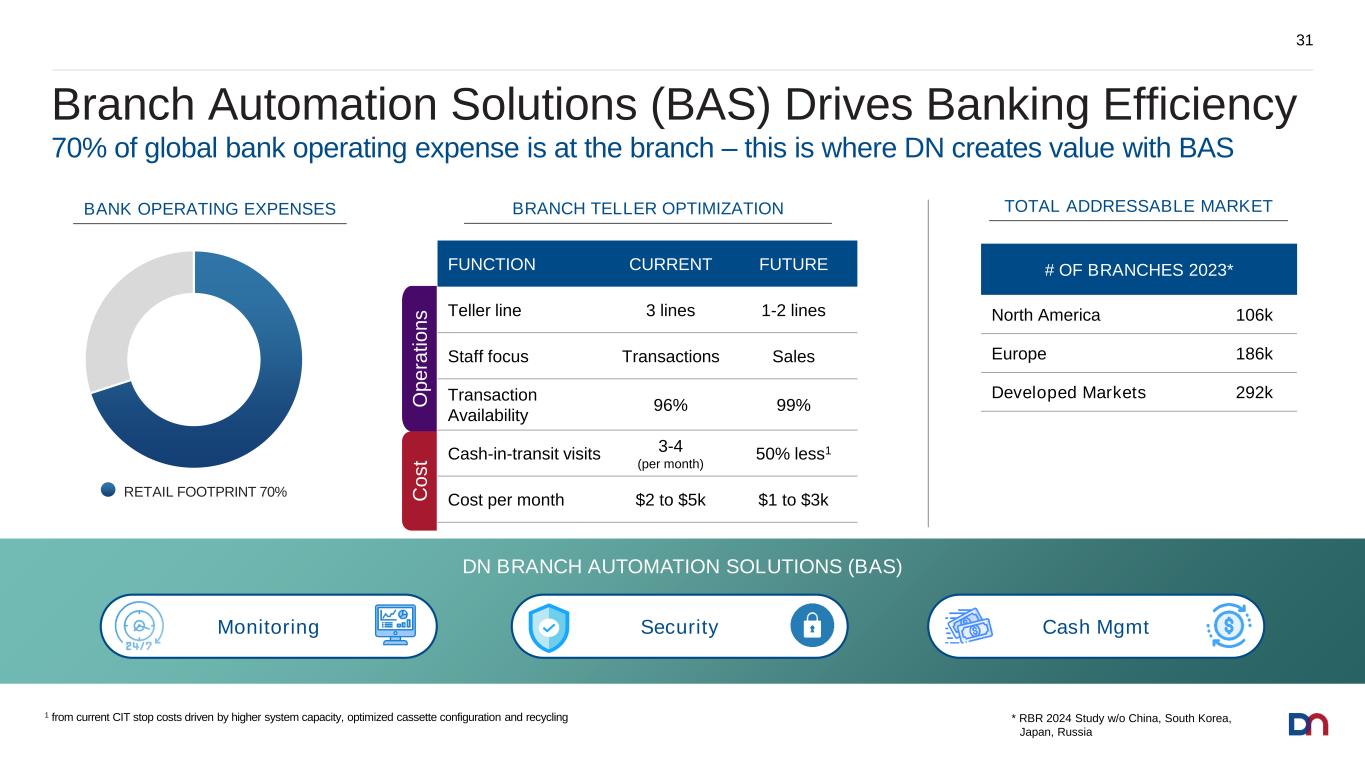
* RBR 2024 Study w/o China, South Korea, Japan, Russia Branch Automation Solutions (BAS) Drives Banking Efficiency 31 Monitoring Security Cash Mgmt DN BRANCH AUTOMATION SOLUTIONS (BAS) FUNCTION CURRENT FUTURE Teller line 3 lines 1-2 lines Staff focus Transactions Sales Transaction Availability 96% 99% Cash-in-transit visits 3-4 (per month) 50% less1 Cost per month $2 to $5k $1 to $3k BANK OPERATING EXPENSES TOTAL ADDRESSABLE MARKET RETAIL FOOTPRINT 70% 1 from current CIT stop costs driven by higher system capacity, optimized cassette configuration and recycling # OF BRANCHES 2023* North America 106k Europe 186k Developed Markets 292k BRANCH TELLER OPTIMIZATION 70% of global bank operating expense is at the branch – this is where DN creates value with BAS O p e ra ti o n s C o s t
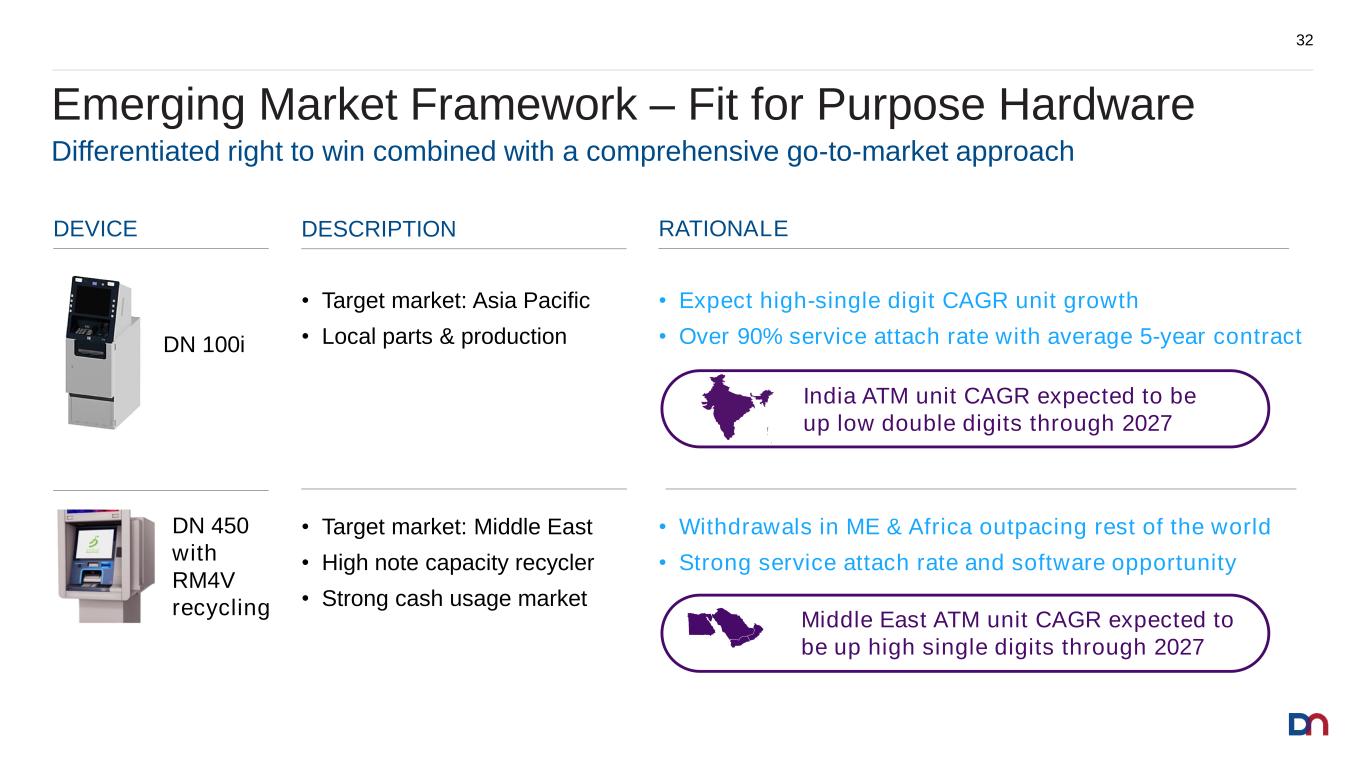
Emerging Market Framework – Fit for Purpose Hardware DESCRIPTION RATIONALEDEVICE Differentiated right to win combined with a comprehensive go-to-market approach • Expect high-single digit CAGR unit growth • Over 90% service attach rate with average 5-year contract • Target market: Asia Pacific • Local parts & production India ATM unit CAGR expected to be up low double digits through 2027 • Target market: Middle East • High note capacity recycler • Strong cash usage market • Withdrawals in ME & Africa outpacing rest of the world • Strong service attach rate and software opportunity Middle East ATM unit CAGR expected to be up high single digits through 2027 32 DN 100i DN 450 with RM4V recycling
Partnering to Meet Next Generation Needs 33 DN BANKING PARTNERS | CUSTOMERS
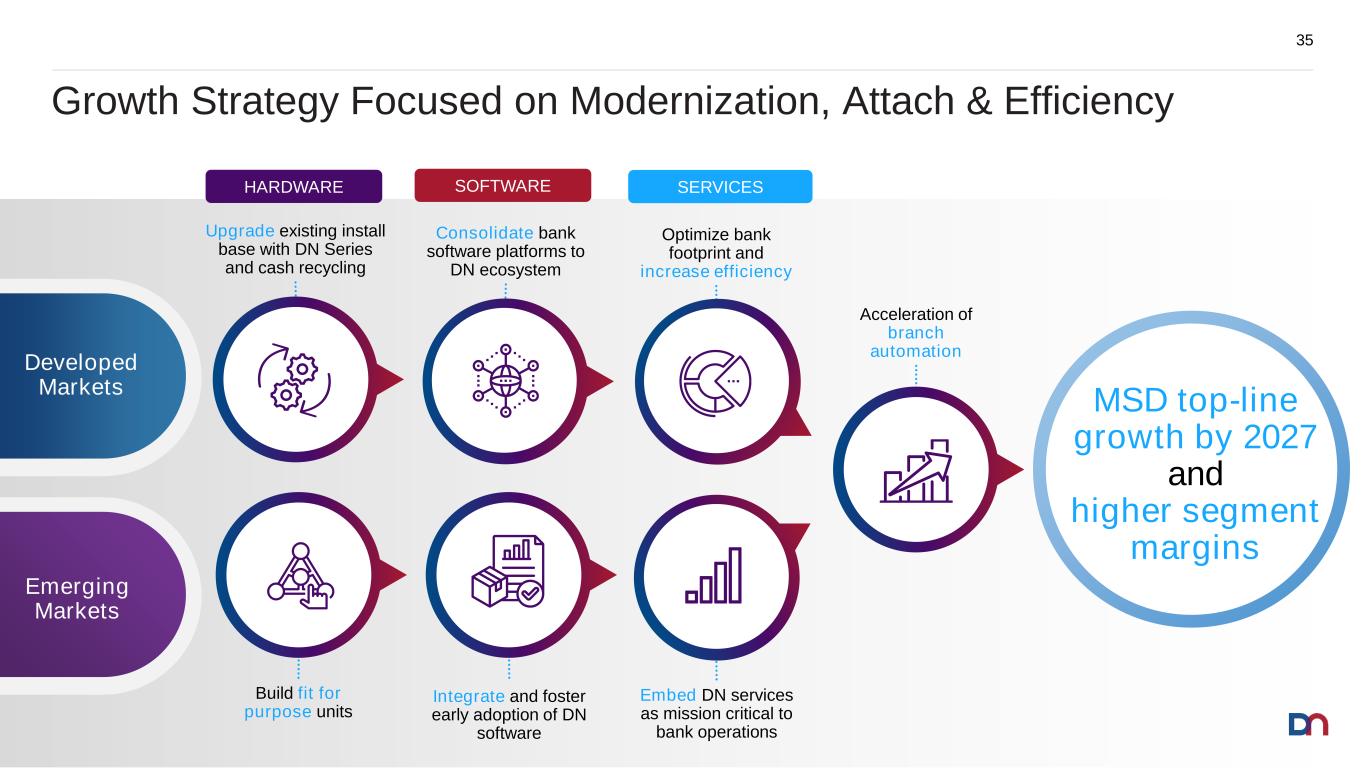
MSD top-line growth by 2027 and higher segment margins Emerging Markets Developed Markets Growth Strategy Focused on Modernization, Attach & Efficiency 35 Acceleration of branch automation Upgrade existing install base with DN Series and cash recycling Consolidate bank software platforms to DN ecosystem Build fit for purpose units Optimize bank footprint and increase efficiency Integrate and foster early adoption of DN software Embed DN services as mission critical to bank operations HARDWARE SOFTWARE SERVICES
Global Retail Growth Strategy Ilhami Cantadurucu Executive Vice President, Global Retail
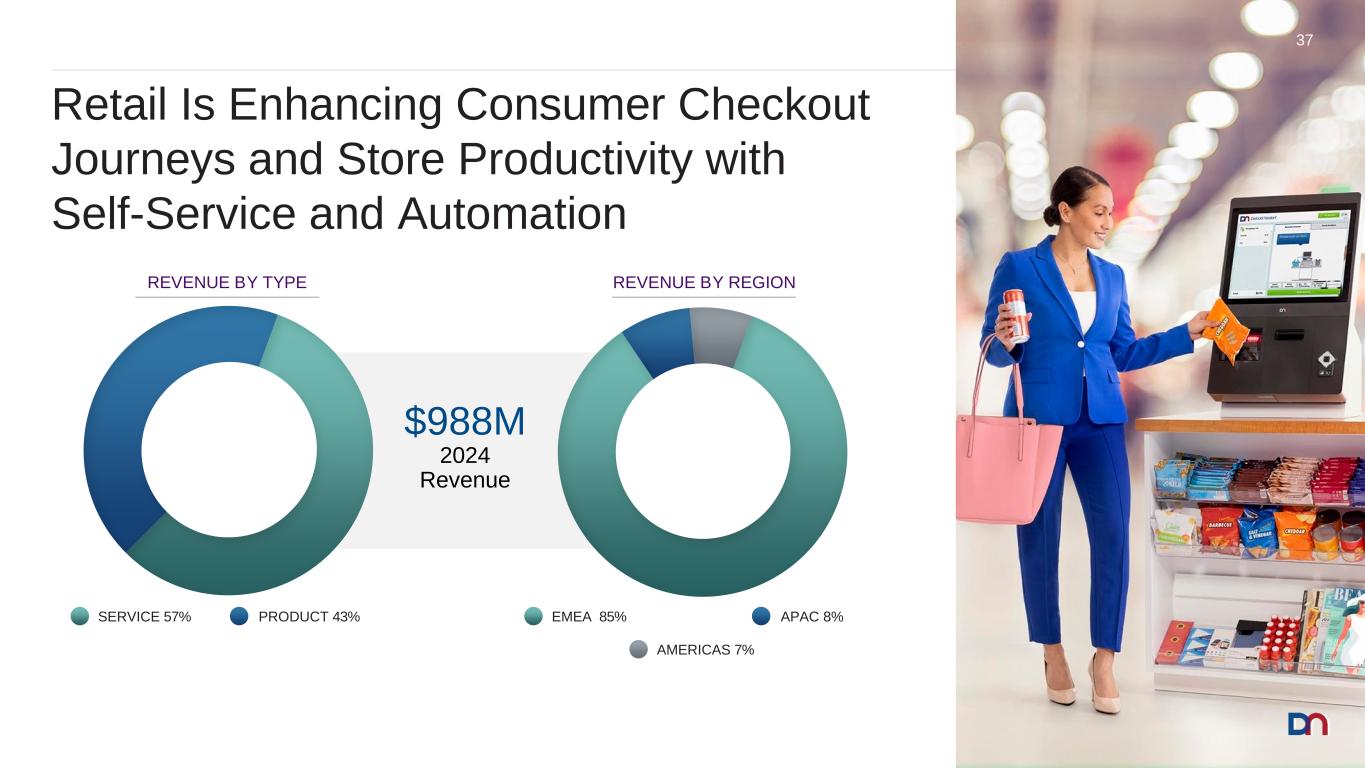
$988M 2024 Revenue Retail Is Enhancing Consumer Checkout Journeys and Store Productivity with Self-Service and Automation 37 REVENUE BY REGION PRODUCT 43%SERVICE 57% APAC 8%EMEA 85% AMERICAS 7% REVENUE BY TYPE
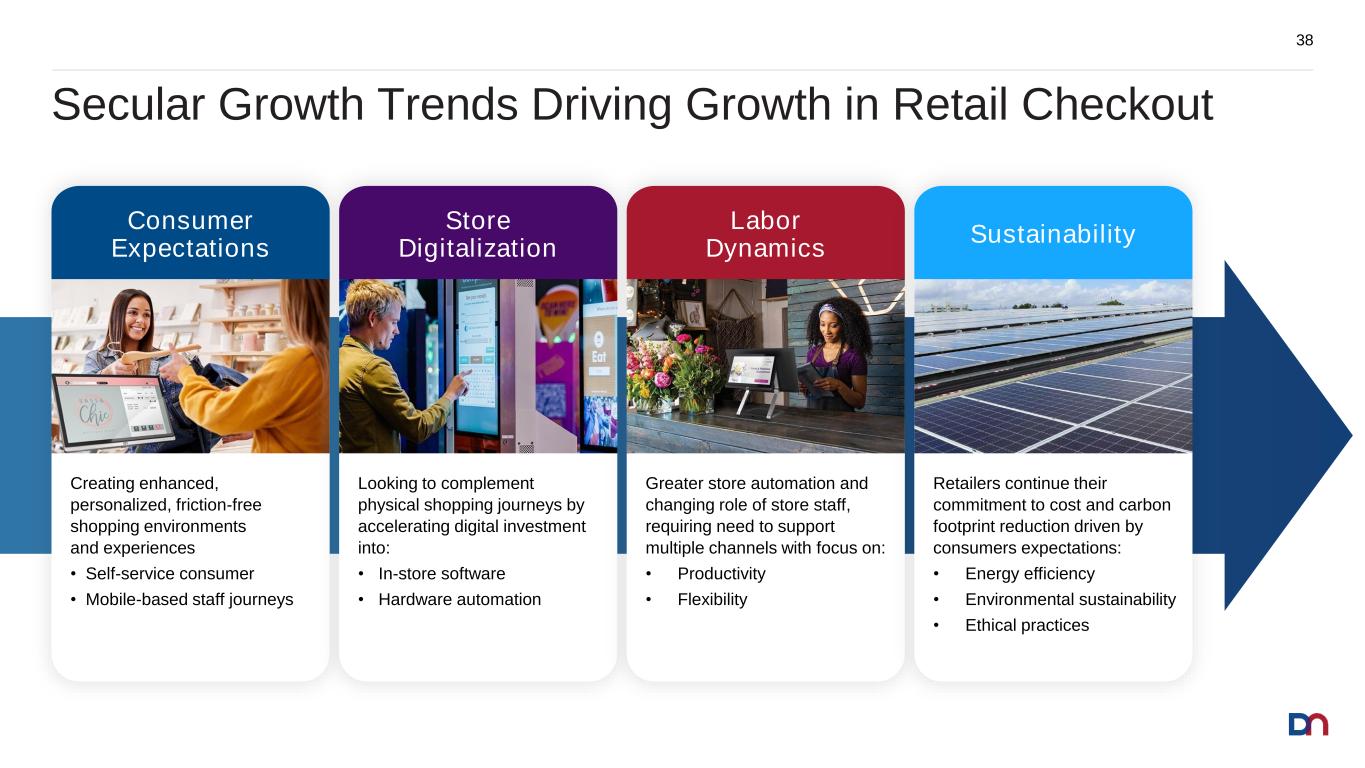
Secular Growth Trends Driving Growth in Retail Checkout 38 Consumer Expectations Creating enhanced, personalized, friction-free shopping environments and experiences • Self-service consumer • Mobile-based staff journeys Store Digitalization Looking to complement physical shopping journeys by accelerating digital investment into: • In-store software • Hardware automation Labor Dynamics Greater store automation and changing role of store staff, requiring need to support multiple channels with focus on: • Productivity • Flexibility Sustainability Retailers continue their commitment to cost and carbon footprint reduction driven by consumers expectations: • Energy efficiency • Environmental sustainability • Ethical practices
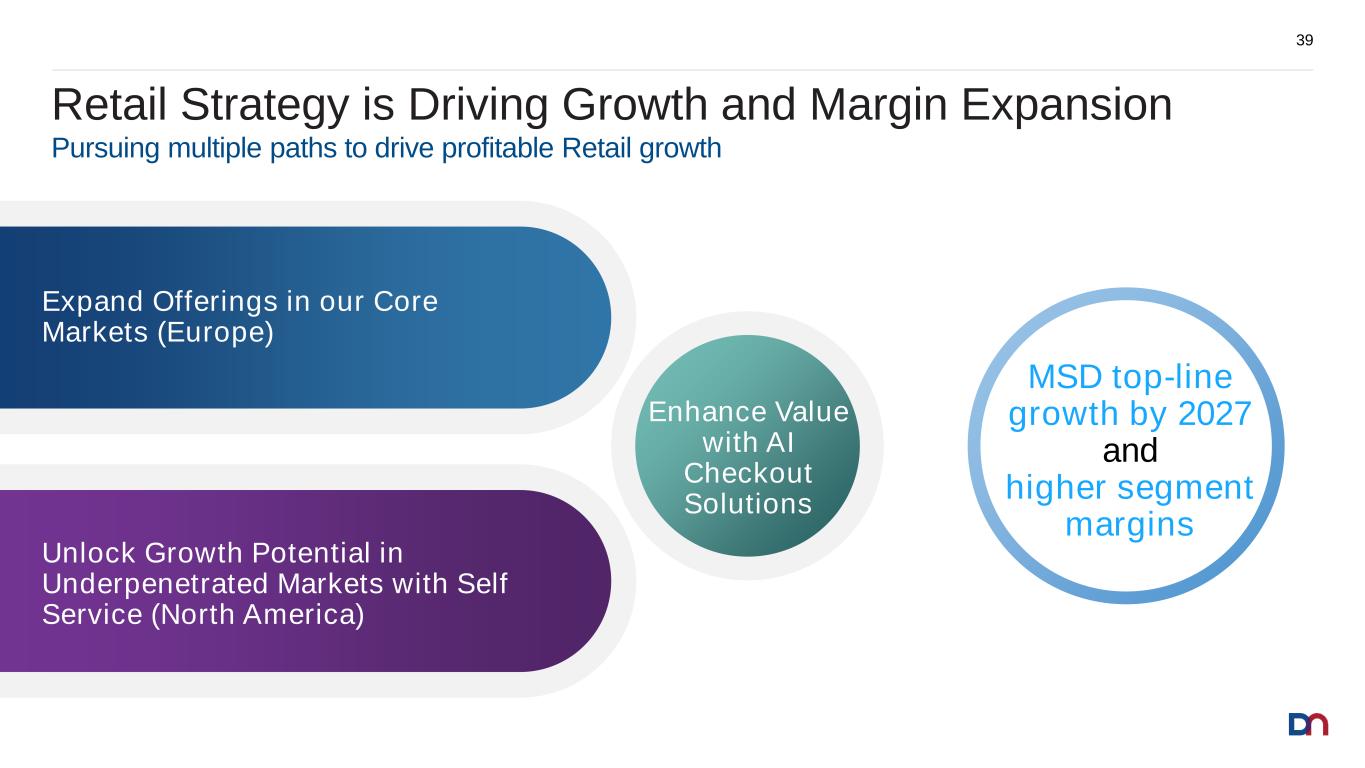
Retail Strategy is Driving Growth and Margin Expansion 39 Enhance Value with AI Checkout Solutions Unlock Growth Potential in Underpenetrated Markets with Self Service (North America) Expand Offerings in our Core Markets (Europe) Pursuing multiple paths to drive profitable Retail growth MSD top-line growth by 2027 and higher segment margins
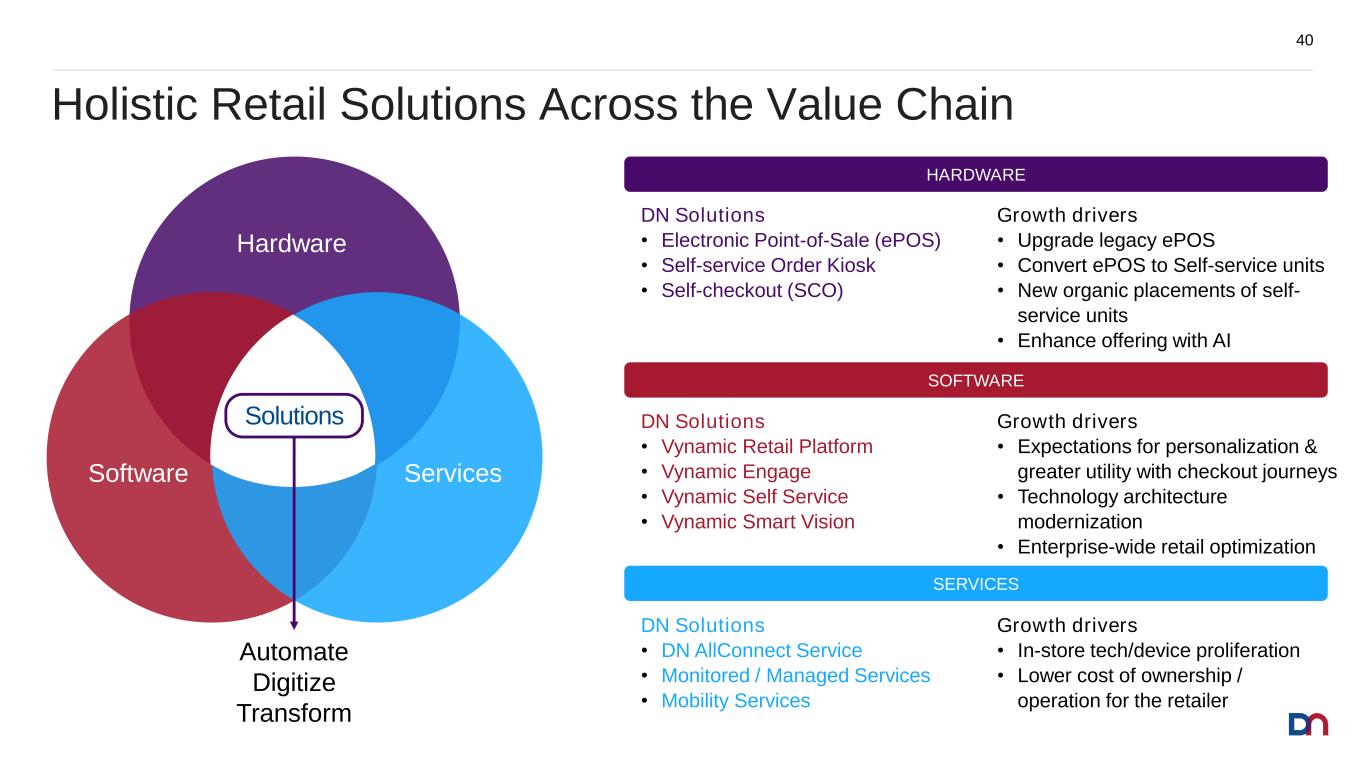
Holistic Retail Solutions Across the Value Chain 40 Software Services Hardware Solutions Automate Digitize Transform Growth drivers • In-store tech/device proliferation • Lower cost of ownership / operation for the retailer DN Solutions • DN AllConnect Service • Monitored / Managed Services • Mobility Services DN Solutions • Vynamic Retail Platform • Vynamic Engage • Vynamic Self Service • Vynamic Smart Vision Growth drivers • Expectations for personalization & greater utility with checkout journeys • Technology architecture modernization • Enterprise-wide retail optimization DN Solutions • Electronic Point-of-Sale (ePOS) • Self-service Order Kiosk • Self-checkout (SCO) Growth drivers • Upgrade legacy ePOS • Convert ePOS to Self-service units • New organic placements of self- service units • Enhance offering with AI HARDWARE SOFTWARE SERVICES
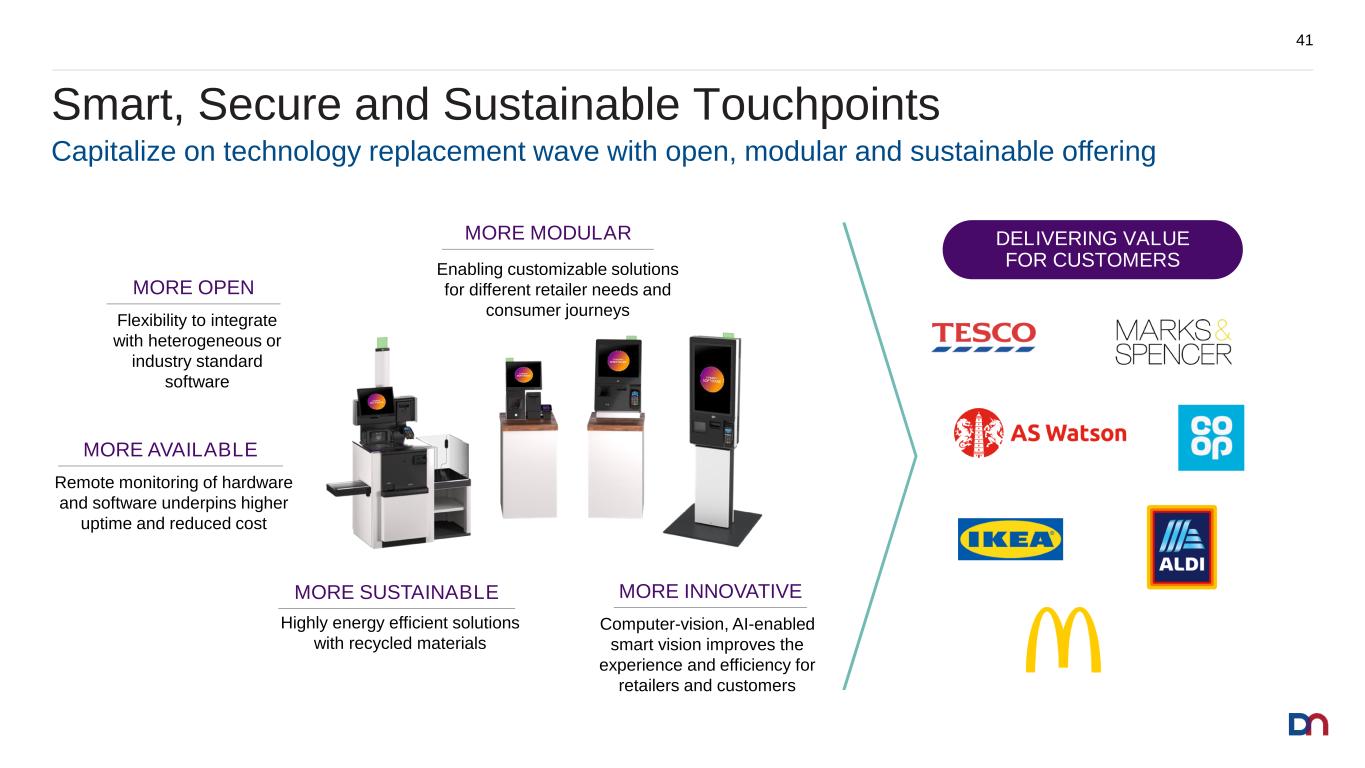
Smart, Secure and Sustainable Touchpoints 41 Capitalize on technology replacement wave with open, modular and sustainable offering MORE AVAILABLE MORE SUSTAINABLE MORE INNOVATIVE MORE MODULAR MORE OPEN Remote monitoring of hardware and software underpins higher uptime and reduced cost Computer-vision, AI-enabled smart vision improves the experience and efficiency for retailers and customers Highly energy efficient solutions with recycled materials Enabling customizable solutions for different retailer needs and consumer journeys Flexibility to integrate with heterogeneous or industry standard software DELIVERING VALUE FOR CUSTOMERS
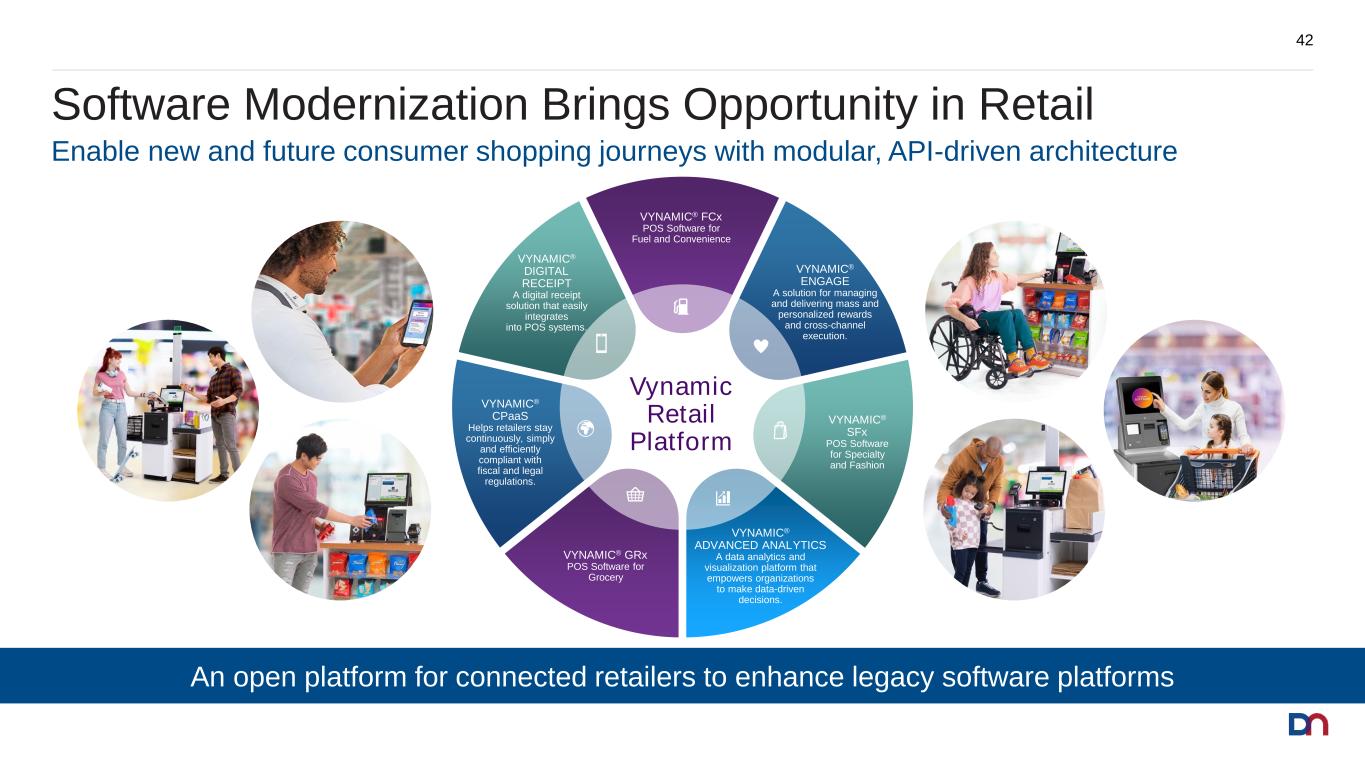
Software Modernization Brings Opportunity in Retail 42 Enable new and future consumer shopping journeys with modular, API-driven architecture VYNAMIC® FCx POS Software for Fuel and Convenience VYNAMIC® ENGAGE A solution for managing and delivering mass and personalized rewards and cross-channel execution. VYNAMIC® SFx POS Software for Specialty and Fashion VYNAMIC® ADVANCED ANALYTICS A data analytics and visualization platform that empowers organizations to make data-driven decisions. VYNAMIC® GRx POS Software for Grocery VYNAMIC® CPaaS Helps retailers stay continuously, simply and efficiently compliant with fiscal and legal regulations. VYNAMIC® DIGITAL RECEIPT A digital receipt solution that easily integrates into POS systems. Vynamic Retail Platform An open platform for connected retailers to enhance legacy software platforms
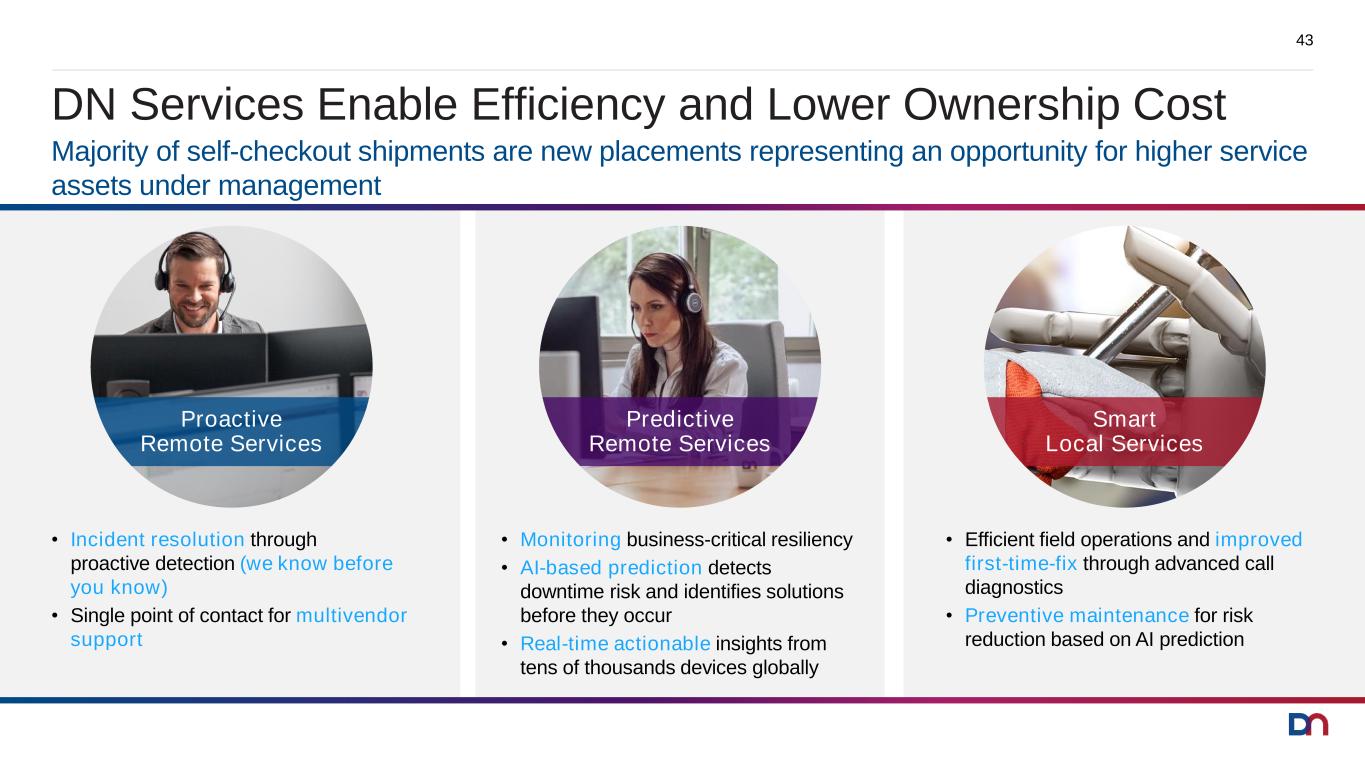
DN Services Enable Efficiency and Lower Ownership Cost 43 • Efficient field operations and improved first-time-fix through advanced call diagnostics • Preventive maintenance for risk reduction based on AI prediction • Incident resolution through proactive detection (we know before you know) • Single point of contact for multivendor support • Monitoring business-critical resiliency • AI-based prediction detects downtime risk and identifies solutions before they occur • Real-time actionable insights from tens of thousands devices globally Proactive Remote Services Predictive Remote Services Smart Local Services Majority of self-checkout shipments are new placements representing an opportunity for higher service assets under management
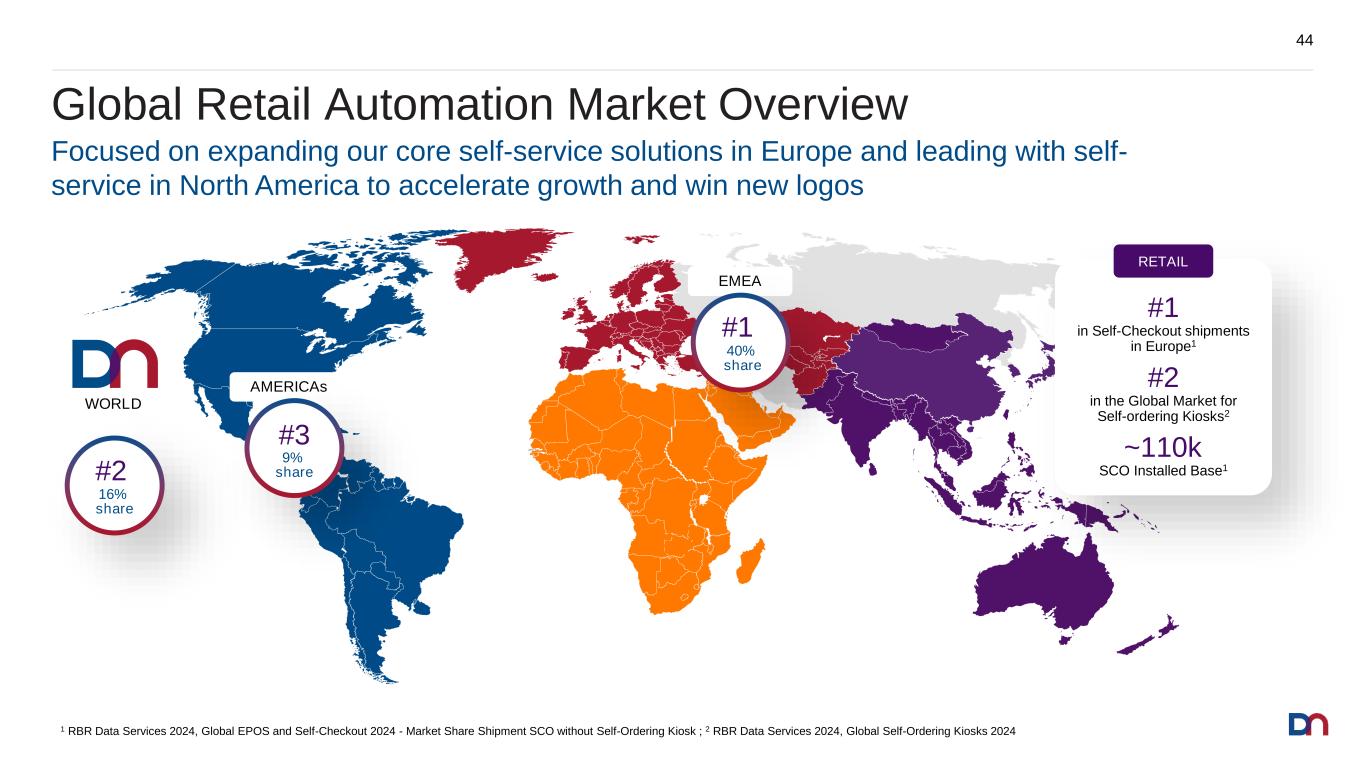
#3 21% share #2 Global Retail Automation Market Overview 44 WORLD #2 16% share #1 in Self-Checkout shipments in Europe1 #2 in the Global Market for Self-ordering Kiosks2 ~110k SCO Installed Base1 RETAIL AMERICAs #3 9% share EMEA #1 40% share Focused on expanding our core self-service solutions in Europe and leading with self- service in North America to accelerate growth and win new logos 1 RBR Data Services 2024, Global EPOS and Self-Checkout 2024 - Market Share Shipment SCO without Self-Ordering Kiosk ; 2 RBR Data Services 2024, Global Self-Ordering Kiosks 2024
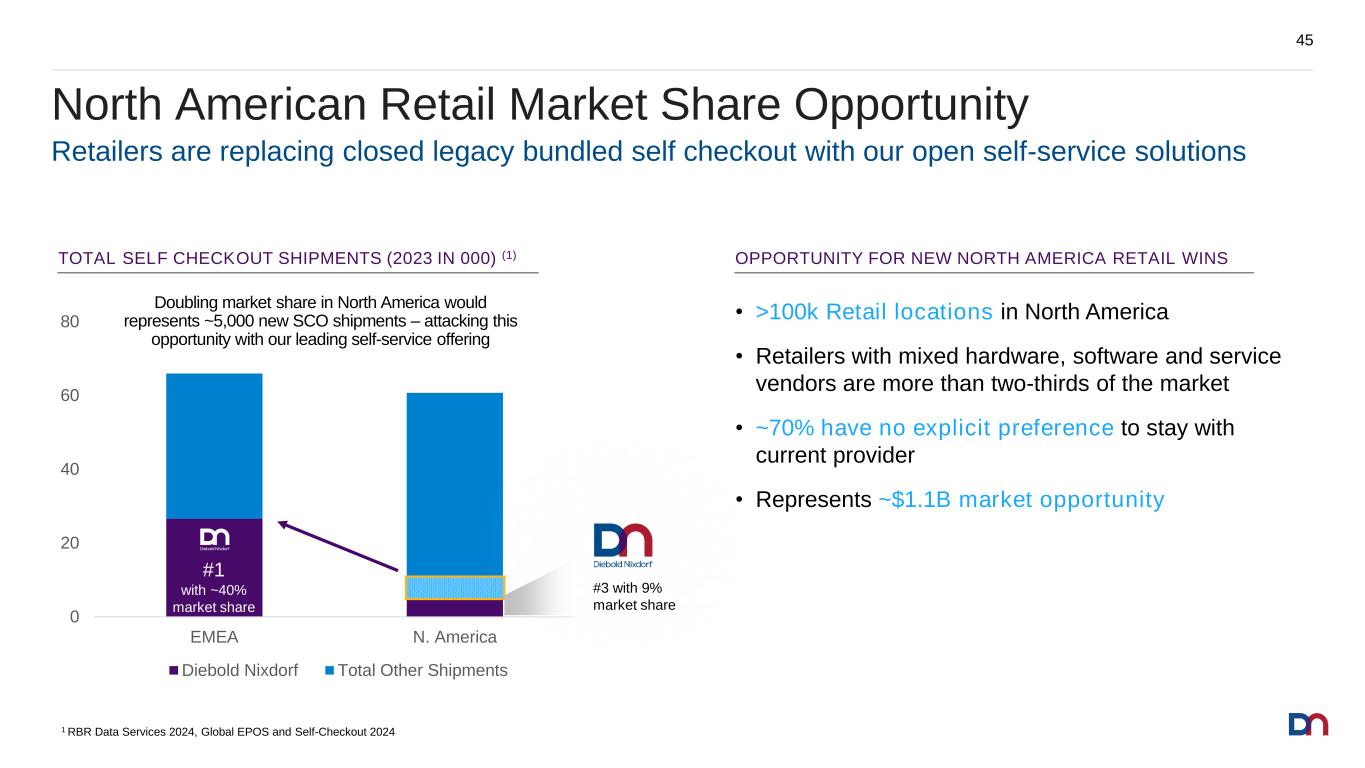
OPPORTUNITY FOR NEW NORTH AMERICA RETAIL WINS North American Retail Market Share Opportunity 45 Retailers are replacing closed legacy bundled self checkout with our open self-service solutions 1 RBR Data Services 2024, Global EPOS and Self-Checkout 2024 • >100k Retail locations in North America • Retailers with mixed hardware, software and service vendors are more than two-thirds of the market • ~70% have no explicit preference to stay with current provider • Represents ~$1.1B market opportunity 0 20 40 60 80 EMEA N. America Diebold Nixdorf Total Other Shipments #1 with ~40% market share #3 with 9% market share TOTAL SELF CHECKOUT SHIPMENTS (2023 IN 000) (1) Doubling market share in North America would represents ~5,000 new SCO shipments – attacking this opportunity with our leading self-service offering
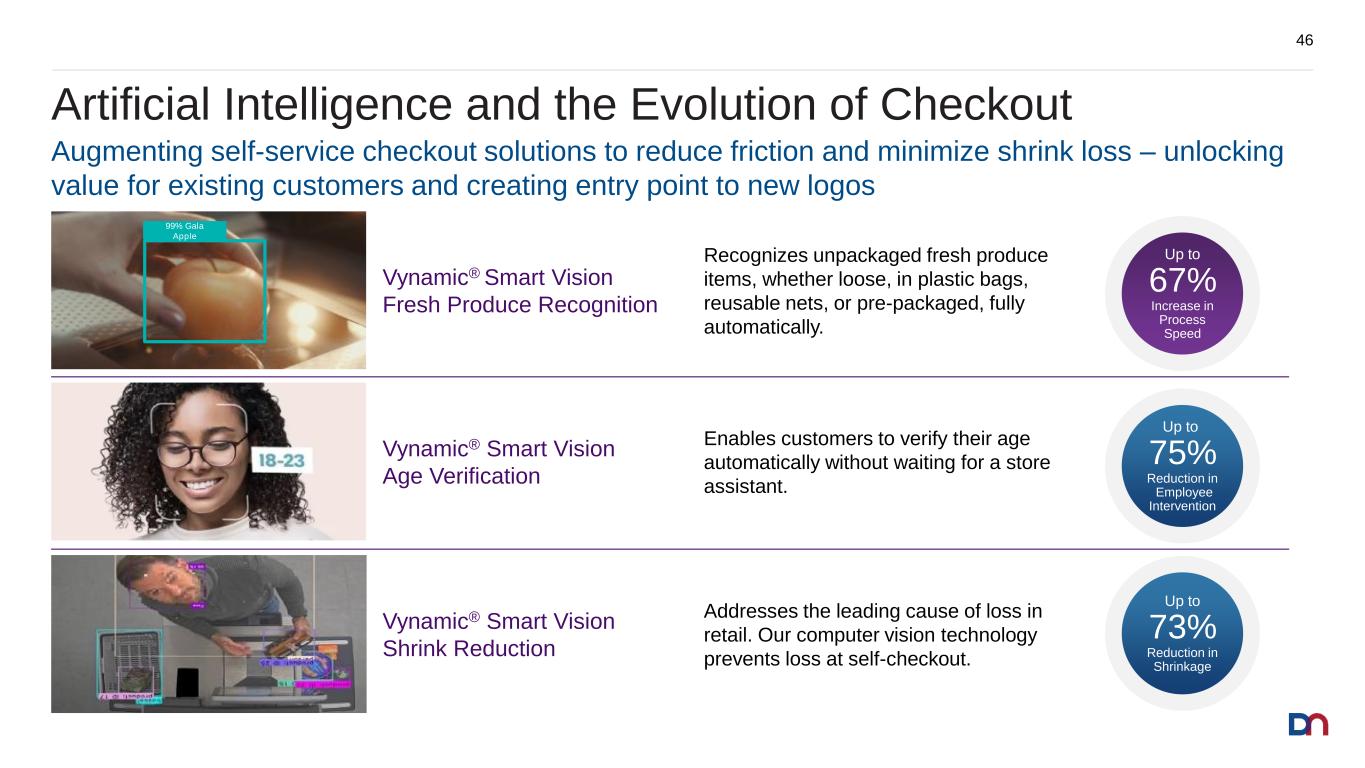
Artificial Intelligence and the Evolution of Checkout 46 Augmenting self-service checkout solutions to reduce friction and minimize shrink loss – unlocking value for existing customers and creating entry point to new logos Vynamic® Smart Vision Shrink Reduction Addresses the leading cause of loss in retail. Our computer vision technology prevents loss at self-checkout. Up to 73% Reduction in Shrinkage Vynamic® Smart Vision Fresh Produce Recognition 99% Gala Apple Recognizes unpackaged fresh produce items, whether loose, in plastic bags, reusable nets, or pre-packaged, fully automatically. Up to 67% Increase in Process Speed Vynamic® Smart Vision Age Verification Enables customers to verify their age automatically without waiting for a store assistant. Up to 75% Reduction in Employee Intervention
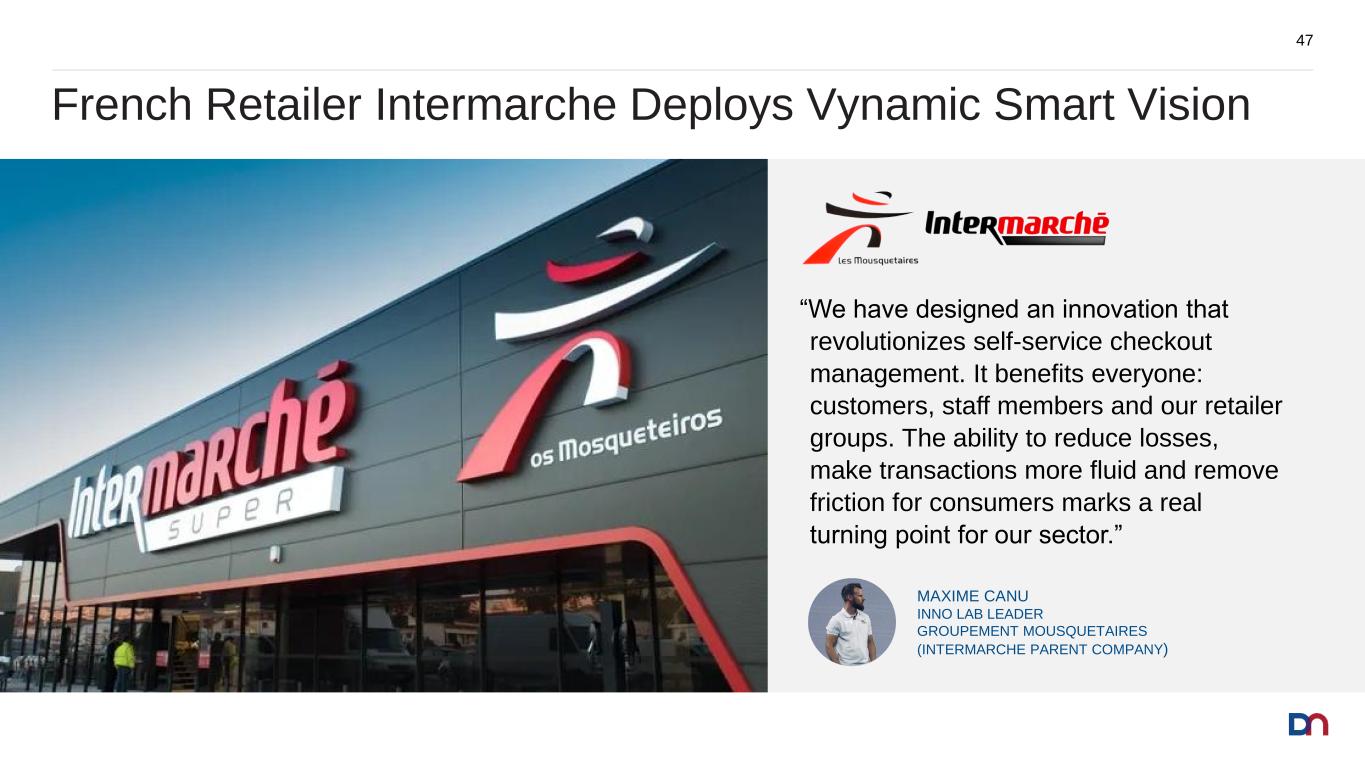
French Retailer Intermarche Deploys Vynamic Smart Vision 47 “We have designed an innovation that revolutionizes self-service checkout management. It benefits everyone: customers, staff members and our retailer groups. The ability to reduce losses, make transactions more fluid and remove friction for consumers marks a real turning point for our sector.” MAXIME CANU INNO LAB LEADER GROUPEMENT MOUSQUETAIRES (INTERMARCHE PARENT COMPANY)

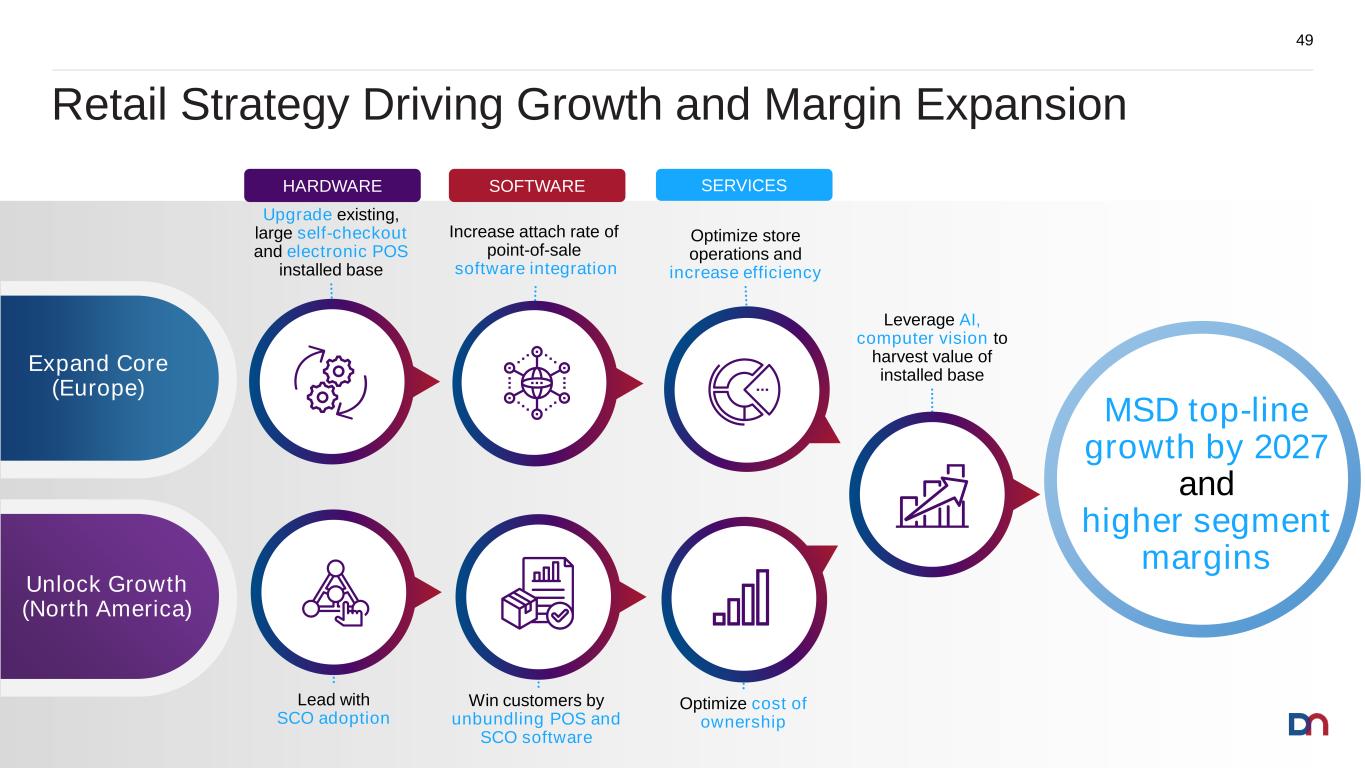
Lead with SCO adoption MSD top-line growth by 2027 and higher segment margins Unlock Growth (North America) Expand Core (Europe) Retail Strategy Driving Growth and Margin Expansion 49 Leverage AI, computer vision to harvest value of installed base Upgrade existing, large self-checkout and electronic POS installed base Increase attach rate of point-of-sale software integration Optimize store operations and increase efficiency Win customers by unbundling POS and SCO software Optimize cost of ownership HARDWARE SOFTWARE SERVICES

Break
Continuous Improvement Journey Frank Baur Executive Vice President, Operational Excellence
In 2024, we drove measurable results with LEAN and Continuous Improvement in manufacturing, supply chain and logistics environment Driving a cultural transformation, built on LEAN competency and a strong commitment across the entire organization Continuous Improvement Journey Driving Consistent Execution 52 Results of our integrated culture of Continuous Improvement realized in safety, quality, delivery and cost with runway for additional optimization DN Accelerator builds the core of our LEAN based operating system Expect continued impact as we accelerate our journey into the service organization in 2025
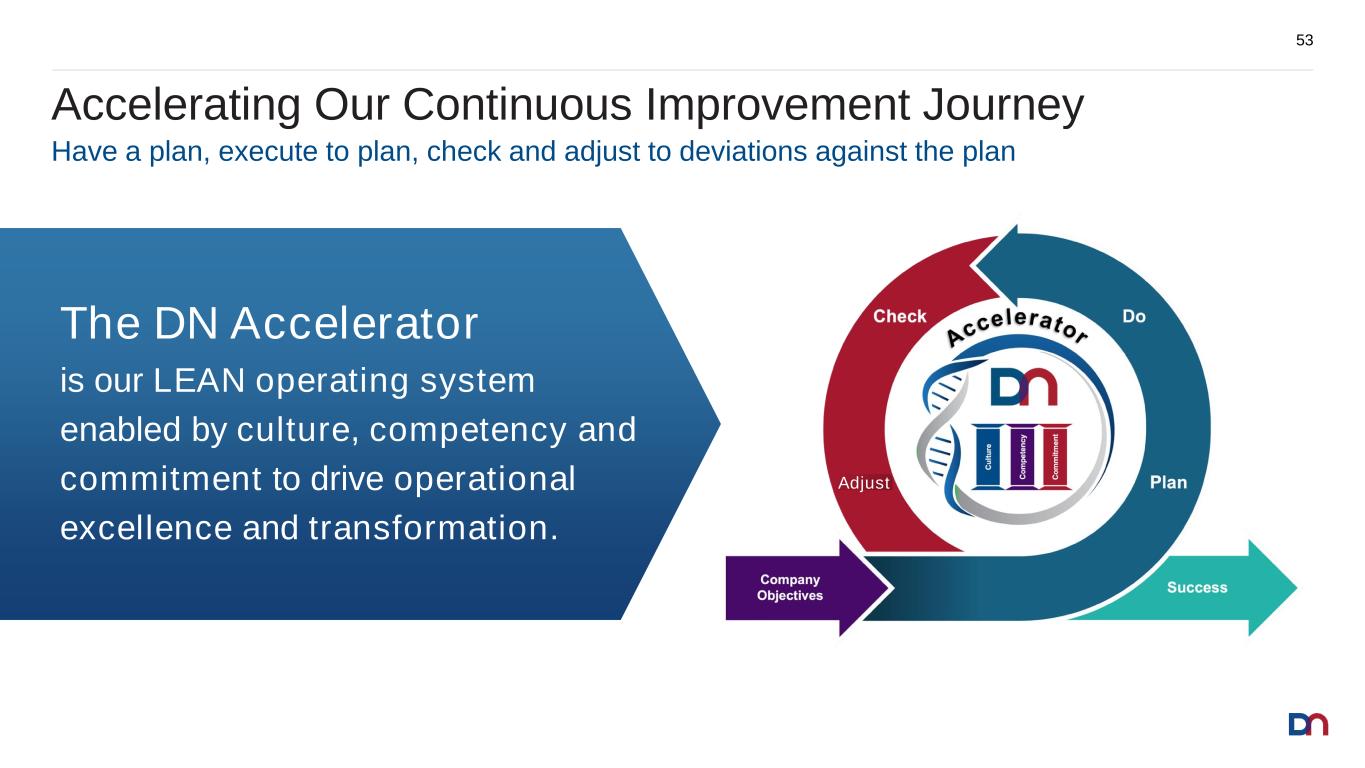
Accelerating Our Continuous Improvement Journey 53 Have a plan, execute to plan, check and adjust to deviations against the plan The DN Accelerator is our LEAN operating system enabled by culture, competency and commitment to drive operational excellence and transformation. Adjust
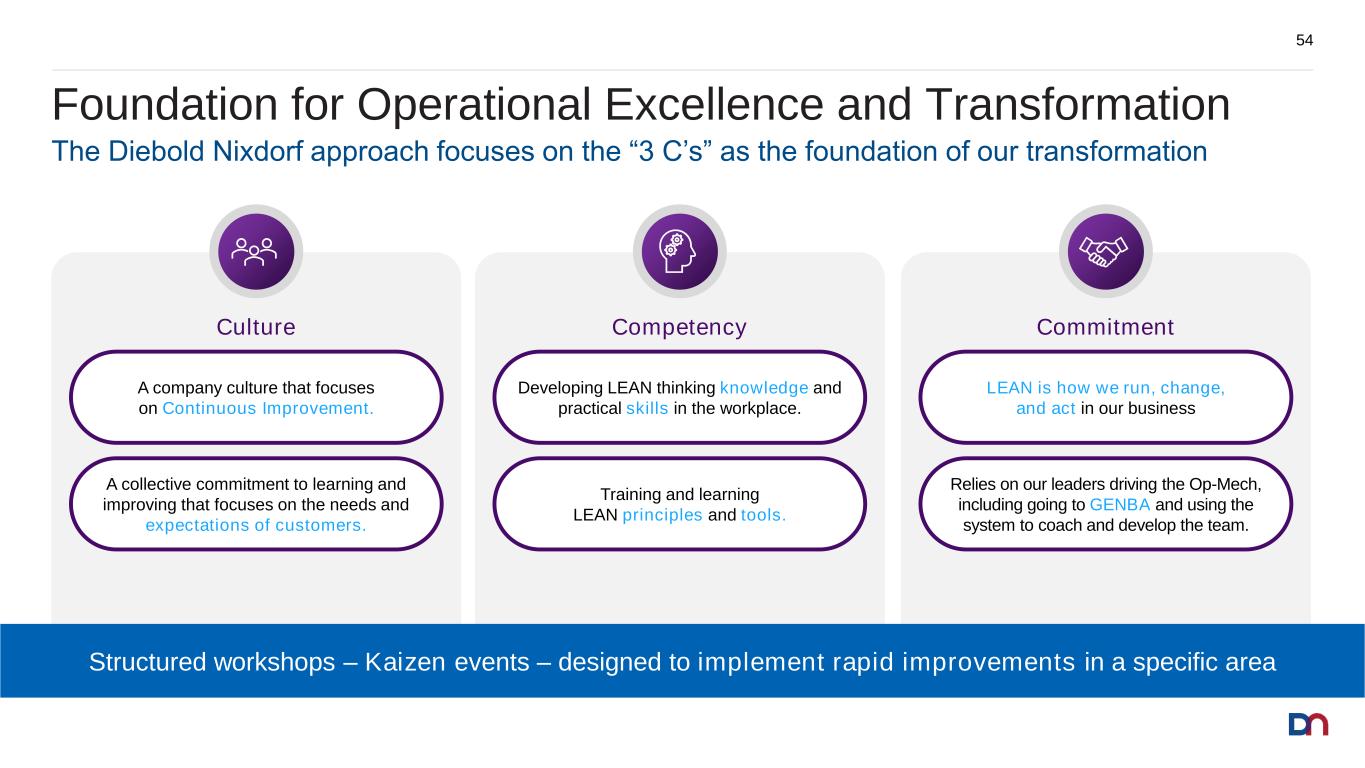
Foundation for Operational Excellence and Transformation 54 The Diebold Nixdorf approach focuses on the “3 C’s” as the foundation of our transformation CompetencyCulture Developing LEAN thinking knowledge and practical skills in the workplace. Training and learning LEAN principles and tools. A company culture that focuses on Continuous Improvement. A collective commitment to learning and improving that focuses on the needs and expectations of customers. LEAN is how we run, change, and act in our business Relies on our leaders driving the Op-Mech, including going to GENBA and using the system to coach and develop the team. Commitment Structured workshops – Kaizen events – designed to implement rapid improvements in a specific area
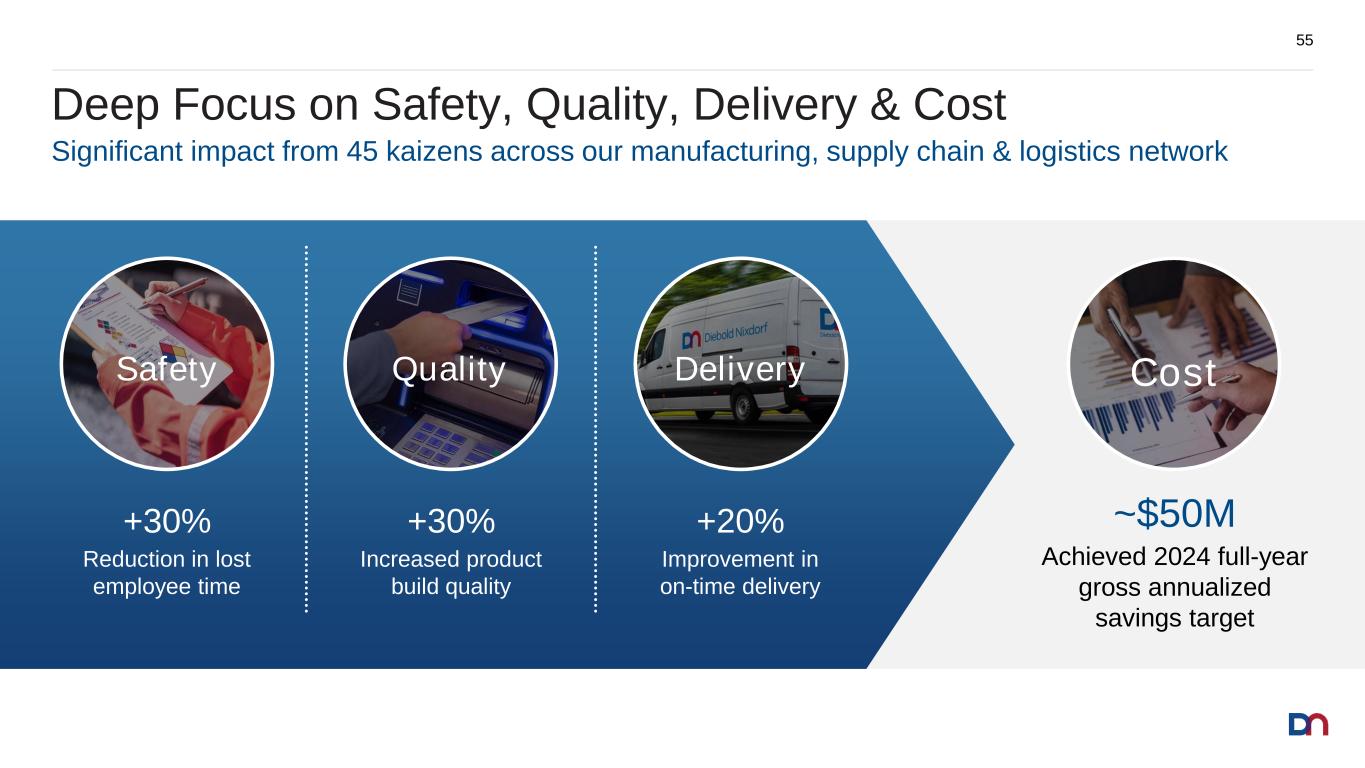
Deep Focus on Safety, Quality, Delivery & Cost 55 Significant impact from 45 kaizens across our manufacturing, supply chain & logistics network +30% Increased product build quality +30% Reduction in lost employee time +20% Improvement in on-time delivery ~$50M Achieved 2024 full-year gross annualized savings target QualitySafety Delivery Cost
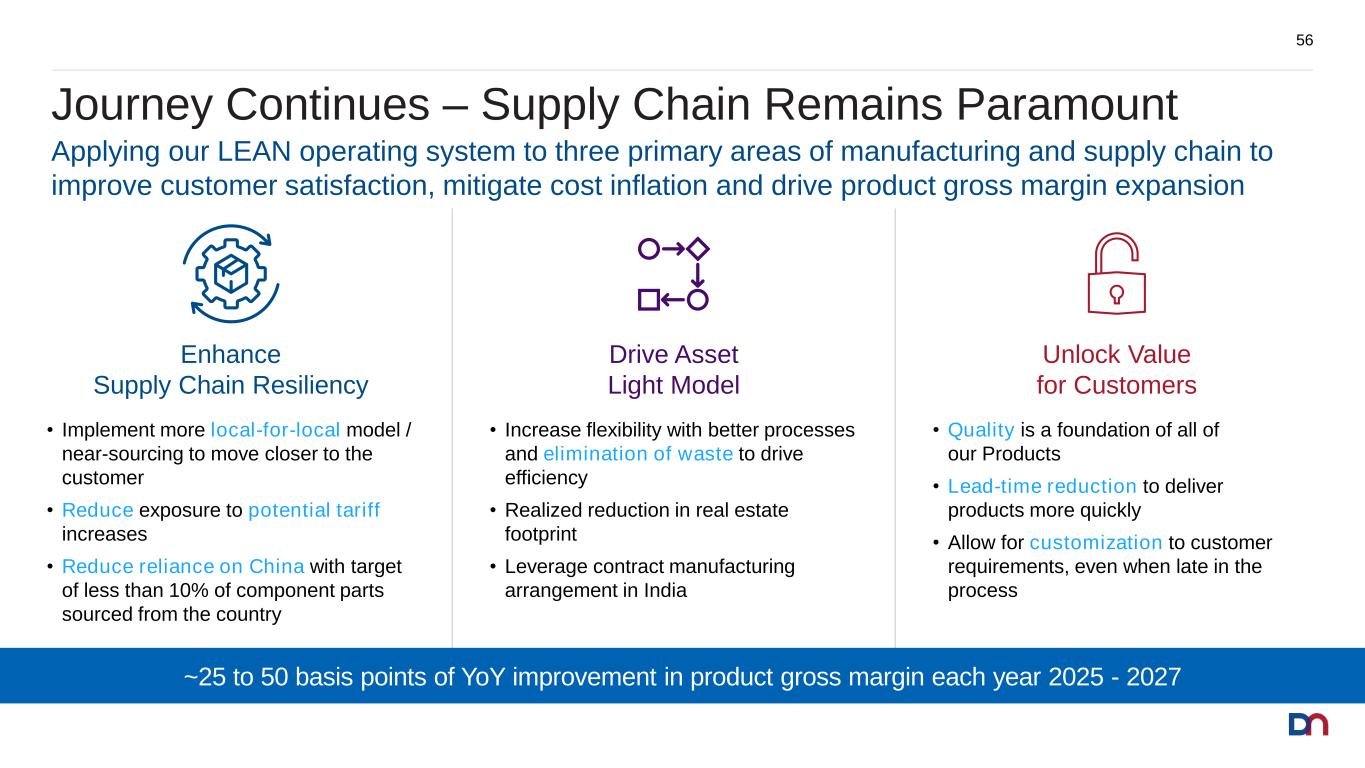
Journey Continues – Supply Chain Remains Paramount 56 Applying our LEAN operating system to three primary areas of manufacturing and supply chain to improve customer satisfaction, mitigate cost inflation and drive product gross margin expansion • Increase flexibility with better processes and elimination of waste to drive efficiency • Realized reduction in real estate footprint • Leverage contract manufacturing arrangement in India Drive Asset Light Model • Implement more local-for-local model / near-sourcing to move closer to the customer • Reduce exposure to potential tariff increases • Reduce reliance on China with target of less than 10% of component parts sourced from the country Enhance Supply Chain Resiliency • Quality is a foundation of all of our Products • Lead-time reduction to deliver products more quickly • Allow for customization to customer requirements, even when late in the process Unlock Value for Customers ~25 to 50 basis points of YoY improvement in product gross margin each year 2025 - 2027
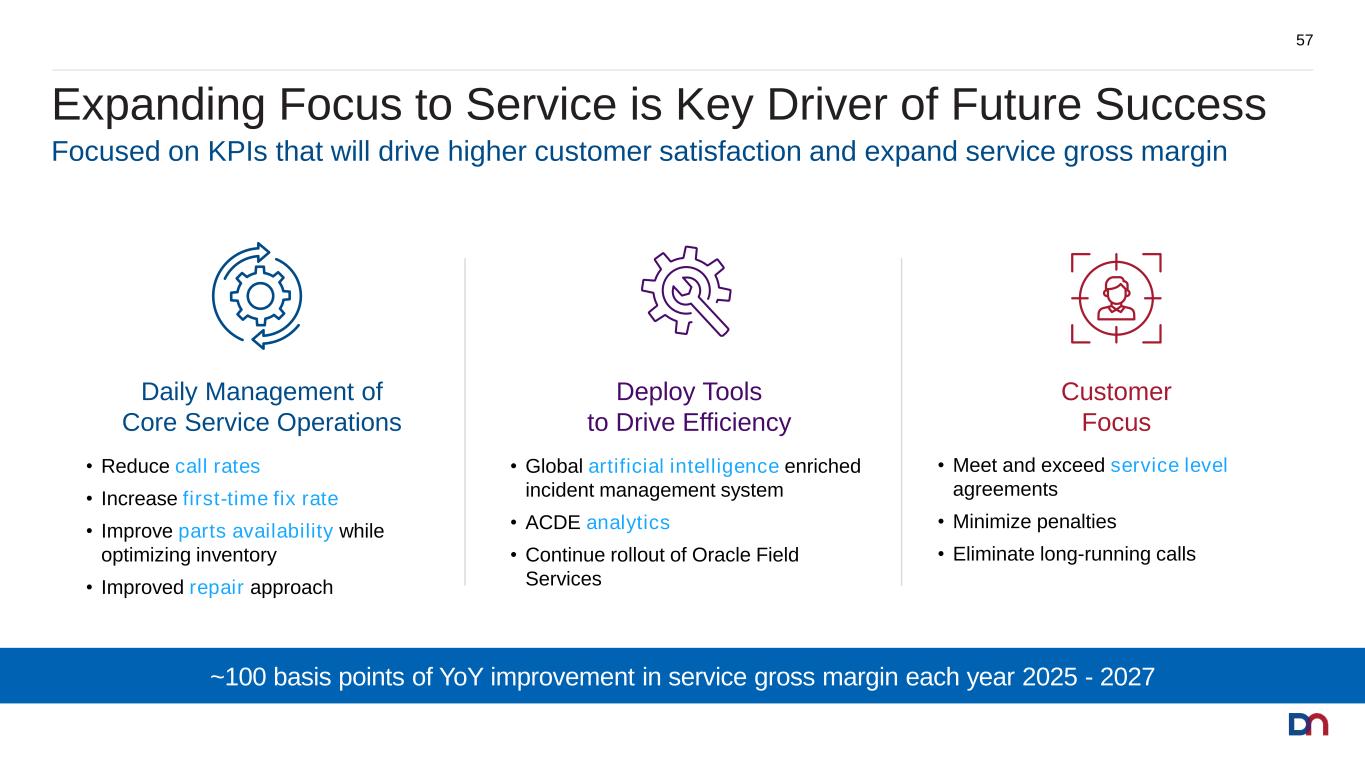
Expanding Focus to Service is Key Driver of Future Success 57 Focused on KPIs that will drive higher customer satisfaction and expand service gross margin Deploy Tools to Drive Efficiency Daily Management of Core Service Operations Customer Focus • Reduce call rates • Increase first-time fix rate • Improve parts availability while optimizing inventory • Improved repair approach • Global artificial intelligence enriched incident management system • ACDE analytics • Continue rollout of Oracle Field Services • Meet and exceed service level agreements • Minimize penalties • Eliminate long-running calls ~100 basis points of YoY improvement in service gross margin each year 2025 - 2027
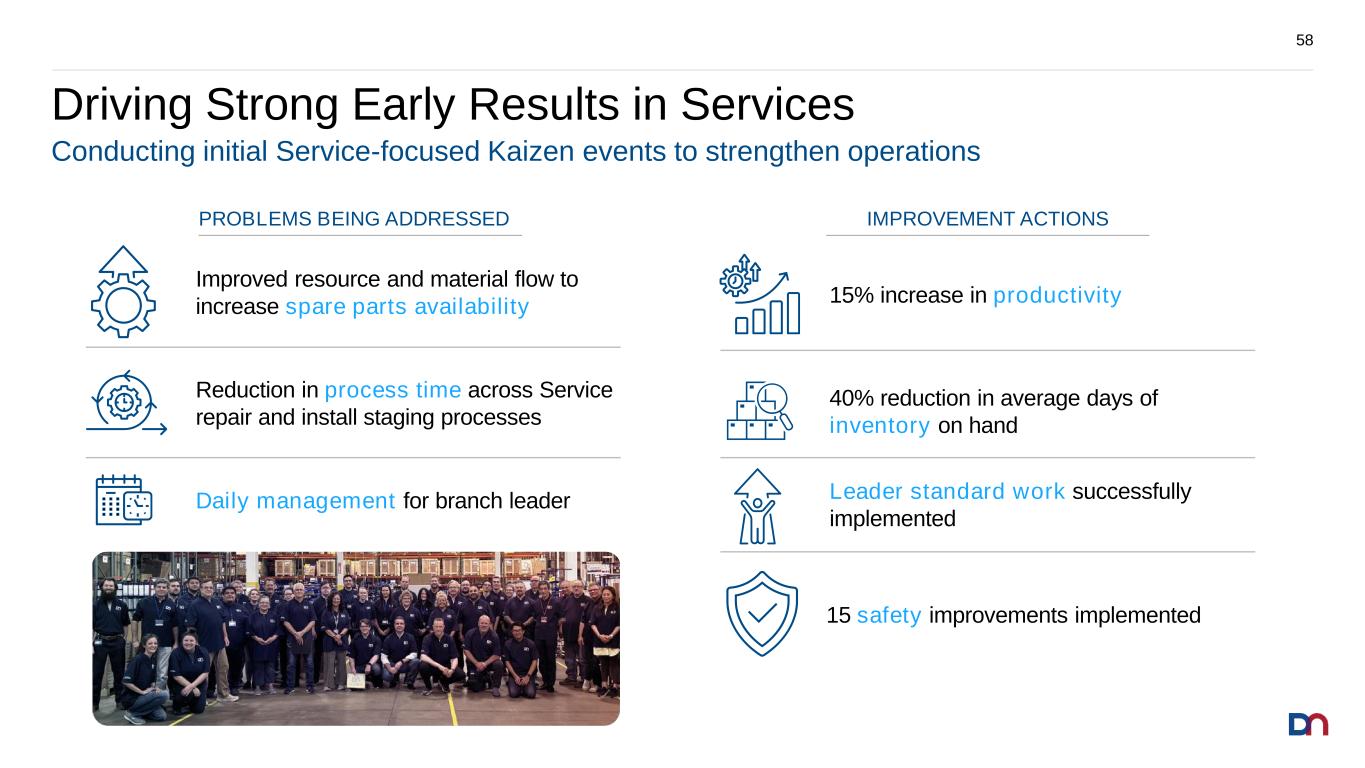
Driving Strong Early Results in Services 58 PROBLEMS BEING ADDRESSED IMPROVEMENT ACTIONS Conducting initial Service-focused Kaizen events to strengthen operations 15% increase in productivity 40% reduction in average days of inventory on hand Leader standard work successfully implemented Improved resource and material flow to increase spare parts availability Reduction in process time across Service repair and install staging processes Daily management for branch leader 15 safety improvements implemented
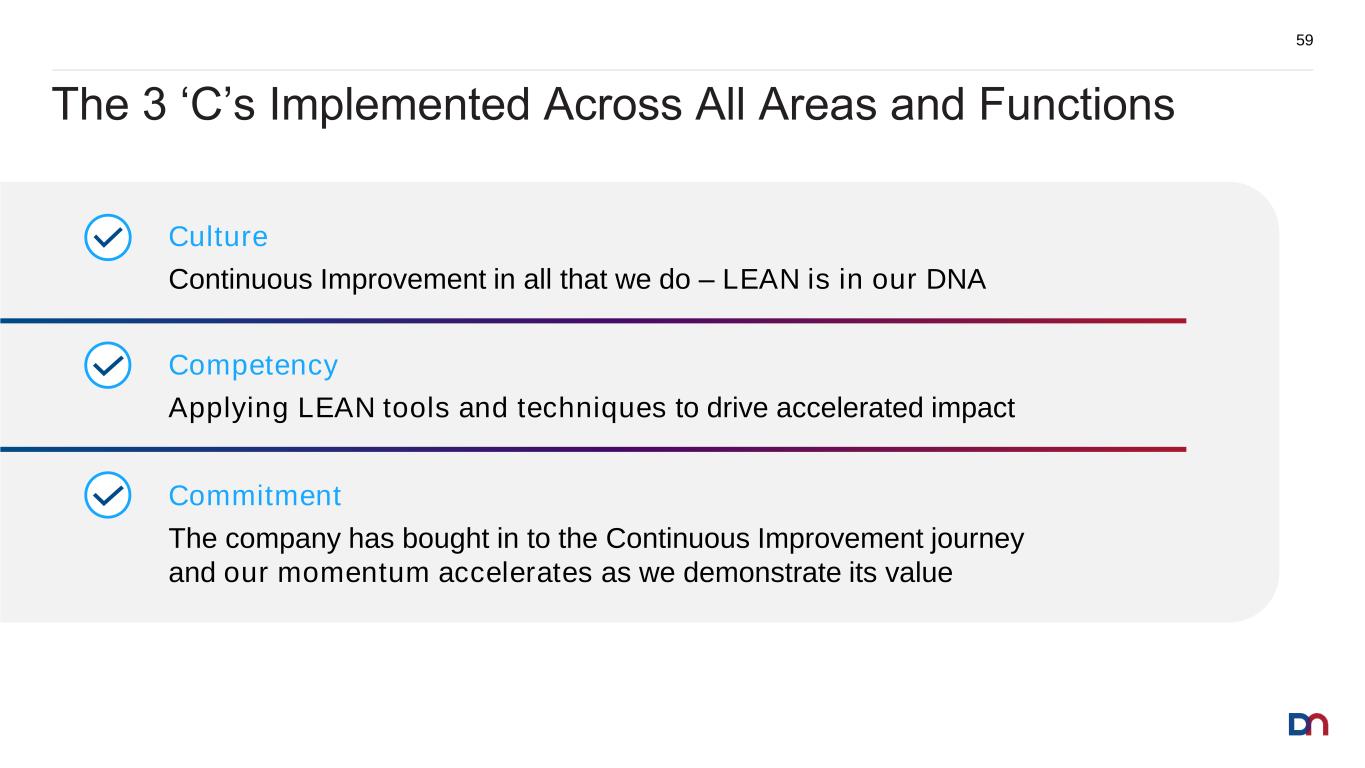
The 3 ‘C’s Implemented Across All Areas and Functions 59 Commitment The company has bought in to the Continuous Improvement journey and our momentum accelerates as we demonstrate its value Culture Continuous Improvement in all that we do – LEAN is in our DNA Competency Applying LEAN tools and techniques to drive accelerated impact

Financial Overview Tom Timko Executive Vice President and Chief Financial Officer
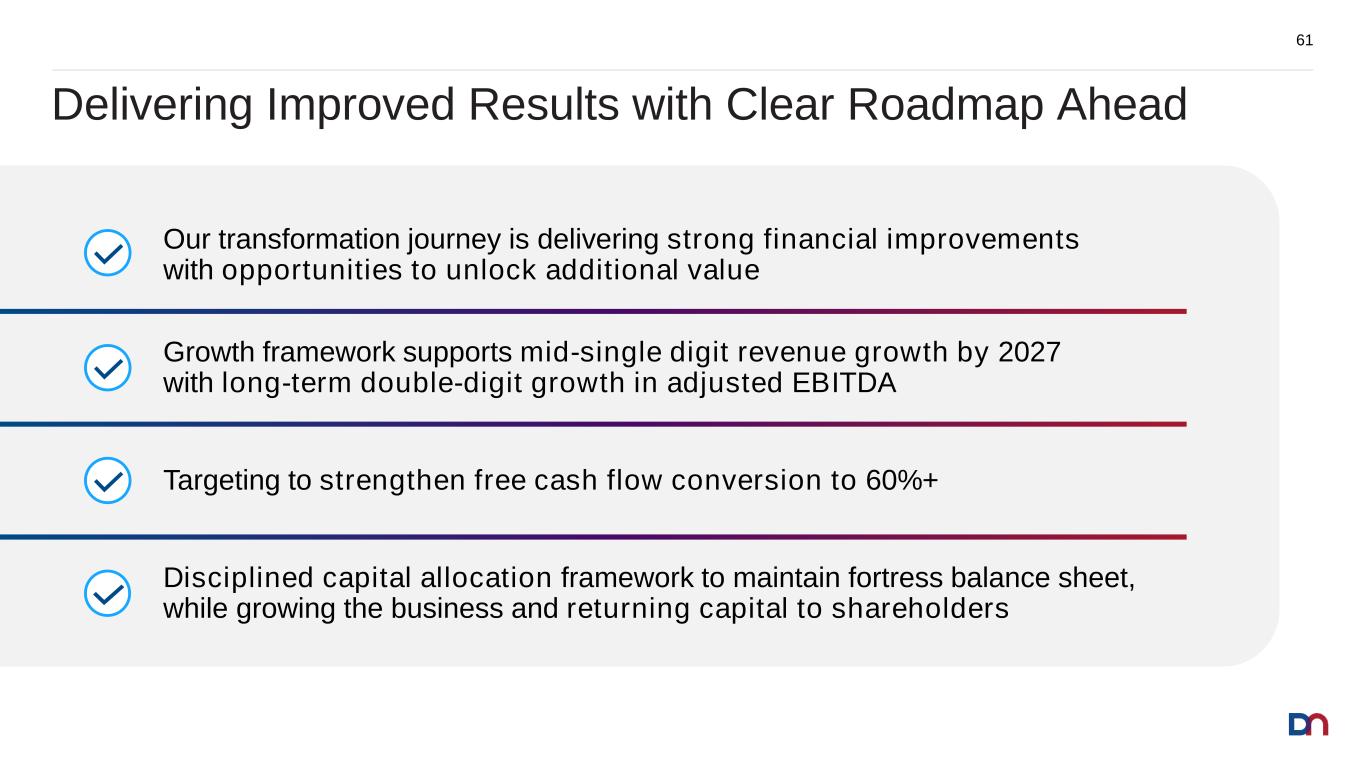
Delivering Improved Results with Clear Roadmap Ahead 61 Disciplined capital allocation framework to maintain fortress balance sheet, while growing the business and returning capital to shareholders Targeting to strengthen free cash flow conversion to 60%+ Our transformation journey is delivering strong financial improvements with opportunities to unlock additional value Growth framework supports mid-single digit revenue growth by 2027 with long-term double-digit growth in adjusted EBITDA
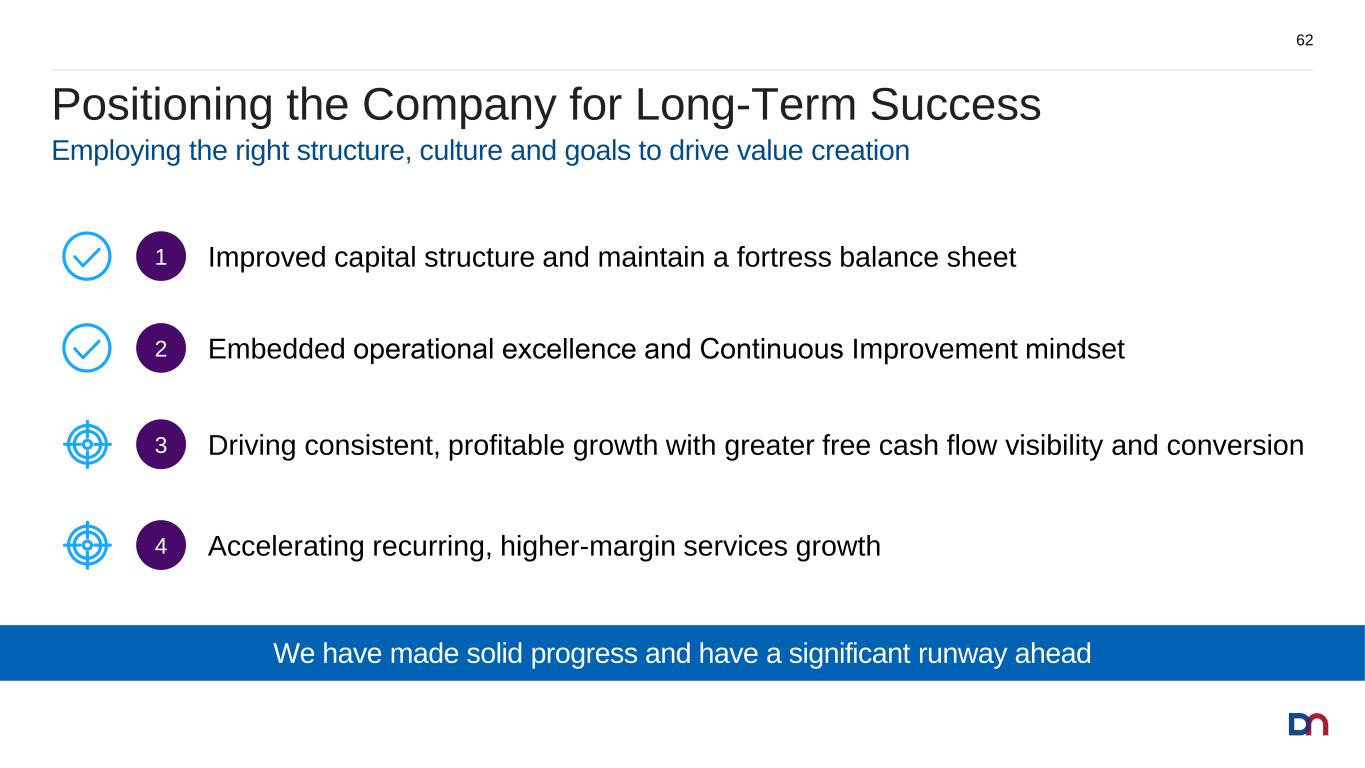
Positioning the Company for Long-Term Success 62 Employing the right structure, culture and goals to drive value creation Driving consistent, profitable growth with greater free cash flow visibility and conversion3 Embedded operational excellence and Continuous Improvement mindset2 Accelerating recurring, higher-margin services growth4 Improved capital structure and maintain a fortress balance sheet1 We have made solid progress and have a significant runway ahead
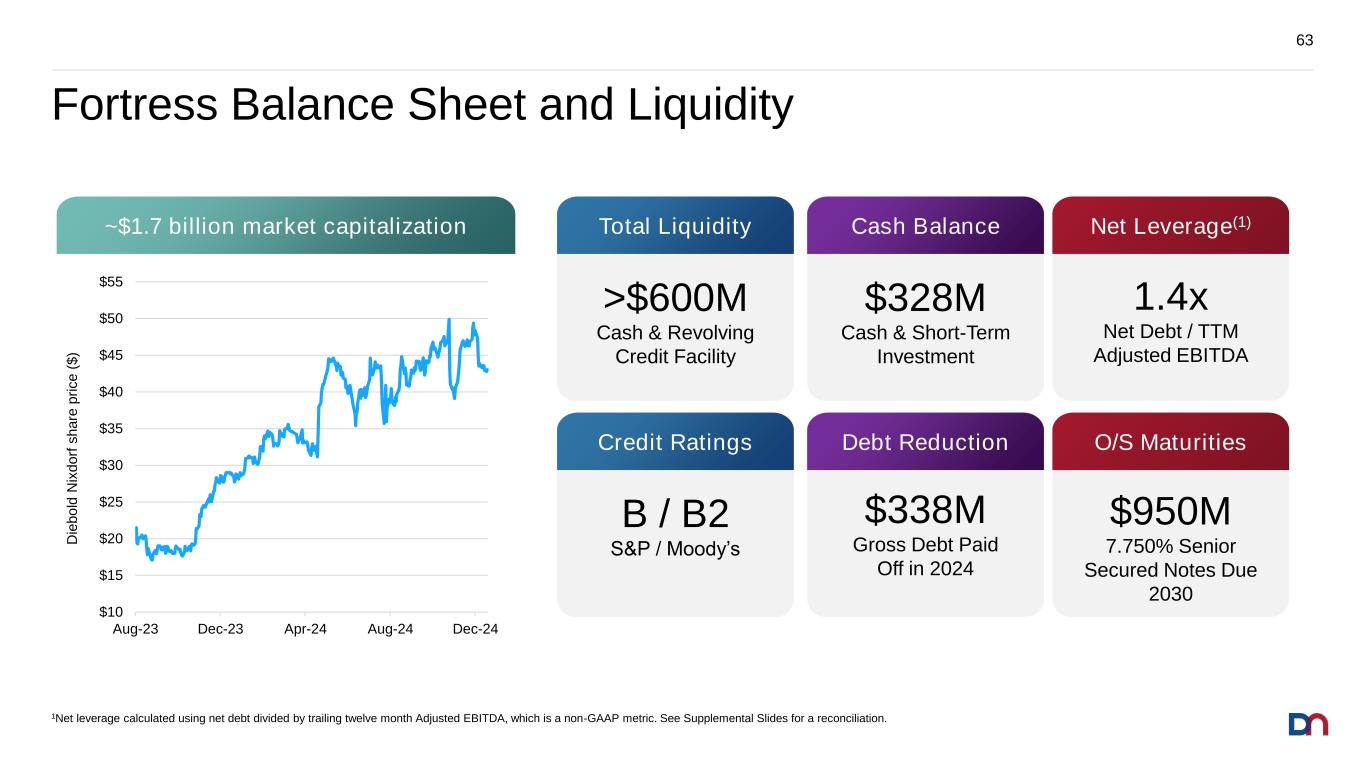
Fortress Balance Sheet and Liquidity 63 $10 $15 $20 $25 $30 $35 $40 $45 $50 $55 Aug-23 Dec-23 Apr-24 Aug-24 Dec-24 D ie b o ld N ix d o rf s h a re p ri c e ( $ ) >$600M Cash & Revolving Credit Facility Total Liquidity Cash Balance $328M Cash & Short-Term Investment Net Leverage(1) 1.4x Net Debt / TTM Adjusted EBITDA B / B2 S&P / Moody’s Credit Ratings Debt Reduction $338M Gross Debt Paid Off in 2024 O/S Maturities $950M 7.750% Senior Secured Notes Due 2030 ~$1.7 billion market capitalization 1Net leverage calculated using net debt divided by trailing twelve month Adjusted EBITDA, which is a non-GAAP metric. See Supplemental Slides for a reconciliation.
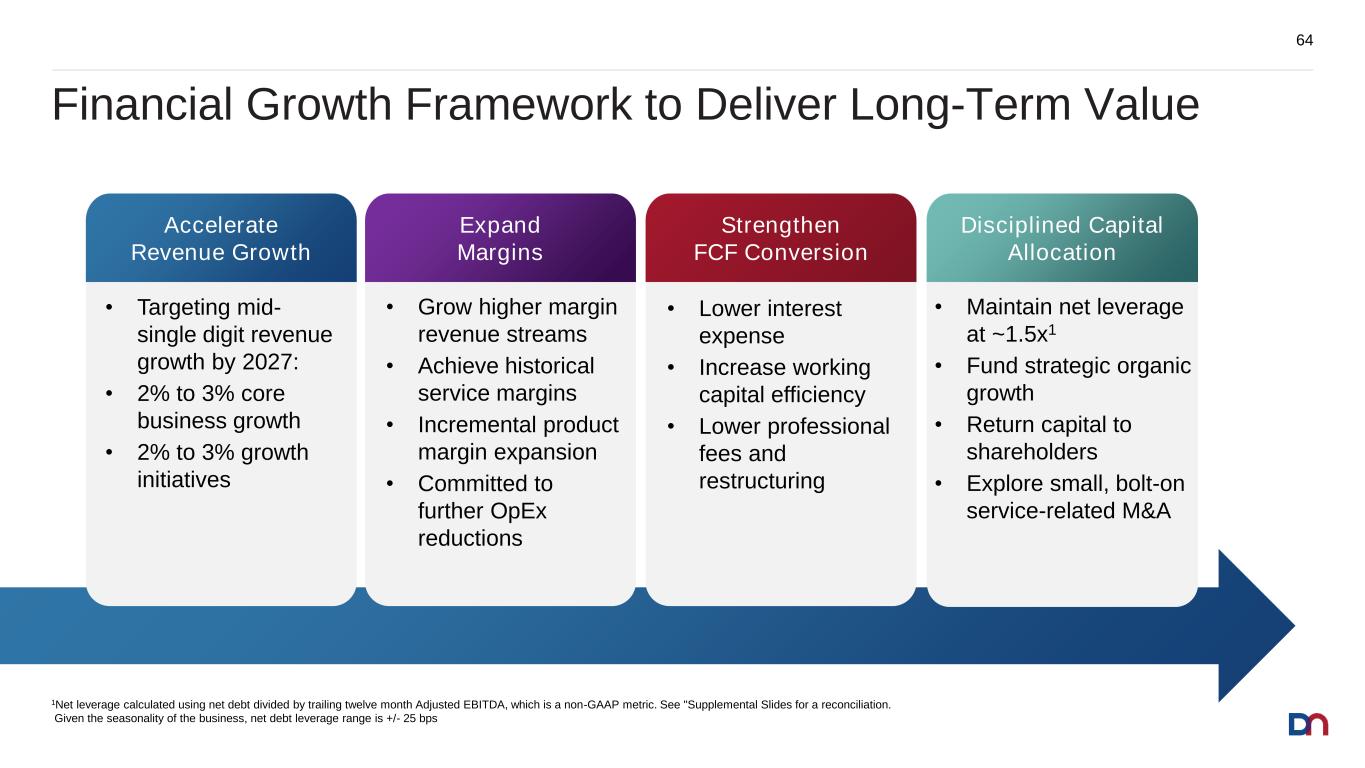
Financial Growth Framework to Deliver Long-Term Value 64 Deliver long term growth in Adj. EBITDA and FCF generation • Targeting mid- single digit revenue growth by 2027: • 2% to 3% core business growth • 2% to 3% growth initiatives Accelerate Revenue Growth • Grow higher margin revenue streams • Achieve historical service margins • Incremental product margin expansion • Committed to further OpEx reductions Expand Margins • Lower interest expense • Increase working capital efficiency • Lower professional fees and restructuring Strengthen FCF Conversion • Maintain net leverage at ~1.5x1 • Fund strategic organic growth • Return capital to shareholders • Explore small, bolt-on service-related M&A Disciplined Capital Allocation 1Net leverage calculated using net debt divided by trailing twelve month Adjusted EBITDA, which is a non-GAAP metric. See "Supplemental Slides for a reconciliation. Given the seasonality of the business, net debt leverage range is +/- 25 bps
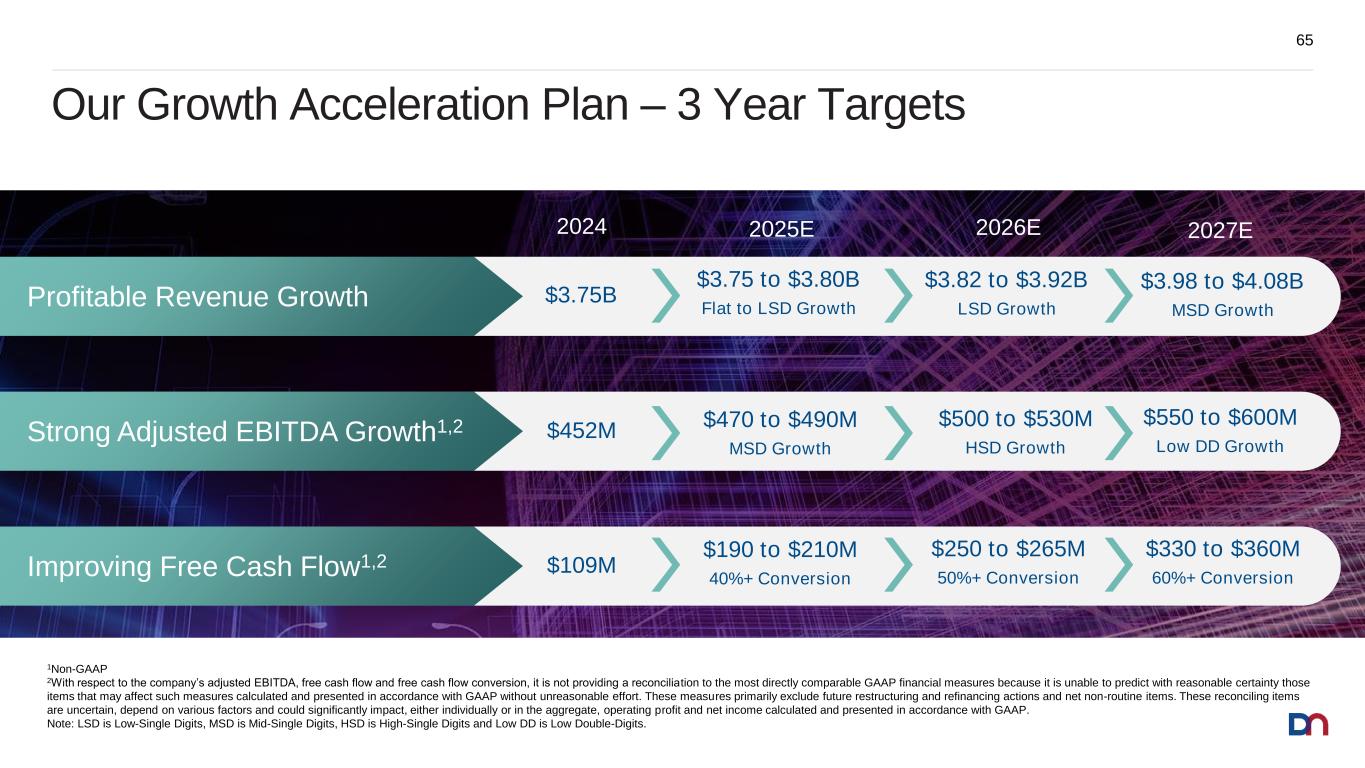
65 Our Growth Acceleration Plan – 3 Year Targets $3.75 to $3.80B Flat to LSD Growth $3.75BProfitable Revenue Growth 2027E2025E2024 Strong Adjusted EBITDA Growth1,2 $470 to $490M MSD Growth $452M Improving Free Cash Flow1,2 $190 to $210M 40%+ Conversion $109M 2026E $3.82 to $3.92B LSD Growth $3.98 to $4.08B MSD Growth $500 to $530M HSD Growth $550 to $600M Low DD Growth $330 to $360M 60%+ Conversion $250 to $265M 50%+ Conversion 1Non-GAAP 2With respect to the company’s adjusted EBITDA, free cash flow and free cash flow conversion, it is not providing a reconciliation to the most directly comparable GAAP financial measures because it is unable to predict with reasonable certainty those items that may affect such measures calculated and presented in accordance with GAAP without unreasonable effort. These measures primarily exclude future restructuring and refinancing actions and net non-routine items. These reconciling items are uncertain, depend on various factors and could significantly impact, either individually or in the aggregate, operating profit and net income calculated and presented in accordance with GAAP. Note: LSD is Low-Single Digits, MSD is Mid-Single Digits, HSD is High-Single Digits and Low DD is Low Double-Digits.
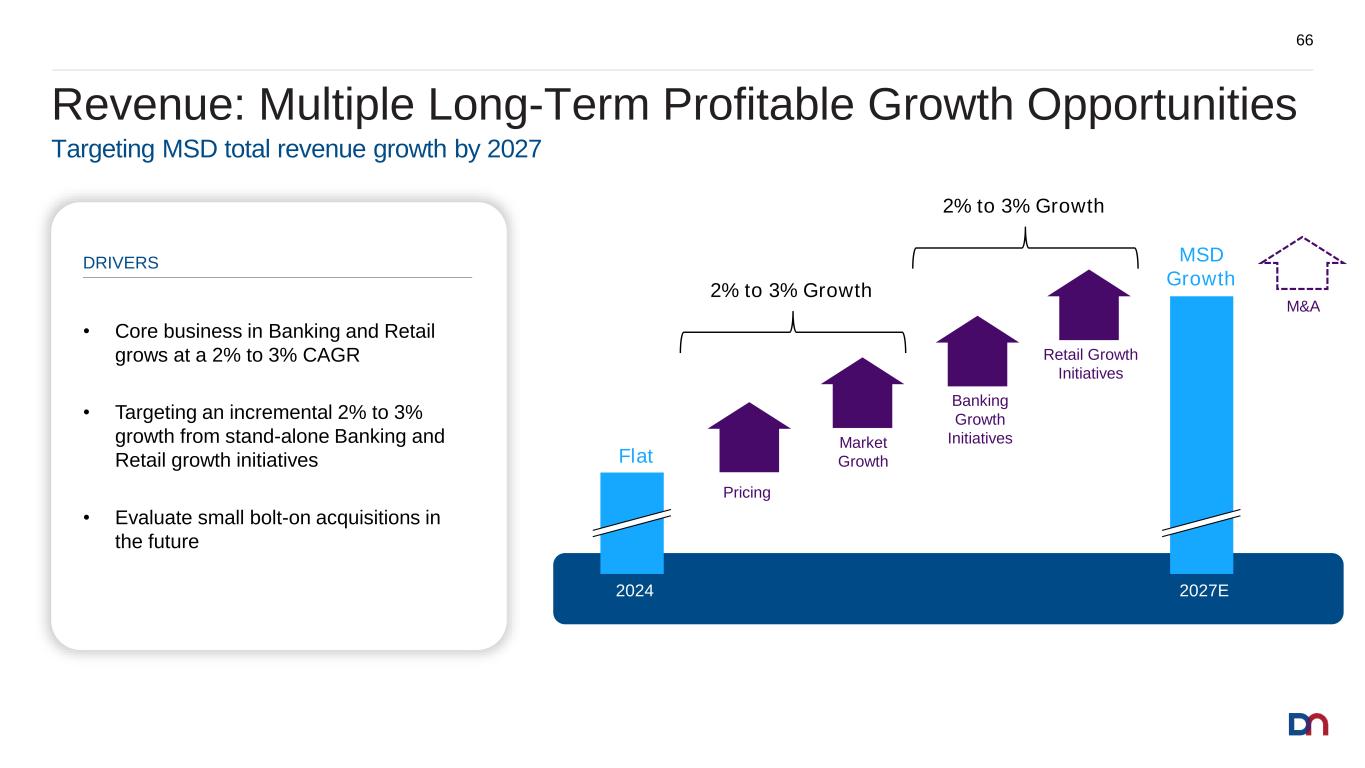
Revenue: Multiple Long-Term Profitable Growth Opportunities 66 2027E2024 Targeting MSD total revenue growth by 2027 DRIVERS $XXX Retail Growth Initiatives Pricing $XXX Banking Growth InitiativesMarket GrowthFlat MSD Growth • Core business in Banking and Retail grows at a 2% to 3% CAGR • Targeting an incremental 2% to 3% growth from stand-alone Banking and Retail growth initiatives • Evaluate small bolt-on acquisitions in the future M&A 2% to 3% Growth 2% to 3% Growth
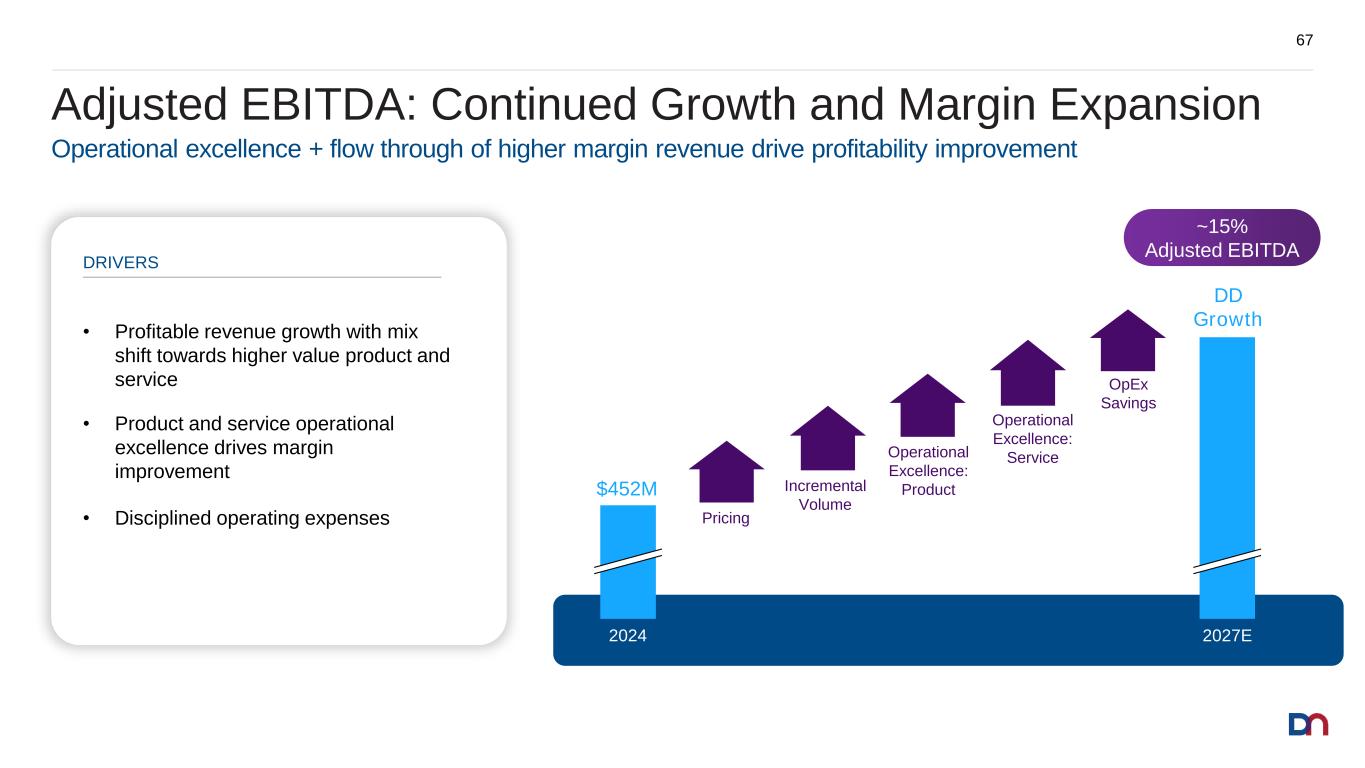
Adjusted EBITDA: Continued Growth and Margin Expansion 67 2024 2027E • Profitable revenue growth with mix shift towards higher value product and service • Product and service operational excellence drives margin improvement • Disciplined operating expenses DRIVERS Operational excellence + flow through of higher margin revenue drive profitability improvement OpEx Savings Operational Excellence: ServiceOperational Excellence: ProductIncremental Volume Pricing $XXX $XXX ~15% Adjusted EBITDA DD Growth $452M
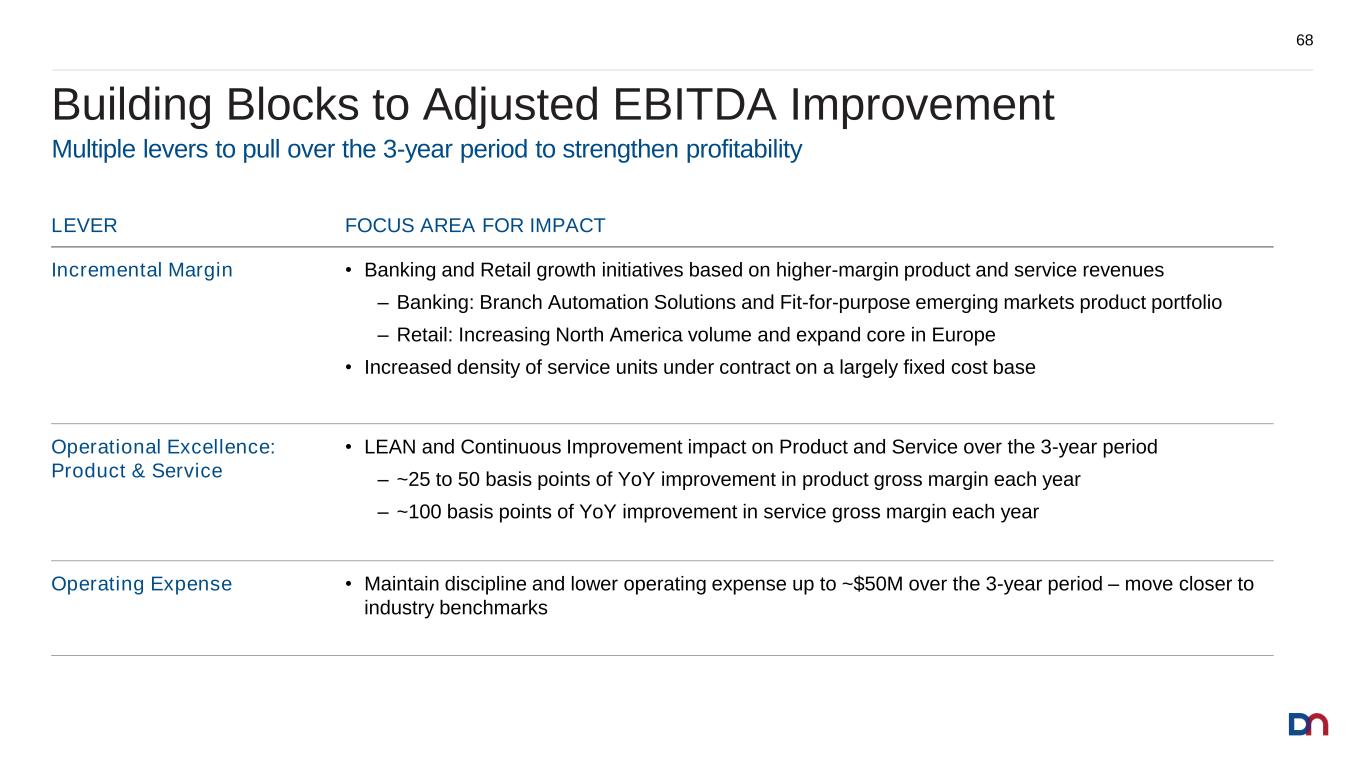
Building Blocks to Adjusted EBITDA Improvement 68 Multiple levers to pull over the 3-year period to strengthen profitability LEVER FOCUS AREA FOR IMPACT Incremental Margin • Banking and Retail growth initiatives based on higher-margin product and service revenues ‒ Banking: Branch Automation Solutions and Fit-for-purpose emerging markets product portfolio ‒ Retail: Increasing North America volume and expand core in Europe • Increased density of service units under contract on a largely fixed cost base Operational Excellence: Product & Service • LEAN and Continuous Improvement impact on Product and Service over the 3-year period ‒ ~25 to 50 basis points of YoY improvement in product gross margin each year ‒ ~100 basis points of YoY improvement in service gross margin each year Operating Expense • Maintain discipline and lower operating expense up to ~$50M over the 3-year period – move closer to industry benchmarks
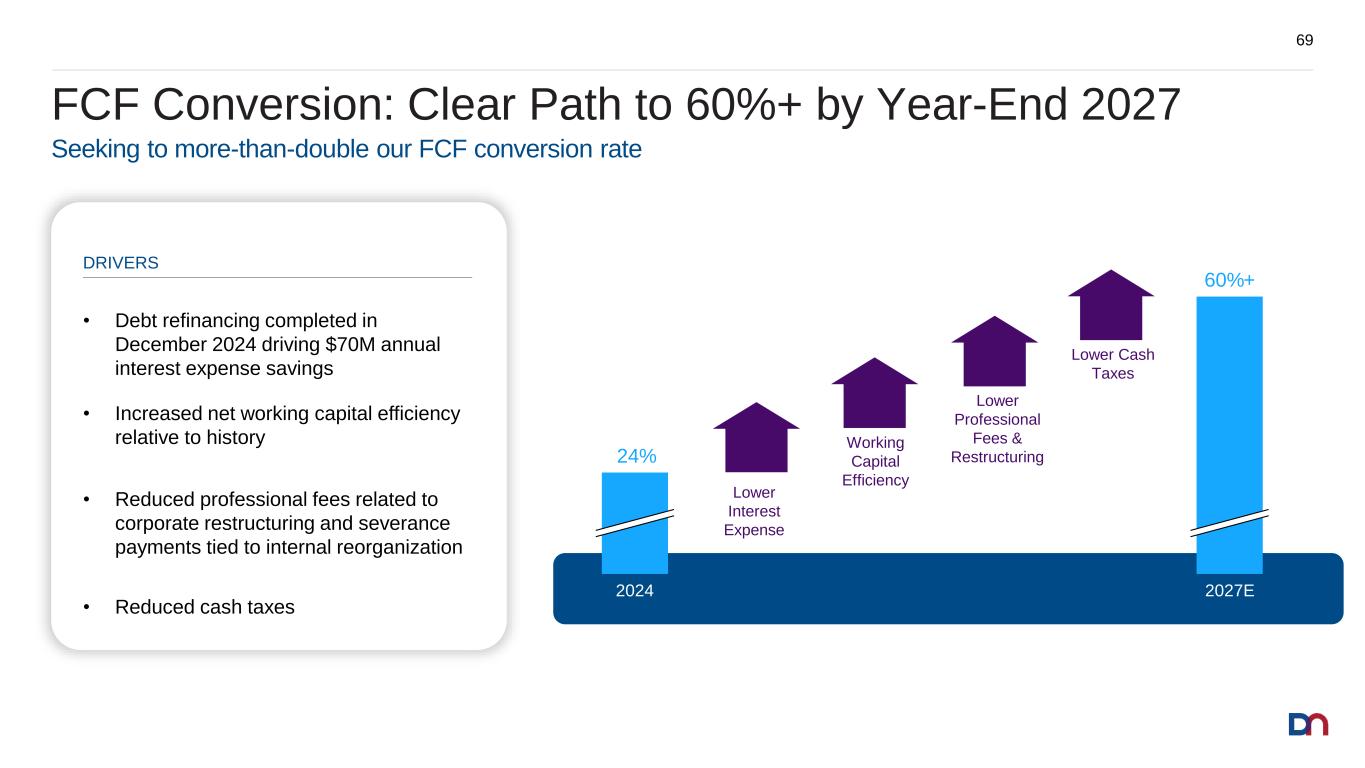
FCF Conversion: Clear Path to 60%+ by Year-End 2027 69 2027E2024 • Debt refinancing completed in December 2024 driving $70M annual interest expense savings • Increased net working capital efficiency relative to history • Reduced professional fees related to corporate restructuring and severance payments tied to internal reorganization • Reduced cash taxes Seeking to more-than-double our FCF conversion rate DRIVERS $XXX Lower Cash Taxes Lower Interest Expense $XXX Lower Professional Fees & Restructuring Working Capital Efficiency 24% 60%+
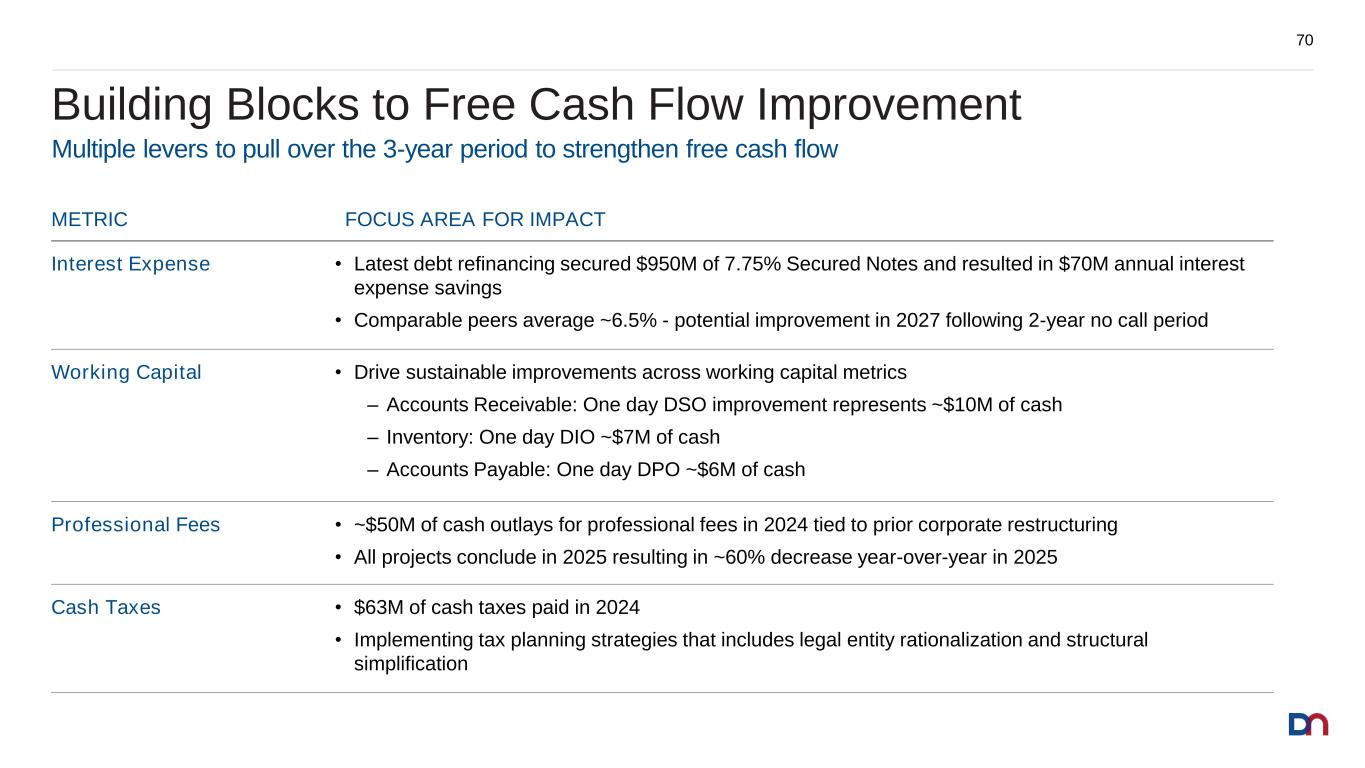
METRIC FOCUS AREA FOR IMPACT Interest Expense • Latest debt refinancing secured $950M of 7.75% Secured Notes and resulted in $70M annual interest expense savings • Comparable peers average ~6.5% - potential improvement in 2027 following 2-year no call period Working Capital • Drive sustainable improvements across working capital metrics ‒ Accounts Receivable: One day DSO improvement represents ~$10M of cash ‒ Inventory: One day DIO ~$7M of cash ‒ Accounts Payable: One day DPO ~$6M of cash Professional Fees • ~$50M of cash outlays for professional fees in 2024 tied to prior corporate restructuring • All projects conclude in 2025 resulting in ~60% decrease year-over-year in 2025 Cash Taxes • $63M of cash taxes paid in 2024 • Implementing tax planning strategies that includes legal entity rationalization and structural simplification Building Blocks to Free Cash Flow Improvement 70 Multiple levers to pull over the 3-year period to strengthen free cash flow
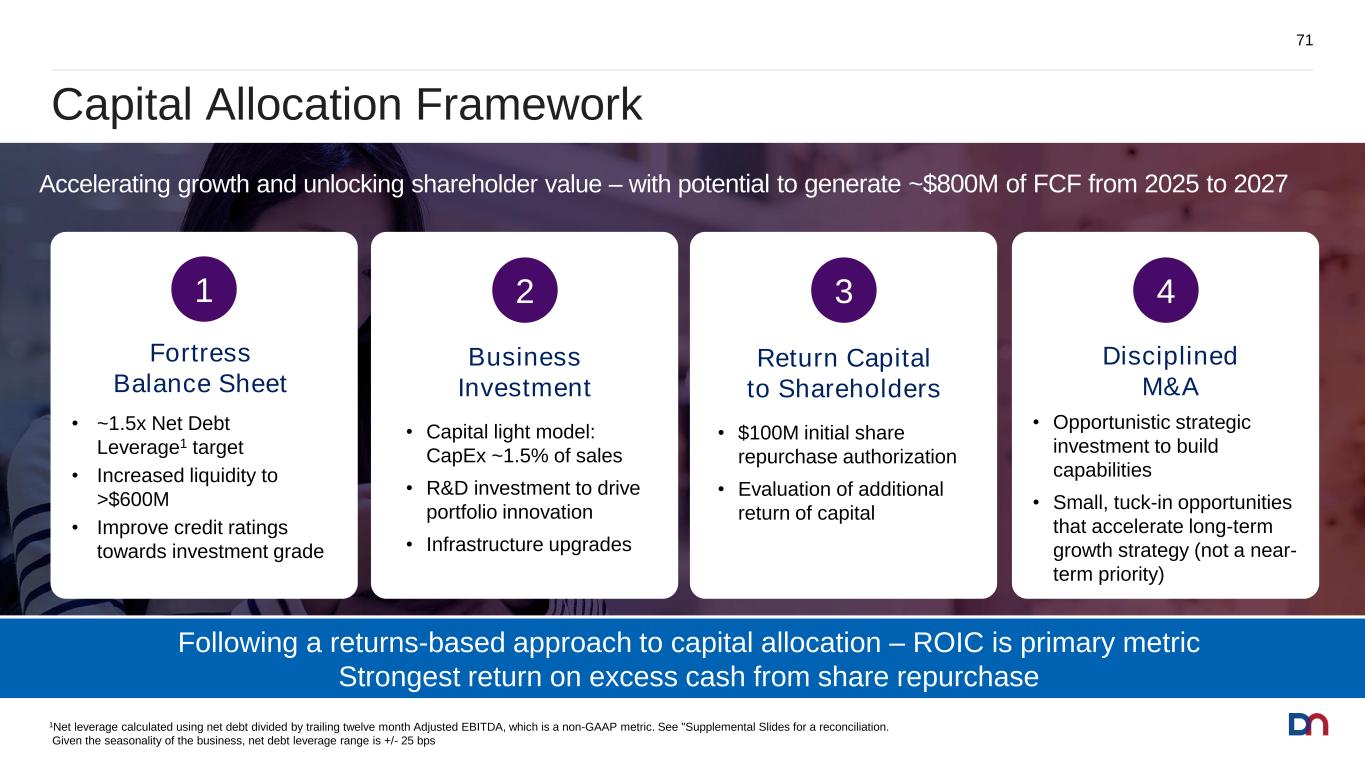
Capital Allocation Framework 71 Following a returns-based approach to capital allocation – ROIC is primary metric Strongest return on excess cash from share repurchase Accelerating growth and unlocking shareholder value – with potential to generate ~$800M of FCF from 2025 to 2027 Business Investment • Capital light model: CapEx ~1.5% of sales • R&D investment to drive portfolio innovation • Infrastructure upgrades 2 Fortress Balance Sheet • ~1.5x Net Debt Leverage1 target • Increased liquidity to >$600M • Improve credit ratings towards investment grade 1 Return Capital to Shareholders • $100M initial share repurchase authorization • Evaluation of additional return of capital 3 Disciplined M&A • Opportunistic strategic investment to build capabilities • Small, tuck-in opportunities that accelerate long-term growth strategy (not a near- term priority) 4 1Net leverage calculated using net debt divided by trailing twelve month Adjusted EBITDA, which is a non-GAAP metric. See "Supplemental Slides for a reconciliation. Given the seasonality of the business, net debt leverage range is +/- 25 bps
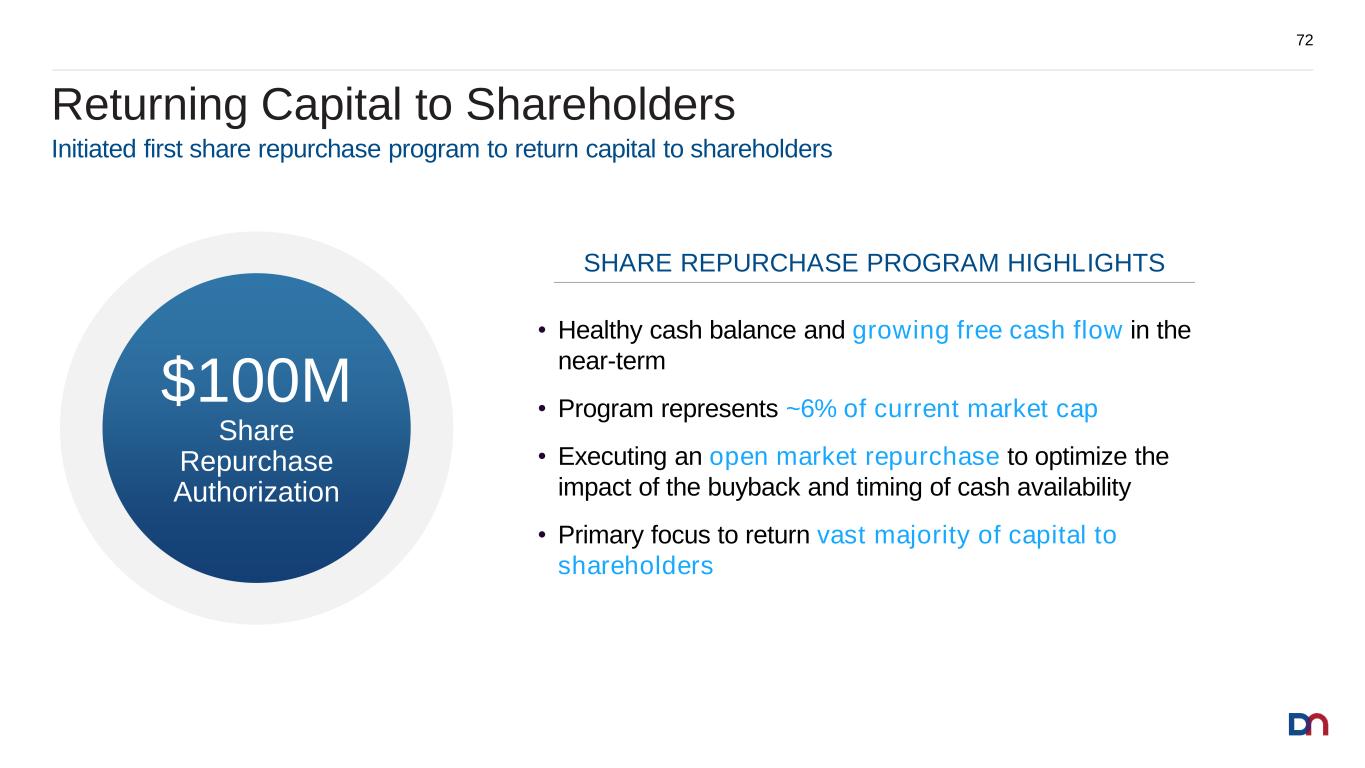
Returning Capital to Shareholders 72 Initiated first share repurchase program to return capital to shareholders SHARE REPURCHASE PROGRAM HIGHLIGHTS • Healthy cash balance and growing free cash flow in the near-term • Program represents ~6% of current market cap • Executing an open market repurchase to optimize the impact of the buyback and timing of cash availability • Primary focus to return vast majority of capital to shareholders $100M Share Repurchase Authorization
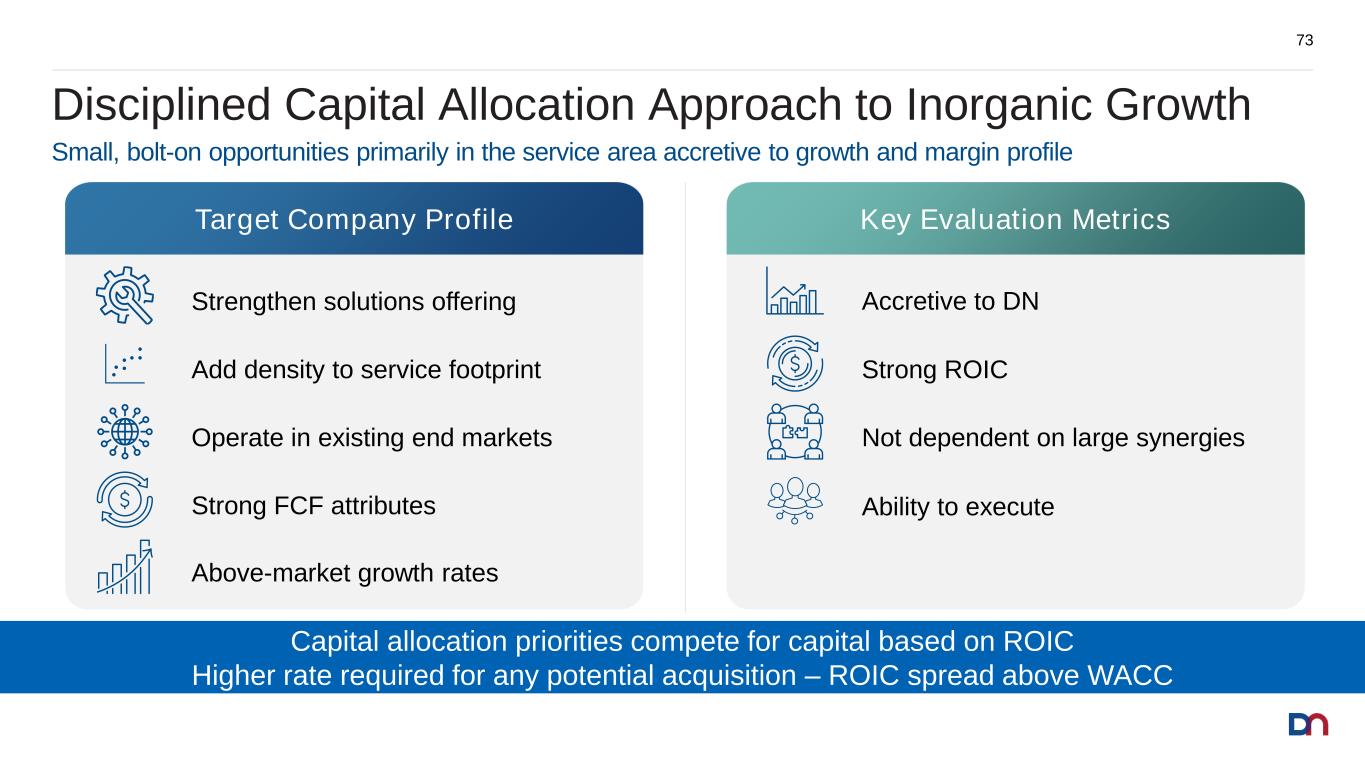
Target Company Profile Key Evaluation Metrics Accretive to DN Strong ROIC Not dependent on large synergies Ability to execute 73 Disciplined Capital Allocation Approach to Inorganic Growth Small, bolt-on opportunities primarily in the service area accretive to growth and margin profile Strengthen solutions offering Add density to service footprint Operate in existing end markets Strong FCF attributes Above-market growth rates Capital allocation priorities compete for capital based on ROIC Higher rate required for any potential acquisition – ROIC spread above WACC
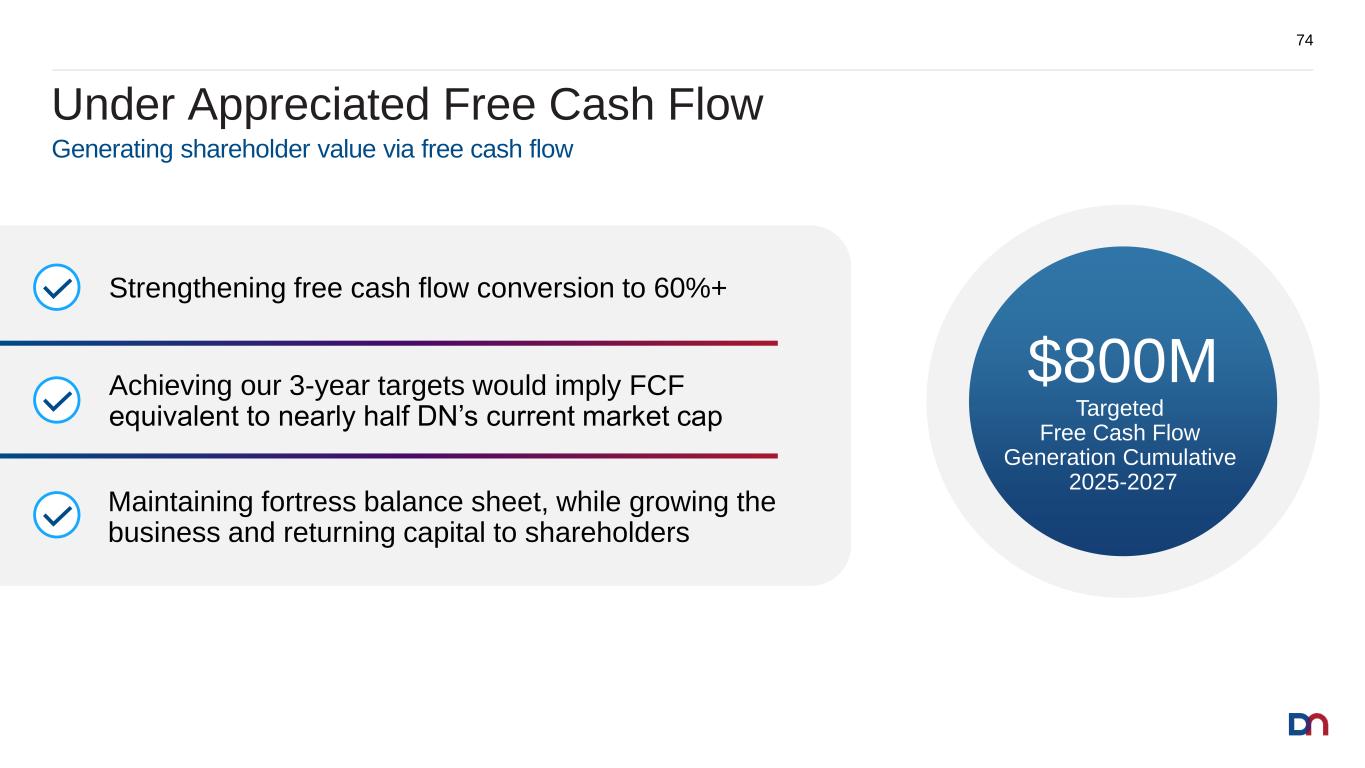
Under Appreciated Free Cash Flow 74 Generating shareholder value via free cash flow Maintaining fortress balance sheet, while growing the business and returning capital to shareholders Strengthening free cash flow conversion to 60%+ Achieving our 3-year targets would imply FCF equivalent to nearly half DN’s current market cap $800M Targeted Free Cash Flow Generation Cumulative 2025-2027
Strategic Value Creation Octavio Marquez President and Chief Executive Officer
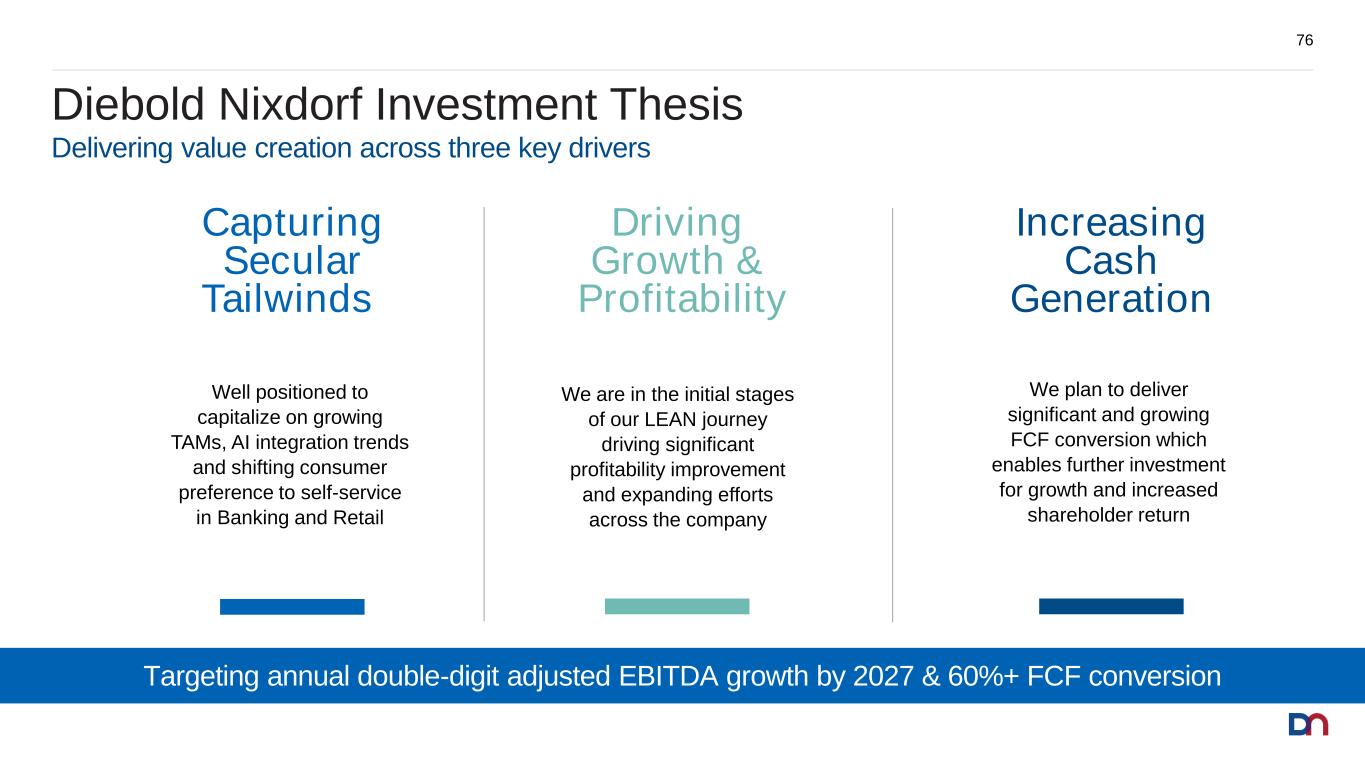
Diebold Nixdorf Investment Thesis 76 Delivering value creation across three key drivers Well positioned to capitalize on growing TAMs, AI integration trends and shifting consumer preference to self-service in Banking and Retail Capturing Secular Tailwinds We are in the initial stages of our LEAN journey driving significant profitability improvement and expanding efforts across the company Driving Growth & Profitability We plan to deliver significant and growing FCF conversion which enables further investment for growth and increased shareholder return Increasing Cash Generation Targeting annual double-digit adjusted EBITDA growth by 2027 & 60%+ FCF conversion
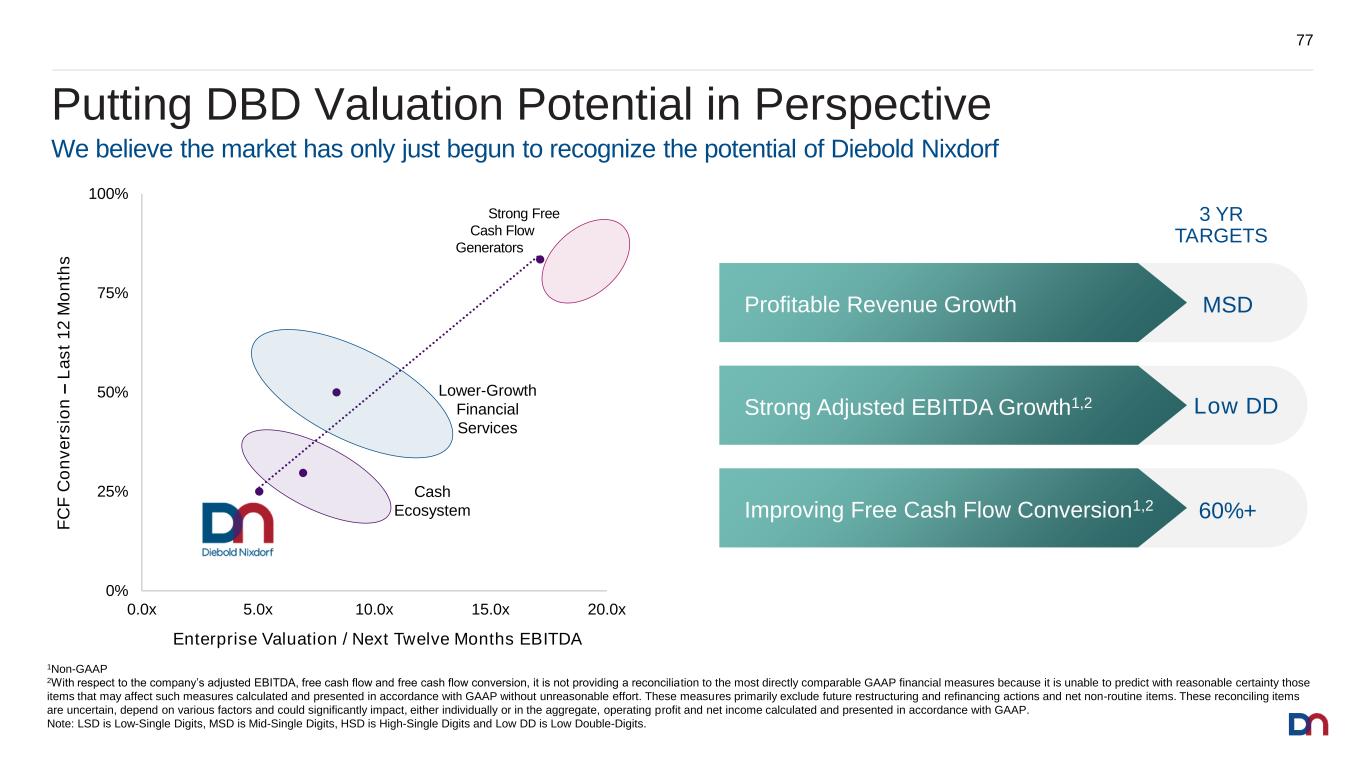
Putting DBD Valuation Potential in Perspective 77 0% 25% 50% 75% 100% 0.0x 5.0x 10.0x 15.0x 20.0x F C F C o n v e rs io n – L a s t 1 2 M o n th s Enterprise Valuation / Next Twelve Months EBITDA Cash Ecosystem Lower-Growth Financial Services Strong Free Cash Flow Generators MSDProfitable Revenue Growth Strong Adjusted EBITDA Growth1,2 Low DD Improving Free Cash Flow Conversion1,2 60%+ 3 YR TARGETS We believe the market has only just begun to recognize the potential of Diebold Nixdorf 1Non-GAAP 2With respect to the company’s adjusted EBITDA, free cash flow and free cash flow conversion, it is not providing a reconciliation to the most directly comparable GAAP financial measures because it is unable to predict with reasonable certainty those items that may affect such measures calculated and presented in accordance with GAAP without unreasonable effort. These measures primarily exclude future restructuring and refinancing actions and net non-routine items. These reconciling items are uncertain, depend on various factors and could significantly impact, either individually or in the aggregate, operating profit and net income calculated and presented in accordance with GAAP. Note: LSD is Low-Single Digits, MSD is Mid-Single Digits, HSD is High-Single Digits and Low DD is Low Double-Digits.
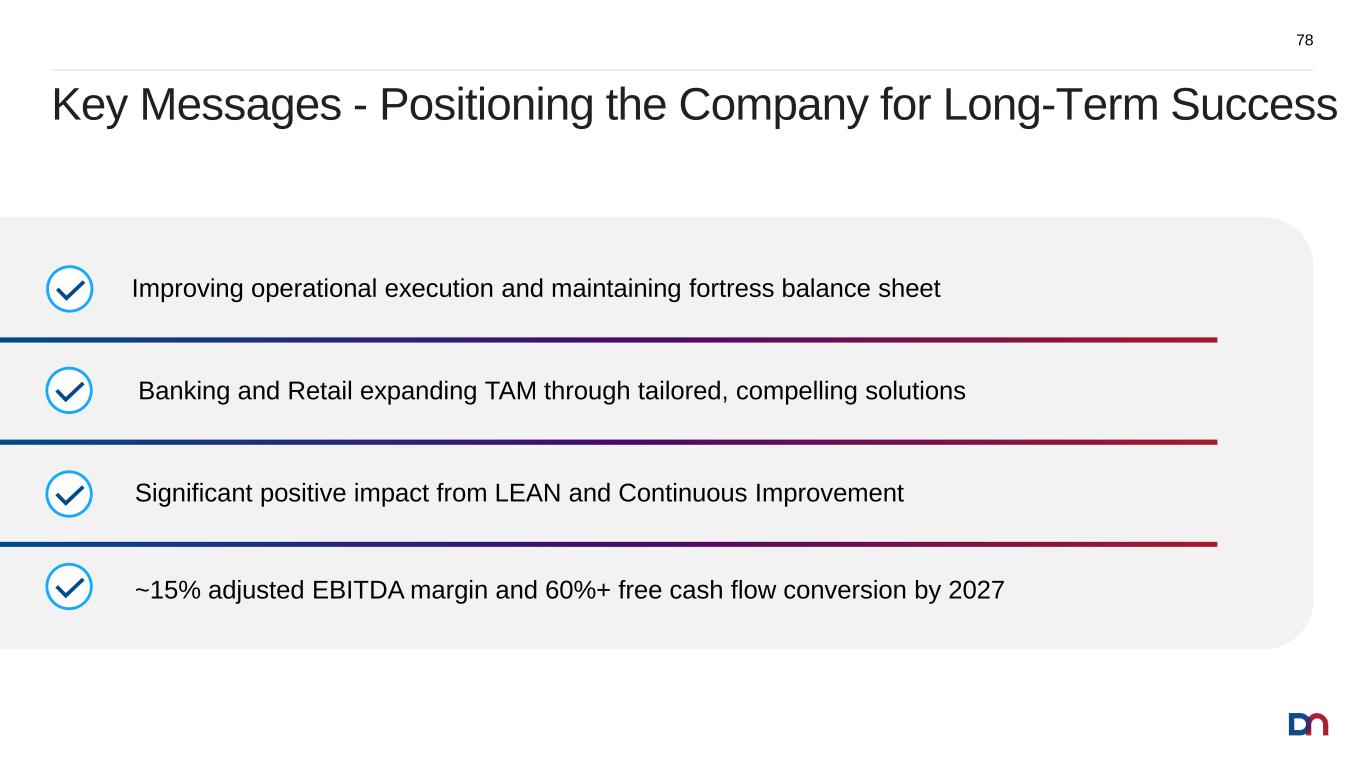
Significant positive impact from LEAN and Continuous Improvement Key Messages - Positioning the Company for Long-Term Success 78 Improving operational execution and maintaining fortress balance sheet Banking and Retail expanding TAM through tailored, compelling solutions ~15% adjusted EBITDA margin and 60%+ free cash flow conversion by 2027
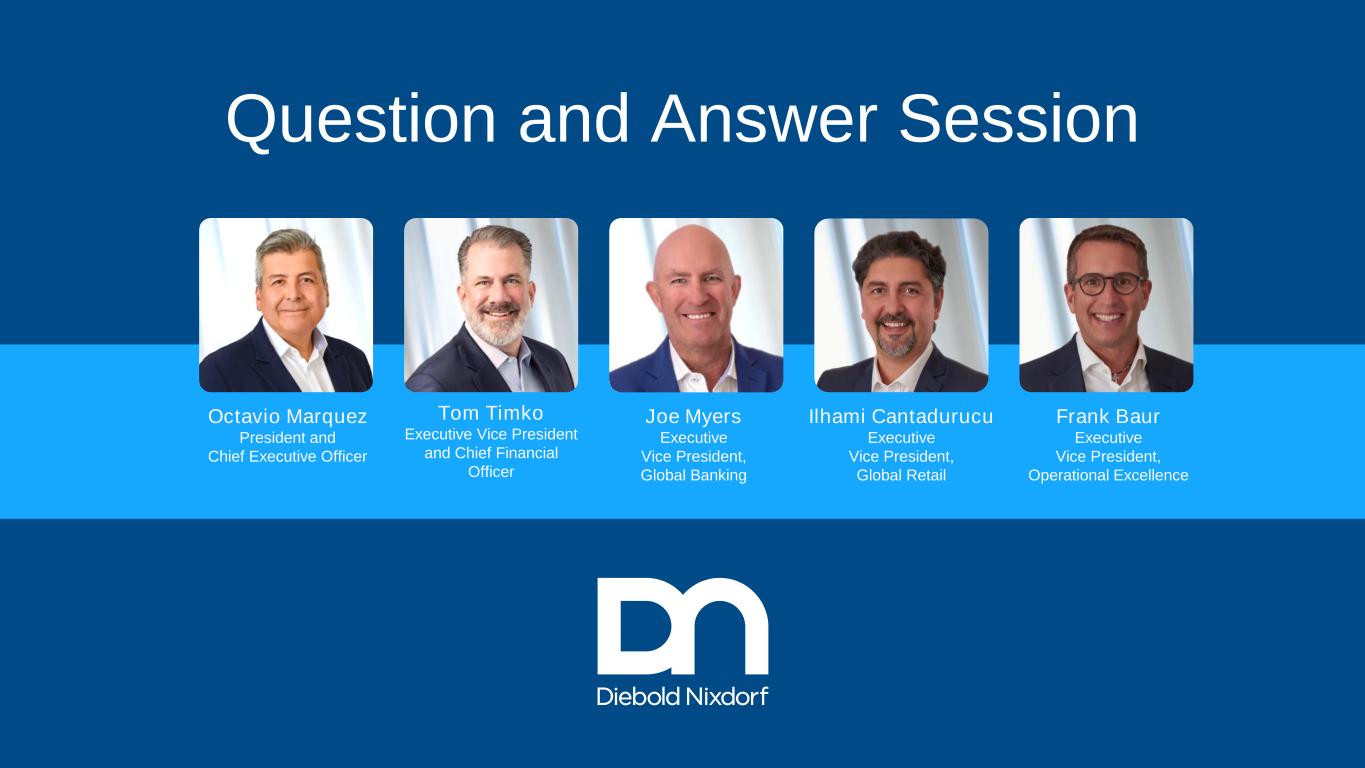
Question and Answer Session Octavio Marquez President and Chief Executive Officer Joe Myers Executive Vice President, Global Banking Ilhami Cantadurucu Executive Vice President, Global Retail Frank Baur Executive Vice President, Operational Excellence Tom Timko Executive Vice President and Chief Financial Officer

Thank You
Supplemental Slides
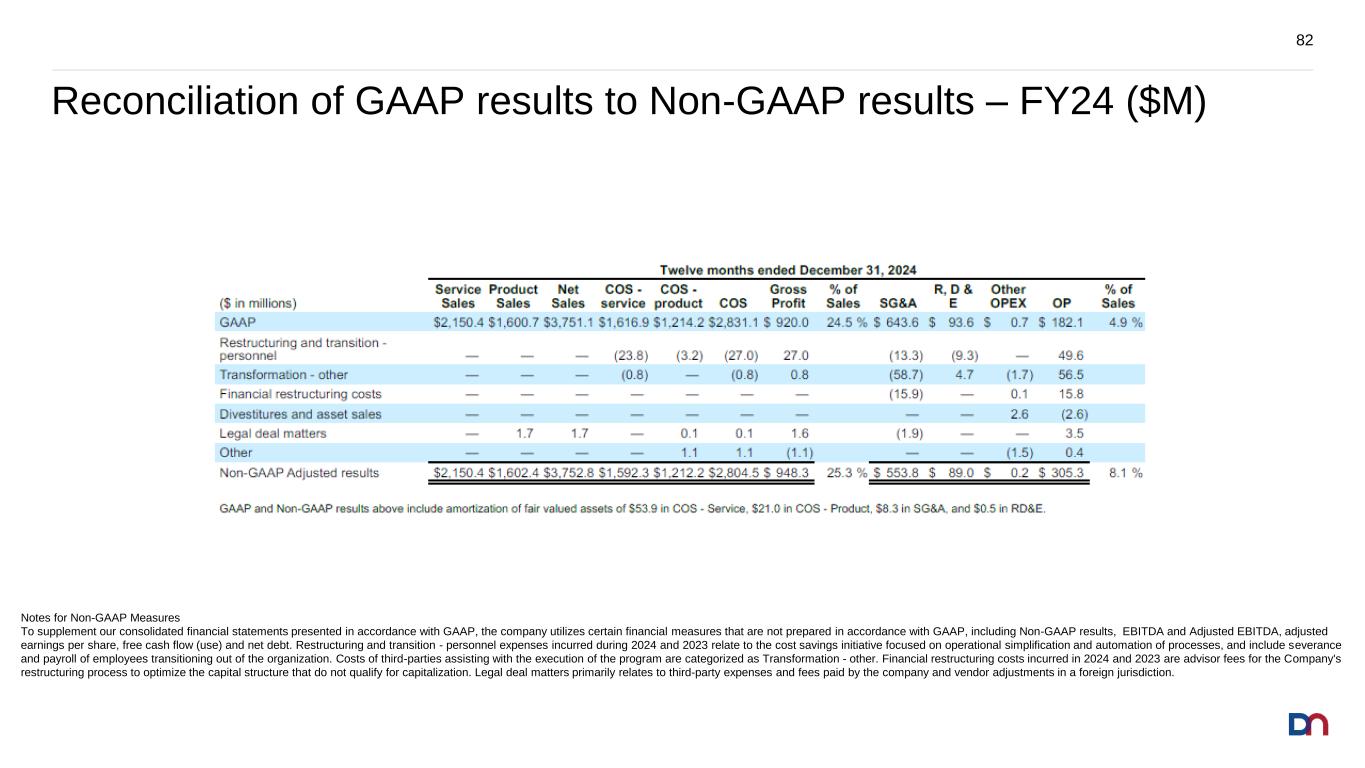
Reconciliation of GAAP results to Non-GAAP results – FY24 ($M) 82 Notes for Non-GAAP Measures To supplement our consolidated financial statements presented in accordance with GAAP, the company utilizes certain financial measures that are not prepared in accordance with GAAP, including Non-GAAP results, EBITDA and Adjusted EBITDA, adjusted earnings per share, free cash flow (use) and net debt. Restructuring and transition - personnel expenses incurred during 2024 and 2023 relate to the cost savings initiative focused on operational simplification and automation of processes, and include severance and payroll of employees transitioning out of the organization. Costs of third-parties assisting with the execution of the program are categorized as Transformation - other. Financial restructuring costs incurred in 2024 and 2023 are advisor fees for the Company's restructuring process to optimize the capital structure that do not qualify for capitalization. Legal deal matters primarily relates to third-party expenses and fees paid by the company and vendor adjustments in a foreign jurisdiction.
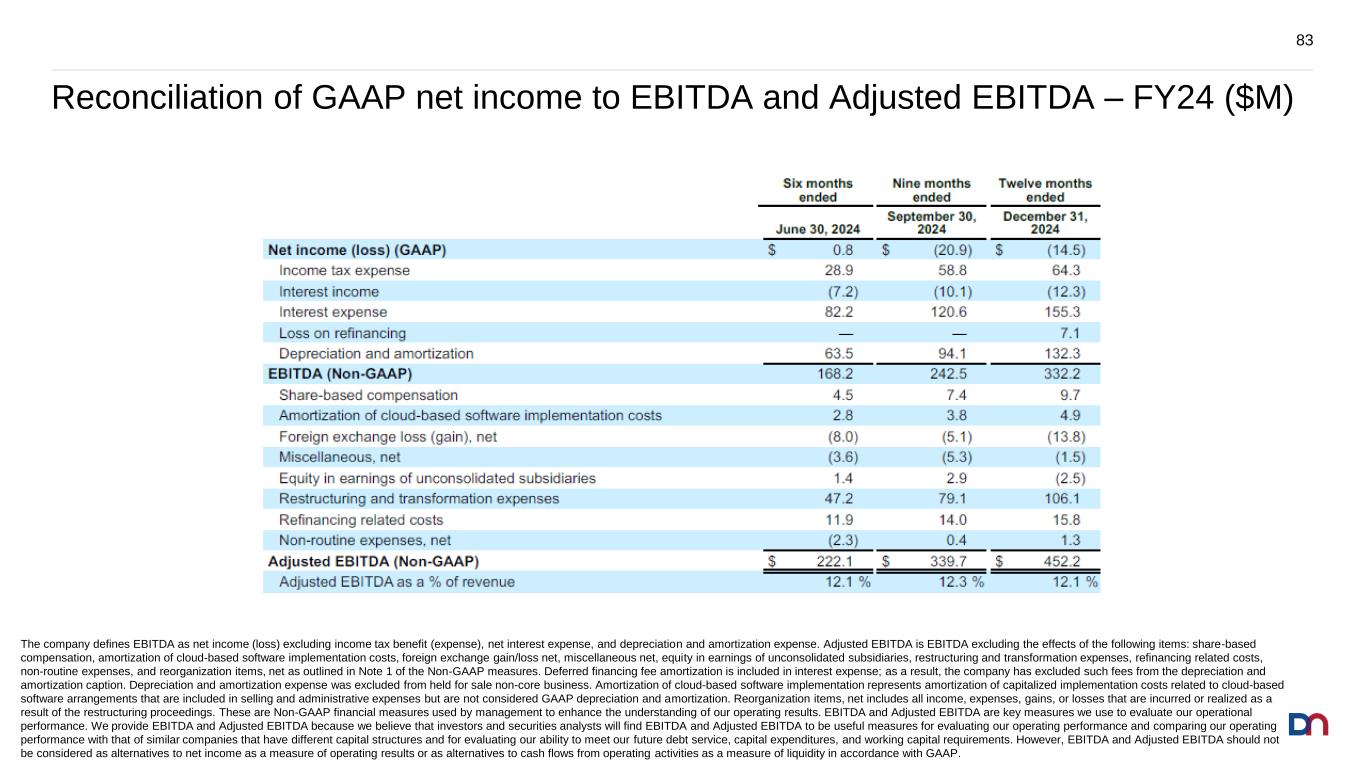
Reconciliation of GAAP net income to EBITDA and Adjusted EBITDA – FY24 ($M) 83 The company defines EBITDA as net income (loss) excluding income tax benefit (expense), net interest expense, and depreciation and amortization expense. Adjusted EBITDA is EBITDA excluding the effects of the following items: share-based compensation, amortization of cloud-based software implementation costs, foreign exchange gain/loss net, miscellaneous net, equity in earnings of unconsolidated subsidiaries, restructuring and transformation expenses, refinancing related costs, non-routine expenses, and reorganization items, net as outlined in Note 1 of the Non-GAAP measures. Deferred financing fee amortization is included in interest expense; as a result, the company has excluded such fees from the depreciation and amortization caption. Depreciation and amortization expense was excluded from held for sale non-core business. Amortization of cloud-based software implementation represents amortization of capitalized implementation costs related to cloud-based software arrangements that are included in selling and administrative expenses but are not considered GAAP depreciation and amortization. Reorganization items, net includes all income, expenses, gains, or losses that are incurred or realized as a result of the restructuring proceedings. These are Non-GAAP financial measures used by management to enhance the understanding of our operating results. EBITDA and Adjusted EBITDA are key measures we use to evaluate our operational performance. We provide EBITDA and Adjusted EBITDA because we believe that investors and securities analysts will find EBITDA and Adjusted EBITDA to be useful measures for evaluating our operating performance and comparing our operating performance with that of similar companies that have different capital structures and for evaluating our ability to meet our future debt service, capital expenditures, and working capital requirements. However, EBITDA and Adjusted EBITDA should not be considered as alternatives to net income as a measure of operating results or as alternatives to cash flows from operating activities as a measure of liquidity in accordance with GAAP.
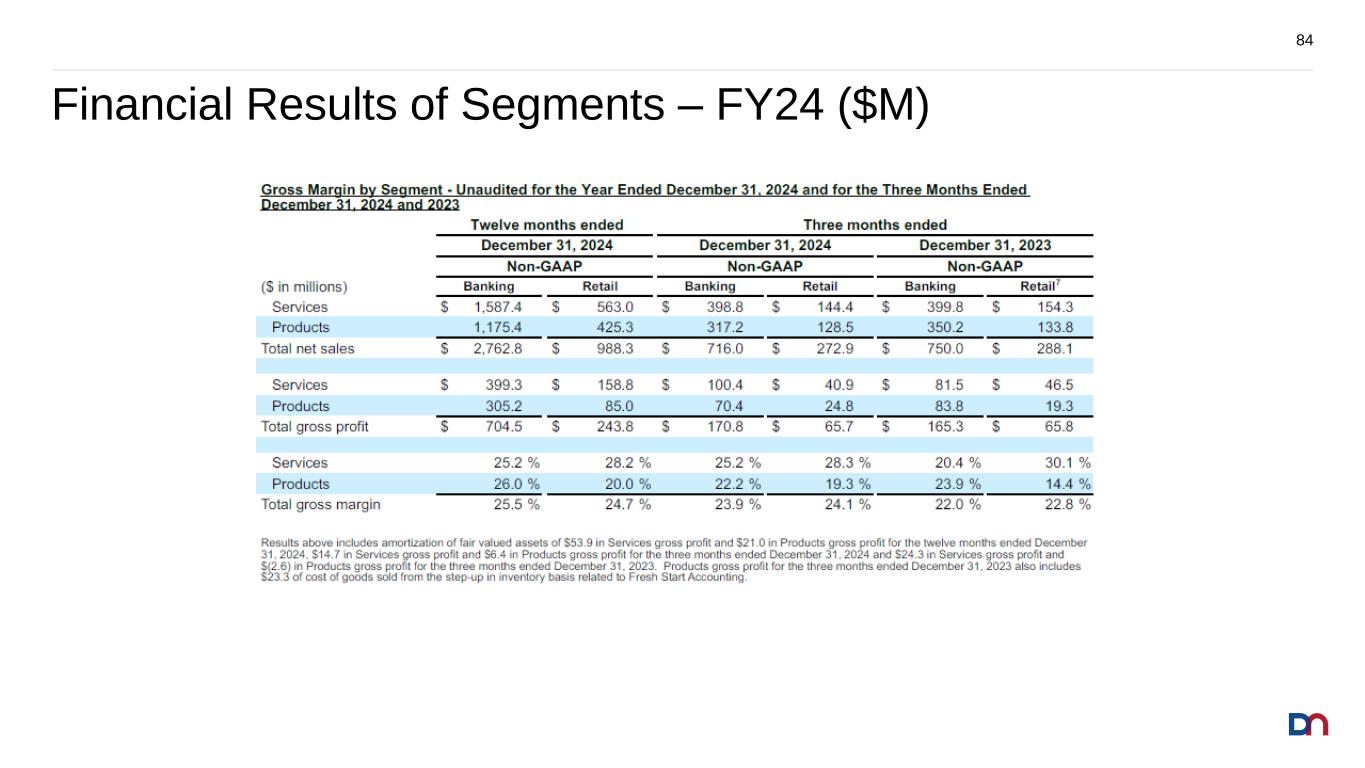
Financial Results of Segments – FY24 ($M) 84
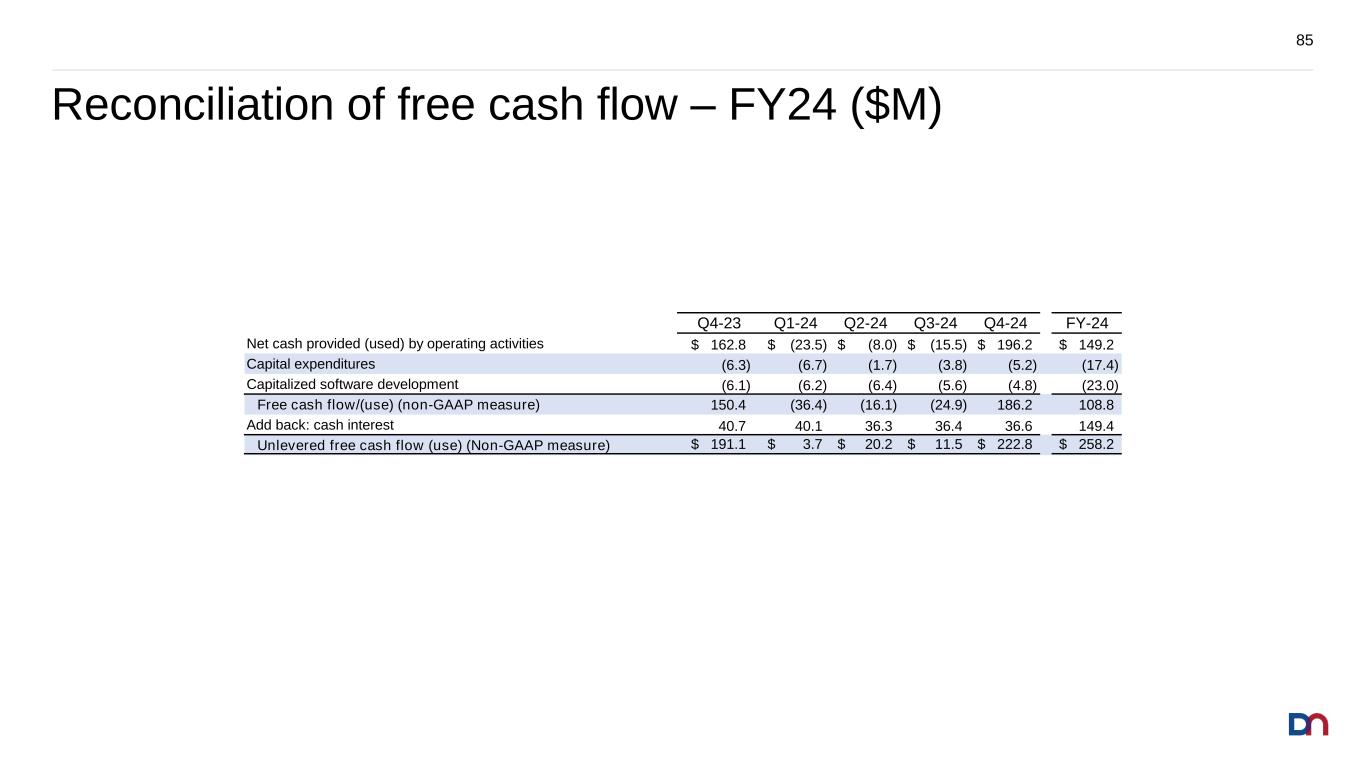
Reconciliation of free cash flow – FY24 ($M) 85 Q4-23 Q1-24 Q2-24 Q3-24 Q4-24 FY-24 Net cash provided (used) by operating activities 162.8$ (23.5)$ (8.0)$ (15.5)$ 196.2$ 149.2$ Capital expenditures (6.3) (6.7) (1.7) (3.8) (5.2) (17.4) Capitalized software development (6.1) (6.2) (6.4) (5.6) (4.8) (23.0) Free cash flow/(use) (non-GAAP measure) 150.4 (36.4) (16.1) (24.9) 186.2 108.8 Add back: cash interest 40.7 40.1 36.3 36.4 36.6 149.4 Unlevered free cash flow (use) (Non-GAAP measure) 191.1$ 3.7$ 20.2$ 11.5$ 222.8$ 258.2$
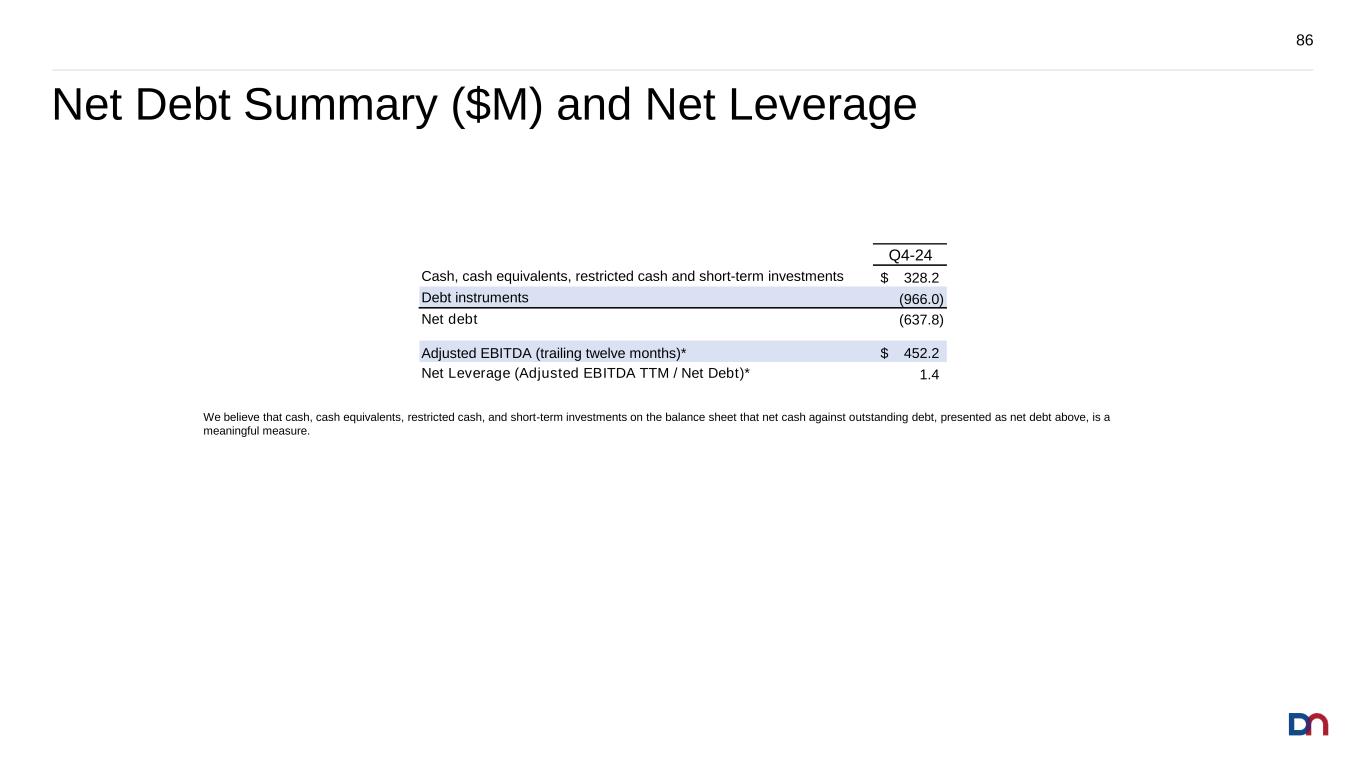
Net Debt Summary ($M) and Net Leverage 86 We believe that cash, cash equivalents, restricted cash, and short-term investments on the balance sheet that net cash against outstanding debt, presented as net debt above, is a meaningful measure. Q4-24 Cash, cash equivalents, restricted cash and short-term investments 328.2$ Debt instruments (966.0) Net debt (637.8) Adjusted EBITDA (trailing twelve months)* 452.2$ Net Leverage (Adjusted EBITDA TTM / Net Debt)* 1.4