| 1 February 10, 2026 ECOLAB Fourth Quarter 2025 Supplemental |
| Cautionary statement Forward-Looking Information This communication contains forward looking statements as that term is defined in the Private Securities Litigation Reform Act of 1995. These forward-looking statements include, but are not limited to, statements regarding macroeconomic conditions and our financial and business performance and prospects, including sales, earnings, special (gains) and charges, raw material costs, margins, pricing, currency translation, productivity, investments and new business. These statements are based on the current expectations of management. There are a number of risks and uncertainties that could cause actual results to differ materially from the forward-looking statements included in this communication. In particular, the ultimate results of any restructuring initiative depend on a number of factors, including the development of final plans, the impact of local regulatory requirements regarding employee terminations, the time necessary to develop and implement the restructuring initiatives and the level of success achieved through such actions in improving competitiveness, efficiency and effectiveness. Additional risks and uncertainties are set forth under Item 1A of our most recent Form 10-K, and our other public filings with the Securities and Exchange Commission (“SEC”), and include the impact of economic factors such as the worldwide economy, interest rates, foreign currency risk, reduced sales and earnings in our international operations resulting from the weakening of local currencies versus the U.S. dollar, demand uncertainty, supply chain challenges and inflation; the vitality of the markets we serve; exposure to global economic, political and legal risks related to our international operations, including international trade policies, geopolitical instability and the escalation of armed conflicts; our increasing reliance on artificial intelligence technologies in our products, services and operations; information technology infrastructure failures or breaches in data security; difficulty in procuring raw materials or fluctuations in raw material costs; our ability to successfully execute organizational change and management transitions; the occurrence of severe public health outbreaks not limited to COVID-19; our ability to acquire complementary businesses and to effectively integrate such businesses; our ability to execute key business initiatives; our ability to successfully compete with respect to value, innovation and customer support; the costs and effect of complying with laws and regulations; the occurrence of litigation or claims, including class action lawsuits; and other uncertainties or risks reported from time to time in our reports to the SEC. In light of these risks, uncertainties and factors, the forward-looking events discussed in this communication may not occur. We caution that undue reliance should not be placed on forward-looking statements, which speak only as of the date made. Ecolab does not undertake, and expressly disclaims, any duty to update any forward-looking statement, except as required by law. Non-GAAP Financial Information This communication includes Company information that does not conform to generally accepted accounting principles (GAAP). Management believes that a presentation of this information is meaningful to investors because it provides insight with respect to ongoing operating results of the Company and allows investors to better evaluate the financial results of the Company. These measures should not be viewed as an alternative to GAAP measures of performance. Furthermore, these measures may not be consistent with similar measures provided by other companies. Reconciliations of our non-GAAP measures included within this presentation are included in the “Non-GAAP Financial Measures” section of this presentation. |
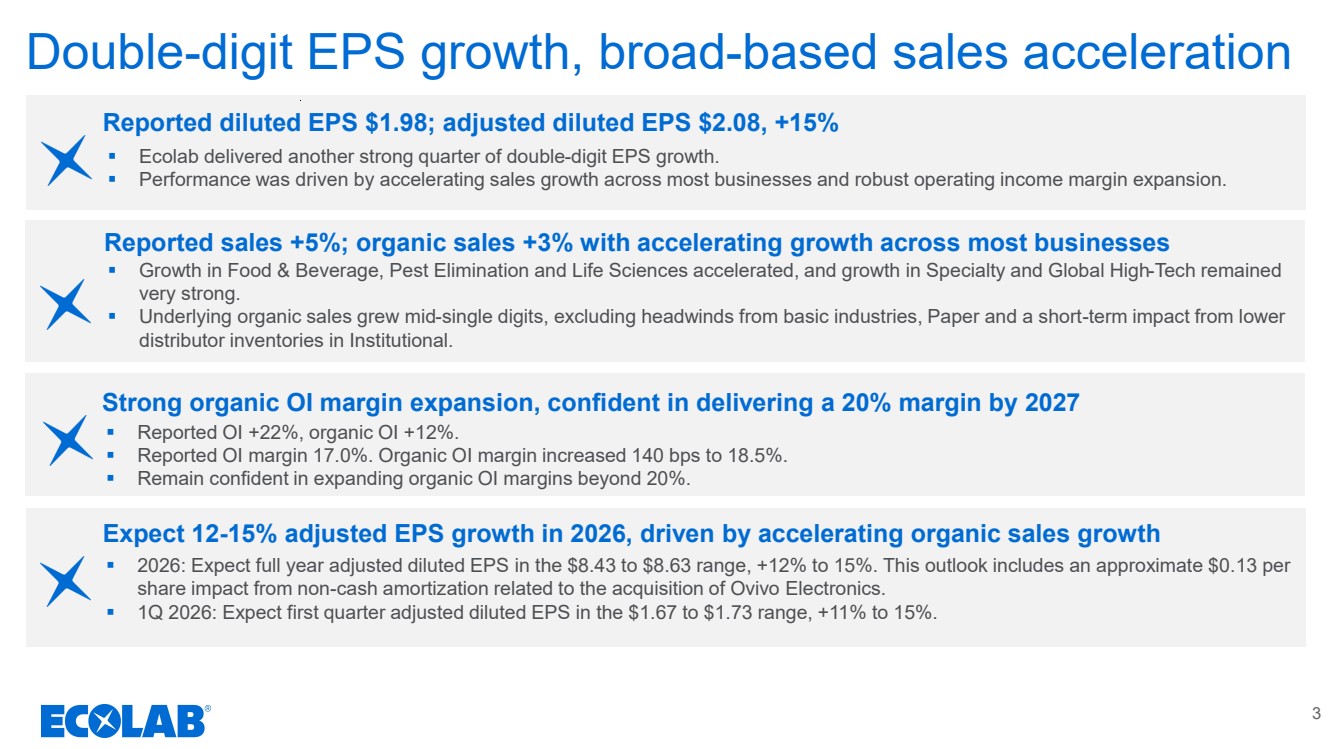
| Double-digit EPS growth, broad-based sales acceleration 3 Reported sales +5%; organic sales +3% with accelerating growth across most businesses Strong organic OI margin expansion, confident in delivering a 20% margin by 2027 Reported diluted EPS $1.98; adjusted diluted EPS $2.08, +15% Expect 12-15% adjusted EPS growth in 2026, driven by accelerating organic sales growth ▪ Growth in Food & Beverage, Pest Elimination and Life Sciences accelerated, and growth in Specialty and Global High-Tech remained very strong. ▪ Underlying organic sales grew mid-single digits, excluding headwinds from basic industries, Paper and a short-term impact from lower distributor inventories in Institutional. ▪ Reported OI +22%, organic OI +12%. ▪ Reported OI margin 17.0%. Organic OI margin increased 140 bps to 18.5%. ▪ Remain confident in expanding organic OI margins beyond 20%. ▪ Ecolab delivered another strong quarter of double-digit EPS growth. ▪ Performance was driven by accelerating sales growth across most businesses and robust operating income margin expansion. ▪ 2026: Expect full year adjusted diluted EPS in the $8.43 to $8.63 range, +12% to 15%. This outlook includes an approximate $0.13 per share impact from non-cash amortization related to the acquisition of Ovivo Electronics. ▪ 1Q 2026: Expect first quarter adjusted diluted EPS in the $1.67 to $1.73 range, +11% to 15%. |
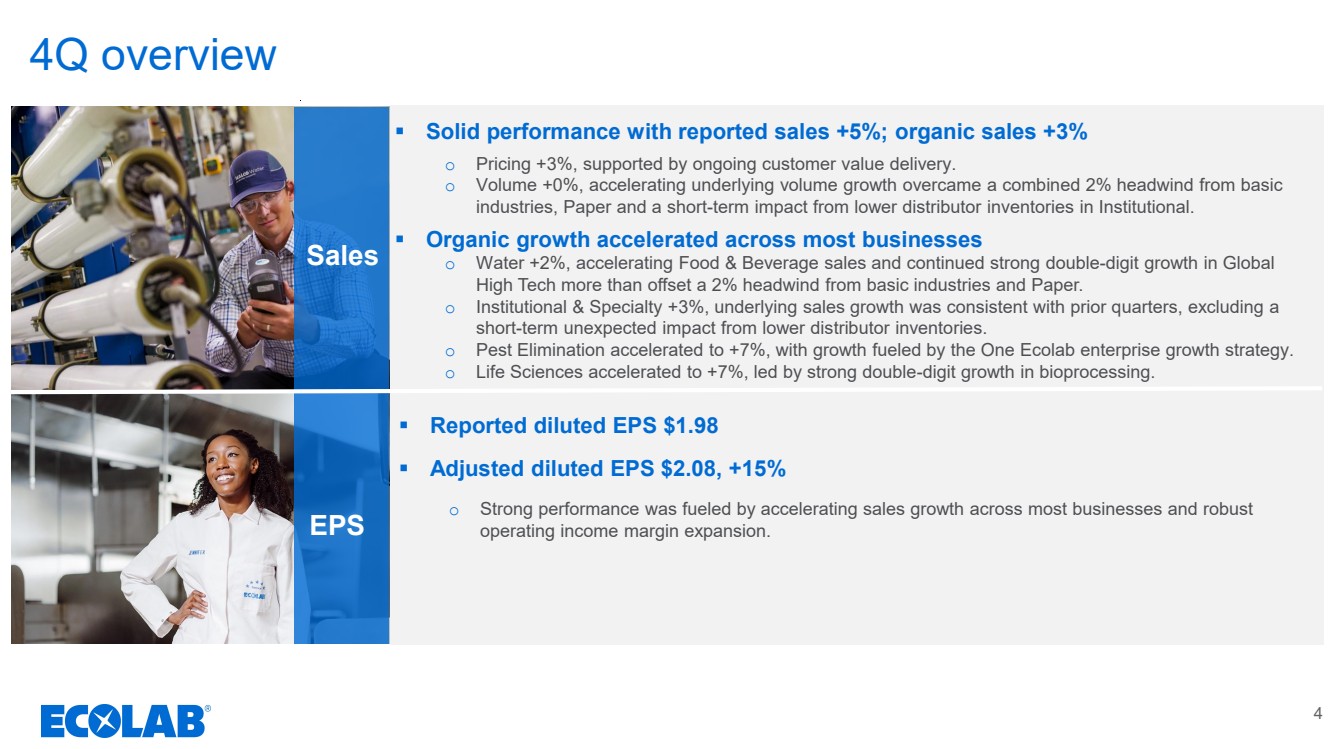
| 4Q overview ▪ Solid performance with reported sales +5%; organic sales +3% o Pricing +3%, supported by ongoing customer value delivery. o Volume +0%, accelerating underlying volume growth overcame a combined 2% headwind from basic industries, Paper and a short-term impact from lower distributor inventories in Institutional. ▪ Organic growth accelerated across most businesses o Water +2%, accelerating Food & Beverage sales and continued strong double-digit growth in Global High Tech more than offset a 2% headwind from basic industries and Paper. o Institutional & Specialty +3%, underlying sales growth was consistent with prior quarters, excluding a short-term unexpected impact from lower distributor inventories. o Pest Elimination accelerated to +7%, with growth fueled by the One Ecolab enterprise growth strategy. o Life Sciences accelerated to +7%, led by strong double-digit growth in bioprocessing. ▪ Reported diluted EPS $1.98 ▪ Adjusted diluted EPS $2.08, +15% o Strong performance was fueled by accelerating sales growth across most businesses and robust operating income margin expansion. Sales EPS 4 |
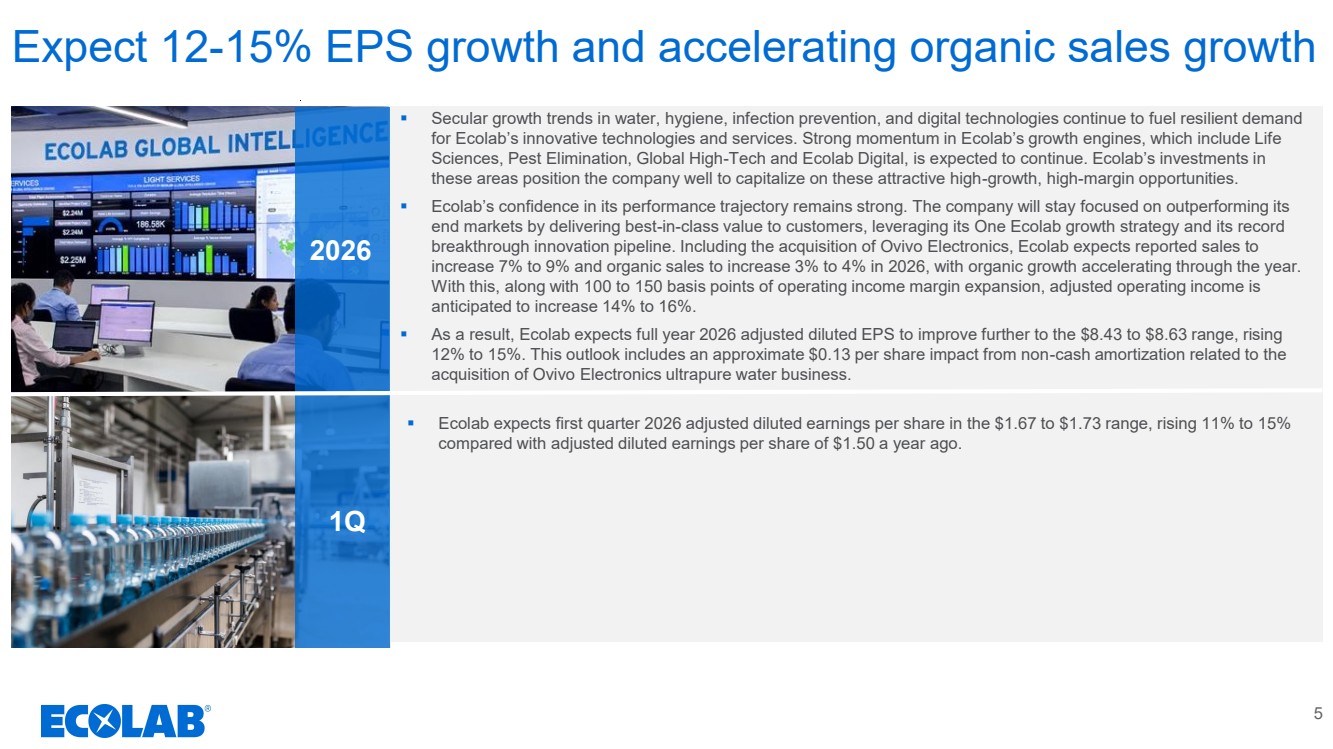
| Expect 12-15% EPS growth and accelerating organic sales growth 1Q 2026 ▪ Ecolab expects first quarter 2026 adjusted diluted earnings per share in the $1.67 to $1.73 range, rising 11% to 15% compared with adjusted diluted earnings per share of $1.50 a year ago. ▪ Secular growth trends in water, hygiene, infection prevention, and digital technologies continue to fuel resilient demand for Ecolab’s innovative technologies and services. Strong momentum in Ecolab’s growth engines, which include Life Sciences, Pest Elimination, Global High-Tech and Ecolab Digital, is expected to continue. Ecolab’s investments in these areas position the company well to capitalize on these attractive high-growth, high-margin opportunities. ▪ Ecolab’s confidence in its performance trajectory remains strong. The company will stay focused on outperforming its end markets by delivering best-in-class value to customers, leveraging its One Ecolab growth strategy and its record breakthrough innovation pipeline. Including the acquisition of Ovivo Electronics, Ecolab expects reported sales to increase 7% to 9% and organic sales to increase 3% to 4% in 2026, with organic growth accelerating through the year. With this, along with 100 to 150 basis points of operating income margin expansion, adjusted operating income is anticipated to increase 14% to 16%. ▪ As a result, Ecolab expects full year 2026 adjusted diluted EPS to improve further to the $8.43 to $8.63 range, rising 12% to 15%. This outlook includes an approximate $0.13 per share impact from non-cash amortization related to the acquisition of Ovivo Electronics ultrapure water business. 5 |
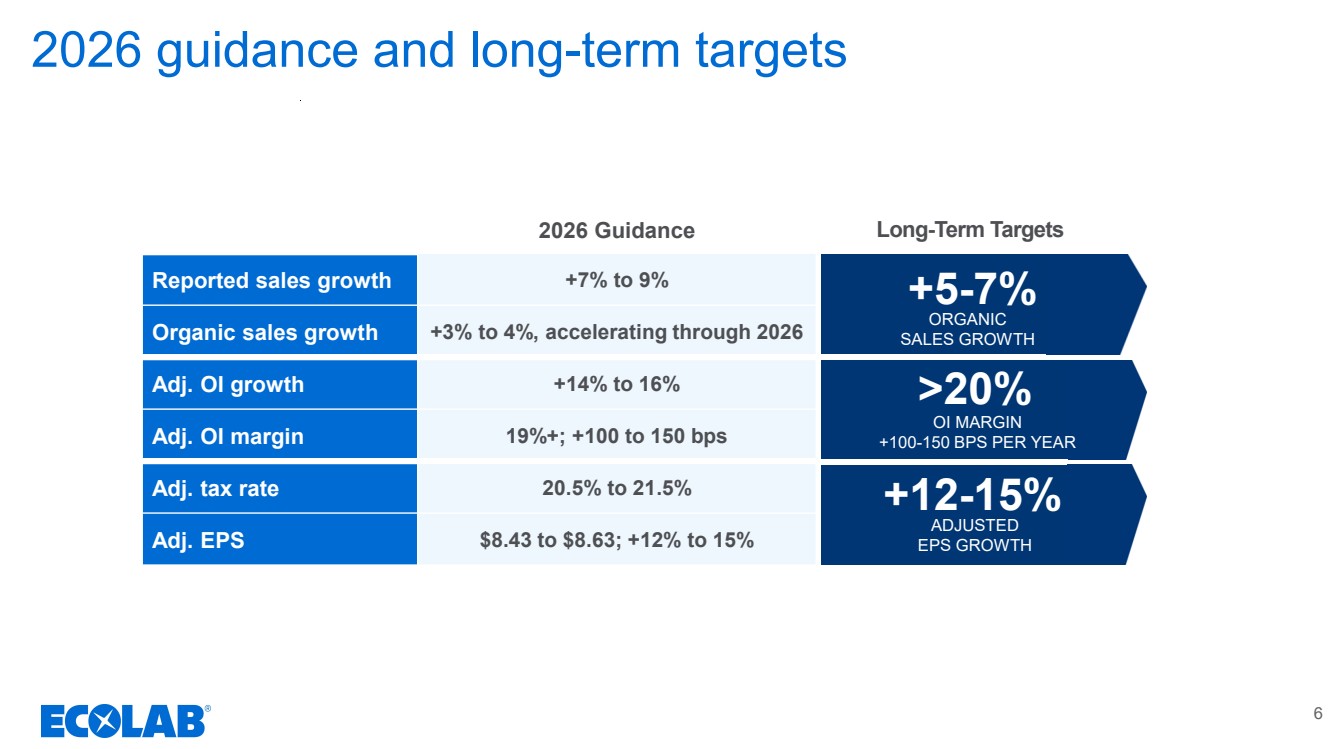
| 2026 guidance and long-term targets 6 2026 Guidance Reported sales growth +7% to 9% Organic sales growth +3% to 4%, accelerating through 2026 Adj. OI growth +14% to 16% Adj. OI margin 19%+; +100 to 150 bps Adj. tax rate 20.5% to 21.5% Adj. EPS $8.43 to $8.63; +12% to 15% ORGANIC SALES GROWTH +5-7% OI MARGIN +100-150 BPS PER YEAR Long-Term Targets >20% ADJUSTED EPS GROWTH +12-15% |
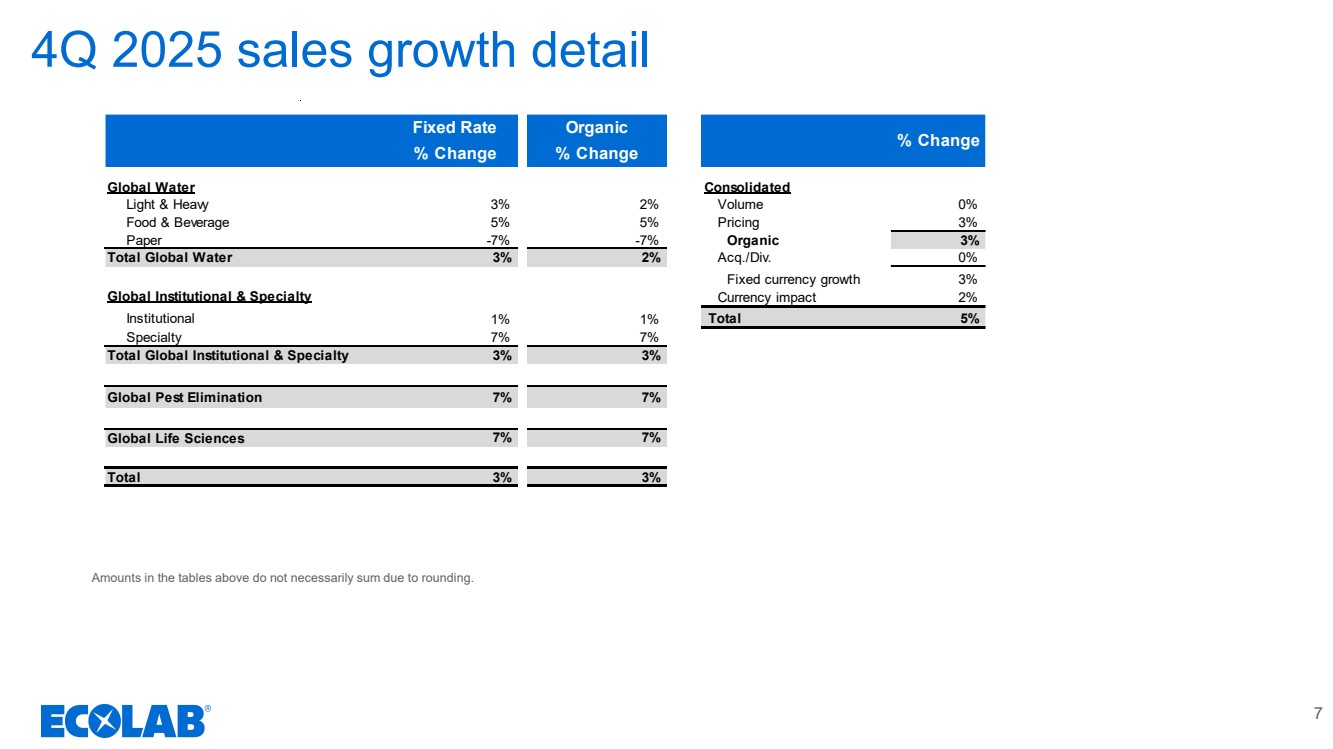
| 4Q 2025 sales growth detail 7 Amounts in the tables above do not necessarily sum due to rounding. Fixed Rate Organic % Change % Change Global Water Consolidated Light & Heavy 3% 2% Volume 0% Food & Beverage 5% 5% Pricing 3% Paper -7% -7% Organic 3% Total Global Water 3% 2% Acq./Div. 0% Fixed currency growth 3% Global Institutional & Specialty Currency impact 2% Institutional 1% 1% Total 5% Specialty 7% 7% Total Global Institutional & Specialty 3% 3% Global Pest Elimination 7% 7% Global Life Sciences 7% 7% Total 3% 3% % Change |
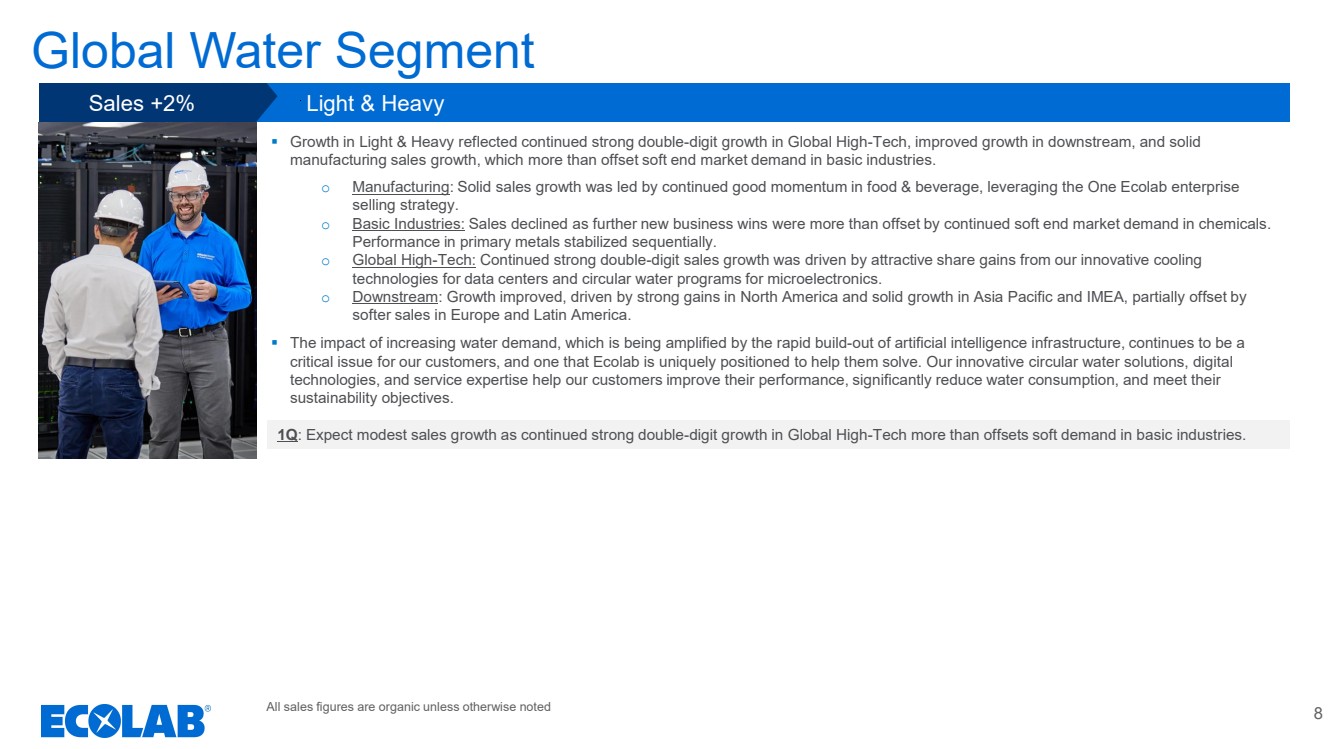
| 8 Sales +2% Light & Heavy All sales figures are organic unless otherwise noted Global Water Segment 1Q: Expect modest sales growth as continued strong double-digit growth in Global High-Tech more than offsets soft demand in basic industries. ▪ Growth in Light & Heavy reflected continued strong double-digit growth in Global High-Tech, improved growth in downstream, and solid manufacturing sales growth, which more than offset soft end market demand in basic industries. o Manufacturing: Solid sales growth was led by continued good momentum in food & beverage, leveraging the One Ecolab enterprise selling strategy. o Basic Industries: Sales declined as further new business wins were more than offset by continued soft end market demand in chemicals. Performance in primary metals stabilized sequentially. o Global High-Tech: Continued strong double-digit sales growth was driven by attractive share gains from our innovative cooling technologies for data centers and circular water programs for microelectronics. o Downstream: Growth improved, driven by strong gains in North America and solid growth in Asia Pacific and IMEA, partially offset by softer sales in Europe and Latin America. ▪ The impact of increasing water demand, which is being amplified by the rapid build-out of artificial intelligence infrastructure, continues to be a critical issue for our customers, and one that Ecolab is uniquely positioned to help them solve. Our innovative circular water solutions, digital technologies, and service expertise help our customers improve their performance, significantly reduce water consumption, and meet their sustainability objectives. |
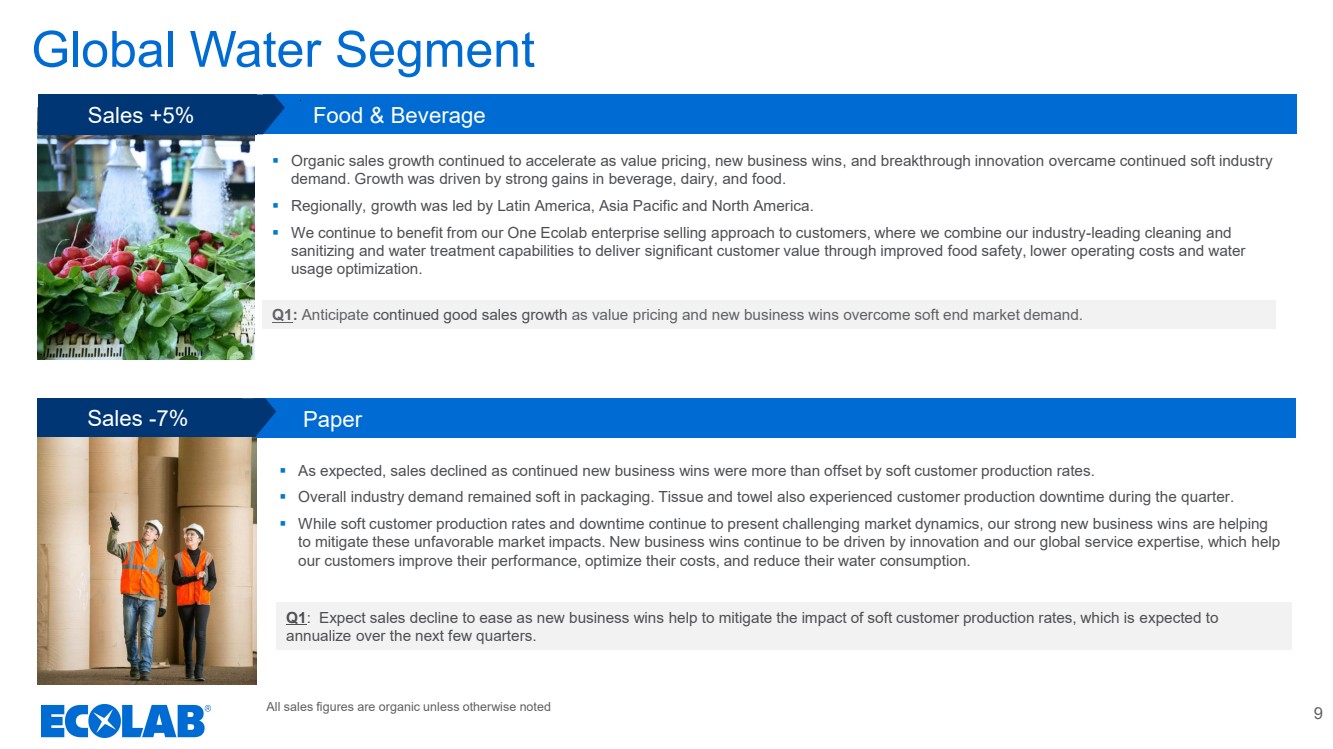
| 9 Sales -7% Paper All sales figures are organic unless otherwise noted Global Water Segment Sales +5% Food & Beverage Q1: Anticipate continued good sales growth as value pricing and new business wins overcome soft end market demand. ▪ Organic sales growth continued to accelerate as value pricing, new business wins, and breakthrough innovation overcame continued soft industry demand. Growth was driven by strong gains in beverage, dairy, and food. ▪ Regionally, growth was led by Latin America, Asia Pacific and North America. ▪ We continue to benefit from our One Ecolab enterprise selling approach to customers, where we combine our industry-leading cleaning and sanitizing and water treatment capabilities to deliver significant customer value through improved food safety, lower operating costs and water usage optimization. Q1: Expect sales decline to ease as new business wins help to mitigate the impact of soft customer production rates, which is expected to annualize over the next few quarters. ▪ As expected, sales declined as continued new business wins were more than offset by soft customer production rates. ▪ Overall industry demand remained soft in packaging. Tissue and towel also experienced customer production downtime during the quarter. ▪ While soft customer production rates and downtime continue to present challenging market dynamics, our strong new business wins are helping to mitigate these unfavorable market impacts. New business wins continue to be driven by innovation and our global service expertise, which help our customers improve their performance, optimize their costs, and reduce their water consumption. |
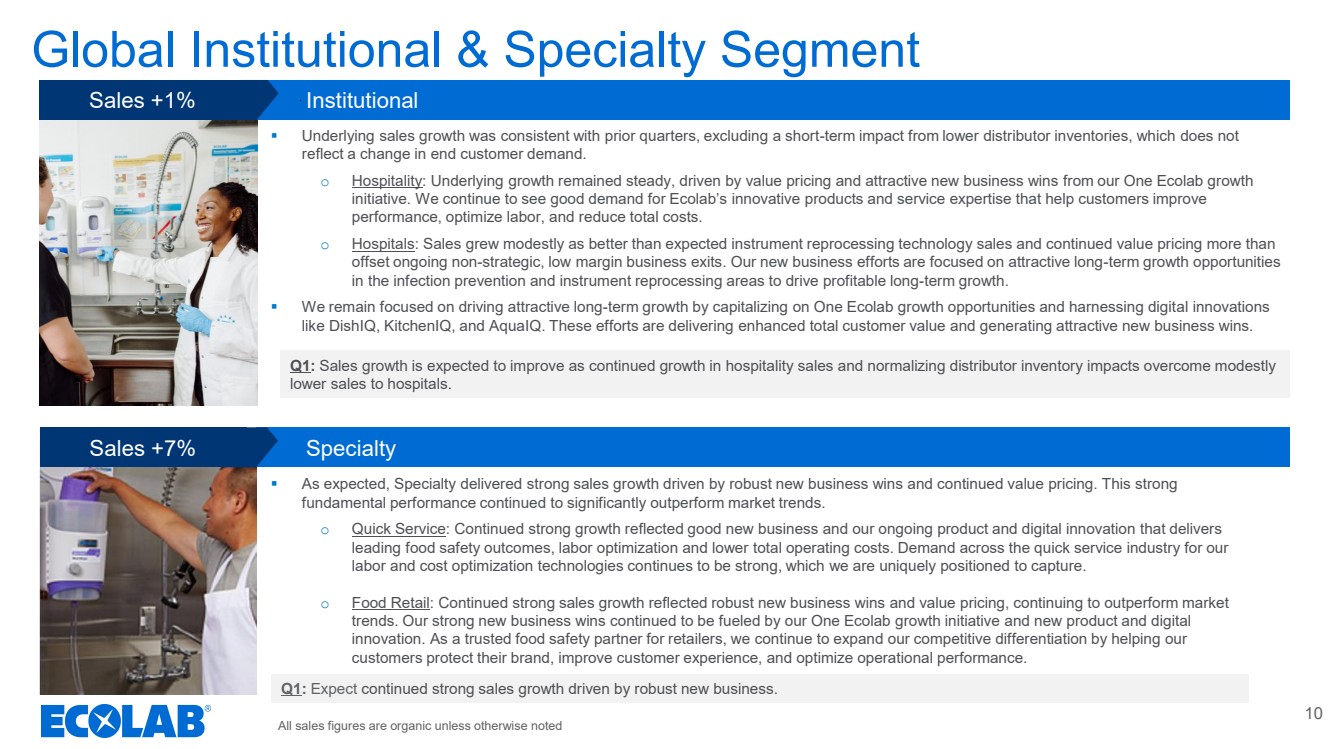
| 10 Sales +1% Institutional Sales +7% Specialty All sales figures are organic unless otherwise noted Global Institutional & Specialty Segment ▪ Underlying sales growth was consistent with prior quarters, excluding a short-term impact from lower distributor inventories, which does not reflect a change in end customer demand. o Hospitality: Underlying growth remained steady, driven by value pricing and attractive new business wins from our One Ecolab growth initiative. We continue to see good demand for Ecolab’s innovative products and service expertise that help customers improve performance, optimize labor, and reduce total costs. o Hospitals: Sales grew modestly as better than expected instrument reprocessing technology sales and continued value pricing more than offset ongoing non-strategic, low margin business exits. Our new business efforts are focused on attractive long-term growth opportunities in the infection prevention and instrument reprocessing areas to drive profitable long-term growth. ▪ We remain focused on driving attractive long-term growth by capitalizing on One Ecolab growth opportunities and harnessing digital innovations like DishIQ, KitchenIQ, and AquaIQ. These efforts are delivering enhanced total customer value and generating attractive new business wins. Q1: Sales growth is expected to improve as continued growth in hospitality sales and normalizing distributor inventory impacts overcome modestly lower sales to hospitals. Q1: Expect continued strong sales growth driven by robust new business. ▪ As expected, Specialty delivered strong sales growth driven by robust new business wins and continued value pricing. This strong fundamental performance continued to significantly outperform market trends. o Quick Service: Continued strong growth reflected good new business and our ongoing product and digital innovation that delivers leading food safety outcomes, labor optimization and lower total operating costs. Demand across the quick service industry for our labor and cost optimization technologies continues to be strong, which we are uniquely positioned to capture. o Food Retail: Continued strong sales growth reflected robust new business wins and value pricing, continuing to outperform market trends. Our strong new business wins continued to be fueled by our One Ecolab growth initiative and new product and digital innovation. As a trusted food safety partner for retailers, we continue to expand our competitive differentiation by helping our customers protect their brand, improve customer experience, and optimize operational performance. |
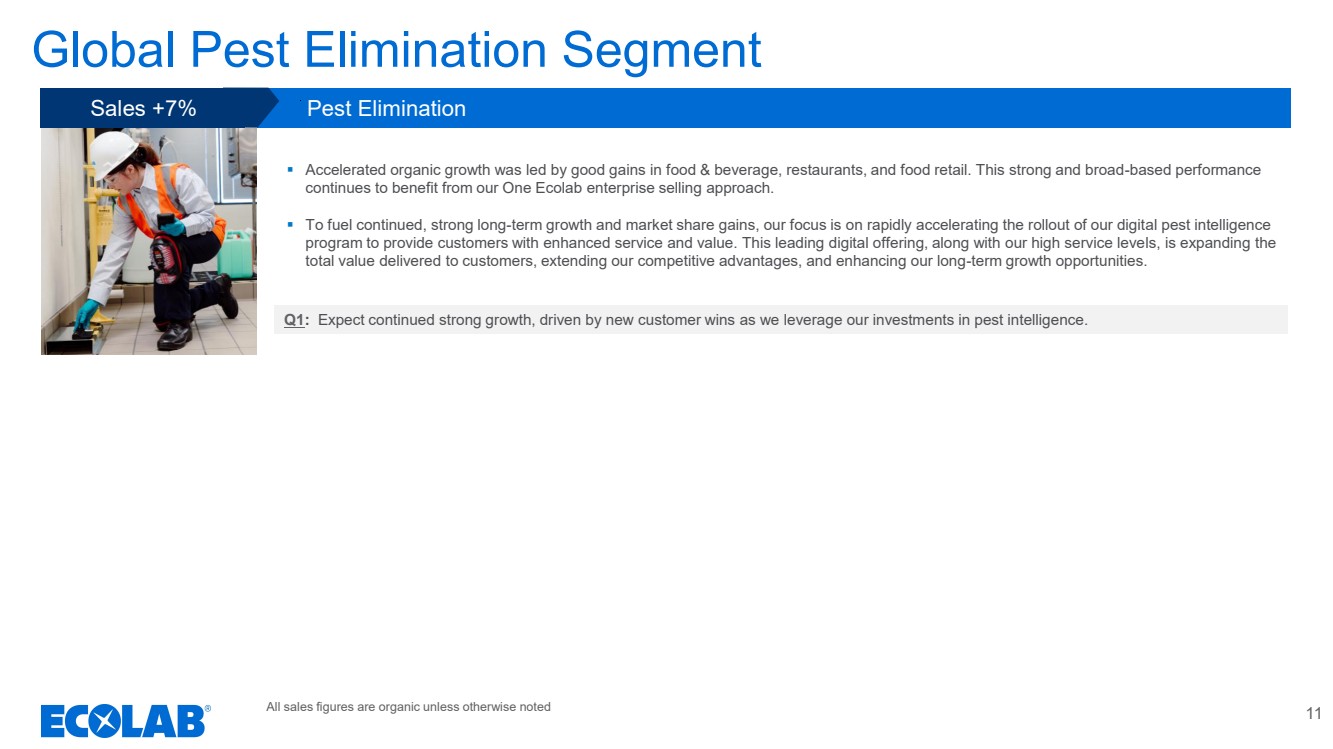
| 11 Sales +7% Pest Elimination All sales figures are organic unless otherwise noted Global Pest Elimination Segment ▪ Accelerated organic growth was led by good gains in food & beverage, restaurants, and food retail. This strong and broad-based performance continues to benefit from our One Ecolab enterprise selling approach. ▪ To fuel continued, strong long-term growth and market share gains, our focus is on rapidly accelerating the rollout of our digital pest intelligence program to provide customers with enhanced service and value. This leading digital offering, along with our high service levels, is expanding the total value delivered to customers, extending our competitive advantages, and enhancing our long-term growth opportunities. Q1: Expect continued strong growth, driven by new customer wins as we leverage our investments in pest intelligence. |
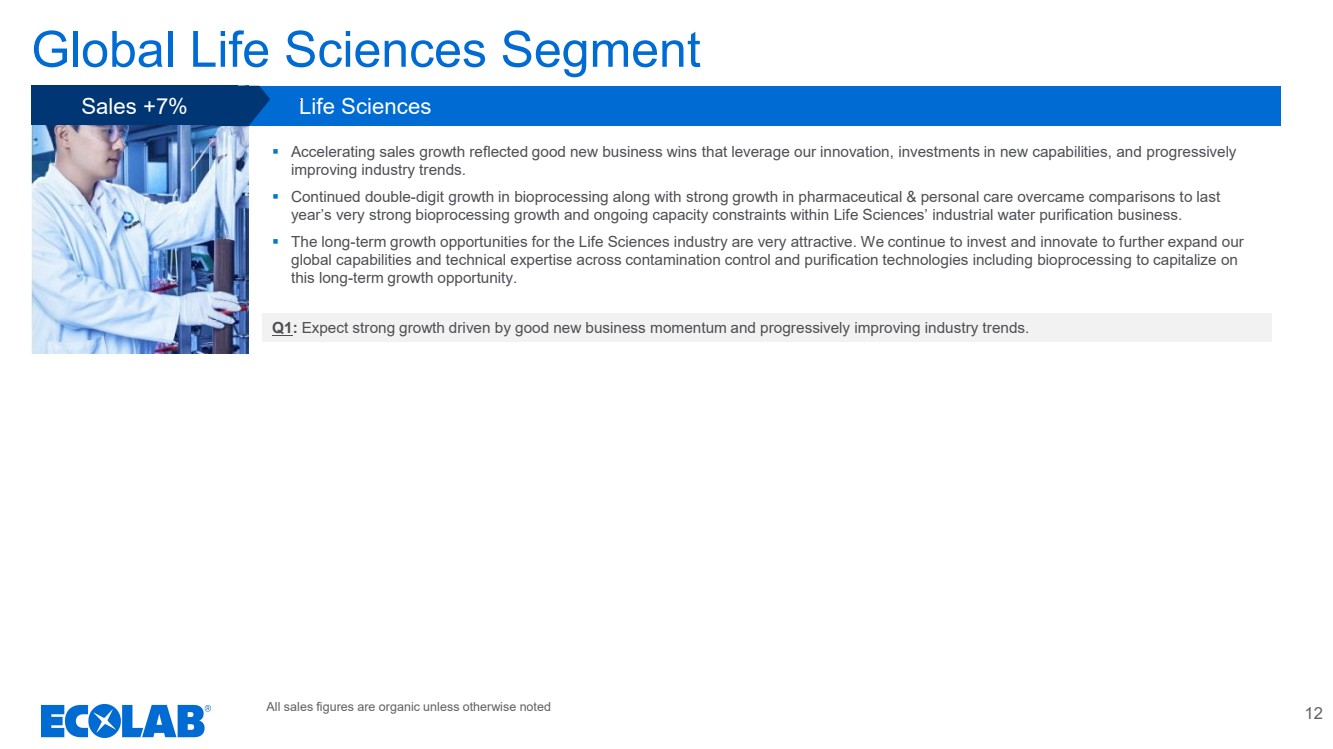
| 12 Sales +7% Life Sciences All sales figures are organic unless otherwise noted Global Life Sciences Segment Q1: Expect strong growth driven by good new business momentum and progressively improving industry trends. ▪ Accelerating sales growth reflected good new business wins that leverage our innovation, investments in new capabilities, and progressively improving industry trends. ▪ Continued double-digit growth in bioprocessing along with strong growth in pharmaceutical & personal care overcame comparisons to last year’s very strong bioprocessing growth and ongoing capacity constraints within Life Sciences’ industrial water purification business. ▪ The long-term growth opportunities for the Life Sciences industry are very attractive. We continue to invest and innovate to further expand our global capabilities and technical expertise across contamination control and purification technologies including bioprocessing to capitalize on this long-term growth opportunity. |
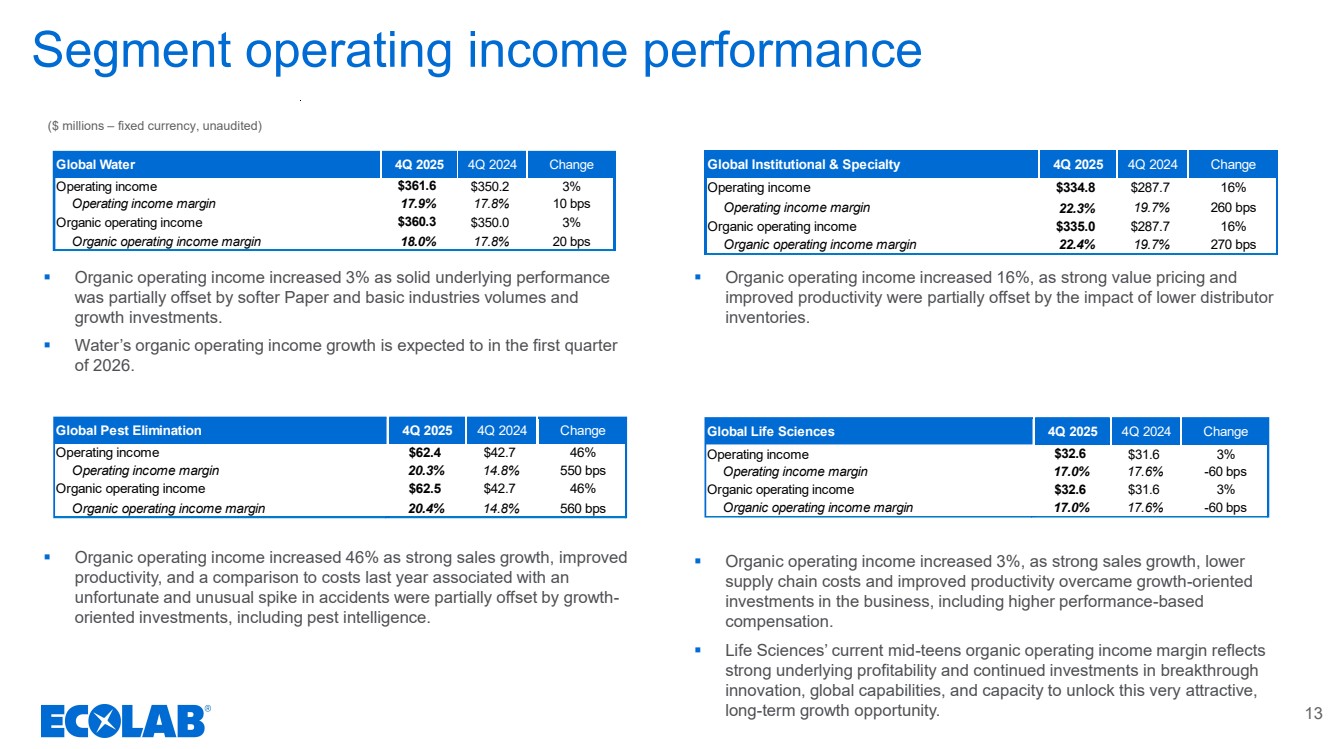
| Segment operating income performance ▪ Organic operating income increased 3% as solid underlying performance was partially offset by softer Paper and basic industries volumes and growth investments. ▪ Water’s organic operating income growth is expected to in the first quarter of 2026. ▪ Organic operating income increased 46% as strong sales growth, improved productivity, and a comparison to costs last year associated with an unfortunate and unusual spike in accidents were partially offset by growth-oriented investments, including pest intelligence. ($ millions – fixed currency, unaudited) 13 Global Water 4Q 2025 4Q 2024 Change Operating income $361.6 $350.2 3% Operating income margin 17.9% 17.8% 10 bps Organic operating income $360.3 $350.0 3% Organic operating income margin 18.0% 17.8% 20 bps Global Institutional & Specialty 4Q 2025 4Q 2024 Change Operating income $334.8 $287.7 16% Operating income margin 22.3% 19.7% 260 bps Organic operating income $335.0 $287.7 16% Organic operating income margin 22.4% 19.7% 270 bps Global Life Sciences 4Q 2025 4Q 2024 Change Operating income $32.6 $31.6 3% Operating income margin 17.0% 17.6% -60 bps Organic operating income $32.6 $31.6 3% Organic operating income margin 17.0% 17.6% -60 bps Global Pest Elimination 4Q 2025 4Q 2024 Change Operating income $62.4 $42.7 46% Operating income margin 20.3% 14.8% 550 bps Organic operating income $62.5 $42.7 46% Organic operating income margin 20.4% 14.8% 560 bps ▪ Organic operating income increased 3%, as strong sales growth, lower supply chain costs and improved productivity overcame growth-oriented investments in the business, including higher performance-based compensation. ▪ Life Sciences’ current mid-teens organic operating income margin reflects strong underlying profitability and continued investments in breakthrough innovation, global capabilities, and capacity to unlock this very attractive, long-term growth opportunity. ▪ Organic operating income increased 16%, as strong value pricing and improved productivity were partially offset by the impact of lower distributor inventories. |
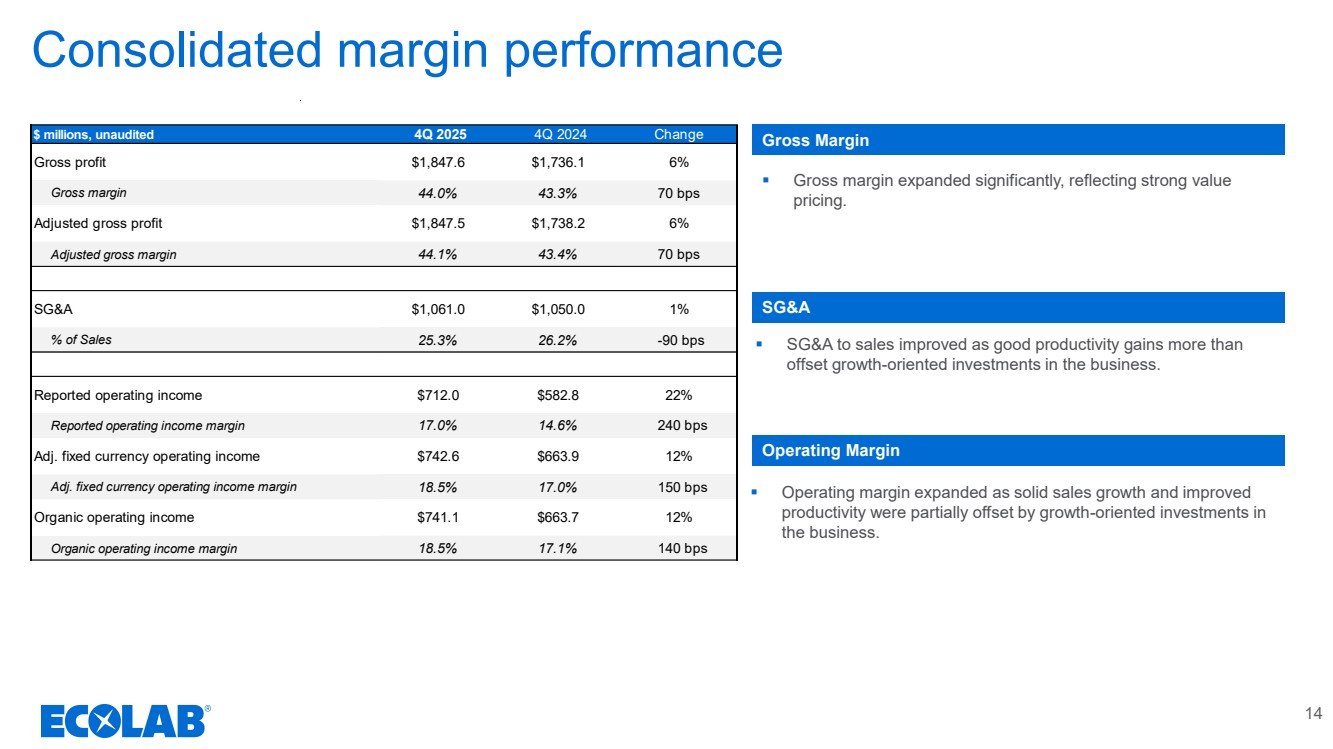
| Consolidated margin performance ▪ Gross margin expanded significantly, reflecting strong value pricing. ▪ SG&A to sales improved as good productivity gains more than offset growth-oriented investments in the business. ▪ Operating margin expanded as solid sales growth and improved productivity were partially offset by growth-oriented investments in the business. Gross Margin SG&A Operating Margin 14 $ millions, unaudited 4Q 2025 4Q 2024 Change Gross profit $1,847.6 $1,736.1 6% Gross margin 44.0% 43.3% 70 bps Adjusted gross profit $1,847.5 $1,738.2 6% Adjusted gross margin 44.1% 43.4% 70 bps SG&A $1,061.0 $1,050.0 1% % of Sales 25.3% 26.2% -90 bps Reported operating income $712.0 $582.8 22% Reported operating income margin 17.0% 14.6% 240 bps Adj. fixed currency operating income $742.6 $663.9 12% Adj. fixed currency operating income margin 18.5% 17.0% 150 bps Organic operating income $741.1 $663.7 12% Organic operating income margin 18.5% 17.1% 140 bps |
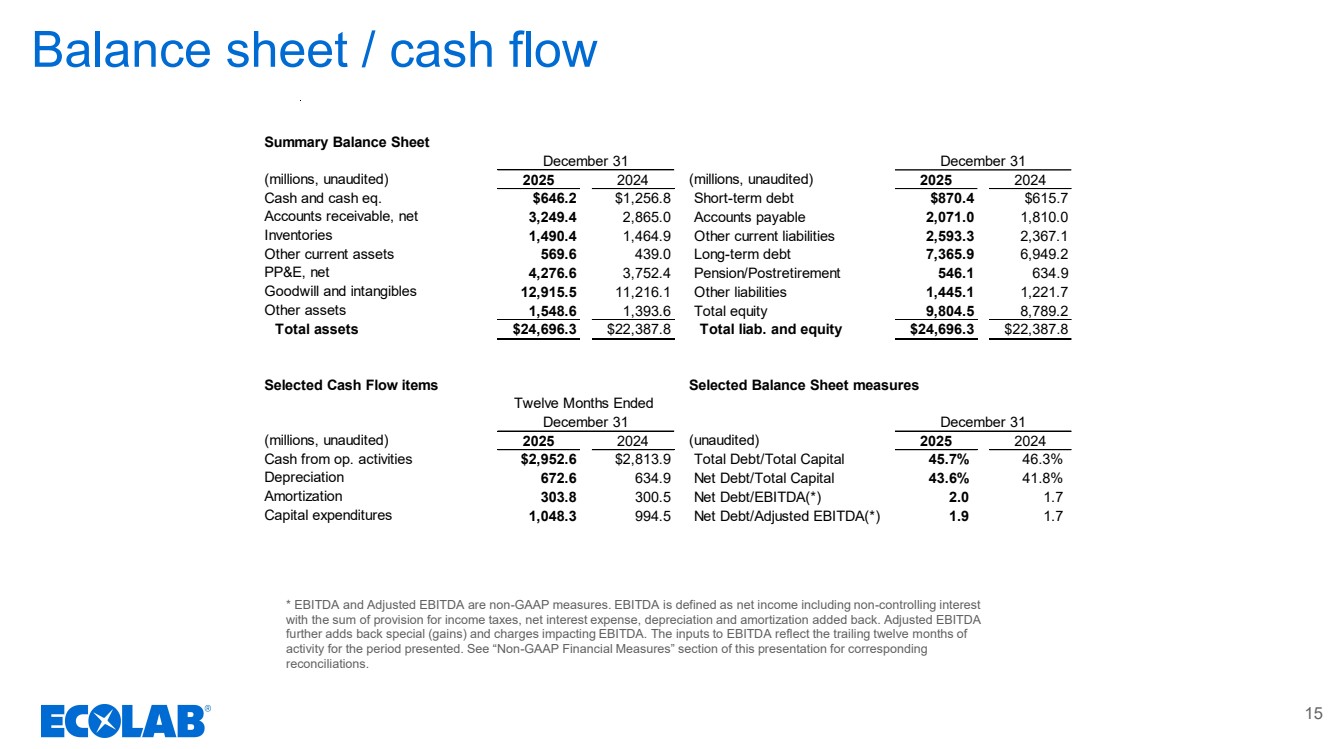
| Balance sheet / cash flow * EBITDA and Adjusted EBITDA are non-GAAP measures. EBITDA is defined as net income including non-controlling interest with the sum of provision for income taxes, net interest expense, depreciation and amortization added back. Adjusted EBITDA further adds back special (gains) and charges impacting EBITDA. The inputs to EBITDA reflect the trailing twelve months of activity for the period presented. See “Non-GAAP Financial Measures” section of this presentation for corresponding reconciliations. 15 Summary Balance Sheet (millions, unaudited) 2025 2024 (millions, unaudited) 2025 2024 Cash and cash eq. $646.2 $1,256.8 Short-term debt $870.4 $615.7 Accounts receivable, net 3,249.4 2,865.0 Accounts payable 2,071.0 1,810.0 Inventories 1,490.4 1,464.9 Other current liabilities 2,593.3 2,367.1 Other current assets 569.6 439.0 Long-term debt 7,365.9 6,949.2 PP&E, net 4,276.6 3,752.4 Pension/Postretirement 546.1 634.9 Goodwill and intangibles 12,915.5 11,216.1 Other liabilities 1,445.1 1,221.7 Other assets 1,548.6 1,393.6 Total equity 9,804.5 8,789.2 Total assets $24,696.3 $22,387.8 Total liab. and equity $24,696.3 $22,387.8 Selected Cash Flow items (millions, unaudited) 2025 2024 (unaudited) 2025 2024 Cash from op. activities $2,952.6 $2,813.9 Total Debt/Total Capital 45.7% 46.3% Depreciation 672.6 634.9 Net Debt/Total Capital 43.6% 41.8% Amortization 303.8 300.5 Net Debt/EBITDA(*) 2.0 1.7 Capital expenditures 1,048.3 994.5 Net Debt/Adjusted EBITDA(*) 1.9 1.7 December 31 December 31 Twelve Months Ended Selected Balance Sheet measures December 31 December 31 |
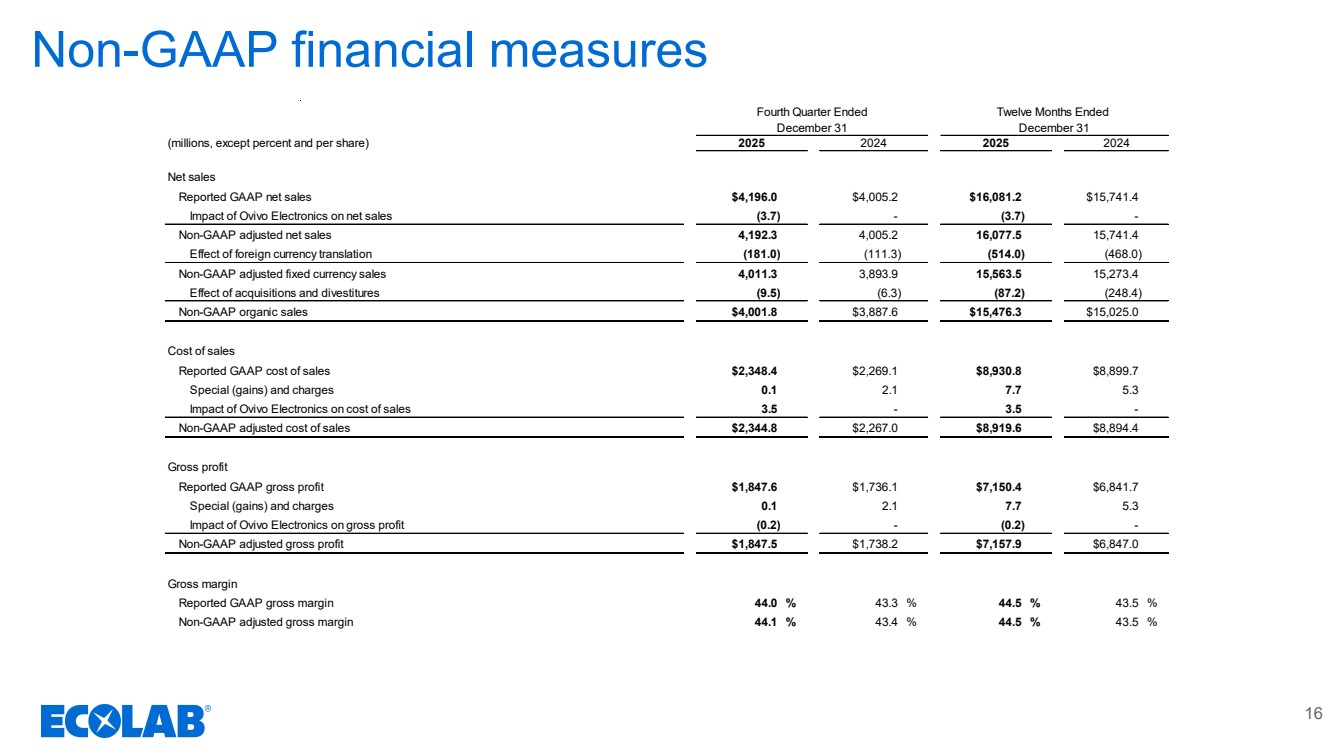
| Non-GAAP financial measures 16 (millions, except percent and per share) Net sales Reported GAAP net sales $4,196.0 $4,005.2 $16,081.2 $15,741.4 Impact of Ovivo Electronics on net sales (3.7) - (3.7) - Non-GAAP adjusted net sales 4,192.3 4,005.2 16,077.5 15,741.4 Effect of foreign currency translation (181.0) (111.3) (514.0) (468.0) Non-GAAP adjusted fixed currency sales 4,011.3 3,893.9 15,563.5 15,273.4 Effect of acquisitions and divestitures (9.5) (6.3) (87.2) (248.4) Non-GAAP organic sales $4,001.8 $3,887.6 $15,476.3 $15,025.0 Cost of sales Reported GAAP cost of sales $2,348.4 $2,269.1 $8,930.8 $8,899.7 Special (gains) and charges 0.1 2.1 7.7 5.3 Impact of Ovivo Electronics on cost of sales 3.5 - 3.5 - Non-GAAP adjusted cost of sales $2,344.8 $2,267.0 $8,919.6 $8,894.4 Gross profit Reported GAAP gross profit $1,847.6 $1,736.1 $7,150.4 $6,841.7 Special (gains) and charges 0.1 2.1 7.7 5.3 Impact of Ovivo Electronics on gross profit (0.2) - (0.2) - Non-GAAP adjusted gross profit $1,847.5 $1,738.2 $7,157.9 $6,847.0 Gross margin Reported GAAP gross margin 44.0 % 43.3 % 44.5 % 43.5 % Non-GAAP adjusted gross margin 44.1 % 43.4 % 44.5 % 43.5 % Fourth Quarter Ended Twelve Months Ended December 31 December 31 2025 2024 2025 2024 |
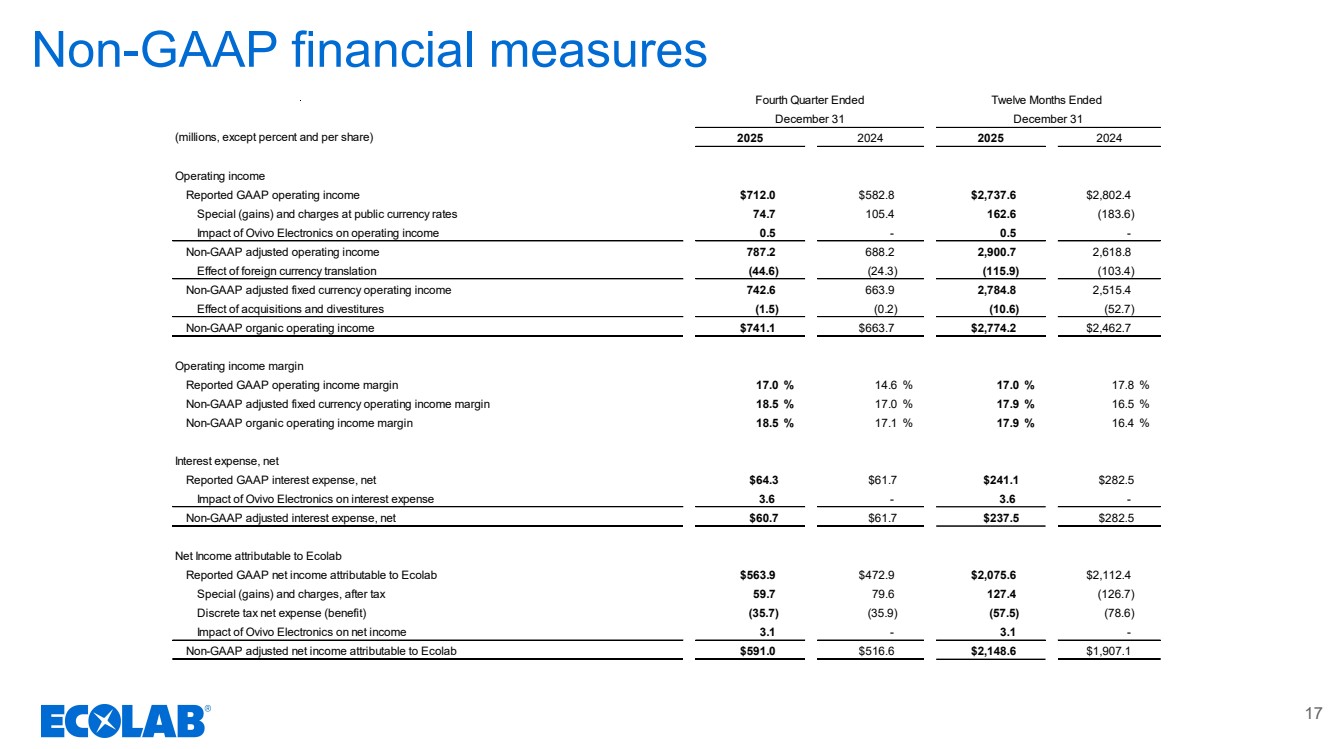
| Non-GAAP financial measures 17 (millions, except percent and per share) Operating income Reported GAAP operating income $712.0 $582.8 $2,737.6 $2,802.4 Special (gains) and charges at public currency rates 74.7 105.4 162.6 (183.6) Impact of Ovivo Electronics on operating income 0.5 - 0.5 - Non-GAAP adjusted operating income 787.2 688.2 2,900.7 2,618.8 Effect of foreign currency translation (44.6) (24.3) (115.9) (103.4) Non-GAAP adjusted fixed currency operating income 742.6 663.9 2,784.8 2,515.4 Effect of acquisitions and divestitures (1.5) (0.2) (10.6) (52.7) Non-GAAP organic operating income $741.1 $663.7 $2,774.2 $2,462.7 Operating income margin Reported GAAP operating income margin 17.0 % 14.6 % 17.0 % 17.8 % Non-GAAP adjusted fixed currency operating income margin 18.5 % 17.0 % 17.9 % 16.5 % Non-GAAP organic operating income margin 18.5 % 17.1 % 17.9 % 16.4 % Interest expense, net Reported GAAP interest expense, net $64.3 $61.7 $241.1 $282.5 Impact of Ovivo Electronics on interest expense 3.6 - 3.6 - Non-GAAP adjusted interest expense, net $60.7 $61.7 $237.5 $282.5 Net Income attributable to Ecolab Reported GAAP net income attributable to Ecolab $563.9 $472.9 $2,075.6 $2,112.4 Special (gains) and charges, after tax 59.7 79.6 127.4 (126.7) Discrete tax net expense (benefit) (35.7) (35.9) (57.5) (78.6) Impact of Ovivo Electronics on net income 3.1 - 3.1 - Non-GAAP adjusted net income attributable to Ecolab $591.0 $516.6 $2,148.6 $1,907.1 Twelve Months Ended December 31 December 31 2025 2024 Fourth Quarter Ended 2025 2024 |
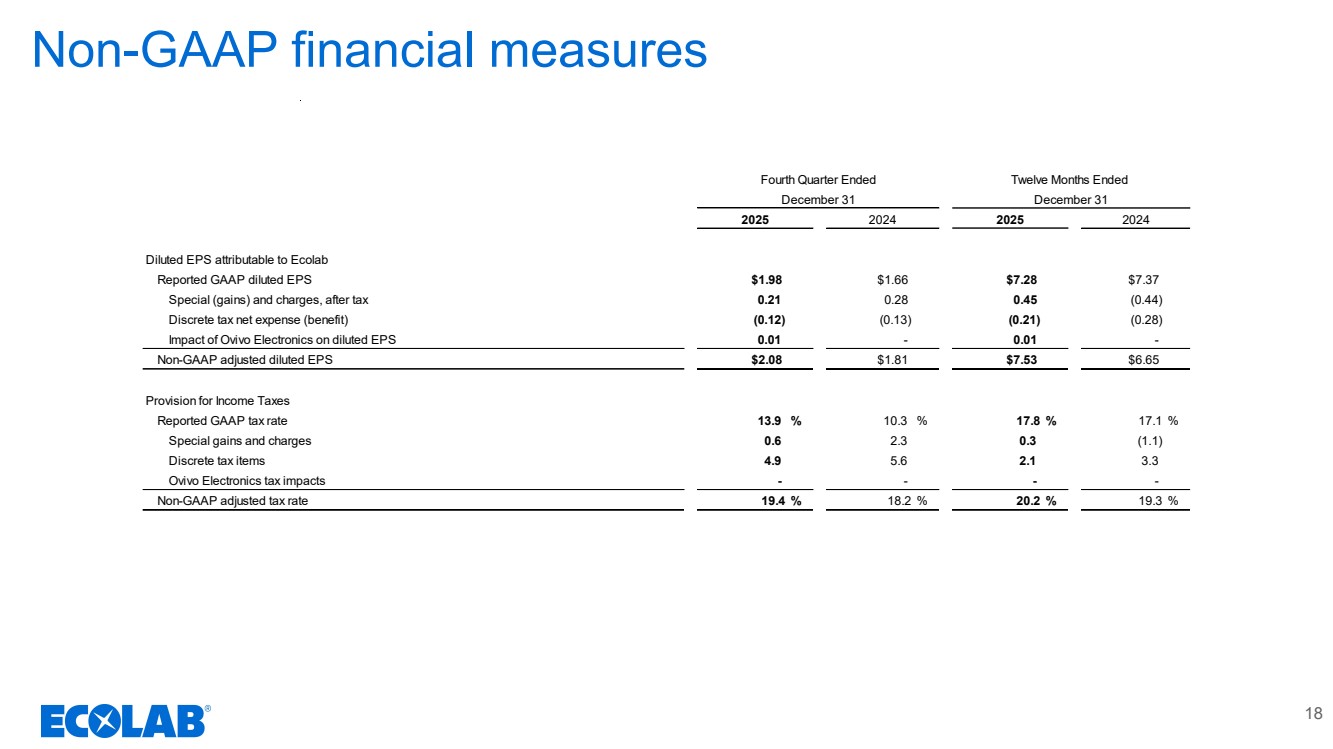
| Non-GAAP financial measures 18 Diluted EPS attributable to Ecolab Reported GAAP diluted EPS $1.98 $1.66 $7.28 $7.37 Special (gains) and charges, after tax 0.21 0.28 0.45 (0.44) Discrete tax net expense (benefit) (0.12) (0.13) (0.21) (0.28) Impact of Ovivo Electronics on diluted EPS 0.01 - 0.01 - Non-GAAP adjusted diluted EPS $2.08 $1.81 $7.53 $6.65 Provision for Income Taxes Reported GAAP tax rate 13.9 % 10.3 % 17.8 % 17.1 % Special gains and charges 0.6 2.3 0.3 (1.1) Discrete tax items 4.9 5.6 2.1 3.3 Ovivo Electronics tax impacts - - - - Non-GAAP adjusted tax rate 19.4 % 18.2 % 20.2 % 19.3 % 2025 2024 2025 2024 Fourth Quarter Ended Twelve Months Ended December 31 December 31 |
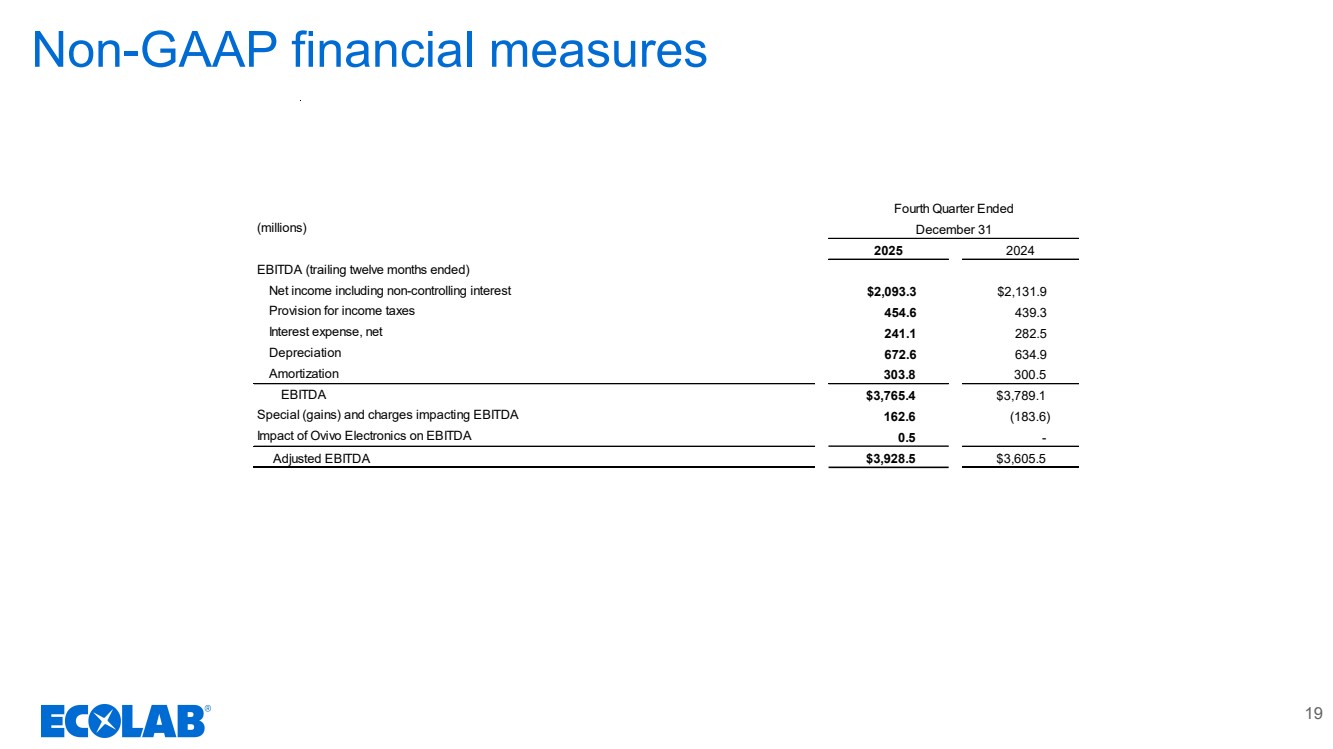
| Non-GAAP financial measures 19 (millions) EBITDA (trailing twelve months ended) Net income including non-controlling interest $2,093.3 $2,131.9 Provision for income taxes 454.6 439.3 Interest expense, net 241.1 282.5 Depreciation 672.6 634.9 Amortization 303.8 300.5 EBITDA $3,765.4 $3,789.1 Special (gains) and charges impacting EBITDA 162.6 (183.6) Impact of Ovivo Electronics on EBITDA 0.5 - Adjusted EBITDA $3,928.5 $3,605.5 Fourth Quarter Ended December 31 2025 2024 |
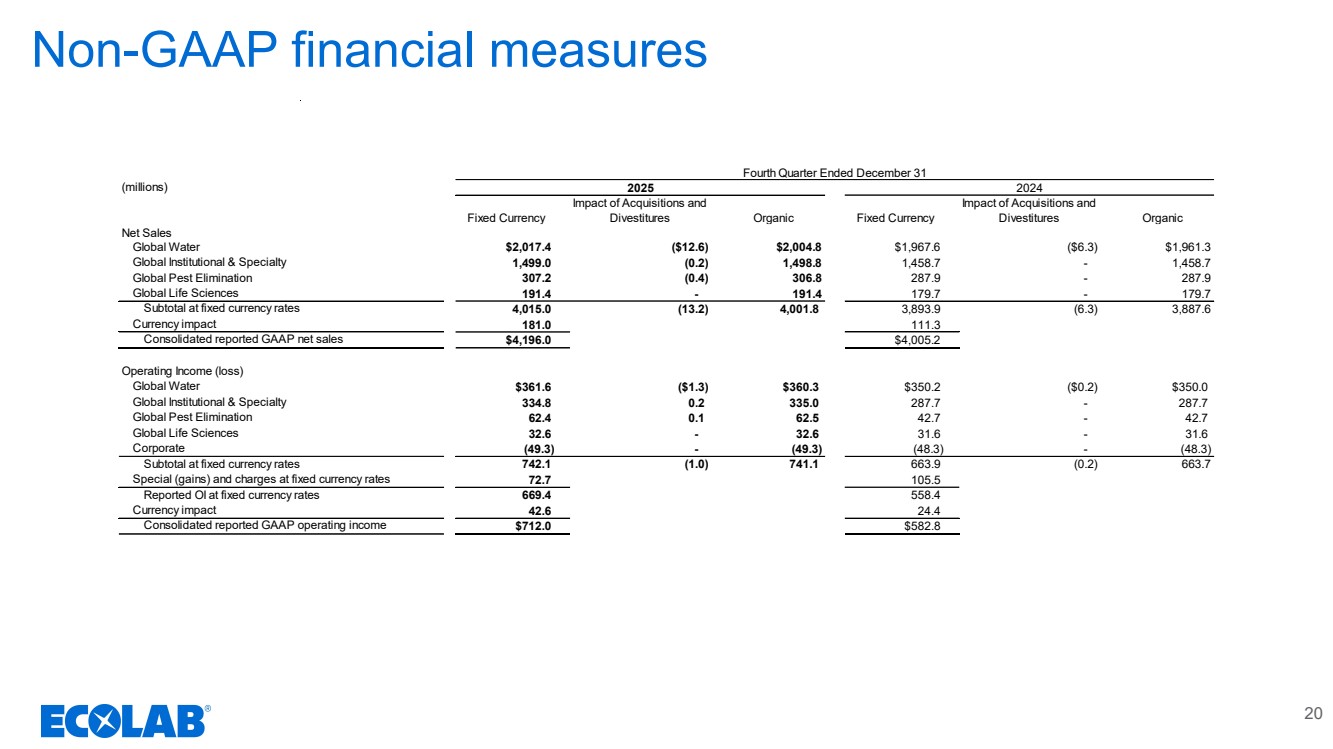
| Non-GAAP financial measures 20 (millions) Fixed Currency Impact of Acquisitions and Divestitures Organic Fixed Currency Impact of Acquisitions and Divestitures Organic Net Sales Global Water $2,017.4 ($12.6) $2,004.8 $1,967.6 ($6.3) $1,961.3 Global Institutional & Specialty 1,499.0 (0.2) 1,498.8 1,458.7 - 1,458.7 Global Pest Elimination 307.2 (0.4) 306.8 287.9 - 287.9 Global Life Sciences 191.4 - 191.4 179.7 - 179.7 Subtotal at fixed currency rates 4,015.0 (13.2) 4,001.8 3,893.9 (6.3) 3,887.6 Currency impact 181.0 111.3 Consolidated reported GAAP net sales $4,196.0 $4,005.2 Operating Income (loss) Global Water $361.6 ($1.3) $360.3 $350.2 ($0.2) $350.0 Global Institutional & Specialty 334.8 0.2 335.0 287.7 - 287.7 Global Pest Elimination 62.4 0.1 62.5 42.7 - 42.7 Global Life Sciences 32.6 - 32.6 31.6 - 31.6 Corporate (49.3) - (49.3) (48.3) - (48.3) Subtotal at fixed currency rates 742.1 (1.0) 741.1 663.9 (0.2) 663.7 Special (gains) and charges at fixed currency rates 72.7 105.5 Reported OI at fixed currency rates 669.4 558.4 Currency impact 42.6 24.4 Consolidated reported GAAP operating income $712.0 $582.8 Fourth Quarter Ended December 31 2025 2024 |
| 21 Non-GAAP Financial Information: This communication and certain of the accompanying tables include financial measures that have not been calculated in accordance with accounting principles generally accepted in the U.S. (“GAAP”). These non-GAAP financial measures may include: • adjusted net sales • adjusted fixed currency sales • organic sales • adjusted cost of sales • adjusted gross profit • adjusted gross margin • fixed currency operating income • fixed currency operating income margin • adjusted operating income • adjusted fixed currency operating income • adjusted fixed currency operating income margin • organic operating income • organic operating income margin • adjusted tax rate • adjusted interest expense, net • adjusted net income attributable to Ecolab • adjusted diluted earnings per share • EBITDA • Adjusted EBITDA We provide these measures as additional information regarding our operating results. We use these non-GAAP measures internally to evaluate our performance and in making financial and operational decisions, including with respect to incentive compensation. We believe that our presentation of these measures provides investors with greater transparency with respect to our results of operations and that these measures are useful for period-to-period comparison of results. Non-GAAP financial information |
| 22 Non-GAAP Financial Information (Continued): Our non-GAAP financial measures for adjusted net sales and adjusted interest expense, net exclude the impact of the Ovivo Electronics acquisition. Our non-GAAP financial measures for adjusted cost of sales, adjusted gross margin, adjusted gross profit and adjusted operating income exclude the impact of special (gains) and charges and the Ovivo Electronics acquisition, and our non-GAAP financial measures for adjusted tax rate, adjusted net income attributable to Ecolab and adjusted diluted earnings per share further exclude the impact of discrete tax items. We include items within special (gains) and charges and discrete tax items that we believe can significantly affect the period-over-period assessment of operating results and not necessarily reflect costs and/or income associated with historical trends and future results. After tax special (gains) and charges are derived by applying the applicable local jurisdictional tax rate to the corresponding pre-tax special (gains) and charges. EBITDA is defined as net income including non-controlling interest with the sum of provision for income taxes, net interest expense, depreciation and amortization added back. Adjusted EBITDA further adds back special (gains) and charges impacting EBITDA. EBITDA and adjusted EBITDA are used in our net debt to EBITDA and net debt to adjusted EBITDA ratios, which we view as important indicators of the operational and financial health of our organization. We evaluate the performance of our international operations based on fixed currency rates of foreign exchange, which eliminate the translation impact of exchange rate fluctuations on our international results. Fixed currency amounts included in this presentation are based on translation into U.S. dollars at the fixed foreign currency exchange rates established by management at the beginning of 2025. We also provide our segment results based on public currency rates for informational purposes. Our reportable segments do not include the impact of intangible asset amortization from the Nalco and Purolite transactions or the impact of special (gains) and charges as these are not allocated to the Company’s reportable segments. Our non-GAAP financial measures for organic sales, organic operating income and organic operating income margin are at fixed currency and exclude the impact of special (gains) and charges where applicable, the impact of the Ovivo Electronics acquisition, the results of our acquired businesses from the first twelve months post acquisition and the results of divested businesses from the twelve months prior to divestiture. Further, due to the sale of the global surgical solutions business on August 1, 2024, we have excluded the results of the business for the nine-month period ended September 30, 2024 from these organic measures to remain comparable to the corresponding periods in 2025. In addition, as part of the separation of ChampionX in 2020, we continue to provide certain products to ChampionX, which are recorded in product and equipment sales in the Global Water segment along with the related cost of sales. These transactions are removed from the consolidated results as part of the calculation of the impact of acquisitions and divestitures. These non-GAAP financial measures are not in accordance with, or an alternative to, GAAP and may be different from non-GAAP measures used by other companies. Investors should not rely on any single financial measure when evaluating our business. We recommend that investors view these measures in conjunction with the GAAP measures included in this presentation. Reconciliations of our non-GAAP measures are included in the following “Non-GAAP Financial Measures” tables of this communication. We do not provide reconciliations for non-GAAP estimates on a forward-looking basis (including those contained in this presentation) when we are unable to provide a meaningful or accurate calculation or estimation of reconciling items and the information is not available without unreasonable effort. This is due to the inherent difficulty of forecasting the timing and amount of various items that have not yet occurred, are out of our control and/or cannot be reasonably predicted, and that would impact reported earnings per share and the reported tax rate, the most directly comparable forward-looking GAAP financial measures to adjusted earnings per share and the adjusted tax rate. For the same reasons, we are unable to address the probable significance of the unavailable information. Non-GAAP financial information (cont.) |