☑QUARTERLY REPORT PURSUANT TO SECTION 13 OR 15(d) OF
THE SECURITIES EXCHANGE ACT OF 1934
For the quarterly period ended June 30, 2025
or
☐TRANSITION REPORT PURSUANT TO SECTION 13 OR 15(d) OF
THE SECURITIES EXCHANGE ACT OF 1934
For the transition period from __________to__________
Commission File Number 1-2256
Exxon Mobil Corporation
(Exact name of registrant as specified in its charter)
New Jersey
13-5409005
(State or other jurisdiction of incorporation or organization)
(I.R.S. Employer Identification Number)
22777 Springwoods Village Parkway,Spring,Texas77389-1425
(Address of principal executive offices) (Zip Code)
(972)940-6000
(Registrant's telephone number, including area code)
_______________________
Securities registered pursuant to Section 12(b) of the Act:
Title of Each Class
Trading Symbol
Name of Each Exchange on Which Registered
Common Stock, without par value
XOM
New York Stock Exchange
0.524% Notes due 2028
XOM28
New York Stock Exchange
0.835% Notes due 2032
XOM32
New York Stock Exchange
1.408% Notes due 2039
XOM39A
New York Stock Exchange
Indicate by check mark whether the registrant (1) has filed all reports required to be filed by Section 13 or 15(d) of the Securities Exchange Act of 1934 during the preceding 12 months (or for such shorter period that the registrant was required to file such reports), and (2) has been subject to such filing requirements for the past 90 days.Yes ☑No ☐
Indicate by check mark whether the registrant has submitted electronically every Interactive Data File required to be submitted and posted pursuant to Rule 405 of Regulation S-T (§ 232.405 of this chapter) during the preceding 12 months (or for such shorter period that the registrant was required to submit and post such files).Yes ☑No ☐
Indicate by check mark whether the registrant is a large accelerated filer, an accelerated filer, a non-accelerated filer, smaller reporting company, or an emerging growth company. See the definitions of "large accelerated filer," "accelerated filer," "smaller reporting company," and “emerging growth company” in Rule 12b-2 of the Exchange Act.
Large accelerated filer
☑
Accelerated filer
☐
Non-accelerated filer
☐
Smaller reporting company
☐
Emerging growth company
☐
If an emerging growth company, indicate by check mark if the registrant has elected not to use the extended transition period for complying with any new or revised financial accounting standards provided pursuant to Section 13(a) of the Exchange Act.☐
Indicate by check mark whether the registrant is a shell company (as defined in Rule 12b-2 of the Exchange Act). Yes☐No ☑
Indicate the number of shares outstanding of each of the issuer's classes of common stock, as of the latest practicable date.
Class
Outstanding as of June 30, 2025
Common stock, without par value
4,263,247,021
EXXON MOBIL CORPORATION
FORM 10-Q
FOR THE QUARTERLY PERIOD ENDED JUNE 30, 2025
TABLE OF CONTENTS
PART I. FINANCIAL INFORMATION
Item 1. Financial Statements
Condensed Consolidated Statement of Income - Three and six months ended June 30, 2025 and 2024
Non-service pension and postretirement benefit expense
90
34
203
57
Interest expense
145
271
350
492
Other taxes and duties
6,257
6,579
12,292
12,902
Total costs and other deductions
70,801
79,395
142,331
150,109
Income (loss) before income taxes
10,705
13,665
22,305
26,034
Income tax expense (benefit)
3,351
4,094
6,918
7,897
Net income (loss) including noncontrolling interests
7,354
9,571
15,387
18,137
Net income (loss) attributable to noncontrolling interests
272
331
592
677
Net income (loss) attributable to ExxonMobil
7,082
9,240
14,795
17,460
Earnings (loss) per common share (dollars)
1.64
2.14
3.40
4.20
Earnings (loss) per common share - assuming dilution (dollars)
1.64
2.14
3.40
4.20
(1) Includes $40 million related to the write-off of exploratory well costs in 2025 that were previously capitalized for greater than one year at December 31, 2024.
The information in the Notes to Condensed Consolidated Financial Statements is an integral part of these statements.
NOTES TO CONDENSED CONSOLIDATED FINANCIAL STATEMENTS
Note 1. Basis of Financial Statement Preparation
These unaudited Condensed Consolidated Financial Statements should be read in the context of the Consolidated Financial Statements and notes thereto filed with the Securities and Exchange Commission in the Corporation's 2024 Annual Report on Form 10-K. In the opinion of the Corporation, the information furnished herein reflects all known accruals and adjustments necessary for a fair statement of the results for the periods reported herein. All such adjustments are of a normal recurring nature.
Restricted cash represents sale proceeds required to be set aside by a contractual arrangement for any potential like-kind exchange. The restriction will lapse upon the earlier of completion of the exchange or the expiry of the underlying time period, which is less than one year.
The Corporation's exploration and production activities are accounted for under the "successful efforts" method.
Note 2. Pioneer Natural Resources Merger
On May 3, 2024, the Corporation acquired Pioneer Natural Resources Company ("Pioneer"), an independent oil and gas exploration and production company. In connection with the acquisition, we issued 545 million shares of ExxonMobil common stock having a fair value of $63 billion on the acquisition date, and assumed debt with a fair value of $5 billion.
The transaction was accounted for as a business combination in accordance with ASC 805, which requires that assets acquired and liabilities assumed be recognized at their fair values as of the acquisition date. The following table summarizes the fair values of the assets acquired and liabilities assumed.
(billions of dollars)
Pioneer
Current assets (1)
3
Other non-current assets
1
Property, plant & equipment (2)
84
Total identifiable assets acquired
88
Current liabilities (1)
3
Long-term debt (3)
5
Deferred income tax liabilities (4)
16
Other non-current liabilities
2
Total liabilities assumed
26
Net identifiable assets acquired
62
Goodwill (5)
1
Net assets
63
(1) Current assets and current liabilities consist primarily of accounts receivable and payable, with their respective fair values approximating historical values given their short-term duration, expectation of insignificant bad debt expense, and our credit rating.
(2) Property, plant and equipment, of which a significant portion relates to crude oil and natural gas properties, was primarily valued using the income approach. Significant inputs and assumptions used in the income approach included estimates for commodity prices, future oil and gas production volumes, drilling and development costs, and risk-adjusted discount rates. Collectively, these inputs are level 3 inputs.
(3) Long-term debt was valued using market prices as of the acquisition date, which reflects the use of level 1 inputs.
(4) Deferred income taxes represent the tax effects of differences in the tax basis and acquisition date fair values of assets acquired and liabilities assumed.
(5) Goodwill was allocated to the Upstream segment.
The following table presents long-term debt assumed at closing:
(millions of dollars)
Par Value
Fair Value as of May 2, 2024
0.250% Convertible Senior Notes due May 2025 (1)
450
1,327
1.125% Senior Notes due January 2026
750
699
5.100% Senior Notes due March 2026
1,100
1,096
7.200% Senior Notes due January 2028
241
252
4.125% Senior Notes due February 2028
138
130
1.900% Senior Notes due August 2030
1,100
914
2.150% Senior Notes due January 2031
1,000
832
(1) In June 2024, the Corporation redeemed in full all of the Convertible Senior Notes assumed from Pioneer for an amount consistent with the acquisition date fair value.
Actual and Pro Forma Impact of Merger
The following table presents revenues and earnings included in the Consolidated Statement of Income for Pioneer since the acquisition date (May 3, 2024) through June 30, 2024:
(millions of dollars)
Three Months Ended June 30, 2024
Six Months Ended June 30, 2024
Sales and other operating revenues
4,372
4,372
Net income (loss) attributable to ExxonMobil
398
398
The following table presents unaudited pro forma information for the Corporation as if the merger with Pioneer had occurred at the beginning of January 1, 2023:
Unaudited
(millions of dollars)
Three Months Ended June 30, 2024
Six Months Ended June 30, 2024
Sales and other operating revenues
92,167
178,557
Net income (loss) attributable to ExxonMobil
9,265
18,256
The historical financial information was adjusted to give effect to the pro forma events that were directly attributable to the merger and factually supportable. The unaudited pro forma consolidated results are not necessarily indicative of what the consolidated results of operations actually would have been had the merger been completed on January 1, 2023. In addition, the unaudited pro forma consolidated results reflect pro forma adjustments primarily related to conforming Pioneer's accounting policies to ExxonMobil, additional depreciation expense related to the fair value adjustment of the acquired property, plant and equipment, our capital structure, Pioneer's transaction-related costs, and applicable income tax impacts of the pro forma adjustments.
Our transaction costs to effect the acquisition were immaterial.
A variety of claims have been made against ExxonMobil and certain of its consolidated subsidiaries in a number of pending lawsuits. Management has regular litigation reviews, including updates from corporate and outside counsel, to assess the need for accounting recognition or disclosure of these contingencies. The Corporation accrues an undiscounted liability for those contingencies where the incurrence of a loss is probable and the amount can be reasonably estimated. If a range of amounts can be reasonably estimated and no amount within the range is a better estimate than any other amount, then the minimum of the range is accrued. The Corporation does not record liabilities when the likelihood that the liability has been incurred is probable but the amount cannot be reasonably estimated or when the liability is believed to be only reasonably possible or remote. For contingencies where an unfavorable outcome is reasonably possible and which are significant, the Corporation discloses the nature of the contingency and, where feasible, an estimate of the possible loss. For purposes of our contingency disclosures, “significant” includes material matters, as well as other matters, which management believes should be disclosed.
State and local governments and other entities in various jurisdictions across the United States and its territories have filed a number of legal proceedings against several oil and gas companies, including ExxonMobil, requesting unprecedented legal and equitable relief for various alleged injuries purportedly connected to climate change. These lawsuits assert a variety of novel, untested claims under statutory and common law. Additional such lawsuits may be filed. We believe the legal and factual theories set forth in these proceedings are meritless and represent an inappropriate attempt to use the court system to usurp the proper role of policymakers in addressing the societal challenges of climate change.
Local governments in Louisiana have filed unprecedented legal proceedings against a number of oil and gas companies, including ExxonMobil, requesting compensation for the restoration of coastal marsh erosion in the state. We believe the factual and legal theories set forth in these proceedings are meritless.
While the outcome of any litigation can be unpredictable, we believe the likelihood is remote that the ultimate outcomes of these lawsuits will have a material adverse effect on the Corporation’s operations, financial condition, or financial statements taken as a whole. We will continue to defend vigorously against these claims.
Other Contingencies
The Corporation and certain of its consolidated subsidiaries were contingently liable at June 30, 2025, for guarantees relating to notes, loans and performance under contracts. Where guarantees for environmental remediation and other similar matters do not include a stated cap, the amounts reflect management’s estimate of the maximum potential exposure. Where it is not possible to make a reasonable estimation of the maximum potential amount of future payments, future performance is expected to be either immaterial or have only a remote chance of occurrence.
June 30, 2025
(millions of dollars)
Equity Company
Obligations(1)
Other Third-Party Obligations
Total
Guarantees
Debt-related
991
157
1,148
Other
674
6,359
7,033
Total
1,665
6,516
8,181
(1) ExxonMobil share.
Additionally, the Corporation and its affiliates have numerous long-term sales and purchase commitments in their various business activities, all of which are expected to be fulfilled with no adverse consequences material to the Corporation’s operations or financial condition.
Current period change excluding amounts reclassified from accumulated other comprehensive income (1)
(1,197)
(21)
(1,218)
Amounts reclassified from accumulated other comprehensive income
—
20
20
Total change in accumulated other comprehensive income
(1,197)
(1)
(1,198)
Balance as of June 30, 2024
(14,253)
1,066
(13,187)
Balance as of December 31, 2024
(16,166)
1,547
(14,619)
Current period change excluding amounts reclassified from accumulated other comprehensive income (1)
2,200
(46)
2,154
Amounts reclassified from accumulated other comprehensive income
—
29
29
Total change in accumulated other comprehensive income
2,200
(17)
2,183
Balance as of June 30, 2025
(13,966)
1,530
(12,436)
(1) Cumulative Foreign Exchange Translation Adjustment includes net investment hedge gain/(loss) net of taxes of $(293) million and $123 million in 2025 and 2024, respectively.
Amounts Reclassified Out of Accumulated Other
Comprehensive Income - Before-tax Income/(Expense)
(millions of dollars)
Three Months Ended June 30,
Six Months Ended June 30,
2025
2024
2025
2024
Amortization and settlement of postretirement benefits reserves adjustment included in net periodic benefit costs
(Statement of Income line: Non-service pension and postretirement benefit expense)
The estimated fair value of financial instruments and derivatives at June 30, 2025 and December 31, 2024, and the related hierarchy level for the fair value measurement was as follows:
June 30, 2025
Fair Value
(millions of dollars)
Level 1
Level 2
Level 3
Total Gross Assets & Liabilities
Effect of Counterparty Netting
Effect of Collateral Netting
Difference in Carrying Value and Fair Value
Net Carrying Value
Assets
Derivative assets (1)
8,022
1,423
—
9,445
(8,585)
(62)
—
798
Advances to/receivables from equity companies (2)(6)
—
2,458
4,290
6,748
—
—
325
7,073
Other long-term financial assets (3)
1,517
—
1,538
3,055
—
—
214
3,269
Liabilities
Derivative liabilities(4)
8,271
1,271
—
9,542
(8,585)
(311)
—
646
Long-term debt(5)
25,560
2,517
—
28,077
—
—
3,374
31,451
Long-term obligations to equity companies(6)
—
—
1,156
1,156
—
—
(43)
1,113
Other long-term financial liabilities(7)
—
—
404
404
—
—
56
460
December 31, 2024
Fair Value
(millions of dollars)
Level 1
Level 2
Level 3
Total Gross Assets & Liabilities
Effect of Counterparty Netting
Effect of Collateral Netting
Difference in Carrying Value and Fair Value
Net Carrying Value
Assets
Derivative assets (1)
3,223
1,206
—
4,429
(3,913)
(3)
—
513
Advances to/receivables from equity companies (2)(6)
—
2,466
4,167
6,633
—
—
451
7,084
Other long-term financial assets (3)
1,468
—
1,504
2,972
—
—
247
3,219
Liabilities
Derivative liabilities(4)
3,561
1,416
—
4,977
(3,913)
(341)
—
723
Long-term debt(5)
28,884
1,813
—
30,697
—
—
3,935
34,632
Long-term obligations to equity companies(6)
—
—
1,393
1,393
—
—
(47)
1,346
Other long-term financial liabilities (7)
—
—
583
583
—
—
57
640
(1) Included in the Balance Sheet lines: Notes and accounts receivable - net and Other assets, including intangibles - net.
(2) Included in the Balance Sheet line: Investments, advances and long-term receivables.
(3) Included in the Balance Sheet lines: Investments, advances and long-term receivables and Other assets, including intangibles - net.
(4) Included in the Balance Sheet lines: Accounts payable and accrued liabilities and Other long-term obligations.
(5) Excluding finance lease obligations.
(6) Advances to/receivables from equity companies and long-term obligations to equity companies are mainly designated as hierarchy level 3 inputs. The fair value is calculated by discounting the remaining obligations by a rate consistent with the credit quality and industry of the equity company.
(7) Included in the Balance Sheet line: Other long-term obligations. Includes contingent consideration related to a prior year acquisition where fair value is based on expected drilling activities and discount rates.
At June 30, 2025 and December 31, 2024, respectively, the Corporation had $849 million and $491 million of collateral under master netting arrangements not offset against the derivatives on the Condensed Consolidated Balance Sheet, primarily related to initial margin requirements.
The Corporation may use non-derivative financial instruments, such as its foreign currency-denominated debt, as hedges of its net investments in certain foreign subsidiaries. Under this method, the change in the carrying value of the financial instruments due to foreign exchange fluctuations is reported in accumulated other comprehensive income. As of June 30, 2025, the Corporation has designated $3.5 billion of its Euro-denominated debt and related accrued interest as a net investment hedge of its European business. The net investment hedge is deemed to be perfectly effective.
The Corporation had undrawn short-term committed lines of credit of $0.2 billion and undrawn long-term committed lines of credit of $0.7 billion as of the end of second quarter 2025.
Derivative Instruments
The Corporation’s size, strong capital structure, geographic diversity, and the complementary nature of its business segments reduce the Corporation’s enterprise-wide risk from changes in commodity prices, currency rates and interest rates. In addition, the Corporation uses commodity-based contracts, including derivatives, to manage commodity price risk and to generate returns from trading. Commodity contracts held for trading purposes are presented in the Condensed Consolidated Statement of Income on a net basis in the line “Sales and other operating revenue" and in the Consolidated Statement of Cash Flows in “Cash Flows from Operating Activities”. The Corporation’s commodity derivatives are not accounted for under hedge accounting. At times, the Corporation also enters into currency and interest rate derivatives, none of which are material to the Corporation’s financial position as of June 30, 2025 and December 31, 2024, or results of operations for the periods ended June 30, 2025 and 2024.
The Corporation operates a program to hedge certain of its fixed-rate debt instruments against changes in fair value due to changes in the designated benchmark interest rate. This program utilizes fair value hedge accounting. The derivative (hedging) instruments are fixed-for-floating interest rate swaps, with settlement dates that correspond to the interest payments associated with the fixed-rate debt (hedged item). Changes in the fair values of the hedging instruments are perfectly offset by changes in the fair values of the hedged items; the effects of these changes in fair values are recorded in "Interest expense" in the Consolidated Statement of Income. This program was not material to the Consolidated Financial Statements as of the end of second quarter 2025.
Credit risk associated with the Corporation’s derivative position is mitigated by several factors, including the use of derivative clearing exchanges and the quality of and financial limits placed on derivative counterparties. The Corporation maintains a system of controls that includes the authorization, reporting, and monitoring of derivative activity.
The net notional long/(short) position of derivative instruments at June 30, 2025 and December 31, 2024, was as follows:
(millions)
June 30, 2025
December 31, 2024
Crude oil (barrels)
—
13
Petroleum products (barrels)
(26)
(32)
Natural gas (MMBTUs)
(647)
(675)
Realized and unrealized gains/(losses) on derivative instruments that were recognized in the Condensed Consolidated Statement of Income are included in the following lines on a before-tax basis:
Note 8. Disclosures about Segments and Related Information
(millions of dollars)
Upstream
Energy Products
Chemical Products
Specialty Products
Segment Total
U.S.
Non-U.S.
U.S.
Non-U.S.
U.S.
Non-U.S.
U.S.
Non-U.S.
Three Months Ended June 30, 2025
Revenues and other income
Sales and other operating revenue
5,939
3,286
25,072
34,917
1,970
3,700
1,438
3,134
79,456
Income from equity affiliates
5
1,300
36
28
38
129
3
(10)
1,529
Intersegment revenue
6,230
8,824
4,502
6,512
1,668
790
551
113
29,190
Other income
93
23
26
54
—
3
2
31
232
Segment revenues and other income
12,267
13,433
29,636
41,511
3,676
4,622
1,994
3,268
110,407
Costs and other items
Crude oil and product purchases
4,533
2,006
25,515
33,551
2,136
3,204
1,073
2,025
74,043
Operating expenses, excl. depreciation and depletion (1)
2,716
2,480
1,940
2,272
1,096
1,194
510
556
12,764
Depreciation and depletion (includes impairments)
3,356
1,733
198
170
148
138
27
43
5,813
Interest expense
22
16
(1)
1
—
—
—
2
40
Other taxes and duties
49
531
830
4,744
18
39
1
44
6,256
Total costs and other deductions
10,676
6,766
28,482
40,738
3,398
4,575
1,611
2,670
98,916
Segment income (loss) before income taxes
1,591
6,667
1,154
773
278
47
383
598
11,491
Income tax expense (benefit)
379
2,332
264
159
23
3
91
106
3,357
Segment net income (loss) incl. noncontrolling interests
1,212
4,335
890
614
255
44
292
492
8,134
Net income (loss) attributable to noncontrolling interests
—
145
65
73
—
6
1
3
293
Segment income (loss)
1,212
4,190
825
541
255
38
291
489
7,841
Reconciliation of consolidated revenues
Segment revenues and other income
110,407
Other revenues (2)
289
Elimination of intersegment revenues
(29,190)
Total consolidated revenues and other income
81,506
Reconciliation of income (loss) attributable to ExxonMobil
Total segment income (loss)
7,841
Corporate and Financing income (loss)
(759)
Net income (loss) attributable to ExxonMobil
7,082
(millions of dollars)
Upstream
Energy Products
Chemical Products
Specialty Products
Segment Total
U.S.
Non-U.S.
U.S.
Non-U.S.
U.S.
Non-U.S.
U.S.
Non-U.S.
Three Months Ended June 30, 2025
Additions to property, plant and equipment (3)
3,047
2,022
145
258
161
101
39
50
5,823
As of June 30, 2025
Investments in equity companies
5,107
19,846
462
983
3,008
2,598
—
793
32,797
Total assets
152,661
134,033
32,412
46,120
17,456
18,433
2,674
8,476
412,265
Reconciliation to Corporate Total
Segment Total
Corporate and Financing
Corporate Total
Three Months Ended June 30, 2025
Additions to property, plant and equipment (3)
5,823
532
6,355
As of June 30, 2025
Investments in equity companies
32,797
(140)
32,657
Total assets
412,265
35,332
447,597
(1) Operating expenses, excl. depreciation and depletion includes the following GAAP line items, as reflected on the Income Statement: Production and manufacturing expenses; Selling, general and administrative expenses; Exploration expenses, including dry holes; and Non-service pension and postretirement benefit expense.
(2) Primarily Corporate and Financing Interest revenue of $312 million.
(3) Includes non-cash additions.
Due to rounding, numbers presented may not add up precisely to the totals indicated.
Operating expenses, excl. depreciation and depletion (1)
2,605
2,710
2,033
2,176
1,194
1,120
467
547
12,852
Depreciation and depletion (includes impairments)
2,792
2,039
197
178
144
110
22
34
5,516
Interest expense
46
18
2
1
—
1
—
—
68
Other taxes and duties
104
687
873
4,841
2
20
—
51
6,578
Total costs and other deductions
9,866
7,992
32,459
48,780
3,522
4,446
1,592
2,939
111,596
Segment income (loss) before income taxes
3,165
7,807
609
649
673
341
584
338
14,166
Income tax expense (benefit)
735
2,954
104
92
147
76
136
31
4,275
Segment net income (loss) incl. noncontrolling interests
2,430
4,853
505
557
526
265
448
307
9,891
Net income (loss) attributable to noncontrolling interests
—
209
55
61
—
12
1
3
341
Segment income (loss)
2,430
4,644
450
496
526
253
447
304
9,550
Reconciliation of consolidated revenues
Segment revenues and other income
125,762
Other revenues (2)
551
Elimination of intersegment revenues
(33,253)
Total consolidated revenues and other income
93,060
Reconciliation of income (loss) attributable to ExxonMobil
Total segment income (loss)
9,550
Corporate and Financing income (loss)
(310)
Net income (loss) attributable to ExxonMobil
9,240
(millions of dollars)
Upstream
Energy Products
Chemical Products
Specialty Products
Segment Total
U.S.
Non-U.S.
U.S.
Non-U.S.
U.S.
Non-U.S.
U.S.
Non-U.S.
Three Months Ended June 30, 2024
Additions to property, plant and equipment (3)
86,884
2,474
160
345
104
298
44
64
90,373
As of December 31, 2024
Investments in equity companies
4,884
21,396
444
915
3,016
2,649
—
814
34,118
Total assets
154,914
134,609
32,143
43,399
17,445
17,692
2,882
8,040
411,124
Reconciliation to Corporate Total
Segment Total
Corporate and Financing
Corporate Total
Three Months Ended June 30, 2024
Additions to property, plant and equipment (3)
90,373
431
90,804
As of December 31, 2024
Investments in equity companies
34,118
(108)
34,010
Total assets
411,124
42,351
453,475
(1) Operating expenses, excl. depreciation and depletion includes the following GAAP line items, as reflected on the Income Statement: Production and manufacturing expenses; Selling, general and administrative expenses; Exploration expenses, including dry holes; and Non-service pension and postretirement benefit expense.
(2) Primarily Corporate and Financing Interest revenue of $433 million.
(3) Includes non-cash additions.
Due to rounding, numbers presented may not add up precisely to the totals indicated.
Operating expenses, excl. depreciation and depletion (1)
5,479
4,761
4,022
4,431
2,159
2,278
982
1,126
25,238
Depreciation and depletion (includes impairments)
6,394
3,422
393
343
293
260
54
81
11,240
Interest expense
59
22
(1)
2
—
—
—
2
84
Other taxes and duties
113
1,070
1,617
9,306
34
61
3
88
12,292
Total costs and other deductions
22,007
14,542
56,652
82,679
6,776
8,818
3,109
5,401
199,984
Segment income (loss) before income taxes
4,003
14,322
1,585
1,606
621
67
801
1,011
24,016
Income tax expense (benefit)
921
4,930
358
346
111
(3)
187
183
7,033
Segment net income (loss) incl. noncontrolling interests
3,082
9,392
1,227
1,260
510
70
614
828
16,983
Net income (loss) attributable to noncontrolling interests
—
316
105
189
—
14
1
6
631
Segment income (loss)
3,082
9,076
1,122
1,071
510
56
613
822
16,352
Reconciliation of consolidated revenues
Segment revenues and other income
224,000
Other revenues (2)
605
Elimination of intersegment revenues
(59,969)
Total consolidated revenues and other income
164,636
Reconciliation of income (loss) attributable to ExxonMobil
Total segment income (loss)
16,352
Corporate and Financing income (loss)
(1,557)
Net income (loss) attributable to ExxonMobil
14,795
(millions of dollars)
Upstream
Energy Products
Chemical Products
Specialty Products
Segment Total
U.S.
Non-U.S.
U.S.
Non-U.S.
U.S.
Non-U.S.
U.S.
Non-U.S.
Six Months Ended June 30, 2025
Additions to property, plant and equipment (3)
5,827
4,044
261
486
306
218
88
103
11,333
As of June 30, 2025
Investments in equity companies
5,107
19,846
462
983
3,008
2,598
—
793
32,797
Total assets
152,661
134,033
32,412
46,120
17,456
18,433
2,674
8,476
412,265
Reconciliation to Corporate Total
Segment Total
Corporate and Financing
Corporate Total
Six Months Ended June 30, 2025
Additions to property, plant and equipment (3)
11,333
1,051
12,384
As of June 30, 2025
Investments in equity companies
32,797
(140)
32,657
Total assets
412,265
35,332
447,597
(1) Operating expenses, excl. depreciation and depletion includes the following GAAP line items, as reflected on the Income Statement: Production and manufacturing expenses; Selling, general and administrative expenses; Exploration expenses, including dry holes; and Non-service pension and postretirement benefit expense.
(2) Primarily Corporate and Financing Interest revenue of $675 million.
(3) Includes non-cash additions.
Due to rounding, numbers presented may not add up precisely to the totals indicated.
Operating expenses, excl. depreciation and depletion (1)
4,332
5,340
4,047
4,314
2,185
2,180
895
1,082
24,375
Depreciation and depletion (includes impairments)
4,634
4,074
393
367
303
219
44
73
10,107
Interest expense
74
33
3
3
—
1
—
1
115
Other taxes and duties
202
1,300
1,693
9,544
19
39
2
103
12,902
Total costs and other deductions
16,554
15,768
62,766
94,163
6,980
8,985
3,190
5,851
214,257
Segment income (loss) before income taxes
4,511
15,382
1,739
1,471
1,332
683
1,113
763
26,994
Income tax expense (benefit)
1,027
5,779
340
230
302
126
261
94
8,159
Segment net income (loss) incl. noncontrolling interests
3,484
9,603
1,399
1,241
1,030
557
852
669
18,835
Net income (loss) attributable to noncontrolling interests
—
353
113
205
—
23
1
8
703
Segment income (loss)
3,484
9,250
1,286
1,036
1,030
534
851
661
18,132
Reconciliation of consolidated revenue
Segment revenues and other income
241,251
Other revenues (2)
1,132
Elimination of intersegment revenues
(66,240)
Total consolidated revenues and other income
176,143
Reconciliation of income (loss) attributable to ExxonMobil
Total segment income (loss)
18,132
Corporate and Financing income (loss)
(672)
Net income (loss) attributable to ExxonMobil
17,460
(millions of dollars)
Upstream
Energy Products
Chemical Products
Specialty Products
Segment Total
U.S.
Non-U.S.
U.S.
Non-U.S.
U.S.
Non-U.S.
U.S.
Non-U.S.
Six Months Ended June 30, 2024
Additions to property, plant and equipment (3)
88,912
4,138
302
666
204
533
58
122
94,935
As of December 31, 2024
Investments in equity companies
4,884
21,396
444
915
3,016
2,649
—
814
34,118
Total assets
154,914
134,609
32,143
43,399
17,445
17,692
2,882
8,040
411,124
Reconciliation to Corporate Total
Segment Total
Corporate and Financing
Corporate Total
Six Months Ended June 30, 2024
Additions to property, plant and equipment (3)
94,935
943
95,878
As of December 31, 2024
Investments in equity companies
34,118
(108)
34,010
Total assets
411,124
42,351
453,475
(1) Operating expenses, excl. depreciation and depletion includes the following GAAP line items, as reflected on the Income Statement: Production and manufacturing expenses; Selling, general and administrative expenses; Exploration expenses, including dry holes; and Non-service pension and postretirement benefit expense.
(2) Primarily Corporate and Financing Interest revenue of $907 million.
(3) Includes non-cash additions.
Due to rounding, numbers presented may not add up precisely to the totals indicated.
Sales and other operating revenue include both revenue within the scope of ASC 606 and outside the scope of ASC 606. Trade receivables in Notes and accounts receivable – net reported on the Balance Sheet also includes both receivables within the scope of ASC 606 and those outside the scope of ASC 606. Revenue and receivables outside the scope of ASC 606 primarily relate to physically settled commodity contracts accounted for as derivatives. Contractual terms, credit quality, and type of customer are generally similar between those revenues and receivables within the scope of ASC 606 and those outside it.
Sales and other operating revenue
(millions of dollars)
Three Months Ended June 30,
Six Months Ended June 30,
2025
2024
2025
2024
Revenue from contracts with customers
56,680
64,181
113,611
122,600
Revenue outside the scope of ASC 606
22,797
25,805
46,924
47,797
Total
79,477
89,986
160,535
170,397
Geographic Sales and Other Operating Revenue
(millions of dollars)
Three Months Ended June 30,
Six Months Ended June 30,
2025
2024
2025
2024
United States
34,436
36,895
69,043
67,551
Non-U.S.
45,041
53,091
91,492
102,846
Total
79,477
89,986
160,535
170,397
Significant Non-U.S. revenue sources include: (1)
Canada
6,804
8,126
13,794
15,182
(1)Revenue is determined by primary country of operations. Excludes certain sales and other operating revenues in non-U.S. operations where attribution to a specific country is not practicable.
Note 9. Divestment Activities
Through June 30, 2025, the Corporation realized proceeds of approximately $2.0 billion and net after-tax earnings of approximately $0.2 billion from its divestment activities. This included the sale of select conventional assets in Texas and New Mexico, Mobil Argentina S.A., as well as other smaller divestments.
In 2024, the Corporation realized proceeds of approximately $5.0 billion and recognized net after-tax earnings of approximately $1.0 billion from its divestment activities. This included the sale of the Santa Ynez Unit and associated facilities in California, Mobil Producing Nigeria Unlimited, ExxonMobil Exploration Argentina, the Fos-sur-Mer Refinery (France), the Adriatic LNG terminal (Italy), and certain conventional and unconventional assets in the United States, as well as other smaller divestments.
ITEM 2. MANAGEMENT'S DISCUSSION AND ANALYSIS OF FINANCIAL CONDITION AND RESULTS OF OPERATIONS
Overview
During the second quarter of 2025, the price of crude oil decreased slightly relative to first quarter 2025, remaining near the middle of the 10-year historical range (2010-2019) supported by strong demand which helped to offset increased OPEC supply. Natural gas prices remained above the 10-year range on strong global demand. Global industry refining margins improved in the second quarter, moving back to the middle of the 10-year historical range driven by strong seasonal demand. Chemical margins remained at bottom of cycle, well below the 10-year range, with continued industry oversupply.
During 2025, the U.S. announced a variety of trade-related actions, including the imposition of tariffs on imports from several countries. In response, many countries announced their own retaliatory tariffs. Certain tariffs were paused for a period of time but have not been withdrawn, while others have been revised. The global trade environment continues to be volatile. The likelihood of the U.S. or its trading partners resuming tariffs, imposing new or revised reciprocal tariffs, export restrictions, or other forms of trade-related sanctions is highly uncertain. Despite the current uncertainty as to what effects these actions will ultimately have on the Corporation, our suppliers and our customers, as well as on the overall macroeconomic environment, we do not anticipate any material near-term financial impacts.
Selected Earnings Driver Definitions
The earnings drivers provide additional visibility into our business results. The Corporation evaluates these drivers periodically to determine if any enhancements may provide helpful insights to the market. Listed below are descriptions of the earnings drivers:
Advantaged Volume Growth. Represents earnings impacts from change in volume/mix from advantaged assets, advantaged projects, and high-value products.
•Advantaged Assets (Advantaged growth projects). Includes Permian, Guyana, and LNG.
•Advantaged Projects. Includes capital projects and programs of work that contribute to Energy, Chemical, and/or Specialty Products segments that drive integration of segments/businesses, increase yield of higher value products, or deliver higher than average returns.
•High-Value Products. Includes performance products and lower-emission fuels. Performance products (performance chemicals, performance lubricants) refers to products that provide differentiated performance for multiple applications through enhanced properties versus commodity alternatives and bring significant additional value to customers and end-users. Lower-emission fuels refers to fuels with lower life cycle emissions than conventional transportation fuels for gasoline, diesel and jet transport.
Base Volume. Represents all volume/mix drivers not included in Advantaged Volume Growth defined above.
Structural Cost Savings. Represents after-tax earnings effects of Structural Cost Savings as defined on page 23, including cash operating expenses related to divestments.
Expenses. Represents all expenses otherwise not included in other earnings drivers.
Timing Effects. Represents timing effects that are primarily related to unsettled derivatives (mark-to-market) and other earnings impacts driven by timing differences between the settlement of derivatives and their offsetting physical commodity realizations (due to LIFO inventory accounting).
Earnings (loss) excluding Identified Items are earnings (loss) excluding individually significant non-operational events with, typically, an absolute corporate total earnings impact of at least $250 million in a given quarter. The earnings (loss) impact of an Identified Item for an individual segment may be less than $250 million when the item impacts several segments or several periods. Earnings (loss) excluding Identified Items does include non-operational earnings events or impacts that are generally below the $250 million threshold utilized for Identified Items. Management uses these figures to improve comparability of the underlying business across multiple periods by isolating and removing significant non-operational events from business results. The Corporation believes this view provides investors increased transparency into business results and trends, and provides investors with a view of the business as seen through the eyes of management. Earnings (loss) excluding Identified Items is not meant to be viewed in isolation or as a substitute for net income (loss) attributable to ExxonMobil as prepared in accordance with U.S. GAAP.
References in this discussion to Corporate earnings (loss) mean net income (loss) attributable to ExxonMobil (U.S. GAAP) from the Condensed Consolidated Statement of Income. Unless otherwise indicated, references to earnings (loss); Upstream, Energy Products, Chemical Products, Specialty Products, and Corporate and Financing earnings (loss); and earnings (loss) per share are ExxonMobil's share after excluding amounts attributable to noncontrolling interests.
Due to rounding, numbers presented may not add up precisely to the totals indicated.
Structural Cost Savings describes decreases in cash opex excluding energy and production taxes as a result of operational efficiencies, workforce reductions, divestment-related reductions, and other cost-savings measures that are expected to be sustainable compared to 2019 levels. Relative to 2019, estimated cumulative Structural Cost Savings totaled $13.5 billion, which included an additional $1.4 billion in the first six months of 2025. The total change between periods in expenses below will reflect both Structural Cost Savings and other changes in spend, including market factors, such as inflation and foreign exchange impacts, as well as changes in activity levels and costs associated with new operations, mergers and acquisitions, new business venture development, and early-stage projects. Structural Cost Savings from new operations, mergers and acquisitions, and new business venture developments are included in the cumulative Structural Cost Savings. Estimates of cumulative annual structural savings may be revised depending on whether cost reductions realized in prior periods are determined to be sustainable compared to 2019 levels. Structural Cost Savings are stewarded internally to support management's oversight of spending over time. This measure is useful for investors to understand the Corporation's efforts to optimize spending through disciplined expense management.
Dollars in billions (unless otherwise noted)
Twelve Months Ended December 31,
Six Months Ended June 30,
2019
2024
2024
2025
Components of Operating Costs
From ExxonMobil’s Consolidated Statement of Income (U.S. GAAP)
Production and manufacturing expenses
36.8
39.6
18.9
20.2
Selling, general and administrative expenses
11.4
10.0
5.1
5.1
Depreciation and depletion (includes impairments)
19.0
23.4
10.6
11.8
Exploration expenses, including dry holes
1.3
0.8
0.3
0.3
Non-service pension and postretirement benefit expense
1.2
0.1
0.1
0.2
Subtotal
69.7
74.0
34.9
37.6
ExxonMobil’s share of equity company expenses (Non-GAAP)
9.1
9.6
4.7
5.2
Total Adjusted Operating Costs (Non-GAAP)
78.8
83.6
39.6
42.8
Total Adjusted Operating Costs (Non-GAAP)
78.8
83.6
39.6
42.8
Less:
Depreciation and depletion (includes impairments)
19.0
23.4
10.6
11.8
Non-service pension and postretirement benefit expense
1.2
0.1
0.1
0.2
Other adjustments (includes equity company depreciation and depletion)
3.6
3.7
1.7
2.4
Total Cash Operating Expenses (Cash Opex) (Non-GAAP)
55.0
56.4
27.2
28.4
Energy and production taxes (Non-GAAP)
11.0
13.9
6.8
7.6
Total Cash Operating Expenses (Cash Opex) excluding Energy and Production Taxes (Non-GAAP)
44.0
42.5
20.4
20.8
Change
vs
2019
Change
vs
2024
Estimated Cumulative vs
2019
Total Cash Operating Expenses (Cash Opex) excluding Energy and Production Taxes (Non-GAAP)
-1.5
+0.4
Market
+4.0
+0.3
Activity / Other
+6.6
+1.5
Structural Cost Savings
-12.1
-1.4
-13.5
Due to rounding, numbers presented may not add up precisely to the totals indicated.
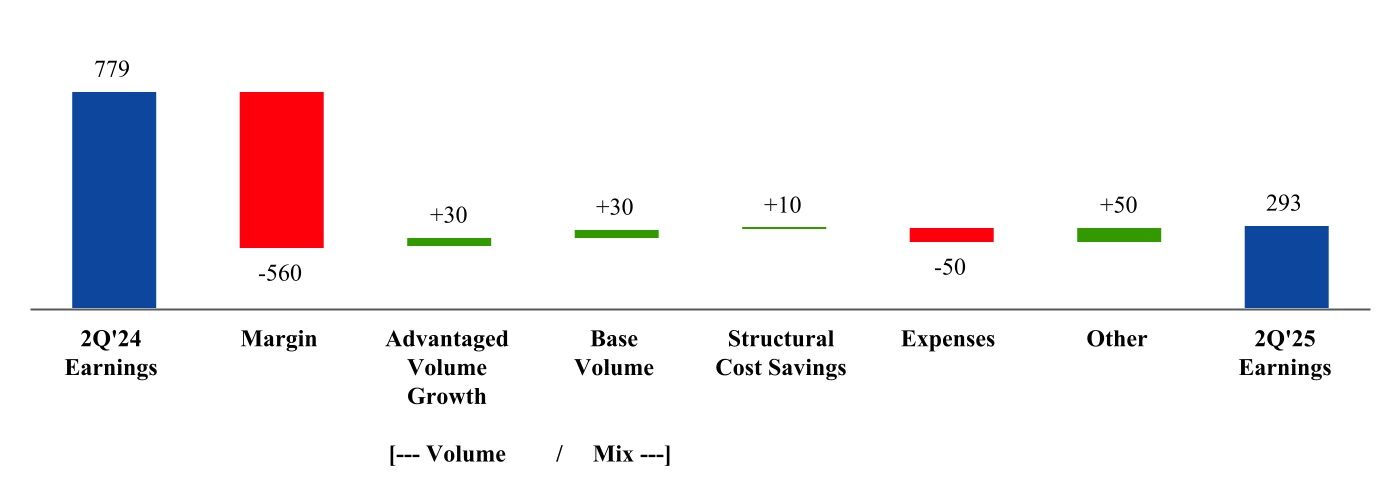
ExxonMobil’s second quarter 2025 earnings were $7.1 billion, compared to $9.2 billion a year earlier. The decrease in earnings was mainly driven by weaker crude prices, lower chemical realizations, and higher expenses from growth initiatives; partly offset by increased volumes from advantaged Upstream investments in the Permian and Structural Cost Savings. Cash capital expenditures were $6.3 billion, down $0.2 billion from second quarter 2024.
Earnings for the first six months of 2025 were $14.8 billion, compared to $17.5 billion a year earlier. Cash capital expenditures were $12.3 billion, up $0.5 billion from the first six months of 2024. The Corporation distributed $8.6 billion in dividends to shareholders and repurchased $9.8 billion of common stock.
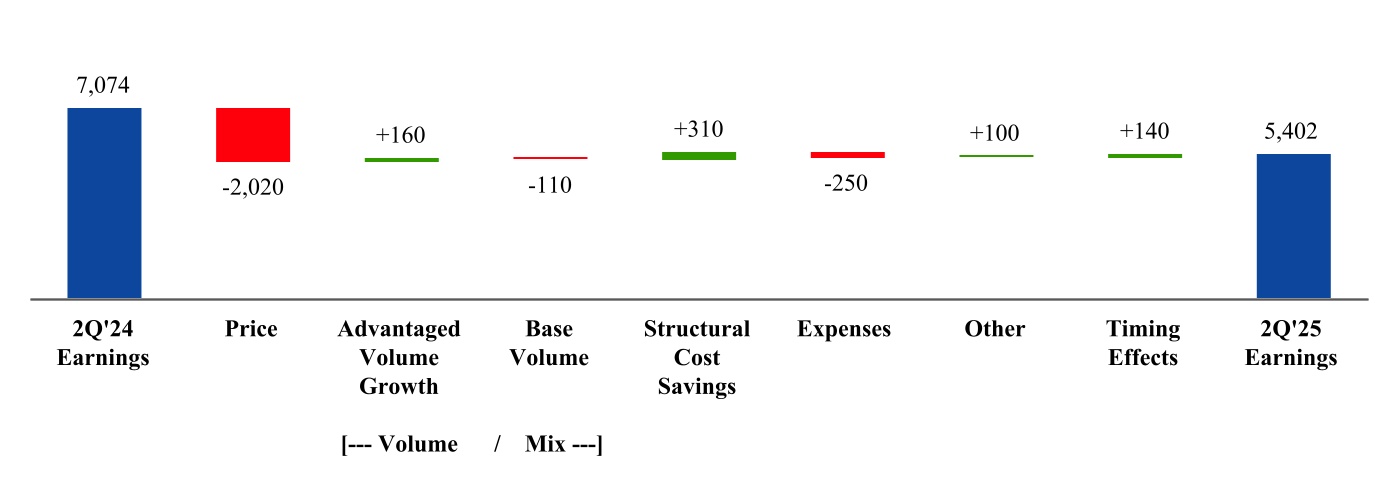
Price – Price impacts decreased earnings by $2,020 million, mainly driven by lower liquids realizations.
Advantaged Volume Growth – Volumes from advantaged assets increased earnings by $160 million, mainly driven by Permian growth, including the Pioneer acquisition.
Base Volume – Decreased earnings by $110 million as a result of divestments.
Structural Cost Savings – Increased earnings by $310 million.
Expenses – Decreased earnings by $250 million from higher depreciation.
Other – Increased earnings by $100 million, driven by favorable foreign exchange and tax items, partially offset by lower divestment gains.
Timing Effects – Increased earnings by $140 million, mainly from favorable derivatives mark-to-market impacts.
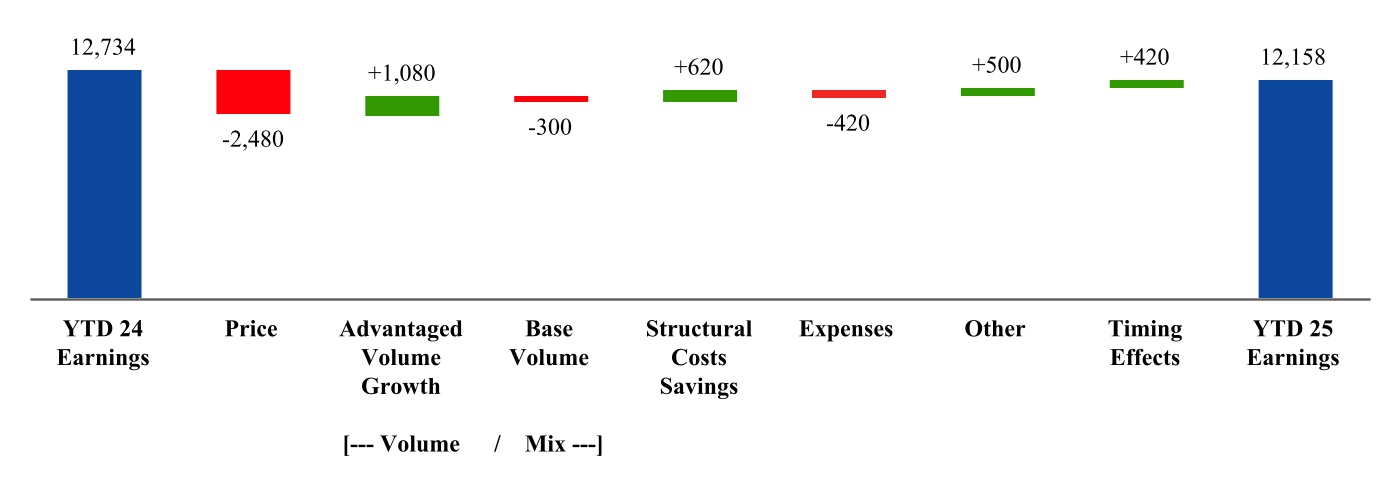
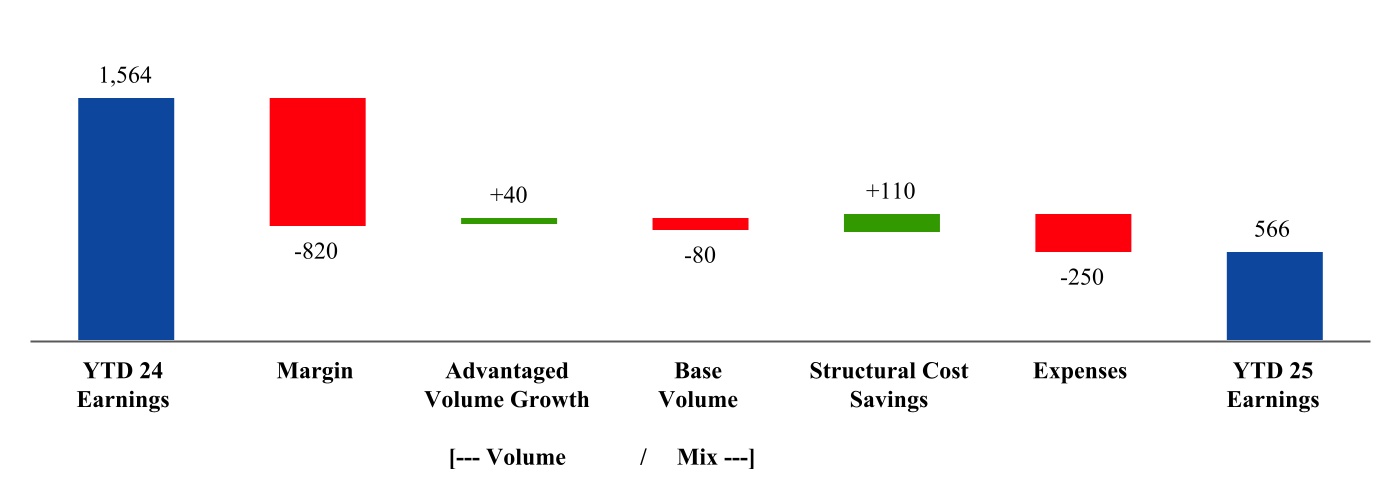
Upstream Year-to-Date Earnings Driver Analysis
(millions of dollars)
Price– Price impacts decreased earnings by $2,480 million, driven by lower liquids realizations.
Advantaged Volume Growth – Volumes from advantaged assets increased earnings by $1,080 million, driven by the Permian and Guyana.
Base Volume – Divestments of non-strategic assets decreased earnings by $300 million, partially offset by the Tengiz expansion.
Structural Cost Savings – Increased earnings by $620 million.
Expenses – Decreased earnings by $420 million, primarily from higher depreciation.
Other – Increased earnings by $500 million, driven by favorable foreign exchange and tax items.
Timing Effects – Increased earnings by $420 million from favorable derivatives mark-to-market impacts.
(1) Natural gas is converted to an oil-equivalent basis at six million cubic feet per one thousand barrels.
Due to rounding, numbers presented may not add up precisely to the totals indicated.
2Q 2025
versus
2Q 2024
2Q 2025 production of 4.6 million oil-equivalent barrels per day increased 272 thousand oil-equivalent barrels per day from 2Q 2024, driven by the Pioneer acquisition.
YTD 2025
versus
YTD 2024
4.6 million oil-equivalent barrels per day in 2025 increased 520 thousand oil-equivalent barrels per day from 2024, driven by Permian production.
Listed below are descriptions of ExxonMobil’s volumes reconciliation drivers which are provided to facilitate understanding of the terms.
Entitlements - Net Interest are changes to ExxonMobil’s share of production volumes caused by non-operational changes to volume-determining drivers. These drivers consist of net interest changes specified in Production Sharing Contracts (PSCs), which typically occur when cumulative investment returns or production volumes achieve defined thresholds, changes in equity upon achieving pay-out in partner investment carry situations, equity redeterminations as specified in venture agreements, or as a result of the termination or expiry of a concession. Once a net interest change has occurred, it typically will not be reversed by subsequent events, such as lower crude oil prices.
Entitlements - Price / Spend / Other are changes to ExxonMobil’s share of production volumes resulting from temporary changes to non-operational volume-determining drivers. These drivers include changes in oil and gas prices or spending levels from one period to another. According to the terms of contractual arrangements or government royalty regimes, price or spending variability can increase or decrease royalty burdens and/or volumes attributable to ExxonMobil. For example, at higher prices, fewer barrels are required for ExxonMobil to recover its costs. These effects generally vary from period to period with field spending patterns or market prices for oil and natural gas. Such drivers can also include other temporary changes in net interest as dictated by specific provisions in production agreements.
Government Mandates are changes to ExxonMobil's sustainable production levels as a result of production limits or sanctions imposed by governments.
Divestments are reductions in ExxonMobil’s production arising from commercial arrangements to fully or partially reduce equity in a field or asset in exchange for financial or other economic consideration.
Growth and Other comprise all other operational and non-operational drivers not covered by the above definitions that may affect volumes attributable to ExxonMobil. Such drivers include, but are not limited to, production enhancements from project and work program activities, acquisitions including additions from asset exchanges, downtime, market demand, natural field decline, and any fiscal or commercial terms that do not affect entitlements.
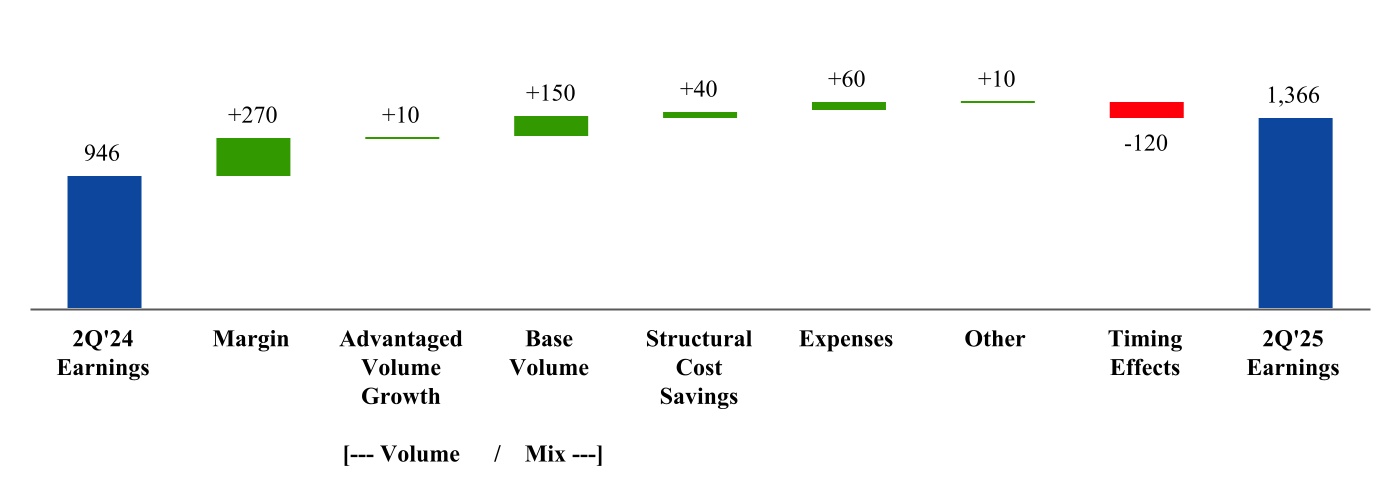
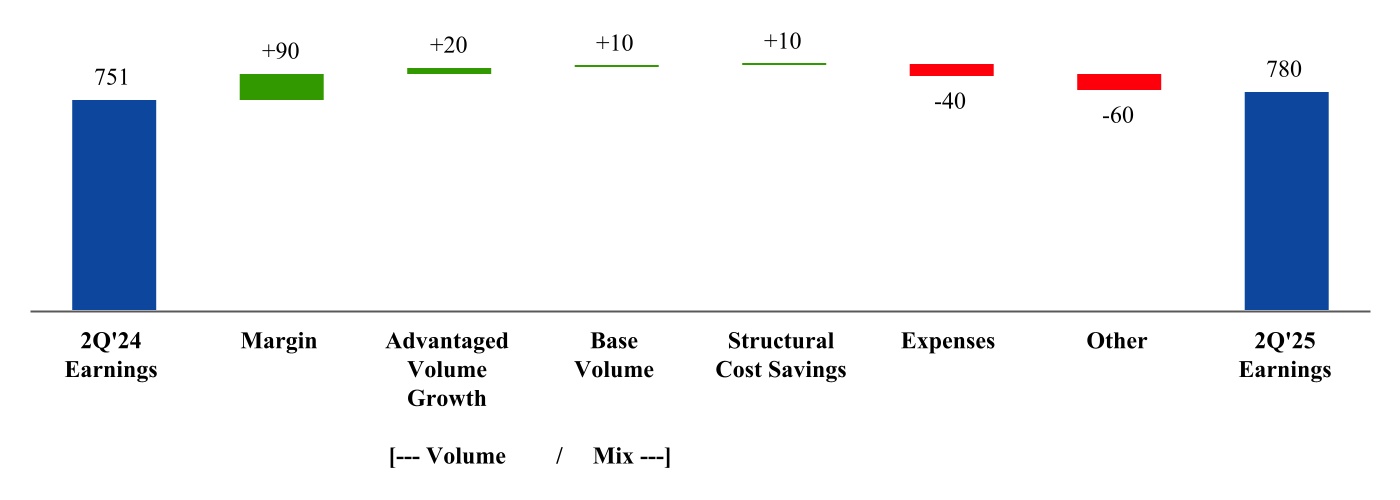
Energy Products Second Quarter Earnings Driver Analysis
(millions of dollars)
Margin – Industry refining margins increased earnings by $270 million, on higher fuel demand and industry supply outages.
Advantaged Volume Growth – Volumes from advantaged projects increased earnings by $10 million.
Base Volume – Increased earnings by $150 million, driven by lower scheduled maintenance.
Structural Cost Savings– Increased earnings by $40 million.
Expenses– Increased earnings by $60 million.
Other – Increased earnings by $10 million.
Timing Effects – Decreased earnings by $120 million, mainly from the absence of prior year favorable derivatives mark-to-market impacts.
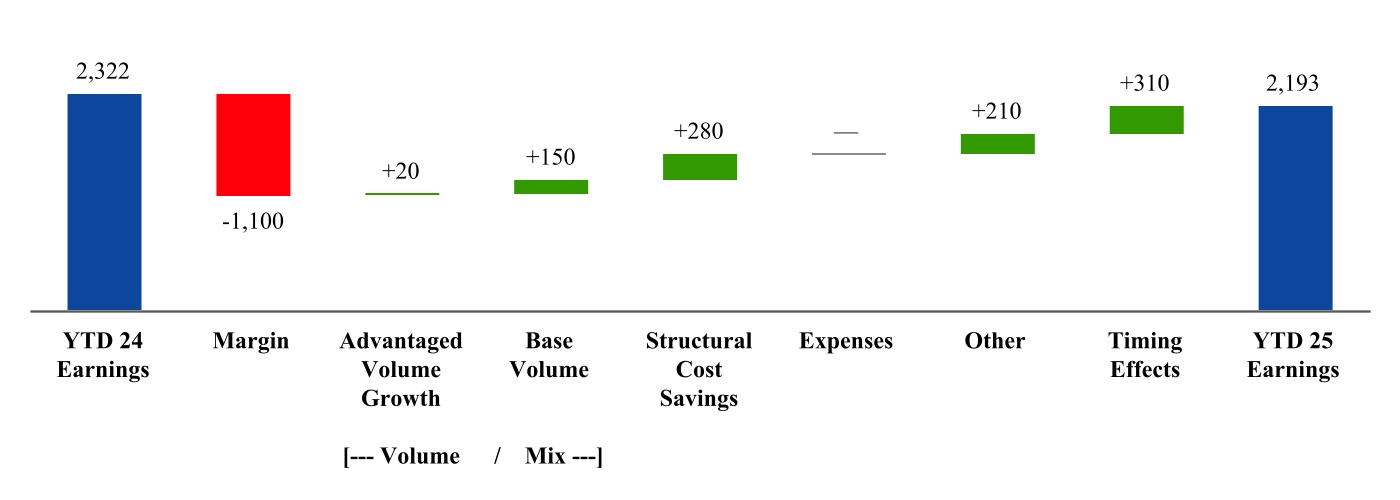
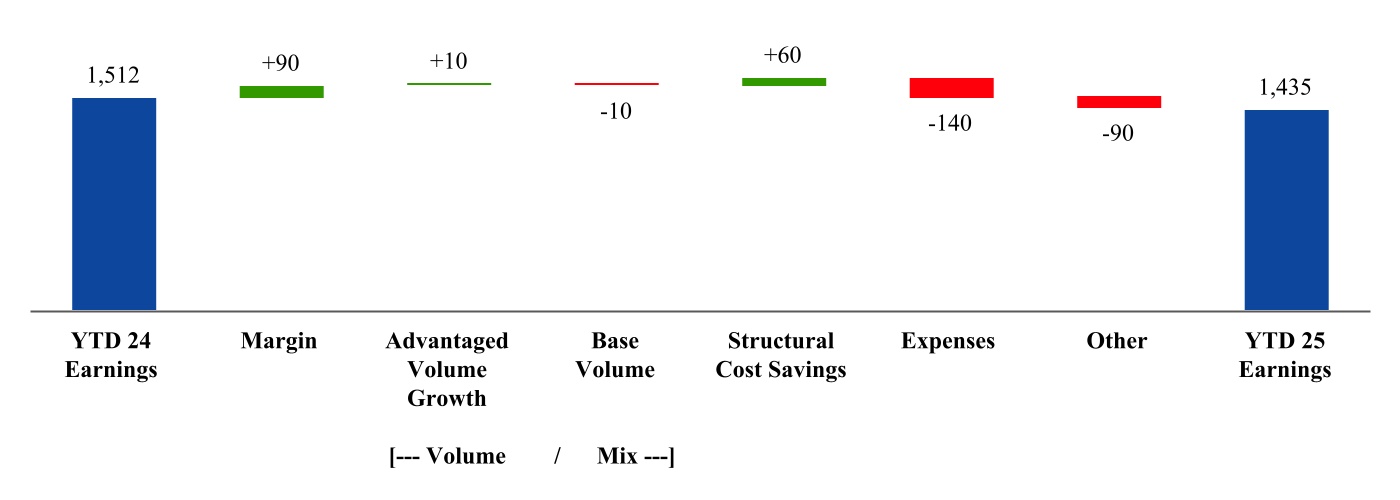
Energy Products Year-to-Date Earnings Driver Analysis
(millions of dollars)
Margins– Industry refining margins decreased earnings by $1,100 million, as the increased supply from industry capacity additions outpaced higher global demand.
Advantaged Volume Growth – Volumes from advantaged projects increased earnings by $20 million.
Base Volume – Higher base volumes increased earnings by $150 million, driven by lower scheduled maintenance.
Structural Cost Savings– Increased earnings by $280 million.
Expenses– Remained flat.
Other – All other items, mainly driven by the absence of unfavorable inventory impacts, increased earnings by $210 million.
Timing Effects – Increased earnings by $310 million, mainly from the absence of prior year unfavorable derivatives mark-to-market impacts.
(2) Refer to page 22 for definition of Identified Items and earnings (loss) excluding Identified Items.
Corporate and Financing expenses were $759 million for the second quarter of 2025, $449 million higher than the second quarter of 2024, due to lower interest income, unfavorable foreign exchange and increased pension-related expenses.
Corporate and Financing expenses were $1,557 million for the first six months of 2025, $885 million higher than 2024, due to lower interest income, unfavorable foreign exchange and increased pension-related expenses.
Net cash provided by operating activities (U.S. GAAP)
11,550
10,560
24,503
25,224
Proceeds associated with sales of subsidiaries, property, plant & equipment, and sales and returns of investments
176
926
1,999
1,629
Cash flow from operations and asset sales (Non-GAAP)
11,726
11,486
26,502
26,853
Because of the ongoing nature of our asset management and divestment program, we believe it is useful for investors to consider proceeds associated with asset sales together with cash provided by operating activities when evaluating cash available for investment in the business and financing activities, including shareholder distributions.
Cash flow from operations and asset sales in the second quarter of 2025 was $11.7 billion, an increase of $0.2 billion from the comparable 2024 period.
Cash provided by operating activities totaled $24.5 billion for the first six months of 2025, $0.7 billion lower than 2024. Net income including noncontrolling interests was $15.4 billion, a decrease of $2.8 billion from the prior year period. The adjustment for the noncash provision of $11.8 billion for depreciation and depletion was up $1.2 billion from 2024. Changes in operational working capital were a reduction of $4.8 billion during the period. All other items net increased cash flows by $2.2 billion in 2025 versus a decrease of $0.9 billion in 2024. See the Condensed Consolidated Statement of Cash Flows for additional details.
Investing activities for the first six months of 2025 used net cash of $10.3 billion, an increase of $0.9 billion compared to the prior year. Spending for additions to property, plant and equipment of $12.2 billion was $0.9 billion higher than 2024. Proceeds from asset sales were $2.0 billion, an increase of $0.4 billion compared to the prior year. Net investments and advances decreased $0.4 billion from $0.5 billion in 2024.
Net cash used in financing activities was $22.3 billion in the first six months of 2025, including $9.8 billion for the purchase of 89.9 million shares of ExxonMobil stock, as part of the previously announced buyback program. This compares to net cash used in financing activities of $20.5 billion in the prior year. Total debt at the end of the second quarter of 2025 was $39.0 billion compared to $41.7 billion at year-end 2024. The Corporation's debt to total capital ratio was 12.6 percent at the end of the second quarter of 2025 compared to 13.4 percent at year-end 2024. The net debt to capital ratio (1) was 8.4 percent at the end of the second quarter, an increase of 1.9 percentage points from year-end 2024. The Corporation's capital allocation priorities are investing in competitively advantaged, high-return projects; maintaining a strong balance sheet; and sharing our success with our shareholders through more consistent share repurchases and a growing dividend. The Corporation distributed a total of $8.6 billion to shareholders in the first six months of 2025 through dividends.
The Corporation has access to significant capacity of long-term and short-term liquidity. Internally generated funds are expected to cover the majority of financial requirements, supplemented by long-term and short-term debt. The Corporation had undrawn short-term committed lines of credit of $0.2 billion and undrawn long-term committed lines of credit of $0.7 billion as of the end of second quarter 2025.
The Corporation, as part of its ongoing asset management program, continues to evaluate its mix of assets for potential upgrade. Because of the ongoing nature of this program, dispositions will continue to be made from time to time which will result in either gains or losses. Additionally, the Corporation continues to evaluate opportunities to enhance its business portfolio through acquisitions of assets or companies, and enters into such transactions from time to time. Key criteria for evaluating acquisitions include strategic fit, cost synergies, potential for future growth, low cost of supply, and attractive valuations. Acquisitions may be made with cash, shares of the Corporation’s common stock, or both.
Litigation and other contingencies are discussed in Note 3 to the unaudited Condensed Consolidated Financial Statements.
(1) Net debt is total debt of $39.0 billion less $14.4 billion of cash and cash equivalents excluding restricted cash . Net debt to capital ratio is net debt divided by net debt plus total equity of $270.0 billion. Total debt is the sum of notes and loans payable and long-term debt, as reported in the Consolidated Balance Sheet.
(1) Includes “Other taxes and duties” plus taxes that are included in “Production and manufacturing expenses” and “Selling, general and administrative expenses”, each from the Consolidated Statement of Income.
Total taxes were $10.6 billion for the second quarter of 2025, a decrease of $1.1 billion from 2024. Income tax expense was $3.4 billion compared to $4.1 billion in the prior year. The effective income tax rate, which is calculated based on consolidated company income taxes and ExxonMobil's share of equity company income taxes, was 34 percent, comparable with the prior year period. Total other taxes and duties decreased by $0.3 billion to $7.2 billion.
Total taxes were $21.2 billion for the first six months of 2025, a decrease of $1.4 billion from 2024. Income tax expense decreased by $1.0 billion to $6.9 billion reflecting lower commodity prices. The effective income tax rate of 34 percent was down compared to the prior year period due primarily to favorable one-time items. Total other taxes and duties decreased by $0.4 billion to $14.3 billion.
CASH CAPITAL EXPENDITURES (Non-GAAP)
Cash capital expenditures (Cash Capex) is the sum of "Additions to property, plant and equipment"; "Additional investments and advances"; and "Other investing activities including collection of advances"; reduced by "Inflows from noncontrolling interests for major projects", each from the Consolidated Statement of Cash Flows. This measure is useful for investors to understand the current period cash impact of investments in the business.
(millions of dollars)
Three Months Ended June 30,
Six Months Ended June 30,
2025
2024
2025
2024
Additions to property, plant and equipment
6,283
6,235
12,181
11,309
Additional investments and advances
319
323
472
744
Other investing activities including collection of advances
(246)
(9)
(339)
(224)
Inflows from noncontrolling interests for major projects
(23)
—
(45)
(12)
Total Cash Capex (Non-GAAP)
6,333
6,549
12,269
11,817
Cash capex in the second quarter of 2025 was $6.3 billion, down $0.2 billion from the second quarter of 2024.
(millions of dollars)
Three Months Ended June 30,
Six Months Ended June 30,
2025
2024
2025
2024
Upstream
5,669
5,351
10,662
9,456
Energy Products
162
467
540
984
Chemical Products
279
468
570
807
Specialty Products
97
82
207
163
Other
126
181
290
407
Total Cash Capex (Non-GAAP)
6,333
6,549
12,269
11,817
The Corporation plans to invest in the range of $27 billion to $29 billion in 2025. Actual spending could vary depending on the progress of individual projects and property acquisitions.
Statements related to future events; projections; descriptions of strategic, operating, and financial plans and objectives; statements of future ambitions and plans; future earnings power; potential addressable markets; and other statements of future events or conditions are forward-looking statements. Similarly, discussion of future plans related to carbon capture, transportation and storage, lower-emission fuels, hydrogen, ammonia, direct air capture, ProxximaTM systems, carbon materials, lithium, low-carbon data centers, and other future plans to reduce emissions and emission intensity of ExxonMobil, its affiliates, and third parties are dependent on future market factors, such as continued technological progress, stable policy support and timely rule-making and permitting, and represent forward-looking statements.
Actual future results, including financial and operating performance; potential earnings, cash flow, dividends or shareholder returns, including the timing and amounts of share repurchases; total capital expenditures and mix, including allocations of capital to low carbon and other new investments; realization and maintenance of structural cost reductions and efficiency gains, including the ability to offset inflationary pressure; plans to reduce future emissions and emissions intensity, including ambitions to reach Scope 1 and Scope 2 net zero from operated assets by 2050, to reach Scope 1 and 2 net zero in heritage Permian Basinunconventional operated assets by 2030 and in Pioneer Permian assets by 2035, to eliminate routine flaring in-line with World Bank Zero Routine Flaring, to reach near-zero methane emissions from operated assets and other methane initiatives; and to meet ExxonMobil’s emission reduction plans and goals, divestment and start-up plans, and associated project plans as well as technology advances, including the timing and outcome of projects to capture, transport and store CO2, produce hydrogen and ammonia, produce lower-emission fuels, produce ProxximaTM systems, produce carbon materials, produce lithium, and use plastic waste as feedstock for advanced recycling; future debt levels and credit ratings; business and project plans, timing, costs, capacities and profitability; resource recoveries and production rates; and planned Denbury and Pioneer integrated benefits, could differ materially due to a number of factors.
These include global or regional changes or imbalances in the supply and demand for oil, natural gas, petrochemicals, and feedstocks and other market factors; economic conditions and seasonal fluctuations that impact prices, differentials, and volume/mix for our products; developments or changes in local, national, or international laws, regulations, taxes, trade sanctions, trade tariffs, or policies affecting our business, such as government policies supporting lower carbon and new market investment opportunities, the punitive European taxes on the oil and gas sector and unequal support for different technological methods of emissions reduction or evolving, ambiguous and unharmonized standards imposed by various jurisdictions related to sustainability and greenhouse gas reporting; timely granting of governmental permits and certifications; uncertain impacts of deregulation on the legal and regulatory environment; changes in interest and exchange rates; variable impacts of trading activities on our margins and results each quarter; actions of co-venturers, competitors and commercial counterparties; the outcome of commercial negotiations, including final agreed terms and conditions; the outcome of competitive bidding and project awards; the ability to access debt markets on favorable terms or at all; the occurrence, pace, rate of recovery and effects of public health crises; adoption of regulatory incentives consistent with law; reservoir performance, including variability and timing factors applicable to unconventional resources, the success of new unconventional technologies, and the ability of new technologies to improve recovery relative to competitors; the level, outcome, and timing of exploration and development projects and decisions to invest in future reserves and resources; timely completion of construction projects and commencement of start-up operations, including reliance on third-party suppliers and service providers; final management approval of future projects and any changes in the scope, terms, costs or assumptions of such projects as approved; the actions of government or other actors against our core business activities and acquisitions, divestitures or financing opportunities; war, civil unrest, attacks against the company or industry, and other geopolitical or security disturbances, including disruption of land or sea transportation routes; decoupling of economies, realignment of global trade and supply chain networks, and disruptions in military alliances; expropriations, seizure, or capacity, insurance, shipping, import or export limitations imposed directly or indirectly by governments or laws; opportunities for potential acquisitions, investments or divestments and satisfaction of applicable conditions to closing, including timely regulatory approvals; the capture of efficiencies within and between business lines and the ability to maintain near-term cost reductions as ongoing efficiencies without impairing our competitive positioning; unforeseen technical or operating difficulties and unplanned maintenance; the development and competitiveness of alternative energy and emission reduction technologies; consumer preferences including willingness and ability to pay for reduced emission products; the results of research programs and the ability to bring new technologies to commercial scale on a cost-competitive basis; and other factors discussed under "Item 1A. Risk Factors" of ExxonMobil’s 2024 Form 10-K.
Forward-looking and other statements regarding environmental and other sustainability efforts and aspirations are not an indication that these statements are material to investors or require disclosure in our filing with the SEC or any other regulatory authority. In addition, historical, current, and forward-looking environmental and other sustainability-related statements may be based on standards for measuring progress that are still developing, internal controls and processes that continue to evolve, and assumptions that are subject to change in the future, including future rule-making.
Actions needed to advance ExxonMobil’s 2030 greenhouse gas emission-reductions plans are incorporated into its medium-term business plans, which are updated annually. The reference case for planning beyond 2030 is based on ExxonMobil’s Global Outlook (Outlook) research and publication. The Outlook is reflective of the existing global policy environment and an assumption of increasing policy stringency and technology improvement to 2050. Current trends for policy stringency and development of lower-emission solutions are not yet on a pathway to achieve net-zero by 2050. As such, the Outlook does not project the degree of required future policy and technology advancement and deployment for the world, or ExxonMobil, to meet net zero by 2050. As future policies and technology advancements emerge, they will be incorporated into the Outlook, and ExxonMobil’s business plans will be updated accordingly. References to projects or opportunities may not reflect investment decisions made by ExxonMobil or its affiliates. Individual projects or opportunities may advance based on a number of factors, including availability of stable and supportive policy, permitting, technological advancement for cost-effective abatement, insights from the Corporate planning process, and alignment with our partners and other stakeholders. Capital investment guidance in lower-emission investments is based on our Corporate plan; however, actual investment levels will be subject to the availability of the opportunity set and public policy support, and focused on returns.
The term “project” as used in this report can refer to a variety of different activities and does not necessarily have the same meaning as in any government payment transparency reports.
ITEM 3. QUANTITATIVE AND QUALITATIVE DISCLOSURES ABOUT MARKET RISK
Information about market risks for the six months ended June 30, 2025, does not differ materially from that discussed under Item 7A of the registrant's Annual Report on Form 10-K for 2024.
ITEM 4. CONTROLS AND PROCEDURES
As indicated in the certifications in Exhibit 31 of this report, the Corporation’s Chief Executive Officer, Chief Financial Officer and Principal Accounting Officer have evaluated the Corporation’s disclosure controls and procedures as of June 30, 2025. Based on that evaluation, these officers have concluded that the Corporation’s disclosure controls and procedures are effective in ensuring that information required to be disclosed by the Corporation in the reports that it files or submits under the Securities Exchange Act of 1934, as amended, is accumulated and communicated to them in a manner that allows for timely decisions regarding required disclosures and are effective in ensuring that such information is recorded, processed, summarized and reported within the time periods specified in the Securities and Exchange Commission’s rules and forms. There were no changes during the Corporation’s last fiscal quarter that materially affected, or are reasonably likely to materially affect, the Corporation’s internal control over financial reporting.
PART II. OTHER INFORMATION
ITEM 1. LEGAL PROCEEDINGS
ExxonMobil has elected to use a $1 million threshold for disclosing environmental proceedings.
As reported in the Corporation’s Form 10-Q for the first quarter of 2025, on December 11, 2024, the Fifth Circuit affirmed the judgment of the United States District Court for the Southern District of Texas assessing a $14.25 million penalty against ExxonMobil related to alleged Clean Air Act and other violations at the Baytown complex. On March 11, 2025, ExxonMobil filed a petition for review with the U.S. Supreme Court. On June 30, 2025, the U.S. Supreme Court denied ExxonMobil’s petition for review. The penalty award is now final and will be paid to the United States Treasury.
Refer to the relevant portions of Note 3 of this Quarterly Report on Form 10-Q for further information on legal proceedings.
ITEM 2. UNREGISTERED SALES OF EQUITY SECURITIES AND USE OF PROCEEDS
Issuer Purchases of Equity Securities for Quarter Ended June 30, 2025
Total Number
of Shares
Purchased (1)
Average
Price Paid
per Share (2)
Total Number of Shares Purchased as Part of Publicly Announced Plans or Programs(3)
Approximate Dollar Value of Shares that May Yet Be Purchased Under the Program
(Billions of dollars) (4)
April 2025
15,755,246
$106.66
15,753,442
$33.5
May 2025
15,966,137
$105.40
15,942,442
$31.8
June 2025
14,766,153
$108.39
14,764,209
$30.2
Total
46,487,536
$106.78
46,460,093
(1) Includes shares withheld from participants in the Corporation's incentive program for personal income taxes.
(2) Excludes 1% U.S. excise tax on stock repurchases.
(3) Purchases were made under terms intended to qualify for exemption under Rules 10b-18 and 10b5-1.
(4) The Corporation continued its share repurchase program, originally initiated in 2022. In its 2024 Corporate Plan Update released December 11, 2024, the Corporation stated that it expects to continue its share repurchase program with a $20 billion repurchase pace per year through 2026, assuming reasonable market conditions.
During the second quarter, the Corporation did not issue or sell any unregistered equity securities.
ITEM 5. OTHER INFORMATION
During the three months ended June 30, 2025, none of the Corporation’s directors or officers adopted or terminated a “Rule 10b5-1 trading arrangement” or “non-Rule 10b5-1 trading arrangement,” as each term is defined in Item 408(a) of Regulation S-K.
Section 1350 Certification (pursuant to Sarbanes-Oxley Section 906) by Principal Accounting Officer.
101*
Interactive Data Files (formatted as Inline XBRL).
104*
Cover Page Interactive Data File (formatted as Inline XBRL and contained in Exhibit 101).
* Filed herewith.
** Furnished herewith.
39
SIGNATURE
Pursuant to the requirements of the Securities Exchange Act of 1934, the Registrant has duly caused this report to be signed on its behalf by the undersigned, thereunto duly authorized.
EXXON MOBIL CORPORATION
Date: August 4, 2025
By:
/s/ LEN M. FOX
Len M. Fox
Vice President, Controller and Tax (Principal Accounting Officer)