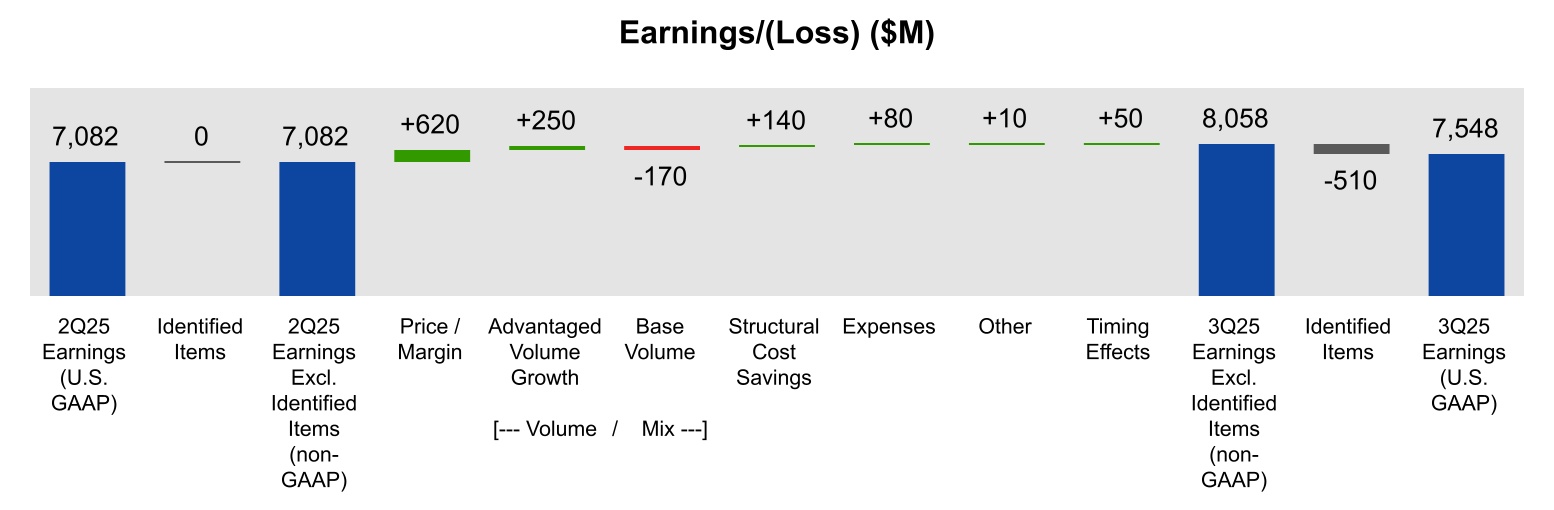
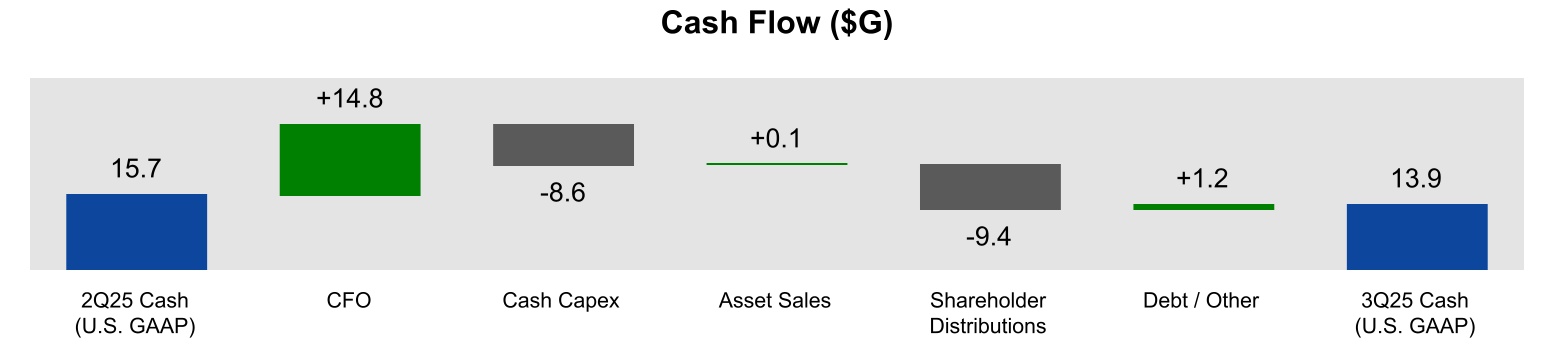
•Generated strong third-quarter earnings of $7.5 billion and cash flow from operations of $14.8 billion
•Returned $9.4 billion to shareholders in the quarter and increased fourth-quarter dividend to $1.03 per share
•Advanced growth ambitions with Permian acreage acquisitions, carbon materials market expansion, and computing power investments
•Started up eight of 10 key projects to date in 2025; remaining projects on track
Results Summary
3Q25
2Q25
Change vs 2Q25
Dollars in millions (except per share data)
YTD 2025
YTD 2024
Change vs YTD 2024
7,548
7,082
+466
Earnings (U.S. GAAP)
22,343
26,070
-3,727
8,058
7,082
+976
Earnings Excluding Identified Items (non-GAAP)
22,853
26,070
-3,217
1.76
1.64
+0.12
Earnings Per Common Share ¹
5.16
6.12
-0.96
1.88
1.64
+0.24
Earnings Excluding Identified Items Per Common Share (non-GAAP) ¹
5.28
6.12
-0.84
SPRING, Texas – October 31, 2025 – Exxon Mobil Corporation today announced third-quarter 2025 earnings of $7.5 billion, or $1.76 per share assuming dilution. Cash flow from operating activities was $14.8 billion and free cash flow was $6.3 billion. Shareholder distributions totaled $9.4 billion, including $4.2 billion of dividends and $5.1 billion of share repurchases, consistent with the company's announced plans.
“ExxonMobil had a strong third quarter, continuing to demonstrate that we are truly in a league of our own,” said Darren Woods, ExxonMobil chairman and chief executive officer.
“We delivered the highest earnings per share we've had compared to other quarters in a similar oil-price environment.2 In Guyana, we broke records with quarterly production surpassing 700,000 barrels per day, and started up the Yellowtail development four months early and under budget. In the Permian, we also set another production record of nearly 1.7 million oil-equivalent barrels per day, while continuing to expand the use of proprietary technologies like our lightweight proppant that improves well recoveries by up to 20%. We’ve now started up eight of our 10 key 2025 projects, with the remaining two on track. No one else in our industry is executing at this scale, with this level of innovation, or delivering this kind of value.”
1 Assuming dilution.
2 Based on comparison to periods within the last 10 years, when actual historical Brent ranged from $65/bbl to $75/bbl.
1
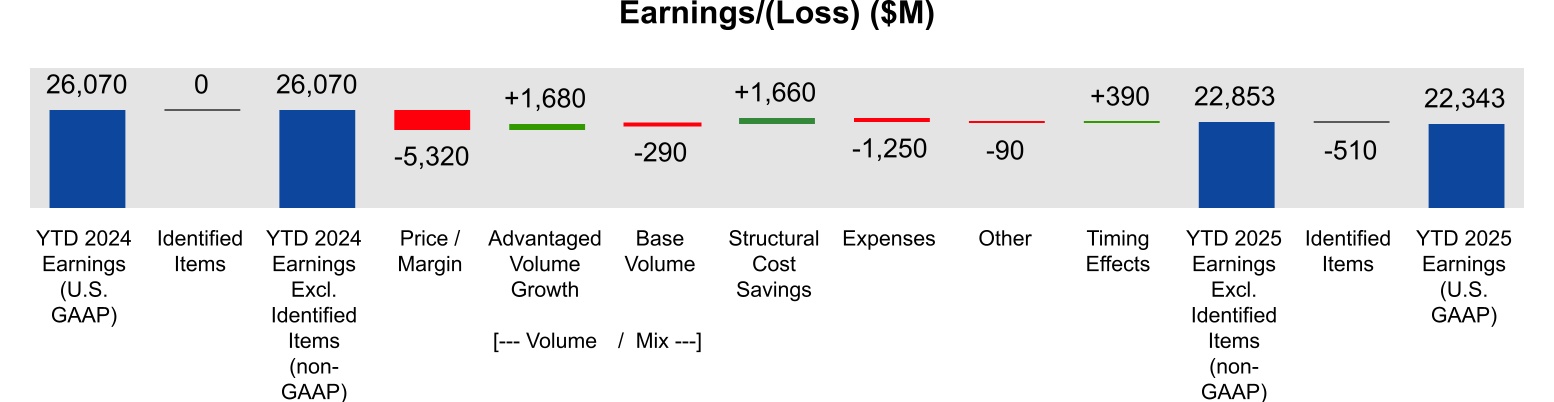
Year-to-date Earnings Driver Analysis
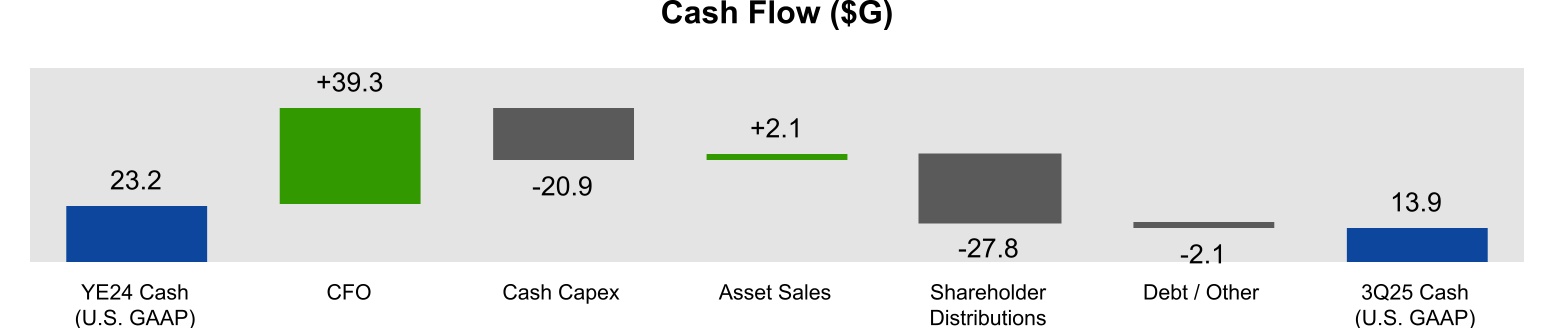
YE24 Cash (U.S. GAAP) to 3Q25 Cash Flow
Financial Highlights
•Year-to-date earnings totaled $22.3 billion compared to $26.1 billion in the same period last year. Earnings excluding identified items related to restructuring costs were $22.9 billion, versus $26.1 billion in the prior year. Weaker crude prices, bottom-of-cycle chemical margins, higher depreciation, growth costs, and lower base volumes from strategic divestments decreased earnings. These impacts were partially offset by advantaged volume growth in the Permian and Guyana, additional structural cost savings, and favorable timing effects.
•The company surpassed $14 billion in cumulative Structural Cost Savings since 2019, with an additional $2.2 billion achieved in 2025. The company is on track to achieve more than $18 billion in cumulative Structural Cost Savings by the end of 2030.
•The company generated strong year-to-date cash flow from operations of $39.3 billion and free cash flow of $20.6 billion. Shareholder distributions of $27.8 billion included $12.9 billion of dividends and $14.9 billion of share repurchases, consistent with the company's plan to repurchase $20 billion of shares this year.
•The Corporation declared a fourth-quarter dividend of $1.03 per share, an increase of 4%, payable on December 10, 2025, to shareholders of record of Common Stock at the close of business on November 14, 2025. The company has grown its annual dividend-per-share payments for 43 consecutive years.
•The company's industry-leading debt-to-capital and net-debt-to-capital ratio were 13.5% and 9.5%, respectively, with a period-end cash balance of $13.9 billion.1
•Cash capital expenditures were $8.6 billion in the third quarter, including $2.4 billion in growth acquisitions. Year-to-date spending is $20.9 billion, of which $20.9 billion was for additions to property, plant and equipment. Excluding acquisitions, the company expects full-year cash capital expenditures slightly below the lower end of the $27 billion to $29 billion guidance range.
1 Net debt is total debt of $42.0 billion less $13.8 billion of cash and cash equivalents excluding restricted cash. Net-debt to-capital ratio is net debt divided by the sum of net debt and total equity of $268.2 billion. Period-end cash balance includes cash and cash equivalents including restricted cash. ExxonMobil has lower net debt-to-capital and debt-to-capital than all IOCs. Net debt-to-capital and debt-to-capital are sourced from Bloomberg. Figures are actuals for IOCs that reported results on or before October 30, 2025, or estimated using Bloomberg consensus as of October 30, 2025.
•Upstream year-to-date earnings were $17.8 billion, a decrease of $1.1 billion compared to the same period last year. Lower earnings from weaker crude realizations and higher depreciation from Tengiz were largely offset by advantaged volume growth in the Permian and Guyana, structural cost savings, and favorable foreign exchange, tax impacts, and timing effects. Year-to-date net production was 4.7 million oil-equivalent barrels per day, highlighted by a new quarterly production record in both the Permian, with nearly 1.7 million oil-equivalent barrels per day, and Guyana, where gross production exceeded 700,000 oil-equivalent barrels per day.
•Third-quarter earnings were $5.7 billion, an increase of $277 million from the second quarter. Earnings improved from advantaged volumes, driven by record production in Guyana and the Permian, structural cost savings, and stronger crude realizations. These gains were partially offset by lower base volumes. Third-quarter net production increased by 139,000 oil-equivalent barrels per day to 4.8 million oil-equivalent barrels per day.
•The Yellowtail project was brought online in the third quarter, four months ahead of schedule. As the largest of four Guyana developments to date, Yellowtail is expected to add an initial annual average production of 250,000 oil-equivalent barrels per day, increasing total installed capacity in Guyana to over 900,000 oil-equivalent barrels per day. Additionally, the company made the final investment decision on its seventh project in the Stabroek block, Hammerhead, which is expected to add an additional 150,000 oil-equivalent barrels per day of production by 2029.
•The company acquired more than 80,000 additional net acres in the Permian Basin from Sinochem Petroleum in the third quarter. The transaction provides opportunities to further deploy the company's innovative technology, leading to greater returns.
•The company commissioned its next-generation supercomputer, Discovery 6, developed in collaboration with Hewlett Packard Enterprise and NVIDIA. This advanced supercomputer accelerates the company's ability to process, analyze, and act on reservoir and exploration data.
•Energy Products year-to-date 2025 earnings were $4.0 billion, an increase of $402 million versus the same period last year despite weaker industry refining margins. Increases in earnings were driven by structural cost savings and record refinery throughput1, supported by lower scheduled maintenance and advantaged projects growth, partially offset by higher expenses related to growth projects.
•Third-quarter earnings were $1.8 billion, an increase of $474 million from the second quarter. The earnings improvement was driven by stronger industry refining margins due to supply disruptions, as well as higher volumes from record refinery throughput1 and advantaged projects growth. These gains were partially offset by unfavorable foreign exchange and tax impacts.
•Chemical Products year-to-date earnings were $1.1 billion, a decrease of $1.4 billion versus the first three quarters of 2024. Results were impacted by weaker margins and higher China Chemical Complex related expenses, partially offset by structural cost savings and record high-value product sales2.
•Third-quarter earnings of $515 million increased $222 million compared to the second quarter. Higher margins, record high-value product sales2, and lower expenses were partially offset by unfavorable regional volume mix.
1 Highest global refining throughput year-to-date and quarterly on a same-site basis since the merger of Exxon and Mobil.
2 Based on comparing year-to-date and quarterly high-value product sales since 2019.
•Specialty Products continued to deliver strong earnings from its portfolio of high-value products. Year-to-date earnings were $2.2 billion, a decrease of $131 million compared to the same period last year. Higher expenses, including spending on carbon materials market development and ProxximaTM systems, and unfavorable foreign exchange were partially offset by structural cost savings.
•Third-quarter earnings of $740 million were down $40 million from the prior quarter. Weaker margins and lower seasonal volumes were partially offset by lower expenses and favorable foreign exchange.
•The company announced the acquisition of key assets from Superior Graphite, a leader in the graphite and specialty carbon market. This acquisition advances entry into the battery anode materials market by leveraging Superior Graphite's furnace technology to accelerate progress toward advanced graphite production.
•Corporate and Financing year-to-date net charges were $2.8 billion compared to $1.2 billion in the prior year. Excluding identified items related to restructuring costs, year-to-date net charges of $2.3 billion increased $1.1 billion compared to the same period last year due to lower interest income, unfavorable foreign exchange, and increased pension-related expenses. Higher net charges were partially offset by favorable tax impacts.
•Third-quarter net charges of $1.2 billion increased $467 million versus the second quarter. Excluding identified items related to restructuring costs, net charges were $716 million, which were comparable to the second quarter.
5
CASH FLOW FROM OPERATIONS AND ASSET SALES EXCLUDING WORKING CAPITAL
3Q25
2Q25
Dollars in millions (unless otherwise noted)
YTD 2025
YTD 2024
7,768
7,354
Net income/(loss) including noncontrolling interests
23,155
27,108
6,475
6,101
Depreciation and depletion (includes impairments)
18,278
16,857
(152)
(3,970)
Changes in operational working capital, excluding cash and debt
(5,000)
(274)
697
2,065
Other
2,858
(898)
14,788
11,550
Cash Flow from Operating Activities (U.S. GAAP)
39,291
42,793
139
176
Proceeds from asset sales and returns of investments
2,138
1,756
14,927
11,726
Cash Flow from Operations and Asset Sales (non-GAAP)
41,429
44,549
152
3,970
Less: Changes in operational working capital, excluding cash and debt
5,000
274
15,079
15,696
Cash Flow from Operations and Asset Sales excluding Working Capital (non-GAAP)
46,429
44,823
(139)
(176)
Less: Proceeds from asset sales and returns of investments
(2,138)
(1,756)
14,940
15,520
Cash Flow from Operations excluding Working Capital (non-GAAP)
44,291
43,067
FREE CASH FLOW
3Q25
2Q25
Dollars in millions (unless otherwise noted)
YTD 2025
YTD 2024
14,788
11,550
Cash Flow from Operating Activities (U.S. GAAP)
39,291
42,793
(8,727)
(6,283)
Additions to property, plant and equipment
(20,908)
(17,469)
(501)
(319)
Additional investments and advances
(973)
(1,038)
610
246
Other investing activities including collection of advances
949
311
139
176
Proceeds from asset sales and returns of investments
2,138
1,756
23
23
Inflows from noncontrolling interest for major projects
68
12
6,332
5,393
Free Cash Flow (non-GAAP)
20,565
26,365
6
CASH CAPITAL EXPENDITURES
3Q25
2Q25
Dollars in millions (unless otherwise noted)
YTD 2025
YTD 2024
8,727
6,283
Additions to property, plant and equipment
20,908
17,469
501
319
Additional investments and advances
973
1,038
(610)
(246)
Other investing activities including collection of advances
(949)
(311)
(23)
(23)
Inflows from noncontrolling interests for major projects
(68)
(12)
8,595
6,333
Total Cash Capital Expenditures (non-GAAP)
20,864
18,184
3Q25
2Q25
Dollars in millions (unless otherwise noted)
YTD 2025
YTD 2024
Upstream
5,843
3,407
United States
12,233
8,123
1,771
2,262
Non-U.S.
6,043
6,283
7,614
5,669
Total
18,276
14,406
Energy Products
182
154
United States
463
536
260
8
Non-U.S.
519
1,064
442
162
Total
982
1,600
Chemical Products
180
171
United States
505
426
95
108
Non-U.S.
340
875
275
279
Total
845
1,301
Specialty Products
65
43
United States
160
67
44
54
Non-U.S.
156
190
109
97
Total
316
257
Other
155
126
Other
445
620
8,595
6,333
Worldwide
20,864
18,184
7
CALCULATION OF STRUCTURAL COST SAVINGS
Dollars in billions (unless otherwise noted)
Twelve Months Ended December 31,
Nine Months Ended September 30,
2019
2024
2024
2025
Components of Operating Costs
From ExxonMobil’s Consolidated Statement of Income (U.S. GAAP)
Production and manufacturing expenses
36.8
39.6
28.8
30.3
Selling, general and administrative expenses
11.4
10.0
7.4
8.1
Depreciation and depletion (includes impairments)
19.0
23.4
16.9
18.3
Exploration expenses, including dry holes
1.3
0.8
0.6
0.5
Non-service pension and postretirement benefit expense
1.2
0.1
0.1
0.3
Subtotal
69.7
74.0
53.7
57.4
ExxonMobil’s share of equity company expenses (non-GAAP)
9.1
9.6
7.1
7.8
Total Adjusted Operating Costs (non-GAAP)
78.8
83.6
60.8
65.3
Total Adjusted Operating Costs (non-GAAP)
78.8
83.6
60.8
65.3
Less:
Depreciation and depletion (includes impairments)
19.0
23.4
16.9
18.3
Non-service pension and postretirement benefit expense
1.2
0.1
0.1
0.3
Other adjustments (includes equity company depreciation and depletion)
3.6
3.7
2.5
3.7
Total Cash Operating Expenses (Cash Opex) (non-GAAP)
55.0
56.4
41.3
43.0
Energy and production taxes (non-GAAP)
11.0
13.9
10.3
11.2
Total Cash Operating Expenses (Cash Opex) excluding Energy and Production Taxes (non-GAAP)
44.0
42.5
31.0
31.8
Change vs 2019
Change vs 2024
Estimated Cumulative vs 2019
Total Cash Operating Expenses (Cash Opex) excluding Energy and Production Taxes (non-GAAP)
-1.5
+0.8
Market
+4.0
+0.5
Activity / Other
+6.6
+2.5
Structural Cost Savings
-12.1
-2.2
-14.3
This press release references Structural Cost Savings, which describes decreases in cash opex excluding energy and production taxes as a result of operational efficiencies, workforce reductions, divestment-related reductions, and other cost-saving measures, that are expected to be sustainable compared to 2019 levels. Relative to 2019, estimated cumulative Structural Cost Savings totaled $14.3 billion, which included an additional $2.2 billion in the first nine months of 2025. The total change between periods in expenses above will reflect both Structural Cost Savings and other changes in spend, including market drivers, such as inflation and foreign exchange impacts, as well as changes in activity levels and costs associated with new operations, mergers and acquisitions, new business venture development, and early-stage projects. Structural Cost Savings from new operations, mergers and acquisitions, and new business venture developments are included in the cumulative Structural Cost Savings. Estimates of cumulative annual Structural Cost Savings may be revised depending on whether cost reductions realized in prior periods are determined to be sustainable compared to 2019 levels. Structural Cost Savings are stewarded internally to support management's oversight of spending over time. This measure is useful for investors to understand the Corporation's efforts to optimize spending through disciplined expense management.
8
ExxonMobil will discuss financial and operating results and other matters during a webcast at 8:30 a.m. Central Time on October 31, 2025. To listen to the event or access an archived replay, please visit www.exxonmobil.com.
Selected Earnings Driver Definitions
Advantaged volume growth. Represents earnings impact from change in volume/mix from advantaged assets, advantaged projects, and high-value products. See frequently used terms on page 11 for definitions of advantaged assets, advantaged projects, and high-value products.
Base volume. Represents and includes all volume/mix drivers not included in advantaged volume growth driver defined above.
Structural cost savings. Represents after-tax earnings effect of Structural Cost Savings as defined on page 8, including cash operating expenses related to divestments.
Expenses. Represents and includes all expenses otherwise not included in other earnings drivers.
Timing effects. Represents timing effects that are primarily related to unsettled derivatives (mark-to-market) and other earnings impacts driven by timing differences between the settlement of derivatives and their offsetting physical commodity realizations (due to LIFO inventory accounting).
Cautionary Statement
Statements related to future events; projections; descriptions of strategic, operating, and financial plans and objectives; statements of future ambitions, future earnings power, potential addressable markets, or plans; and other statements of future events or conditions in this release, are forward-looking statements. Similarly, discussion of future carbon capture, transportation and storage, as well as lower-emission fuels, hydrogen, ammonia, lithium, direct air capture, ProxximaTM systems, carbon materials, low-carbon data centers, and other low carbon and new business plans to reduce emissions of ExxonMobil, its affiliates, and third parties, are dependent on future market factors, such as continued technological progress, stable policy support and timely rule-making and permitting, and represent forward-looking statements. Actual future results, including financial and operating performance; potential earnings, cash flow, or rate of return; total capital expenditures and mix, including allocations of capital to low carbon and other new investments; realization and maintenance of structural cost reductions and efficiency gains, including the ability to offset inflationary pressure; plans to reduce future emissions and emissions intensity; ambitions to reach Scope 1 and Scope 2 net zero from operated assets by 2050, to reach Scope 1 and 2 net zero in heritage Permian Basin unconventional operated assets by 2030 and in Pioneer Permian assets by 2035, to eliminate routine flaring in-line with World Bank Zero Routine Flaring, to reach near-zero methane emissions from its operated assets and other methane initiatives, and to meet ExxonMobil’s emission reduction goals and plans, divestment and start-up plans, and associated project plans as well as technology advances, including the timing and outcome of projects to capture and store CO2, produce hydrogen and ammonia, produce lower-emission fuels, produce lithium, produce ProxximaTM systems, create new advanced carbon materials, and use plastic waste as feedstock for advanced recycling; cash flow, dividends and shareholder returns, including the timing and amounts of share repurchases; future debt levels and credit ratings; business and project plans, timing, costs, capacities and returns; resource recoveries and production rates; and planned Pioneer and Denbury integrated benefits, could differ materially due to a number of factors. These include global or regional changes or imbalances in the supply and demand for oil, natural gas, petrochemicals, and feedstocks and other market factors, economic conditions and seasonal fluctuations that impact prices, differentials, and volume/mix for our products; changes in any part of the world in laws, taxes, or regulations including extraterritorial environmental and tax regulations, trade sanctions, and timely granting of governmental permits and certifications; developments or changes in government policies supporting lower carbon and new market investment opportunities or policies limiting the attractiveness of future investment such as the additional European taxes on the energy sector and unequal support for different methods of emissions reduction; variable impacts of trading activities on our margins and results each quarter; changes in interest and exchange rates; actions of competitors and commercial counterparties; the outcome of commercial negotiations, including final agreed terms and conditions; the ability to access debt markets; the ultimate impacts of public health crises, including the effects of government responses on people and economies; reservoir performance, including variability and timing factors applicable to unconventional resources, the success of new unconventional technologies, and the ability of new technologies to improve the recovery relative to competitors; the level and outcome of exploration projects and decisions to invest in future reserves; timely completion of development and other construction projects and commencement of start-up operations, including reliance on third-party suppliers and service providers; final management approval of future projects and any changes in the scope, terms, or costs of such projects as approved; government regulation of our growth opportunities; war, civil unrest, attacks against the company or industry and other political or security disturbances; expropriations, seizure, or capacity, insurance, export, import or shipping limitations by foreign governments or laws; changes in market, national or regional tariffs or realignment of global trade and supply chain networks; opportunities for potential acquisitions, investments or divestments and satisfaction of applicable conditions to closing, including timely regulatory approvals; the capture of efficiencies within and between business lines and the ability to maintain near-term cost reductions as ongoing efficiencies without impairing our competitive positioning; unforeseen technical or operating difficulties and unplanned maintenance; the development and competitiveness of alternative energy and emission reduction technologies; the results of research programs and the ability to bring new technologies to commercial scale on a cost-competitive basis; and other factors discussed under Item 1A. Risk Factors of ExxonMobil’s 2024 Form 10-K.
9
Actions needed to advance ExxonMobil’s 2030 greenhouse gas emission-reductions plans are incorporated into its medium-term business plans, which are updated annually. The reference case for planning beyond 2030 is based on ExxonMobil’s Global Outlook (Outlook) research and publication. The Outlook is reflective of the existing global policy environment and an assumption of increasing policy stringency and technology improvement to 2050. Current trends for policy stringency and deployment of lower-emission solutions are not yet on a pathway to achieve net-zero by 2050. As such, the Outlook does not project the degree of required future policy and technology advancement and deployment for the world, or ExxonMobil, to meet net zero by 2050. As future policies and technology advancements emerge, they will be incorporated into the Outlook, and ExxonMobil's business plans will be updated accordingly. References to projects or opportunities may not reflect investment decisions made by ExxonMobil or its affiliates. Individual projects or opportunities may advance based on a number of factors, including availability of stable and supportive policy, permitting, technological advancement for cost-effective abatement, insights from the company planning process, and alignment with our partners and other stakeholders. Capital investment guidance in lower-emission investments is based on our corporate plan; however, actual investment levels will be subject to the availability of the opportunity set and public policy support, and focused on returns.
Frequently Used Terms and Non-GAAP Measures
This press release includes cash flow from operations and asset sales (non-GAAP). Because of the regular nature of our asset management and divestment program, the company believes it is useful for investors to consider proceeds associated with the sales of subsidiaries, property, plant and equipment, and sales and returns of investments together with cash provided by operating activities when evaluating cash available for investment in the business and financing activities. A reconciliation to net cash provided by operating activities for the 2024 and 2025 periods is shown on page 6.
This press release also includes cash flow from operations excluding working capital (non-GAAP), and cash flow from operations and asset sales excluding working capital (non-GAAP). The company believes it is useful for investors to consider these numbers in comparing the underlying performance of the company's business across periods when there are significant period-to-period differences in the amount of changes in working capital. A reconciliation to net cash provided by operating activities for the 2024 and 2025 periods is shown on page 6.
This press release also includes Earnings/(Loss) Excluding Identified Items (non-GAAP), which are earnings/(loss) excluding individually significant non-operational events with, typically, an absolute corporate total earnings impact of at least $250 million in a given quarter. The earnings/(loss) impact of an identified item for an individual segment may be less than $250 million when the item impacts several periods or several segments. Earnings/(loss) excluding Identified Items does include non-operational earnings events or impacts that are generally below the $250 million threshold utilized for identified items. When the effect of these events is significant in aggregate, it is indicated in analysis of period results as part of quarterly earnings press release and teleconference materials. Management uses these figures to improve comparability of the underlying business across multiple periods by isolating and removing significant non-operational events from business results. The Corporation believes this view provides investors increased transparency into business results and trends and provides investors with a view of the business as seen through the eyes of management. Earnings excluding Identified Items is not meant to be viewed in isolation or as a substitute for net income/(loss) attributable to ExxonMobil as prepared in accordance with U.S. GAAP. A reconciliation to each of corporate earnings and segment earnings are shown for 2025 and 2024 periods in Attachments II-a and II-b. Earnings per share amounts are shown on page 1 and in Attachment II-a, including a reconciliation to earnings/(loss) per common share – assuming dilution (U.S. GAAP).
This press release also includes total taxes including sales-based taxes. This is a broader indicator of the total tax burden on the Corporation’s products and earnings, including certain sales and value-added taxes imposed on and concurrent with revenue-producing transactions with customers and collected on behalf of governmental authorities (“sales-based taxes”). It combines “Income taxes” and “Total other taxes and duties” with sales-based taxes, which are reported net in the income statement. The company believes it is useful for the Corporation and its investors to understand the total tax burden imposed on the Corporation’s products and earnings. A reconciliation to total taxes is shown in Attachment I-a.
This press release also references free cash flow (non-GAAP). Free cash flow is the sum of net cash provided by operating activities, net cash flow used in investing activities excluding cash acquired from mergers and acquisitions, and inflows from noncontrolling interests for major projects from financing activities. This measure is useful when evaluating cash available for financing activities, including shareholder distributions, after investment in the business. Free cash flow is not meant to be viewed in isolation or as a substitute for net cash provided by operating activities. A reconciliation to net cash provided by operating activities for the 2024 and 2025 periods is shown on page 6.
This press release also references total cash capital expenditures (non-GAAP). Cash capital expenditures are the sum of additions to property, plant and equipment; additional investments and advances; and other investing activities including collection of advances; reduced by inflows from noncontrolling interests for major projects, each from the Consolidated Statement of Cash Flows. The company believes it is a useful measure for investors to understand the cash impact of investments in the business, which is in line with standard industry practice. A breakdown of cash capex is shown on page 7.
References to resources or resource base may include quantities of oil and natural gas classified as proved reserves, as well as quantities that are not yet classified as proved reserves, but that are expected to be ultimately recoverable. The term “resource base” or similar terms are not intended to correspond to SEC definitions such as “probable” or “possible” reserves.
10
A reconciliation of production excluding divestments, entitlements, and government mandates to actual production is contained in the Supplement to this release included as .2 to the Form 8-K filed the same day as this news release.
The term “project” as used in this news release can refer to a variety of different activities and does not necessarily have the same meaning as in any government payment transparency reports. Projects or plans may not reflect investment decisions made by the company. Individual opportunities may advance based on a number of factors, including availability of supportive policy, technology for cost-effective abatement, and alignment with our partners and other stakeholders. The company may refer to these opportunities as projects in external disclosures at various stages throughout their progression.
Advantaged assets (Advantaged growth projects) when used in reference to the Upstream business, includes Permian, Guyana, and LNG.
Advantaged projects refers to capital projects and programs of work that contribute to Energy, Chemical, and/or Specialty Products segments that drive integration of segments/businesses, increase yield of higher value products, or deliver higher than average returns.
Base portfolio (Base) in our Upstream segment, refers to assets (or volumes) other than advantaged assets (or volumes from advantaged assets). In our Energy Products segment, refers to assets (or volumes) other than advantaged projects (or volumes from advantaged projects). In our Chemical Products and Specialty Products segments, refers to volumes other than high-value products volumes.
Compound annual growth rate (CAGR) represents the consistent rate at which an investment or business result would have grown had the investment or business result compounded at the same rate each year.
Debt-to-capital ratio is total debt divided by the sum of total debt and equity. Total debt is the sum of notes and loans payable and long-term debt, as reported in the Consolidated Balance Sheet.
Government mandates (curtailments) are changes to ExxonMobil’s sustainable production levels as a result of production limits or sanctions imposed by governments.
High-value products include performance products and lower-emission fuels.
Lower-emission fuels are fuels with lower life cycle emissions than conventional transportation fuels for gasoline, diesel and jet transport.
Net-debt-to-capital ratio is net debt divided by the sum of net debt and total equity, where net debt is total debt net of cash and cash equivalents, excluding restricted cash. Total debt is the sum of notes and loans payable and long-term debt, as reported in the consolidated balance sheet.
Performance products (performance chemicals, performance lubricants) refer to products that provide differentiated performance for multiple applications through enhanced properties versus commodity alternatives and bring significant additional value to customers and end-users.
Total shareholder return (TSR) is defined by FactSet and measures the change in value of an investment in common stock over a specified period of time, assuming dividend reinvestment. FactSet assumes dividends are reinvested in stock at market prices on the ex-dividend date. Unless stated otherwise, total shareholder return is quoted on an annualized basis.
This press release also references Structural Cost Savings, for more details see page 8.
Unless otherwise indicated, year-to-date (“YTD”) means as of the last business day of the most recent fiscal quarter.
Reference to Earnings
References to corporate earnings mean net income attributable to ExxonMobil (U.S. GAAP) from the consolidated income statement. Unless otherwise indicated, references to earnings, Upstream, Energy Products, Chemical Products, Specialty Products and Corporate and Financing earnings, and earnings per share are ExxonMobil’s share after excluding amounts attributable to noncontrolling interests.
Exxon Mobil Corporation has numerous affiliates, many with names that include ExxonMobil, Exxon, Mobil, Esso, and XTO. For convenience and simplicity, those terms and terms such as Corporation, company, our, we, and its are sometimes used as abbreviated references to specific affiliates or affiliate groups. Similarly, ExxonMobil has business relationships with thousands of customers, suppliers, governments, and others. For convenience and simplicity, words such as venture, joint venture, partnership, co-venturer, and partner are used to indicate business and other relationships involving common activities and interests, and those words may not indicate precise legal relationships. ExxonMobil's ambitions, plans and goals do not guarantee any action or future performance by its affiliates or Exxon Mobil Corporation's responsibility for those affiliates' actions and future performance, each affiliate of which manages its own affairs.
Throughout this press release, both as well as .2, due to rounding, numbers presented may not add up precisely to the totals indicated.
11
ATTACHMENT I-a
CONDENSED CONSOLIDATED STATEMENT OF INCOME
(Preliminary)
Dollars in millions (unless otherwise noted)
Three Months Ended September 30,
Nine Months Ended September 30,
2025
2024
2025
2024
Revenues and other income
Sales and other operating revenue
83,331
87,792
243,866
258,189
Income from equity affiliates
1,267
1,481
4,098
5,067
Other income
696
743
1,966
2,903
Total revenues and other income
85,294
90,016
249,930
266,159
Costs and other deductions
Crude oil and product purchases
47,928
51,261
140,043
153,061
Production and manufacturing expenses
10,094
9,881
30,279
28,776
Selling, general and administrative expenses
3,032
2,296
8,100
7,359
Depreciation and depletion (includes impairments)
6,475
6,258
18,278
16,857
Exploration expenses, including dry holes
149
339
464
640
Non-service pension and postretirement benefit expense
119
33
322
90
Interest expense
90
207
440
699
Other taxes and duties
6,475
6,715
18,767
19,617
Total costs and other deductions
74,362
76,990
216,693
227,099
Income/(Loss) before income taxes
10,932
13,026
33,237
39,060
Income tax expense/(benefit)
3,164
4,055
10,082
11,952
Net income/(loss) including noncontrolling interests
7,768
8,971
23,155
27,108
Net income/(loss) attributable to noncontrolling interests
220
361
812
1,038
Net income/(loss) attributable to ExxonMobil
7,548
8,610
22,343
26,070
OTHER FINANCIAL DATA
Dollars in millions (unless otherwise noted)
Three Months Ended September 30,
Nine Months Ended September 30,
2025
2024
2025
2024
Earnings per common share (U.S. dollars)
1.76
1.92
5.16
6.12
Earnings per common share - assuming dilution (U.S. dollars)
1.76
1.92
5.16
6.12
Dividends on common stock
Total
4,242
4,240
12,865
12,333
Per common share (U.S. dollars)
0.99
0.95
2.97
2.85
Millions of common shares outstanding
Average - assuming dilution
4,285
4,462
4,328
4,260
Taxes
Income taxes
3,164
4,055
10,082
11,952
Total other taxes and duties
7,319
7,609
21,589
22,300
Total taxes
10,483
11,664
31,671
34,252
Sales-based taxes
5,487
5,174
16,246
17,062
Total taxes including sales-based taxes
15,970
16,838
47,917
51,314
ExxonMobil share of income taxes of equity companies (non-GAAP)
517
682
1,660
2,587
12
ATTACHMENT I-b
CONDENSED CONSOLIDATED BALANCE SHEET
(Preliminary)
Dollars in millions (unless otherwise noted)
September 30, 2025
December 31, 2024
ASSETS
Current assets
Cash and cash equivalents
13,814
23,029
Cash and cash equivalents – restricted
55
158
Notes and accounts receivable – net
45,285
43,681
Inventories
Crude oil, products and merchandise
23,174
19,444
Materials and supplies
4,064
4,080
Other current assets
2,113
1,598
Total current assets
88,505
91,990
Investments, advances and long-term receivables
46,138
47,200
Property, plant and equipment – net
298,388
294,318
Other assets, including intangibles – net
21,309
19,967
Total Assets
454,340
453,475
LIABILITIES
Current liabilities
Notes and loans payable
9,212
4,955
Accounts payable and accrued liabilities
65,382
61,297
Income taxes payable
3,256
4,055
Total current liabilities
77,850
70,307
Long-term debt
32,824
36,755
Postretirement benefits reserves
10,394
9,700
Deferred income tax liabilities
39,942
39,042
Long-term obligations to equity companies
1,145
1,346
Other long-term obligations
23,962
25,719
Total Liabilities
186,117
182,869
EQUITY
Common stock without par value
(9,000 million shares authorized, 8,019 million shares issued)
46,808
46,238
Earnings reinvested
480,367
470,903
Accumulated other comprehensive income
(12,782)
(14,619)
Common stock held in treasury
(3,802 million shares at September 30, 2025, and 3,666 million shares at December 31, 2024)
(253,832)
(238,817)
ExxonMobil share of equity
260,561
263,705
Noncontrolling interests
7,662
6,901
Total Equity
268,223
270,606
Total Liabilities and Equity
454,340
453,475
13
ATTACHMENT I-c
CONDENSED CONSOLIDATED STATEMENT OF CASH FLOWS
(Preliminary)
Dollars in millions (unless otherwise noted)
Nine Months Ended September 30,
2025
2024
CASH FLOWS FROM OPERATING ACTIVITIES
Net income/(loss) including noncontrolling interests
23,155
27,108
Depreciation and depletion (includes impairments)
18,278
16,857
Changes in operational working capital, excluding cash and debt
(5,000)
(274)
All other items – net
2,858
(898)
Net cash provided by operating activities
39,291
42,793
CASH FLOWS FROM INVESTING ACTIVITIES
Additions to property, plant and equipment
(20,908)
(17,469)
Proceeds from asset sales and returns of investments
2,138
1,756
Additional investments and advances
(973)
(1,038)
Other investing activities including collection of advances
949
311
Cash acquired from mergers and acquisitions
—
754
Net cash used in investing activities
(18,794)
(15,686)
CASH FLOWS FROM FINANCING ACTIVITIES
Additions to long-term debt
1,145
426
Reductions in long-term debt
(13)
(1,142)
Additions to short-term debt
758
—
Reductions in short-term debt
(4,815)
(3,835)
Additions/(Reductions) in debt with three months or less maturity
1,212
(5)
Contingent consideration payments
(79)
(27)
Cash dividends to ExxonMobil shareholders
(12,865)
(12,333)
Cash dividends to noncontrolling interests
(524)
(580)
Changes in noncontrolling interests
(340)
(313)
Inflows from noncontrolling interests for major projects
68
12
Common stock acquired
(14,894)
(13,849)
Net cash provided by (used in) financing activities
(30,347)
(31,646)
Effects of exchange rate changes on cash
532
(57)
Increase/(Decrease) in cash and cash equivalents (including restricted)
(9,318)
(4,596)
Cash and cash equivalents at beginning of period (including restricted)
23,187
31,568
Cash and cash equivalents at end of period (including restricted)