☑QUARTERLY REPORT PURSUANT TO SECTION 13 OR 15(d) OF
THE SECURITIES EXCHANGE ACT OF 1934
For the quarterly period ended September 30, 2025
or
☐TRANSITION REPORT PURSUANT TO SECTION 13 OR 15(d) OF
THE SECURITIES EXCHANGE ACT OF 1934
For the transition period from __________to__________
Commission File Number 1-2256
Exxon Mobil Corporation
(Exact name of registrant as specified in its charter)
New Jersey
13-5409005
(State or other jurisdiction of incorporation or organization)
(I.R.S. Employer Identification Number)
22777 Springwoods Village Parkway,Spring,Texas77389-1425
(Address of principal executive offices) (Zip Code)
(972)940-6000
(Registrant's telephone number, including area code)
_______________________
Securities registered pursuant to Section 12(b) of the Act:
Title of Each Class
Trading Symbol
Name of Each Exchange on Which Registered
Common Stock, without par value
XOM
New York Stock Exchange
0.524% Notes due 2028
XOM28
New York Stock Exchange
0.835% Notes due 2032
XOM32
New York Stock Exchange
1.408% Notes due 2039
XOM39A
New York Stock Exchange
Indicate by check mark whether the registrant (1) has filed all reports required to be filed by Section 13 or 15(d) of the Securities Exchange Act of 1934 during the preceding 12 months (or for such shorter period that the registrant was required to file such reports), and (2) has been subject to such filing requirements for the past 90 days.Yes ☑No ☐
Indicate by check mark whether the registrant has submitted electronically every Interactive Data File required to be submitted and posted pursuant to Rule 405 of Regulation S-T (§ 232.405 of this chapter) during the preceding 12 months (or for such shorter period that the registrant was required to submit and post such files).Yes ☑No ☐
Indicate by check mark whether the registrant is a large accelerated filer, an accelerated filer, a non-accelerated filer, smaller reporting company, or an emerging growth company. See the definitions of "large accelerated filer," "accelerated filer," "smaller reporting company," and “emerging growth company” in Rule 12b-2 of the Exchange Act.
Large accelerated filer
☑
Accelerated filer
☐
Non-accelerated filer
☐
Smaller reporting company
☐
Emerging growth company
☐
If an emerging growth company, indicate by check mark if the registrant has elected not to use the extended transition period for complying with any new or revised financial accounting standards provided pursuant to Section 13(a) of the Exchange Act.☐
Indicate by check mark whether the registrant is a shell company (as defined in Rule 12b-2 of the Exchange Act). Yes☐No ☑
Indicate the number of shares outstanding of each of the issuer's classes of common stock, as of the latest practicable date.
Class
Outstanding as of September 30, 2025
Common stock, without par value
4,217,165,614
EXXON MOBIL CORPORATION
FORM 10-Q
FOR THE QUARTERLY PERIOD ENDED SEPTEMBER 30, 2025
TABLE OF CONTENTS
PART I. FINANCIAL INFORMATION
Item 1. Financial Statements
Condensed Consolidated Statement of Income - Three and nine months ended September 30, 2025 and 2024
Non-service pension and postretirement benefit expense
119
33
322
90
Interest expense
90
207
440
699
Other taxes and duties
6,475
6,715
18,767
19,617
Total costs and other deductions
74,362
76,990
216,693
227,099
Income (loss) before income taxes
10,932
13,026
33,237
39,060
Income tax expense (benefit)
3,164
4,055
10,082
11,952
Net income (loss) including noncontrolling interests
7,768
8,971
23,155
27,108
Net income (loss) attributable to noncontrolling interests
220
361
812
1,038
Net income (loss) attributable to ExxonMobil
7,548
8,610
22,343
26,070
Earnings (loss) per common share (dollars)
1.76
1.92
5.16
6.12
Earnings (loss) per common share - assuming dilution (dollars)
1.76
1.92
5.16
6.12
(1) Includes $40 million related to the write-off of exploratory well costs in second quarter 2025 that were previously capitalized for greater than one year at December 31, 2024.
The information in the Notes to Condensed Consolidated Financial Statements is an integral part of these statements.
NOTES TO CONDENSED CONSOLIDATED FINANCIAL STATEMENTS
Note 1. Basis of Financial Statement Preparation
These unaudited Condensed Consolidated Financial Statements should be read in the context of the Consolidated Financial Statements and notes thereto filed with the Securities and Exchange Commission in the Corporation's 2024 Annual Report on Form 10-K. In the opinion of the Corporation, the information furnished herein reflects all known accruals and adjustments necessary for a fair statement of the results for the periods reported herein. All such adjustments are of a normal recurring nature.
The Corporation's exploration and production activities are accounted for under the "successful efforts" method.
Note 2. Mergers and Acquisitions
During the third quarter of 2025, the Corporation completed $2.4 billion in acquisitions consisting primarily of proved and unproved acreage in the Permian basin. One of the acquisitions was partially funded by restricted cash as it qualified as a like-kind exchange. We accounted for these acquisitions as business combinations and allocated substantially all of their fair values to "Property, plant and equipment" on the Consolidated Balance Sheet. We did not recognize any goodwill associated with the acquisitions. Consideration paid was reflected in the Condensed Consolidated Statement of Cash Flows mainly in the line item “Additions to property, plant, and equipment”.
Pioneer Natural Resources Company
On May 3, 2024, the Corporation acquired Pioneer Natural Resources Company ("Pioneer"), an independent oil and gas exploration and production company. In connection with the acquisition, we issued 545 million shares of ExxonMobil common stock having a fair value of $63 billion on the acquisition date, and assumed debt with a fair value of $5 billion.
The transaction was accounted for as a business combination in accordance with ASC 805, which requires that assets acquired and liabilities assumed be recognized at their fair values as of the acquisition date. The following table summarizes the fair values of the assets acquired and liabilities assumed.
(billions of dollars)
Pioneer
Current assets (1)
3
Other non-current assets
1
Property, plant & equipment (2)
84
Total identifiable assets acquired
88
Current liabilities (1)
3
Long-term debt (3)
5
Deferred income tax liabilities (4)
16
Other non-current liabilities
2
Total liabilities assumed
26
Net identifiable assets acquired
62
Goodwill (5)
1
Net assets
63
(1) Current assets and current liabilities consist primarily of accounts receivable and payable, with their respective fair values approximating historical values given their short-term duration, expectation of insignificant bad debt expense, and our credit rating.
(2) Property, plant and equipment, of which a significant portion relates to crude oil and natural gas properties, was primarily valued using the income approach. Significant inputs and assumptions used in the income approach included estimates for commodity prices, future oil and gas production volumes, drilling and development costs, and risk-adjusted discount rates. Collectively, these inputs are level 3 inputs.
(3) Long-term debt was valued using market prices as of the acquisition date, which reflects the use of level 1 inputs.
(4) Deferred income taxes represent the tax effects of differences in the tax basis and acquisition date fair values of assets acquired and liabilities assumed.
(5) Goodwill was allocated to the Upstream segment.
The following table presents long-term debt assumed at closing:
(millions of dollars)
Par Value
Fair Value as of May 2, 2024
0.250% Convertible Senior Notes due May 2025 (1)
450
1,327
1.125% Senior Notes due January 2026
750
699
5.100% Senior Notes due March 2026
1,100
1,096
7.200% Senior Notes due January 2028
241
252
4.125% Senior Notes due February 2028
138
130
1.900% Senior Notes due August 2030
1,100
914
2.150% Senior Notes due January 2031
1,000
832
(1) In June 2024, the Corporation redeemed in full all of the Convertible Senior Notes assumed from Pioneer for an amount consistent with the acquisition date fair value.
Actual and Pro Forma Impact of Merger
The following table presents revenues and earnings included in the Consolidated Statement of Income for Pioneer since the acquisition date (May 3, 2024) through September 30, 2024:
(millions of dollars)
Three Months Ended September 30, 2024
Nine Months Ended September 30, 2024
Sales and other operating revenues
6,291
10,663
Net income (loss) attributable to ExxonMobil
615
1,013
The following table presents unaudited pro forma information for the Corporation as if the merger with Pioneer had occurred at the beginning of January 1, 2023:
Unaudited
(millions of dollars)
Three Months Ended September 30, 2024
Nine Months Ended September 30, 2024
Sales and other operating revenues
87,792
266,349
Net income (loss) attributable to ExxonMobil
8,610
26,866
The historical financial information was adjusted to give effect to the pro forma events that were directly attributable to the merger and factually supportable. The unaudited pro forma consolidated results are not necessarily indicative of what the consolidated results of operations actually would have been had the merger been completed on January 1, 2023. In addition, the unaudited pro forma consolidated results reflect pro forma adjustments primarily related to conforming Pioneer's accounting policies to ExxonMobil, additional depreciation expense related to the fair value adjustment of the acquired property, plant and equipment, our capital structure, Pioneer's transaction-related costs, and applicable income tax impacts of the pro forma adjustments.
Our transaction costs to effect the acquisition were immaterial.
A variety of claims have been made against ExxonMobil and certain of its consolidated subsidiaries in a number of pending lawsuits. Management has regular litigation reviews, including updates from corporate and outside counsel, to assess the need for accounting recognition or disclosure of these contingencies. The Corporation accrues an undiscounted liability for those contingencies where the incurrence of a loss is probable and the amount can be reasonably estimated. If a range of amounts can be reasonably estimated and no amount within the range is a better estimate than any other amount, then the minimum of the range is accrued. The Corporation does not record liabilities when the likelihood that the liability has been incurred is probable but the amount cannot be reasonably estimated or when the liability is believed to be only reasonably possible or remote. For contingencies where an unfavorable outcome is reasonably possible and which are significant, the Corporation discloses the nature of the contingency and, where feasible, an estimate of the possible loss. For purposes of our contingency disclosures, “significant” includes material matters, as well as other matters, which management believes should be disclosed.
State and local governments and other entities in various jurisdictions across the United States and its territories have filed a number of legal proceedings against several oil and gas companies, including ExxonMobil, requesting unprecedented legal and equitable relief for various alleged injuries purportedly connected to climate change. These lawsuits assert a variety of novel, untested claims under statutory and common law. Additional such lawsuits may be filed. We believe the legal and factual theories set forth in these proceedings are meritless and represent an inappropriate attempt to use the court system to usurp the proper role of policymakers in addressing the societal challenges of climate change.
Local governments in Louisiana have filed unprecedented legal proceedings against a number of oil and gas companies, including ExxonMobil, requesting compensation for the restoration of coastal marsh erosion in the state. We believe the factual and legal theories set forth in these proceedings are meritless.
While the outcome of any litigation can be unpredictable, we believe the likelihood is remote that the ultimate outcomes of these lawsuits will have a material adverse effect on the Corporation’s operations, financial condition, or financial statements taken as a whole. We will continue to defend vigorously against these claims.
Other Contingencies
The Corporation and certain of its consolidated subsidiaries were contingently liable at September 30, 2025, for guarantees relating to notes, loans and performance under contracts. Where guarantees for environmental remediation and other similar matters do not include a stated cap, the amounts reflect management’s estimate of the maximum potential exposure. Where it is not possible to make a reasonable estimation of the maximum potential amount of future payments, future performance is expected to be either immaterial or have only a remote chance of occurrence.
September 30, 2025
(millions of dollars)
Equity Company
Obligations(1)
Other Third-Party Obligations
Total
Guarantees
Debt-related
—
47
47
Other
670
6,157
6,827
Total
670
6,204
6,874
(1) ExxonMobil share.
Additionally, the Corporation and its affiliates have numerous long-term sales and purchase commitments in their various business activities, all of which are expected to be fulfilled with no adverse consequences material to the Corporation’s operations or financial condition.
Current period change excluding amounts reclassified from accumulated other comprehensive income (1)
32
(34)
(2)
Amounts reclassified from accumulated other comprehensive income
—
32
32
Total change in accumulated other comprehensive income
32
(2)
30
Balance as of September 30, 2024
(13,024)
1,065
(11,959)
Balance as of December 31, 2024
(16,166)
1,547
(14,619)
Current period change excluding amounts reclassified from accumulated other comprehensive income (1)
1,851
(49)
1,802
Amounts reclassified from accumulated other comprehensive income
—
35
35
Total change in accumulated other comprehensive income
1,851
(14)
1,837
Balance as of September 30, 2025
(14,315)
1,533
(12,782)
(1) Cumulative Foreign Exchange Translation Adjustment includes net investment hedge gain/(loss) net of taxes of $(300) million and $8 million in 2025 and 2024, respectively.
Amounts Reclassified Out of Accumulated Other
Comprehensive Income - Before-tax Income/(Expense)
(millions of dollars)
Three Months Ended September 30,
Nine Months Ended September 30,
2025
2024
2025
2024
Amortization and settlement of postretirement benefits reserves adjustment included in net periodic benefit costs
(Statement of Income line: Non-service pension and postretirement benefit expense)
The estimated fair value of financial instruments and derivatives at September 30, 2025 and December 31, 2024, and the related hierarchy level for the fair value measurement was as follows:
September 30, 2025
(millions of dollars)
Fair Value
Level 1
Level 2
Level 3
Total Gross Assets & Liabilities
Effect of Counterparty Netting
Effect of Collateral Netting
Difference in Carrying Value and Fair Value
Net Carrying Value
Assets
Derivative assets (1)
6,312
1,602
—
7,914
(7,037)
(141)
—
736
Advances to/receivables from equity companies (2)(6)
—
1,931
4,847
6,778
—
—
258
7,036
Other long-term financial assets (3)
1,508
—
1,559
3,067
—
—
250
3,317
Liabilities
Derivative liabilities(4)
6,381
1,388
—
7,769
(7,037)
(213)
—
519
Long-term debt(5)
25,221
2,811
—
28,032
—
—
2,726
30,758
Long-term obligations to equity companies(6)
—
—
1,181
1,181
—
—
(36)
1,145
Other long-term financial liabilities(7)
—
—
406
406
—
—
13
419
December 31, 2024
(millions of dollars)
Fair Value
Level 1
Level 2
Level 3
Total Gross Assets & Liabilities
Effect of Counterparty Netting
Effect of Collateral Netting
Difference in Carrying Value and Fair Value
Net Carrying Value
Assets
Derivative assets (1)
3,223
1,206
—
4,429
(3,913)
(3)
—
513
Advances to/receivables from equity companies (2)(6)
—
2,466
4,167
6,633
—
—
451
7,084
Other long-term financial assets (3)
1,468
—
1,504
2,972
—
—
247
3,219
Liabilities
Derivative liabilities(4)
3,561
1,416
—
4,977
(3,913)
(341)
—
723
Long-term debt(5)
28,884
1,813
—
30,697
—
—
3,935
34,632
Long-term obligations to equity companies(6)
—
—
1,393
1,393
—
—
(47)
1,346
Other long-term financial liabilities (7)
—
—
583
583
—
—
57
640
(1) Included in the Balance Sheet lines: Notes and accounts receivable - net and Other assets, including intangibles - net.
(2) Included in the Balance Sheet line: Investments, advances and long-term receivables.
(3) Included in the Balance Sheet lines: Investments, advances and long-term receivables and Other assets, including intangibles - net.
(4) Included in the Balance Sheet lines: Accounts payable and accrued liabilities and Other long-term obligations.
(5) Excluding finance lease obligations.
(6) Advances to/receivables from equity companies and long-term obligations to equity companies are mainly designated as hierarchy level 3 inputs. The fair value is calculated by discounting the remaining obligations by a rate consistent with the credit quality and industry of the equity company.
(7) Included in the Balance Sheet line: Other long-term obligations. Includes contingent consideration related to a prior year acquisition where fair value is based on expected drilling activities and discount rates.
At September 30, 2025 and December 31, 2024, respectively, the Corporation had $836 million and $491 million of collateral under master netting arrangements not offset against the derivatives on the Condensed Consolidated Balance Sheet, primarily related to initial margin requirements.
The Corporation may use non-derivative financial instruments, such as its foreign currency-denominated debt, as hedges of its net investments in certain foreign subsidiaries. Under this method, the change in the carrying value of the financial instruments due to foreign exchange fluctuations is reported in accumulated other comprehensive income. As of September 30, 2025, the Corporation has designated $3.5 billion of its Euro-denominated debt and related accrued interest as a net investment hedge of its European business. The net investment hedge is deemed to be perfectly effective.
The Corporation had undrawn short-term committed lines of credit of $0.2 billion and undrawn long-term committed lines of credit of $0.4 billion as of the end of third quarter 2025. On October 2, 2025, the Corporation established a 364-day revolving credit facility of $7.0 billion to provide short-term borrowing capacity for general corporate purposes.
Derivative Instruments
The Corporation’s size, strong capital structure, geographic diversity, and the complementary nature of its business segments reduce the Corporation’s enterprise-wide risk from changes in commodity prices, currency rates, and interest rates. In addition, the Corporation uses commodity-based contracts, including derivatives, to manage commodity price risk and to generate returns from trading. Commodity contracts held for trading purposes are presented in the Condensed Consolidated Statement of Income on a net basis in the line “Sales and other operating revenue" and in the Consolidated Statement of Cash Flows in “Cash Flows from Operating Activities”. The Corporation’s commodity derivatives are not accounted for under hedge accounting. At times, the Corporation also enters into currency and interest rate derivatives, none of which are material to the Corporation’s financial position as of September 30, 2025 and December 31, 2024, or results of operations for the periods ended September 30, 2025 and 2024.
The Corporation operates a program to hedge certain of its fixed-rate debt instruments against changes in fair value due to changes in the designated benchmark interest rate. This program utilizes fair value hedge accounting. The derivative (hedging) instruments are fixed-for-floating interest rate swaps, with settlement dates that correspond to the interest payments associated with the fixed-rate debt (hedged item). Changes in the fair values of the hedging instruments are perfectly offset by changes in the fair values of the hedged items; the effects of these changes in fair values are recorded in "Interest expense" in the Consolidated Statement of Income. This program was not material to the Consolidated Financial Statements as of the end of third quarter 2025.
Credit risk associated with the Corporation’s derivative position is mitigated by several factors, including the use of derivative clearing exchanges and the quality of and financial limits placed on derivative counterparties. The Corporation maintains a system of controls that includes the authorization, reporting, and monitoring of derivative activity.
The net notional long/(short) position of derivative instruments at September 30, 2025 and December 31, 2024, was as follows:
(millions)
September 30, 2025
December 31, 2024
Crude oil (barrels)
(24)
13
Petroleum products (barrels)
(28)
(32)
Natural gas (MMBTUs)
(709)
(675)
Realized and unrealized gains/(losses) on derivative instruments that were recognized in the Condensed Consolidated Statement of Income are included in the following lines on a before-tax basis:
Note 8. Disclosures about Segments and Related Information
(millions of dollars)
Upstream
Energy Products
Chemical Products
Specialty Products
Segment Total
U.S.
Non-U.S.
U.S.
Non-U.S.
U.S.
Non-U.S.
U.S.
Non-U.S.
Three Months Ended September 30, 2025
Revenues and other income
Sales and other operating revenue
7,185
3,252
25,635
37,073
1,868
3,837
1,398
3,063
83,311
Income from equity affiliates
4
1,048
31
45
45
172
2
(10)
1,337
Intersegment revenue
6,601
9,372
4,946
7,185
1,744
896
562
121
31,427
Other income
231
97
37
38
1
9
7
32
452
Segment revenues and other income
14,021
13,769
30,649
44,341
3,658
4,914
1,969
3,206
116,527
Costs and other items
Crude oil and product purchases
6,212
2,189
26,542
35,597
1,989
3,409
982
2,077
78,997
Operating expenses, excl. depreciation and depletion (1)
2,780
2,341
1,903
2,181
1,085
1,079
504
546
12,419
Depreciation and depletion (includes impairments)
3,265
1,813
216
185
151
179
26
45
5,880
Interest expense
34
15
4
11
—
1
—
1
66
Other taxes and duties
33
561
825
4,924
23
57
3
49
6,475
Total costs and other deductions
12,324
6,919
29,490
42,898
3,248
4,725
1,515
2,718
103,837
Segment income (loss) before income taxes
1,697
6,850
1,159
1,443
410
189
454
488
12,690
Income tax expense (benefit)
469
2,219
239
350
81
(5)
100
92
3,545
Segment net income (loss) incl. noncontrolling interests
1,228
4,631
920
1,093
329
194
354
396
9,145
Net income (loss) attributable to noncontrolling interests
—
180
62
111
—
8
—
10
371
Segment income (loss)
1,228
4,451
858
982
329
186
354
386
8,774
Reconciliation of consolidated revenues
Segment revenues and other income
116,527
Other revenues (2)
194
Elimination of intersegment revenues
(31,427)
Total consolidated revenues and other income
85,294
Reconciliation of income (loss) attributable to ExxonMobil
Total segment income (loss)
8,774
Corporate and Financing income (loss)
(1,226)
Net income (loss) attributable to ExxonMobil
7,548
(millions of dollars)
Upstream
Energy Products
Chemical Products
Specialty Products
Segment Total
U.S.
Non-U.S.
U.S.
Non-U.S.
U.S.
Non-U.S.
U.S.
Non-U.S.
Three Months Ended September 30, 2025
Additions to property, plant and equipment (3)
6,654
3,215
181
245
167
98
62
39
10,661
As of September 30, 2025
Investments in equity companies
5,302
19,592
460
977
2,991
2,707
—
788
32,817
Total assets
153,531
134,975
34,909
47,259
17,417
18,570
2,655
8,543
417,859
Reconciliation to Corporate Total
Segment Total
Corporate and Financing
Corporate Total
Three Months Ended September 30, 2025
Additions to property, plant and equipment (3)
10,661
612
11,273
As of September 30, 2025
Investments in equity companies
32,817
(142)
32,675
Total assets
417,859
36,481
454,340
(1) Operating expenses, excl. depreciation and depletion includes the following GAAP line items, as reflected on the Income Statement: Production and manufacturing expenses; Selling, general and administrative expenses; Exploration expenses, including dry holes; and Non-service pension and postretirement benefit expense.
(2) Primarily Corporate and Financing Interest revenue of $281 million.
(3) Includes non-cash additions.
Due to rounding, numbers presented may not add up precisely to the totals indicated.
Operating expenses, excl. depreciation and depletion (1)
2,727
2,603
1,841
2,156
1,337
1,008
480
548
12,700
Depreciation and depletion (includes impairments)
3,200
2,032
198
186
151
118
22
39
5,946
Interest expense
24
11
2
5
1
—
—
1
44
Other taxes and duties
60
691
882
4,990
31
20
3
39
6,716
Total costs and other deductions
11,766
7,929
30,358
46,552
3,610
4,331
1,507
2,829
108,882
Segment income (loss) before income taxes
2,136
7,551
764
1,030
492
639
506
532
13,650
Income tax expense (benefit)
450
2,825
201
183
125
101
131
107
4,123
Segment net income (loss) incl. noncontrolling interests
1,686
4,726
563
847
367
538
375
425
9,527
Net income (loss) attributable to noncontrolling interests
—
254
46
55
—
12
—
6
373
Segment income (loss)
1,686
4,472
517
792
367
526
375
419
9,154
Reconciliation of consolidated revenues
Segment revenues and other income
122,532
Other revenues (2)
413
Elimination of intersegment revenues
(32,929)
Total consolidated revenues and other income
90,016
Reconciliation of income (loss) attributable to ExxonMobil
Total segment income (loss)
9,154
Corporate and Financing income (loss)
(544)
Net income (loss) attributable to ExxonMobil
8,610
(millions of dollars)
Upstream
Energy Products
Chemical Products
Specialty Products
Segment Total
U.S.
Non-U.S.
U.S.
Non-U.S.
U.S.
Non-U.S.
U.S.
Non-U.S.
Three Months Ended September 30, 2024
Additions to property, plant and equipment (3)
2,697
1,949
143
335
114
279
45
57
5,619
As of December 31, 2024
Investments in equity companies
4,884
21,396
444
915
3,016
2,649
—
814
34,118
Total assets
154,914
134,609
32,143
43,399
17,445
17,692
2,882
8,040
411,124
Reconciliation to Corporate Total
Segment Total
Corporate and Financing
Corporate Total
Three Months Ended September 30, 2024
Additions to property, plant and equipment (3)
5,619
564
6,183
As of December 31, 2024
Investments in equity companies
34,118
(108)
34,010
Total assets
411,124
42,351
453,475
(1) Operating expenses, excl. depreciation and depletion includes the following GAAP line items, as reflected on the Income Statement: Production and manufacturing expenses; Selling, general and administrative expenses; Exploration expenses, including dry holes; and Non-service pension and postretirement benefit expense.
(2) Primarily Corporate and Financing Interest revenue of $383 million.
(3) Includes non-cash additions.
Due to rounding, numbers presented may not add up precisely to the totals indicated.
Operating expenses, excl. depreciation and depletion (1)
8,259
7,102
5,925
6,612
3,244
3,357
1,486
1,672
37,657
Depreciation and depletion (includes impairments)
9,659
5,235
609
528
444
439
80
126
17,120
Interest expense
93
37
3
13
—
1
—
3
150
Other taxes and duties
146
1,631
2,442
14,230
57
118
6
137
18,767
Total costs and other deductions
34,331
21,461
86,142
125,577
10,024
13,543
4,624
8,119
303,821
Segment income (loss) before income taxes
5,700
21,172
2,744
3,049
1,031
256
1,255
1,499
36,706
Income tax expense (benefit)
1,390
7,149
597
696
192
(8)
287
275
10,578
Segment net income (loss) incl. noncontrolling interests
4,310
14,023
2,147
2,353
839
264
968
1,224
26,128
Net income (loss) attributable to noncontrolling interests
—
496
167
300
—
22
1
16
1,002
Segment income (loss)
4,310
13,527
1,980
2,053
839
242
967
1,208
25,126
Reconciliation of consolidated revenues
Segment revenues and other income
340,527
Other revenues (2)
799
Elimination of intersegment revenues
(91,396)
Total consolidated revenues and other income
249,930
Reconciliation of income (loss) attributable to ExxonMobil
Total segment income (loss)
25,126
Corporate and Financing income (loss)
(2,783)
Net income (loss) attributable to ExxonMobil
22,343
(millions of dollars)
Upstream
Energy Products
Chemical Products
Specialty Products
Segment Total
U.S.
Non-U.S.
U.S.
Non-U.S.
U.S.
Non-U.S.
U.S.
Non-U.S.
Nine Months Ended September 30, 2025
Additions to property, plant and equipment (3)
12,481
7,259
442
731
473
316
150
142
21,994
As of September 30, 2025
Investments in equity companies
5,302
19,592
460
977
2,991
2,707
—
788
32,817
Total assets
153,531
134,975
34,909
47,259
17,417
18,570
2,655
8,543
417,859
Reconciliation to Corporate Total
Segment Total
Corporate and Financing
Corporate Total
Nine Months Ended September 30, 2025
Additions to property, plant and equipment (3)
21,994
1,663
23,657
As of September 30, 2025
Investments in equity companies
32,817
(142)
32,675
Total assets
417,859
36,481
454,340
(1) Operating expenses, excl. depreciation and depletion includes the following GAAP line items, as reflected on the Income Statement: Production and manufacturing expenses; Selling, general and administrative expenses; Exploration expenses, including dry holes; and Non-service pension and postretirement benefit expense.
(2) Primarily Corporate and Financing Interest revenue of $956 million.
(3) Includes non-cash additions.
Due to rounding, numbers presented may not add up precisely to the totals indicated.
Operating expenses, excl. depreciation and depletion (1)
7,059
7,943
5,888
6,470
3,522
3,188
1,375
1,630
37,075
Depreciation and depletion (includes impairments)
7,834
6,106
591
553
454
337
66
112
16,053
Interest expense
98
44
5
8
1
1
—
2
159
Other taxes and duties
262
1,991
2,575
14,534
50
59
5
142
19,618
Total costs and other deductions
28,320
23,697
93,124
140,715
10,590
13,316
4,697
8,680
323,139
Segment income (loss) before income taxes
6,647
22,933
2,503
2,501
1,824
1,322
1,619
1,295
40,644
Income tax expense (benefit)
1,477
8,604
541
413
427
227
392
201
12,282
Segment net income (loss) incl. noncontrolling interests
5,170
14,329
1,962
2,088
1,397
1,095
1,227
1,094
28,362
Net income (loss) attributable to noncontrolling interests
—
607
159
260
—
35
1
14
1,076
Segment income (loss)
5,170
13,722
1,803
1,828
1,397
1,060
1,226
1,080
27,286
Reconciliation of consolidated revenue
Segment revenues and other income
363,783
Other revenues (2)
1,545
Elimination of intersegment revenues
(99,169)
Total consolidated revenues and other income
266,159
Reconciliation of income (loss) attributable to ExxonMobil
Total segment income (loss)
27,286
Corporate and Financing income (loss)
(1,216)
Net income (loss) attributable to ExxonMobil
26,070
(millions of dollars)
Upstream
Energy Products
Chemical Products
Specialty Products
Segment Total
U.S.
Non-U.S.
U.S.
Non-U.S.
U.S.
Non-U.S.
U.S.
Non-U.S.
Nine Months Ended September 30, 2024
Additions to property, plant and equipment (3)
91,609
6,087
445
1,001
318
812
103
179
100,554
As of December 31, 2024
Investments in equity companies
4,884
21,396
444
915
3,016
2,649
—
814
34,118
Total assets
154,914
134,609
32,143
43,399
17,445
17,692
2,882
8,040
411,124
Reconciliation to Corporate Total
Segment Total
Corporate and Financing
Corporate Total
Nine Months Ended September 30, 2024
Additions to property, plant and equipment (3)
100,554
1,507
102,061
As of December 31, 2024
Investments in equity companies
34,118
(108)
34,010
Total assets
411,124
42,351
453,475
(1) Operating expenses, excl. depreciation and depletion includes the following GAAP line items, as reflected on the Income Statement: Production and manufacturing expenses; Selling, general and administrative expenses; Exploration expenses, including dry holes; and Non-service pension and postretirement benefit expense.
(2) Primarily Corporate and Financing Interest revenue of $1,290 million.
(3) Includes non-cash additions.
Due to rounding, numbers presented may not add up precisely to the totals indicated.
Sales and other operating revenue include both revenue within the scope of ASC 606 and outside the scope of ASC 606. Trade receivables in "Notes and accounts receivable – net" reported on the Balance Sheet also includes both receivables within the scope of ASC 606 and those outside the scope of ASC 606. Revenue and receivables outside the scope of ASC 606 primarily relate to physically settled commodity contracts accounted for as derivatives. Contractual terms, credit quality, and type of customer are generally similar between those revenues and receivables within the scope of ASC 606 and those outside it.
Sales and other operating revenue
(millions of dollars)
Three Months Ended September 30,
Nine Months Ended September 30,
2025
2024
2025
2024
Revenue from contracts with customers
58,992
63,594
172,603
186,194
Revenue outside the scope of ASC 606
24,339
24,198
71,263
71,995
Total
83,331
87,792
243,866
258,189
Geographic Sales and Other Operating Revenue
(millions of dollars)
Three Months Ended September 30,
Nine Months Ended September 30,
2025
2024
2025
2024
United States
36,105
36,302
105,148
103,853
Non-U.S.
47,226
51,490
138,718
154,336
Total
83,331
87,792
243,866
258,189
Significant Non-U.S. revenue sources include: (1)
Canada
6,989
7,777
20,783
22,958
(1)Revenue is determined by primary country of operations. Excludes certain sales and other operating revenues in non-U.S. operations where attribution to a specific country is not practicable.
Note 9. Divestment Activities
Through September 30, 2025, the Corporation realized proceeds of approximately $2.1 billion and net after-tax earnings of approximately $0.4 billion from its divestment activities. This included the sale of certain conventional and unconventional assets in the United States, Mobil Argentina S.A., as well as other smaller divestments.
In 2024, the Corporation realized proceeds of approximately $5.0 billion and recognized net after-tax earnings of approximately $1.0 billion from its divestment activities. This included the sale of the Santa Ynez Unit and associated facilities in California, Mobil Producing Nigeria Unlimited, ExxonMobil Exploration Argentina, the Fos-sur-Mer Refinery (France), the Adriatic LNG terminal (Italy), and certain conventional and unconventional assets in the United States, as well as other smaller divestments.
ITEM 2. MANAGEMENT'S DISCUSSION AND ANALYSIS OF FINANCIAL CONDITION AND RESULTS OF OPERATIONS
Overview
During the third quarter of 2025, the price of crude oil increased slightly relative to second quarter 2025, remaining near the middle of the 10-year historical range (2010-2019) supported by strong demand despite increased OPEC+ supply. Natural gas prices remained at the top of the 10-year range on robust global demand. Global industry refining margins moved toward the top of the 10-year historical range in the third quarter, impacted by industry supply outages coupled with strong demand. Chemical margins remained at bottom of cycle, well below the 10-year range, with continued industry oversupply.
During 2025, the U.S. announced a variety of trade-related actions, including the imposition of tariffs on imports from several countries. In response, many countries announced their own retaliatory tariffs. Despite the current uncertainty as to what effects these actions will ultimately have on the Corporation, our suppliers and our customers, as well as on the overall macroeconomic environment, we do not anticipate any material near-term financial impacts.
Selected Earnings Driver Definitions
The earnings drivers provide additional visibility into our business results. The Corporation evaluates these drivers periodically to determine if any enhancements may provide helpful insights to the market. Listed below are descriptions of the earnings drivers:
Advantaged Volume Growth. Represents earnings impacts from change in volume/mix from advantaged assets, advantaged projects, and high-value products.
•Advantaged Assets (Advantaged growth projects). Includes Permian, Guyana, and LNG.
•Advantaged Projects. Includes capital projects and programs of work that contribute to Energy, Chemical, and/or Specialty Products segments that drive integration of segments/businesses, increase yield of higher value products, or deliver higher than average returns.
•High-Value Products. Includes performance products and lower-emission fuels. Performance products (performance chemicals, performance lubricants) refers to products that provide differentiated performance for multiple applications through enhanced properties versus commodity alternatives and bring significant additional value to customers and end-users. Lower-emission fuels refers to fuels with lower life cycle emissions than conventional transportation fuels for gasoline, diesel and jet transport.
Base Volume. Represents all volume/mix drivers not included in Advantaged Volume Growth defined above.
Structural Cost Savings. Represents after-tax earnings effects of Structural Cost Savings as defined on page 23, including cash operating expenses related to divestments.
Expenses. Represents all expenses otherwise not included in other earnings drivers.
Timing Effects. Represents timing effects that are primarily related to unsettled derivatives (mark-to-market) and other earnings impacts driven by timing differences between the settlement of derivatives and their offsetting physical commodity realizations (due to LIFO inventory accounting).
Earnings (loss) excluding Identified Items are earnings (loss) excluding individually significant non-operational events with, typically, an absolute corporate total earnings impact of at least $250 million in a given quarter. The earnings (loss) impact of an Identified Item for an individual segment may be less than $250 million when the item impacts several segments or several periods. Earnings (loss) excluding Identified Items does include non-operational earnings events or impacts that are generally below the $250 million threshold utilized for Identified Items. Management uses these figures to improve comparability of the underlying business across multiple periods by isolating and removing significant non-operational events from business results. The Corporation believes this view provides investors increased transparency into business results and trends, and provides investors with a view of the business as seen through the eyes of management. Earnings (loss) excluding Identified Items is not meant to be viewed in isolation or as a substitute for net income (loss) attributable to ExxonMobil as prepared in accordance with U.S. GAAP.
References in this discussion to Corporate earnings (loss) mean net income (loss) attributable to ExxonMobil (U.S. GAAP) from the Condensed Consolidated Statement of Income. Unless otherwise indicated, references to earnings (loss); Upstream, Energy Products, Chemical Products, Specialty Products, and Corporate and Financing earnings (loss); and earnings (loss) per share are ExxonMobil's share after excluding amounts attributable to noncontrolling interests.
Due to rounding, numbers presented may not add up precisely to the totals indicated.
Structural Cost Savings describes decreases in cash opex excluding energy and production taxes as a result of operational efficiencies, workforce reductions, divestment-related reductions, and other cost-savings measures that are expected to be sustainable compared to 2019 levels. Relative to 2019, estimated cumulative Structural Cost Savings totaled $14.3 billion, which included an additional $2.2 billion in the first nine months of 2025. The total change between periods in expenses below will reflect both Structural Cost Savings and other changes in spend, including market factors, such as inflation and foreign exchange impacts, as well as changes in activity levels and costs associated with new operations, mergers and acquisitions, new business venture development, and early-stage projects. Structural Cost Savings from new operations, mergers and acquisitions, and new business venture developments are included in the cumulative Structural Cost Savings. Estimates of cumulative annual structural savings may be revised depending on whether cost reductions realized in prior periods are determined to be sustainable compared to 2019 levels. Structural Cost Savings are stewarded internally to support management's oversight of spending over time. This measure is useful for investors to understand the Corporation's efforts to optimize spending through disciplined expense management.
Dollars in billions (unless otherwise noted)
Twelve Months Ended December 31,
Nine Months Ended September 30,
2019
2024
2024
2025
Components of Operating Costs
From ExxonMobil’s Consolidated Statement of Income (U.S. GAAP)
Production and manufacturing expenses
36.8
39.6
28.8
30.3
Selling, general and administrative expenses
11.4
10.0
7.4
8.1
Depreciation and depletion (includes impairments)
19.0
23.4
16.9
18.3
Exploration expenses, including dry holes
1.3
0.8
0.6
0.5
Non-service pension and postretirement benefit expense
1.2
0.1
0.1
0.3
Subtotal
69.7
74.0
53.7
57.4
ExxonMobil’s share of equity company expenses (Non-GAAP)
9.1
9.6
7.1
7.8
Total Adjusted Operating Costs (Non-GAAP)
78.8
83.6
60.8
65.3
Total Adjusted Operating Costs (Non-GAAP)
78.8
83.6
60.8
65.3
Less:
Depreciation and depletion (includes impairments)
19.0
23.4
16.9
18.3
Non-service pension and postretirement benefit expense
1.2
0.1
0.1
0.3
Other adjustments (includes equity company depreciation and depletion)
3.6
3.7
2.5
3.7
Total Cash Operating Expenses (Cash Opex) (Non-GAAP)
55.0
56.4
41.3
43.0
Energy and production taxes (Non-GAAP)
11.0
13.9
10.3
11.2
Total Cash Operating Expenses (Cash Opex) excluding Energy and Production Taxes (Non-GAAP)
44.0
42.5
31.0
31.8
Change
vs
2019
Change
vs
2024
Estimated Cumulative vs
2019
Total Cash Operating Expenses (Cash Opex) excluding Energy and Production Taxes (Non-GAAP)
-1.5
+0.8
Market
+4.0
+0.5
Activity / Other
+6.6
+2.5
Structural Cost Savings
-12.1
-2.2
-14.3
Due to rounding, numbers presented may not add up precisely to the totals indicated.
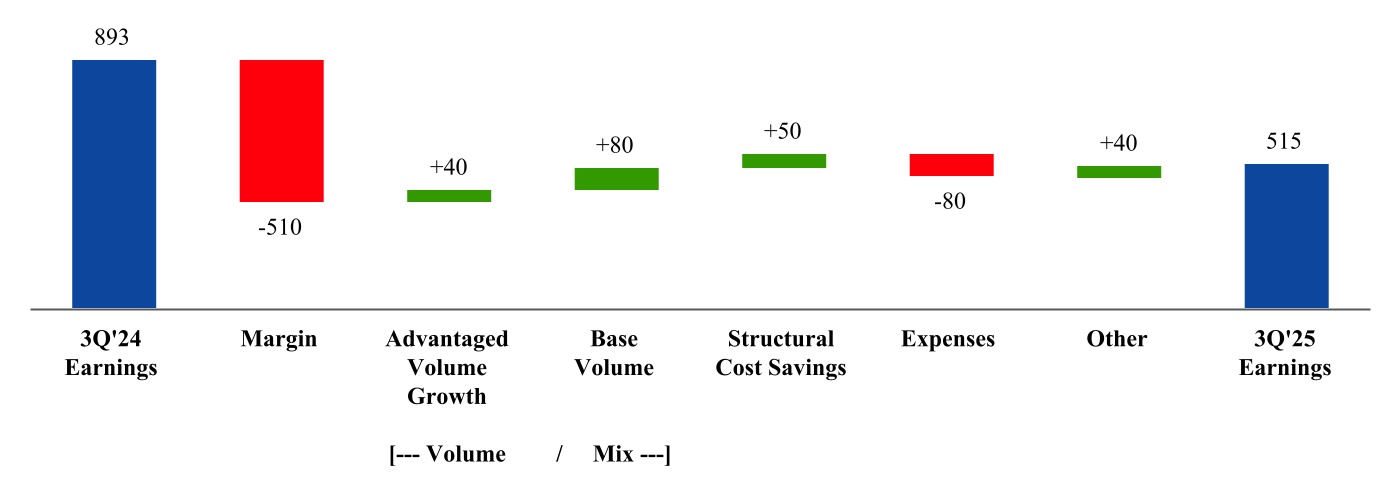
ExxonMobil’s third quarter 2025 earnings were $7.5 billion, compared to $8.6 billion a year earlier. The decrease in earnings was mainly driven by weaker crude prices, lower chemical margins, and higher expenses from growth initiatives; partly offset by stronger refining margins, increased volumes from advantaged Upstream investments in Guyana and the Permian, and Structural Cost Savings from base efficiencies and divestments. Cash capital expenditures were $8.6 billion, up $2.2 billion from third quarter 2024.
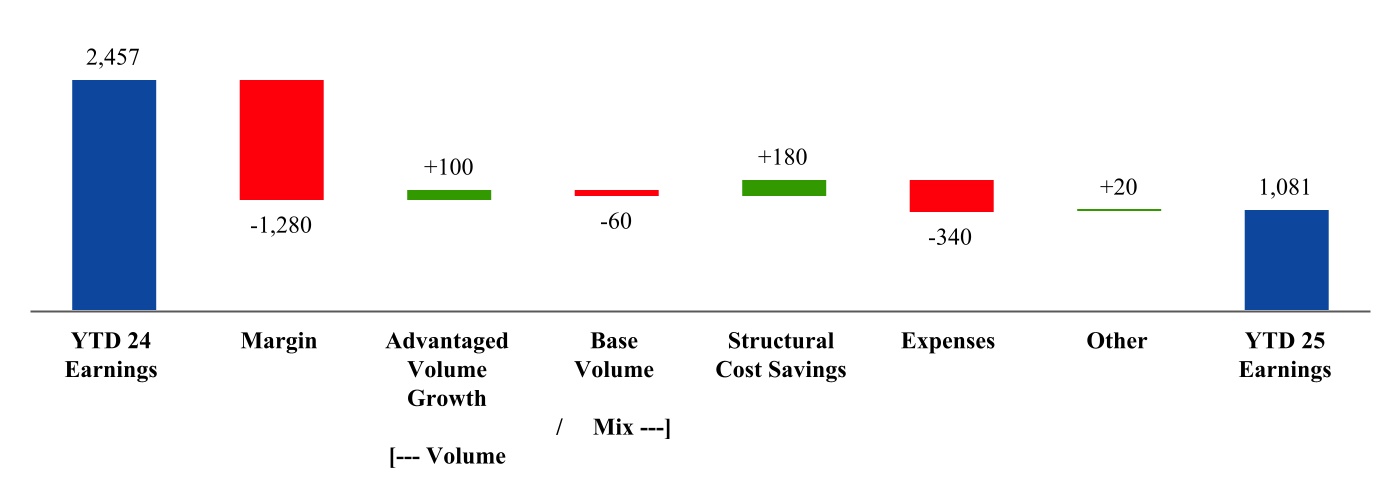
Earnings for the first nine months of 2025 were $22.3 billion, compared to $26.1 billion a year earlier. Cash capital expenditures were $20.9 billion, up $2.7 billion from the first nine months of 2024. The Corporation distributed $12.9 billion in dividends to shareholders and repurchased $14.9 billion of common stock.
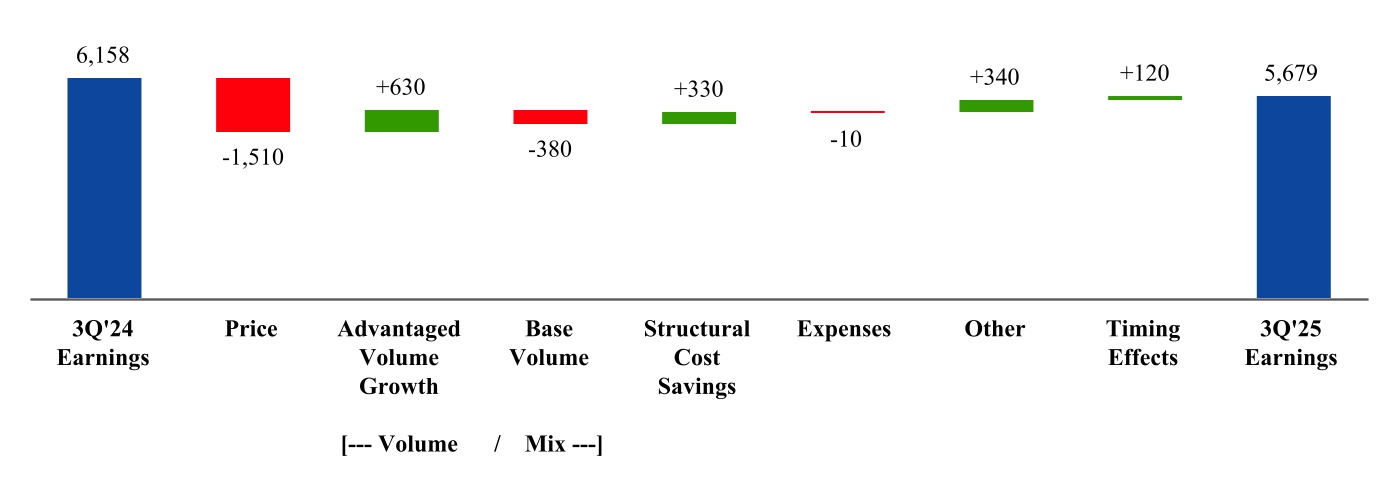
Upstream Third Quarter Earnings Driver Analysis (millions of dollars)
Price – Price impacts decreased earnings by $1,510 million, mainly driven by lower liquids realizations.
Advantaged Volume Growth – Increased earnings by $630 million, mainly driven by Permian and Guyana growth.
Base Volume – Decreased earnings by $380 million as a result of non-strategic asset divestments.
Structural Cost Savings – Increased earnings by $330 million.
Expenses – Decreased earnings by $10 million.
Other – Increased earnings by $340 million, primarily driven by one-time tax items.
Timing Effects – Increased earnings by $120 million, mainly from the absence of unfavorable derivatives mark-to-market impacts.
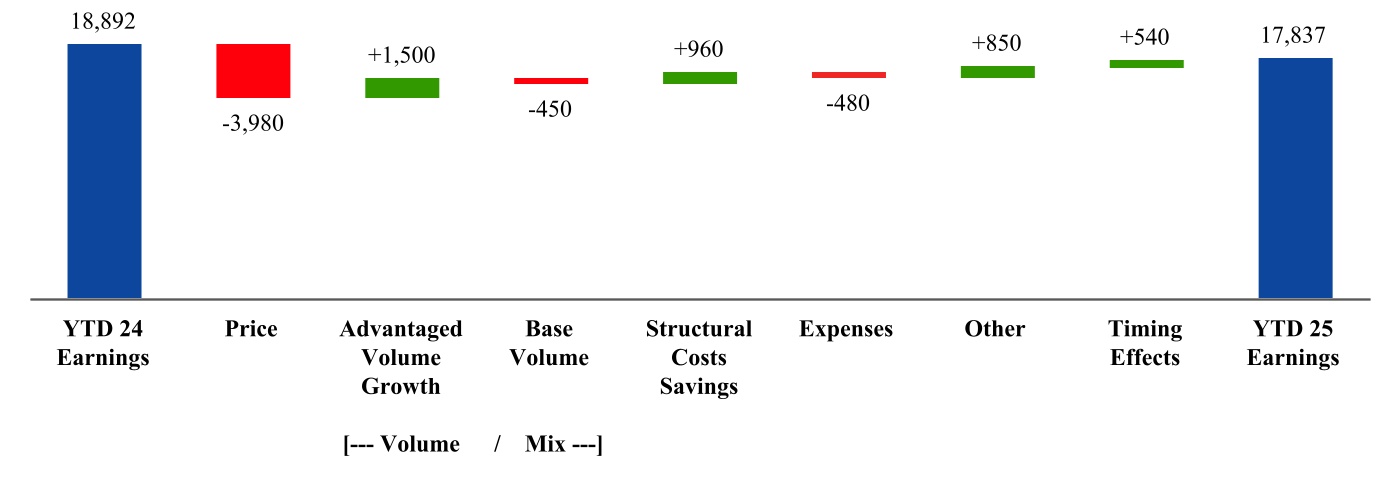
Upstream Year-to-Date Earnings Driver Analysis (millions of dollars)
Price– Price impacts decreased earnings by $3,980 million, driven by lower liquids realizations on higher industry supply.
Advantaged Volume Growth – Increased earnings by $1,500 million, mainly driven by Permian and Guyana growth.
Base Volume – Decreased earnings by $450 million as a result of non-strategic asset divestments, partially offset by ramp-up of the Tengiz expansion.
Structural Cost Savings – Increased earnings by $960 million.
Expenses – Decreased earnings by $480 million, primarily from higher depreciation on the Tengiz expansion.
Other – Increased earnings by $850 million, driven by favorable foreign exchange effects and tax items.
Timing Effects – Increased earnings by $540 million from favorable derivatives mark-to-market impacts and the absence of unfavorable prior year impacts.
(1) Natural gas is converted to an oil-equivalent basis at six million cubic feet per one thousand barrels.
Due to rounding, numbers presented may not add up precisely to the totals indicated.
3Q 2025
versus
3Q 2024
3Q 2025 production of 4.8 million oil-equivalent barrels per day increased 187 thousand oil-equivalent barrels per day from 3Q 2024, driven by Permian and Guyana growth.
YTD 2025
versus
YTD 2024
4.7 million oil-equivalent barrels per day in 2025 increased 408 thousand oil-equivalent barrels per day from 2024, driven by Permian production.
Listed below are descriptions of ExxonMobil’s volumes reconciliation drivers which are provided to facilitate understanding of the terms.
Entitlements - Net Interest are changes to ExxonMobil’s share of production volumes caused by non-operational changes to volume-determining drivers. These drivers consist of net interest changes specified in Production Sharing Contracts (PSCs), which typically occur when cumulative investment returns or production volumes achieve defined thresholds, changes in equity upon achieving pay-out in partner investment carry situations, equity redeterminations as specified in venture agreements, or as a result of the termination or expiry of a concession. Once a net interest change has occurred, it typically will not be reversed by subsequent events, such as lower crude oil prices.
Entitlements - Price / Spend / Other are changes to ExxonMobil’s share of production volumes resulting from temporary changes to non-operational volume-determining drivers. These drivers include changes in oil and gas prices or spending levels from one period to another. According to the terms of contractual arrangements or government royalty regimes, price or spending variability can increase or decrease royalty burdens and/or volumes attributable to ExxonMobil. For example, at higher prices, fewer barrels are required for ExxonMobil to recover its costs. These effects generally vary from period to period with field spending patterns or market prices for oil and natural gas. Such drivers can also include other temporary changes in net interest as dictated by specific provisions in production agreements.
Government Mandates are changes to ExxonMobil's sustainable production levels as a result of production limits or sanctions imposed by governments.
Divestments are reductions in ExxonMobil’s production arising from commercial arrangements to fully or partially reduce equity in a field or asset in exchange for financial or other economic consideration.
Growth and Other comprise all other operational and non-operational drivers not covered by the above definitions that may affect volumes attributable to ExxonMobil. Such drivers include, but are not limited to, production enhancements from project and work program activities, acquisitions including additions from asset exchanges, downtime, market demand, natural field decline, and any fiscal or commercial terms that do not affect entitlements.
(2) Refer to page 22 for definition of Identified Items and earnings (loss) excluding Identified Items.
Corporate and Financing expenses were $1,226 million for the third quarter of 2025, $682 million higher than the third quarter of 2024, due to lower interest income and increased pension-related expenses, partially offset by favorable tax impacts.
Corporate and Financing expenses were $2,783 million for the first nine months of 2025, $1,567 million higher than 2024, due to lower interest income, unfavorable foreign exchange, and increased pension-related expenses, partially offset by favorable tax impacts.
Net cash provided by operating activities (U.S. GAAP)
14,788
17,569
39,291
42,793
Proceeds associated with sales of subsidiaries, property, plant & equipment, and sales and returns of investments
139
127
2,138
1,756
Cash flow from operations and asset sales (Non-GAAP)
14,927
17,696
41,429
44,549
Because of the ongoing nature of our asset management and divestment program, we believe it is useful for investors to consider proceeds associated with asset sales together with cash provided by operating activities when evaluating cash available for investment in the business and financing activities, including shareholder distributions.
Cash flow from operations and asset sales in the third quarter of 2025 was $14.9 billion, a decrease of $2.8 billion from the comparable 2024 period.
Cash provided by operating activities totaled $39.3 billion for the first nine months of 2025, $3.5 billion lower than 2024. Net income including noncontrolling interests was $23.2 billion, a decrease of $4.0 billion from the prior year period. The adjustment for the noncash provision of $18.3 billion for depreciation and depletion was up $1.4 billion from 2024. Changes in operational working capital were a reduction of $5.0 billion during the period. All other items net increased cash flows by $2.9 billion in 2025 versus a decrease of $0.9 billion in 2024. See the Condensed Consolidated Statement of Cash Flows for additional details.
Investing activities for the first nine months of 2025 used net cash of $18.8 billion, an increase of $3.1 billion compared to the prior year. Spending for additions to property, plant and equipment of $20.9 billion was $3.4 billion higher than 2024. Proceeds from asset sales were $2.1 billion, an increase of $0.4 billion compared to the prior year. Net investments and advances decreased $0.7 billion from $0.7 billion in 2024.
Net cash used in financing activities was $30.3 billion in the first nine months of 2025, including $14.9 billion for the purchase of 136 million shares of ExxonMobil stock, as part of the previously announced buyback program. This compares to net cash used in financing activities of $31.6 billion in the prior year. Total debt at the end of the third quarter of 2025 was $42.0 billion compared to $41.7 billion at year-end 2024. The Corporation's debt to total capital ratio was 13.5 percent at the end of the third quarter of 2025 compared to 13.4 percent at year-end 2024. The net debt to capital ratio (1) was 9.5 percent at the end of the third quarter, an increase of 3.0 percentage points from year-end 2024. The Corporation's capital allocation priorities are investing in competitively advantaged, high-return projects, maintaining a strong balance sheet, and sharing our success with our shareholders through more consistent share repurchases and a growing dividend. The Corporation distributed a total of $12.9 billion to shareholders in the first nine months of 2025 through dividends.
The Corporation has access to significant capacity of long-term and short-term liquidity. Internally generated funds are expected to cover the majority of financial requirements, supplemented by long-term and short-term debt. Commercial paper is used to balance short-term liquidity requirements and is reflected in "Notes and loans payable" on the Consolidated Balance Sheet, with changes in outstanding commercial paper between periods included in the Consolidated Statement of Cash Flows. The Corporation had undrawn short-term committed lines of credit of $0.2 billion and undrawn long-term committed lines of credit of $0.4 billion as of the end of third quarter 2025. On October 2, 2025, the Corporation established a 364-day revolving credit facility of $7.0 billion to provide short-term borrowing capacity for general corporate purposes.
(1) Net debt is total debt of $42.0 billion less $13.8 billion of cash and cash equivalents excluding restricted cash . Net debt to capital ratio is net debt divided by net debt plus total equity of $268.2 billion. Total debt is the sum of notes and loans payable and long-term debt, as reported in the Consolidated Balance Sheet.
The Corporation, as part of its ongoing asset management program, continues to evaluate its mix of assets for potential upgrade. Because of the ongoing nature of this program, dispositions will continue to be made from time to time which will result in either gains or losses. Additionally, the Corporation continues to evaluate opportunities to enhance its business portfolio through acquisitions of assets or companies, and enters into such transactions from time to time. Key criteria for evaluating acquisitions include strategic fit, cost synergies, potential for future growth, low cost of supply, and attractive valuations. Acquisitions may be made with cash, shares of the Corporation’s common stock, or both.
Litigation and other contingencies are discussed in Note 3 to the unaudited Condensed Consolidated Financial Statements.
Contractual Obligations
The Corporation and its affiliates have numerous long-term sales and purchase commitments in their various business activities, all of which are expected to be fulfilled with no adverse consequences material to the Corporation’s operations or financial condition. Through the third quarter of 2025, the Corporation entered into a long-term purchase agreement with an estimated total obligation of approximately $2.3 billion.
TAXES
(millions of dollars)
Three Months Ended September 30,
Nine Months Ended September 30,
2025
2024
2025
2024
Income taxes
3,164
4,055
10,082
11,952
Effective income tax rate
32%
35%
34%
35%
Total other taxes and duties (1)
7,319
7,609
21,589
22,300
Total
10,483
11,664
31,671
34,252
(1) Includes “Other taxes and duties” plus taxes that are included in “Production and manufacturing expenses” and “Selling, general and administrative expenses”, each from the Consolidated Statement of Income.
Total taxes were $10.5 billion for the third quarter of 2025, a decrease of $1.2 billion from 2024. Income tax expense was $3.2 billion compared to $4.1 billion in the prior year. The effective income tax rate, which is calculated based on consolidated company income taxes and ExxonMobil's share of equity company income taxes, was 32 percent, lower than the prior year period due primarily to favorable one-time items. Total other taxes and duties decreased by $0.3 billion to $7.3 billion.
Total taxes were $31.7 billion for the first nine months of 2025, a decrease of $2.6 billion from 2024. Income tax expense decreased by $1.9 billion to $10.1 billion reflecting lower commodity prices. The effective income tax rate of 34 percent was down compared to the prior year period due primarily to favorable one-time items. Total other taxes and duties decreased by $0.7 billion to $21.6 billion.
Cash capital expenditures (Cash Capex) is the sum of "Additions to property, plant and equipment", "Additional investments and advances", and "Other investing activities including collection of advances", reduced by "Inflows from noncontrolling interests for major projects", each from the Consolidated Statement of Cash Flows. This measure is useful for investors to understand the current period cash impact of investments in the business.
(millions of dollars)
Three Months Ended September 30,
Nine Months Ended September 30,
2025
2024
2025
2024
Additions to property, plant and equipment
8,727
6,160
20,908
17,469
Additional investments and advances
501
294
973
1,038
Other investing activities including collection of advances
(610)
(87)
(949)
(311)
Inflows from noncontrolling interests for major projects
(23)
—
(68)
(12)
Total Cash Capex (Non-GAAP)
8,595
6,367
20,864
18,184
Cash capex in the third quarter of 2025 was $8.6 billion, up $2.2 billion from the third quarter of 2024.
(millions of dollars)
Three Months Ended September 30,
Nine Months Ended September 30,
2025
2024
2025
2024
Upstream
7,614
4,950
18,276
14,406
Energy Products
442
616
982
1,600
Chemical Products
275
493
845
1,301
Specialty Products
109
95
316
257
Other
155
213
445
620
Total Cash Capex (Non-GAAP)
8,595
6,367
20,864
18,184
The Corporation plans to invest slightly below the lower end of the $27 billion to $29 billion range in 2025, excluding acquisitions. Actual spending could vary depending on the progress of individual projects.
FORWARD-LOOKING STATEMENTS
Statements related to future events; projections; descriptions of strategic, operating, and financial plans and objectives; statements of future ambitions and plans; future earnings power; potential addressable markets; and other statements of future events or conditions are forward-looking statements. Similarly, discussion of future plans related to carbon capture, transportation and storage, lower-emission fuels, hydrogen, ammonia, direct air capture, ProxximaTM systems, carbon materials, lithium, low-carbon data centers, and other future plans to reduce emissions and emission intensity of ExxonMobil, its affiliates, and third parties are dependent on future market factors, such as continued technological progress, stable policy support and timely rule-making and permitting, and represent forward-looking statements.
Actual future results, including financial and operating performance; potential earnings, cash flow, dividends or shareholder returns, including the timing and amounts of share repurchases; total capital expenditures and mix, including allocations of capital to low carbon and other new investments; realization and maintenance of structural cost reductions and efficiency gains, including the ability to offset inflationary pressure; plans to reduce future emissions and emissions intensity, including ambitions to reach Scope 1 and Scope 2 net zero from operated assets by 2050, to reach Scope 1 and 2 net zero in heritage Permian Basinunconventional operated assets by 2030 and in Pioneer Permian assets by 2035, to eliminate routine flaring in-line with World Bank Zero Routine Flaring, to reach near-zero methane emissions from operated assets and other methane initiatives; and to meet ExxonMobil’s emission reduction plans and goals, divestment and start-up plans, and associated project plans as well as technology advances, including the timing and outcome of projects to capture, transport and store CO2, produce hydrogen and ammonia, produce lower-emission fuels, produce ProxximaTM systems, produce carbon materials, produce lithium, and use plastic waste as feedstock for advanced recycling; future debt levels and credit ratings; business and project plans, timing, costs, capacities and profitability; resource recoveries and production rates; and planned Denbury and Pioneer integrated benefits, could differ materially due to a number of factors.
These include global or regional changes or imbalances in the supply and demand for oil, natural gas, petrochemicals, and feedstocks and other market factors; economic conditions and seasonal fluctuations that impact prices, differentials, and volume/mix for our products; developments or changes in local, national, or international laws, regulations, taxes, trade sanctions, trade tariffs, or policies affecting our business, such as government policies supporting lower carbon and new market investment opportunities, the punitive European taxes on the oil and gas sector and unequal support for different technological methods of emissions reduction or evolving, ambiguous and unharmonized standards or extraterritorial laws and regulations imposed by various jurisdictions related to sustainability and greenhouse gas reporting; timely granting of governmental permits and certifications; uncertain impacts of deregulation on the legal and regulatory environment; changes in interest and exchange rates; variable impacts of trading activities on our margins and results each quarter; actions of co-venturers, competitors and commercial counterparties; the outcome of commercial negotiations, including final agreed terms and conditions; the outcome of competitive bidding and project awards; the ability to access debt markets on favorable terms or at all; the occurrence, pace, rate of recovery and effects of public health crises; adoption of regulatory incentives consistent with law; reservoir performance, including variability and timing factors applicable to unconventional resources, the success of new unconventional technologies, and the ability of new technologies to improve recovery relative to competitors; the level, outcome, and timing of exploration and development projects and decisions to invest in future reserves and resources; timely completion of construction projects and commencement of start-up operations, including reliance on third-party suppliers and service providers; final management approval of future projects and any changes in the scope, terms, costs or assumptions of such projects as approved; the actions of governments or other actors against our core business activities and acquisitions, divestitures or financing opportunities; war, civil unrest, attacks against the company or industry, and other geopolitical or security disturbances, including disruption of land or sea transportation routes; decoupling of economies, realignment of global trade and supply chain networks, and disruptions in military alliances; expropriations, seizure, or capacity, insurance, shipping, import or export limitations imposed directly or indirectly by governments or laws; opportunities for potential acquisitions, investments or divestments and satisfaction of applicable conditions to closing, including timely regulatory approvals; the capture of efficiencies within and between business lines and the ability to maintain near-term cost reductions as ongoing efficiencies without impairing our competitive positioning; unforeseen technical or operating difficulties and unplanned maintenance; the development and competitiveness of alternative energy and emission reduction technologies; consumer preferences including willingness and ability to pay for reduced emission products; the results of research programs and the ability to bring new technologies to commercial scale on a cost-competitive basis; and other factors discussed under "Item 1A. Risk Factors" of ExxonMobil’s 2024 Form 10-K.
Forward-looking and other statements regarding environmental and other sustainability efforts and aspirations are not an indication that these statements are material to investors or require disclosure in our filing with the SEC or any other regulatory authority. In addition, historical, current, and forward-looking environmental and other sustainability-related statements may be based on standards for measuring progress that are still developing, internal controls and processes that continue to evolve, and assumptions that are subject to change in the future, including future rule-making.
Actions needed to advance ExxonMobil’s 2030 greenhouse gas emission-reductions plans are incorporated into its medium-term business plans, which are updated annually. The reference case for planning beyond 2030 is based on ExxonMobil’s Global Outlook (Outlook) research and publication. The Outlook is reflective of the existing global policy environment and an assumption of increasing policy stringency and technology improvement to 2050. Current trends for policy stringency and development of lower-emission solutions are not yet on a pathway to achieve net-zero by 2050. As such, the Outlook does not project the degree of required future policy and technology advancement and deployment for the world, or ExxonMobil, to meet net zero by 2050. As future policies and technology advancements emerge, they will be incorporated into the Outlook, and ExxonMobil’s business plans will be updated accordingly. References to projects or opportunities may not reflect investment decisions made by ExxonMobil or its affiliates. Individual projects or opportunities may advance based on a number of factors, including availability of stable and supportive policy, permitting, technological advancement for cost-effective abatement, insights from the Corporate planning process, and alignment with our partners and other stakeholders. Capital investment guidance in lower-emission investments is based on our Corporate plan; however, actual investment levels will be subject to the availability of the opportunity set and public policy support, and focused on returns.
The term “project” as used in this report can refer to a variety of different activities and does not necessarily have the same meaning as in any government payment transparency reports.
ITEM 3. QUANTITATIVE AND QUALITATIVE DISCLOSURES ABOUT MARKET RISK
Information about market risks for the nine months ended September 30, 2025, does not differ materially from that discussed under Item 7A of the registrant's Annual Report on Form 10-K for 2024.
As indicated in the certifications in Exhibit 31 of this report, the Corporation’s Chief Executive Officer, Chief Financial Officer, and Principal Accounting Officer have evaluated the Corporation’s disclosure controls and procedures as of September 30, 2025. Based on that evaluation, these officers have concluded that the Corporation’s disclosure controls and procedures are effective in ensuring that information required to be disclosed by the Corporation in the reports that it files or submits under the Securities Exchange Act of 1934, as amended, is accumulated and communicated to them in a manner that allows for timely decisions regarding required disclosures and are effective in ensuring that such information is recorded, processed, summarized, and reported within the time periods specified in the Securities and Exchange Commission’s rules and forms. There were no changes during the Corporation’s last fiscal quarter that materially affected, or are reasonably likely to materially affect, the Corporation’s internal control over financial reporting.
PART II. OTHER INFORMATION
ITEM 1. LEGAL PROCEEDINGS
ExxonMobil has elected to use a $1 million threshold for disclosing environmental proceedings.
Refer to the relevant portions of Note 3 of this Quarterly Report on Form 10-Q for further information on legal proceedings.
ITEM 2. UNREGISTERED SALES OF EQUITY SECURITIES AND USE OF PROCEEDS
Issuer Purchases of Equity Securities for Quarter Ended September 30, 2025
Total Number
of Shares
Purchased (1)
Average
Price Paid
per Share (2)
Total Number of Shares Purchased as Part of Publicly Announced Plans or Programs(3)
Approximate Dollar Value of Shares that May Yet Be Purchased Under the Program
(Billions of dollars) (4)
July 2025
15,786,446
$111.51
15,786,419
$28.5
August 2025
15,456,069
$108.72
15,456,069
$26.8
September 2025
14,844,682
$113.20
14,843,547
$25.1
Total
46,087,197
$111.12
46,086,035
(1) Includes shares withheld from participants in the Corporation's incentive program for personal income taxes.
(2) Excludes 1% U.S. excise tax on stock repurchases.
(3) Purchases were made under terms intended to qualify for exemption under Rules 10b-18 and 10b5-1.
(4) The Corporation continued its share repurchase program, originally initiated in 2022. In its 2024 Corporate Plan Update released December 11, 2024, the Corporation stated that it expects to continue its share repurchase program with a $20 billion repurchase pace per year through 2026, assuming reasonable market conditions.
During the third quarter, the Corporation did not issue or sell any unregistered equity securities.
ITEM 5. OTHER INFORMATION
During the three months ended September 30, 2025, none of the Corporation’s directors or officers adopted or terminated a “Rule 10b5-1 trading arrangement” or “non-Rule 10b5-1 trading arrangement,” as each term is defined in Item 408(a) of Regulation S-K.
Section 1350 Certification (pursuant to Sarbanes-Oxley Section 906) by Principal Accounting Officer.
101*
Interactive Data Files (formatted as Inline XBRL).
104*
Cover Page Interactive Data File (formatted as Inline XBRL and contained in Exhibit 101).
* Filed herewith.
** Furnished herewith.
40
SIGNATURE
Pursuant to the requirements of the Securities Exchange Act of 1934, the Registrant has duly caused this report to be signed on its behalf by the undersigned, thereunto duly authorized.
EXXON MOBIL CORPORATION
Date: November 3, 2025
By:
/s/ LEN M. FOX
Len M. Fox
Vice President, Controller and Tax (Principal Accounting Officer)