•Delivered first-quarter earnings of $4.2 billion, or $8.8 billion excluding unfavorable estimated timing effects of $3.9 billion and an identified item of $0.7 billion
•Generated earnings per share of $1.00, or $1.16 excluding the identified item, and $2.09 excluding the identified item and estimated timing effects
•Sustained industry-leading reliability and delivered record production in Guyana1
•Achieved first LNG at Golden Pass Train 1, increasing U.S. LNG exports by 5%
•Generated a one-year total shareholder return of 48% and shareholder distributions of $9.2 billion
•Leveraged world-scale supply chain capabilities to optimize the industry's largest and most diverse global portfolio, supporting customers in more than 180 countries
Results Summary
Dollars in millions (except per share data)
1Q26
4Q25
Change vs 4Q25
1Q25
Change vs 1Q25
Earnings (U.S. GAAP)
4,183
6,501
-2,318
7,713
-3,530
Earnings Excluding Identified Items (non-GAAP)
4,889
7,256
-2,367
7,713
-2,824
Earnings Excluding Identified Items and Estimated Timing Effects (non-GAAP)
8,772
6,920
+1,852
7,584
+1,188
Earnings Per Common Share ²
1.00
1.53
-0.53
1.76
-0.76
Earnings Excluding Identified Items Per Common Share (non-GAAP) ²
1.16
1.71
-0.55
1.76
-0.60
Earnings Excluding Identified Items and Estimated Timing Effects Per Common Share (non-GAAP) ²
2.09
1.63
+0.46
1.73
+0.36
SPRING, Texas – May 1, 2026 – Exxon Mobil Corporation today announced first-quarter 2026 earnings of $4.2 billion, or $1.00 per share assuming dilution. Earnings excluding identified items were $4.9 billion, or $1.16 per share. Earnings were $8.8 billion, or $2.09 per share, excluding identified items and unfavorable estimated timing effects that unwind in subsequent periods.3 Cash flow from operating activities was $8.7 billion, or $13.8 billion excluding margin postings, which primarily fluctuate with the fair value of underlying derivatives.4 Shareholder distributions of $9.2 billion included $4.3 billion of dividends and $4.9 billion of share repurchases, consistent with the company's previously announced plans.
"This quarter demonstrated that ExxonMobil is a fundamentally stronger company than it was just a few years ago, built to perform through disruption and across market cycles. Events in the Middle East tested that strength with the safety of our people remaining our top priority. Those events also underscored the importance of reliable, affordable energy products and the value of the capabilities we have built to deliver them," said Darren Woods, chairman and chief executive officer.
"The underlying business delivered strong results, reflecting the benefits of the strategy we have consistently executed since 2018. We have grown advantaged volumes, optimized our operations, reduced structural costs, and strengthened our earnings power. The result is a more resilient, lower-cost business, grounded in advantaged assets, disciplined capital allocation, and execution excellence. That foundation gives us a durable platform to grow earnings, cash flow, and shareholder value through 2030 and beyond."
1 Guyana 1Q26 FPSO performance is industry-leading in operational availability against Solomon Associates’ most current benchmarking report, dated April 2026. Solomon defines industry-leading as the top two performers.
2 Assuming dilution.
3 Estimated timing effects, which unwind in subsequent periods, are primarily related to unsettled derivatives that are required to be marked to current period-end prices (mark-to-market), where the associated physical shipments are not reflected in earnings until the physical transaction is complete. It also includes estimated recognition differences between the settlement of derivatives and their offsetting physical commodity realizations (due to LIFO inventory accounting).
4 Margin postings refer to cash collateral posted in support of derivative positions on regulated futures exchanges like ICE and CME.
1
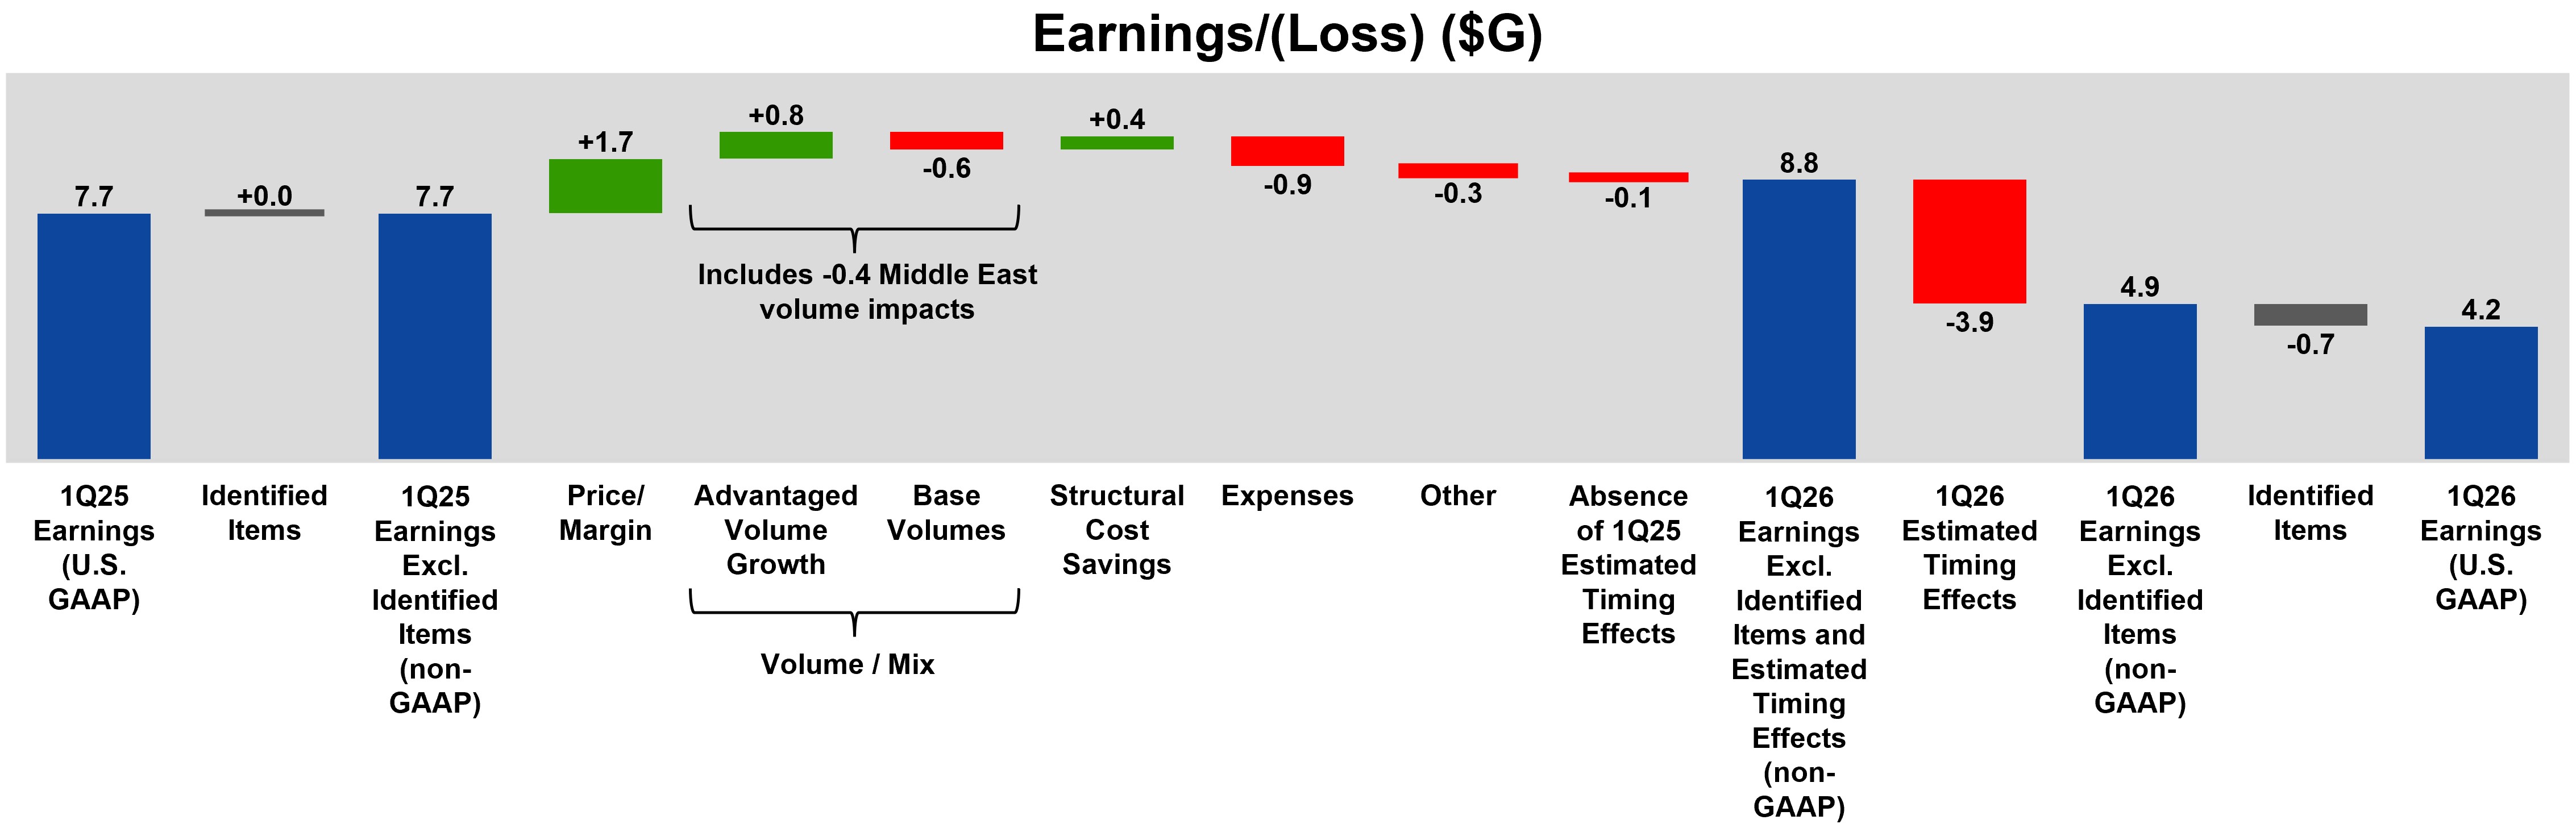
1Q25 to 1Q26 Earnings Driver Analysis
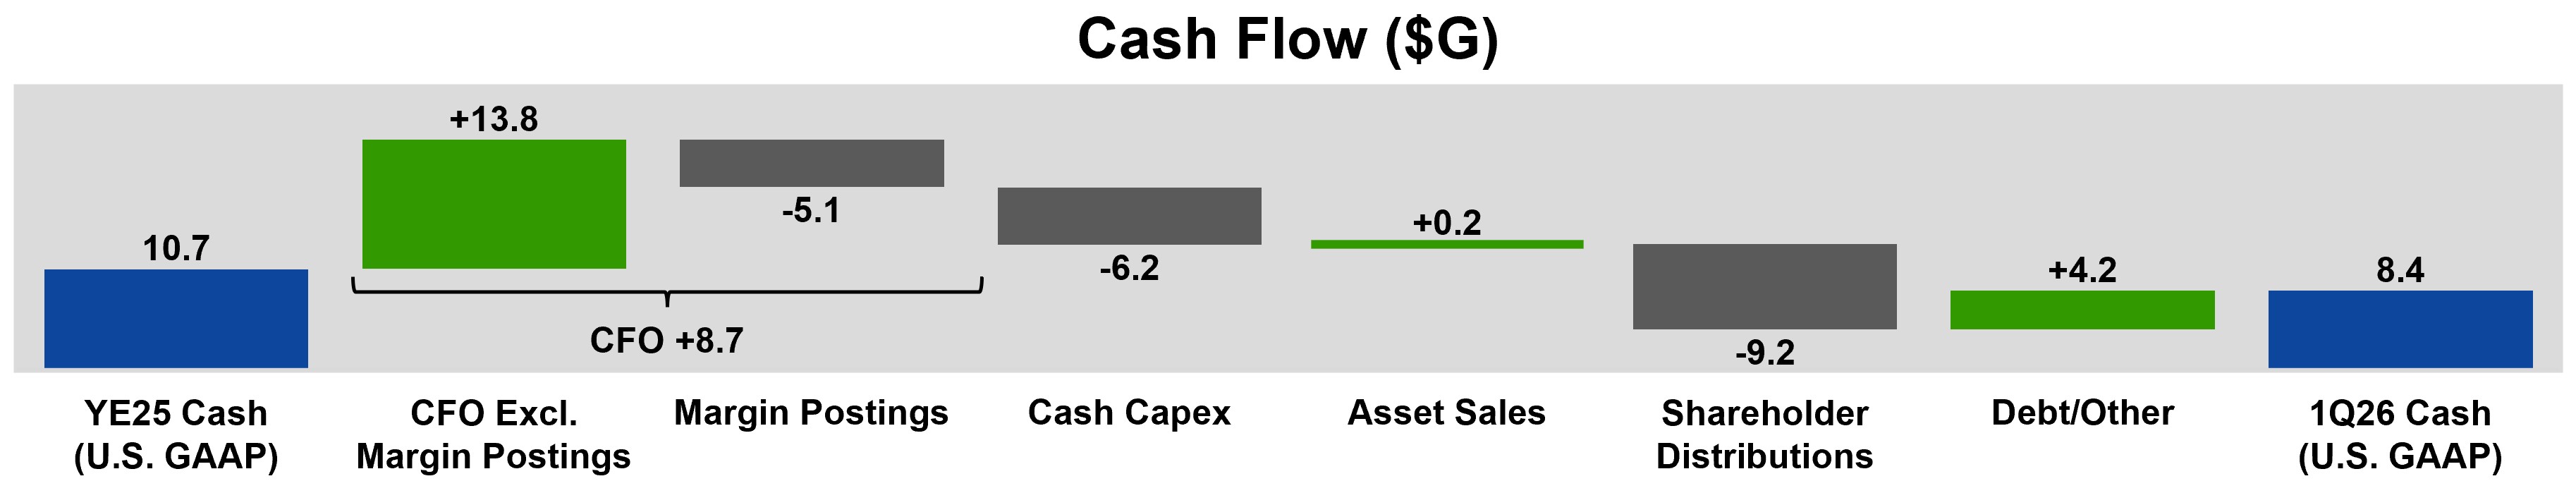
YE25 Cash (U.S. GAAP) to 1Q26 Cash
Financial Highlights
•First-quarter earnings were $4.2 billion compared to $7.7 billion in the first quarter of 2025. Earnings excluding identified items and estimated timing effects were $8.8 billion versus $7.6 billion in the same period last year. Identified items of $0.7 billion reflect losses on settled financial hedges that were not offset by the associated physical shipments due to Middle East supply disruptions. Unfavorable estimated timing effects of $3.9 billion reflect the mismatch between the valuation of financial derivatives and the associated physical transactions, resulting in a timing difference in earnings that unwinds in subsequent periods. These timing effects were primarily driven by unsettled derivatives that are required to be marked to current period-end prices, where the associated physical shipments are not reflected in earnings until completion of the physical transactions. Higher prices and margins, advantaged volume growth, and structural cost savings were partly offset by higher expenses from advantaged investments and Middle East volume impacts.
•The company has delivered $15.6 billion in cumulative Structural Cost Savings since 2019, with an additional $0.6 billion achieved during the quarter. Structural Cost Savings are expected to reach $20 billion by 2030.
•The company generated cash flow from operations of $8.7 billion, or $13.8 billion excluding margin postings, which primarily fluctuate with the fair value of underlying derivatives, and free cash flow of $2.7 billion. Industry-leading shareholder distributions of $9.2 billion included $4.3 billion of dividends and $4.9 billion of share repurchases, on pace with plans to repurchase $20 billion of shares in 2026, assuming reasonable market conditions. ExxonMobil also delivered industry-leading first quarter total shareholder return (TSR) of 42%.1
•The Corporation declared a second-quarter dividend of $1.03 per share, payable on June 10, 2026, to shareholders of record of Common Stock at the close of business on May 15, 2026.
•The company's industry-leading debt-to-capital and net-debt-to-capital ratios were 15.4% and 13.1%, respectively, with a period-end cash balance of $8.4 billion.2
•Cash capital expenditures totaled $6.2 billion, consistent with the company's full-year guidance range of $27-$29 billion, and includes $6.5 billion of additions to property, plant and equipment.
1 Shareholder distributions compare IOCs' reported results or Bloomberg consensus as of April 30, 2026. TSR compares to each IOC as of March 31, 2026.
2 Net debt is total debt of $47.7 billion less $8.4 billion of cash and cash equivalents excluding restricted cash. Net-debt to-capital ratio is net debt divided by the sum of net debt and total equity of $261.0 billion. Period-end cash balance includes cash and cash equivalents including restricted cash. ExxonMobil has lower net debt-to-capital and debt-to-capital than all IOCs. Net debt-to-capital and debt-to-capital are sourced from Bloomberg. Figures are actuals for IOCs that reported results or estimated using Bloomberg consensus as of April 30, 2026.
Earnings/(Loss) Excluding Identified Items and Estimated Timing Effects (non-GAAP)
6,265
4,429
6,598
Production (koebd)
4,594
4,988
4,551
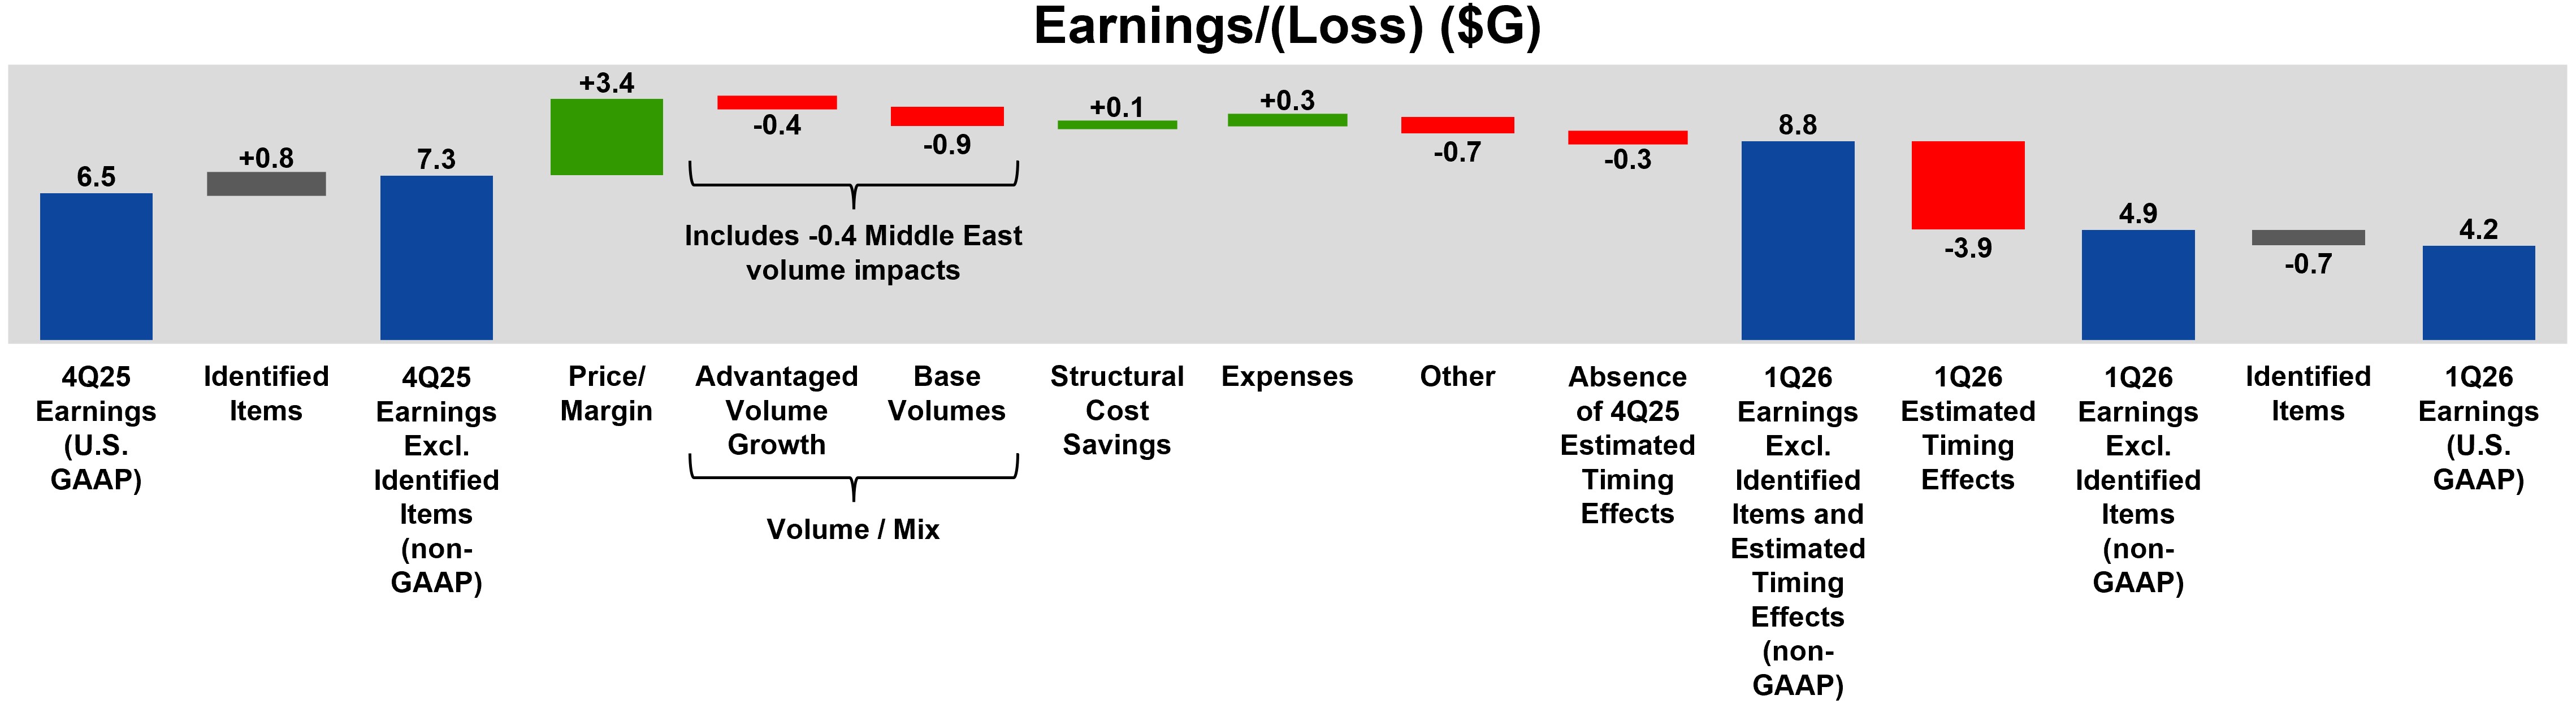
•Upstream first-quarter reported earnings were $5.7 billion versus $6.8 billion in the same period last year. Earnings excluding identified items and estimated timing effects of $6.3 billion decreased $0.3 billion from higher depreciation expense and lower base volumes from divestments and operational disruptions in Kazakhstan, partly offset by advantaged volume growth in Guyana and the Permian, and structural cost savings.
•Compared to the fourth quarter, reported earnings increased $2.2 billion. Earnings excluding identified items and estimated timing effects of $6.3 billion increased $1.8 billion versus the prior quarter. Higher crude and gas realizations were partly offset by lower volumes from Middle East impacts, operational disruptions in Kazakhstan and from U.S. winter storm Fern, and higher depreciation expense.
•Net production in the first quarter reached 4.6 million oil-equivalent barrels per day, with Guyana setting a new quarterly production record of more than 900 thousand gross barrels of oil per day.
•At the end of March, Golden Pass LNG, a joint venture between QatarEnergy and ExxonMobil, achieved first production of LNG from Train 1 at its Sabine Pass Terminal, marking a major milestone, increasing U.S. exports by 5% relative to 2025.
•Golden Pass LNG also announced the safe and successful loading and departure of its first LNG export cargo from the Golden Pass LNG terminal in April. This achievement marks another major milestone toward full commercial operations.
Earnings/(Loss) Excluding Identified Items and Estimated Timing Effects (non-GAAP)
2,799
2,552
856
Energy Products Sales (kbd)
5,630
5,804
5,283
•Energy Products reported lower first-quarter earnings versus the same quarter last year. Earnings excluding identified items and estimated timing effects were $2.8 billion, an increase of $1.9 billion versus the same quarter last year. Identified items reflect losses on settled financial hedges that were not offset by the associated physical shipments due to Middle East supply disruptions. Unfavorable estimated timing effects reflect the mismatch between the valuation of financial derivatives and the associated physical transactions, resulting in a timing difference in earnings that unwinds in subsequent periods. Improved margins, including strong trading and optimization results, and structural cost savings were partly offset by higher expenses from planned turnaround activity and unfavorable foreign exchange impacts.
•Reported first-quarter earnings decreased versus the prior quarter. Earnings excluding identified items and estimated timing effects increased $247 million compared to the fourth quarter. The quarter-over-quarter increase was driven by strong margins from refining and trading, structural cost savings, and lower seasonal expenses. These favorable impacts were partly offset by lower volumes due to scheduled maintenance and Middle East disruptions, and the absence of favorable year-end inventory effects.
•Chemical Products first-quarter earnings were $110 million, a decrease of $163 million versus the same quarter last year. Weaker margins driven by lower realizations and higher feed costs were partly offset by volume increases from the China Chemical Complex start-up and structural cost savings.
•First-quarter earnings of $110 million increased $391 million versus the fourth quarter. Improved results were driven by the absence of prior quarter identified items, lower seasonal expenses, and structural cost savings, partly offset by the absence of favorable tax impacts.
•Specialty Products delivered strong first-quarter earnings of $651 million, consistent with the same period last year. Record sales volume of high-value products1 and structural cost savings were offset by lower margins from increased feed costs.
•First-quarter earnings of $651 million decreased $31 million from the prior quarter. Higher feed costs that compressed margins were partially offset by lower seasonal expenses and record sales volumes of high-value products.
•Corporate and Financing first-quarter net charges were $1.1 billion compared to $0.8 billion in the same quarter last year due to lower interest income and the absence of favorable tax items.
•First-quarter net charges of $1.1 billion increased $0.2 billion versus the fourth quarter driven by the absence of favorable tax items.
1 Based on comparing quarterly high-value product sales since 2019.
5
CASH FLOW FROM OPERATIONS EXCLUDING WORKING CAPITAL
Dollars in millions (unless otherwise noted)
1Q26
4Q25
1Q25
Net income/(loss) including noncontrolling interests
4,472
6,609
8,033
Depreciation and depletion (includes impairments)
6,771
7,715
5,702
Changes in operational working capital, excluding cash and debt
(1,758)
(2,728)
(878)
Other
(780)
1,083
96
Cash Flow from Operating Activities (U.S. GAAP)
8,705
12,679
12,953
Less: Changes in operational working capital, excluding cash and debt
1,758
2,728
878
Cash Flow from Operations excluding Working Capital (non-GAAP)
10,463
15,407
13,831
FREE CASH FLOW
Dollars in millions (unless otherwise noted)
1Q26
4Q25
1Q25
Cash Flow from Operating Activities (U.S. GAAP)
8,705
12,679
12,953
Additions to property, plant, and equipment
(6,470)
(7,450)
(5,898)
Additional investments and advances
(387)
(3,160)
(153)
Other investing activities including collection of advances
632
2,457
93
Proceeds from asset sales and returns of investments
219
1,020
1,823
Inflows from noncontrolling interest for major projects
—
20
22
Free Cash Flow (non-GAAP)
2,699
5,566
8,840
6
CASH CAPITAL EXPENDITURES
Dollars in millions (unless otherwise noted)
1Q26
4Q25
1Q25
Additions to property, plant, and equipment
6,470
7,450
5,898
Additional investments and advances
387
3,160
153
Other investing activities including collection of advances
(632)
(2,457)
(93)
Inflows from noncontrolling interests for major projects
—
(20)
(22)
Less: Advances and collections not related to capital expenditures or equity investments
(38)
(232)
—
Total Cash Capital Expenditures (non-GAAP)
6,187
7,901
5,936
Dollars in millions (unless otherwise noted)
1Q26
4Q25
1Q25
Upstream
United States
3,449
3,674
2,983
Non-U.S.
1,363
2,709
2,010
Total
4,812
6,383
4,993
Energy Products
United States
828
289
127
Non-U.S.
170
204
251
Total
998
493
378
Chemical Products
United States
156
338
154
Non-U.S.
26
212
137
Total
182
550
291
Specialty Products
United States
35
221
52
Non-U.S.
20
86
58
Total
55
307
110
Other
Other
140
168
164
Worldwide
6,187
7,901
5,936
7
CALCULATION OF STRUCTURAL COST SAVINGS
Dollars in billions (unless otherwise noted)
Twelve Months Ended December 31,
Three Months Ended March 31,
2019
2025
2025
2026
Components of Operating Costs
From ExxonMobil’s Consolidated Statement of Income (U.S. GAAP)
Production and manufacturing expenses
36.8
42.4
10.1
10.7
Selling, general and administrative expenses
11.4
11.1
2.5
2.7
Depreciation and depletion (includes impairments)
19.0
26.0
5.7
6.8
Exploration expenses, including dry holes
1.3
1.0
0.1
0.1
Non-service pension and postretirement benefit expense
1.2
0.4
0.1
0.1
Subtotal
69.7
81.0
18.5
20.3
ExxonMobil’s share of equity company expenses (non-GAAP)
9.1
10.6
2.6
2.3
Total Adjusted Operating Costs (non-GAAP)
78.8
91.6
21.1
22.6
Total Adjusted Operating Costs (non-GAAP)
78.8
91.6
21.1
22.6
Less:
Depreciation and depletion (includes impairments)
19.0
26.0
5.7
6.8
Non-service pension and postretirement benefit expense
1.2
0.4
0.1
0.1
Other adjustments (includes equity company depreciation and depletion)
3.6
6.2
1.3
1.3
Total Cash Operating Expenses (Cash Opex) (non-GAAP)
55.0
59.0
14.1
14.5
Energy and production taxes (non-GAAP)
11.0
14.9
3.9
3.7
Total Cash Operating Expenses (Cash Opex) excluding Energy and Production Taxes (non-GAAP)
44.0
44.1
10.2
10.8
Change vs 2019
Change vs 2025
Estimated Cumulative vs 2019
Total Cash Operating Expenses (Cash Opex) excluding Energy and Production Taxes (non-GAAP)
+0.1
+0.6
Market
+4.9
+0.5
Activity/ Other
+10.3
+0.6
Structural Cost Savings
-15.1
-0.6
-15.6
This press release references Structural Cost Savings, which describes decreases in cash opex excluding energy and production taxes as a result of operational efficiencies, workforce reductions, divestment-related reductions, and other cost-saving measures, that are expected to be sustainable compared to 2019 levels. Relative to 2019, estimated cumulative Structural Cost Savings totaled $15.6 billion, which included an additional $0.6 billion in the first three months of 2026. The total change between periods in expenses above will reflect both Structural Cost Savings and other changes in spend, including market drivers, such as inflation and foreign exchange impacts, as well as changes in activity levels and costs associated with new operations, mergers and acquisitions, new business venture development, and early-stage projects. Structural Cost Savings from new operations, mergers and acquisitions, and new business venture developments are included in the cumulative Structural Cost Savings. Estimates of cumulative annual Structural Cost Savings may be revised depending on whether cost reductions realized in prior periods are determined to be sustainable compared to 2019 levels. Structural Cost Savings are stewarded internally to support management's oversight of spending over time. This measure is useful for investors to understand the Corporation's efforts to optimize spending through disciplined expense management.
8
ExxonMobil will discuss financial and operating results and other matters during a webcast at 8:30 a.m. Central Time on May 1, 2026. To listen to the event or access an archived replay, please visit www.exxonmobil.com.
Selected Earnings Driver Definitions
Advantaged volume growth. Represents earnings impact from change in volume/mix from advantaged assets, advantaged projects, and high-value products. See frequently used terms on page 11 for definitions of advantaged assets, advantaged projects, and high-value products.
Base volume. Represents and includes all volume/mix drivers not included in advantaged volume growth driver defined above.
Structural cost savings. Represents after-tax earnings effect of Structural Cost Savings as defined on page 8, including cash operating expenses related to divestments.
Expenses. Represents and includes all expenses otherwise not included in other earnings drivers.
Estimated timing effects. Represents estimated timing effects which unwind in subsequent periods, and are primarily related to unsettled derivatives which are required to be marked to current period-end prices (mark-to-market), where the associated physical shipments are not reflected in earnings until the physical transaction is complete. It also includes estimated recognition differences between the settlement of derivatives and their offsetting physical commodity realizations (due to LIFO inventory accounting).
Cautionary Statement
Statements related to future events; projections; descriptions of strategic, operating, and financial plans and objectives; statements of future ambitions, future earnings power, potential addressable markets, or plans; and other statements of future events or conditions in this release are forward-looking statements. Similarly, discussion of future carbon capture, transportation and storage, as well as lower-emission fuels, hydrogen and ammonia, lithium, direct air capture, ProxximaTM resin systems, carbon materials, low-carbon data centers, and other low carbon and new business plans to reduce emissions of ExxonMobil, its affiliates, and third parties, are dependent on future market factors, such as continued technological progress, stable policy support and timely rule-making and permitting, and represent forward-looking statements. Actual future results, including financial and operating performance; potential earnings, cash flow, or rate of return; total cash capital expenditures and mix, including allocations of capital to low carbon and other new investments; realization and maintenance of structural cost reductions and efficiency gains, including the ability to offset inflationary pressure; plans to reduce future emissions and emissions intensity; ambitions to reach Scope 1 and Scope 2 net zero from operated assets by 2050, to reach Scope 1 and 2 net zero in integrated Upstream Permian Basin unconventional operated assets by 2035, to eliminate routine flaring in-line with World Bank Zero Routine Flaring, to reach near-zero methane emissions from operated assets and other methane initiatives, and to meet ExxonMobil’s emission reduction goals and plans, divestment and start-up plans, and associated project plans as well as technology advances, including the timing and outcome of projects to capture, transport, and store CO2, produce hydrogen and ammonia, produce lower-emission fuels, produce lithium, produce ProxximaTM resin systems, produce carbon materials, and use plastic waste as feedstock for advanced recycling; cash flow, dividends and shareholder returns, including the timing and amounts of share repurchases; future debt levels and credit ratings; business and project plans, timing, costs, capacities and returns; resource recoveries and production rates; and planned Pioneer and Denbury integrated benefits, could differ materially due to a number of factors. These include global or regional changes or imbalances in the supply and demand for oil, natural gas, petrochemicals, and feedstocks and other market factors, economic conditions and seasonal fluctuations that impact prices, differentials, margins, and volume/mix for our products; changes in any part of the world in laws, taxes, or regulations including extraterritorial environmental and tax regulations, trade sanctions, and timely granting of governmental permits, licenses, and certifications; developments or changes in government policies supporting lower carbon and new market investment opportunities or policies limiting the attractiveness of future investment such as the additional European taxes on the energy sector and unequal support for different methods of emissions reduction; variable impacts of trading activities and derivative positions, including timing effects, on our margins and results each quarter; changes in interest and exchange rates; actions of co-venturers or partners, competitors and commercial counterparties, including suppliers and customers; the outcome of commercial negotiations, including final agreed terms and conditions; the ability to access debt markets; the ultimate impacts of public health crises, including the effects of government responses on people and economies; reservoir performance and optimization, including variability and timing factors applicable to unconventional resources, the success of new unconventional technologies, and the ability of new technologies to improve the recovery relative to competitors; the level, outcome, and timing of exploration projects and decisions to invest in future reserves and resources; timely completion of development and other construction projects and commencement of start-up operations, including reliance on third-party suppliers and service providers; final management approval of future projects and any changes in the scope, terms, or costs of such projects as approved; government regulation of our growth opportunities; government actions in pursuit of national energy and security policies or priorities affecting our business; war, civil unrest, armed hostilities, attacks against the company or industry and other political or security disturbances, including disruption of land or sea transportation routes or distribution or shipping channels; expropriations, seizures, or capacity, insurance, export, import or shipping limitations imposed directly or indirectly by governments or laws; changes in market, national or regional tariffs or disruption, realignment or breaking of current or historical trade or military alliances or global trade and supply chain networks; escalating geopolitical volatility, including regime changes; opportunities for potential acquisitions, investments or divestments and satisfaction of applicable conditions to closing, including timely regulatory approvals; the capture of efficiencies within and between business lines and the ability to maintain near-term cost reductions as ongoing efficiencies without impairing our competitive positioning; unforeseen technical or operating disruptions or difficulties and unplanned maintenance; the development and competitiveness of alternative energy and emission
9
reduction technologies; the results of research programs and the ability to bring new technologies to commercial scale on a cost-competitive basis; and other factors discussed under Item 1A. Risk Factors of ExxonMobil’s 2025 Form 10-K.
Actions needed to advance ExxonMobil’s 2030 greenhouse gas emission-reductions plans are incorporated into its medium-term business plans, which are updated annually. The reference case for planning beyond 2030 is based on ExxonMobil’s Global Outlook (Outlook) research and publication. The Outlook is reflective of the existing global policy environment and an assumption of increasing policy stringency and technology improvement to 2050. Current trends for policy stringency and deployment of lower-emission solutions are not yet on a pathway to achieve net-zero by 2050. As such, the Outlook does not project the degree of required future policy and technology advancement and deployment for the world, or ExxonMobil, to meet net zero by 2050. As future policies and technology advancements emerge, they will be incorporated into the Outlook, and ExxonMobil's business plans will be updated accordingly. References to projects or opportunities may not reflect investment decisions made by ExxonMobil or its affiliates. Individual projects or opportunities may advance based on a number of factors, including availability of stable and supportive policy, permitting, technological advancement for cost-effective abatement, insights from the corporate planning process, and alignment with our partners and other stakeholders. Capital investment guidance in lower-emission investments is based on our corporate plan; however, actual investment levels will be subject to the availability of the opportunity set and public policy support, and focused on returns.
Frequently Used Terms and Non-GAAP Measures
This press release also includes cash flow from operations excluding working capital (non-GAAP). The company believes it is useful for investors to consider these numbers in comparing the underlying performance of the company's business across periods when there are significant period-to-period differences in the amount of changes in working capital. A reconciliation to net cash provided by operating activities for the 2025 and 2026 periods is shown on page 6.
This press release also includes Earnings/(Loss) Excluding Identified Items (non-GAAP) and Earnings/(Loss) Excluding Identified Items Per Common Share (non-GAAP), which are earnings/(loss) excluding individually significant non-operational events with, typically, an absolute corporate total earnings impact of at least $250 million in a given quarter. The earnings/(loss) impact of an identified item for an individual segment may be less than $250 million when the item impacts several periods or several segments. Earnings/(loss) excluding Identified Items does include non-operational earnings events or impacts that are generally below the $250 million threshold utilized for identified items. When the effect of these events is significant in aggregate, it is indicated in analysis of period results as part of quarterly earnings press release and teleconference materials. The press release also includes Earnings/(Loss) Excluding Identified Items and Estimated Timing Effects (non-GAAP) and Earnings/(Loss) Excluding Identified Items and Estimated Timing Effects Per Common Share (non-GAAP), which further excludes estimated timing effects, both favorable and unfavorable that are primarily related to unsettled derivatives which are required to be marked to current period-end prices (mark-to-market), where the associated physical shipments are not reflected in earnings until the physical transaction is complete. It also includes estimated recognition differences between the settlement of derivatives and their offsetting physical commodity realizations (due to LIFO inventory accounting). Impacts are expected to unwind in subsequent periods. Management uses these figures to improve comparability of the underlying business across multiple periods by isolating and removing significant non-operational events from business results. The Corporation believes these views provide investors increased transparency into business results and trends and provide investors with a view of the business as seen through the eyes of management. Earnings excluding Identified Items and Earnings excluding Identified Items and Estimated Timing Effects are not meant to be viewed in isolation or as a substitute for net income/(loss) attributable to ExxonMobil as prepared in accordance with U.S. GAAP. A reconciliation to each of corporate earnings and segment earnings are shown for 2025 and 2026 periods in Attachments II-a and II-b. Earnings excluding Identified Items per share and Earnings excluding Identified Items and Estimated Timing Effects per share amounts are shown on page 1 and in Attachment II-a, including a reconciliation to earnings/(loss) per common share – assuming dilution (U.S. GAAP).
This press release also includes total taxes including sales-based taxes. This is a broader indicator of the total tax burden on the Corporation’s products and earnings, including certain sales and value-added taxes imposed on and concurrent with revenue-producing transactions with customers and collected on behalf of governmental authorities (“sales-based taxes”). It combines “Income taxes” and “Total other taxes and duties” with sales-based taxes, which are reported net in the income statement. The company believes it is useful for the Corporation and its investors to understand the total tax burden imposed on the Corporation’s products and earnings. A reconciliation to total taxes is shown in Attachment I-a.
This press release also references free cash flow (non-GAAP). Free cash flow is the sum of net cash provided by operating activities, net cash flow used in investing activities excluding cash acquired from mergers and acquisitions, and inflows from noncontrolling interests for major projects from financing activities. This measure is useful when evaluating cash available for financing activities, including shareholder distributions, after investment in the business. Free cash flow is not meant to be viewed in isolation or as a substitute for net cash provided by operating activities. A reconciliation to net cash provided by operating activities for the 2025 and 2026 periods is shown on page 6.
This press release also references total cash capital expenditures (non-GAAP). Cash capital expenditures are the sum of additions to property, plant and equipment; additional investments and advances; and other investing activities including collection of advances; reduced by inflows from noncontrolling interests for major projects, each from the Consolidated Statement of Cash Flows, and excludes advances and collections not related to capital expenditures or equity investments, for example, supply and marketing related advances and associated collections. The company believes it is a useful measure for investors to understand the cash impact of investments in the business, which is in line with standard industry practice. A breakdown of cash capex is shown on page 7.
10
References to resources or resource base may include quantities of oil and natural gas classified as proved reserves, as well as quantities that are not yet classified as proved reserves, but that are expected to be ultimately recoverable. The term “resource base” or similar terms are not intended to correspond to SEC definitions such as “probable” or “possible” reserves. A reconciliation of production excluding divestments, entitlements, and government mandates to actual production is contained in the Supplement to this release included as .2 to the Form 8-K filed the same day as this news release.
The term “project” as used in this news release can refer to a variety of different activities and does not necessarily have the same meaning as in any government payment transparency reports. Projects or plans may not reflect investment decisions made by the company. Individual opportunities may advance based on a number of factors, including availability of supportive policy, technology for cost-effective abatement, and alignment with our partners and other stakeholders. The company may refer to these opportunities as projects in external disclosures at various stages throughout their progression.
Advantaged assets (Advantaged growth projects) when used in reference to the Upstream business, includes Permian, Guyana, and LNG.
Advantaged projects refers to capital projects and programs of work that contribute to Energy, Chemical, and/or Specialty Products segments that drive integration of segments/businesses, increase yield of higher value products, or deliver higher than average returns.
Base portfolio (Base) in our Upstream segment, refers to assets (or volumes) other than advantaged assets (or volumes from advantaged assets). In our Energy Products segment, refers to assets (or volumes) other than advantaged projects (or volumes from advantaged projects). In our Chemical Products and Specialty Products segments, refers to volumes other than high-value products volumes.
Compound annual growth rate (CAGR) represents the consistent rate at which an investment or business result would have grown had the investment or business result compounded at the same rate each year.
Debt-to-capital ratio is total debt divided by the sum of total debt and equity. Total debt is the sum of notes and loans payable and long-term debt, as reported in the Consolidated Balance Sheet.
Government mandates (curtailments) are changes to ExxonMobil’s sustainable production levels as a result of production limits or sanctions imposed by governments.
High-value products include performance products and lower-emission fuels.
IOCs, unless stated otherwise, includes each of BP, Chevron, Shell and TotalEnergies.
Lower-emission fuels are fuels with lower life cycle emissions than conventional transportation fuels for gasoline, diesel and jet transport.
Net-debt-to-capital ratio is net debt divided by the sum of net debt and total equity, where net debt is total debt net of cash and cash equivalents, excluding restricted cash. Total debt is the sum of notes and loans payable and long-term debt, as reported in the consolidated balance sheet.
Performance products (performance chemicals, performance lubricants) refer to products that provide differentiated performance for multiple applications through enhanced properties versus commodity alternatives and bring significant additional value to customers and end-users.
Shareholder distributions are the Corporation's distributions of cash to shareholders in the form of both dividends and share purchases. Shares are acquired to reduce shares outstanding and to offset shares or units settled in shares issued in conjunction with company benefit plans and programs. For the purposes of calculating distributions to shareholders, the Corporation includes only the cost of those shares acquired to reduce shares outstanding.
Total shareholder return (TSR) is defined by FactSet and measures the change in value of an investment in common stock over a specified period of time, assuming dividend reinvestment. FactSet assumes dividends are reinvested in stock at market prices on the ex-dividend date. Unless stated otherwise, total shareholder return is quoted on an annualized basis.
This press release also references Structural Cost Savings, for more details see page 8.
Unless otherwise indicated, year-to-date (“YTD”) means as of the last business day of the most recent fiscal quarter.
Reference to Earnings
References to corporate earnings mean net income attributable to ExxonMobil (U.S. GAAP) from the consolidated income statement. Unless otherwise indicated, references to earnings, Upstream, Energy Products, Chemical Products, Specialty Products and Corporate and Financing earnings, and earnings per share are ExxonMobil’s share after excluding amounts attributable to noncontrolling interests.
Exxon Mobil Corporation has numerous affiliates, many with names that include ExxonMobil, Exxon, Mobil, Esso, and XTO. For convenience and simplicity, those terms and terms such as Corporation, company, our, we, and its are sometimes used as abbreviated references to specific affiliates or affiliate groups. Similarly, ExxonMobil has business relationships with thousands of customers, suppliers, governments, and others. For convenience and simplicity, words such as venture, joint venture, partnership, co-venturer, and partner are used to indicate business and other relationships involving common activities and interests, and those words may not indicate precise legal relationships. ExxonMobil's ambitions, plans and goals do not guarantee any action or future performance by its affiliates or Exxon Mobil Corporation's responsibility for those affiliates' actions and future performance, each affiliate of which manages its own affairs.
Throughout this press release, both as well as .2, due to rounding, numbers presented may not add up precisely to the totals indicated.
11
ATTACHMENT I-a
CONDENSED CONSOLIDATED STATEMENT OF INCOME
(Preliminary)
Dollars in millions (unless otherwise noted)
Three Months Ended March 31,
2026
2025
Revenues and other income
Sales and other operating revenue
83,161
81,058
Income from equity affiliates
1,369
1,369
Other income
608
703
Total revenues and other income
85,138
83,130
Costs and other deductions
Crude oil and product purchases
51,802
46,788
Production and manufacturing expenses
10,695
10,083
Selling, general and administrative expenses
2,684
2,540
Depreciation and depletion (includes impairments)
6,771
5,702
Exploration expenses, including dry holes
126
64
Non-service pension and postretirement benefit expense
62
113
Interest expense
295
205
Other taxes and duties
5,736
6,035
Total costs and other deductions
78,171
71,530
Income/(Loss) before income taxes
6,967
11,600
Income tax expense/(benefit)
2,495
3,567
Net income/(loss) including noncontrolling interests
4,472
8,033
Net income/(loss) attributable to noncontrolling interests
289
320
Net income/(loss) attributable to ExxonMobil
4,183
7,713
OTHER FINANCIAL DATA
Dollars in millions (unless otherwise noted)
Three Months Ended March 31,
2026
2025
Earnings per common share (U.S. dollars)
1.00
1.76
Earnings per common share - assuming dilution (U.S. dollars)
1.00
1.76
Dividends on common stock
Total
4,334
4,335
Per common share (U.S. dollars)
1.03
0.99
Millions of common shares outstanding
Average - assuming dilution
4,202
4,372
Taxes
Income taxes
2,495
3,567
Total other taxes and duties
6,775
7,066
Total taxes
9,270
10,633
Sales-based taxes
5,177
5,470
Total taxes including sales-based taxes
14,447
16,103
ExxonMobil share of income taxes of equity companies (non-GAAP)
477
657
12
ATTACHMENT I-b
CONDENSED CONSOLIDATED BALANCE SHEET
(Preliminary)
Dollars in millions (unless otherwise noted)
March 31,
2026
December 31, 2025
ASSETS
Current assets
Cash and cash equivalents
8,435
10,681
Notes and accounts receivable – net
61,783
44,562
Inventories
Crude oil, products and merchandise
21,838
22,979
Materials and supplies
3,137
3,323
Other current assets
2,594
1,837
Total current assets
97,787
83,382
Investments, advances and long-term receivables
46,125
45,317
Property, plant, and equipment – net
298,781
299,373
Other assets, including intangibles – net
21,717
20,908
Total Assets
464,410
448,980
LIABILITIES
Current liabilities
Notes and loans payable
14,531
9,296
Accounts payable and accrued liabilities
77,088
60,911
Income taxes payable
2,759
2,123
Total current liabilities
94,378
72,330
Long-term debt
33,130
34,241
Postretirement benefits reserves
8,940
8,847
Deferred income tax liabilities
40,018
40,216
Long-term obligations to equity companies
562
542
Other long-term obligations
26,386
26,178
Total Liabilities
203,414
182,354
EQUITY
Common stock without par value
(9,000 million shares authorized, 8,019 million shares issued)
46,426
46,150
Earnings reinvested
482,344
482,494
Accumulated other comprehensive income
(11,098)
(10,863)
Common stock held in treasury
(3,874 million shares at March 31, 2026, and 3,840 million shares at December 31, 2025)
(263,291)
(258,395)
ExxonMobil share of equity
254,381
259,386
Noncontrolling interests
6,615
7,240
Total Equity
260,996
266,626
Total Liabilities and Equity
464,410
448,980
13
ATTACHMENT I-c
CONDENSED CONSOLIDATED STATEMENT OF CASH FLOWS
(Preliminary)
Dollars in millions (unless otherwise noted)
Three Months Ended March 31,
2026
2025
CASH FLOWS FROM OPERATING ACTIVITIES
Net income/(loss) including noncontrolling interests
4,472
8,033
Depreciation and depletion (includes impairments)
6,771
5,702
Changes in operational working capital, excluding cash and debt
(1,758)
(878)
All other items – net
(780)
96
Net cash provided by operating activities
8,705
12,953
CASH FLOWS FROM INVESTING ACTIVITIES
Additions to property, plant, and equipment
(6,470)
(5,898)
Proceeds from asset sales and returns of investments
219
1,823
Additional investments and advances
(387)
(153)
Other investing activities including collection of advances
632
93
Net cash used in investing activities
(6,006)
(4,135)
CASH FLOWS FROM FINANCING ACTIVITIES
Additions to long-term debt
894
280
Reductions in long-term debt
(158)
(7)
Reductions in short-term debt
(5,402)
(4,541)
Additions/(reductions) in commercial paper, and debt with three months or less maturity
9,075
(41)
Cash dividends to ExxonMobil shareholders
(4,334)
(4,335)
Cash dividends to noncontrolling interests
(168)
(141)
Changes in noncontrolling interests
61
(12)
Inflows from noncontrolling interests for major projects
—
22
Common stock acquired
(4,868)
(4,804)
Net cash provided by (used in) financing activities
(4,900)
(13,579)
Effects of exchange rate changes on cash
(45)
86
Increase/(Decrease) in cash and cash equivalents (including restricted)
(2,246)
(4,675)
Cash and cash equivalents at beginning of period (including restricted)
10,681
23,187
Cash and cash equivalents at end of period (including restricted)
8,435
18,512
14
ATTACHMENT II-a
KEY FIGURES: IDENTIFIED ITEMS AND ESTIMATED TIMING EFFECTS
Earnings/(Loss) Excluding Identified Items and Estimated Timing Effects (non-GAAP)
8,772
6,920
7,584
¹ Fourth quarter includes charge of $640 million associated with the optimization of materials and supply inventory. Materials and supplies impacts are included in production and manufacturing expenses on the Consolidated Statement of Income.
EARNINGS/(LOSS) EXCLUDING IDENTIFIED ITEMS AND ESTIMATED TIMING EFFECTS PER COMMON SHARE
Dollars per common share
1Q26
4Q25
1Q25
Earnings/(Loss) Per Common Share (U.S. GAAP) ¹
1.00
1.53
1.76
Identified Items Per Common Share ¹
Impairments ²
—
(0.40)
—
Gain/(Loss) on sale of assets
—
0.17
—
Tax-related items
—
0.07
—
Restructuring charges
—
(0.02)
—
Other
(0.16)
—
—
Total Identified Items Per Common Share ¹
(0.16)
(0.18)
—
Earnings/(Loss) Excluding Identified Items Per Common Share (non-GAAP) ¹
1.16
1.71
1.76
Estimated Timing Effects Per Common Share ¹
(0.92)
0.08
0.03
Earnings/(Loss) Excluding Identified Items and Estimated Timing Effects Per Common Share (non-GAAP) ¹
2.09
1.63
1.73
¹ Assuming dilution.
2 Fourth quarter includes charge of $640 million associated with the optimization of materials and supply inventory. Materials and supplies impacts are included in production and manufacturing expenses on the Consolidated Statement of Income.
15
ATTACHMENT II-b
KEY FIGURES: IDENTIFIED ITEMS AND ESTIMATED TIMING EFFECTS BY SEGMENT
First Quarter 2026
Upstream
Energy Products
Chemical Products
Specialty Products
Corporate & Financing
Total
Dollars in millions (unless otherwise noted)
U.S.
Non-U.S.
U.S.
Non-U.S.
U.S.
Non-U.S.
U.S.
Non-U.S.
Earnings/(Loss) (U.S. GAAP)
1,574
4,163
661
(1,923)
319
(209)
274
377
(1,053)
4,183
Identified Items
Other
—
—
—
(706)
—
—
—
—
—
(706)
Total Identified Items
—
—
—
(706)
—
—
—
—
—
(706)
Earnings/(Loss) Excl. Identified Items (non-GAAP)
1,574
4,163
661
(1,217)
319
(209)
274
377
(1,053)
4,889
Estimated Timing Effects (Worldwide)
(528)
(3,355)
—
—
—
(3,883)
Earnings/(Loss) Excl. Identified Items and Estimated Timing Effects (non-GAAP)
6,265
2,799
110
651
(1,053)
8,772
Fourth Quarter 2025
Upstream
Energy Products
Chemical Products
Specialty Products
Corporate & Financing
Total
Dollars in millions (unless otherwise noted)
U.S.
Non-U.S.
U.S.
Non-U.S.
U.S.
Non-U.S.
U.S.
Non-U.S.
Earnings/(Loss) (U.S. GAAP)
753
2,764
1,012
2,378
64
(345)
233
449
(807)
6,501
Identified Items
Impairments
(662)
(422)
(153)
(113)
(130)
(190)
(18)
(12)
—
(1,700)
Gain/(Loss) on sale of assets
—
—
—
720
—
—
—
—
—
720
Tax-related items
192
—
34
(6)
50
—
30
—
(11)
288
Restructuring charges
—
—
—
—
—
—
—
—
(64)
(64)
Total Identified Items
(471)
(422)
(118)
601
(80)
(190)
12
(12)
(75)
(755)
Earnings/(Loss) Excl. Identified Items (non-GAAP)
1,224
3,186
1,130
1,777
144
(155)
221
461
(732)
7,256
Estimated Timing Effects (Worldwide)
(19)
355
—
—
—
336
Earnings/(Loss) Excl. Identified Items and Estimated Timing Effects (non-GAAP)
4,429
2,552
(11)
682
(732)
6,920
First Quarter 2025
Upstream
Energy Products
Chemical Products
Specialty Products
Corporate & Financing
Total
Dollars in millions (unless otherwise noted)
U.S.
Non-U.S.
U.S.
Non-U.S.
U.S.
Non-U.S.
U.S.
Non-U.S.
Earnings/(Loss) (U.S. GAAP)
1,870
4,886
297
530
255
18
322
333
(798)
7,713
Total Identified Items
—
—
—
—
—
—
—
—
—
—
Earnings/(Loss) Excl. Identified Items (non-GAAP)
1,870
4,886
297
530
255
18
322
333
(798)
7,713
Estimated Timing Effects (Worldwide)
158
(29)
—
—
—
129
Earnings/(Loss) Excl. Identified Items and Estimated Timing Effects (non-GAAP)
6,598
856
273
655
(798)
7,584
16
ATTACHMENT III
KEY FIGURES: UPSTREAM VOLUMES
Net production of crude oil, natural gas liquids, bitumen and synthetic oil, thousand barrels per day (kbd)
1Q26
4Q25
1Q25
United States
1,586
1,663
1,418
Canada/Other Americas
936
919
760
Europe
3
3
4
Africa
138
148
137
Asia
611
774
796
Australia/Oceania
23
24
24
Worldwide
3,297
3,531
3,139
Net natural gas production available for sale, million cubic feet per day (mcfd)
1Q26
4Q25
1Q25
United States
3,589
3,435
3,266
Canada/Other Americas
28
21
42
Europe
313
289
331
Africa
114
113
118
Asia
2,500
3,598
3,457
Australia/Oceania
1,236
1,286
1,256
Worldwide
7,779
8,743
8,470
Oil-equivalent production (koebd) ¹
4,594
4,988
4,551
1 Natural gas is converted to an oil-equivalent basis at six million cubic feet per one thousand barrels.
17
ATTACHMENT IV
KEY FIGURES: MANUFACTURING THROUGHPUT AND SALES
Refinery throughput, thousand barrels per day (kbd)
1Q26
4Q25
1Q25
United States
1,795
1,983
1,789
Canada
384
408
397
Europe
733
1,000
986
Asia Pacific
386
480
447
Other
195
189
191
Worldwide
3,494
4,060
3,810
Energy Products sales, thousand barrels per day (kbd)
1Q26
4Q25
1Q25
United States
3,214
2,899
2,728
Non-U.S.
2,416
2,905
2,555
Worldwide
5,630
5,804
5,283
Gasolines, naphthas
2,214
2,369
2,162
Heating oils, kerosene, diesel
1,672
1,838
1,724
Aviation fuels
399
386
366
Heavy fuels
187
233
158
Other energy products
1,158
978
873
Worldwide
5,630
5,804
5,283
Chemical Products sales, thousand metric tons (kt)