| ANNUAL REPORT PURSUANT TO SECTION 13 OR 15(d) OF THE SECURITIES EXCHANGE ACT OF 1934 |
| TRANSITION REPORT PURSUANT TO SECTION 13 OR 15(d) OF THE SECURITIES EXCHANGE ACT OF 1934 |

| (State or other jurisdiction of incorporation or organization) |
(I.R.S. Employer Identification No.) |
(Street Address) |
(City) |
(State) |
(Zip Code) |
| Title of each class: |
Trading symbol(s): |
Name of exchange on which registered: | ||
| ☒ | Accelerated filer | ☐ | ||||
| Non-accelerated filer | ☐ | Smaller reporting company | ||||
| Emerging growth company | ||||||
| 3 | ||||
| 4 | ||||
| 4 | ||||
| 13 | ||||
| 46 | ||||
| 49 | ||||
| 50 | ||||
| 51 | ||||
| 51 | ||||
| 51 | ||||
| 55 |
| Name |
Biography | |
| W. Steve Albrecht Director since 2020 Age: 74 |
Expertise • Public Company Director • Financial/Mergers and Acquisitions • Technology | |
| Biographical Information Qualifications and Experience | ||
| Douglas C. Curling Director since 2012 Age: 66 |
Expertise • Public Company Chief Financial Officer and Chief Operating Officer • Technology • Real Estate/Insurance • Financial/Mergers and Acquisitions • Private Equity/Investing | |
| Biographical Information family-run investment business, and a principal at New Kent Consulting LLC, a consulting business that he founded.From 1997 until 2008, Mr. Curling held various executive positions at ChoicePoint Inc., a provider of identification and credential verification services that was sold to Reed Elsevier, including serving as President from 2002 to 2008, Chief Operating Officer from 1999 to 2008, and Executive Vice President, Chief Financial Officer and Treasurer from 1997 to 1999. Mr. Curling also served as a director of ChoicePoint Inc. from 2000 to 2008. Prior to joining ChoicePoint Inc., Mr. Curling served in various financial roles at Equifax, Inc., a credit bureau, from 1989 to 1997. Mr. Curling previously served as a director of Aaron’s, Inc. (NYSE: AAN) prior to its separation into two standalone public companies in late 2020. He currently serves as a director of Progressive Holdings Inc. (Nasdaq: PROG), a specialty point of sale lease-to-own Qualifications and Experience | ||
| John C. Dorman Director since 2012 Age: 70 |
Expertise • Public Company Chief Executive Officer • Technology • Financial/Mergers and Acquisitions • Private Equity/Investing | |
| Biographical Information co-Chairman in 2010, and interim Chief Executive Officer in 2010, of Online Resources Corporation, a developer and supplier of electronic payment services that was acquired by ACI Worldwide, Inc.Prior to that, from 1998 to 2003 he served as Chief Executive Officer of Digital Insight Corporation, a provider of software as a service for online banking and bill payment for financial institutions that was acquired by Intuit, Inc., and as Senior Vice President of the Global Financial Services Division of Oracle Corporation from 1997 to 1998. From 1983 to 1997, Mr. Dorman was the Chief Executive Officer of Treasury Services Corporation, a provider of modeling and analysis software for financial institutions, which was acquired by Oracle Corporation in 1997. Mr. Dorman currently serves as a director of LoanDepot, LLC, a national non-bank lender serving consumers, and DeepDyve, Inc., an online rental service for scientific and scholarly research.Qualifications and Experience | ||
| Paul F. Folino Director since 2011 Age: 76 |
Expertise • Public Company Chief Executive Officer • Technology • Financial/Mergers and Acquisitions | |
| Biographical Information Mr. Folino serves on the board of directors and is Chairman of the Nominating and Governance Committee of Lantronix, Inc., a provider of device networking and remote access products for remote IT management. He also serves as Lead Director of Commercial Bank of California, a full-service FDIC-insured community bank, and on the boards of several charitable organizations. Mr. Folino previously served on the board of directors of Microsemi Corporation, a provider of semiconductor solutions, from 2004 until its sale in 2018. Qualifications and Experience | ||
| Wendy Lane Director since 2020 Age: 70 |
Expertise • Financial/Mergers and Acquisitions • Risk Management • Private Equity/Investing | |
| Biographical Information Ms. Lane has served on the Board of Directors and as Chairman of the Compensation Committee of Willis Tower Watson (Nasdaq: WLTW) since 2016, and its predecessor company, Willis Group Holdings, and its Audit Committee from 2004 to 2019, chairing its Compensation Committee since 2012. Her prior Board of Director experience includes, among others, MSCI, Inc. (NYSE: MSCI), where she served on the Compensation Committee, Laboratory Corporation of America, where she served on the Nominating and Corporate Governance Committee and chaired the Audit and Compensation Committees, and UPM Kymmene Corporation (OTCMKTS: UPMMY), a Finnish public company, where she served on the Audit Committee. She has also served on the board of the private Saudi Arabian company Al-Dabbagh Group since 2014 and founded and chairs the Audit Committee. She also serves as Lead Director and Chair of the Audit Committee since 2020 for Nextpoint Acquisition Corp.Qualifications and Experience | ||
| Frank D. Martell Director since 2017 Age: 61 |
Expertise • Public Company Chief Executive Officer, Chief Financial Officer and Chief Operating Officer • Technology • Real Estate/Insurance • Financial/Mergers and Acquisitions • Private Equity/Investing | |
| Biographical Information Before joining the Company, Mr. Martell served as President and Chief Executive Officer of the Western Institutional Review Board from 2010 to 2011, a leading provider of review, approval and oversight for clinical research studies involving human subjects. Before that, he served as Chief Financial Officer of Information Services Group, Inc. from 2007 to 2009 and Advantage Solutions from 2009 to 2010. From 1996 to 2006, Mr. Martell held various leadership positions at ACNielsen Corporation, including President of Asia Pacific and Emerging Markets, Executive Vice President of the Marketing Information Group, and Chief Operating Officer of ACNielsen and President of Europe, Middle East and Africa. Mr. Martell spent the first 15 years of his business career in a variety of financial leadership roles at General Electric. Mr. Martell currently serves on the board of directors of Bank of the West, a subsidiary of BNP Paribas, and the Mortgage Bankers Association. Mr. Martell also serves on the board of directors of Operation HOPE, a provider of financial literacy empowerment for youth and financial capability for communities. Qualifications and Experience | ||
| Claudia Fan Munce Director since 2017 Age: 61 |
Expertise • Technology • Financial/Mergers and Acquisitions • Private Equity/Investing | |
| Biographical Information Previously, she served as a Managing Director of IBM Venture Capital Group and Vice President of Corporate Development at IBM Corp. from 2004 to 2015; Director of Strategy, IBM Venture Capital Group from 2003 to 2004; and Head of Technology Transfer and Licensing, IBM Research from 1994 to 2000. Ms. Munce serves on the board of directors of Best Buy Co., Inc., a retailer of electronic goods and services, and Bank of the West, a wholly-owned subsidiary of BNP Paribas, as well as several industry boards of directors including NACD. Qualifications and Experience | ||
| Pamela Hughes Patenaude Director since 2020 Age: 60 |
Expertise • Government/Regulatory • Real Estate/Insurance • Financial | |
| Biographical Information day-to-day Ms. Patenaude previously served in other leadership positions at HUD, including Assistant Secretary for Community Planning and Development and Assistant Deputy Secretary for Field Policy and Management. From 2014 to 2017, Ms. Patenaude served as President of the J. Ronald Terwilliger Foundation for Housing America’s Families. Ms. Patenaude has also served in several leadership positions at institutions focused on housing policy and community development including the Director of Housing Policy for the Bipartisan Policy Center, Executive Vice President of the Urban Land Institute (ULI) and Founding Executive Director of the ULI Terwilliger Center for Workforce Housing. Ms. Patenaude currently serves on the Board of Directors of Habitat for Humanity International, the Bipartisan Policy Center and is a Trustee of the Homebuilders Institute (HBI). In addition, she serves as a member of the Board of Directors of the FDIC Advisory Committee on Economic Inclusion. Qualifications and Experience | ||
| Vikrant Raina Director since 2017 Age: 53 |
Expertise • Technology • Financial/Mergers and Acquisitions • Private Equity/Investing | |
| Biographical Information mid-market private equity firm focused on technology services and business services sectors, since 1999, where he currently manages the firm’s investment strategy, risk management and limited partnership relations activities and chairs the Investment, Operating and Valuation committees.Prior to that, he was an Executive Director in the communications, media and technology group at Goldman Sachs (Asia) and a project leader at The Boston Consulting Group. Through his role at BV Investment Partners, Mr. Raina serves on a variety of private company boards of directors. Qualifications and Experience | ||
| J. Michael Shepherd Director since 2019 Age: 65 |
Expertise • Public Company Director • Real Estate/Insurance • Regulatory • Financial | |
| Biographical Information Prior to joining Bank of the West, Mr. Shepherd served as General Counsel of The Bank of New York Company, Inc. and Shawmut National Corporation. Mr. Shepherd also served in various public sector appointments, including Senior Deputy Comptroller of the Currency, Associate Counsel to the President of the United States, and Deputy Assistant Attorney General. He also has served as a member and the President of the Federal Advisory Council of the Federal Reserve Board, as a member of the FDIC Advisory Committee on Economic Inclusion, as a director of the Presidio Trust, and as a director of The Clearing House. Mr. Shepherd currently serves as a director of Pacific Mutual Holdings (the parent of the Pacific Life Insurance Company) and BNP Paribas USA. He is also a member of the Council on Foreign Relations and is a member of the Business Executive Council of the University of California. Mr. Shepherd also previously served as a member of the board of directors of First Hawaiian, Inc. until his resignation in September 2018. Qualifications and Experience top-tier commercial and retail banking leadership, and his perspectives gained through his diverse experience, are an important contribution to the Board’s oversight of CoreLogic. | ||
| Jaynie Miller Studenmund Director since 2012 Age: 66 |
Expertise • Public Company Chief Operating Officer • Marketing, Product Management, Strategy, and Team Building • Financial/Mergers and Acquisitions | |
| Biographical Information C-suite line operating roles, and public board service. She spent the first stage of her career leading three of the Nation’s largest consumer banking businesses, and then pivoted to being the Chief Operating Officer for two internet-digital companies in the early days of the internet. Since 2004, she has focused on public boards and nonprofits. Her career has been primarily in digital, data, and financial services companies.From 2001 to 2004, Ms. Studenmund was Chief Operating Officer of Overture Services Inc., a public company that transformed online advertising by pioneering paid search and helped create what is today the $60 billion SEM (search engine marketing) industry and was acquired by Yahoo. Overture successfully scaled and experienced hyper growth during her three-year tenure. From 1999 to 2001, she was President & Chief Operating Officer of PayMyBills, a leading bill management company. From 1982 to 1997, Ms. Studenmund held executive positions in the financial services industry and was, in succession, the EVP and top executive responsible for retail and consumer businesses during the era of deregulation, growth, and consolidation, first at First Interstate of California (now Wells Fargo) and then Great Western Bank and Home Savings (now JP Morgan Chase). She began her career in management consulting with Booz, Allen & Hamilton and Data Resources Inc. Today Ms. Studenmund serves on the Board of Directors of Pacific Premier Bancorp Inc., a regional bank; Exl Service Holdings, Inc., a global digital intelligence, data analytics, and operations management company; and funds for Western Asset Management, a global fixed income investment manager. Previous public company Boards of Directors include Pinnacle Entertainment, an owner, operator, and developer of casinos and entertainment properties, from 2012 to 2018; LifeLock, Inc., an identity theft protection and fraud management company, from 2015 to 2017; Orbitz Worldwide, Inc., a leading online travel firm, from 2007 to 2014; and aQuantive, an advertising agency and digital ad serving platform from 2004 to 2007. She also currently serves as a Board Leadership Fellow for the National Association of Corporate Directors (NACD). Qualifications and Experience C-suite profit center and line operating experience, especially with fast-growing, innovative companies, and deep experience as a director of public companies, is particularly useful background for our Compensation and Nominating and Governance Committees. | ||
| Henry W. “Jay” Winship Director since 2020 Age: 53 |
Expertise • Financial/Mergers and Acquisitions • Private Equity/Investing • Real Estate/Insurance • Corporate Governance • Risk Management | |
| Biographical Information Mr. Winship currently serves on the Board of Directors and as Chair of the Audit Committee of Bunge Limited (NYSE: BG). He was previously on the Board of Directors of Esterline Technologies Corporation (NYSE: ESL) and Excel National Bank. Mr. Winship is on the Board of Advisors of the Corporate Governance Institute at San Diego State University Fowler College of Business. Mr. Winship is a Certified Public Accountant and holds the professional designation of Certified Financial Analyst. Qualifications and Experience | ||
| Name |
Position(s) Held |
Age | ||
| Frank D. Martell | President and Chief Executive Officer | 61 | ||
| James L. Balas | Chief Financial Officer | 50 | ||
| Patrick L. Dodd | Chief Operating and Growth Officer | 53 | ||
| Barry M. Sando | Managing Director, Underwriting and Workflow Solutions | 61 | ||
| Francis Aaron Henry | Chief Legal Officer and Corporate Secretary | 55 | ||
| • | Frank D. Martell |
| • | Mr. Balas 10-year career at Ernst & Young and Capgemini. |
| • | Mr. Dodd |
| • | Mr. Sando |
| • | Mr. Henry |
Item 11. |
Executive Compensation |
| Named Executive Officer |
Position as of December 31, 2020 | |
Frank D. Martell |
President and Chief Executive Officer | |
James L. Balas |
Chief Financial Officer | |
Patrick Dodd |
Chief Operating and Growth Officer (1) | |
Barry M. Sando |
Managing Director, Underwriting and Workflow Solutions | |
Francis Aaron Henry |
Chief Legal Officer and Corporate Secretary |
| (1) | Mr. Dodd joined CoreLogic on September 1, 2020. |
| • | Strong total and organic revenue growth fueled by a combination of share gains (including major contract wins in both of our operating segments), successful product launches and enhancements, and elevated U.S. housing market volumes. |
| • | Boosting our percentage of non-U.S. mortgage revenues from 40% to approximately 45% of total revenue, in line with long-term goals. |
| • | Initiating the sale of our Credit Solutions and Tenant Screening reseller businesses with expected completion in the second half of 2021. The completion of these divestitures should result in improved margins and reduced cyclicality, and a higher mix of fixed recurring revenues. |
| • | Investing in strategic programs related to technology and data-related capabilities with a focus on data structures, visualization, technology platforms and advanced automation techniques. |
| • | Rolling out our new digital tax payment processing solution, our state-of-the-art |
| • | Continuing to successfully migrate our technology stack to the Google Cloud Platform (“GCP”). |
| • | Improving profit margins through the successful evolution of our revenue mix toward higher-margin solutions, as well as delivering productivity and cost management upsides. |
| • | Successfully navigating the COVID-19 pandemic with a strong focus on employee health and welfare while continuing to deliver superior solutions and service levels for our clients. |
| • | Revenues from continuing operations of $1.642 billion, an increase of 14%. |
| • | Net income from continuing operations of $264 million, up by $230 million over the prior year. |
| • | Adjusted earnings before interest, taxes, depreciation, and amortization (“EBITDA”) increased to $638 million, an increase of $198 million, or 45% above 2019 levels. |
| • | Adjusted EBITDA margins up more than 800 bps to 39% through a combination of revenue outperformance, favorable business mix shift, and benefits from our continued productivity initiatives. |
| • | Adjusted earnings per share (“EPS”) of $4.26 grew by 77% compared to the prior year. |
| • | Cost management and productivity benefits of more than $25 million. |
| • | Generated net operating cash provided by continuing operations of $491 million and free cash flow (“FCF”) of $392 million, while simultaneously escalating reinvestment in growth generating initiatives and productivity programs. |
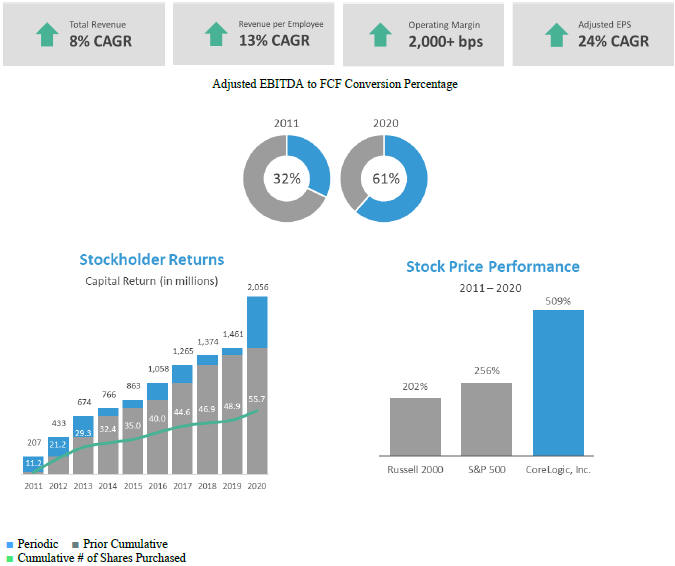
| • | Returned more than $509 million in capital to stockholders through repurchase of approximately 8.5% of our common shares. |
| • | Paid our first ever dividend to stockholders of $0.22 per share in January 2020 with the same value paid again in June 2020. Announced a 50% increase in dividends in July, and subsequently paid two additional dividends of $0.33 each in September and December of 2020, resulting in an $86 million return of capital to stockholders over the course of 2020. |
| • | Delivered total stockholder returns (“TSR”) (1) of more than 80%. |
| (1) | TSR is defined as the change in share price plus the value of dividends paid assuming reinvestment. |

| Strategic Focus |
2020 Accomplishments | |
Growth and Innovation |
• Achieved organic growth of 8% during the course of 2020 primarily through market share gains and various customer wins • Increased mix of non-US mortgage sensitive businesses to approximately 45% of total revenues• Out-performed US mortgage market volume trends primarily in property tax payment processing, flood zone determination• Expanded market share through solution packages and product introduction • Invested in strategic cutting-edge data and technology-related enhancements, artificial intelligence, and visualization to enhance future growth and offering capabilities | |
Operational Excellence |
• Deployed GCP operating model, and migrated significant systems and applications to the GCP to further enhance technology infrastructure capabilities and efficiencies • Exceeded productivity savings target of $20 million through automation, outsourcing and partnerships, real estate consolidation and other workflow enhancements • Expanded adjusted EBITDA margins by more than 800 basis points for the full year to 39%; adjusted EBITDA margins exceeded 40% during the second half of 2020, significantly ahead of targeted levels and the prior-year period • Generated strong operating cash flow, which facilitated heightened investment levels, the repurchase of $509 million of our common shares, and the initiation of a quarterly dividend while simultaneously reducing our debt covenant leverage to under 3.0 times |
High Performing Organization |
• Navigated COVID-19 pandemic by protecting employee health and well-being while delivering on client commitments and achieving record performance• Deepened senior level talent bench with strategic hires including Chief Operating & Growth Officer, Chief Marketing Officer, GM Insurance, as well as key hires in legal, finance, science & analytics, insurance, and credit • Strengthened diversity in all ethnic categories, appointed 10 women to executive positions, and expanded our ESG programs • Enhanced compliance and information security organizations and capabilities while exceeding key cyber security-related performance targets • Expanded training and development focus with the implementation of new learning platform, training programs, and self-development capabilities • Grew common share price more than 80% during the 2020 calendar year |
What We Do |
What We Don’t Do | |||
| ✓ Tie annual incentives to achievement of multiple rigorous financial and operating goals |
× | |||
| ✓ Use performance-based vesting for 50% of long-term compensation, tied to achievement of stretch EPS targets and TSR relative to our peers |
× | |||
| ✓ Cap performance-based vesting of performance shares at 150% of target if 3-year TSR ranks below 55th percentile of our peers |
× | |||
| ✓ Require achievement of threshold adjusted net income level for restricted stock unit (“RSU”) awards to vest |
× | |||
| ✓ Review total compensation relative to a peer group of industry-aligned companies with similar executive talent needs |
× gross-ups upon termination with a change in control or tax gross-ups for other compensation | |||
| ✓ Maintain robust stock ownership guidelines and require covered executives to retain 50% of net after-tax shares earned until the guidelines are met |
× | |||
| ✓ Maintain a claw-back policy for incentive payments |
× change-of-control | |||
| ✓ Use an independent compensation consultant retained directly by the Committee, in its sole discretion, who performs no consulting or other services for management |
||||
| ✓ Require double trigger for accelerated vesting of equity awards and for severance benefits upon termination of employment following a change in control |
||||
| ✓ Assess annually potential risks relating to our compensation policies and practices |
||||
| Compensation Philosophy |
• Attract, motivate and retain highly qualified executive officers critical to our long-term success • Align the interests of our executive officers with the interests of our stockholders • Reward executive officers for achieving pre-defined rigorous financial goals and strategic objectives that may not yield current-period financial results but are expected to position us for enhanced results in future periods• Encourage strategic long-term development and profitable investment in the business • Motivate and reward appropriate risk-taking to grow the business • Support pay practices with strong corporate governance and independent board oversight | |
| Compensation Program Primary Elements |
• Base salary • Annual cash incentive compensation plan awards • Long-term equity incentives • Other compensation (welfare, retirement, termination and other benefits) | |


ELEMENT |
DESCRIPTION |
ROLE AND PURPOSE | ||||||||||
REWARDS STRATEGY |
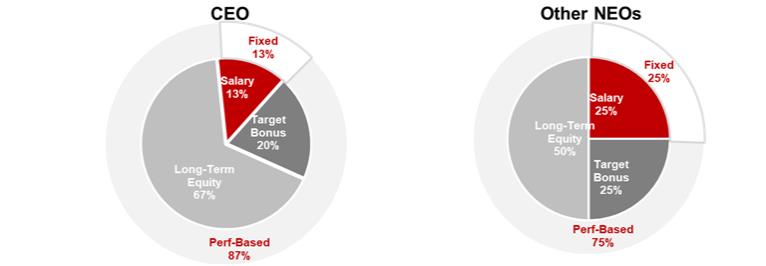
Review target total pay relative to market median and determine individual pay based on experience and performance Tie approximately 75% or more of NEO target pay opportunity to operating results and share price performance |
Provide market-competitive mix of base salary, cash incentives and equity incentives Align compensation to results for our stockholders | ||||||||||
BASE SALARY |
Competitive fixed compensation Base salary increased primarily for sustained performance or promotions |
Provide competitive level of fixed pay to attract, motivate and retain highly qualified executives Control fixed costs and emphasize pay for performance through limited salary increases | ||||||||||
| ANNUAL INCENTIVE COMPENSATION PROGRAM (ICP) |
Base incentives on performance against rigorous targets for revenue, adjusted EBITDA, FCF and strategic goals | Motivate and reward achievement of key financial goals and strategic accomplishments that drive long-term stockholder value | ||||||||||
LONG-TERM EQUITY INCENTIVES (LTI) |
Performance- Based Restricted Stock Units (PBRSUs) |
50% of 2020 total LTI grant value for executive officers Shares earned based on three years of adjusted EPS performance, modified by TSR relative to our peers |
Focus and reward for achievement of operating results over the long term Use of operating results and relative TSR ensures alignment of payouts with our performance relative to the broader market EPS growth has been highly aligned with our share price | |||||||||
Restricted Stock Units (RSUs) |
50% of 2020 total LTI grant value for executive officers Grants vest ratably over three years Requires achievement of threshold adjusted net income goal to be eligible for vesting |
Enhance retention of key talent Value at vesting based on share price, which aligns executives with stockholders’ interests | ||||||||||
RETIREMENT PROGRAMS |
401(k) program for all employees Legacy supplemental executive retirement plan frozen in 2010 with no new entrants allowed |
Provide market-prevalent retirement programs Focus executives on accumulating savings | ||||||||||
PERQUISITES |
Limited benefits available | Focus executives on rewards from value-creating activities | ||||||||||
| • | role, including the scope and complexity of responsibilities |
| • | experience and capabilities, including institutional knowledge |
| • | contributions or responsibilities beyond the typical scope of the role |
| • | individual performance |
| • | positioning relative to our other executive officers |
| • | difficulty in recruiting a replacement, and |
| • | competitive compensation opportunities provided by our peers and other competitors for similar executive talent |
| CORELOGIC 2020 PEER GROUP | ||||||||||||||||||||||||||||||||||||||||
| Company Name |
Revenue 1 ($MM) |
Market Value (12/31/2020) ($MM) |
EBITDA Margin 1 (%) |
Comparator Group Rationale | ||||||||||||||||||||||||||||||||||||
Comparable Revenue Size 2 |
Comparable Market Value 2 |
Data Analytics |
Mortgage Origination |
Direct Talent Competitor | ||||||||||||||||||||||||||||||||||||
| Fidelity National Information Services, Inc. | $ | 12,578 | $ | 87,777 | 35 | % | ✓ | |||||||||||||||||||||||||||||||||
| Fidelity National Financial, Inc. | $ | 9,413 | $ | 11,480 | 18 | % | ✓ | ✓ | ||||||||||||||||||||||||||||||||
| Global Payments Inc. | $ | 7,481 | $ | 64,483 | 38 | % | ||||||||||||||||||||||||||||||||||
| First American Financial Corporation | $ | 6,664 | $ | 5,764 | 16 | % | ✓ | ✓ | ✓ | |||||||||||||||||||||||||||||||
| Realogy Holdings Corp. | $ | 5,510 | $ | 1,515 | 10 | % | ✓ | |||||||||||||||||||||||||||||||||
| Gartner, Inc. | $ | 4,190 | $ | 14,303 | 16 | % | ✓ | |||||||||||||||||||||||||||||||||
| PennyMac Financial Services, Inc. | $ | 4,062 | $ | 4,754 | — | ✓ | ✓ | |||||||||||||||||||||||||||||||||
| Equifax Inc. | $ | 3,915 | $ | 23,458 | 27 | % | ✓ | |||||||||||||||||||||||||||||||||
| Zillow Group, Inc. | $ | 3,495 | $ | 30,611 | -1 | % | ✓ | |||||||||||||||||||||||||||||||||
| Verisk Analytics, Inc. | $ | 2,748 | $ | 33,752 | 45 | % | ✓ | ✓ | ||||||||||||||||||||||||||||||||
| Mr. Cooper Group Inc. | $ | 2,520 | $ | 2,819 | 42 | % | ✓ | ✓ | ✓ | |||||||||||||||||||||||||||||||
| FLEETCOR Technologies, Inc. | $ | 2,470 | $ | 22,754 | 52 | % | ✓ | ✓ | ✓ | |||||||||||||||||||||||||||||||
| Euronet Worldwide, Inc. | $ | 2,470 | $ | 7,581 | 13 | % | ✓ | ✓ | ||||||||||||||||||||||||||||||||
| Jack Henry & Associates, Inc. | $ | 1,711 | $ | 12,362 | 26 | % | ✓ | ✓ | ✓ | |||||||||||||||||||||||||||||||
| Radian Group Inc. | $ | 1,457 | $ | 3,879 | 42 | % | ✓ | ✓ | ✓ | |||||||||||||||||||||||||||||||
| Fair Isaac Corporation | $ | 1,295 | $ | 14,870 | 29 | % | ✓ | ✓ | ✓ | ✓ | ||||||||||||||||||||||||||||||
| MGIC Investment Corporation | $ | 1,208 | $ | 4,249 | 60 | % | ✓ | ✓ | ✓ | |||||||||||||||||||||||||||||||
| Black Knight, Inc. | $ | 1,197 | $ | 13,733 | 34 | % | ✓ | ✓ | ✓ | ✓ | ||||||||||||||||||||||||||||||
| CSG Systems International, Inc. | $ | 985 | $ | 1,428 | 17 | % | ✓ | |||||||||||||||||||||||||||||||||
| Altisource Portfolio Solutions S.A. | $ | 446 | $ | 202 | 3 | % | ✓ | |||||||||||||||||||||||||||||||||
Peer Group Summary Statistics |
||||||||||||||||||||||||||||||||||||||||
| 75th %ile | $ | 5,180 | $ | 23,282 | 42 | % | — |
— |
— |
— |
— |
|||||||||||||||||||||||||||||
| Median | $ | 2,634 | $ | 11,921 | 27 | % | — |
— | — |
— |
— |
|||||||||||||||||||||||||||||
| 25th %ile | $ | 1,335 | $ | 3,972 | 16 | % | — |
— |
— | — | — | |||||||||||||||||||||||||||||
| CoreLogic | $ | 1,849 | $ | 6,014 | 25 | % | — |
— | — |
— |
— |
|||||||||||||||||||||||||||||
| Percent Rank | 35% | 31% | 46 | % | ||||||||||||||||||||||||||||||||||||
| (1) | Data above reflects most recent fiscal year (2020) results when available; if FY20 financial results not yet released at the time of this report, revenue and EBITDA data reflect 12-month trailing results for Q4 of 2019 and Q1 - Q3 of 2020. |
| (2) | The Committee reviews executive officer pay relative to the median pay of comparable positions in Peer Group companies. |
Named Executive Officer |
2019 |
2020 |
||||||
| Frank D. Martell |
$ | 825,000 | $ | 900,000 | ||||
| James L. Balas |
$ | 475,000 | $ | 475,000 | ||||
| Patrick Dodd (1) |
— | $ | 650,000 | |||||
| Barry M. Sando |
$ | 550,000 | $ | 550,000 | ||||
| Francis Aaron Henry |
$ | 475,000 | $ | 475,000 | ||||
| (1) | Mr. Dodd was hired on September 1, 2020. |
ICP Bonus |
||||||||||||||||||
Name |
Title |
Base Salary ($000s) |
% of Salary (Target) |
Target ($000s) |
Maximum ($000s) |
|||||||||||||
| Frank D. Martell |
President and CEO | $ | 900 | 150 | % | $ | 1,350 | $ | 2,700 | |||||||||
| James L. Balas |
Chief Financial Officer | $ | 475 | 100 | % | $ | 475 | $ | 950 | |||||||||
| Patrick Dodd |
Chief Operating and Growth Officer | $ | 650 | 100 | % | $ | 650 | $ | 1,300 | |||||||||
| Barry M. Sando |
Managing Director, Underwriting and Workflow Solutions | $ | 550 | 100 | % | $ | 550 | $ | 1,100 | |||||||||
| Francis Aaron Henry |
Chief Legal Officer and Corporate Secretary | $ | 475 | 100 | % | $ | 475 | $ | 950 | |||||||||
| • | Revenue (GAAP) |
| • | Adjusted EBITDA — non-GAAP metric calculated as net income from continuing operations adjusted for interest, taxes, depreciation and amortization, stock compensation, non-operating gains/losses and other adjustments. |
| • | Free Cash Flow (FCF) — non-GAAP metric calculated as net cash from continuing operating activities, less capital expenditures for purchases of property and equipment, capitalized data and other intangible assets. |
| Revenue |
34 | % | ||||
| Adjusted EBITDA |
33 | % | ||||
| Free Cash Flow |
33 | % |
| Performance Level |
Less than Threshold |
Threshold |
Target |
Maximum and Above |
||||||||||||
| Performance as % of Target |
< 80 | % | 80 | % | 100 | % | 120 | % | ||||||||
| Payout as a % of Target |
0 | % | 34 | % | 100 | % | 200 | % | ||||||||
| Financial Performance Metric |
Weight |
Target ($000) |
Actual 2020 Results ($000) |
Percentage Achieved |
Funding Percentage |
|||||||||||||||
| 2020 Revenue |
34 | % | $ | 1,410 | $ | 1,642 | 116.5 | % | 182.4 | % | ||||||||||
| 2020 Adjusted EBITDA |
33 | % | $ | 460 | $ | 638 | 138.8 | % | 200.0 | % | ||||||||||
| 2020 Free Cash Flow |
33 | % | $ | 230 | $ | 392 | 170.5 | % | 200.0 | % | ||||||||||
| |
|
|
|
|
|
|||||||||||||||
| Total |
100 |
% |
141.1 |
% |
194.0 |
% | ||||||||||||||
| |
|
|
|
|
|
|||||||||||||||
ICP Target |
Financial Results |
Individual Strategic Results |
ICP Award |
|||||||||||||||||||||||||
| Name |
($000) |
% of Target |
75% Weight |
% of Target |
25% Weight |
% of Target |
Award ($000) |
|||||||||||||||||||||
| Frank D. Martell |
$ | 1,350 | 194.0 | % | 145.5 | % | 200.0 | % | 50.0 | % | 195.5 | % | $ | 2,639 | ||||||||||||||
| James L. Balas |
$ | 475 | 194.0 | % | 145.5 | % | 200.0 | % | 50.0 | % | 195.5 | % | $ | 929 | ||||||||||||||
| Patrick Dodd |
$ | 650 | — | — | — | — | 100.0 | % | $ | 650 | ||||||||||||||||||
| Barry M. Sando (1) |
$ | 550 | 197.0 | % | 150.0 | % | 200.0 | % | 50.0 | % | 198.5 | % | $ | 1,092 | ||||||||||||||
| Francis Aaron Henry |
$ | 475 | 194.0 | % | 145.5 | % | 200.0 | % | 50.0 | % | 195.5 | % | $ | 929 | ||||||||||||||
| (1) | Financial goals for Mr. Sando are calculated based on a split between corporate targets (25%) and segment revenue and adjusted EBITDA targets (50%), together accounting for 75% of his total ICP award. Unadjusted funding results for the segment were 200% of target resulting in weighted financial results of 150% and a total ICP award equal to 197% of his target. |
Base Salary |
Target LTI |
|||||||||||||
| Name |
Title |
($000s) |
% of Salary |
($000s) |
||||||||||
| Frank D. Martell |
President and CEO |
$ | 900 | 500 | % | $ | 4,500 | |||||||
| James L. Balas |
Chief Financial Officer |
$ | 475 | 225 | % | $ | 1,069 | |||||||
| Patrick Dodd |
Chief Operating and Growth Officer |
$ | 650 | 250 | % | $ | 1,625 | |||||||
| Barry M. Sando |
MD, Underwriting and Workflow Solutions |
$ | 550 | 200 | % | $ | 1,100 | |||||||
| Francis Aaron Henry |
Chief Legal Officer |
$ | 475 | 200 | % | $ | 950 | |||||||
2020 Grant Values |
||||||||
| Named Executive Officer |
RSUs |
PBRSUs (1) |
||||||
| Frank D. Martell |
$ | 2,250,000 | $ | 2,250,000 | ||||
| James L. Balas |
$ | 534,500 | $ | 534,500 | ||||
| Patrick Dodd |
$ | 812,500 | $ | 812,500 | ||||
| Barry M. Sando |
$ | 550,000 | $ | 550,000 | ||||
| Francis Aaron Henry |
$ | 475,000 | $ | 475,000 | ||||
| (1) | PBRSU amount shown at target performance level. Based on 2020 performance, the portion of the PBRSUs tied to 2020 performance will be eligible to vest contingent upon continued employment through December 31, 2022. |
LTI VEHICLE |
WEIGHT |
OVERVIEW | ||||||||
RSUs |
50 | % | • Vests in equal annual installments over 3 years • Vesting subject to achievement of threshold level of adjusted net income | |||||||
PBRSUs |
50 | % | • 3-year measurement and vesting period using adjusted EPS growth goals• Earn the greater number of shares from: • 3 annual measurements against 1-year targets• 3-year measurement against 3-year targets• Shares earned from adjusted EPS performance subject to modification based on TSR relative to our peers for 1-year and 3-year measurement periods | |||||||

(A) |
For the PBRSUs granted in 2020, 30% of the PBRSUs may be earned based on 2020 performance, 50% based on 2021 performance, and 20% based on 2022 performance. |
| (A) PBRSUs Eligible to be Earned Based on Annual Adjusted EPS Results (% of Total PBRSUs Granted) | ||||||
2020 |
30% |
|||||
2021 |
50% |
|||||
2022 |
20% |
|||||
(B) |
The number of PBRSUs earned is based on a schedule that provides for 50% of PBRSUs to be earned for annual adjusted EPS results at 80% of target (threshold), 100% of PBRSUs to be earned for results at 100% of target (target), and 200% of PBRSUs to be earned for results at 120% of target (maximum). PBRSUs earned for results between these levels are determined by interpolation. |
| (B) PBRSUs Earned Based on Adjusted EPS Results |
||||||||
| Performance Level |
Adjusted Annual EPS Results (% of Target) |
Accrued PBRSUs Earned (% of Target) |
||||||
| Less than Threshold |
< 80 | % | 0 | % | ||||
| Threshold |
80 | % | 50 | % | ||||
| Target |
100 | % | 100 | % | ||||
| Maximum+ |
120 | % | 200 | % | ||||
(C) |
The number of PBRSUs earned is then subject to modification based on our relative total stockholder return compared to our 2020 Peer Group (“TSR Modifier”). The TSR Modifier ensures alignment of PBRSU payouts and results for stockholders. |
| (C) TSR Modifier | ||||
| PBRSUs Earned from Adj. EPS Results (B) |
Annual TSR Performance (Relative to Peers) |
Modifier | ||
| 150% to 200% of Target | 55 Percentile or Above | No modification | ||
| |
Below 55 Percentile |
Earnout capped at 150% of target | ||
| 50% to 150% of Target |
— |
No modifications | ||
| 0% | Above Peer median Below Peer median |
Earnout is 50% of target No earnout | ||
(D) |
PBRSUs earned each year are accrued until the end of the three-year performance period. |

| PBRSUs Awarded for 2020 Performance |
% of Award Subject to Crediting in 2020 |
Adjusted EPS Target |
Adjusted EPS Results |
Adjusted EPS Performance |
% of Award Credited for Adjusted EPS Results |
% of Award Credited Adjusted for TSR Modifier |
||||||||||||||||||
| 2020 |
30 | % | $ | 2.45 | $ | 4.26 | 174 | % | 60 | % | No modification | |||||||||||||
| 2018-2020 PBRSU Performance Period |
% of Award Subject to Crediting for Annual Performance |
Adjusted EPS Target |
Adjusted EPS Results |
% of Budget |
% of Target |
% of Award Subject to Credit for Adjusted EPS Results |
% Vesting- Adjusted for TSR Modifier |
|||||||||||||||||||||
| 2018 |
30 | % | $ | 2.50 | $ | 2.72 | 109 | % | 144.00 | % | 43 | % | No modification | |||||||||||||||
| 2019 |
50 | % | $ | 2.65 | $ | 2.83 | 107 | % | 133.96 | % | 67 | % | No modification | |||||||||||||||
| 2020 |
20 | % | $ | 2.81 | $ | 4.26 | 152 | % | 200.00 | % | 40 | % | No modification | |||||||||||||||
| Cumulative |
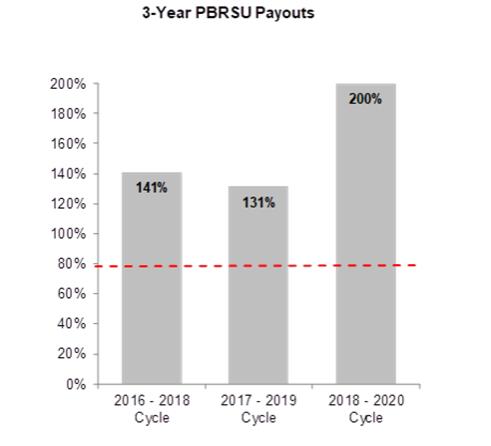
100 | % | $ | 7.96 | $ | 9.80 | 123 | % | 200.00 | % | 200 | % | No modification | |||||||||||||||
| Sum of Each Year |
150.18 | % | ||||||||||||||||||||||||||
2018 PBRSU Grant — 2020 Vesting |
||||||||
| Name |
Target |
Earned (1) |
||||||
| Frank D. Martell |
40,696 | 82,909 | ||||||
| James L. Balas |
9,885 | 20,137 | ||||||
| Barry M. Sando |
12,082 | 24,614 | ||||||
| (1) | Earned amount reflects 200% of target award amount plus the vesting of dividend equivalents earned with respect to the PBRSUs throughout the performance period. |
| • | advised on the selection of a peer group of companies for executive officer compensation comparison purposes; |
| • | provided guidance on industry best practices, emerging trends and developments in executive officer compensation, and investor views of compensation design and practices; |
| • | consulted on the design of incentive compensation programs and change in control provision best practices; |
| • | advised on determining the total compensation of each of our executive officers and the material elements of total compensation, including (1) annual base salaries, (2) target cash bonus amounts, and (3) the structure and target amount of long-term incentive awards; |
| • | consulted on non-employee director compensation; and |
| • | assisted on a compensation risk assessment |
| Position |
Ownership Guidelines | |
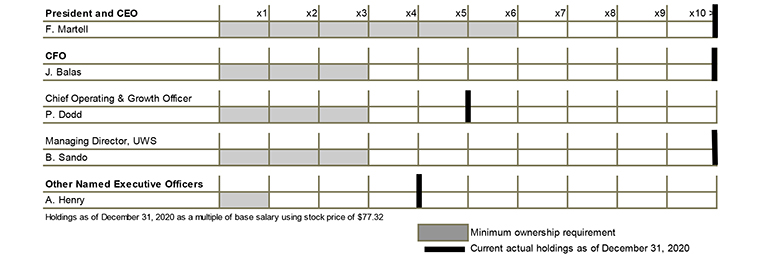
| Chief Executive Officer | 6x base salary | |
| Chief Financial Officer | 3x base salary | |
| Chief Operating and Growth Officer | 3x base salary | |
| Managing Directors | 3x base salary | |
| Other Executive Officers | 1x base salary |

| • | a merger or consolidation of the Company in which our stockholders end up owning less than 50% of the voting securities of the surviving entity |
| • | the sale, transfer or other disposition of all or substantially all our assets or the complete liquidation or dissolution of the Company |
| • | a change in the composition of our Board over a two-year period as a result of which fewer than a majority of the directors are incumbent directors, as defined in the agreement, or |
| • | the acquisition or accumulation by any person or group, subject to certain limited exceptions, of at least 30% of our voting securities |
| • | a pro rata portion of the executive’s target annual cash bonus amount established for the fiscal year in which the termination occurs (or, for 2020 only and in accordance with the terms of the 2020 ICP, a pro rata portion of the target annual cash bonus at the greater of the target or actual level of performance |
| • | between two and three times the executive officer’s target annual cash bonus amount established for the fiscal year in which the termination occurs, and |
| • | between two and three times the executive officer’s annual base salary in effect immediately prior to the date of termination |
| Name and Principal Position |
Year |
Salary (3) ($) |
Bonus (3) ($) |
Stock Awards (4) ($) |
Option Awards (5) ($) |
Non-Equity Incentive Plan Compensation (6) ($) |
Change in Pension Value and Nonqualified Deferred Compensation Earnings (7) ($) |
All Other Compensation (8) ($) |
Total ($) |
|||||||||||||||||||||||||||
| Frank D. Martell |
2020 | 897,981 | — | 4,499,952 | — | 2,639,420 | — | 155,473 | 8,192,826 | |||||||||||||||||||||||||||
| President and CEO |
2019 | 823,962 | — | 3,959,957 | — | 1,720,000 | — | 62,495 | 6,566,414 | |||||||||||||||||||||||||||
| 2018 | 778,942 | — | 3,704,964 | — | 1,092,000 | — | 65,748 | 5,641,654 | ||||||||||||||||||||||||||||
| |
|
|
|
|
|
|
|
|
|
|
|
|
|
|
|
|
|
|||||||||||||||||||
| James L. Balas |
2020 | 475,000 | — | 1,068,658 | — | 928,685 | — | 60,180 | 2,532,523 | |||||||||||||||||||||||||||
| Chief Financial Officer |
2019 | 474,423 | — | 949,926 | — | 660,000 | — | 29,443 | 2,113,792 | |||||||||||||||||||||||||||
| 2018 | 449,519 | — | 1,349,905 | — | 450,000 | — | 30,856 | 2,280,280 | ||||||||||||||||||||||||||||
| |
|
|
|
|
|
|
|
|
|
|
|
|
|
|
|
|
|
|||||||||||||||||||
| Patrick Dodd Chief Operating & Growth Officer (1) |
2020 | 197,500 | 510,000 | 3,124,864 | — | 150,000 | — | 25,833 | 4,008,197 | |||||||||||||||||||||||||||
| |
|
|
|
|
|
|
|
|
|
|
|
|
|
|
|
|
|
|||||||||||||||||||
| Barry M. Sando |
2020 | 550,000 | — | 1,099,950 | — | 1,091,774 | 956,956 | 85,374 | 3,784,053 | |||||||||||||||||||||||||||
| Managing Director, Underwriting & Workflow Solutions |
|
2019 2018 |
|
|
550,000 550,000 |
|
— | |
1,099,950 1,649,903 |
|
|
— — |
|
|
765,500 522,500 |
|
|
1,296,860 — |
|
|
46,581 50,556 |
|
|
3,758,891 2,772,959 |
| |||||||||||
| |
|
|
|
|
|
|
|
|
|
|
|
|
|
|
|
|
|
|||||||||||||||||||
| Francis Aaron Henry |
2020 | 475,000 | 560,000 | 949,961 | — | 928,685 | — | 183,354 | 3,097,000 | |||||||||||||||||||||||||||
| Chief Legal Officer and Corporate Secretary (2) |
2019 | 63,942 | 385,000 | 474,987 | — | — | — | 1,108 | 925,037 | |||||||||||||||||||||||||||
| (1) | Patrick Dodd was appointed Chief Operating & Growth Officer on September 1, 2020. His annual salary is $650,000 and has been reflected for the days employed in 2020. The bonus amount represents a one-time bonus guarantee for fiscal year 2020 of $500,000, plus a relocation expense allowance of $10,000. The non-equity incentive plan compensation amount reflects an additional $150,000 award approved by the Compensation Committee under the ICP for fiscal year 2020 for the achievement of strategic objectives. |
| (2) | Francis Aaron Henry was appointed Chief Legal Officer and Corporate Secretary on November 4, 2019. His annual base salary is $475,000, and in 2019 has been reflected for days employed in 2019. The bonus amount in 2020 represents a sign-on bonus that was paid in two installments in 2020 totaling $500,000, a spot bonus of $50,000 and a relocation expense allowance of $10,000. |
| (3) | Amounts include any amounts electively deferred by the NEO under the Deferred Compensation Plan. |
| (4) | For 2020, reflects the aggregate grant date fair value of stock awards, consisting of RSUs and PBRSUs, computed in accordance with the Financial Accounting Standards Board’s Accounting Standards Codification Topic 718, Compensation-Stock Compensation. We valued the RSUs as of the grant date by multiplying the closing price of our common stock on that date by the number of RSUs awarded. We valued the PBRSUs as of the grant date by multiplying the closing price of our common stock on that date by the target number of PBRSUs that will vest upon achievement of the target performance. The RSUs vest contingent upon the satisfaction of certain performance criteria through December 31, 2020, which criteria were satisfied, and thereafter vest in three equal installments on the first three anniversaries of the grant date, subject to continued employment through each such vesting date. The PBRSUs vest contingent upon satisfaction of certain performance criteria and continued employment through December 31, 2022. If the highest performance target is met or exceeded, the value of the awards at grant date would be as follows: Mr. Martell $4,499,952; Mr. Balas $1,068,658; Mr. Dodd $1,624,918: Mr. Sando $1,099,950; and Mr. Henry $949,961. |
| (5) | The Company did not grant stock options in 2018, 2019 or 2020. |
| (6) | For 2020, represents the annual incentive bonus that was earned with respect to 2020 under the ICP and paid to each NEO and includes any amounts electively deferred by the NEO under the Deferred Compensation Plan. |
| (7) | For 2020, represents the change in the present value of the life annuity from the end of fiscal year 2019 to the end of fiscal year 2020 for the Executive Supplemental Benefit Plan and the Pension Restoration Plan with respect to Mr. Sando. The actual change in the present values is as follows: $936,680 under the Executive Supplemental Benefit Plan and $20,276 under the Pension Restoration Plan. The amounts in this column do not include earnings under the Deferred Compensation Plan as such earnings were neither above-market nor preferential. See the Pension Benefits table below under “ Pension Benefits for 2020 |
| (8) | Amounts included in all other compensation consist of the amounts shown in the table below paid by the Company in 2020 for each NEO. |
| Named Executive Officer |
Life Insurance Premiums ($) |
HSA Employer Contribution |
401(k) Matching Contributions ($) |
Relocation ($) |
Amounts Contributed to the Deferred Compensation Plan ($) |
Total ($) |
||||||||||||||||||
| Frank D. Martell |
7,921 | — | 8,550 | — | 139,002 | 155,473 | ||||||||||||||||||
| James L. Balas |
1,848 | — | 8,550 | — | 49,782 | 60,180 | ||||||||||||||||||
| Patrick Dodd |
6 | — | 8,550 | 17,277 | — | 25,833 | ||||||||||||||||||
| Barry M. Sando |
16,894 | — | 8,550 | — | 59,930 | 85,374 | ||||||||||||||||||
| Francis Aaron Henry |
2,937 | — | 8,550 | 128,835 | 43,032 | 183,354 | ||||||||||||||||||
Estimated Future Payouts Under Non-Equity Incentive Plan Awards (1) |
Estimated Future Payouts Under Equity Incentive Plan Awards (2) |
Grant Date Fair Value of Stock & Option |
||||||||||||||||||||||||||||||||||
| Name |
Approval Date |
Grant Date |
Threshold ($) |
Target ($) |
Maximum ($) |
Threshold (#) |
Target (#) |
Maximum (#) |
Awards (3)($) |
|||||||||||||||||||||||||||
| Frank D. Martell |
| |||||||||||||||||||||||||||||||||||
| 2020 ICP Award |
459,000 | 1,350,000 | 2,700,000 | |||||||||||||||||||||||||||||||||
| RSUs |
2/13/2020 | 3/2/2020 | 46,593 | 2,249,976 | ||||||||||||||||||||||||||||||||
| PBRSUs |
2/13/2020 | 3/2/2020 | 23,297 | 46,593 | 93,186 | 2,249,976 | ||||||||||||||||||||||||||||||
| |
|
|
|
|
|
|
|
|
|
|
|
|
|
|
|
|
|
|||||||||||||||||||
| James Balas |
| |||||||||||||||||||||||||||||||||||
| 2020 ICP Award |
161,500 | 475,000 | 950,000 | |||||||||||||||||||||||||||||||||
| RSUs |
2/13/2020 | 3/2/2020 | 11,065 | 534,329 | ||||||||||||||||||||||||||||||||
| PBRSUs |
2/13/2020 | 3/2/2020 | 5,533 | 11,065 | 22,130 | 534,329 | ||||||||||||||||||||||||||||||
| |
|
|
|
|
|
|
|
|
|
|
|
|
|
|
|
|
|
|||||||||||||||||||
| Patrick Dodd |
| |||||||||||||||||||||||||||||||||||
| 2020 ICP Award |
221,000 | 650,000 | 1,300,000 | |||||||||||||||||||||||||||||||||
| RSUs |
7/3/2020 | 9/21/2020 | 34,268 | 2,312,405 | ||||||||||||||||||||||||||||||||
| PBRSUs |
7/3/2020 | 9/21/2020 | 6,020 | 12,040 | 24,080 | 812,459 | ||||||||||||||||||||||||||||||
| |
|
|
|
|
|
|
|
|
|
|
|
|
|
|
|
|
|
|||||||||||||||||||
| Barry M. Sando |
| |||||||||||||||||||||||||||||||||||
| 2020 ICP Award |
187,000 | 550,000 | 1,100,000 | |||||||||||||||||||||||||||||||||
| RSUs |
2/13/2020 | 3/2/2020 | 11,389 | 549,975 | ||||||||||||||||||||||||||||||||
| PBRSUs |
2/13/2020 | 3/2/2020 | 5,695 | 11,389 | 22,778 | 549,975 | ||||||||||||||||||||||||||||||
| |
|
|
|
|
|
|
|
|
|
|
|
|
|
|
|
|
|
|||||||||||||||||||
| Francis Aaron Henry |
||||||||||||||||||||||||||||||||||||
| 2020 ICP Award |
161,500 | 475,000 | 950,000 | |||||||||||||||||||||||||||||||||
| RSUs |
2/13/2020 | 3/2/2020 | 9,836 | 474,980 | ||||||||||||||||||||||||||||||||
| PBRSUs |
2/13/2020 | 3/2/2020 | 4,918 | 9,836 | 19,672 | 474,980 | ||||||||||||||||||||||||||||||
| (1) | At threshold performance, a NEO would receive 34% of the target award amount and at maximum performance, a NEO would receive 200% of the target award amount. The actual incentive award earned by each NEO is reported in the 2020 Summary Compensation Table. |
| (2) | Equity awards in 2020 consisted of RSUs and PBRSUs granted as part of the 2020 long-term incentive compensation program and with respect to Mr. Dodd, an additional sign-on RSU award with a grant date fair value of $1,500,000. Vesting of the RSUs is tied to achievement of at least $65 million in 2020 adjusted net income. For the RSUs, if as was the case, the adjusted net income performance target is met, the shares vest in three equal installments on the first three anniversaries of the grant date. In the case of the PBRSUs, vesting is tied to achievement of certain adjusted earnings-per-share |
| (3) | These amounts represent the aggregate grant date fair value of each award determined pursuant to Financial Accounting Standards Board’s Accounting Standards Codification Topic 718, Compensation-Stock Compensation. For the assumptions and methodologies used to value these awards, see footnote (4) to the 2020 Summary Compensation Table above. |
Option Awards |
Stock Awards |
|||||||||||||||||||||||||||||||
| Name |
Number of Securities Underlying Unexercised Options Exercisable (#) |
Number of Securities Underlying Unexercised Options Unexercisable (#) |
Option Exercise Price ($) |
Option Expiration Date (1) |
Number of Shares or Units of Stock That Have Not Vested (#) |
Market Value of Shares or Units of Stock That Have Not Vested (2) ($) |
Equity Incentive Plan Awards: Number of Unearned Shares, Units or Other Rights That Have Not Vested (#) |
Equity Incentive Plan Awards: Market or Payout Value of Unearned Shares, Units or Other Rights That Have Not Vested ($) |
||||||||||||||||||||||||
| Frank D. Martell |
|
|||||||||||||||||||||||||||||||
| 38,150 | 25.95 | 2/26/2023 | ||||||||||||||||||||||||||||||
| 20,313 | 32.49 | 3/2/2024 | ||||||||||||||||||||||||||||||
| 14,138 | (3) | 1,093,116 | ||||||||||||||||||||||||||||||
| 82,909 | (4) | 6,410,524 | ||||||||||||||||||||||||||||||
| 36,502 | (5) | 2,822,313 | ||||||||||||||||||||||||||||||
| 77,779 | (6) | 6,013,872 | ||||||||||||||||||||||||||||||
| 47,234 | (7) | 3,652,133 | ||||||||||||||||||||||||||||||
| 28,339 | (8) | 2,191,171 | ||||||||||||||||||||||||||||||
| 10,730 | (9) | 829,644 | ||||||||||||||||||||||||||||||
| 33,065 | (10) | 2,556,586 | ||||||||||||||||||||||||||||||
| |
|
|
|
|
|
|
|
|
|
|
|
|
|
|
|
|||||||||||||||||
| James L. Balas |
||||||||||||||||||||||||||||||||
| 3,433 | (3) | 265,442 | ||||||||||||||||||||||||||||||
| 20,137 | (4) | 1,556,993 | ||||||||||||||||||||||||||||||
| 8,756 | (5) | 677,051 | ||||||||||||||||||||||||||||||
| 18,657 | (6) | 1,442,559 | ||||||||||||||||||||||||||||||
| 11,217 | (7) | 867,298 | ||||||||||||||||||||||||||||||
| 6,729 | (8) | 520,286 | ||||||||||||||||||||||||||||||
| 2,574 | (9) | 199,022 | ||||||||||||||||||||||||||||||
| 7,853 | (10) | 607,194 | ||||||||||||||||||||||||||||||
| |
|
|
|
|
|
|
|
|
|
|
|
|
|
|
|
|||||||||||||||||
| Patrick Dodd |
||||||||||||||||||||||||||||||||
| 34,412 | (11) | 2,660,698 | ||||||||||||||||||||||||||||||
| 7,254 | (8) | 560,879 | ||||||||||||||||||||||||||||||
| 8,463 | (10) | 654,359 | ||||||||||||||||||||||||||||||
| |
|
|
|
|
|
|
|
|
|
|
|
|
|
|
|
|||||||||||||||||
| Barry M. Sando |
||||||||||||||||||||||||||||||||
| 26,011 | 25.95 | 2/26/2023 | ||||||||||||||||||||||||||||||
| 18,467 | 32.49 | 3/2/2024 | ||||||||||||||||||||||||||||||
| 4,197 | (3) | 324,543 | ||||||||||||||||||||||||||||||
| 24,614 | (4) | 1,903,154 | ||||||||||||||||||||||||||||||
| 10,139 | (5) | 783,958 | ||||||||||||||||||||||||||||||
| 21,604 | (6) | 1,670,421 | ||||||||||||||||||||||||||||||
| 11,546 | (7) | 892,737 | ||||||||||||||||||||||||||||||
| 6,926 | (8) | 535,518 | ||||||||||||||||||||||||||||||
| 2,981 | (9) | 230,491 | ||||||||||||||||||||||||||||||
| 8,083 | (10) | 624,978 | ||||||||||||||||||||||||||||||
| |
|
|
|
|
|
|
|
|
|
|
|
|
|
|
|
|||||||||||||||||
| Francis Aaron Henry |
||||||||||||||||||||||||||||||||
| 9,971 | (7) | 770,958 | ||||||||||||||||||||||||||||||
| 5,983 | (8) | 462,606 | ||||||||||||||||||||||||||||||
| 6,980 | (10) | 539,694 | ||||||||||||||||||||||||||||||
| (1) | The stock options disclosed in this table have a ten-year term. As of December 31, 2020, all stock options were fully vested. |
| (2) | Represents the value of unvested RSUs based on closing stock price on December 31, 2020 of $77.32. |
| (3) | These RSUs represent the unvested portion of RSUs that were granted to the NEOs on March 1, 2018, which were subject to (i) the achievement of adjusted net income of $62.5 million for 2018 and (ii) time vesting in three equal annual installments on the first, second and third anniversaries of the grant date. We achieved the $62.5 million performance measure for 2018. |
| (4) | These PBRSUs represent the portion of the PBRSUs that were granted to the NEOs on March 1, 2018, and vest based upon our achievement of certain performance measures and continued employment through December 31, 2020. The amount set forth in this column represents the actual number of units that were earned based on our achievement of the performance measures. |
| (5) | These RSUs represent the unvested portion of RSUs that were granted to the NEOs on March 1, 2019, which were subject to (i) the achievement of adjusted net income of $62.5 million for 2019 and (ii) time vesting in three equal annual installments on the first, second and third anniversaries of the grant date. We achieved the $62.5 million performance measure for 2019. |
| (6) | These PBRSUs represent the portion of the PBRSUs that were granted to the NEOs on March 1, 2019, and vest based upon our achievement of certain performance measures and continued employment through December 31, 2021. The amount set forth in this column represents the actual number of units that were earned based on our achievement of adjusted EPS in 2019 and 2020, but remain subject to the time vesting requirement. |
| (7) | These RSUs represent the unvested portion of RSUs that were granted to the NEOs on March 1, 2020, which were subject to (i) the achievement of adjusted net income of $65 million for 2020 and (ii) time vesting in three equal annual installments on the first, second and third anniversaries of the grant date. We achieved the $65 million performance measure for 2020. |
| (8) | These PBRSUs represent the portion of the PBRSUs that were granted to the NEOs (other than Dodd) on March 1, 2020 and Mr. Dodd on September 21, 3030, and vest based upon our achievement of certain performance measures and continued employment through December 31, 2022. The amount set forth in this column represents the actual number of units that were earned based on our achievement of adjusted EPS in 2020, but remain subject to the time vesting requirement. |
| (9) | These PBRSUs represent the portion of the PBRSUs that were granted to the NEOs on March 1, 2019, that remain subject to our achievement of certain performance measures. The amount set forth in this column represents the estimated future payout of PBRSUs assuming the target performance goals have been achieved. The PBRSUs vest based on the degree of achievement of certain adjusted EPS goals over a three-year performance period (2019, 2020 and 2021) and the executive’s continued employment through December 31, 2021. |
| (10) | These PBRSUs represent the portion of the PBRSUs that were granted to the NEOs (other than Mr. Dodd) on March 1, 2020 and Mr. Dodd on September 21, 2020, that remain subject to our achievement of certain performance measures. The amount set forth in this column represents the estimated future payout of PBRSUs assuming the target performance goals have been achieved. The PBRSUs vest based on the degree of achievement of certain adjusted EPS goals over a three-year performance period (2020, 2021 and 2022) and the executive’s continued employment through December 31, 2022. See “ Compensation Discussion and Analysis-Long-Term Incentives |
| (11) | These RSUs represent a combination of new hire RSUs and annual LTI RSUs granted to Mr. Dodd on September 21, 2020. |
Option Awards |
Stock Awards |
|||||||||||||||
| Name |
Number of Shares Acquired on Exercise (#) |
Value Realized on Exercise ($) (1) |
Number of Shares Acquired on Vesting (#) |
Value Realized on Vesting ($)(2) |
||||||||||||
| Frank D. Martell |
185,000 | 12,128,942 | 128,050 | 8,529,570 | ||||||||||||
| James L. Balas |
19,937 | 858,357 | 49,408 | 3,467,199 | ||||||||||||
| Patrick Dodd |
— | — | — | — | ||||||||||||
| Barry M. Sando |
31,233 | 1,968,504 | 60,379 | 4,236,574 | ||||||||||||
| Francis Aaron Henry |
— | — | 22,647 | 1,728,419 | ||||||||||||
| (1) | Value realized on exercise is based on the fair market value of our common stock on the date of exercise minus the exercise price and does not necessarily reflect proceeds actually received by the NEO. |
| (2) | Value realized on vesting is based on the fair market value of our common stock on the vesting date and does not necessarily reflect proceeds actually received by the NEO. |
| Name |
Plan Name |
Number of Years Credited Service (1)(#) |
Present Value of Accumulated Benefits (2)($) |
Payments During Last Fiscal Year | ||||
| Barry M. Sando |
Executive Supplemental Benefit Plan |
29 | 7,603,164 | 0 | ||||
| Barry M. Sando |
Pension Restoration Plan |
28 | 168,398 | 0 |
| (1) | Credited years of service for the Pension Restoration Plan and the Executive Supplemental Benefit Plan is the time between the participant’s deemed participation date under the plan and December 31, 2020. |
| (2) | The Pension Restoration Plan benefits generally accrue from the date of employment through the normal retirement age (as discussed below). The following assumptions were used for calculating present values: interest rate of 2.36%, post-retirement mortality per Pri-2012 Table for Healthy Retirees with mortality projection using Fully Generational Scale MP-2020, and benefit is payable as a single life annuity. |
| Name |
Executive Contributions in Last FY (1)($) |
Registrant Contributions in Last FY (1)($) |
Aggregate Earnings in Last FY (2)($) |
Aggregate Balance at Last FYE (3)($) |
||||||||||||
| Frank D. Martell |
1,189,143 | 49,079 | 619,491 | 4,758,454 | ||||||||||||
| James L. Balas |
734,706 | 19,333 | 450,595 | 2,302,725 | ||||||||||||
| Patrick Dodd |
— | — | — | — | ||||||||||||
| Barry M. Sando |
51,980 | 23,775 | 270,177 | 1,825,131 | ||||||||||||
| Francis Aaron Henry |
— | — | — | — | ||||||||||||
| (1) | All contributions presented herein reflect amounts actually deferred in 2020 and have been reported as compensation in the appropriate columns of the Summary Compensation Table. Amounts reported in the 2020 Summary Compensation Table under “All Other Compensation” reflect Company contributions earned for 2020. |
| (2) | Represents earnings or losses on participant-selected investment options. None of the amounts are reflected in the 2020 Summary Compensation Table because the return on deferred amounts is calculated in a similar manner and at a similar rate as earnings on externally managed mutual funds. |
| (3) | To the extent the executive officers were NEOs in prior years, the amounts reported in the aggregate balance at last fiscal year end that represented prior salary and non-equity incentive plan compensation deferrals or Company contributions were previously reported as compensation to the NEO in our Summary Compensation Table as “Salary,” “Non-Equity Incentive Plan Compensation” or “All Other Compensation” in previous years. Amounts reported in the aggregate balance at last fiscal year end that represent earnings in prior years on previously deferred amounts are not reflected on prior period Summary Compensation Tables. |
| Name |
Trigger |
Severance |
Bonus |
Value of RSU Acceleration (6) |
Value of PBRSU Acceleration (7) |
Deferred Compensation (8) |
Vested Pension Plan (11) (12) |
Benefit Continuation |
Total |
|||||||||||||||||||||||||
| Frank Martell |
Voluntary Resignation |
— | — | — | — | 4,758,454 | — | — | 4,758,454 | |||||||||||||||||||||||||
| Termination For Cause |
— | — | — | — | 4,758,454 | — | — | 4,758,454 | ||||||||||||||||||||||||||
Termination Without Cause / For Good Reason |
4,500,000 | (2) | 2,639,420 | (4) | 7,485,713 | — | 4,758,454 | — | 35,900 | (9) | 19,419,487 | |||||||||||||||||||||||
Change in Control with Termination Good Reason / Without Cause (1) |
6,750,000 | (3) | 2,639,420 | (5) | 7,485,713 | 12,594,528 | 4,758,454 | — | 53,850 | (10) | 34,281,965 | |||||||||||||||||||||||
Death |
— | 2,639,420 | (4) | 7,485,713 | 12,594,528 | 4,758,454 | — | — | 27,478,115 | |||||||||||||||||||||||||
Disability |
— | 2,639,420 | (4) | 7,485,713 | 12,594,528 | 4,758,454 | — | — | 27,478,115 | |||||||||||||||||||||||||
| |
|
|
|
|
|
|
|
|
|
|
|
|
|
|
|
|||||||||||||||||||
| James Balas |
Voluntary Resignation |
— | — | — | — | 2,302,725 | — | — | 2,302,725 | |||||||||||||||||||||||||
Termination For Cause |
— | — | — | — | 2,302,725 | — | — | 2,302,725 | ||||||||||||||||||||||||||
Termination Without Cause |
950,000 | (2) | 928,685 | (4) | 1,790,188 | — | 2,302,725 | — | 27,123 | (9) | 5,998,721 | |||||||||||||||||||||||
Change in Control with Termination Good Reason / Without Cause (1) |
1,900,000 | (3) | 928,685 | (5) | 1,790,188 | 3,024,949 | 2,302,725 | — | 54,245 | (10) | 10,000,792 | |||||||||||||||||||||||
Death |
— | 928,685 | (4) | 1,790,188 | 3,024,949 | 2,302,725 | — | — | 8,046,547 | |||||||||||||||||||||||||
Disability |
— | 928,685 | (4) | 1,790,188 | 3,024,949 | 2,302,725 | — | — | 8,046,547 | |||||||||||||||||||||||||
| |
|
|
|
|
|
|
|
|
|
|
|
|
|
|
|
|||||||||||||||||||
| Patrick Dodd |
Voluntary Resignation |
— | — | — | — | — | — | — | — | |||||||||||||||||||||||||
Termination For Cause |
— | — | — | — | — | — | — | — | ||||||||||||||||||||||||||
Termination Without Cause |
2,600,000 | (2) | — | 2,660,698 | — | — | — | 1,238 | (9) | 5,911,936 | ||||||||||||||||||||||||
Change in Control with Termination Good Reason / Without Cause (1) |
2,600,000 | (3) | 650,000 | (4) | 2,660,698 | 934,831 | — | — | 1,238 | (10) | 6,846,767 | |||||||||||||||||||||||
Death |
— | 650,000 | (5) | 2,660,698 | 934,831 | — | — | 4,245,529 | ||||||||||||||||||||||||||
Disability |
— | 650,000 | (4) | 2,660,698 | 934,831 | — | — | — | 4,245,529 | |||||||||||||||||||||||||
| |
|
|
|
|
|
|
|
|
|
|
|
|
|
|
|
|||||||||||||||||||
| Barry M. Sando |
Voluntary Resignation |
— | — | — | — | 1,825,131 | 7,642,505 | — | 9,467,636 | |||||||||||||||||||||||||
Termination For Cause |
— | — | — | — | 1,825,131 | 7,642,505 | — | 9,467,636 | ||||||||||||||||||||||||||
Termination Without Cause |
2,200,000 | (2) | 1,091,773 | (4) | 1,978,074 | — | 1,825,131 | 7,642,505 | 35,900 | (9) | 14,773,383 | |||||||||||||||||||||||
Change in Control with Termination Good Reason / Without Cause (1) |
3,300,000 | (3) | 1,091,773 | (5) | 1,978,074 | 3,456,350 | 1,825,131 | 7,963,548 | (13) | 53,850 | (10) | 19,668,726 | ||||||||||||||||||||||
Death |
— | 1,091,773 | (4) | 1,978,074 | 3,456,350 | 1,825,131 | 3,738,227 | (14) | — | 12,089,555 | ||||||||||||||||||||||||
Disability |
— | 1,091,773 | (4) | 1,978,074 | 3,456,350 | 1,825,131 | 7,642,505 | — | 15,993,833 | |||||||||||||||||||||||||
| |
|
|
|
|
|
|
|
|
|
|
|
|
|
|
|
|||||||||||||||||||
| Francis Aaron Henry |
Voluntary Resignation |
— | — | — | — | — | — | — | — | |||||||||||||||||||||||||
Termination For Cause |
— | — | — | — | — | — | — | — | ||||||||||||||||||||||||||
Termination Without Cause |
950,000 | (2) | 928,685 | (4) | 770,982 | — | — | — | 27,123 | (9) | 2,676,790 | |||||||||||||||||||||||
Change in Control with Termination Good Reason / Without Cause (1) |
1,900,000 | (3) | 628,685 | (5) | 770,982 | 770,982 | — | — | 54,245 | (10) | 4,424,894 | |||||||||||||||||||||||
Death |
— | 928,685 | (4) | 770,982 | 770,982 | — | — | — | 2,470,649 | |||||||||||||||||||||||||
Disability |
— | 928,685 | (4) | 770,982 | 770,982 | — | — | — | 2,470,649 | |||||||||||||||||||||||||
| (1) | In accordance with SEC rules, an excise tax calculation is not presented in this table as we do not provide a gross-up or tax reimbursement to our NEOs in connection with a change in control. Amounts payable in the event of a change in control may be subject to reduction under Sections 280G and 4999 of the Code. |
| (2) | Represents an amount equal to a multiple of annualized base salary in effect on the date employment terminates (the “Severance Date”)—two times annualized base salary in the case of Messrs. Martell, Sando and Dodd; one-time annualized base salary in the case of Messrs. Balas and Henry, plus (ii) the same multiple of target annual ICP amount in effect on the Severance Date (the “Severance Benefit”). The Severance Benefit will be payable in a lump sum equal to 7/24 (7/12 for Messrs. Balas and Henry) of the Severance Benefit on the seventh month after the Severance Date with an additional 1/24 (1/12 for Messrs. Balas and Henry) of the Severance Benefit paid each month until the month which is 24 months for Messrs. Martell and Sando (12 months for Messrs. Balas, Dodd and Henry) after the Severance Date. Receipt of the benefit is contingent upon execution of a general release of claims and compliance with certain post-termination covenants, including a 24-month post-termination non-competition covenant for Messrs. Martell and Sando (12 months for Messrs. Balas, Dodd, and Henry), and confidentiality provisions in the employment agreement. |
| (3) | Represents a multiple of base salary in effect immediately prior to the date of termination by us (three times base salary for Messrs. Martell and Sando and two times base salary for Messrs. Balas, Dodd, and Henry) and a multiple of target annual cash bonus established for fiscal year (three times for Messrs. Martell and Sando; two times for Messrs. Balas, Dodd and Henry) payable on the same payment schedule as described above in footnote (2). Receipt of the benefit is contingent upon execution of a general release of claims. |
| (4) | Represents the pro rata portion of annual cash bonus for fiscal year 2020; applicable agreements provide for the payment of the pro rata portion of the bonus amount that would have been paid if employment had not terminated during the fiscal year. Such payment is required to be paid within two- and one-half months following fiscal year end. Receipt of the benefit is contingent upon execution of a general release of claims and compliance with certain post termination covenants, including a 24-month post-termination non-competition covenant for Messrs. Martell and Sando (12 months for Messrs. Balas and Dodd), and confidentiality provisions in the employment agreement. |
| (5) | The 2020 ICP provides for a pro rata portion of the greater of target annual cash bonus or annual cash bonus for fiscal year 2020 based on actual performance. Represents the pro rata portion of target annual cash bonus for the fiscal year 2020, other than for Mr. Dodd which represents a pro rata portion of his target annual cash bonus; applicable agreements provide for the payment of the pro rata portion of the target annual cash bonus established for the fiscal year in which the executive is terminated. |
| (6) | Represents the value after acceleration of outstanding unvested RSUs based on our closing stock price on December 31, 2020 of $77.32. The outstanding unvested RSUs reported above will accelerate and vest on an involuntary termination without cause or resignation for good reason (whether before or after a change in control, although not all outstanding RSUs may vest on such a termination before a change in control), retirement, death or disability. For certain terminations of employment, the accelerated vesting is subject to execution of a general release of claims and compliance with certain post-termination covenants, including a 24-month post-termination non-competition covenant for Messrs. Martell and Sando (12 months for Messrs. Balas and Dodd), and confidentiality provisions in the employment agreement. |
| (7) | Represents the value after acceleration of all outstanding unvested PBRSUs based on our closing stock price on December 31, 2020 of $77.32. All or a pro-rata portion of outstanding unvested PBRSUs will generally accelerate on death, disability or involuntary termination without cause or resignation for good reason following a change in control, subject to attainment of the performance measures for any termination prior to a change in control. We have assumed that the target number of PBRSUs would become vested in connection with each acceleration event, although the actual number of PBRSUs that could become vested could be higher or lower than the target number of PBRSUs, based on actual performance. |
| (8) | Refers to payments accrued under the Deferred Compensation Plan as of December 31, 2020 based on each executive officer’s salary and bonus deferral election and 401(k) restoration contributions. |
| (9) | Represents the cost of continued health and welfare benefits for 24 months in the case of Messrs. Martell, Sando and Dodd, or 12 months in the case of Messrs. Balas and Henry, after the date on which the termination occurs. These obligations are reduced by any welfare benefits made available to the executive officer from subsequent employers. |
| (10) | Represents the cost of continued health and welfare benefits for 36 months in the case of Messrs. Martell and Sando, or 24 months in the case of Messrs. Balas, Dodd, and Henry, after the date on which the termination occurs subject to the executive’s continued payment of the same premium payment amount as immediately prior to termination. These obligations are reduced by any welfare benefits made available to the executive officer from subsequent employers. |
| (11) | Mr. Sando is eligible to receive current vested benefits amount under the Pension Restoration Plan and Executive Supplemental Benefit Plan. |
| (12) | Represents the present value of the benefit calculated under the Executive Supplemental Benefit using the following assumptions: interest rate of 3.12% post-retirement mortality per Pri-2012 “Retirees” and “Contingent Survivors” tables with white collar adjustments, projected generationally beyond 2012 using MP-2019 Order 2 Graduation Alternative Projection Scale and the present value of the benefit calculated under the Pension Restoration Plan using the following assumptions: interest rate of 3.12%, post-retirement mortality per Pri-2012 Table for Healthy Retirees with mortality projection using Fully Generational Scale MP-2020. |
| (13) | Upon an involuntary termination without cause or for good reason after a change in control, Mr. Sando becomes 100% vested in the Executive Supplemental Benefit Plan in the amount Mr. Sando would have been entitled to receive in accordance with the provisions of the plans in effect on the date of the change of control. |
| (14) | Represents pre-retirement death benefit payable to the executive officer’s spouse. |
| Name |
Fees Earned or Paid in Cash ($) |
Stock Awards (1)(2) ($) |
Total ($) |
|||||||||
| W. Steve Albrecht (3) |
$ | 10,959 | $ | 79,923 | $ | 90,882 | ||||||
| J. David Chatham (4) |
$ | 175,000 | $ | 159,994 | $ | 334,994 | ||||||
| Douglas C. Curling |
$ | 161,979 | $ | 159,994 | $ | 321,973 | ||||||
| John C. Dorman |
$ | 181,733 | $ | 159,994 | $ | 341,727 | ||||||
| Paul F. Folino |
$ | 309,500 | $ | 159,994 | $ | 469,494 | ||||||
| Wendy Lane (3) |
$ | 10,466 | $ | 79,924 | $ | 90,389 | ||||||
| Claudia Fan Munce |
$ | 166,233 | $ | 159,994 | $ | 326,227 | ||||||
| Thomas C. O’Brien (4) |
$ | 162,500 | $ | 159,994 | $ | 322,494 | ||||||
| Pamela H. Patenaude (5) |
$ | 112,409 | $ | 146,659 | $ | 259,068 | ||||||
| Vikrant Raina |
$ | 161,979 | $ | 159,994 | $ | 321,973 | ||||||
| J. Michael Shepherd |
$ | 154,979 | $ | 159,994 | $ | 314,974 | ||||||
| Jaynie Miller Studenmund |
$ | 171,966 | $ | 159,994 | $ | 331,960 | ||||||
| David F. Walker (4) |
$ | 175,000 | $ | 159,994 | $ | 334,994 | ||||||
| Mary Lee Widener (6) |
$ | 107,500 | $ | 159,994 | $ | 267,494 | ||||||
| Henry W. “Jay” Winship (3) |
$ | 10,219 | $ | 79,923 | $ | 90,142 | ||||||
| (1) | The amounts shown reflect the aggregate grant date fair value of stock awards granted in 2020 computed in accordance with the Financial Accounting Standards Board’s Accounting Standards Codification Topic 718, Compensation-Stock Compensation. We value the RSUs as of the grant date by multiplying the closing price of our common stock on that date by the number of RSUs awarded. The stock awards were granted on April 28, 2020 to each non-management director, other than for Pamela H. Patenaude who received her grant on June 17, 2020 and W. Steve Albrecht, Wendy Lane and Henry W. “Jay” Winship, who received their grants on November 20, 2020. |
| (2) | The aggregate numbers of RSUs held by each current non-management director as of December 31, 2020 were as follows: |
| Name |
Restricted Stock Unit Awards (#) |
|||
| W. Steve Albrecht |
1,018 | |||
| Douglas C. Curling |
4,217 | |||
| John C. Dorman |
4,217 | |||
| Paul F. Folino |
4,217 | |||
| Wendy Lane |
1,018 | |||
| Claudia Fan Munce |
4,217 | |||
| Pamela H. Patenaude |
2,991 | |||
| Vikrant Raina |
4,217 | |||
| J. Michael Shepherd |
4,217 | |||
| Jaynie Miller Studenmund |
4,217 | |||
| Henry W. “Jay” Winship |
1,018 | |||
| (3) | W. Steve Albrecht, Wendy Lane and Henry W. “Jay” Winship were appointed to our Board, effective November 20, 2020. |
| (4) | J. David Chatham, Thomas C. O’Brien and David F. Walker were removed from our Board, effective November 17, 2020. The amount reported in the Stock Awards column represents the grant date fair value of annual equity compensation awards granted in April 2020. However, the awards were terminated pursuant to their terms at the time of the directors’ removal from the Board in November 2020. As a result, Messrs. Chatham, O’Brien and Walker received no value from stock awards granted in 2020. |
| (5) | Pamela H. Patenaude was appointed to our Board, effective June 17, 2020. |
| (6) | Mary Lee Widener retired from our Board, effective June 17, 2020. The fees reported as earned or paid in cash include $60,000 in consultant fees paid to Ms. Widener in 2020. |
| • | provided advice on the selection of a peer group of companies for director compensation comparison purposes; |
| • | provided guidance on industry best practices and emerging trends and developments in director compensation; |
| • | reviewed director compensation; and |
| • | provided advice on determining the structure and amounts payable under our director compensation program. |
| Compensation Element |
2020 |
|||
| Annual Retainer — Non-Management Director (1) |
$ | 80,000 | ||
| Annual Equity Compensation — RSUs (2) |
$ | 160,000 | ||
| Annual Retainer — Non-Management Board Chairman |
$ | 120,000 | ||
| Annual Retainer — Committee Chairs (1) |
||||
| Audit Committee |
$ | 25,000 | ||
| Compensation Committee |
$ | 20,000 | ||
| Nominating and Corporate Governance Committee |
$ | 15,000 | ||
| Strategic Planning and Acquisition Committee |
$ | 12,500 | ||
| Annual Retainer — Committee Members (1) |
||||
| Audit Committee |
$ | 15,000 | ||
| Compensation Committee |
$ | 10,000 | ||
| Nominating and Corporate Governance Committee |
$ | 7,500 | ||
| Strategic Planning and Acquisition Committee |
$ | 5,000 | ||
| Fee for attendance of Board and Committee Meetings in Excess of Designated Number (3) |
$ | 2,000 | ||
| (1) | Committee chair retainer represents amounts paid to each committee chair for their service in addition to the committee member annual retainer. Fees are paid in cash in equal quarterly installments. Fees are paid pro-rata for directors joining the Board after the payment date. |
| (2) | The award is granted and priced on the day of our annual meeting or, in the event of an out-of-cycle |
| (3) | Meeting fees paid only for meetings in excess of eight meetings of the Board, Audit Committee and Compensation Committee, and in excess of four meetings of the Nominating and Corporate Governance Committee and Strategic Planning and Acquisition Committee. Fees are paid in cash in connection with each such additional meeting. Directors may also elect to defer payment of their RSUs under the Outside Director Deferral Program. RSUs deferred under such program will generally be paid, subject to the applicable vesting requirements, in shares of the Company’s common stock on the earlier of (1) the director’s death or separation from service or (2) a change in control of the Company. |
For the Year Ended December 31, 2020 |
||||||||||||||||||||
(in thousands) |
PIRM |
UWS |
CORP |
ELIM |
CoreLogic |
|||||||||||||||
| Net income/(loss) from continuing operations |
$ | 129,865 | $ | 431,873 | $ | (297,488 | ) | $ | — | $ | 264,250 | |||||||||
| Income taxes |
— | — | 42,184 | — | 42,184 | |||||||||||||||
| Depreciation and amortization |
93,640 | 48,126 | 32,679 | — | 174,445 | |||||||||||||||
| Interest expense/(income), net |
1,760 | (56 | ) | 67,472 | — | 69,176 | ||||||||||||||
| Share-based compensation |
7,886 | 7,607 | 29,567 | 45,060 | ||||||||||||||||
| Impairment loss |
— | 2,278 | 31 | — | 2,309 | |||||||||||||||
| Non-operating (gains)/losses |
(35,425 | ) | (128 | ) | (5,464 | ) | — | (41,017 | ) | |||||||||||
| Efficiency investments |
(2,286 | ) | 1,460 | 26,211 | — | 25,385 | ||||||||||||||
| Transaction costs |
300 | 905 | 1,533 | — | 2,738 | |||||||||||||||
| Unsolicited Proposal Related Costs |
— | — | $ | 53,846 | — | 53,846 | ||||||||||||||
| |
|
|
|
|
|
|
|
|
|
|||||||||||
| Adjusted EBITDA |
$ | 195,740 | $ | 492,065 | $ | (49,429 | ) | $ | — | $ | 638,376 | |||||||||
| |
|
|
|
|
|
|
|
|
|
|||||||||||
For the Year Ended December 31, 2019 |
||||||||||||||||||||
(in thousands) |
PIRM |
UWS |
CORP |
ELIM |
CoreLogic |
|||||||||||||||
| Net income/(loss) from continuing operations |
$ | 47,759 | $ | 194,454 | $ | (208,443 | ) | $ | — | $ | 33,770 | |||||||||
| Income taxes |
— | — | (1,622 | ) | — | (1,622 | ) | |||||||||||||
| Depreciation and amortization |
94,862 | 51,337 | 28,901 | — | 175,100 | |||||||||||||||
| Interest expense, net |
37 | 269 | 75,851 | — | 76,157 | |||||||||||||||
| Share-based compensation |
6,309 | 6,079 | 22,783 | — | 35,171 | |||||||||||||||
| Impairment loss |
— | 47,834 | — | — | 47,834 | |||||||||||||||
| Non-operating gains |
6,725 | 6,279 | 13,738 | — | 26,742 | |||||||||||||||
| Efficiency investments |
3,471 | 6,484 | 29,562 | — | 39,517 | |||||||||||||||
| Transaction costs |
6,448 | 359 | 392 | — | 7,199 | |||||||||||||||
| Amortization of acquired intangibles included in equity in earnings of affiliates |
307 | — | — | — | 307 | |||||||||||||||
| |
|
|
|
|
|
|
|
|
|
|||||||||||
| Adjusted EBITDA |
$ | 165,918 | $ | 313,095 | $ | (38,838 | ) | $ | — | $ | 440,175 | |||||||||
| |
|
|
|
|
|
|
|
|
|
|||||||||||
For the Year Ended December 31, |
||||||||
(Diluted income per share) |
2020 |
2019 |
||||||
| Net income from continuing operations |
$ | 3.28 | $ | 0.42 | ||||
| Share-based compensation |
0.56 | 0.43 | ||||||
| Non-operating (gains)/losses |
(0.51 | ) | 0.33 | |||||
| Efficiency investments |
0.32 | 0.49 | ||||||
| Impairment loss |
0.03 | 0.59 | ||||||
| Transaction costs |
0.03 | 0.09 | ||||||
| Depreciation and amortization of acquired software and intangibles |
0.85 | 0.89 | ||||||
| Amortization of acquired intangibles included in equity in earnings of affiliates |
— | — | ||||||
| Unsolicited proposal related costs |
0.67 | — | ||||||
| Income tax effect on adjustments |
(0.97 | ) | (0.83 | ) | ||||
| |
|
|
|
|||||
| Adjusted EPS |
$ | 4.26 | $ | 2.41 | ||||
| |
|
|
|
|||||
(in thousands) |
For the Year Ended December 31, 2020 |
|||
| Net cash provided by operating activities—continuing operations |
$ | 491,178 | ||
| Purchases of property and equipment |
(57,668 | ) | ||
| Purchases of capitalized data and other intangible assets |
(41,442 | ) | ||
| |
|
|||
| Free Cash Flow |
$ | 392,068 | ||
| |
|
|||
| Name of Beneficial Owner |
Amount and Nature of Beneficial Ownership |
Percent of Class |
||||||
| The Vanguard Group (1) |
6,816,293 | 8.8 | % | |||||
| BlackRock, Inc. (2) |
6,435,505 | 8.3 | % | |||||
| Pentwater Capital Management LP (3) |
3,850,000 | 5.3 | % | |||||
| (1) | Share count is based on a Schedule 13G/A filed February 10, 2021. According to such 13G/A, as of December 31, 2020, these securities are owned by The Vanguard Group, a registered investment adviser with shared voting power with respect to 52,684 shares, sole dispositive power with respect to 6,698,562 shares and shared dispositive power with respect to 117,731 shares. The address of the principal business office of the reporting entity is 100 Vanguard Boulevard, Malvern, Pennsylvania 19355. |
| (2) | Share count is based on a Schedule 13G/A filed January 29, 2021. According to such 13G/A, as of December 31, 2020, BlackRock, Inc. is a parent holding company with sole voting power with respect to 6,176,633 shares and sole dispositive power with respect to 6,435,505 shares, reporting on behalf of certain related subsidiaries. The address of the principal business office of the reporting entity is 55 East 52nd Street, New York, New York 10055. |
| (3) | Share count is based on a Schedule 13D filed February 18, 2021, reporting beneficial ownership as of February 16, 2021. According to such Schedule 13D, Pentwater Capital Management LP is a registered investment adviser with sole voting and dispositive power with respect to 3,850,000 shares owned by itself and its affiliates. The address of the principal business office of the reporting entity is 1001 10th Avenue South, Suite 216, Naples, Florida 34102. |
| • | each director; |
| • | each executive officer named in the “Summary Compensation Table”; and |
| • | all directors and executive officers as a group. |
| Stockholders |
Number of shares of common stock |
Percent if greater than 1% |
||||||
| Directors |
||||||||
| W. Steve Albrecht |
1,022 | |||||||
| Douglas C. Curling |
40,106 | — | ||||||
| John C. Dorman |
15,998 | — | ||||||
| Paul F. Folino |
10,145 | — | ||||||
| Wendy Lane |
1,022 | — | ||||||
| Frank D. Martell |
379,982 | — | ||||||
| Claudia Fan Munce |
13,208 | — | ||||||
| Pamela H. Patenaude |
3,003 | — | ||||||
| Vikrant Raina |
15,638 | — | ||||||
| J. Michael Shepherd |
7,693 | — | ||||||
| Jaynie Miller Studenmund |
35,437 | — | ||||||
| Henry W. “Jay” Winship |
1,022 | — | ||||||
| NEOs who are not directors |
||||||||
| James L. Balas |
81,185 | — | ||||||
| Patrick L. Dodd |
0 | — | ||||||
| Barry M. Sando |
210,475 | — | ||||||
| Francis Aaron Henry |
13,613 | — | ||||||
| |
|
|
|
|||||
| All directors and executive officers as a group (16 persons) |
829,549 | 1.1 | % | |||||
| |
|
|
|
| Stockholders |
Number of shares of common stock |
Percent if greater than 1% |
||||||
| W. Steve Albrecht |
— | — | ||||||
| Douglas C. Curling |
— | — | ||||||
| John C. Dorman |
— | — | ||||||
| Paul F. Folino |
— | — | ||||||
| Wendy Lane |
— | — | ||||||
| Frank D. Martell |
53,631 | — | ||||||
| Claudia Fan Munce |
— | — | ||||||
| Pamela H. Patenaude |
— | — | ||||||
| Vikrant Raina |
— | — | ||||||
| J. Michael Shepherd |
— | — | ||||||
| Jaynie Miller Studenmund |
— | — | ||||||
| Henry W. “Jay” Winship |
— | — | ||||||
| James L. Balas |
— | — | ||||||
| Patrick L. Dodd |
— | — | ||||||
| Barry M. Sando |
44,478 | — | ||||||
| Francis Aaron Henry |
— | — | ||||||
| |
|
|
|
|||||
| All directors and executive officers as a group (16 persons) |
98,109 | — | ||||||
| |
|
|
|
|||||
| Plan category |
Number of securities to be issued upon exercise of outstanding options, warrants and rights (a) |
Weighted-average exercise price of outstanding options, warrants and rights (b) |
Number of securities remaining available for future issuance under equity compensation plans (excluding shares reflected in column (a)) (c) |
|||||||||
| Equity compensation plans approved by stockholders |
2,023,610 | (1) |
27.26 | (2) |
8,083,747 | (3) | ||||||
| (1) | Of these shares, 158,104 were subject to options still outstanding under the 2011 Plan, 393,936 were subject to stock unit awards then outstanding under the 2011 Plan (which currently count as 787,873 under the 2011 Plan (2 shares for each share issued)), and 1,471,570 were subject to stock unit awards then outstanding under the 2018 Plan (which count as 2,943,141 under the 2018 Plan). Of the 1,865,507 shares subject to stock unit awards under the plans described above, 671,225 shares are subject to performance-based awards assuming that the maximum level of performance with respect to such awards is achieved. Note that the actual number of shares to be issued with respect to these performance-based awards will vary depending on the applicable level of performance achieved, with such number ranging from zero to the maximum level indicated above. |
| (2) | This weighted-average exercise price does not reflect the shares that will be issued upon the payment of outstanding restricted stock units and is calculated solely with respect to outstanding unexercised stock options. |
| (3) | Represents 7,656,381 shares available for future issuance under the 2018 Plan, and 427,366 shares available for future issuance under the 2012 ESPP. Shares available under the 2018 Plan may be used for any type of award authorized in the 2018 Plan (subject to certain limitations of the 2018 Plan) including stock options, stock appreciation rights, stock units, restricted stock, performance-based awards, stock bonuses and other awards payable in share of our common stock. |
| • | compensatory arrangements for service as an officer or director of ours, provided such compensation is approved by the Compensation Committee; |
| • | transactions between us and our affiliates (other than directors and officers); |
| • | transactions involving a related person with only an indirect interest resulting solely from ownership of less than 10% of, or being a director of, the entity entering into a transaction with us; |
| • | ordinary course transactions involving annual payments of $100,000 or less; or |
| • | transactions involving indebtedness between us and a beneficial owner of more than 5% of our common stock or an immediate family member of such beneficial owner, provided that the beneficial owner or family member is not an executive officer, director or director nominee of ours or an immediate family member thereof. |
| Aggregate fees billed in year |
2020 |
2019 |
||||||
| Audit Fees |
$ | 3,153,317 | $ | 3,091,436 | ||||
| Audit-Related Fees (1) |
973,750 | 77,276 | ||||||
| Tax Fees (2) |
922,765 | 76,868 | ||||||
| All Other Fees (3) |
11,319 | 22,613 | ||||||
| |
|
|
|
|||||
| Total Fees |
$ | 5,026,901 | $ | 3,268,193 | ||||
| |
|
|
|
|||||
| (1) | Fees in 2020 primarily related to audit services, due diligence procedures for certain acquisitions and divestitures, and SOC-1 fees. Fees in 2019 primarily related to audit services and due diligence procedures for certain acquisitions. |
| (2) | Fees incurred for tax advice, compliance and planning over transfer pricing, acquisition of certain businesses, and unsolicited acquisition proposals. |
| (3) | Fees primarily incurred for services related to the compilation of statutory financial statements. |
| CoreLogic, Inc. | ||||||
| (Registrant) | ||||||
| By: | /s/ Frank D. Martell | |||||
| Frank D. Martell | ||||||
| President and Chief Executive Officer | ||||||
| (Principal Executive Officer) | ||||||
| Date: April 29, 2021 | ||||||