
U.S. Bancorp 3Q25 Earnings Conference Call O c t o b e r 1 6 , 2 0 2 5
2©2025 U.S. Bank | Confidential Forward-looking Statements and Additional Information The following information appears in accordance with the Private Securities Litigation Reform Act of 1995: This presentation contains forward-looking statements about U.S. Bancorp. Statements that are not historical or current facts, including statements about beliefs and expectations, are forward-looking statements and are based on the information available to, and assumptions and estimates made by, management as of the date hereof. These forward-looking statements cover, among other things, future economic conditions and the anticipated future revenue, expenses, financial condition, asset quality, capital and liquidity levels, plans, prospects, targets, initiatives and operations of U.S. Bancorp. Forward-looking statements often use words such as “anticipates,” “targets,” “expects,” “hopes,” “estimates,” “projects,” “forecasts,” “intends,” “plans,” “goals,” “believes,” “continue” and other similar expressions or future or conditional verbs such as “will,” “may,” “might,” “should,” “would” and “could.” Forward-looking statements involve inherent risks and uncertainties that could cause actual results to differ materially from those set forth in forward-looking statements, including the following risks and uncertainties: deterioration in general business and economic conditions or turbulence in domestic or global financial markets, which could adversely affect U.S. Bancorp’s revenues and the values of its assets and liabilities, reduce the availability of funding to certain financial institutions, lead to a tightening of credit, and increase stock price volatility; changes to statutes, regulations, or regulatory policies or practices, including capital and liquidity requirements, and the enforcement and interpretation of such laws and regulations, and U.S. Bancorp’s ability to address or satisfy those requirements and other requirements or conditions imposed by regulatory entities; changes in trade policy, including the imposition of tariffs or the impacts of retaliatory tariffs; changes in interest rates; increases in unemployment rates; deterioration in the credit quality of U.S. Bancorp’s loan portfolios or in the value of the collateral securing those loans; changes in commercial real estate occupancy rates; increases in Federal Deposit Insurance Corporation (FDIC) assessments, including due to bank failures; actions taken by governmental agencies to stabilize the financial system and the effectiveness of such actions; turmoil and volatility in the financial services industry, including failures or rumors of failures of other depository institutions, which could affect the ability of depository institutions, including U.S. Bank National Association, to attract and retain depositors, and could affect the ability of financial services providers, including U.S. Bancorp, to borrow or raise capital; risks related to originating and selling mortgages, including repurchase and indemnity demands, and related to U.S. Bancorp’s role as a loan servicer; impacts of current, pending or future litigation and governmental proceedings; increased competition from both banks and non-banks; effects of climate change and related physical and transition risks; changes in customer behavior and preferences and the ability to implement technological changes to respond to customer needs and meet competitive demands; breaches in data security; failures or disruptions in or breaches of U.S. Bancorp’s operational, technology or security systems or infrastructure, or those of third parties, including as a result of cybersecurity incidents; failures to safeguard personal information; impacts of pandemics, natural disasters, terrorist activities, civil unrest, international hostilities and geopolitical events; impacts of supply chain disruptions, rising inflation, slower growth or a recession; failure to execute on strategic or operational plans; effects of mergers and acquisitions and related integration; effects of critical accounting policies and judgments; effects of changes in or interpretations of tax laws and regulations; management’s ability to effectively manage credit risk, market risk, operational risk, compliance risk, strategic risk, interest rate risk, liquidity risk and reputation risk; and the risks and uncertainties more fully discussed in the section entitled “Risk Factors” of U.S. Bancorp’s Form 10-K for the year ended December 31, 2024, and subsequent filings with the Securities and Exchange Commission. Factors other than these risks also could adversely affect U.S. Bancorp’s results, and the reader should not consider these risks to be a complete set of all potential risks or uncertainties. Readers are cautioned not to place undue reliance on any forward-looking statements. Forward-looking statements speak only as of the date hereof, and U.S. Bancorp undertakes no obligation to update them in light of new information or future events. This presentation includes non-GAAP financial measures to describe U.S. Bancorp’s performance. The calculations of these measures are provided in the Appendix. These disclosures should not be viewed as a substitute for operating results determined in accordance with GAAP, nor are they necessarily comparable to non-GAAP performance measures that may be presented by other companies. Management does not provide a reconciliation for forward-looking non-GAAP financial measures where it is unable to provide a meaningful or accurate calculation or estimation of reconciling items and the information is not available without unreasonable effort. This is due to the difficulty forecasting the occurrence and the financial impact of various items that have not yet occurred, are out of U.S. Bancorp’s control or cannot be reasonably predicted. For the same reasons, U.S. Bancorp’s management is unable to address the probable significance of the unavailable information. Forward-looking non-GAAP financial measures provided without the most directly comparable GAAP financial measures may vary materially from the corresponding GAAP financial measures.
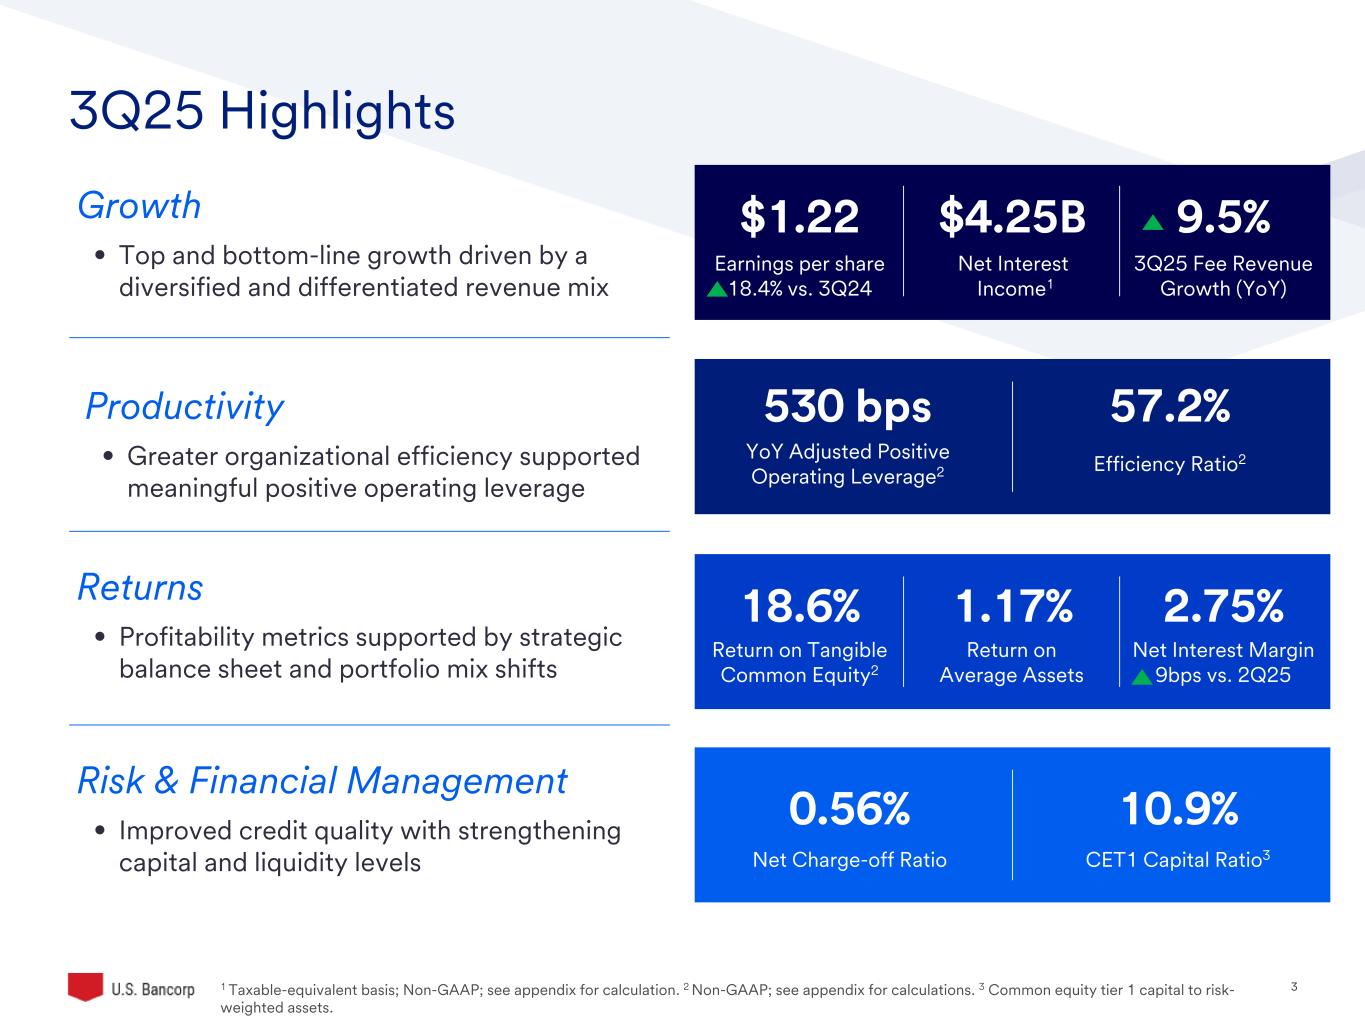
3 3Q25 Highlights Growth • Top and bottom-line growth driven by a diversified and differentiated revenue mix Productivity • Greater organizational efficiency supported meaningful positive operating leverage Returns • Profitability metrics supported by strategic balance sheet and portfolio mix shifts Risk & Financial Management • Improved credit quality with strengthening capital and liquidity levels 1 Taxable-equivalent basis; Non-GAAP; see appendix for calculation. 2 Non-GAAP; see appendix for calculations. 3 Common equity tier 1 capital to risk- weighted assets. 0.56% Net Charge-off Ratio 10.9% CET1 Capital Ratio3 $1.22 Net Interest Income1 $4.25B 3Q25 Fee Revenue Growth (YoY) 9.5% YoY Adjusted Positive Operating Leverage2 530 bps Efficiency Ratio2 57.2% Return on Tangible Common Equity2 18.6% Return on Average Assets 1.17% Net Interest Margin 9bps vs. 2Q25 2.75% Earnings per share 18.4% vs. 3Q24
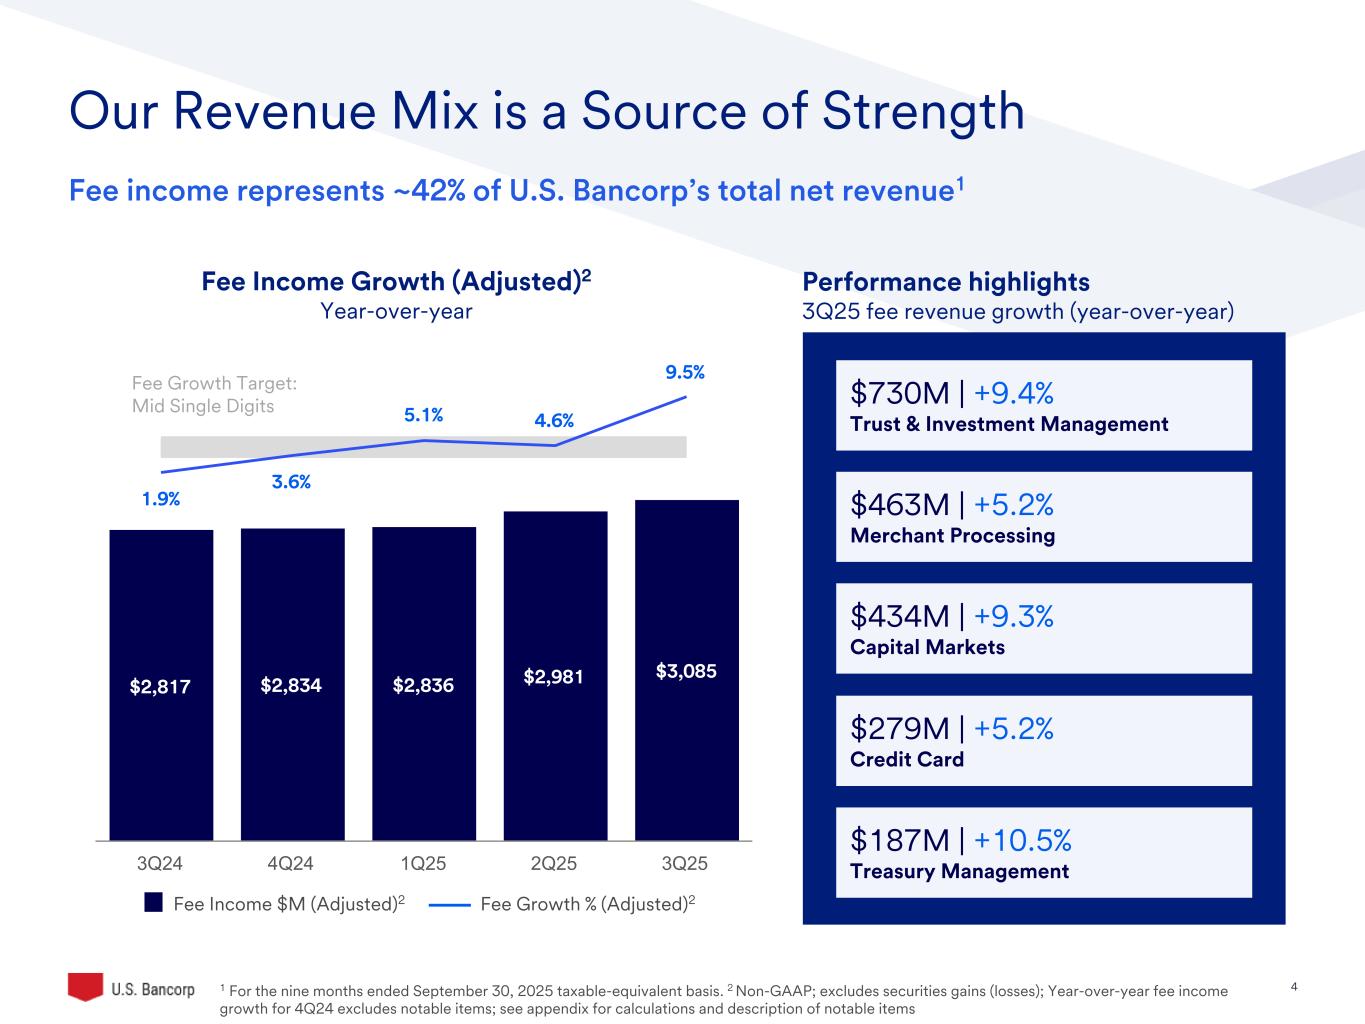
4 Fee Growth Target: Mid Single Digits Fee Income Growth (Adjusted)2 Year-over-year Performance highlights 3Q25 fee revenue growth (year-over-year) $463M | +5.2% Merchant Processing $187M | +10.5% Treasury Management $730M | +9.4% Trust & Investment Management $434M | +9.3% Capital Markets Our Revenue Mix is a Source of Strength $279M | +5.2% Credit Card Fee income represents ~42% of U.S. Bancorp’s total net revenue1 Fee Income $M (Adjusted)2 Fee Growth % (Adjusted)2 1 For the nine months ended September 30, 2025 taxable-equivalent basis. 2 Non-GAAP; excludes securities gains (losses); Year-over-year fee income growth for 4Q24 excludes notable items; see appendix for calculations and description of notable items $2,817 $2,834 $2,836 $2,981 $3,085 1.9% 3.6% 5.1% 4.6% 9.5% 3Q24 4Q24 1Q25 2Q25 3Q25
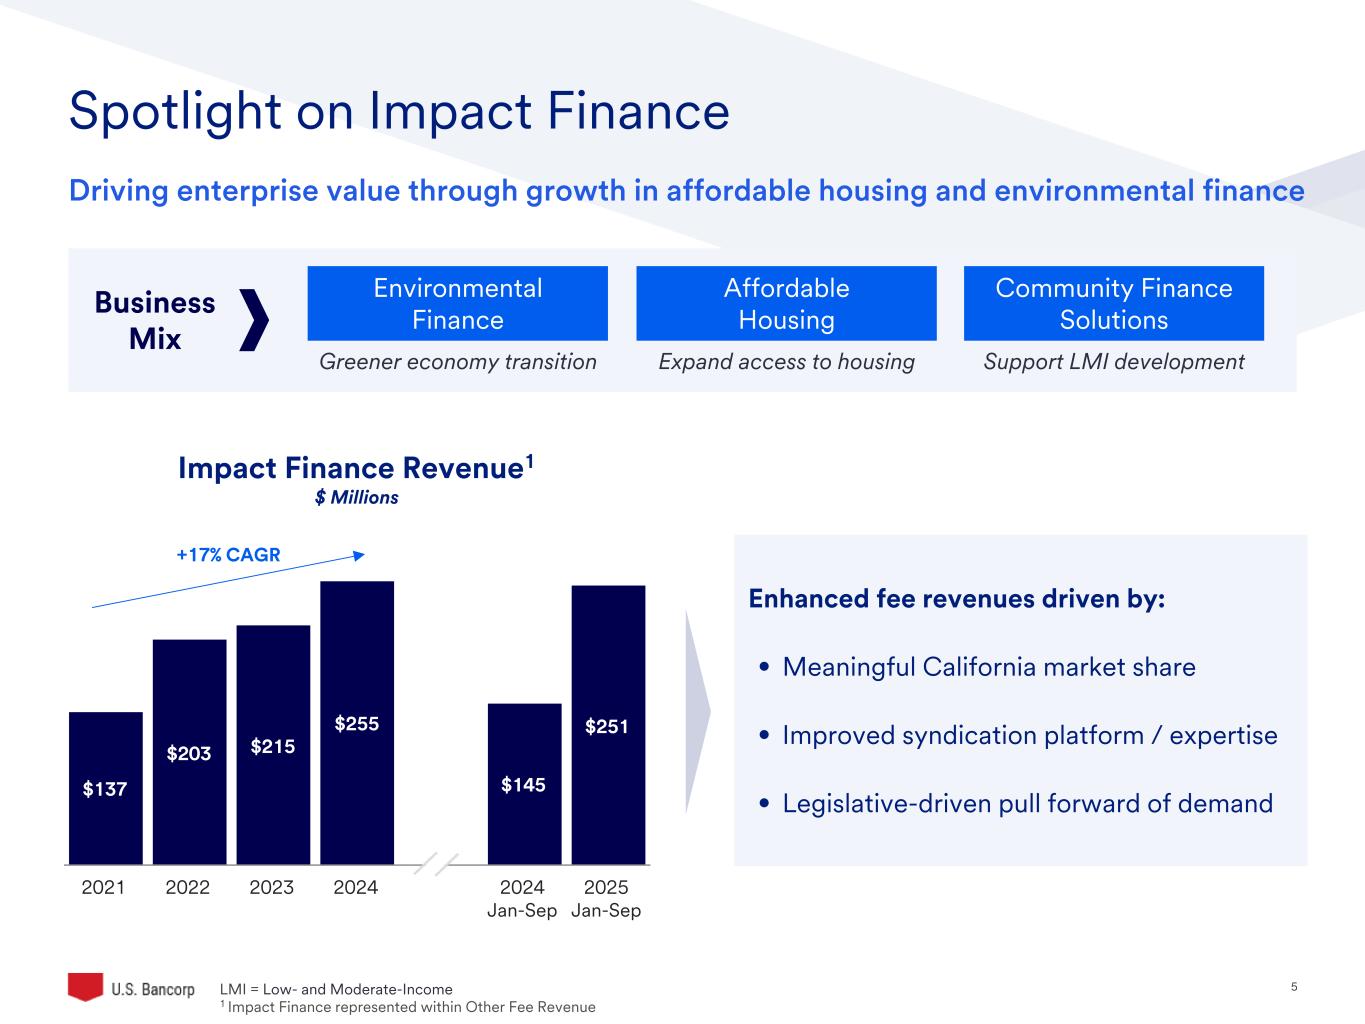
5 Spotlight on Impact Finance Impact Finance Revenue1 $ Millions Enhanced fee revenues driven by: • Meaningful California market share • Improved syndication platform / expertise • Legislative-driven pull forward of demand +17% CAGR $137 $203 $215 $255 $145 $251 2021 2022 2023 2024 2024 Jan-Sep 2025 Jan-Sep LMI = Low- and Moderate-Income 1 Impact Finance represented within Other Fee Revenue Driving enterprise value through growth in affordable housing and environmental finance Business Mix Environmental Finance Affordable Housing Community Finance Solutions Greener economy transition Expand access to housing Support LMI development
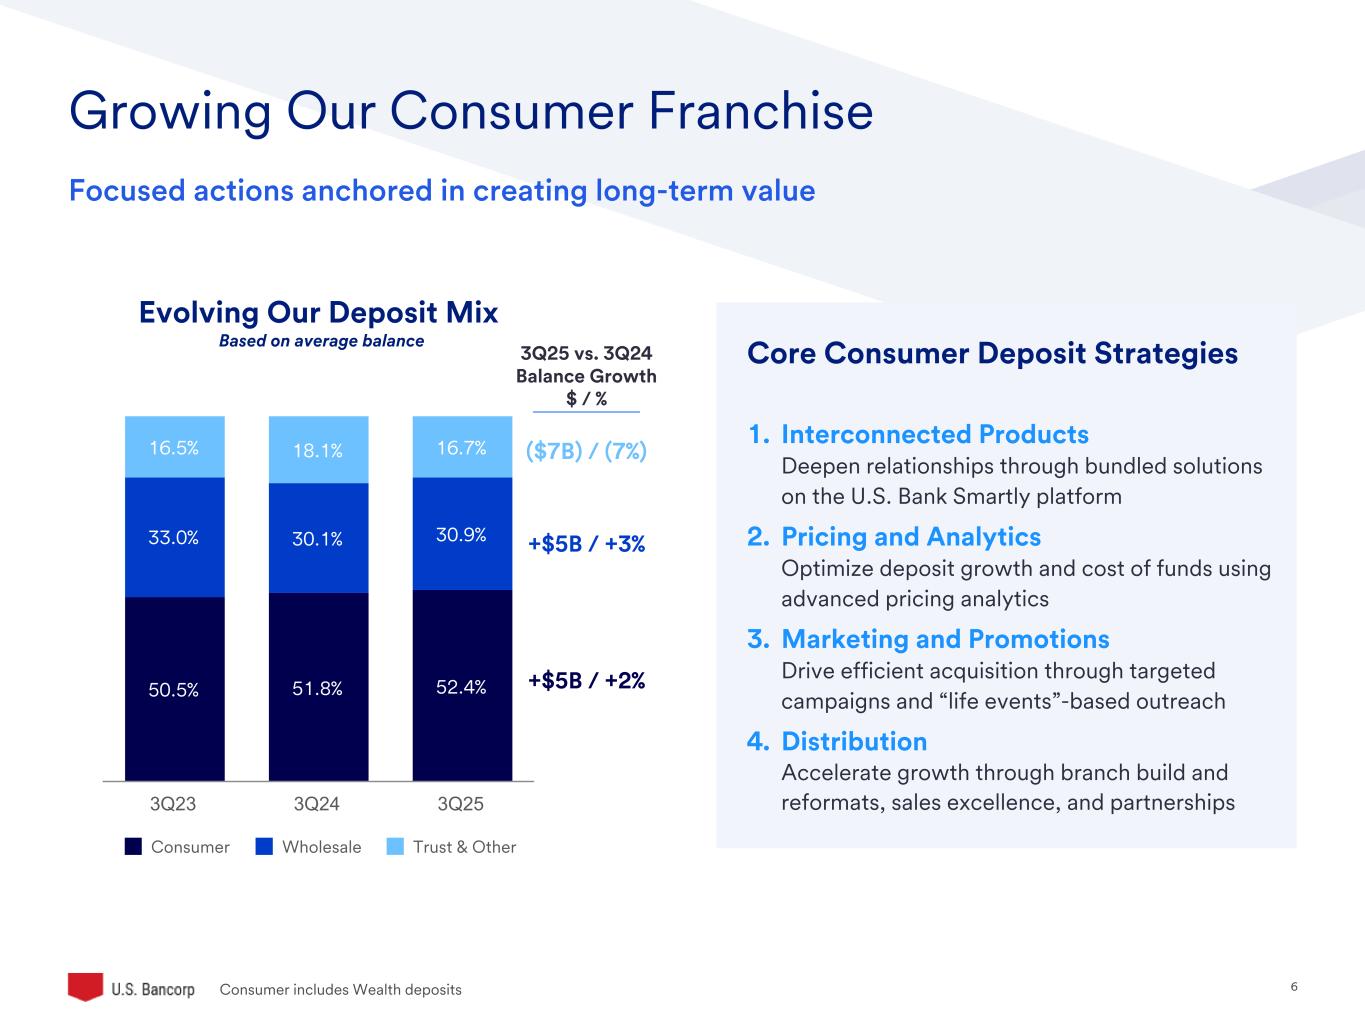
6 50.5% 51.8% 52.4% 33.0% 30.1% 30.9% 16.5% 18.1% 16.7% Consumer Wholesale Trust & Other 3Q23 3Q24 3Q25 Core Consumer Deposit Strategies 1. Interconnected Products Deepen relationships through bundled solutions on the U.S. Bank Smartly platform 2. Pricing and Analytics Optimize deposit growth and cost of funds using advanced pricing analytics 3. Marketing and Promotions Drive efficient acquisition through targeted campaigns and “life events”-based outreach 4. Distribution Accelerate growth through branch build and reformats, sales excellence, and partnerships Growing Our Consumer Franchise Evolving Our Deposit Mix Based on average balance 3Q25 vs. 3Q24 Balance Growth $ / % ($7B) / (7%) +$5B / +3% +$5B / +2% Focused actions anchored in creating long-term value Consumer includes Wealth deposits
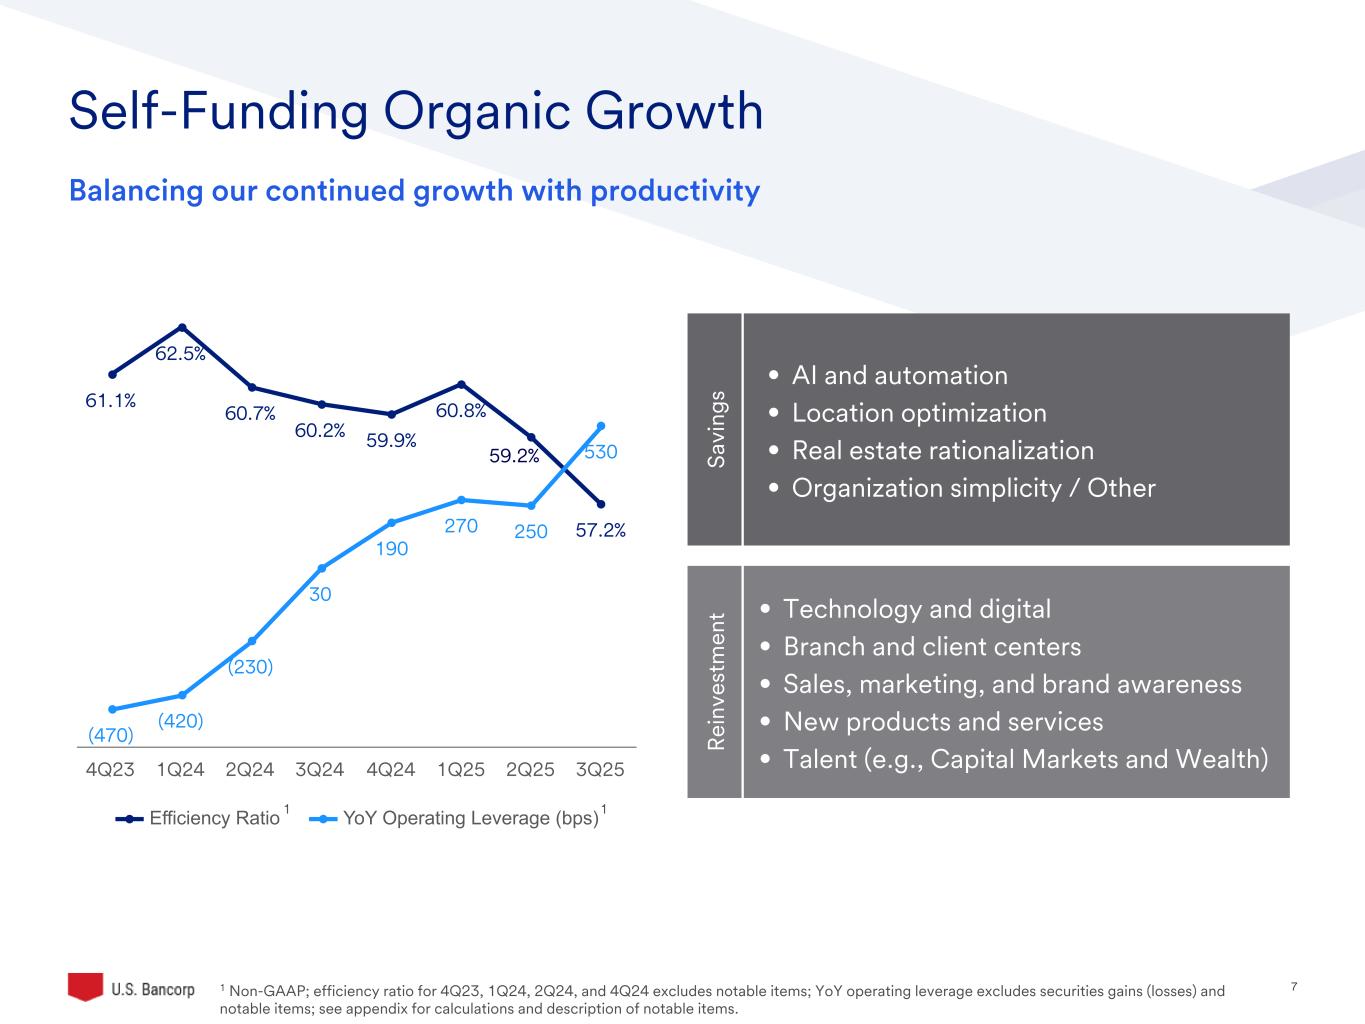
7 61.1% 62.5% 60.7% 60.2% 59.9% 60.8% 57.2% (470) (420) (230) 30 190 270 250 530 Efficiency Ratio YoY Operating Leverage (bps) 4Q23 1Q24 2Q24 3Q24 4Q24 1Q25 2Q25 3Q25 • AI and automation • Location optimization • Real estate rationalization • Organization simplicity / Other Self-Funding Organic Growth Balancing our continued growth with productivity • Technology and digital • Branch and client centers • Sales, marketing, and brand awareness • New products and services • Talent (e.g., Capital Markets and Wealth) Sa vi ng s Re in ve st m en t 1 Non-GAAP; efficiency ratio for 4Q23, 1Q24, 2Q24, and 4Q24 excludes notable items; YoY operating leverage excludes securities gains (losses) and notable items; see appendix for calculations and description of notable items. 1 1 59.2%
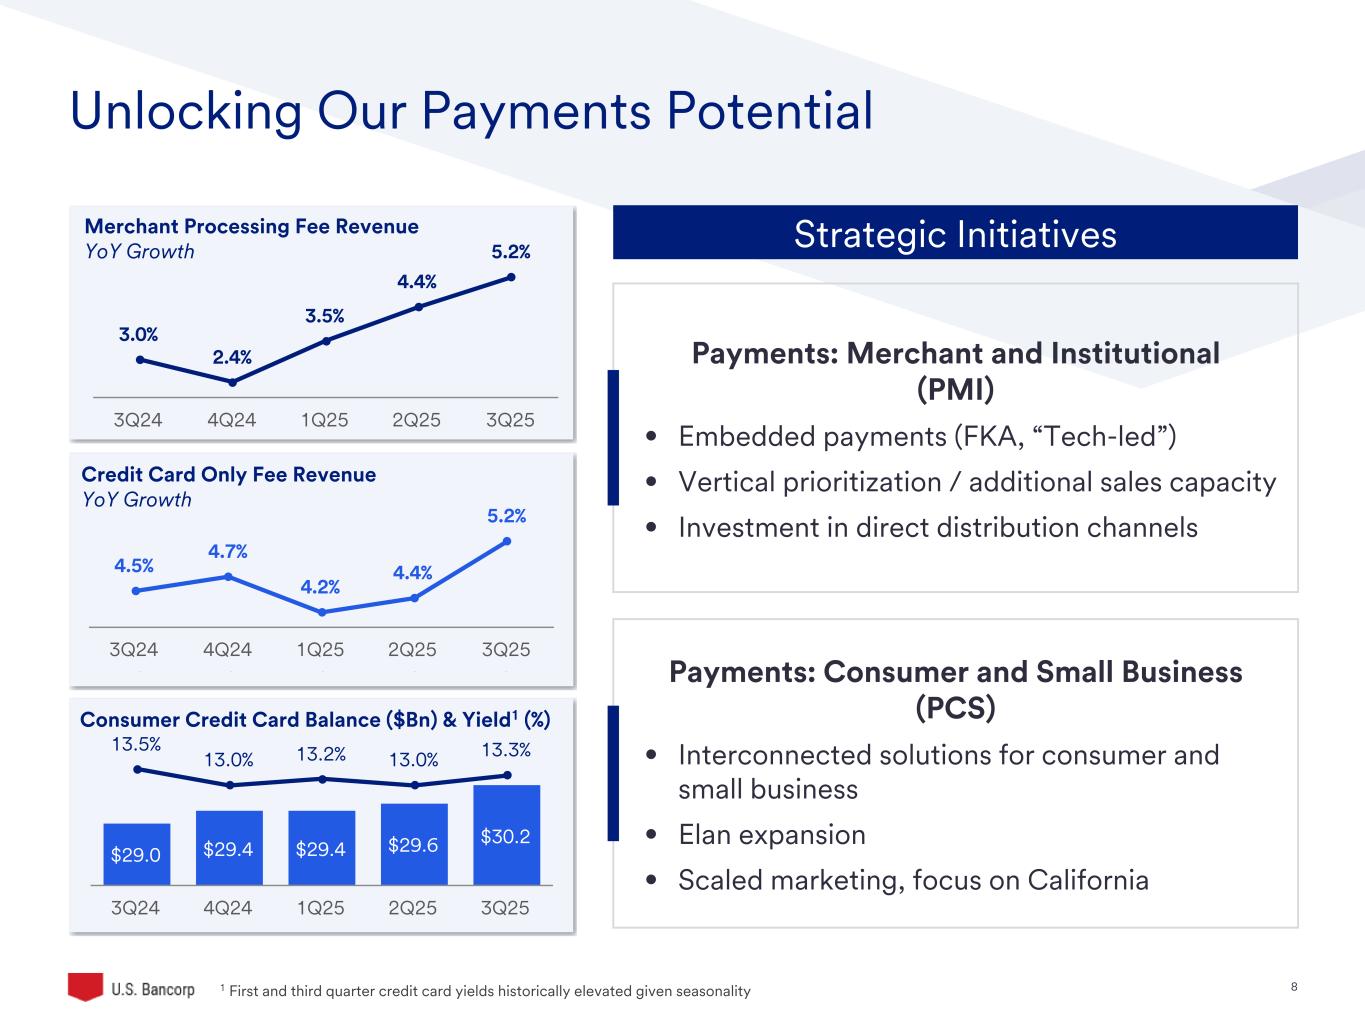
8 4.5% 4.7% 4.2% 4.4% 5.2% 3Q24 4Q24 1Q25 2Q25 3Q25 3.0% 2.4% 3.5% 4.4% 5.2% 3Q24 4Q24 1Q25 2Q25 3Q25 Unlocking Our Payments Potential Strategic Initiatives Payments: Merchant and Institutional (PMI) • Embedded payments (FKA, “Tech-led”) • Vertical prioritization / additional sales capacity • Investment in direct distribution channels Payments: Consumer and Small Business (PCS) • Interconnected solutions for consumer and small business • Elan expansion • Scaled marketing, focus on California Merchant Processing Fee Revenue YoY Growth Credit Card Only Fee Revenue YoY Growth Consumer Credit Card Balance ($Bn) & Yield1 (%) $29.0 $29.4 $29.4 $29.6 $30.2 13.5% 13.0% 13.2% 13.0% 13.3% 3Q24 4Q24 1Q25 2Q25 3Q25 1 First and third quarter credit card yields historically elevated given seasonality
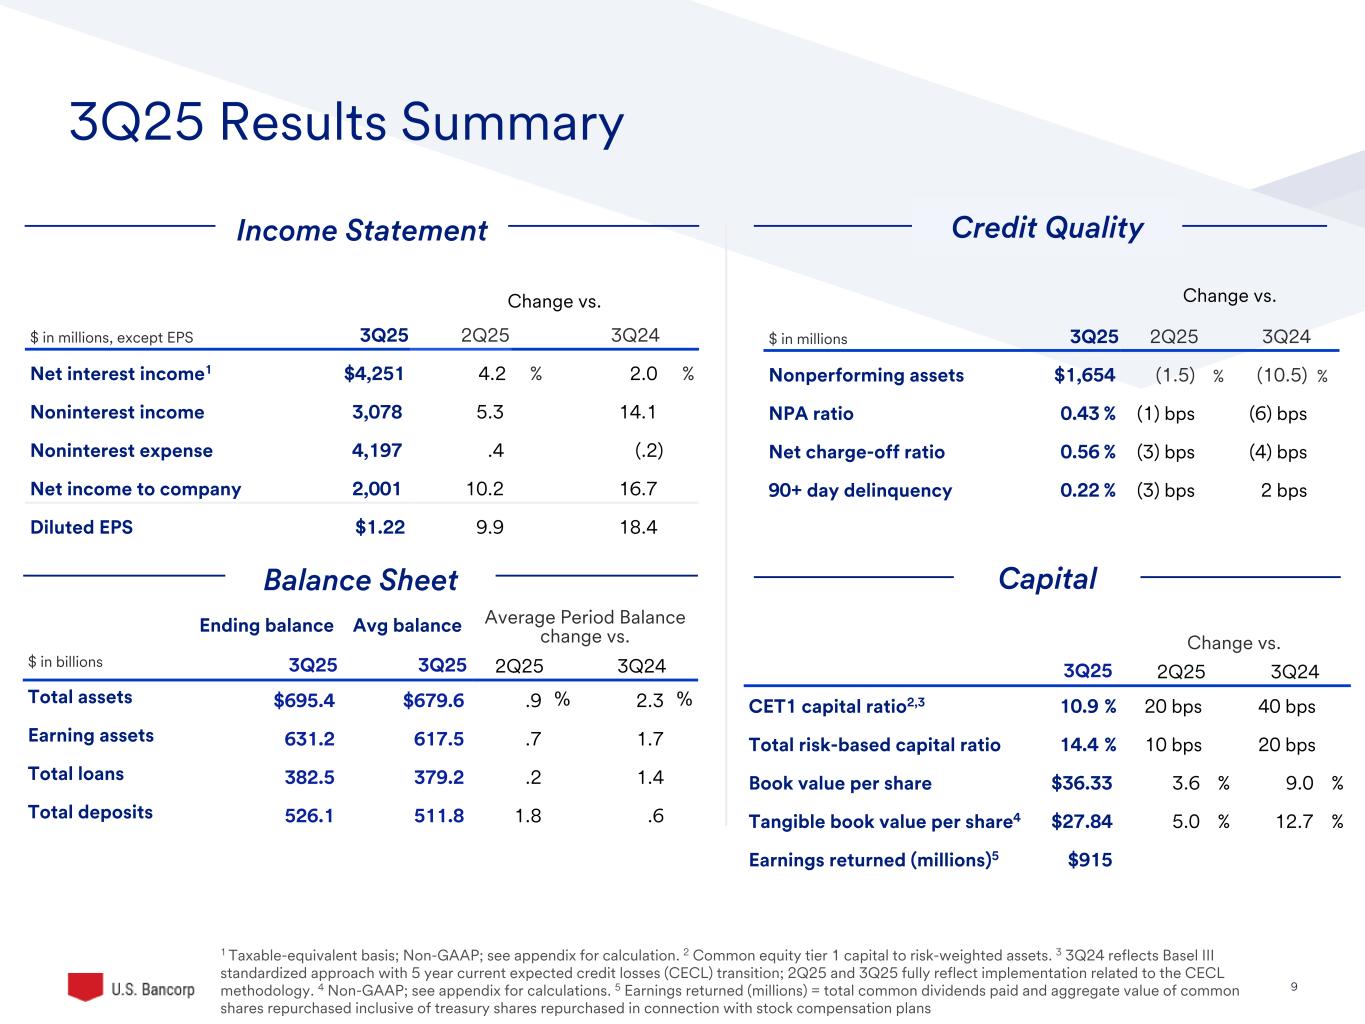
9©2025 U.S. Bank | Confidential 3Q25 Results Summary Income Statement Balance Sheet Capital 1 Taxable-equivalent basis; Non-GAAP; see appendix for calculation. 2 Common equity tier 1 capital to risk-weighted assets. 3 3Q24 reflects Basel III standardized approach with 5 year current expected credit losses (CECL) transition; 2Q25 and 3Q25 fully reflect implementation related to the CECL methodology. 4 Non-GAAP; see appendix for calculations. 5 Earnings returned (millions) = total common dividends paid and aggregate value of common shares repurchased inclusive of treasury shares repurchased in connection with stock compensation plans Change vs. $ in millions, except EPS 3Q25 2Q25 3Q24 Net interest income1 $4,251 4.2 % 2.0 % Noninterest income 3,078 5.3 14.1 Noninterest expense 4,197 .4 (.2) Net income to company 2,001 10.2 16.7 Diluted EPS $1.22 9.9 18.4 Change vs. $ in millions 3Q25 2Q25 3Q24 Nonperforming assets $1,654 (1.5) % (10.5) % NPA ratio 0.43 % (1) bps (6) bps Net charge-off ratio 0.56 % (3) bps (4) bps 90+ day delinquency 0.22 % (3) bps 2 bps Ending balance Avg balance Average Period Balance change vs. $ in billions 3Q25 3Q25 2Q25 3Q24 Total assets $695.4 $679.6 .9 % 2.3 % Earning assets 631.2 617.5 .7 1.7 Total loans 382.5 379.2 .2 1.4 Total deposits 526.1 511.8 1.8 .6 Change vs. 3Q25 2Q25 3Q24 CET1 capital ratio2,3 10.9 % 20 bps 40 bps Total risk-based capital ratio 14.4 % 10 bps 20 bps Book value per share $36.33 3.6 % 9.0 % Tangible book value per share4 $27.84 5.0 % 12.7 % Earnings returned (millions)5 $915 Credit Quality

10©2025 U.S. Bank | Confidential 60.2% 59.2% 57.2% 2.74% 2.66% 2.75% Efficiency Ratio Net Interest Margin 3Q24 2Q25 3Q25 Performance Ratios 1.03% 1.08% 1.17% 3Q24 2Q25 3Q25 12.4% 12.9% 13.5% 3Q24 2Q25 3Q25 17.9% 18.0% 18.6% 3Q24 2Q25 3Q25 Return on Average Assets Return on Average Common Equity Return on Tangible Common Equity1 Efficiency Ratio1 & Net Interest Margin 2 2 1 Non-GAAP; see appendix for calculations 2 Net interest margin on a taxable-equivalent basis; see appendix for calculations
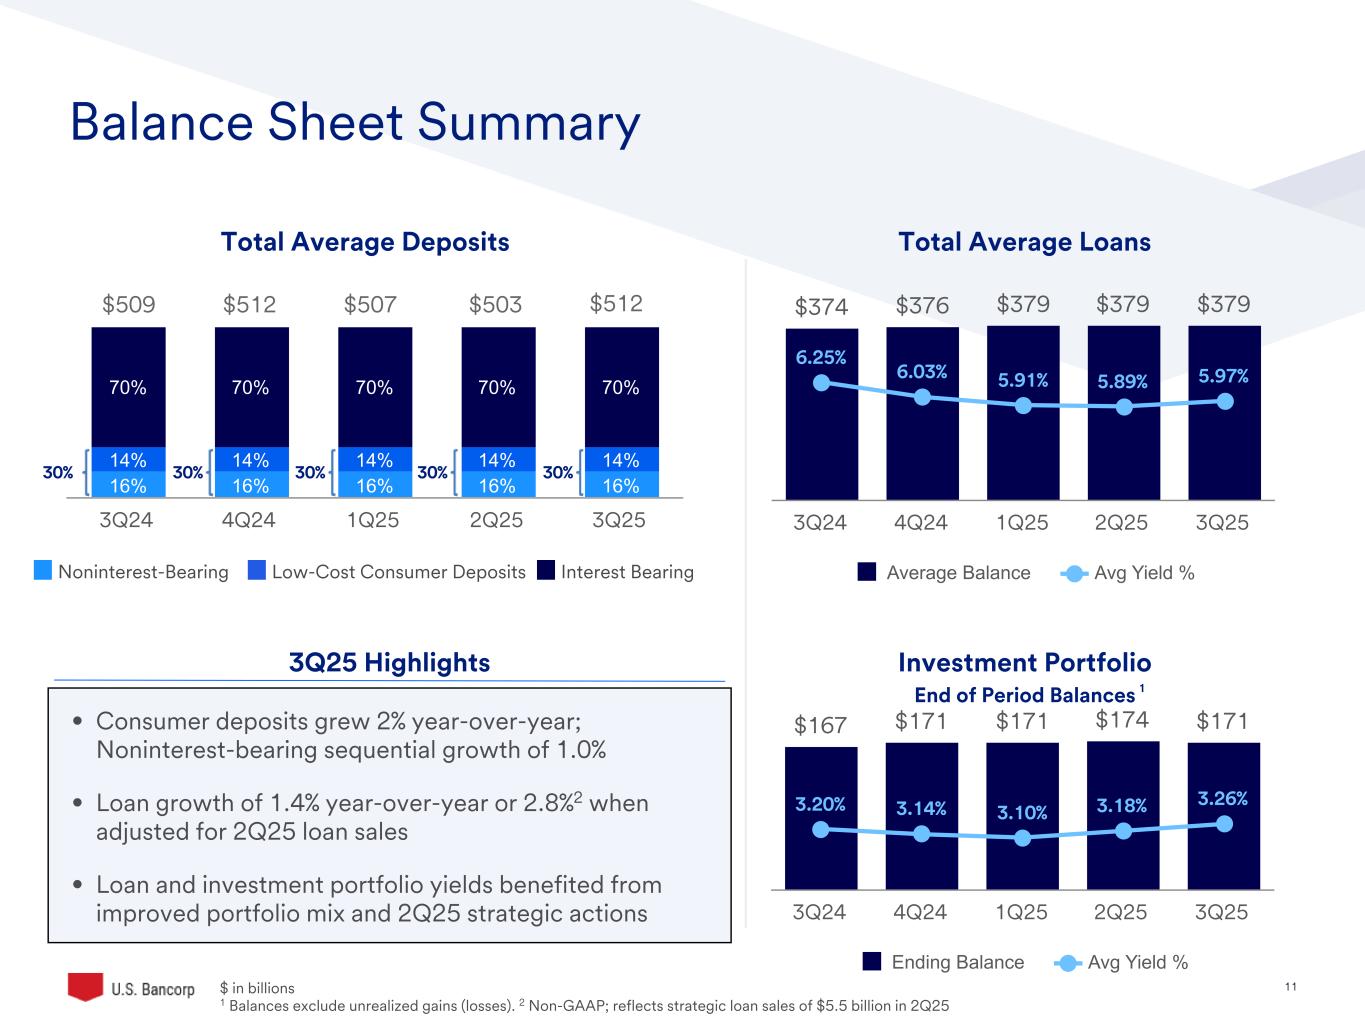
11©2025 U.S. Bank | Confidential Balance Sheet Summary 16% 16% 16% 16% 16% 14% 14% 14% 14% 14% 70% 70% 70% 70% 70% 3Q24 4Q24 1Q25 2Q25 3Q25 Total Average Deposits 3Q25 Highlights Total Average Loans $374 $376 $379 $379 $379 6.25% 6.03% 5.91% 5.89% 5.97% Average Balance Avg Yield % 3Q24 4Q24 1Q25 2Q25 3Q25 Investment Portfolio End of Period Balances $ in b llio s 1 Balances exclude unrealized gains (losses). 2 Non-GAAP; reflects strategic loan sales of $5.5 billion in 2Q25 $167 $171 $171 $174 $171 3.20% 3.14% 3.10% 3.18% 3.26% Ending Balance Avg Yield % 3Q24 4Q24 1Q25 2Q25 3Q25 1 $509 $512 $507 $503 30% 30% 30% 30% $512 Noninterest-Bearing Low-Cost Consumer Deposits Interest Bearing • Consumer deposits grew 2% year-over-year; Noninterest-bearing sequential growth of 1.0% • Loan growth of 1.4% year-over-year or 2.8%2 when adjusted for 2Q25 loan sales • Loan and investment portfolio yields benefited from improved portfolio mix and 2Q25 strategic actions 30%
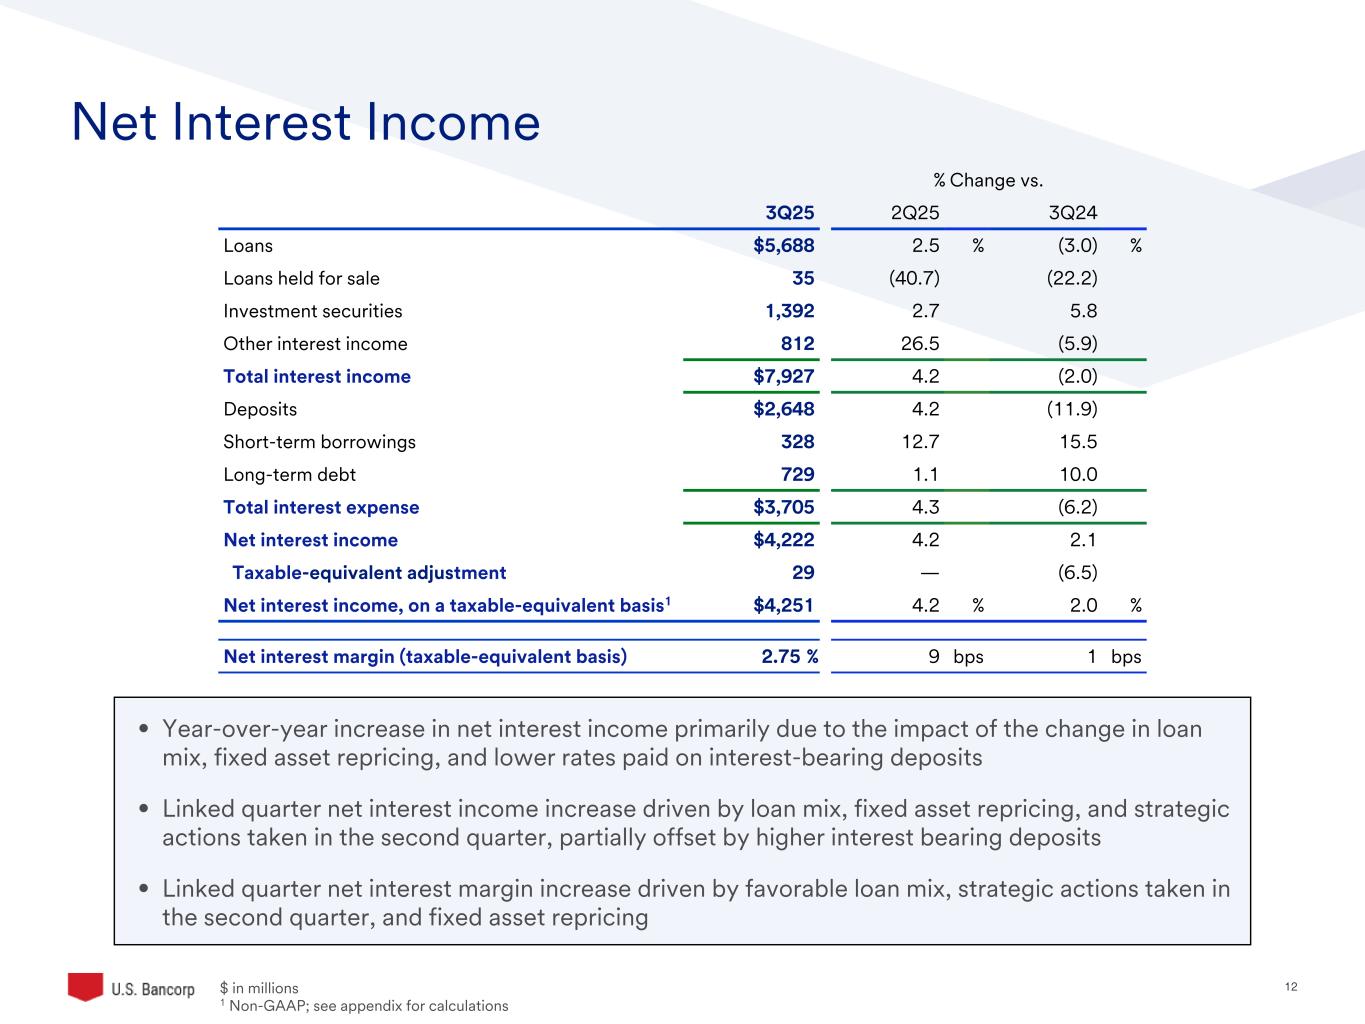
12©2025 U.S. Bank | Confidential • Year-over-year increase in net interest income primarily due to the impact of the change in loan mix, fixed asset repricing, and lower rates paid on interest-bearing deposits • Linked quarter net interest income increase driven by loan mix, fixed asset repricing, and strategic actions taken in the second quarter, partially offset by higher interest bearing deposits • Linked quarter net interest margin increase driven by favorable loan mix, strategic actions taken in the second quarter, and fixed asset repricing Net Interest Income % Change vs. 3Q25 2Q25 3Q24 Loans $5,688 2.5 % (3.0) % Loans held for sale 35 (40.7) (22.2) Investment securities 1,392 2.7 5.8 Other interest income 812 26.5 (5.9) Total interest income $7,927 4.2 (2.0) Deposits $2,648 4.2 (11.9) Short-term borrowings 328 12.7 15.5 Long-term debt 729 1.1 10.0 Total interest expense $3,705 4.3 (6.2) Net interest income $4,222 4.2 2.1 Taxable-equivalent adjustment 29 — (6.5) Net interest income, on a taxable-equivalent basis1 $4,251 4.2 % 2.0 % Net interest margin (taxable-equivalent basis) 2.75 % 9 bps 1 bps $ in millions 1 Non-GAAP; see appendix for calculations
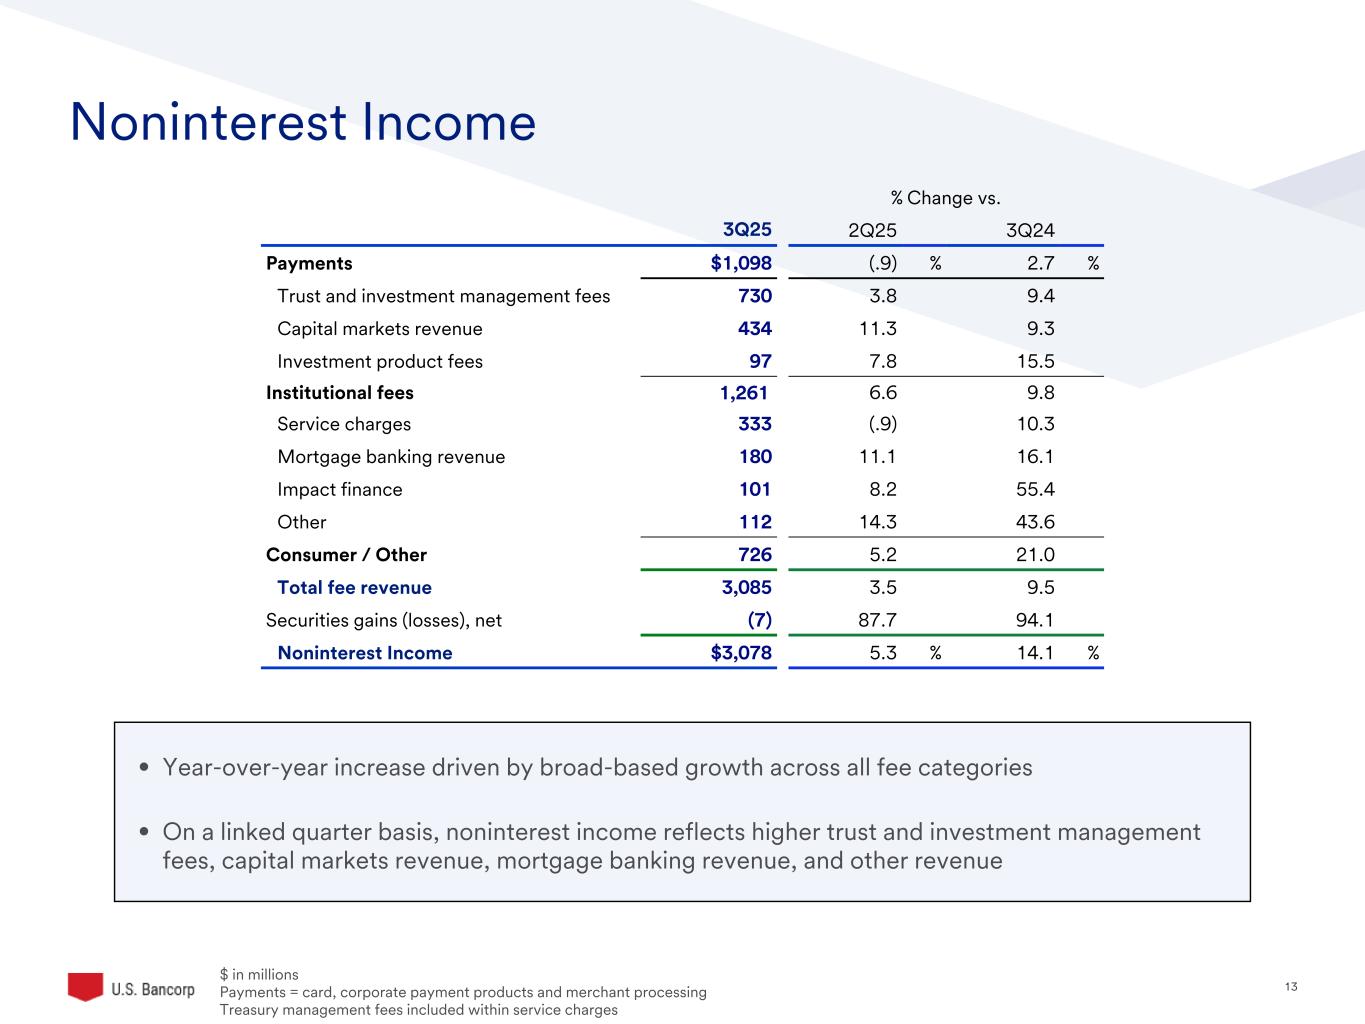
13©2025 U.S. Bank | Confidential Noninterest Income $ in millions Payments = card, corporate payment products and merchant processing Treasury management fees included within service charges % Change vs. 3Q25 2Q25 3Q24 Payments $1,098 (.9) % 2.7 % Trust and investment management fees 730 3.8 9.4 Capital markets revenue 434 11.3 9.3 Investment product fees 97 7.8 15.5 Institutional fees 1,261 6.6 9.8 Service charges 333 (.9) 10.3 Mortgage banking revenue 180 11.1 16.1 Impact finance 101 8.2 55.4 Other 112 14.3 43.6 Consumer / Other 726 5.2 21.0 Total fee revenue 3,085 3.5 9.5 Securities gains (losses), net (7) 87.7 94.1 Noninterest Income $3,078 5.3 % 14.1 % • Year-over-year increase driven by broad-based growth across all fee categories • On a linked quarter basis, noninterest income reflects higher trust and investment management fees, capital markets revenue, mortgage banking revenue, and other revenue

14©2025 U.S. Bank | Confidential Noninterest Expense $ in millions % Change vs. 3Q25 2Q25 3Q24 Compensation and benefits $2,561 (1.5) % (2.9) % Technology and communications 560 4.9 6.9 Occupancy and equipment 300 (.3) (5.4) Professional services 117 7.3 (10.0) Marketing and business development 175 8.7 6.1 All other 484 1.7 12.3 Total noninterest expense $4,197 .4 % (.2) % • Year-over-year decrease in noninterest expense was driven by lower compensation and benefits expense and occupancy and equipment expense, partially reinvested in technology and marketing expense • On a linked quarter basis, increase in noninterest expense was driven by higher marketing and business development expense and technology and communications expense
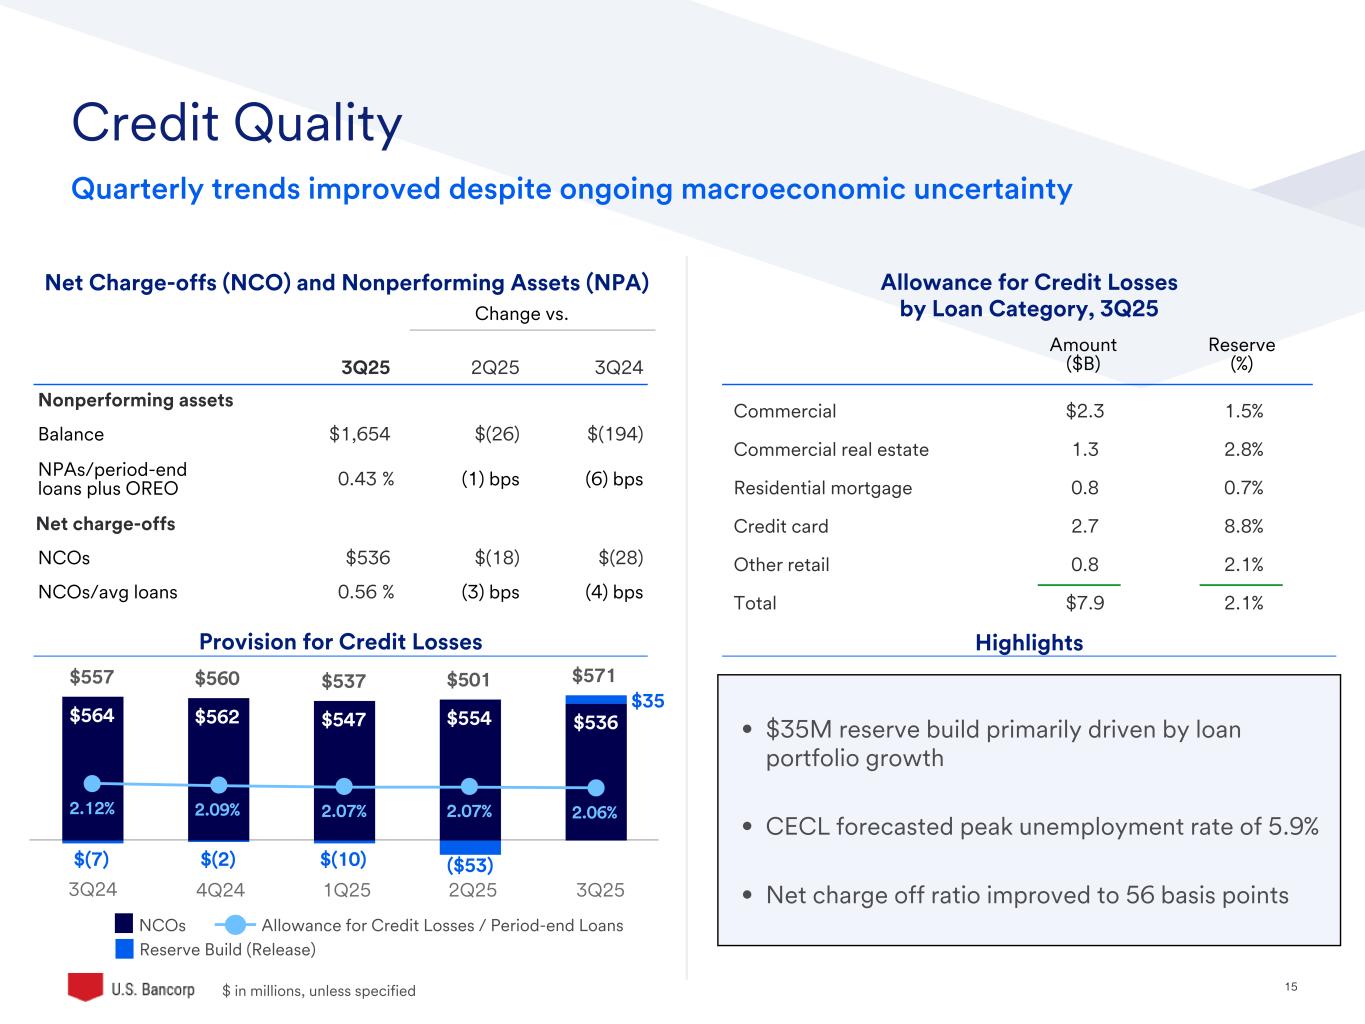
15©2025 U.S. Bank | Confidential $557 $560 $537 $501 $571 $564 $562 $547 $554 $536 $(7) $(2) $(10) 2.12% 2.09% 2.07% 2.07% 2.06% $ in millions, unless specified Credit Quality Quarterly trends improved despite ongoing macroeconomic uncertainty Amount ($B) Reserve (%) Commercial $2.3 1.5% Commercial real estate 1.3 2.8% Residential mortgage 0.8 0.7% Credit card 2.7 8.8% Other retail 0.8 2.1% Total $7.9 2.1% Change vs. 3Q25 2Q25 3Q24 Nonperforming assets Balance $1,654 $(26) $(194) NPAs/period-end loans plus OREO 0.43 % (1) bps (6) bps Net charge-offs NCOs $536 $(18) $(28) NCOs/avg loans 0.56 % (3) bps (4) bps Provision for Credit Losses Net Charge-offs (NCO) and Nonperforming Assets (NPA) Highlights Allowance for Credit Losses by Loan Category, 3Q25 • $35M reserve build primarily driven by loan portfolio growth • CECL forecasted peak unemployment rate of 5.9% • Net charge off ratio improved to 56 basis points NCOs Reserve Build (Release) Allowance for Credit Losses / Period-end Loans 3Q24 4Q24 1Q25 2Q25 3Q25 ($53) $35
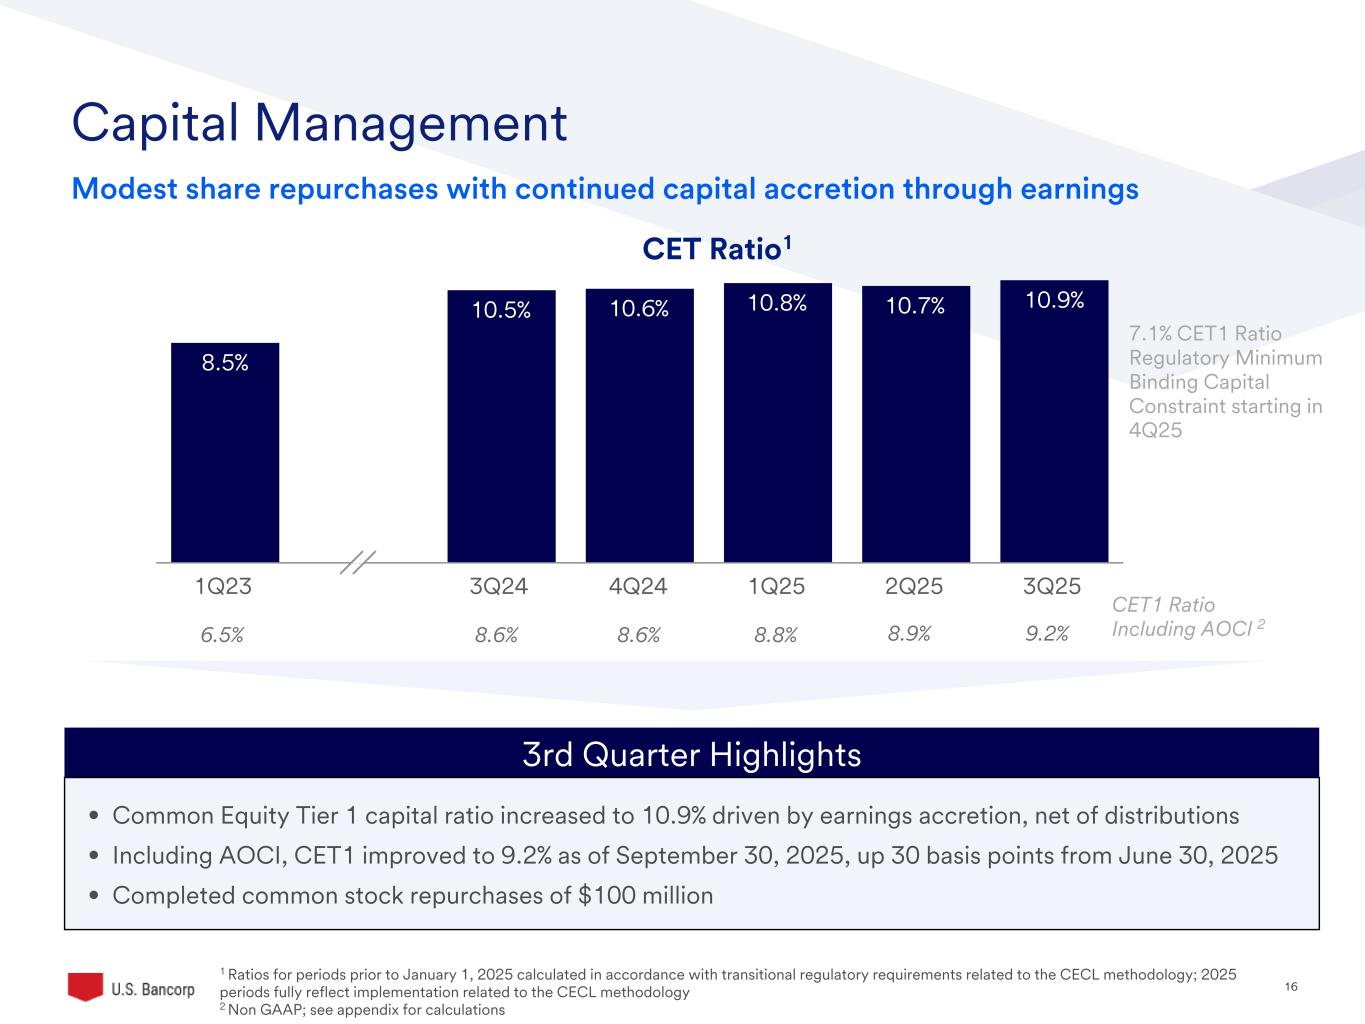
16©2025 U.S. Bank | Confidential Capital Management Modest share repurchases with continued capital accretion through earnings 1 Ratios for periods prior to January 1, 2025 calculated in accordance with transitional regulatory requirements related to the CECL methodology; 2025 periods fully reflect implementation related to the CECL methodology 2 Non GAAP; see appendix for calculations 3rd Quarter Highlights CET1 Ratio Including AOCI 28.8%8.6%8.6% 8.9%6.5% 8.5% 10.5% 10.6% 10.8% 10.7% 10.9% 1Q23 3Q24 4Q24 1Q25 2Q25 3Q25 7.1% CET1 Ratio Regulatory Minimum Binding Capital Constraint starting in 4Q25 9.2% • Common Equity Tier 1 capital ratio increased to 10.9% driven by earnings accretion, net of distributions • Including AOCI, CET1 improved to 9.2% as of September 30, 2025, up 30 basis points from June 30, 2025 • Completed common stock repurchases of $100 million CET Ratio1
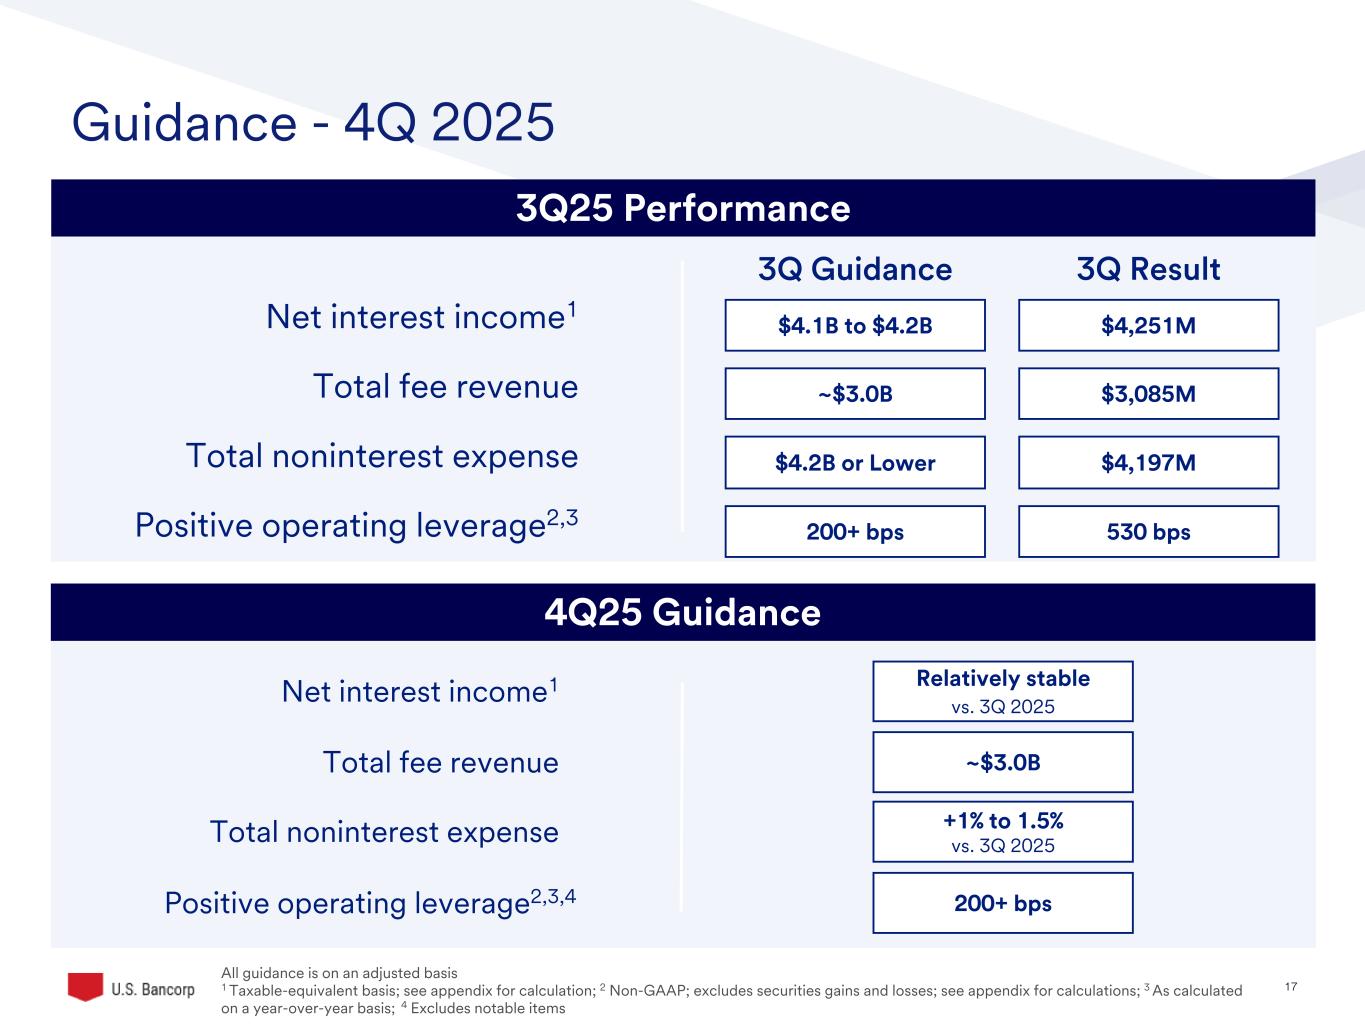
17©2025 U.S. Bank | Confidential Guidance - 4Q 2025 All guidance is on an adjusted basis 1 Taxable-equivalent basis; see appendix for calculation; 2 Non-GAAP; excludes securities gains and losses; see appendix for calculations; 3 As calculated on a year-over-year basis; 4 Excludes notable items 3Q25 Performance Net interest income1 Total noninterest expense Positive operating leverage2,3 3Q Guidance 3Q Result $4.1B to $4.2B $4,251M $4.2B or Lower $4,197M 200+ bps 530 bps 4Q25 Guidance Net interest income1 Total fee revenue Total noninterest expense Positive operating leverage2,3,4 Total fee revenue ~$3.0B $3,085M Relatively stable vs. 3Q 2025 +1% to 1.5% vs. 3Q 2025 200+ bps ~$3.0B
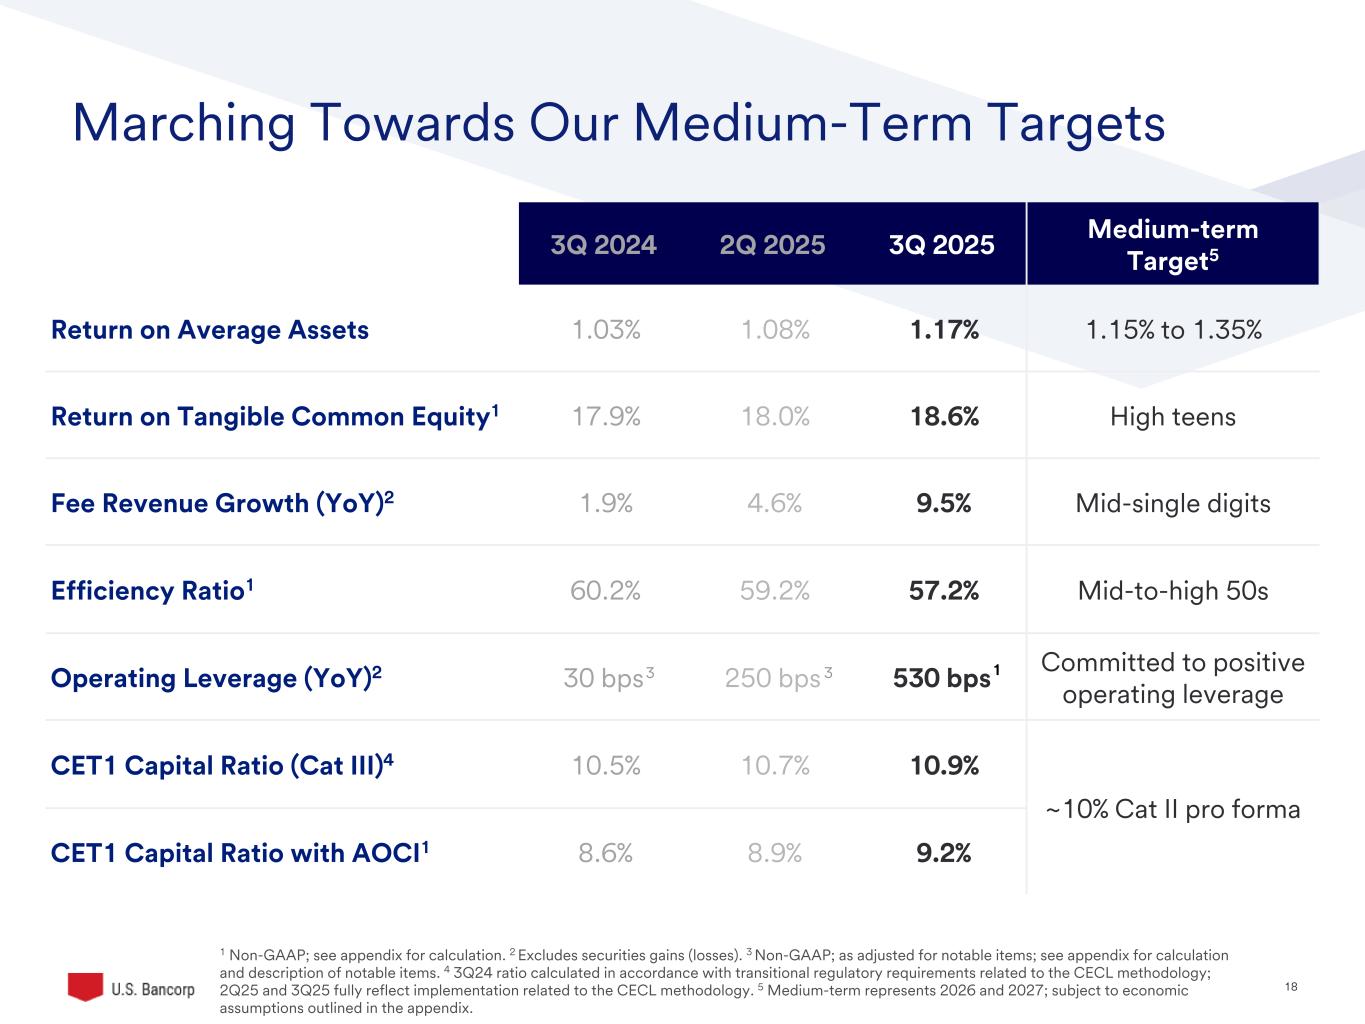
18©2025 U.S. Bank | Confidential Marching Towards Our Medium-Term Targets 1 Non-GAAP; see appendix for calculation. 2 Excludes securities gains (losses). 3 Non-GAAP; as adjusted for notable items; see appendix for calculation and description of notable items. 4 3Q24 ratio calculated in accordance with transitional regulatory requirements related to the CECL methodology; 2Q25 and 3Q25 fully reflect implementation related to the CECL methodology. 5 Medium-term represents 2026 and 2027; subject to economic assumptions outlined in the appendix. 3Q 2024 2Q 2025 3Q 2025 Medium-term Target5 Return on Average Assets 1.03% 1.08% 1.17% 1.15% to 1.35% Return on Tangible Common Equity1 17.9% 18.0% 18.6% High teens Fee Revenue Growth (YoY)2 1.9% 4.6% 9.5% Mid-single digits Efficiency Ratio1 60.2% 59.2% 57.2% Mid-to-high 50s Operating Leverage (YoY)2 30 bps 250 bps 530 bps Committed to positive operating leverage CET1 Capital Ratio (Cat III)4 10.5% 10.7% 10.9% ~10% Cat II pro forma CET1 Capital Ratio with AOCI1 8.6% 8.9% 9.2% 3 3 1
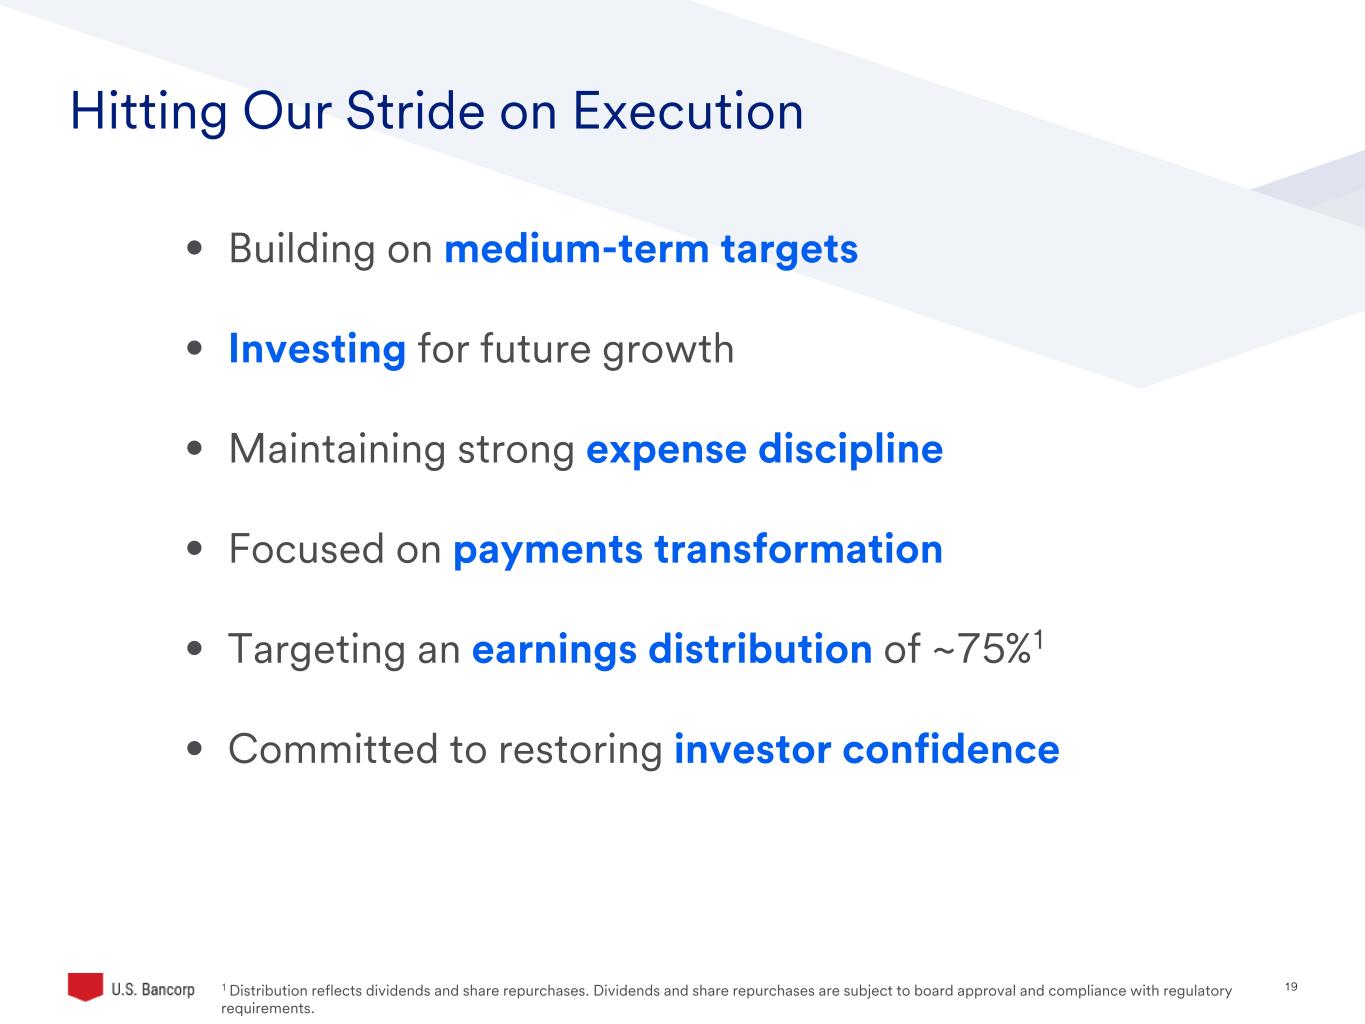
19 • Building on medium-term targets • Investing for future growth • Maintaining strong expense discipline • Focused on payments transformation • Targeting an earnings distribution of ~75%1 • Committed to restoring investor confidence Hitting Our Stride on Execution 1 Distribution reflects dividends and share repurchases. Dividends and share repurchases are subject to board approval and compliance with regulatory requirements.
20©2025 U.S. Bank Appendix
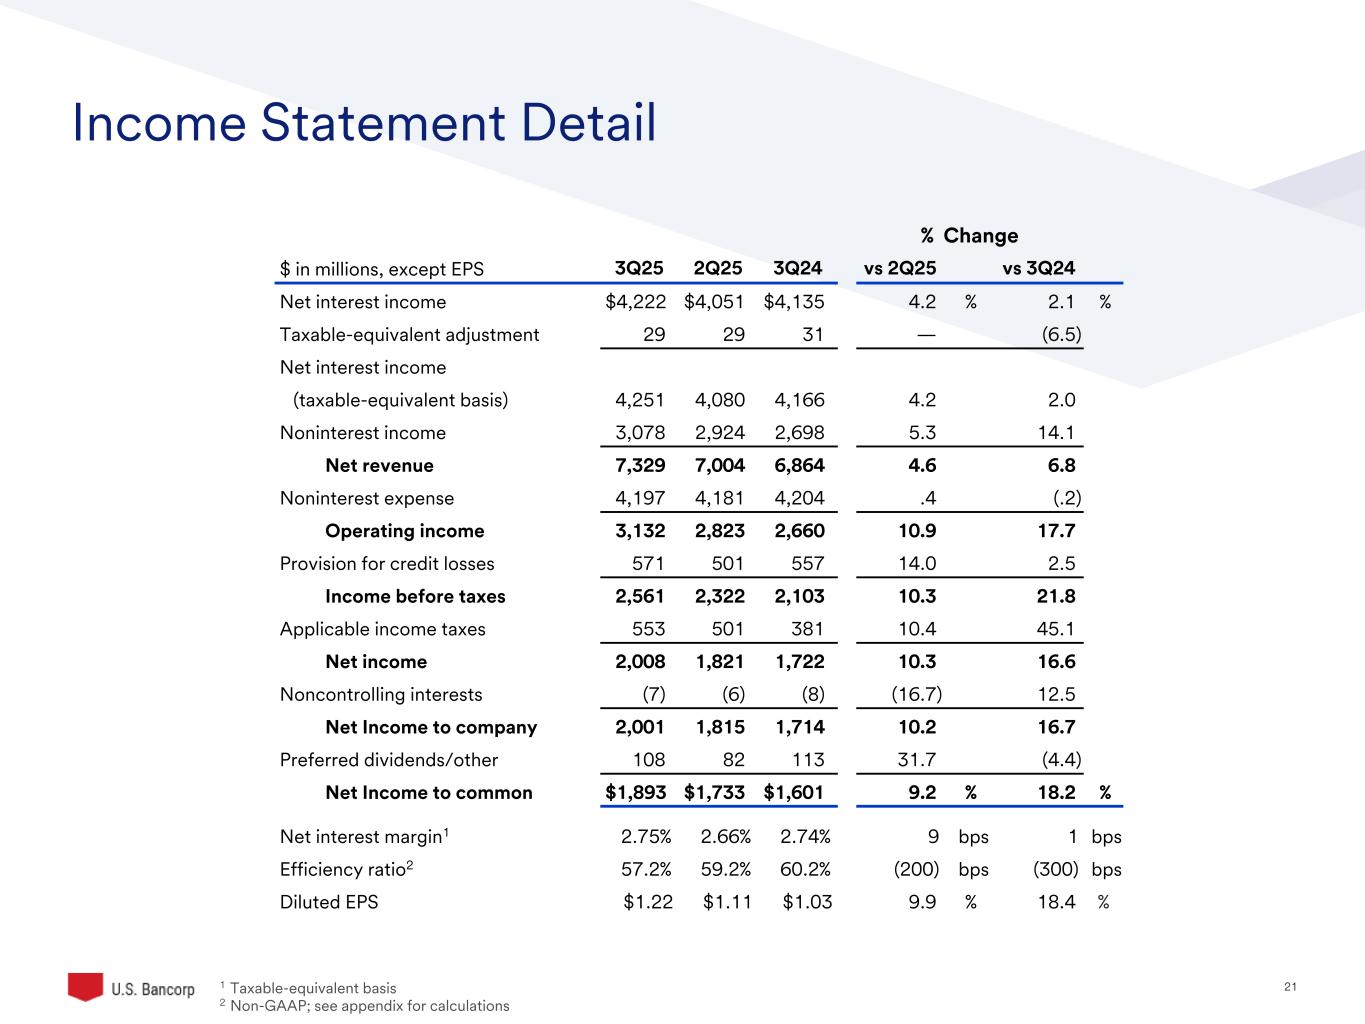
21©2025 U.S. Bank | Confidential Income Statement Detail 1 Taxable-equivalent basis 2 Non-GAAP; see appendix for calculations % Change $ in millions, except EPS 3Q25 2Q25 3Q24 vs 2Q25 vs 3Q24 Net interest income $4,222 $4,051 $4,135 4.2 % 2.1 % Taxable-equivalent adjustment 29 29 31 — (6.5) Net interest income (taxable-equivalent basis) 4,251 4,080 4,166 4.2 2.0 Noninterest income 3,078 2,924 2,698 5.3 14.1 Net revenue 7,329 7,004 6,864 4.6 6.8 Noninterest expense 4,197 4,181 4,204 .4 (.2) Operating income 3,132 2,823 2,660 10.9 17.7 Provision for credit losses 571 501 557 14.0 2.5 Income before taxes 2,561 2,322 2,103 10.3 21.8 Applicable income taxes 553 501 381 10.4 45.1 Net income 2,008 1,821 1,722 10.3 16.6 Noncontrolling interests (7) (6) (8) (16.7) 12.5 Net Income to company 2,001 1,815 1,714 10.2 16.7 Preferred dividends/other 108 82 113 31.7 (4.4) Net Income to common $1,893 $1,733 $1,601 9.2 % 18.2 % Net interest margin1 2.75% 2.66% 2.74% 9 bps 1 bps Efficiency ratio2 57.2% 59.2% 60.2% (200) bps (300) bps Diluted EPS $1.22 $1.11 $1.03 9.9 % 18.4 %
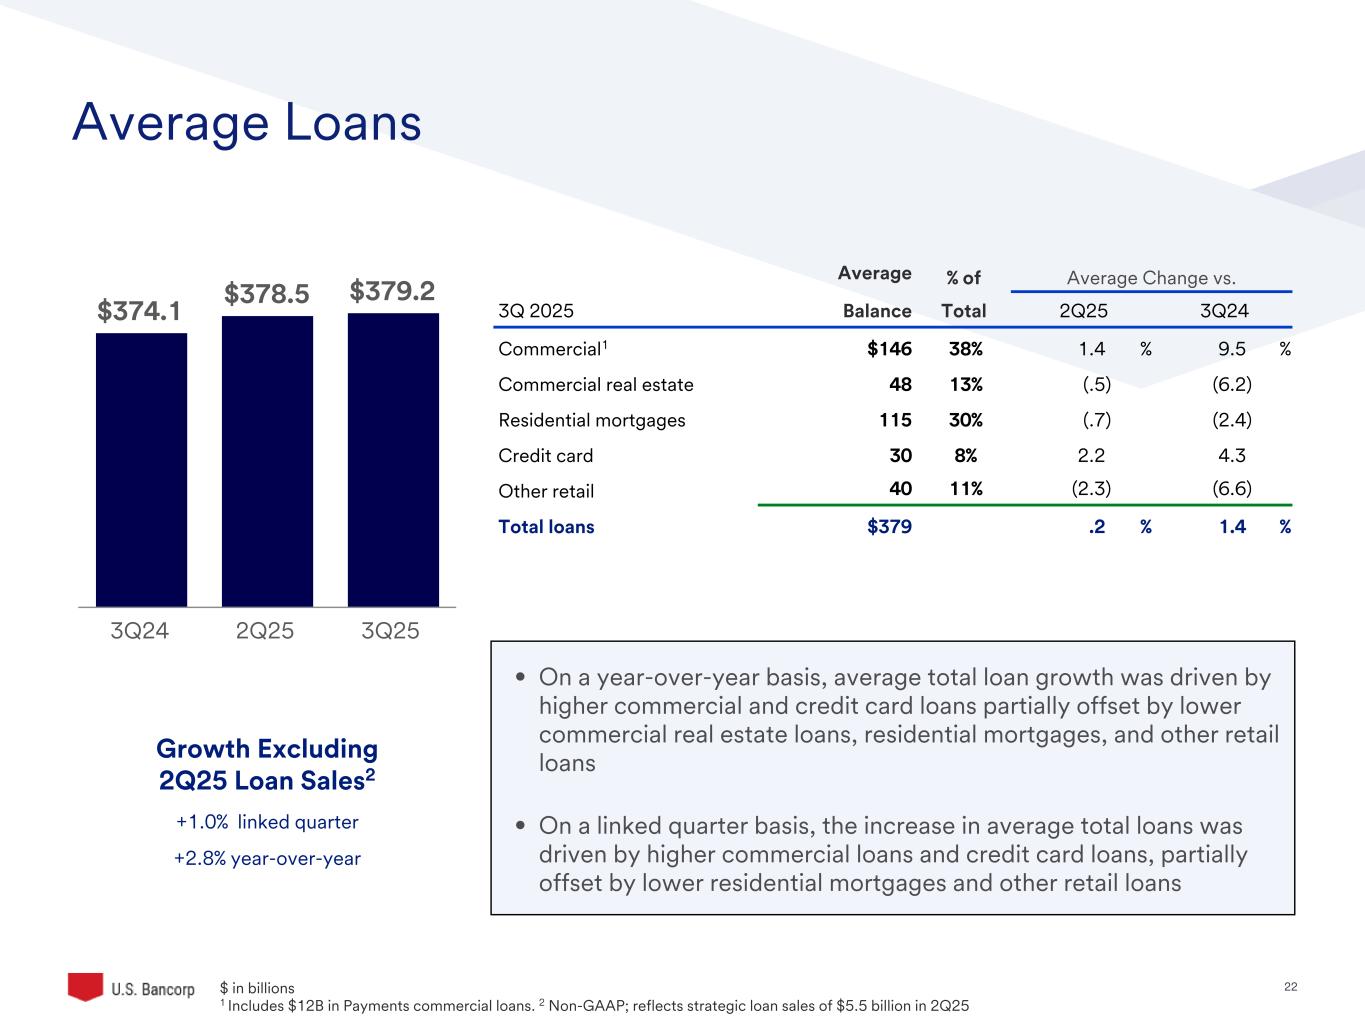
22©2025 U.S. Bank | Confidential Average Loans • On a year-over-year basis, average total loan growth was driven by higher commercial and credit card loans partially offset by lower commercial real estate loans, residential mortgages, and other retail loans • On a linked quarter basis, the increase in average total loans was driven by higher commercial loans and credit card loans, partially offset by lower residential mortgages and other retail loans Average % of Average Change vs. 3Q 2025 Balance Total 2Q25 3Q24 Commercial1 $146 38% 1.4 % 9.5 % Commercial real estate 48 13% (.5) (6.2) Residential mortgages 115 30% (.7) (2.4) Credit card 30 8% 2.2 4.3 Other retail 40 11% (2.3) (6.6) Total loans $379 .2 % 1.4 % $374.1 $378.5 $379.2 3Q24 2Q25 3Q25 $ in b llio s 1 Includes $12B in Payments commercial loans. 2 Non-GAAP; reflects strategic loan sales of $5.5 billion in 2Q25 Growth Excluding 2Q25 Loan Sales2 +1.0% linked quarter +2.8% year-over-year

23 $103 $45 Core C&I NDFI 9/30/2025 12.5% 16.0% 17.3% 27.3% 26.9% 9/30/2025 NDFI Transparency Loan composition based on ending balances ($ in billions) CLO = Collateralized Loan Obligations, BDC = Business Development Corporations, ABS = Asset Backed Security 1 Based on NDFI blended portfolio external S&P equivalent rating of ‘A’ vs Core C&I external equivalent S&P rating of ‘BBB’ 3Q25 Category Allocation Inside NDFI: Business Composition Commercial Loan Composition Private Equity: Subscription Lines (e.g., capital call facilities) Business Credit: CLOs, Commercial ABS, BDCs Consumer Credit: Consumer Auto ABS Mortgage Credit: Warehouse Lines, Repo Lines Other: All Other (e.g. insurance, broker/dealer) Private Equity Business Consumer Mortgage Other Non Depository Financial Institution (NDFI) loan portfolio characteristics: • Balanced composition of subscription lines and credit investment entities with diversified repayment sources • Portfolio credit quality exceeds that of our core investment-grade corporate and commercial lending book1 • Asset quality supported by strong collateral and structural protections
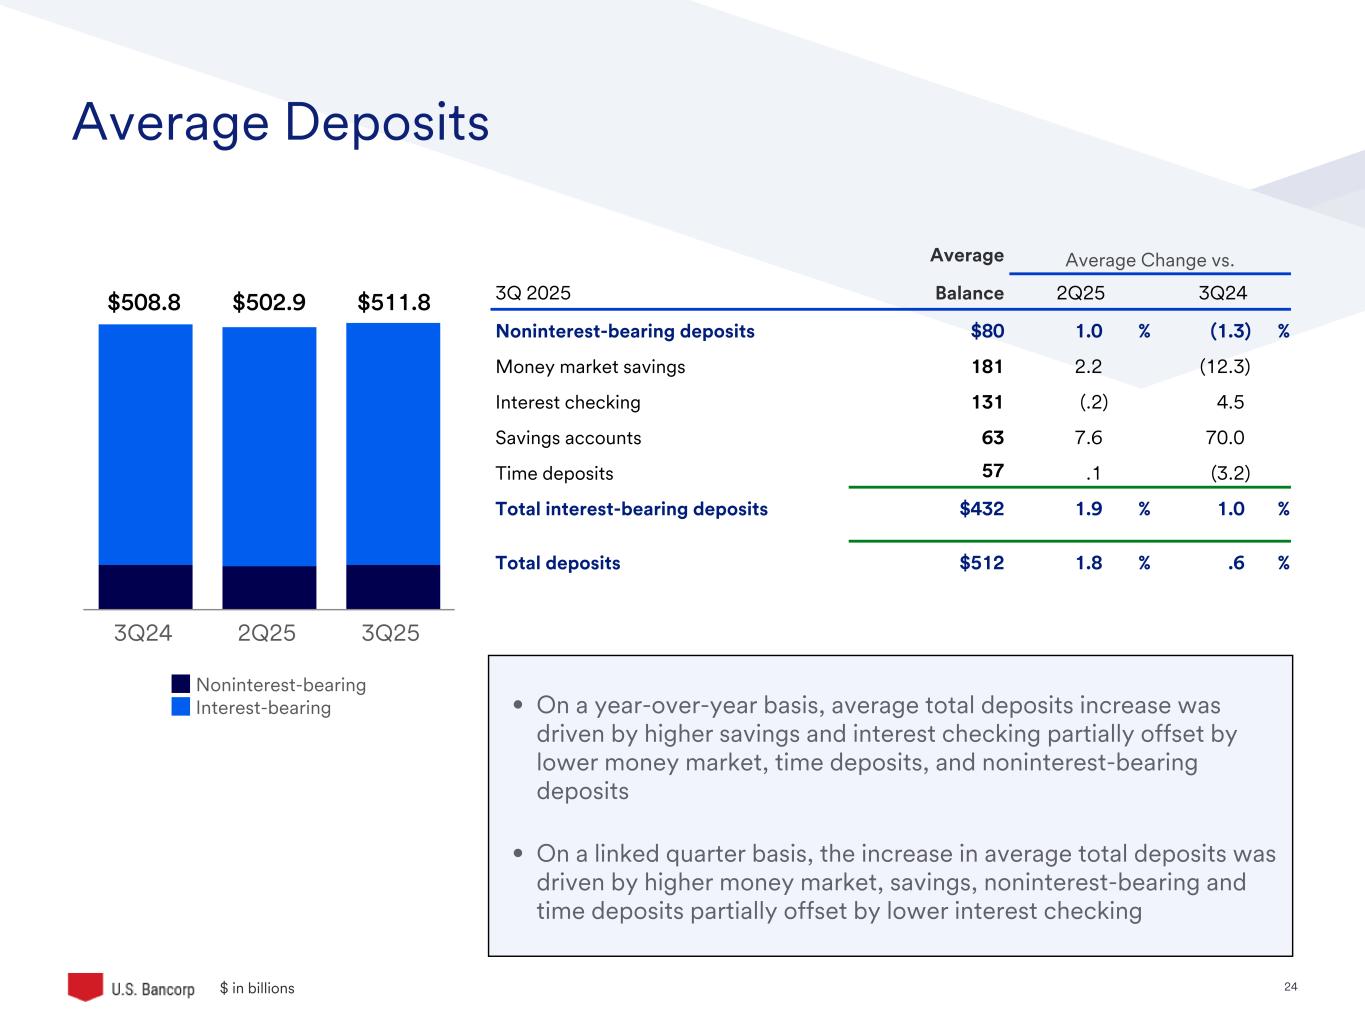
24©2025 U.S. Bank | Confidential Average Deposits • On a year-over-year basis, average total deposits increase was driven by higher savings and interest checking partially offset by lower money market, time deposits, and noninterest-bearing deposits • On a linked quarter basis, the increase in average total deposits was driven by higher money market, savings, noninterest-bearing and time deposits partially offset by lower interest checking $ in b llio s Noninterest-bearing Interest-bearing 3Q24 2Q25 3Q25 Average Average Change vs. 3Q 2025 Balance 2Q25 3Q24 Noninterest-bearing deposits $80 1.0 % (1.3) % Money market savings 181 2.2 (12.3) Interest checking 131 (.2) 4.5 Savings accounts 63 7.6 70.0 Time deposits 57 .1 (3.2) Total interest-bearing deposits $432 1.9 % 1.0 % Total deposits $512 1.8 % .6 % $511.8$502.9$508.8
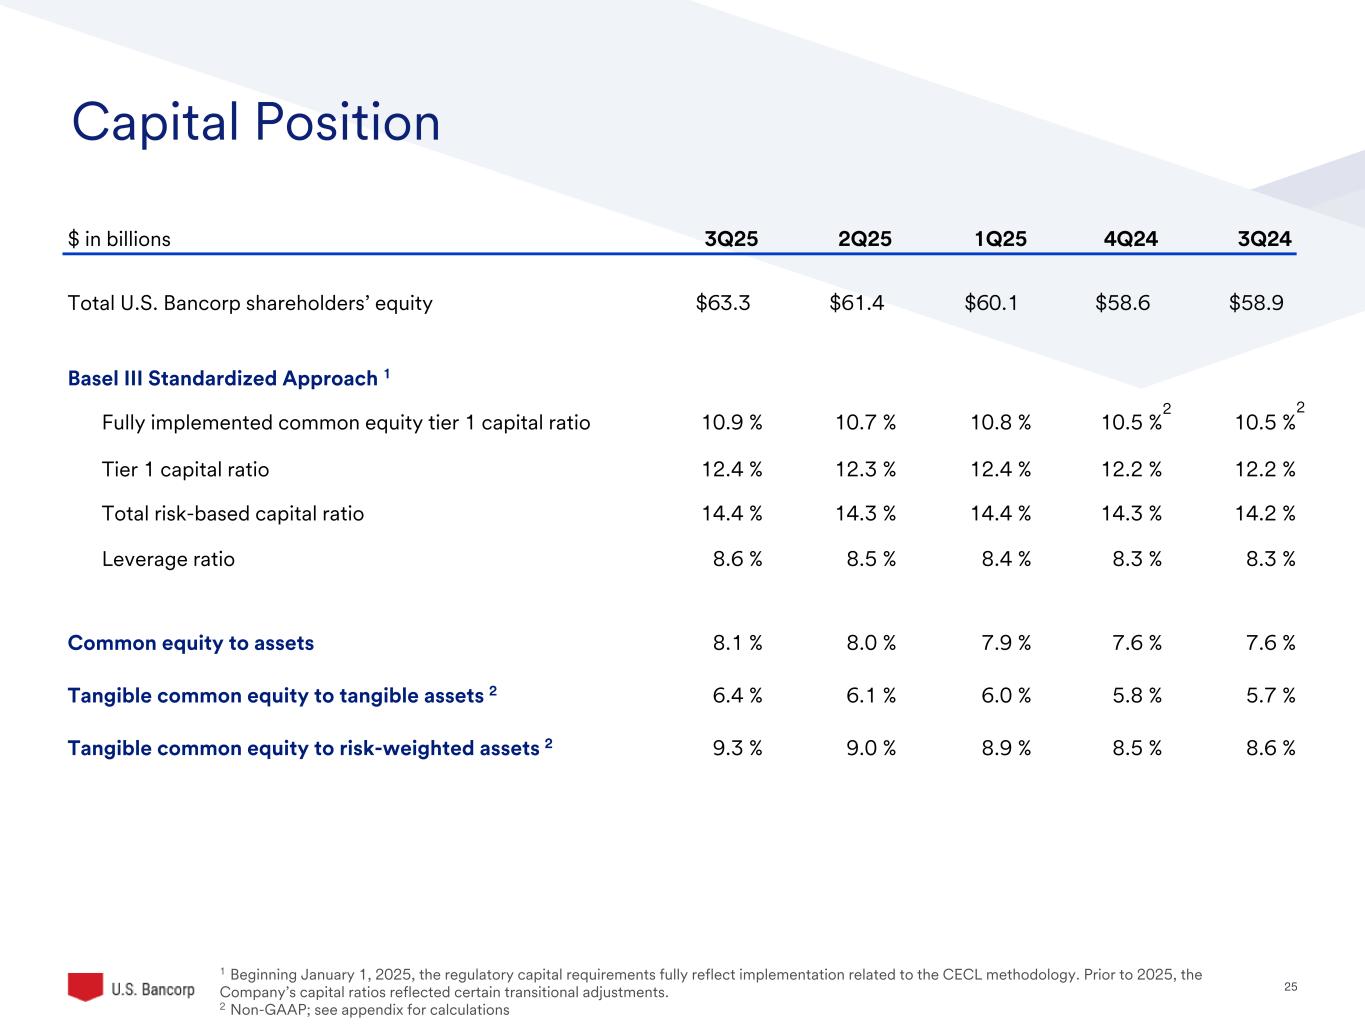
25©2025 U.S. Bank | Confidential Capital Position $ in billions 3Q25 2Q25 1Q25 4Q24 3Q24 Total U.S. Bancorp shareholders’ equity $63.3 $61.4 $60.1 $58.6 $58.9 Basel III Standardized Approach 1 Fully implemented common equity tier 1 capital ratio 10.9 % 10.7 % 10.8 % 10.5 % 10.5 % Tier 1 capital ratio 12.4 % 12.3 % 12.4 % 12.2 % 12.2 % Total risk-based capital ratio 14.4 % 14.3 % 14.4 % 14.3 % 14.2 % Leverage ratio 8.6 % 8.5 % 8.4 % 8.3 % 8.3 % Common equity to assets 8.1 % 8.0 % 7.9 % 7.6 % 7.6 % Tangible common equity to tangible assets 2 6.4 % 6.1 % 6.0 % 5.8 % 5.7 % Tangible common equity to risk-weighted assets 2 9.3 % 9.0 % 8.9 % 8.5 % 8.6 % 1 Beginning January 1, 2025, the regulatory capital requirements fully reflect implementation related to the CECL methodology. Prior to 2025, the Company’s capital ratios reflected certain transitional adjustments. 2 Non-GAAP; see appendix for calculations 2 2
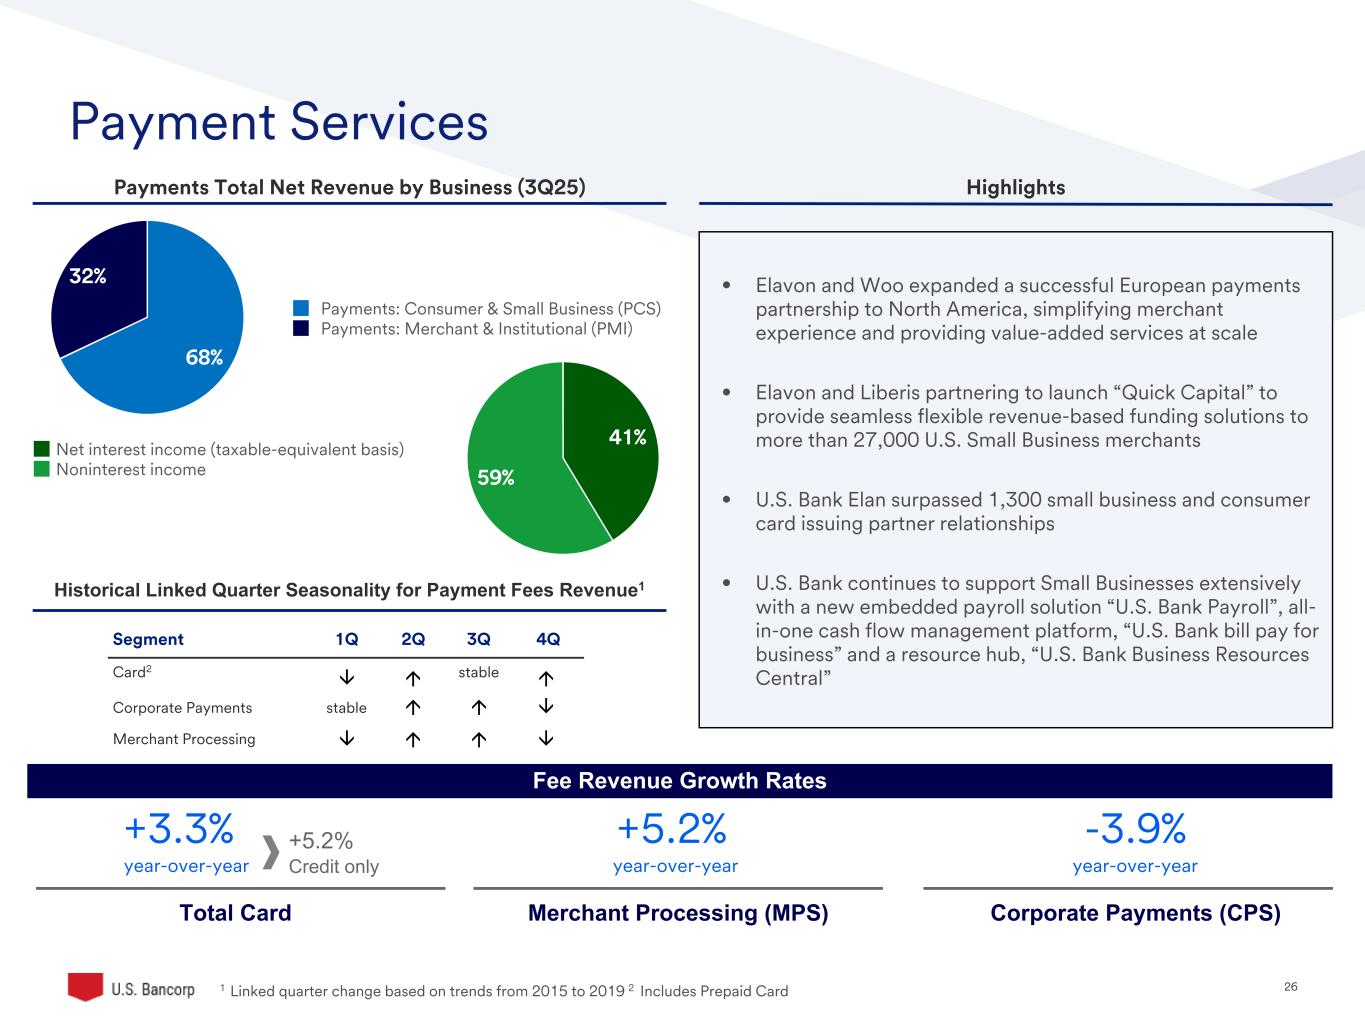
26©2025 U.S. Bank | Confidential • Elavon and Woo expanded a successful European payments partnership to North America, simplifying merchant experience and providing value-added services at scale • Elavon and Liberis partnering to launch “Quick Capital” to provide seamless flexible revenue-based funding solutions to more than 27,000 U.S. Small Business merchants • U.S. Bank Elan surpassed 1,300 small business and consumer card issuing partner relationships • U.S. Bank continues to support Small Businesses extensively with a new embedded payroll solution “U.S. Bank Payroll”, all- in-one cash flow management platform, “U.S. Bank bill pay for business” and a resource hub, “U.S. Bank Business Resources Central” Segment 1Q 2Q 3Q 4Q Card2 stable Corporate Payments stable Merchant Processing Merchant Processing (MPS) Corporate Payments (CPS)Total Card Payments Total Net Revenue by Business (3Q25) Highlights Historical Linked Quarter Seasonality for Payment Fees Revenue1 â â â á á á á á á â +3.3% year-over-year +5.2% year-over-year -3.9% year-over-year Payment Services +5.2% Credit only Fee Revenue Growth Rates 1 Linked quarter change based on trends from 2015 to 2019 2 Includes Prepaid Card 68% 32% Payments: Consumer & Small Business (PCS) Payments: Merchant & Institutional (PMI) 41% 59% Net interest income (taxable-equivalent basis) Noninterest income
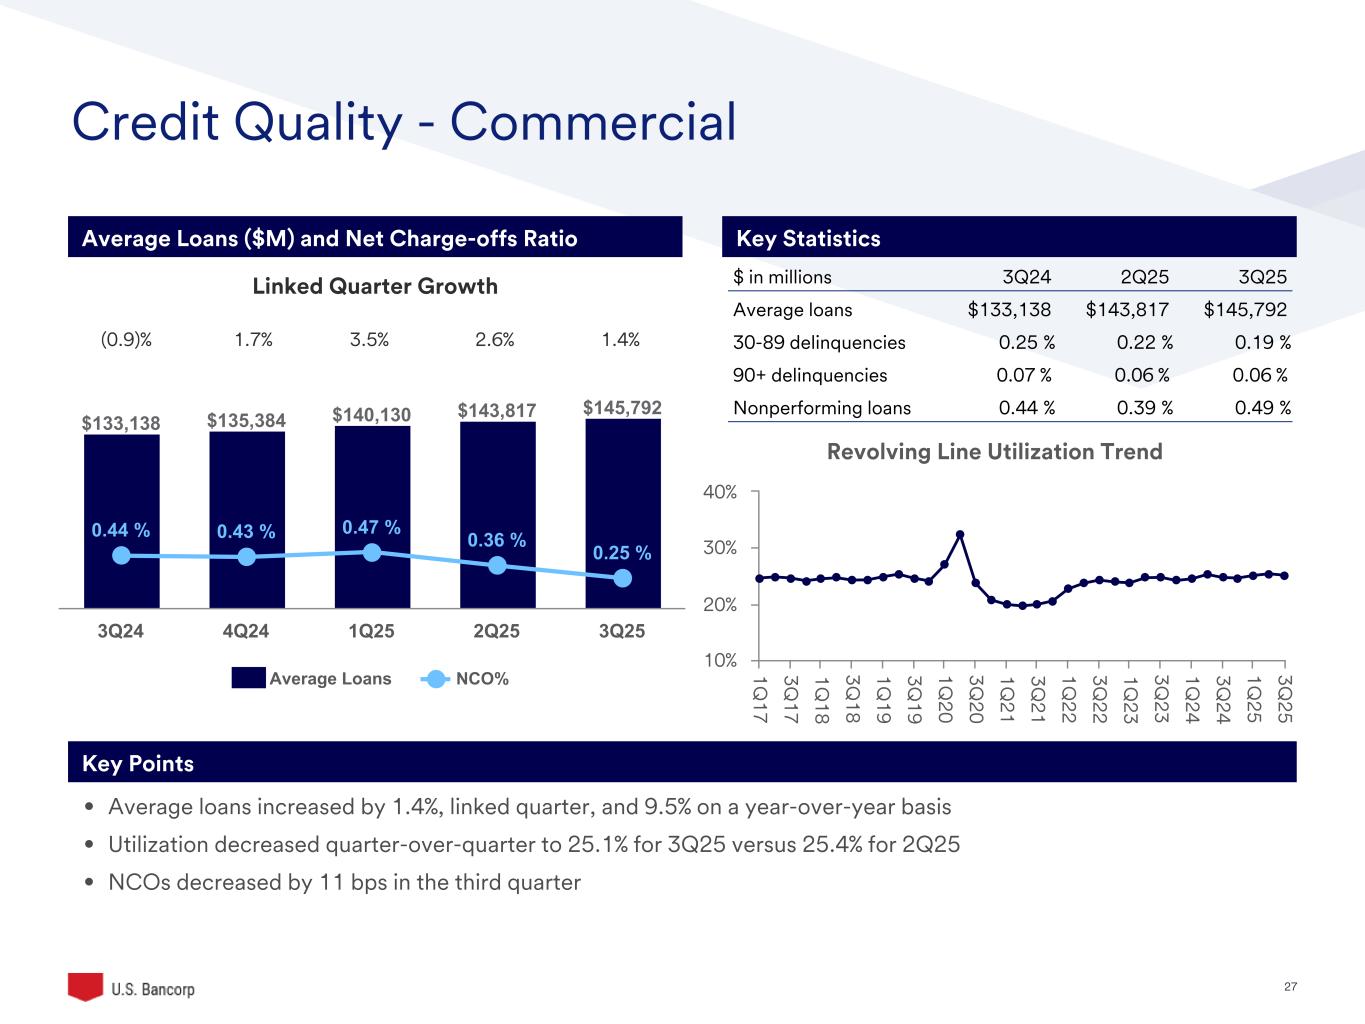
27©2025 U.S. Bank | Confidential Credit Quality - Commercial $133,138 $135,384 $140,130 $143,817 $145,792 0.44 % 0.43 % 0.47 % 0.36 % 0.25 % Average Loans NCO% 3Q24 4Q24 1Q25 2Q25 3Q25 Key StatisticsAverage Loans ($M) and Net Charge-offs Ratio (0.9)% 1.7% 3.5% 2.6% 1.4% Linked Quarter Growth Key Points • Average loans increased by 1.4%, linked quarter, and 9.5% on a year-over-year basis • Utilization decreased quarter-over-quarter to 25.1% for 3Q25 versus 25.4% for 2Q25 • NCOs decreased by 11 bps in the third quarter $ in millions 3Q24 2Q25 3Q25 Average loans $133,138 $143,817 $145,792 30-89 delinquencies 0.25 % 0.22 % 0.19 % 90+ delinquencies 0.07 % 0.06 % 0.06 % Nonperforming loans 0.44 % 0.39 % 0.49 % Revolving Line Utilization Trend 1Q 17 3Q 17 1Q 18 3Q 18 1Q 19 3Q 19 1Q 20 3Q 20 1Q 21 3Q 21 1Q 22 3Q 22 1Q 23 3Q 23 1Q 24 3Q 24 1Q 25 3Q 25 10% 20% 30% 40%

28©2025 U.S. Bank | Confidential CRE by Loan Type Mortgage 58% Owner Occupied 21% Construction 21% Credit Quality – Commercial Real Estate Key Points Average Loans ($M) and Net Charge-offs Ratio Key Statistics Linked Quarter Growth (1.6)% (3.1)% (2.0)% (0.9)% (0.5)% • Average loans decreased by 0.5% on a linked quarter basis • 30-89 and 90+ delinquencies improved on a linked quarter basis • NCOs and non-performing loans continued to be driven by the Office portfolio $51,454 $49,871 $48,890 $48,466 $48,246 0.54 % 0.30 % (0.03) % 0.47 % 0.85 % Average Loans NCO% 3Q24 4Q24 1Q25 2Q25 3Q25 CRE by Property Class SFR Construction 8% Owner Occupied 21% Multi-Family 37% Office 10% Industrial 10% Other 14% $ in millions 3Q24 2Q25 3Q25 Average loans $51,454 $48,466 $48,246 30-89 delinquencies 0.16 % 0.23 % 0.16 % 90+ delinquencies 0.02 % 0.28 % 0.04 % Nonperforming loans 1.83 % 1.58 % 1.20 % 1 1 SFR = Single Family Residential

29©2025 U.S. Bank | Confidential Credit Quality - Residential Mortgage $117,559 $118,406 $118,844 $115,616 $114,780 (0.01) % (0.01) % 0.00 % 0.00 % 0.00 % Average Loans NCO% 3Q24 4Q24 1Q25 2Q25 3Q25 Key Points • Average loans decreased by 0.7% on a linked quarter basis; Year-over-year decline driven by 2Q25 loan sale • Continued low losses and nonperforming loans supported by strong portfolio credit quality and collateral values • Originations continued to reflect high credit quality (weighted average credit score of 772, weighted average LTV of 69%) Linked Quarter Growth Average Loans ($M) and Net Charge-offs Ratio Key Statistics $ in millions 3Q24 2Q25 3Q25 Average loans $117,559 $115,616 $114,780 30-89 delinquencies 0.14 % 0.15 % 0.14 % 90+ delinquencies 0.15 % 0.28 % 0.26 % Nonperforming loans 0.13 % 0.13 % 0.12 % 0.9% 0.7% 0.4% (2.7)% (0.7)% Residential Mortgage Delinquencies ($M) 30-89 days past due 90+ days past due 2Q22 3Q22 4Q22 1Q23 2Q23 3Q23 4Q23 1Q24 2Q24 3Q24 4Q24 1Q25 2Q25 3Q25 $— $200 $400 $600 $800 $1,000

30©2025 U.S. Bank | Confidential Credit Quality - Credit Card $28,994 $29,438 $29,404 $29,588 $30,241 4.10 % 4.28 % 4.48 % 4.30 % 3.73 % Average Loans NCO% 3Q24 4Q24 1Q25 2Q25 3Q25 Key Points • Average loans increased by 2.2%, linked quarter, and 4.3% on a year-over-year basis • Net charge-off rate decreased to 3.73% consistent with seasonal patterns • 30-89 and 90+ day delinquency rates decreased from prior year Average Loans ($M) and Net Charge-offs Ratio Key Statistics 2.3% 1.5% (0.1)% 0.6% 2.2% Linked Quarter Growth $ in millions 3Q24 2Q25 3Q25 Average loans $28,994 $29,588 $30,241 30-89 delinquencies 1.47 % 1.24 % 1.34 % 90+ delinquencies 1.36 % 1.24 % 1.26 % Nonperforming loans — % — % — % Credit Card Delinquencies ($M) 30-89 days past due 90+ days past due 2Q22 3Q22 4Q22 1Q23 2Q23 3Q23 4Q23 1Q24 2Q24 3Q24 4Q24 1Q25 2Q25 3Q25 $— $200 $400 $600 $800 $1,000

31©2025 U.S. Bank | Confidential Credit Quality - Other Retail Key Points • Third quarter balance growth rates impacted by 2Q25 auto portfolio sale • Nonperforming loans ratio increased slightly quarter-over-quarter • Net charge-off ratio increased 5 bps on a linked quarter basis Average Loans ($M) and Net Charge-offs Ratio Key Statistics Linked Quarter Growth (0.7)% (0.9)% (1.9)% (1.7)% (2.3)% $42,925 $42,556 $41,760 $41,042 $40,093 0.47 % 0.59 % 0.61 % 0.52 % 0.57 % Average Loans NCO% 3Q24 4Q24 1Q25 2Q25 3Q25 Auto Loans 10% Installment 36% Home Equity 35% Retail Leasing 9% Revolving Credit 10% $ in millions 3Q24 2Q25 3Q25 Average loans $42,925 $41,042 $40,093 30-89 delinquencies 0.52 % 0.43 % 0.44 % 90+ delinquencies 0.14 % 0.13 % 0.13 % Nonperforming loans 0.34 % 0.38 % 0.39 %
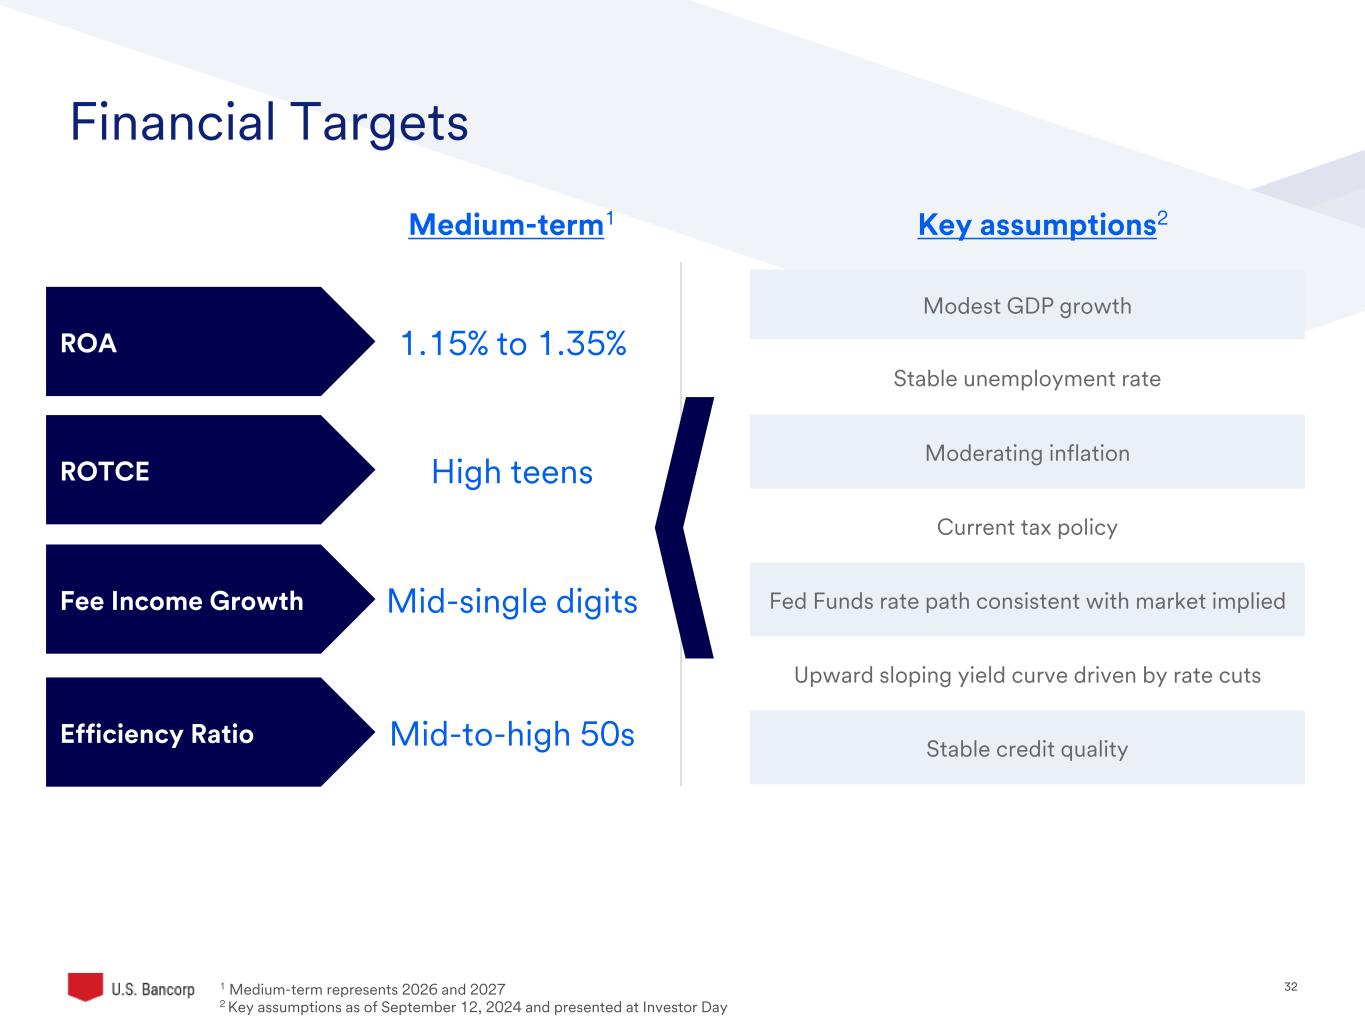
32©2025 U.S. Bank | Confidential Financial Targets ROA ROTCE Fee Income Growth Efficiency Ratio 1.15% to 1.35% High teens Mid-single digits Mid-to-high 50s Medium-term1 Key assumptions2 Modest GDP growth Stable unemployment rate Moderating inflation Current tax policy Fed Funds rate path consistent with market implied Upward sloping yield curve driven by rate cuts Stable credit quality 1 Medium-term represents 2026 and 2027 2 Key assumptions as of September 12, 2024 and presented at Investor Day
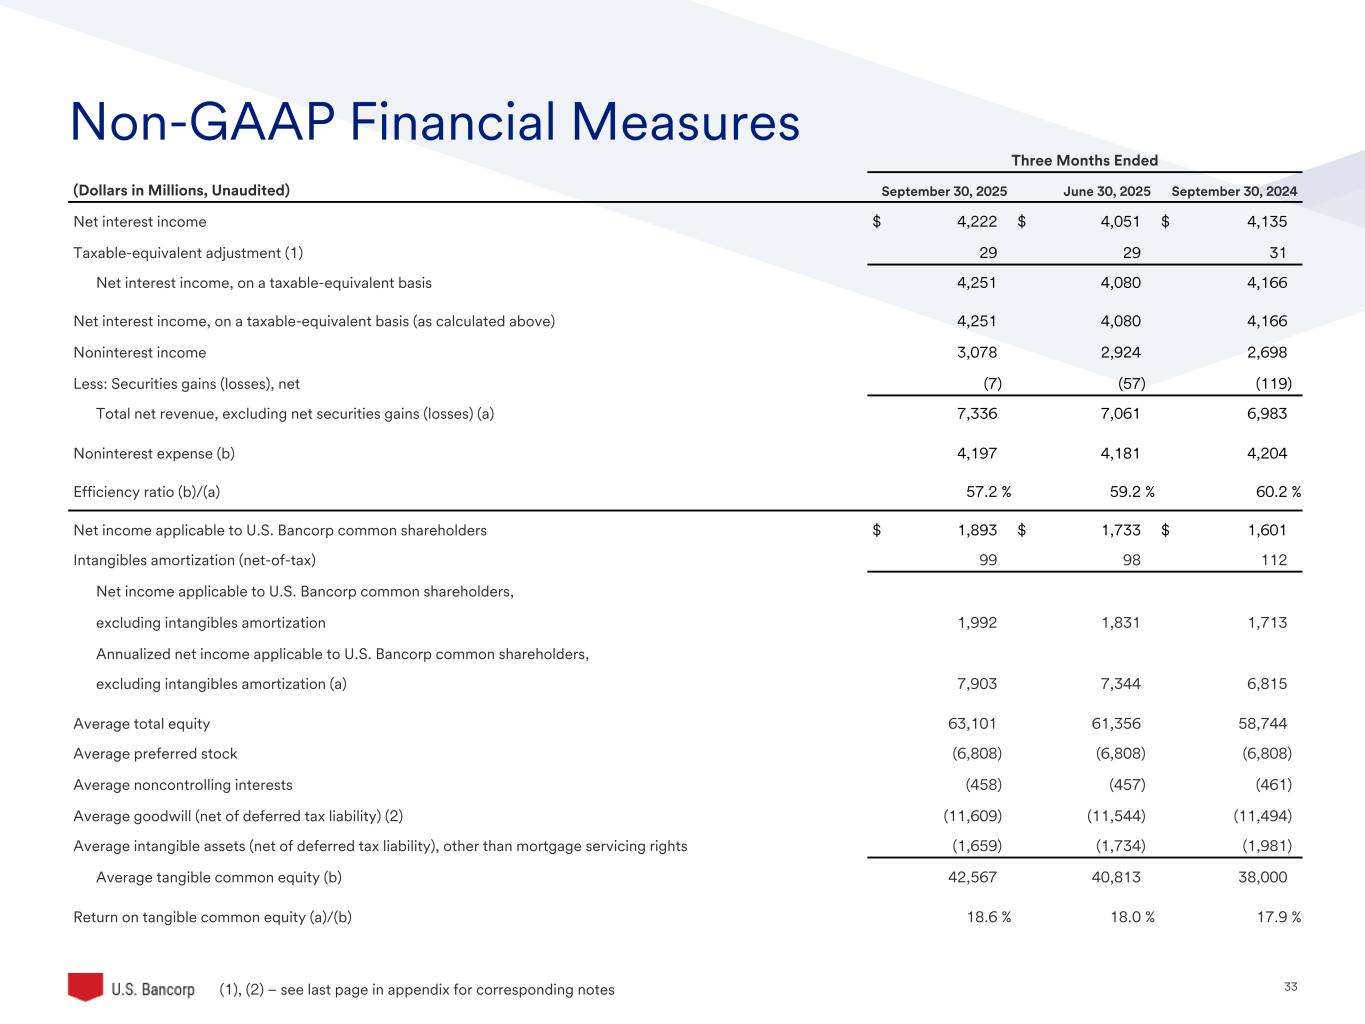
33©2025 U.S. Bank | Confidential Non-GAAP Financial Measures Three Months Ended (Dollars in Millions, Unaudited) September 30, 2025 June 30, 2025 September 30, 2024 Net interest income $ 4,222 $ 4,051 $ 4,135 Taxable-equivalent adjustment (1) 29 29 31 Net interest income, on a taxable-equivalent basis 4,251 4,080 4,166 Net interest income, on a taxable-equivalent basis (as calculated above) 4,251 4,080 4,166 Noninterest income 3,078 2,924 2,698 Less: Securities gains (losses), net (7) (57) (119) Total net revenue, excluding net securities gains (losses) (a) 7,336 7,061 6,983 Noninterest expense (b) 4,197 4,181 4,204 Efficiency ratio (b)/(a) 57.2 % 59.2 % 60.2 % Net income applicable to U.S. Bancorp common shareholders $ 1,893 $ 1,733 $ 1,601 Intangibles amortization (net-of-tax) 99 98 112 Net income applicable to U.S. Bancorp common shareholders, excluding intangibles amortization 1,992 1,831 1,713 Annualized net income applicable to U.S. Bancorp common shareholders, excluding intangibles amortization (a) 7,903 7,344 6,815 Average total equity 63,101 61,356 58,744 Average preferred stock (6,808) (6,808) (6,808) Average noncontrolling interests (458) (457) (461) Average goodwill (net of deferred tax liability) (2) (11,609) (11,544) (11,494) Average intangible assets (net of deferred tax liability), other than mortgage servicing rights (1,659) (1,734) (1,981) Average tangible common equity (b) 42,567 40,813 38,000 Return on tangible common equity (a)/(b) 18.6 % 18.0 % 17.9 % (1), (2) – see last page in appendix for corresponding notes
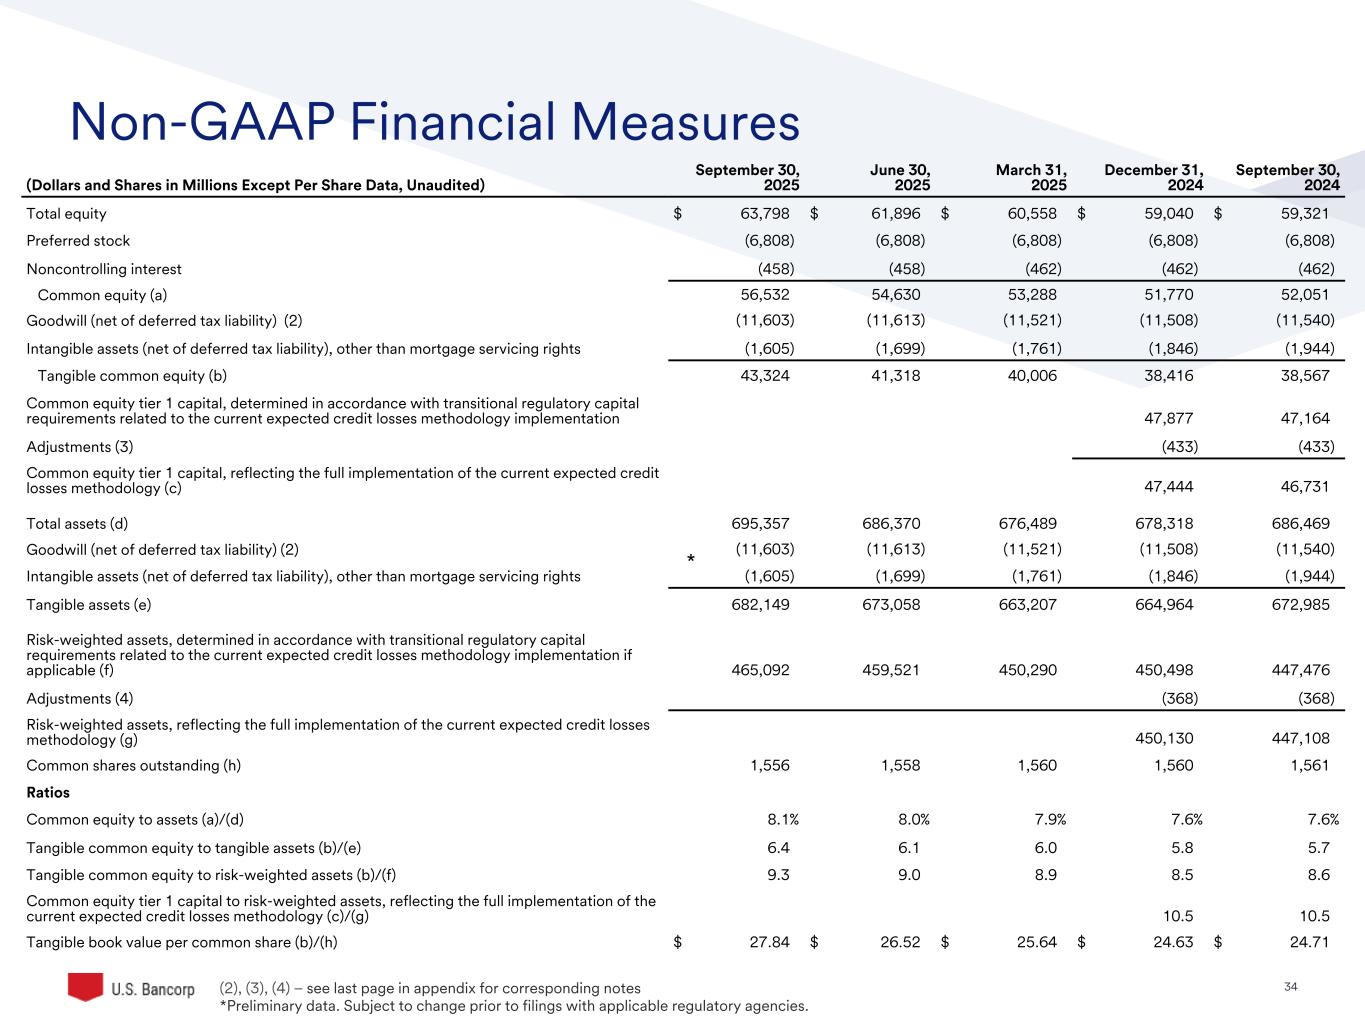
34©2025 U.S. Bank | Confidential Non-GAAP Financial Measures (Dollars and Shares in Millions Except Per Share Data, Unaudited) September 30, 2025 June 30, 2025 March 31, 2025 December 31, 2024 September 30, 2024 Total equity $ 63,798 $ 61,896 $ 60,558 $ 59,040 $ 59,321 Preferred stock (6,808) (6,808) (6,808) (6,808) (6,808) Noncontrolling interest (458) (458) (462) (462) (462) Common equity (a) 56,532 54,630 53,288 51,770 52,051 Goodwill (net of deferred tax liability) (2) (11,603) (11,613) (11,521) (11,508) (11,540) Intangible assets (net of deferred tax liability), other than mortgage servicing rights (1,605) (1,699) (1,761) (1,846) (1,944) Tangible common equity (b) 43,324 41,318 40,006 38,416 38,567 Common equity tier 1 capital, determined in accordance with transitional regulatory capital requirements related to the current expected credit losses methodology implementation 47,877 47,164 Adjustments (3) (433) (433) Common equity tier 1 capital, reflecting the full implementation of the current expected credit losses methodology (c) 47,444 46,731 Total assets (d) 695,357 686,370 676,489 678,318 686,469 Goodwill (net of deferred tax liability) (2) (11,603) (11,613) (11,521) (11,508) (11,540) Intangible assets (net of deferred tax liability), other than mortgage servicing rights (1,605) (1,699) (1,761) (1,846) (1,944) Tangible assets (e) 682,149 673,058 663,207 664,964 672,985 Risk-weighted assets, determined in accordance with transitional regulatory capital requirements related to the current expected credit losses methodology implementation if applicable (f) 465,092 459,521 450,290 450,498 447,476 Adjustments (4) (368) (368) Risk-weighted assets, reflecting the full implementation of the current expected credit losses methodology (g) 450,130 447,108 Common shares outstanding (h) 1,556 1,558 1,560 1,560 1,561 Ratios Common equity to assets (a)/(d) 8.1% 8.0% 7.9% 7.6% 7.6% Tangible common equity to tangible assets (b)/(e) 6.4 6.1 6.0 5.8 5.7 Tangible common equity to risk-weighted assets (b)/(f) 9.3 9.0 8.9 8.5 8.6 Common equity tier 1 capital to risk-weighted assets, reflecting the full implementation of the current expected credit losses methodology (c)/(g) 10.5 10.5 Tangible book value per common share (b)/(h) $ 27.84 $ 26.52 $ 25.64 $ 24.63 $ 24.71 * (2), (3), (4) – see last page in appendix for corresponding notes *Preliminary data. Subject to change prior to filings with applicable regulatory agencies.

35©2025 U.S. Bank | Confidential Non-GAAP Financial Measures (Dollars in Millions, Unaudited) September 30, 2025 June 30, 2025 March 31, 2025 December 31, 2024 September 30, 2024 March 31, 2023 Common equity tier 1 capital, determined in accordance with transitional regulatory capital requirements related to the current expected credit losses methodology implementation (a) 50,602 49,382 48,482 47,877 47,164 42,027 Accumulated Other Comprehensive Income (AOCI) related adjustments (5) (7,638) (8,458) (8,737) (9,198) (8,648) (10,153) Common equity tier 1 capital, including AOCI related adjustments (5) (b) 42,964 40,924 39,745 38,679 38,516 31,874 Risk-weighted assets, determined in accordance with transitional regulatory capital requirements related to the current expected credit losses methodology implementation (c) 465,092 459,521 450,290 450,498 447,476 494,048 Ratios Common equity tier 1 capital ratio (a)/(c) 10.9 % 10.7 % 10.8 % 10.6 % 10.5 % 8.5 % Common equity tier 1 capital ratio, including AOCI related adjustments (5) (b)/(c) 9.2 8.9 8.8 8.6 8.6 6.5 (5) – se last page in appendix for corresponding notes

36©2025 U.S. Bank | Confidential Non-GAAP Financial Measures (1), (6) - see last page in appendix for corresponding notes Three Months Ended (Dollars in Millions, Unaudited) September 30, 2025 September 30, 2024 June 30, 2025 June 30, 2024 March 31, 2025 March 31, 2024 Net interest income $ 4,222 $ 4,135 $ 4,051 $ 4,023 $ 4,092 $ 3,985 Taxable-equivalent adjustment (1) 29 31 29 29 30 30 Net interest income, on a taxable-equivalent adjustment basis 4,251 4,166 4,080 4,052 4,122 4,015 Net interest income, on a taxable-equivalent basis (as calculated above) 4,251 4,166 4,080 4,052 4,122 4,015 Noninterest income 3,078 2,698 2,924 2,815 2,836 2,700 Total net revenue 7,329 6,864 7,004 6,867 6,958 6,715 Percentage change (a) 6.8 % 2.0 % 3.6 % Less: Securities gains (losses), net (7) (119) (57) (36) — 2 Total net revenue, excluding net securities gains (losses) (b) 7,336 6,983 7,061 6,903 6,958 6,713 Percent change (c) 5.1 % 2.3 % 3.6 % Noninterest expense (d) 4,197 4,204 4,181 4,214 4,232 4,459 Percentage change (e) (0.2) % (0.8) % (5.1) % Less: Notable items (6) — — — 26 — 265 Total noninterest expense, excluding notable items 4,197 4,204 4,181 4,188 4,232 4,194 Percentage change (f) (0.2) % (0.2) % 0.9 % Operating leverage (a) - (e) 7.0 % 2.8 % 8.7 % Operating leverage, excl. notable items and net securities losses (c) - (f) 5.3 % 2.5 % 2.7 % Efficiency ratio (d) / (b) 57.2 % 59.2 % 60.8 %
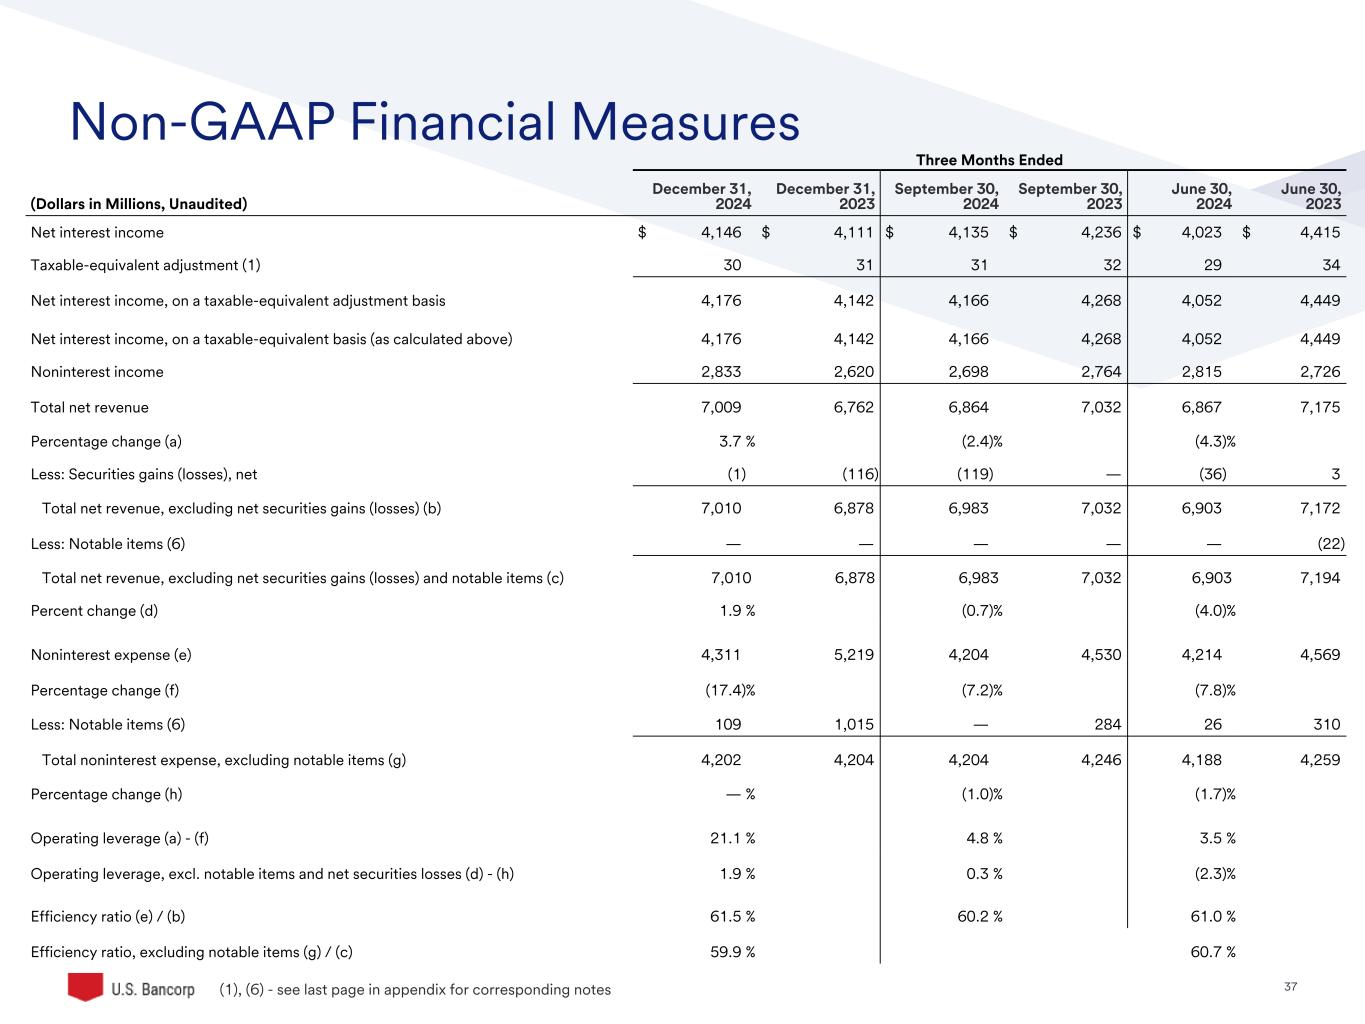
37©2025 U.S. Bank | Confidential Non-GAAP Financial Measures Three Months Ended (Dollars in Millions, Unaudited) December 31, 2024 December 31, 2023 September 30, 2024 September 30, 2023 June 30, 2024 June 30, 2023 Net interest income $ 4,146 $ 4,111 $ 4,135 $ 4,236 $ 4,023 $ 4,415 Taxable-equivalent adjustment (1) 30 31 31 32 29 34 Net interest income, on a taxable-equivalent adjustment basis 4,176 4,142 4,166 4,268 4,052 4,449 Net interest income, on a taxable-equivalent basis (as calculated above) 4,176 4,142 4,166 4,268 4,052 4,449 Noninterest income 2,833 2,620 2,698 2,764 2,815 2,726 Total net revenue 7,009 6,762 6,864 7,032 6,867 7,175 Percentage change (a) 3.7 % (2.4) % (4.3) % Less: Securities gains (losses), net (1) (116) (119) — (36) 3 Total net revenue, excluding net securities gains (losses) (b) 7,010 6,878 6,983 7,032 6,903 7,172 Less: Notable items (6) — — — — — (22) Total net revenue, excluding net securities gains (losses) and notable items (c) 7,010 6,878 6,983 7,032 6,903 7,194 Percent change (d) 1.9 % (0.7) % (4.0) % Noninterest expense (e) 4,311 5,219 4,204 4,530 4,214 4,569 Percentage change (f) (17.4) % (7.2) % (7.8) % Less: Notable items (6) 109 1,015 — 284 26 310 Total noninterest expense, excluding notable items (g) 4,202 4,204 4,204 4,246 4,188 4,259 Percentage change (h) — % (1.0) % (1.7) % Operating leverage (a) - (f) 21.1 % 4.8 % 3.5 % Operating leverage, excl. notable items and net securities losses (d) - (h) 1.9 % 0.3 % (2.3) % Efficiency ratio (e) / (b) 61.5 % 60.2 % 61.0 % Efficiency ratio, excluding notable items (g) / (c) 59.9 % 60.7 % (1), (6) - see last page in appendix for corresponding notes
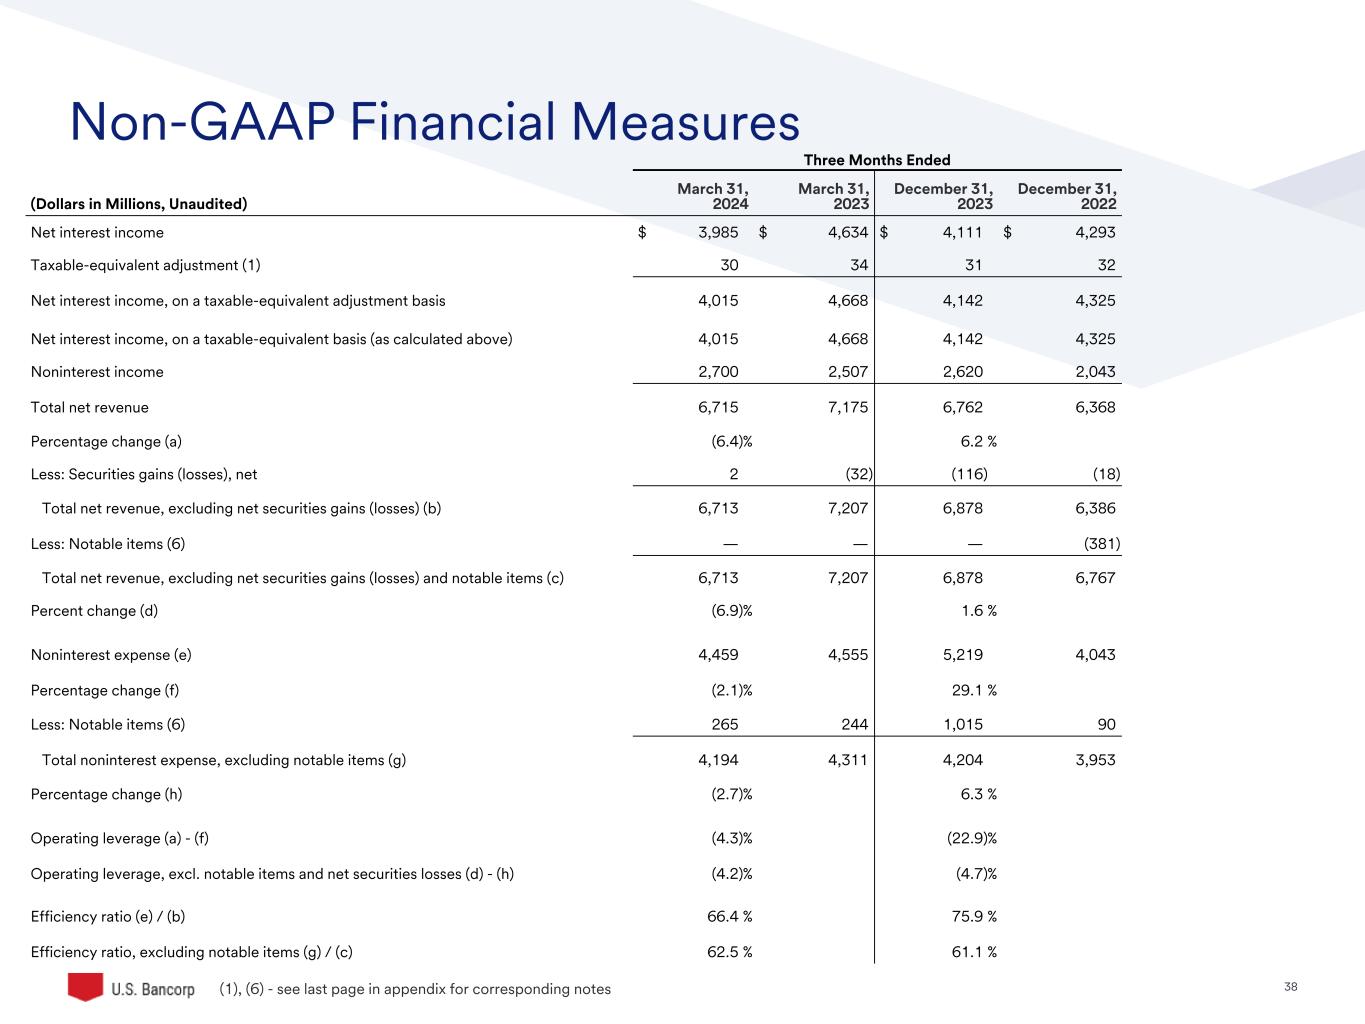
38©2025 U.S. Bank | Confidential Non-GAAP Financial Measures (1), (6) - see last page in appendix for corresponding notes Three Months Ended (Dollars in Millions, Unaudited) March 31, 2024 March 31, 2023 December 31, 2023 December 31, 2022 Net interest income $ 3,985 $ 4,634 $ 4,111 $ 4,293 Taxable-equivalent adjustment (1) 30 34 31 32 Net interest income, on a taxable-equivalent adjustment basis 4,015 4,668 4,142 4,325 Net interest income, on a taxable-equivalent basis (as calculated above) 4,015 4,668 4,142 4,325 Noninterest income 2,700 2,507 2,620 2,043 Total net revenue 6,715 7,175 6,762 6,368 Percentage change (a) (6.4) % 6.2 % Less: Securities gains (losses), net 2 (32) (116) (18) Total net revenue, excluding net securities gains (losses) (b) 6,713 7,207 6,878 6,386 Less: Notable items (6) — — — (381) Total net revenue, excluding net securities gains (losses) and notable items (c) 6,713 7,207 6,878 6,767 Percent change (d) (6.9) % 1.6 % Noninterest expense (e) 4,459 4,555 5,219 4,043 Percentage change (f) (2.1) % 29.1 % Less: Notable items (6) 265 244 1,015 90 Total noninterest expense, excluding notable items (g) 4,194 4,311 4,204 3,953 Percentage change (h) (2.7) % 6.3 % Operating leverage (a) - (f) (4.3) % (22.9) % Operating leverage, excl. notable items and net securities losses (d) - (h) (4.2) % (4.7) % Efficiency ratio (e) / (b) 66.4 % 75.9 % Efficiency ratio, excluding notable items (g) / (c) 62.5 % 61.1 %

39©2025 U.S. Bank | Confidential Non-GAAP Financial Measures Three Months Ended (Dollars in Millions, Unaudited) September 30, 2025 September 30, 2024 June 30, 2025 June 30, 2024 March 31, 2025 March 31, 2024 Noninterest income $ 3,078 $ 2,698 $ 2,924 $ 2,815 $ 2,836 $ 2,700 Less: Securities gains (losses), net (7) (119) (57) (36) — 2 Total noninterest income, excluding net securities gains (losses) 3,085 2,817 2,981 2,851 2,836 2,698 Percent change 9.5 % 4.6 % 5.1 % (6) - se last page in appendix for corresponding notes Three Months Ended (Dollars in Millions, Unaudited) December 31, 2024 December 31, 2023 September 30, 2024 September 30, 2023 Noninterest income $ 2,833 $ 2,620 $ 2,698 $ 2,764 Less: Securities gains (losses), net (1) 2 (119) — Less: Notable items (6) — (118) — — Total noninterest income, excluding net securities gains (losses) and notable items 2,834 2,736 2,817 2,764 Percent change 3.6 % 1.9 %
40©2025 U.S. Bank | Confidential Notes 1. Based on a federal income tax rate of 21 percent for those assets and liabilities whose income or expense is not included for federal income tax purposes. 2. Includes goodwill related to certain investments in unconsolidated financial institutions per prescribed regulatory requirements. 3. Includes the estimated increase in the allowance for credit losses related to the adoption of the current expected credit losses methodology net of deferred taxes. 4. Includes the impact of the estimated increase in the allowance for credit losses related to the adoption of the current expected credit losses methodology. 5. Includes Accumulated Other Comprehensive Income (AOCI) related to available for sale securities, pension plans, and available for sale to held to maturity transfers. 6. Notable item for the three months ended December 31, 2024 of $109 million ($82 million net-of-tax) included lease impairments and operational efficiency actions. Notable items for the three months ended June 30, 2024 were a $26 million ($19 million net-of-tax) charge for the increase in FDIC special assessment. Notable items for the three months ended March 31, 2024 of $265 million ($199 million net-of-tax) included $155 million of merger and integration-related charges and a $110 million charge for the increase in the FDIC special assessment. Notable items for the three months ended December 31, 2023 of $1.1 billion ($780 million net-of-tax, including a $70 million discrete tax benefit) included $(118) million of noninterest income related to investment securities balance sheet repositioning and capital management actions, $171 million of merger and integration-related charges, $734 million of FDIC special assessment charges and a $110 million charitable contribution. Notable items for the three months ended September 30, 2023 included $284 million ($213 million net-of-tax) of merger and integration-related charges.
41©2025 U.S. Bank | Confidential 1. 2. 3. 4. 5. 6. Notable items for the three months ended June 30, 2023 of $575 million ($432 million net-of-tax) included $(22) million of noninterest income related to balance sheet repositioning and capital management actions, $310 million of merger and integration-related charges, and $243 million of provision for credit losses related to balance sheet repositioning and capital management actions. Notable items for the three months ended March 31, 2023 included $244 million ($183 million net-of-tax) of merger and integration-related charges. Notable items for the three months ended December 31, 2022 of $1.3 billion ($952 million net-of-tax) included $(399) million of noninterest income related to balance sheet repositioning and capital management actions, $90 million of merger and integration-related charges and $791 million of provision for credit losses related to the acquisition of Union Bank and balance sheet optimization activities. Notes

42©2025 U.S. Bank | Confidential Thank you