
Investor Presentation FEBRUARY 2026
Disclaimer 2 Forward - Looking Statements This presentation contains, and from time - to - time in connection with this presentation our management may make, forward - looking statements within the meaning of the Private Securities Litigation Reform Act of 1995. These forward - looking statements reflect our views at such time with r espect to, among other things, future events and our financial performance. These statements are often, but not always, made through the use of words or phrases s uch as “may,” “might,” “should,” “could,” “predict,” “potential,” “believe,” “expect,” “continue,” “will,” “anticipate,” “seek,” “estimate,” “intend,” “plan,” “p rojection,” “would,” “annualized,” and “outlook,” or the negative version of these words or other comparable words or phrases of a future or forward - looking nature. These forwar d - looking statements are not historical facts and are based on current expectations, estimates and projections about our industry, management’s beliefs an d c ertain assumptions made by management, and any such forward - looking statements are subject to risks, assumptions, estimates and uncertainties that are diff icult to predict. Actual results may prove to be materially different from the results expressed or implied by the forward - looking statements. Factors that could cause our actual results to differ materially from those described in the forward - looking statements, including (without limitation) the domestic and global econom ic environment and capital market conditions and other risk factors, can be found in our SEC filings, including, but not limited to, our most recent Form 10 - K and subsequent Quarterly Reports on Form 10 - Q, which are available on our website (www.fhb.com) and the SEC’s website (www.sec.gov). Any forward - looking statement s peaks only as of the date on which it is made, and we do not undertake any obligation to update or review any forward - looking statement, whether as a result of new information, future developments or otherwise, except as required by applicable law. Use of Non - GAAP Financial Measures The information provided herein includes certain non - GAAP financial measures. We believe that these measures provide useful inf ormation about our operating results and enhance the overall understanding of our past performance and future performance. Although these non - GAAP financial measures are frequently used by stakeholders in the evaluation of a company, they have limitations as analytical tools and should not be considered in iso lat ion or as a substitute for analysis of our results or financial condition as reported under GAAP. Investors should consider our performance and financial condition as reported under GAAP and all other relevant information when assessing our performance or financial condition. The reconciliation of such measures to the compa rab le GAAP figures are included in the appendix of this presentation. Other References to “we,” “us,” “our,” “FHI,” “FHB,” “Company,” and “First Hawaiian” refer to First Hawaiian, Inc. and its consolid ate d subsidiaries.
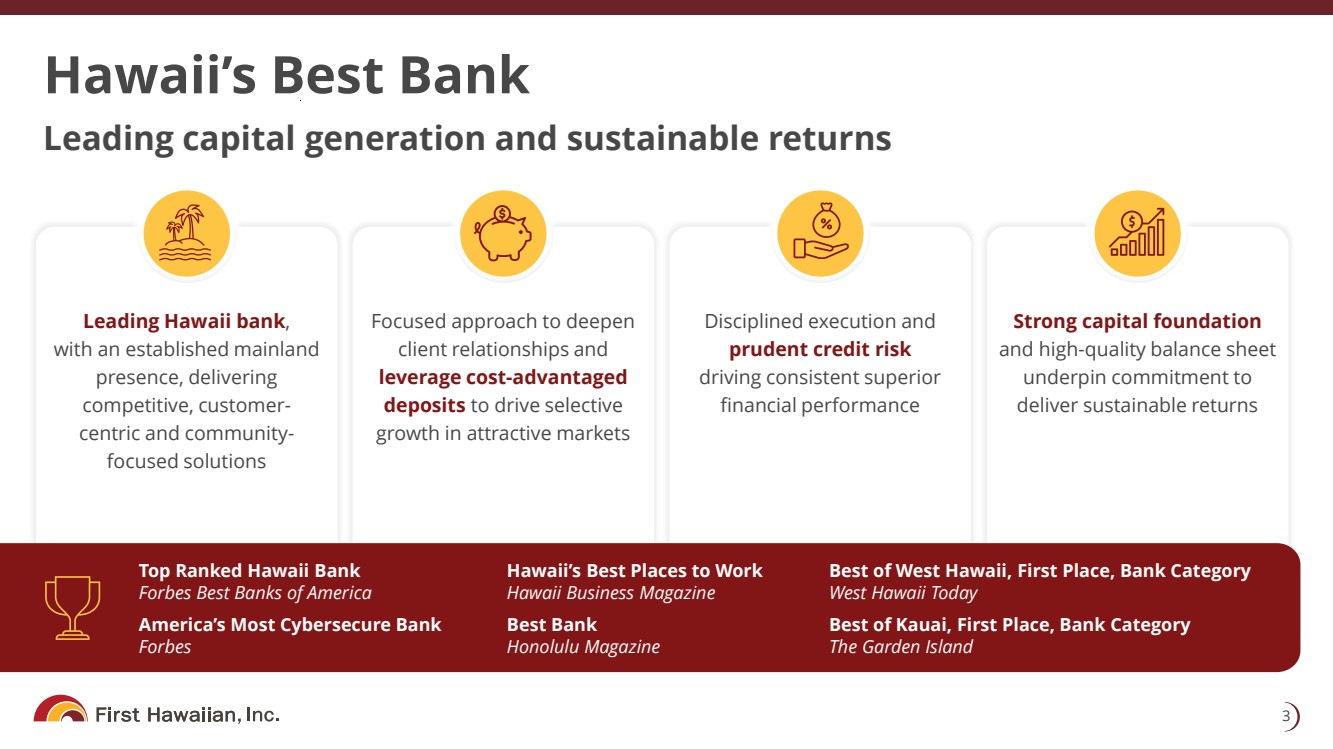
Hawaii’s Best Bank 3 Top Ranked Hawaii Bank Forbes Best Banks of America America’s Most Cybersecure Bank Forbes Leading capital generation and sustainable returns Hawaii’s Best Places to Work Hawaii Business Magazine Best Bank Honolulu Magazine Best of West Hawaii, First Place, Bank Category West Hawaii Today Best of Kauai, First Place, Bank Category The Garden Island Leading Hawaii bank , with an established mainland presence, delivering competitive, customer - centric and community - focused solutions Focused approach to deepen client relationships and leverage cost - advantaged deposits to drive selective growth in attractive markets Disciplined execution and prudent credit risk driving consistent superior financial performance Strong capital foundation and high - quality balance sheet underpin commitment to deliver sustainable returns
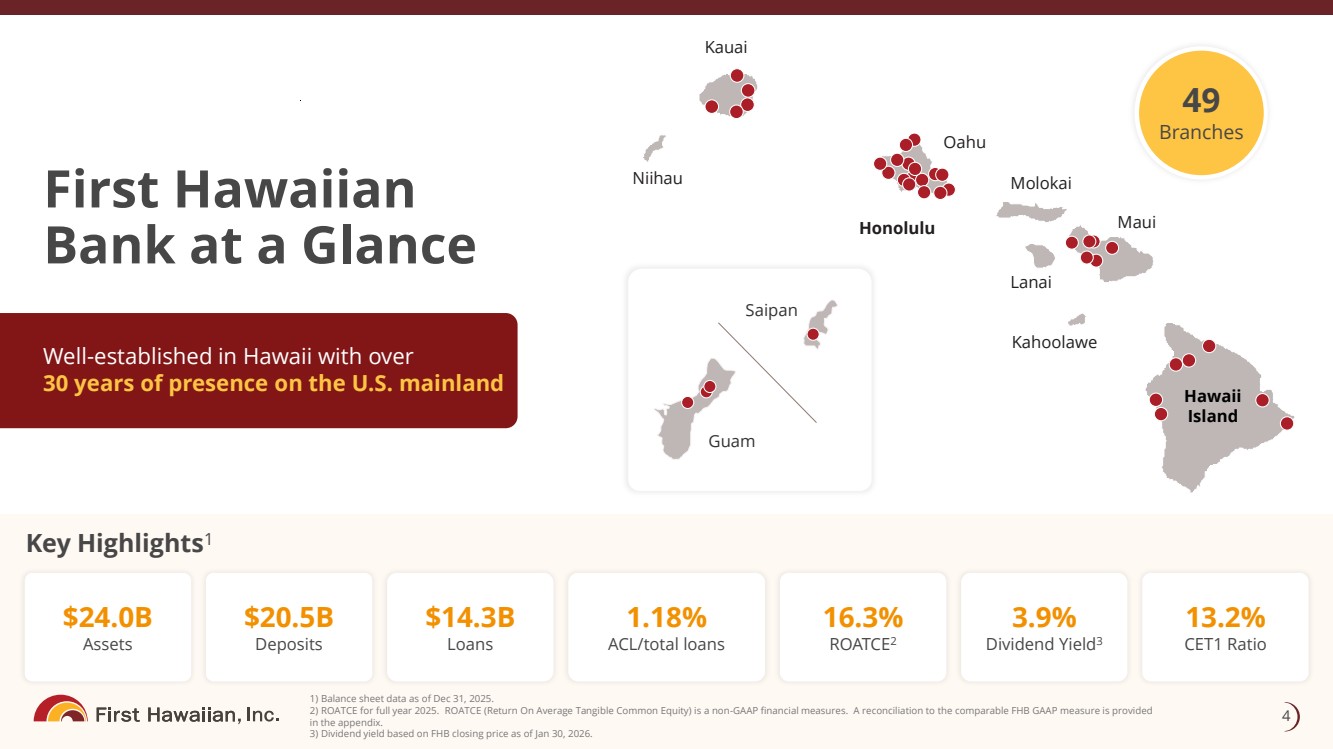
4 First Hawaiian Bank at a Glance 1) Balance sheet data as of Dec 31, 2025. 2) ROATCE for full year 2025. ROATCE (Return On Average Tangible Common Equity) is a non - GAAP financial measures. A reconcilia tion to the comparable FHB GAAP measure is provided in the appendix. 3) Dividend yield based on FHB closing price as of Jan 30, 2026. Guam Saipan Maui Kahoolawe Lanai Oahu Kauai Niihau Honolulu Molokai Hawaii Island $24.0B Assets $20.5B Deposits $14.3B Loans 1.18% ACL/total loans 16.3% ROATCE 2 3.9% Dividend Yield 3 13.2% CET1 Ratio Key Highlights 1 Well - established in Hawaii with over 30 years of presence on the U.S. mainland 49 Branches
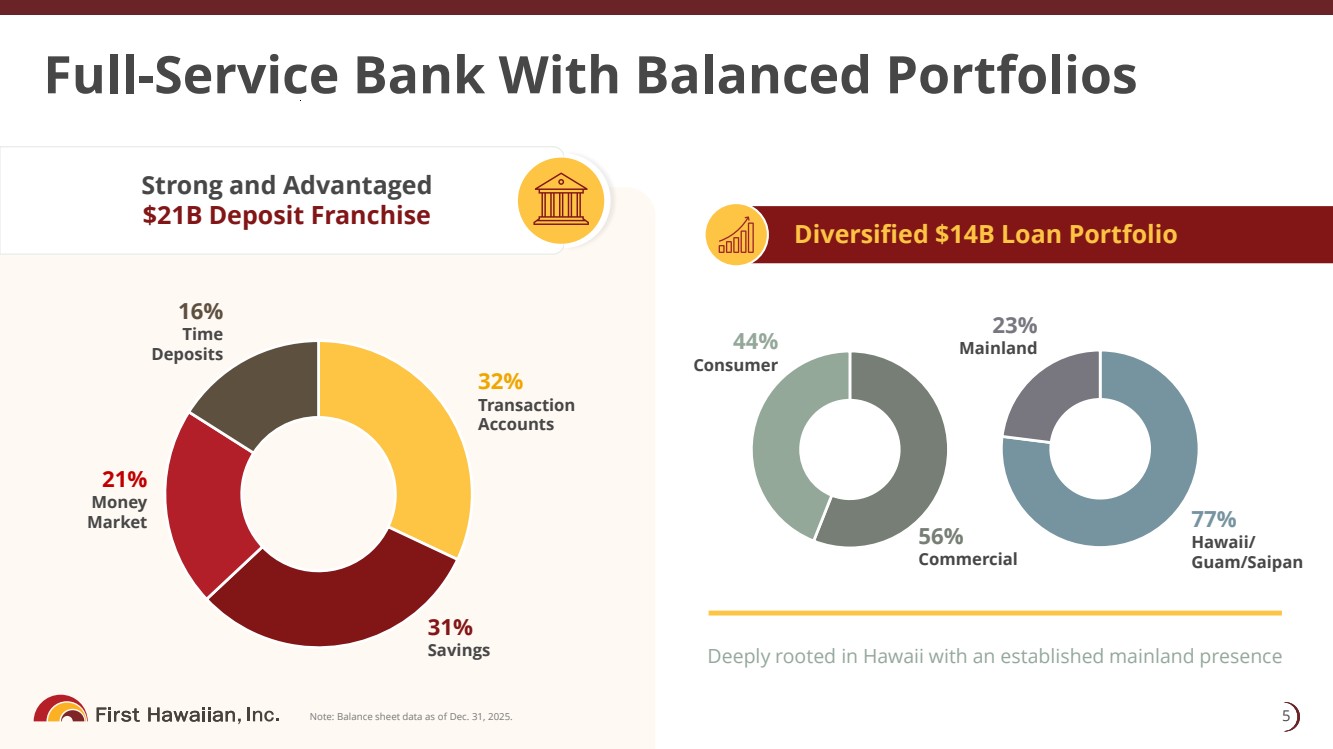
Deeply rooted in Hawaii with an established mainland presence Full - Service Bank With Balanced Portfolios 5 Note: Balance sheet data as of Dec. 31, 2025. Strong and Advantaged $21B Deposit Franchise 32% Transaction Accounts 31% Savings 16% Time Deposits 44% Consumer 56% Commercial 23% Mainland 77% Hawaii/ Guam/Saipan 21% Money Market Diversified $14B Loan Portfolio
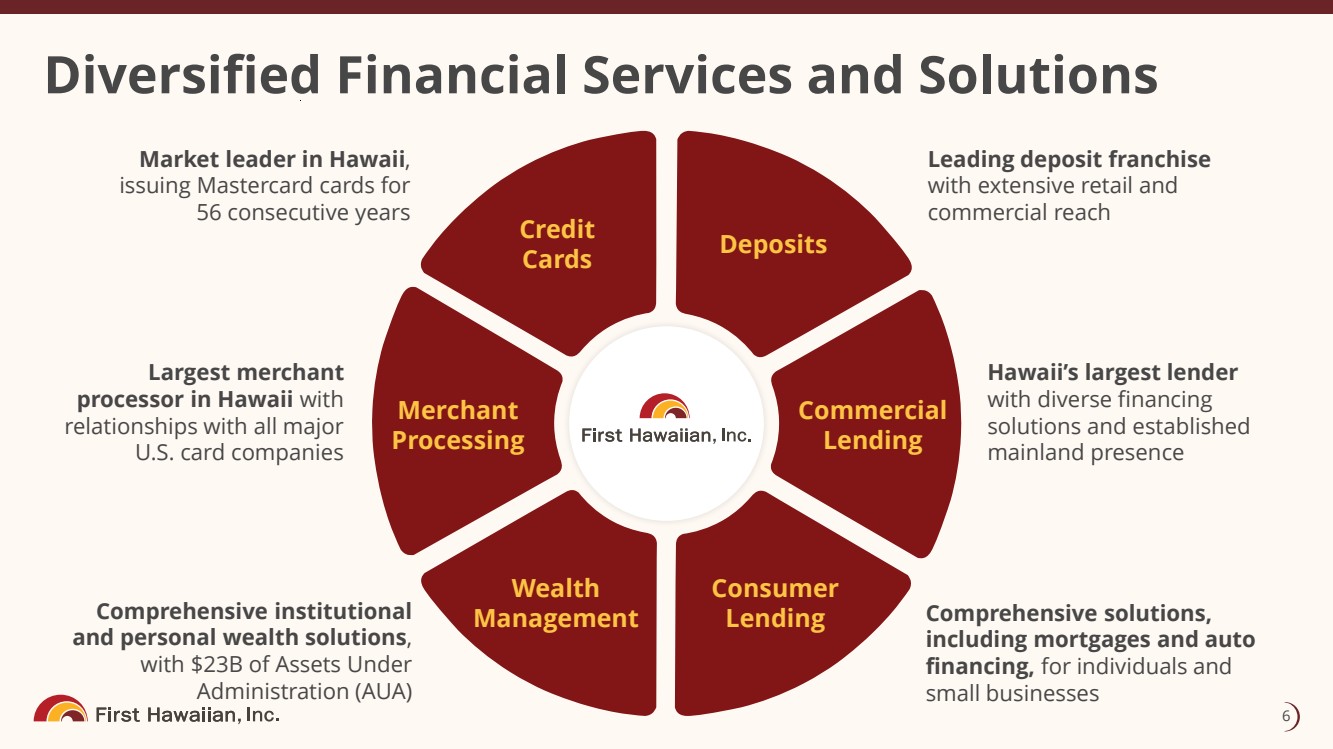
Diversified Financial Services and Solutions 6 Deposits Commercial Lending Consumer Lending Wealth Management Merchant Processing Credit Cards Leading deposit franchise with extensive retail and commercial reach Hawaii’s largest lender with diverse financing solutions and established mainland presence Comprehensive solutions, including mortgages and auto financing, for individuals and small businesses Comprehensive institutional and personal wealth solutions , with $23B of Assets Under Administration (AUA) Largest merchant processor in Hawaii with relationships with all major U.S. card companies Market leader in Hawaii , issuing Mastercard cards for 56 consecutive years
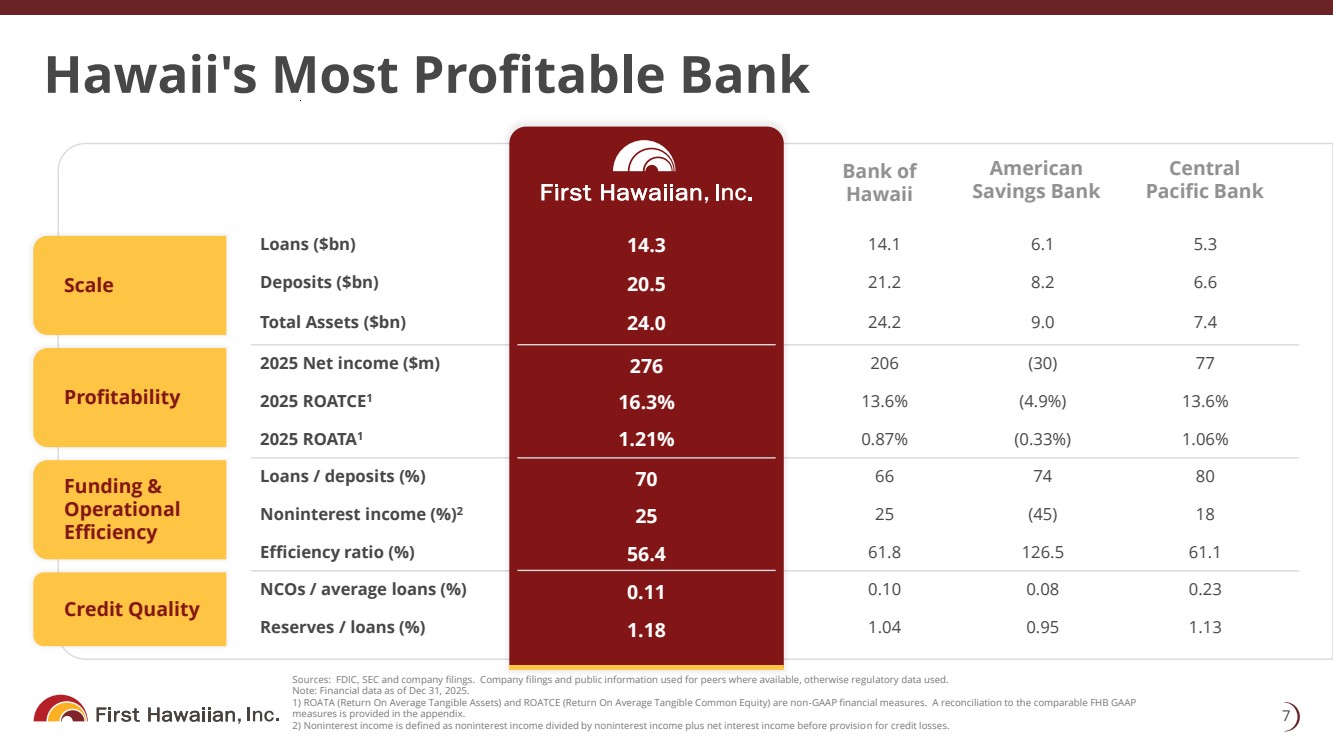
Hawaii's Most Profitable Bank 7 Sources: FDIC, SEC and company filings. Company filings and public information used for peers where available, otherwise regul atory data used. Note: Financial data as of Dec 31, 2025. 1) ROATA (Return On Average Tangible Assets) and ROATCE (Return On Average Tangible Common Equity) are non - GAAP financial measur es. A reconciliation to the comparable FHB GAAP measures is provided in the appendix. 2) Noninterest income is defined as noninterest income divided by noninterest income plus net interest income before provisio n f or credit losses. 5.3 6.1 14.1 14.4 Loans ($bn) 6.6 8.2 21.2 20.3 Deposits ($bn) 7.4 9.0 24.2 23.8 Total Assets ($bn) 77 (30) 206 230 2025 Net income ($m) 13.6% (4.9%) 13.6% 14.7% 2025 ROATCE 1 1.06% (0.33%) 0.87% 1.00% 2025 ROATA 1 80 74 66 xx Loans / deposits (%) 18 (45) 25 xx Noninterest income (%) 2 61.1 126.5 61.8 61.6 Efficiency ratio (%) 0.23 0.08 0.10 0.10 NCOs / average loans (%) 1.13 0.95 1.04 1.11 Reserves / loans (%) Bank of Hawaii American Savings Bank Central Pacific Bank Scale Profitability Funding & Operational Efficiency Credit Quality 14.3 20.5 24.0 276 16.3% 1.21% 70 25 56.4 0.11 1.18
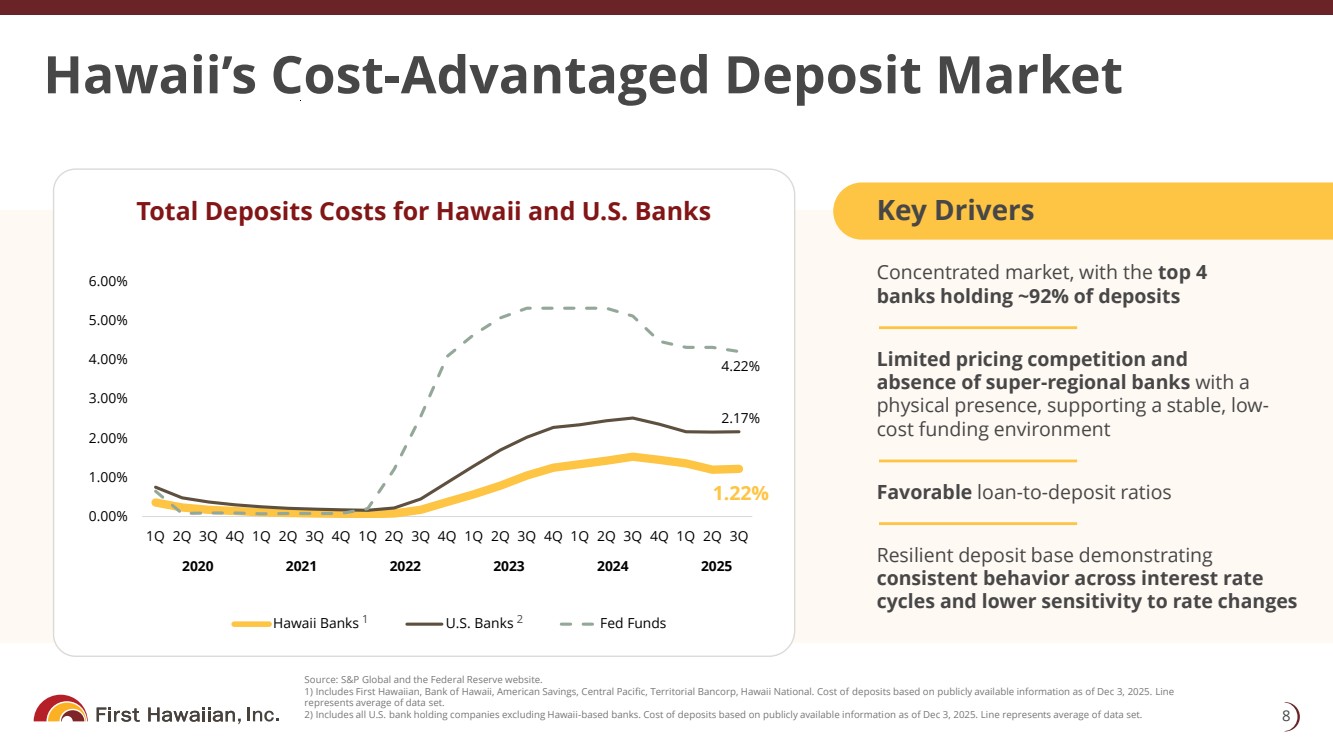
Hawaii’s Cost - Advantaged Deposit Market 8 Source: S&P Global and the Federal Reserve website. 1) Includes First Hawaiian, Bank of Hawaii, American Savings, Central Pacific, Territorial Bancorp, Hawaii National. Cost of dep osits based on publicly available information as of Dec 3, 2025. Line represents average of data set. 2) Includes all U.S. bank holding companies excluding Hawaii - based banks. Cost of deposits based on publicly available informati on as of Dec 3, 2025. Line represents average of data set. Total Deposits Costs for Hawaii and U.S. Banks Key Drivers Concentrated market, with the top 4 banks holding ~92% of deposits Limited pricing competition and absence of super - regional banks with a physical presence, supporting a stable, low - cost funding environment Favorable loan - to - deposit ratios Resilient deposit base demonstrating consistent behavior across interest rate cycles and lower sensitivity to rate changes 0.00% 1.00% 2.00% 3.00% 4.00% 5.00% 6.00% 1Q 2Q 3Q 4Q 1Q 2Q 3Q 4Q 1Q 2Q 3Q 4Q 1Q 2Q 3Q 4Q 1Q 2Q 3Q 4Q 1Q 2Q 3Q Hawaii Banks U.S. Banks Fed Funds 2020 2021 2022 2023 2024 2025 1 2 4.22% 2.17% 1.22%
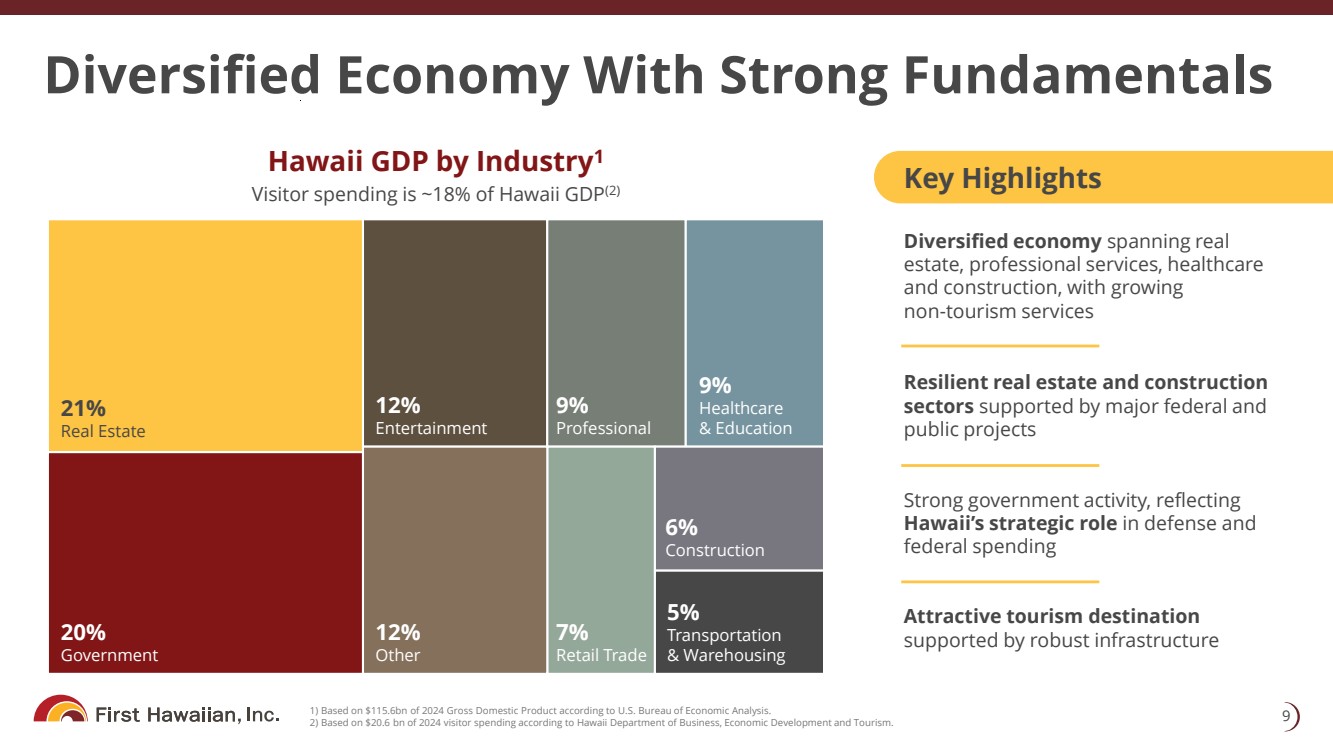
Diversified economy spanning real estate, professional services, healthcare and construction, with growing non - tourism services Resilient real estate and construction sectors supported by major federal and public projects Strong government activity, reflecting Hawaii’s strategic role in defense and federal spending Attractive tourism destination supported by robust infrastructure Diversified Economy With Strong Fundamentals 9 1) Based on $115.6bn of 2024 Gross Domestic Product according to U.S. Bureau of Economic Analysis. 2) Based on $20.6 bn of 2024 visitor spending according to Hawaii Department of Business, Economic Development and Tourism. Hawaii GDP by Industry 1 Key Highlights 21% Real Estate 12% Entertainment 9% Professional 9% Healthcare & Education 20% Government 12% Other 7% Retail Trade 6% Construction 5% Transportation & Warehousing Visitor spending is ~18% of Hawaii GDP (2)
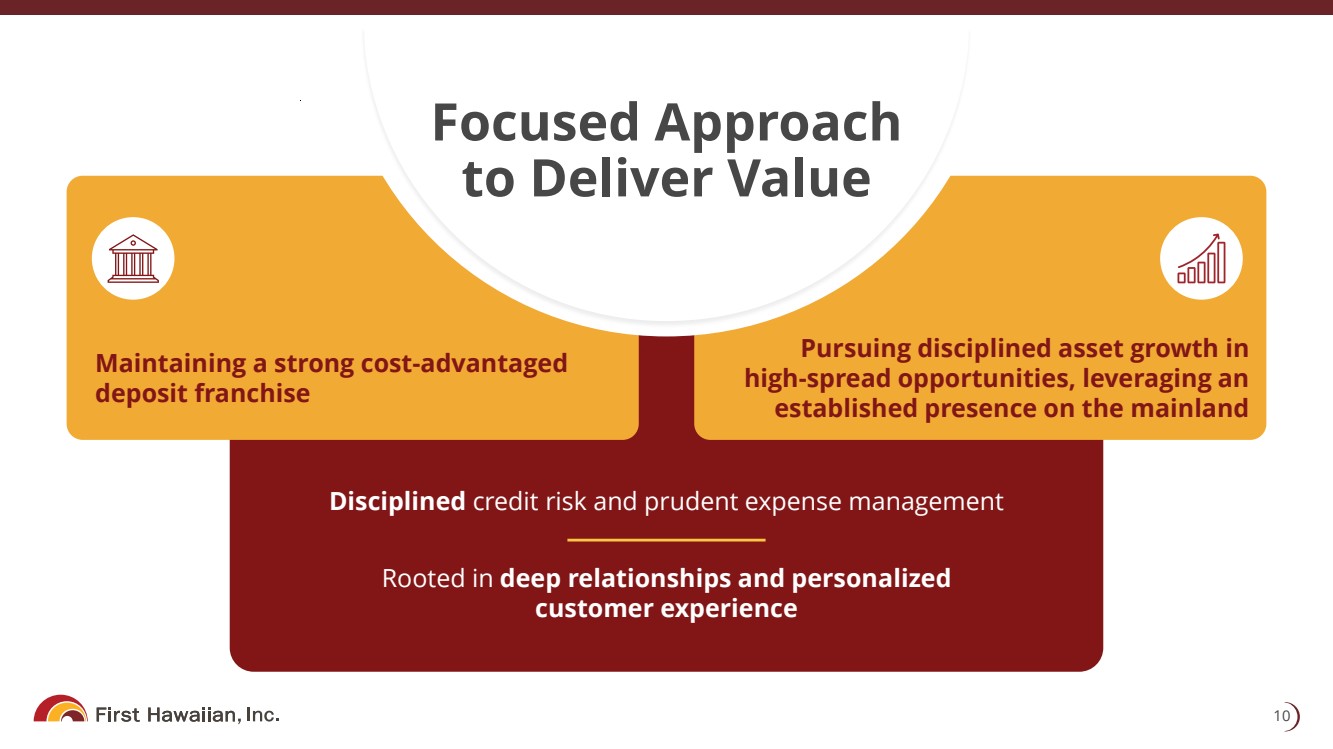
Maintaining a strong cost - advantaged deposit franchise Pursuing disciplined asset growth in high - spread opportunities, leveraging an established presence on the mainland 10 Focused Approach to Deliver Value Disciplined credit risk and prudent expense management Rooted in deep relationships and personalized customer experience
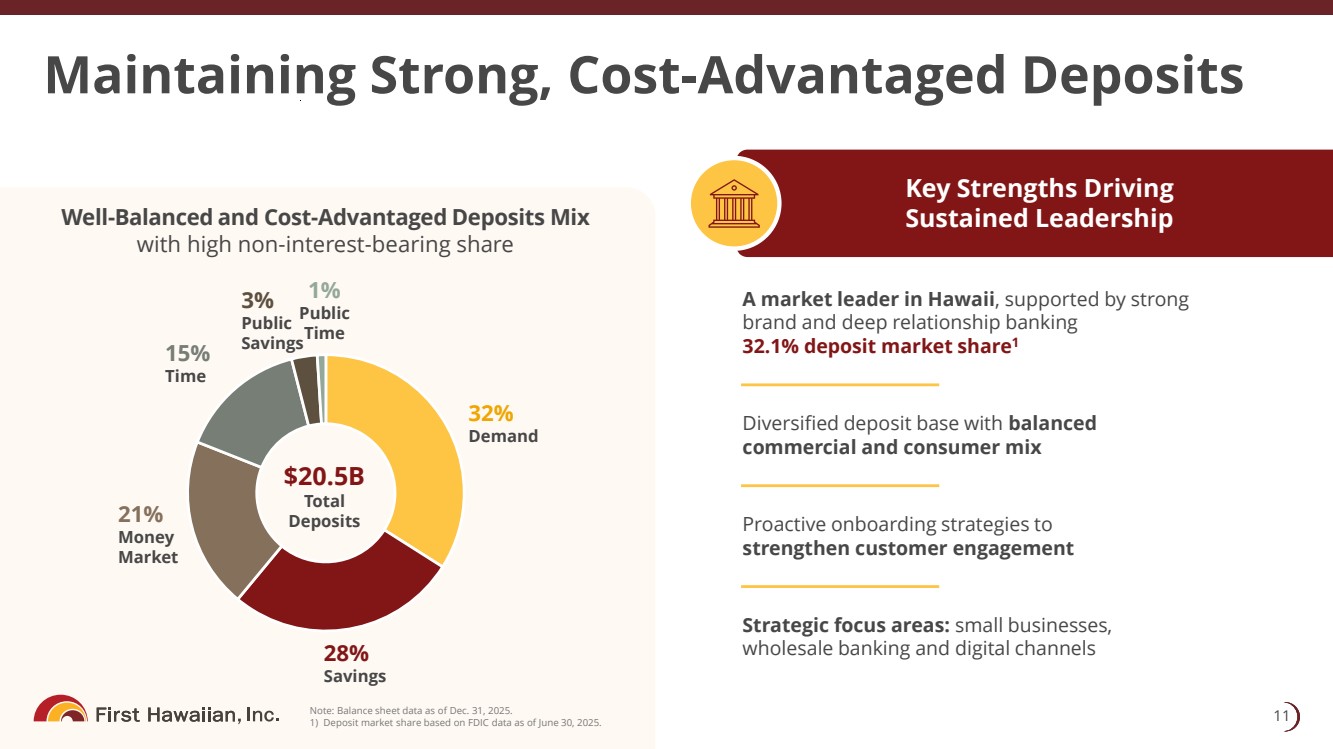
Well - Balanced and Cost - Advantaged Deposits Mix with high non - interest - bearing share Maintaining Strong, Cost - Advantaged Deposits 11 Note: Balance sheet data as of Dec. 31, 2025. 1) Deposit market share based on FDIC data as of June 30, 2025. $20.5B Total Deposits Key Strengths Driving Sustained Leadership A market leader in Hawaii , supported by strong brand and deep relationship banking 32.1% deposit market share 1 Diversified deposit base with balanced commercial and consumer mix Proactive onboarding strategies to strengthen customer engagement Strategic focus areas: small businesses, wholesale banking and digital channels 32% Demand 28% Savings 3% Public Savings 21% Money Market 15% Time 1% Public Time
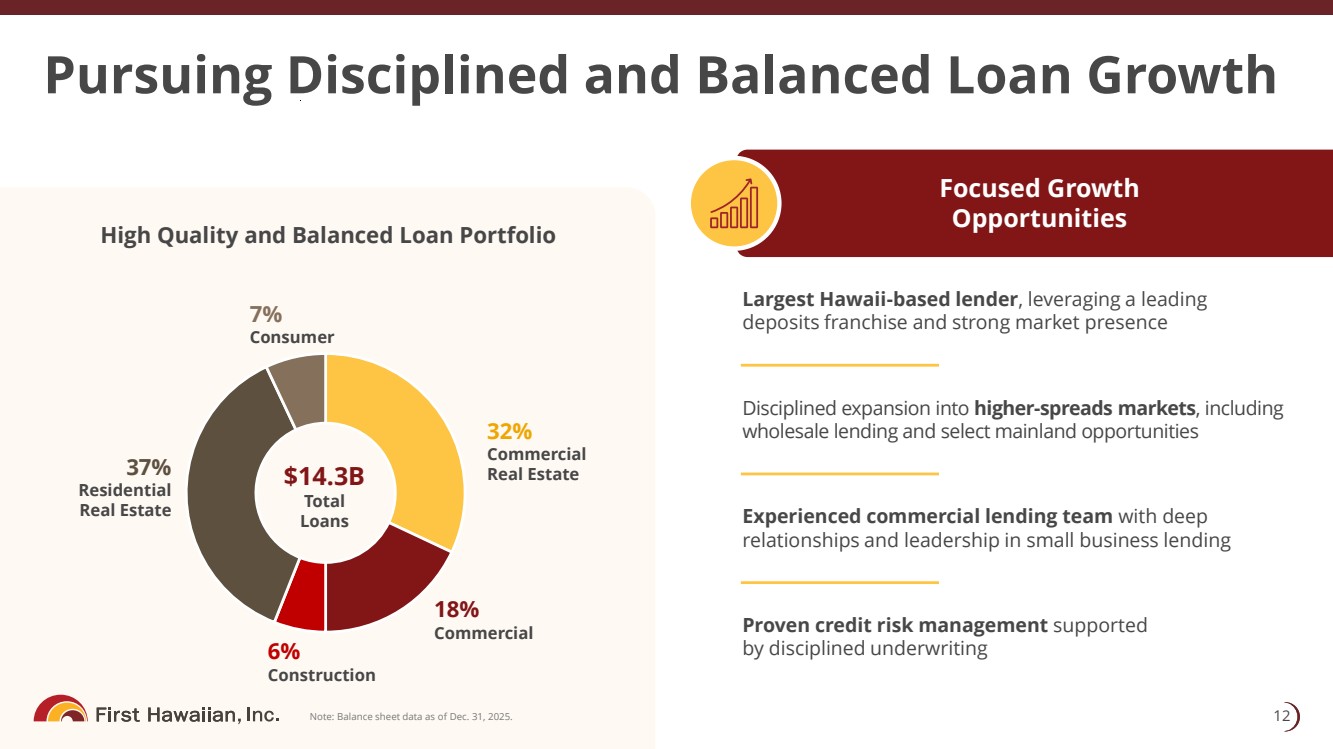
Largest Hawaii - based lender , leveraging a leading deposits franchise and strong market presence Disciplined expansion into higher - spreads markets , including wholesale lending and select mainland opportunities Experienced commercial lending team with deep relationships and leadership in small business lending Proven credit risk management supported by disciplined underwriting Pursuing Disciplined and Balanced Loan Growth 12 Note: Balance sheet data as of Dec. 31, 2025. Focused Growth Opportunities High Quality and Balanced Loan Portfolio 32% Commercial Real Estate 37% Residential Real Estate 6% Construction 7% Consumer $14.3B Total Loans 18% Commercial
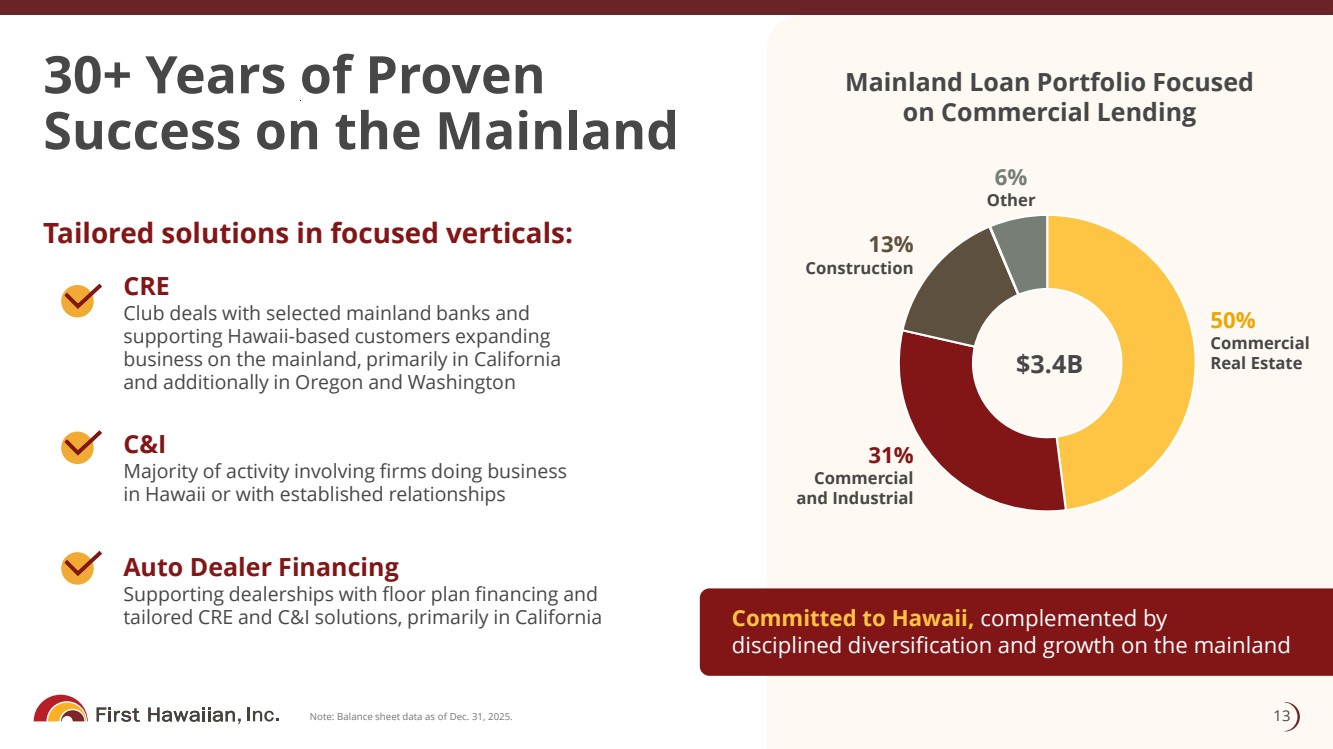
30+ Years of Proven Success on the Mainland 13 Note: Balance sheet data as of Dec. 31, 2025. Tailored solutions in focused verticals: CRE Club deals with selected mainland banks and supporting Hawaii - based customers expanding business on the mainland, primarily in California and additionally in Oregon and Washington C&I Majority of activity involving firms doing business in Hawaii or with established relationships Auto Dealer Financing Supporting dealerships with floor plan financing and tailored CRE and C&I solutions, primarily in California Committed to Hawaii, complemented by disciplined diversification and growth on the mainland Mainland Loan Portfolio Focused on Commercial Lending $3.4B 50% Commercial Real Estate 31% Commercial and Industrial 13% Construction 6% Other
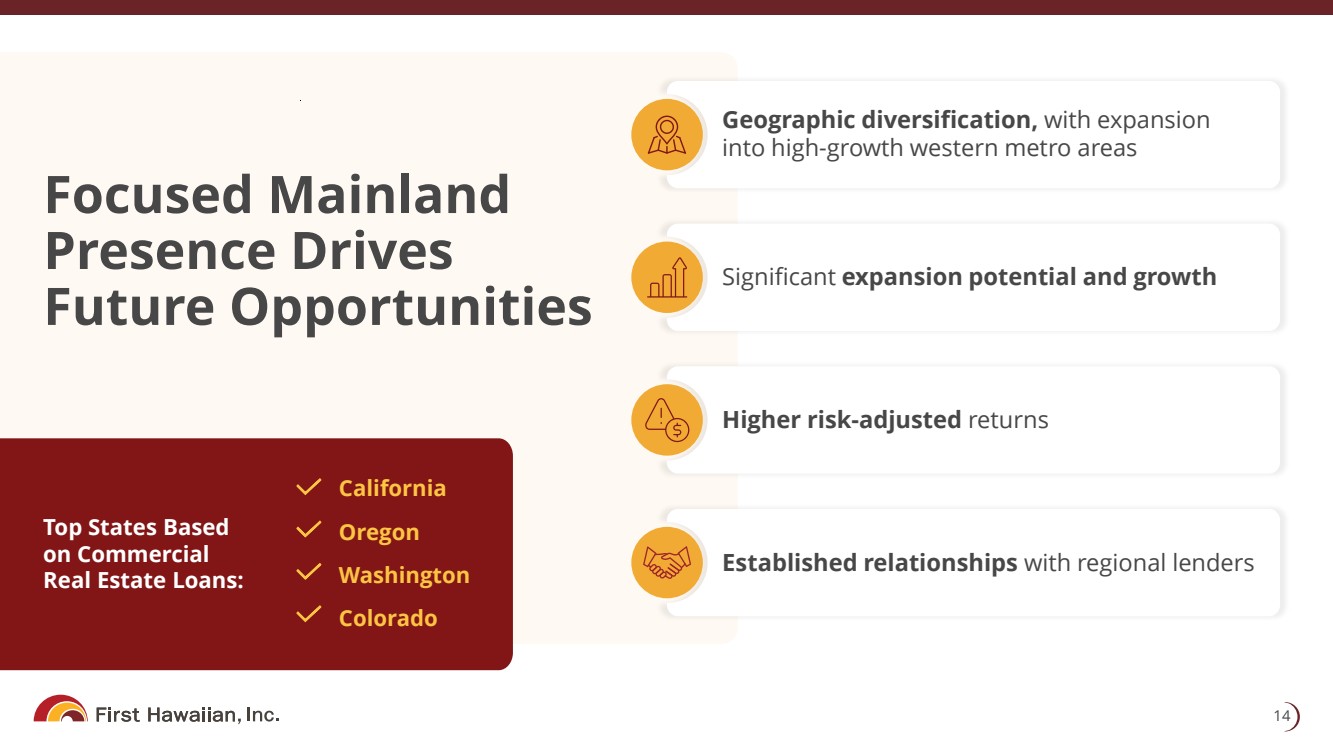
14 Focused Mainland Presence Drives Future Opportunities Top States Based on Commercial Real Estate Loans: California Oregon Washington Colorado Geographic diversification, with expansion into high - growth western metro areas Established relationships with regional lenders Significant expansion potential and growth Higher risk - adjusted returns
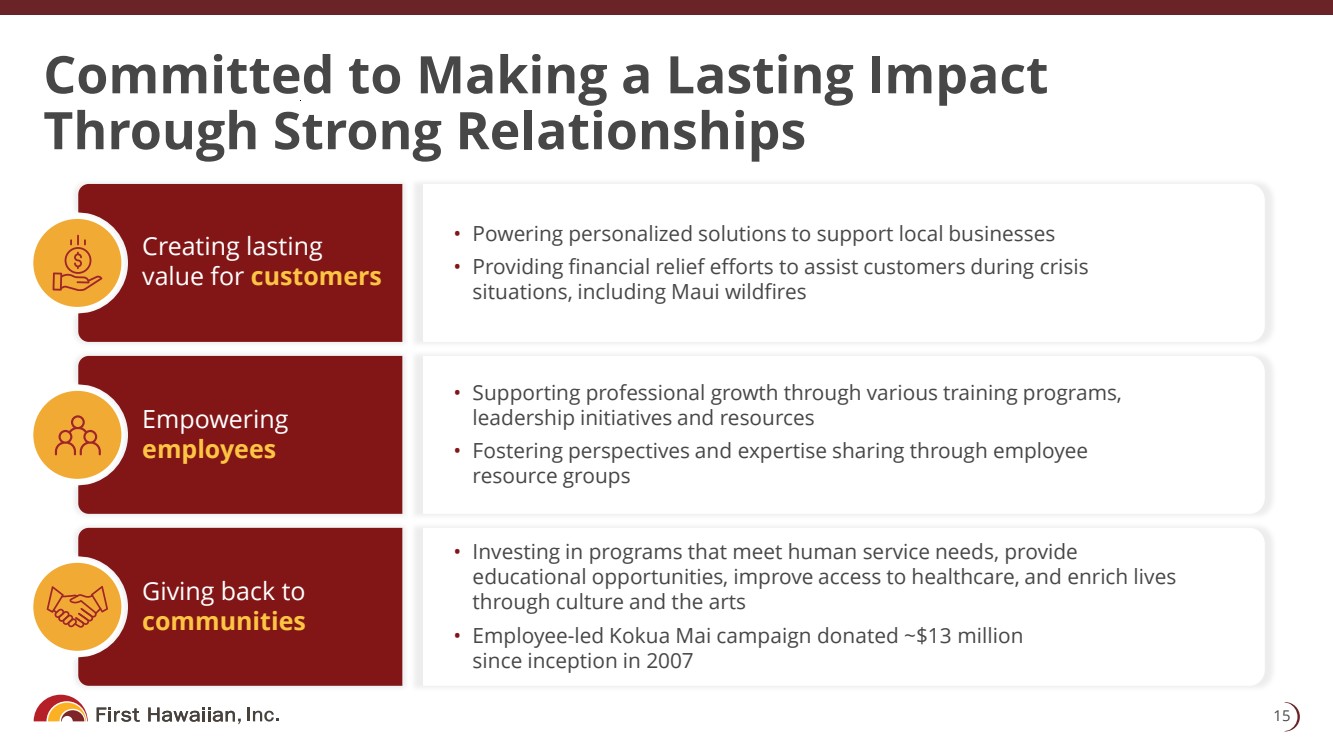
Committed to Making a Lasting Impact Through Strong Relationships 15 • Supporting professional growth through various training programs, leadership initiatives and resources • Fostering perspectives and expertise sharing through employee resource groups Empowering employees • Powering personalized solutions to support local businesses • Providing financial relief efforts to assist customers during crisis situations, including Maui wildfires Creating lasting value for customers • Investing in programs that meet human service needs, provide educational opportunities, improve access to healthcare, and enrich lives through culture and the arts • Employee - led Kokua Mai campaign donated ~$13 million since inception in 2007 Giving back to communities
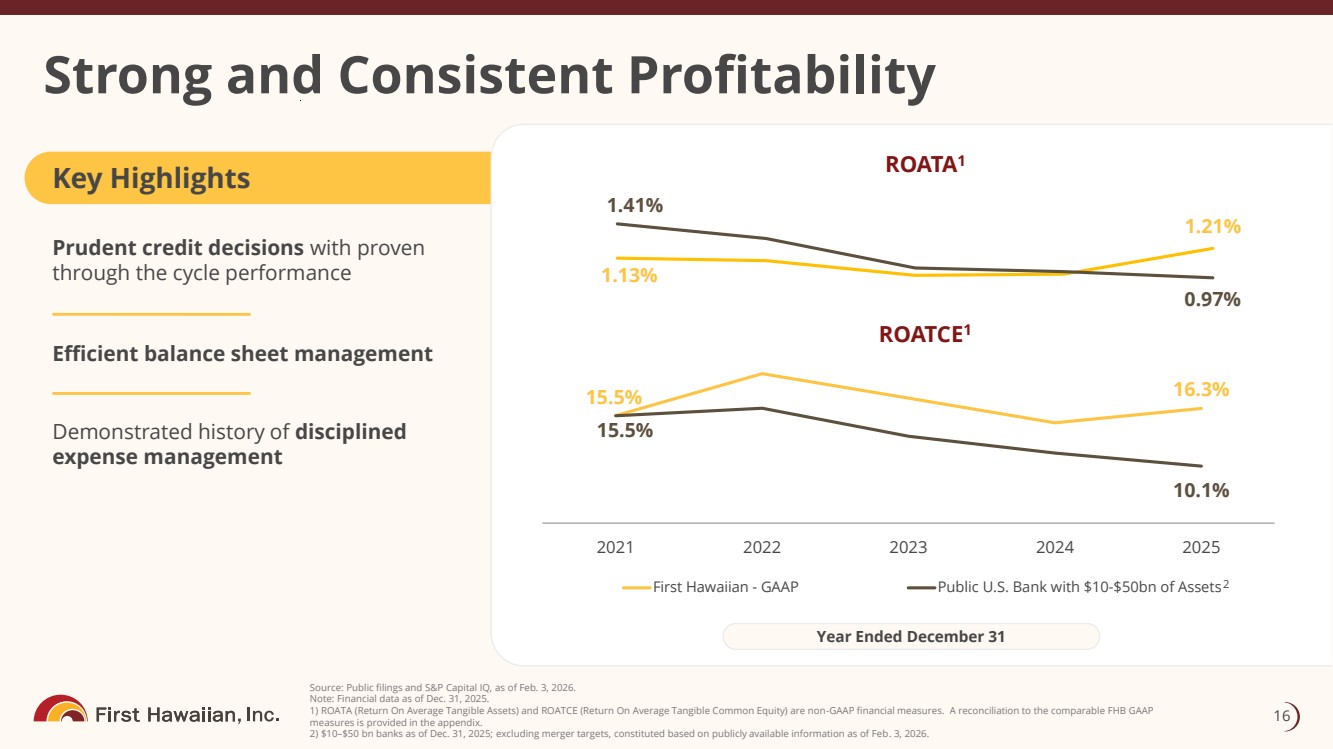
Key Highlights Prudent credit decisions with proven through the cycle performance Efficient balance sheet management Demonstrated history of disciplined expense management ROATA 1 Strong and Consistent Profitability 16 Source: Public filings and S&P Capital IQ, as of Feb. 3, 2026. Note: Financial data as of Dec. 31, 2025. 1) ROATA (Return On Average Tangible Assets) and ROATCE (Return On Average Tangible Common Equity) are non - GAAP financial measur es. A reconciliation to the comparable FHB GAAP measures is provided in the appendix. 2) $10 – $50 bn banks as of Dec. 31, 2025; excluding merger targets, constituted based on publicly available information as of Feb . 3, 2026. 1.13% 1.21% 1.41% 0.97% 15.5% 16.3% 15.5% 10.1% 2021 2022 2023 2024 2025 First Hawaiian - GAAP Public U.S. Bank with $10-$50bn of Assets ROATCE 1 Year Ended December 31 2
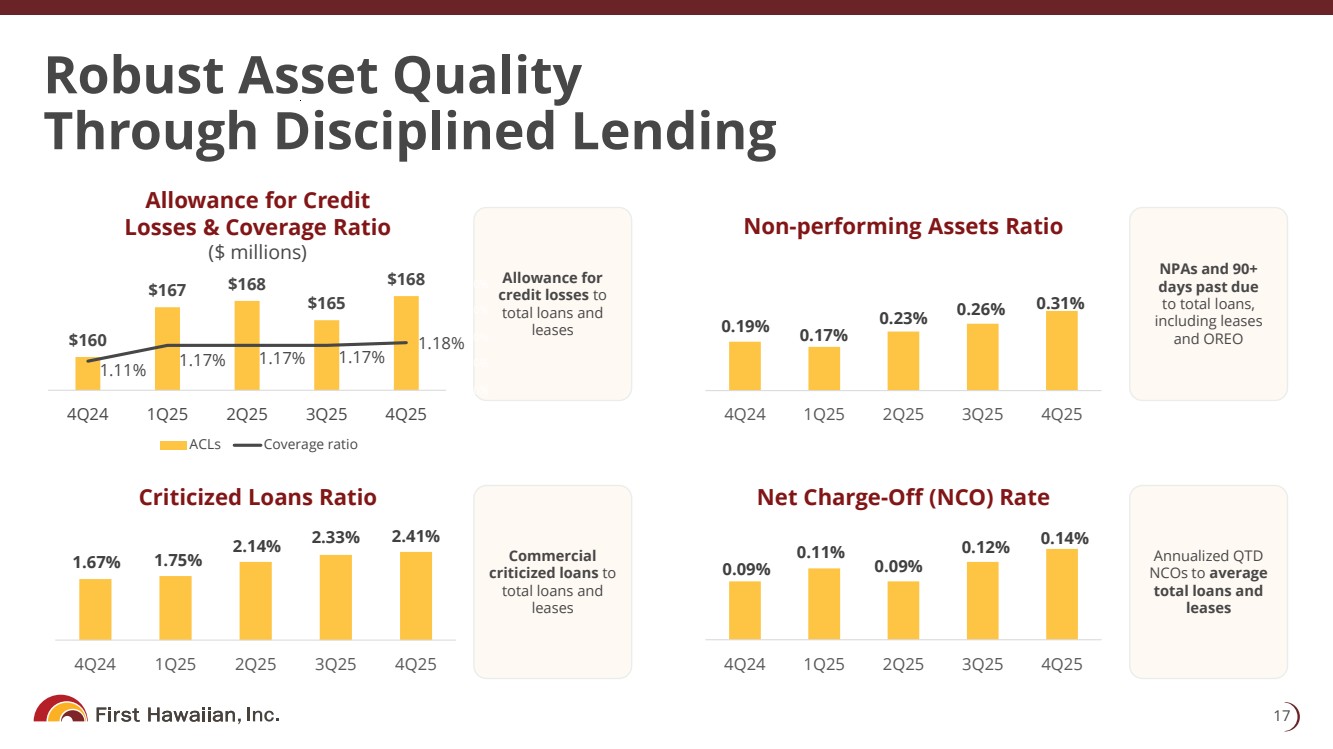
1.67% 1.75% 2.14% 2.33% 2.41% 4Q24 1Q25 2Q25 3Q25 4Q25 Robust Asset Quality Through Disciplined Lending 17 Allowance for Credit Losses & Coverage Ratio ($ millions) Net Charge - Off (NCO) Rate Criticized Loans Ratio Non - performing Assets Ratio 0.19% 0.17% 0.23% 0.26% 0.31% 4Q24 1Q25 2Q25 3Q25 4Q25 0.09% 0.11% 0.09% 0.12% 0.14% 4Q24 1Q25 2Q25 3Q25 4Q25 NPAs and 90+ days past due to total loans, including leases and OREO Annualized QTD NCOs to average total loans and leases Allowance for credit losses to total loans and leases Commercial criticized loans to total loans and leases $ 160 $ 167 $ 168 $ 165 $ 168 1.11% 1.17% 1.17% 1.17% 1.18% 1.00% 1.10% 1.20% 1.30% 1.40% 156 158 160 162 164 166 168 170 4Q24 1Q25 2Q25 3Q25 4Q25 ACLs Coverage ratio
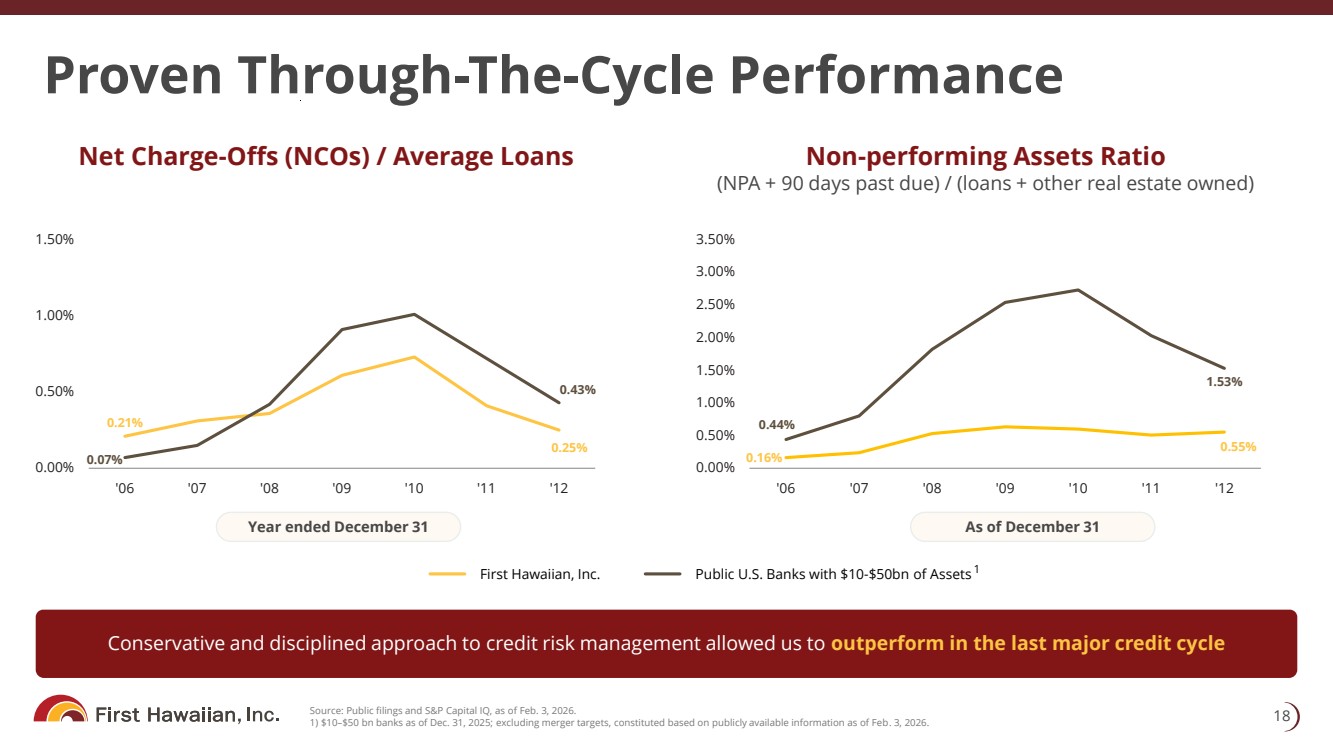
Proven Through - The - Cycle Performance 18 Source: Public filings and S&P Capital IQ, as of Feb. 3, 2026. 1) $10 – $50 bn banks as of Dec. 31, 2025; excluding merger targets, constituted based on publicly available information as of Feb . 3, 2026. Net Charge - Offs (NCOs) / Average Loans Non - performing Assets Ratio (NPA + 90 days past due) / (loans + other real estate owned) 0.21% 0.25% 0.07% 0.43% 0.00% 0.50% 1.00% 1.50% '06 '07 '08 '09 '10 '11 '12 0.16% 0.55% 0.44% 1.53% 0.00% 0.50% 1.00% 1.50% 2.00% 2.50% 3.00% 3.50% '06 '07 '08 '09 '10 '11 '12 Year ended December 31 As of December 31 First Hawaiian, Inc. Public U.S. Banks with $10 - $50bn of Assets Conservative and disciplined approach to credit risk management allowed us to outperform in the last major credit cycle 1
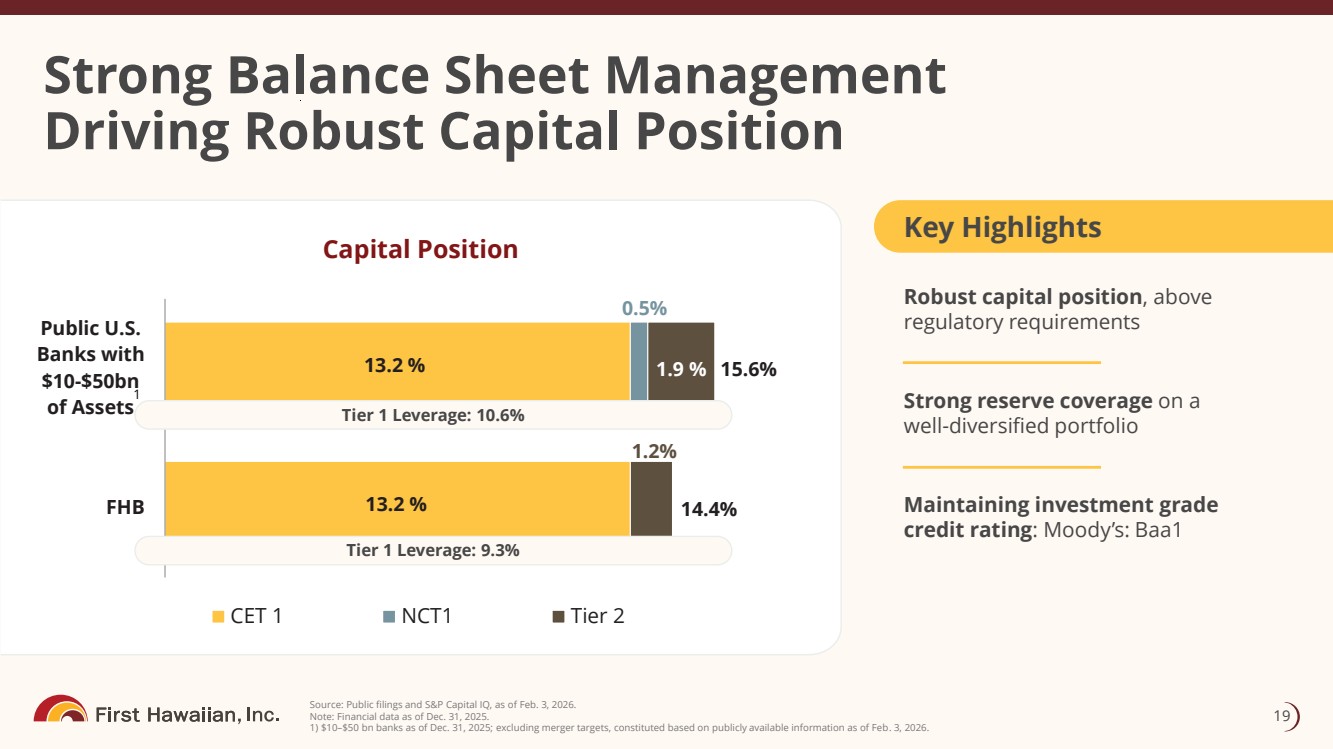
Key Highlights Robust capital position , above regulatory requirements Strong reserve coverage on a well - diversified portfolio Maintaining investment grade credit rating : Moody’s: Baa1 Strong Balance Sheet Management Driving Robust Capital Position 19 Source: Public filings and S&P Capital IQ, as of Feb. 3, 2026. Note: Financial data as of Dec. 31, 2025. 1) $10 – $50 bn banks as of Dec. 31, 2025; excluding merger targets, constituted based on publicly available information as of Feb . 3, 2026. 13.2 % 13.2 % 0.5% 1.2% 1.9 % 14.4% 15.6% FHB Public U.S. Banks with $10-$50bn of Assets CET 1 NCT1 Tier 2 Capital Position Tier 1 Leverage: 10.6% Tier 1 Leverage: 9.3% 1
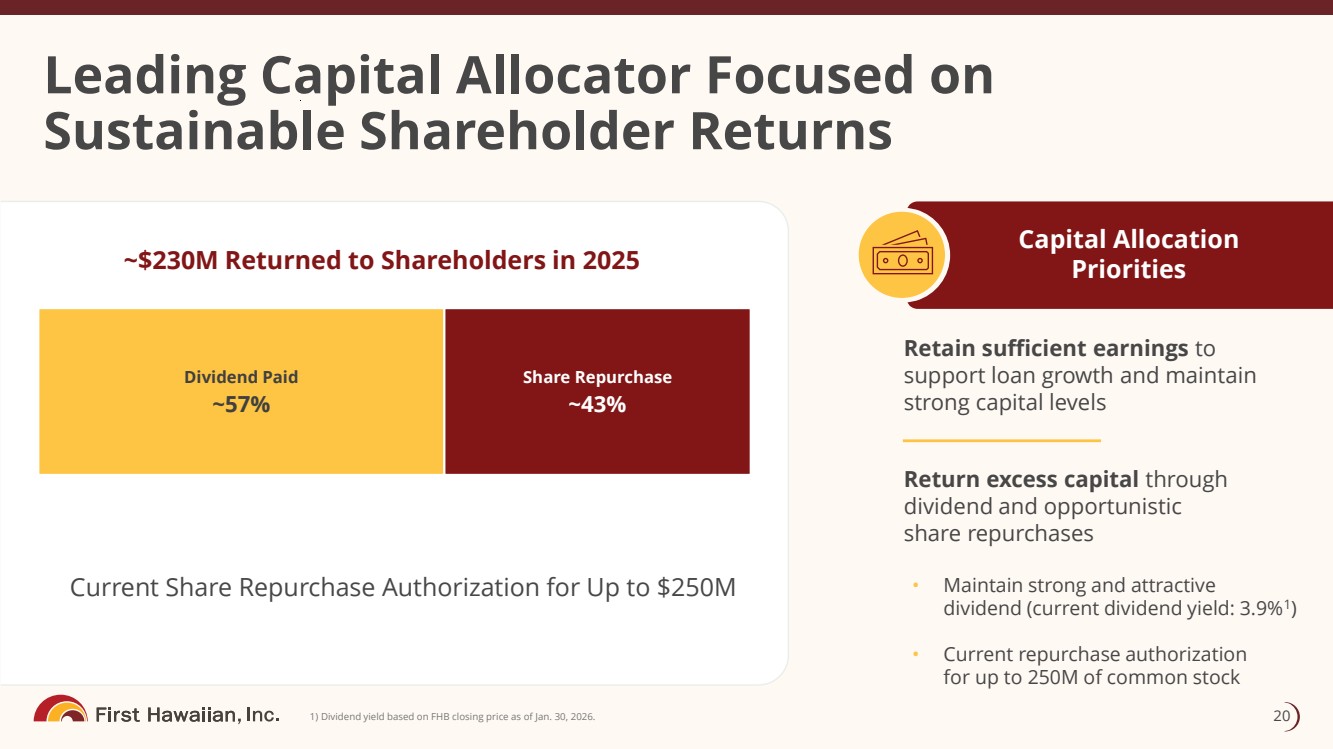
Capital Allocation Priorities Leading Capital Allocator Focused on Sustainable Shareholder Returns 20 1) Dividend yield based on FHB closing price as of Jan. 30, 2026. ~$230M Returned to Shareholders in 2025 Retain sufficient earnings to support loan growth and maintain strong capital levels Return excess capital through dividend and opportunistic share repurchases • Maintain strong and attractive dividend (current dividend yield: 3.9% 1 ) Dividend Paid ~ 57% Share Repurchase ~ 43% • Current repurchase authorization for up to 250M of common stock Current Share Repurchase Authorization for Up to $250M
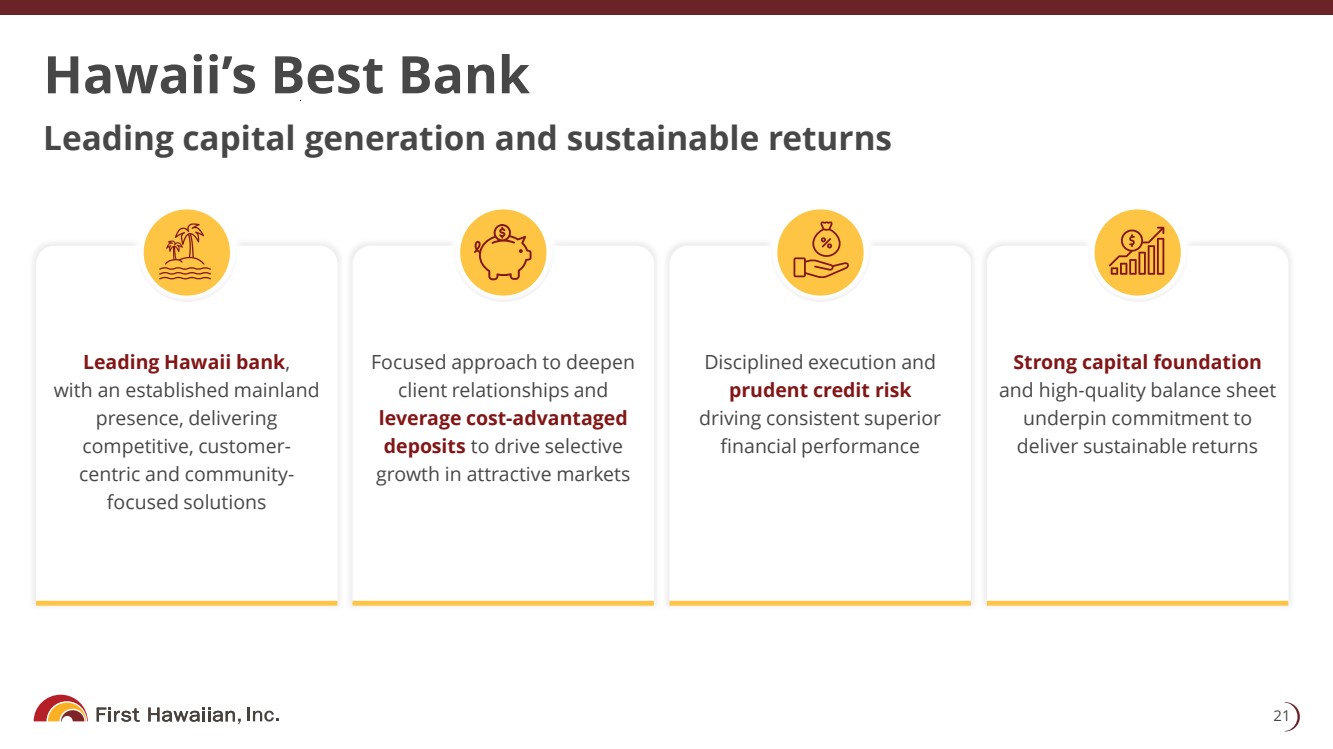
Leading capital generation and sustainable returns 21 Hawaii’s Best Bank Focused approach to deepen client relationships and leverage cost - advantaged deposits to drive selective growth in attractive markets Disciplined execution and prudent credit risk driving consistent superior financial performance Strong capital foundation and high - quality balance sheet underpin commitment to deliver sustainable returns Leading Hawaii bank , with an established mainland presence, delivering competitive, customer - centric and community - focused solutions

22 Appendix

Seasoned Management Team 23 James M. Moses Chief Financial Officer Robert S. Harrison Chairman, President and CEO Gina O.W. Anonuevo Chief Administrative Officer Alan H. Arizumi Vice Chair Wealth Management Neill A. Char Vice Chair Retail Banking and Consumer Products Darlene Blakeney Chief Lending Officer Lea Nakamura Chief Risk Officer Cameron Nekota Executive Vice President Commercial Banking Joel E. Rappoport General Counsel and Secretary
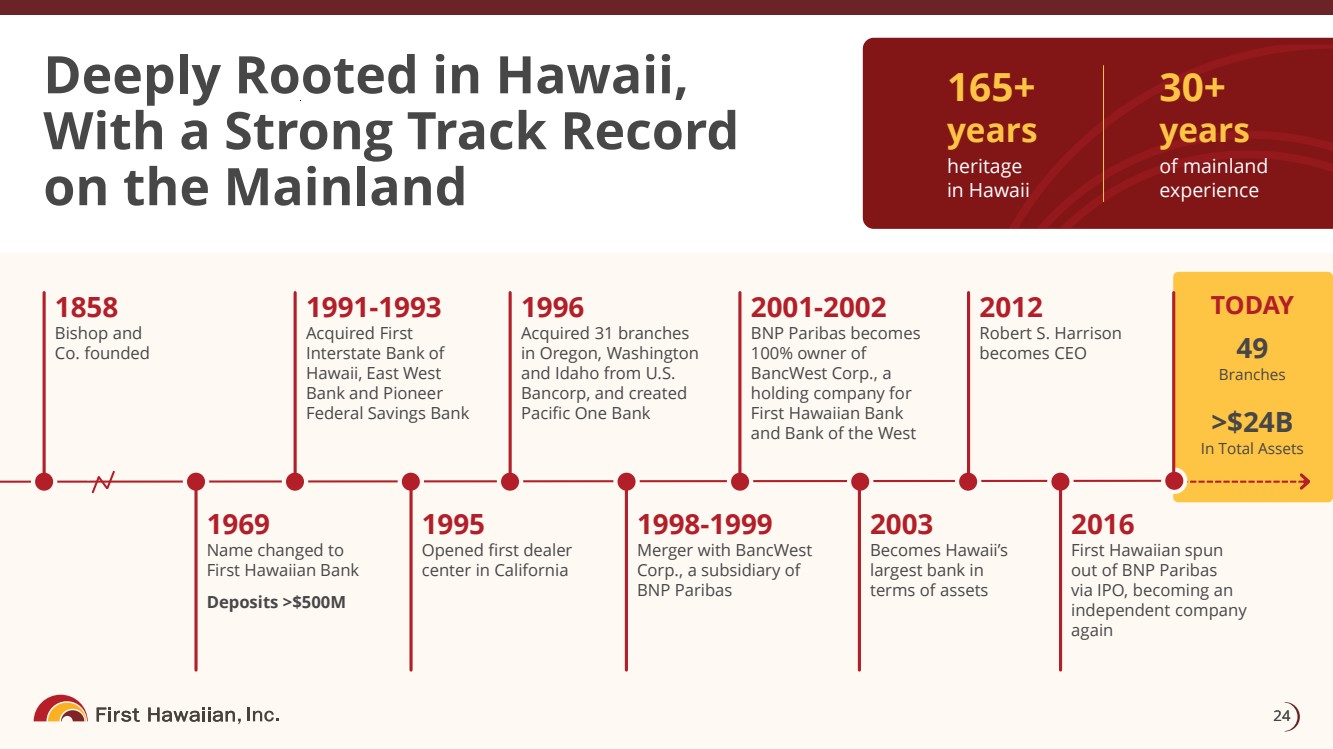
24 Deeply Rooted in Hawaii, With a Strong Track Record on the Mainland 24 1858 Bishop and Co. founded 1969 Name changed to First Hawaiian Bank Deposits >$500M 1991 - 1993 Acquired First Interstate Bank of Hawaii, East West Bank and Pioneer Federal Savings Bank 1995 Opened first dealer center in California 1996 Acquired 31 branches in Oregon, Washington and Idaho from U.S. Bancorp, and created Pacific One Bank 1998 - 1999 Merger with BancWest Corp., a subsidiary of BNP Paribas 2001 - 2002 BNP Paribas becomes 100% owner of BancWest Corp., a holding company for First Hawaiian Bank and Bank of the West 2003 Becomes Hawaii’s largest bank in terms of assets 2012 Robert S. Harrison becomes CEO 2016 First Hawaiian spun out of BNP Paribas via IPO, becoming an independent company again TODAY 49 Branches >$24B In Total Assets 30+ years of mainland experience 165 + years heritage in Hawaii
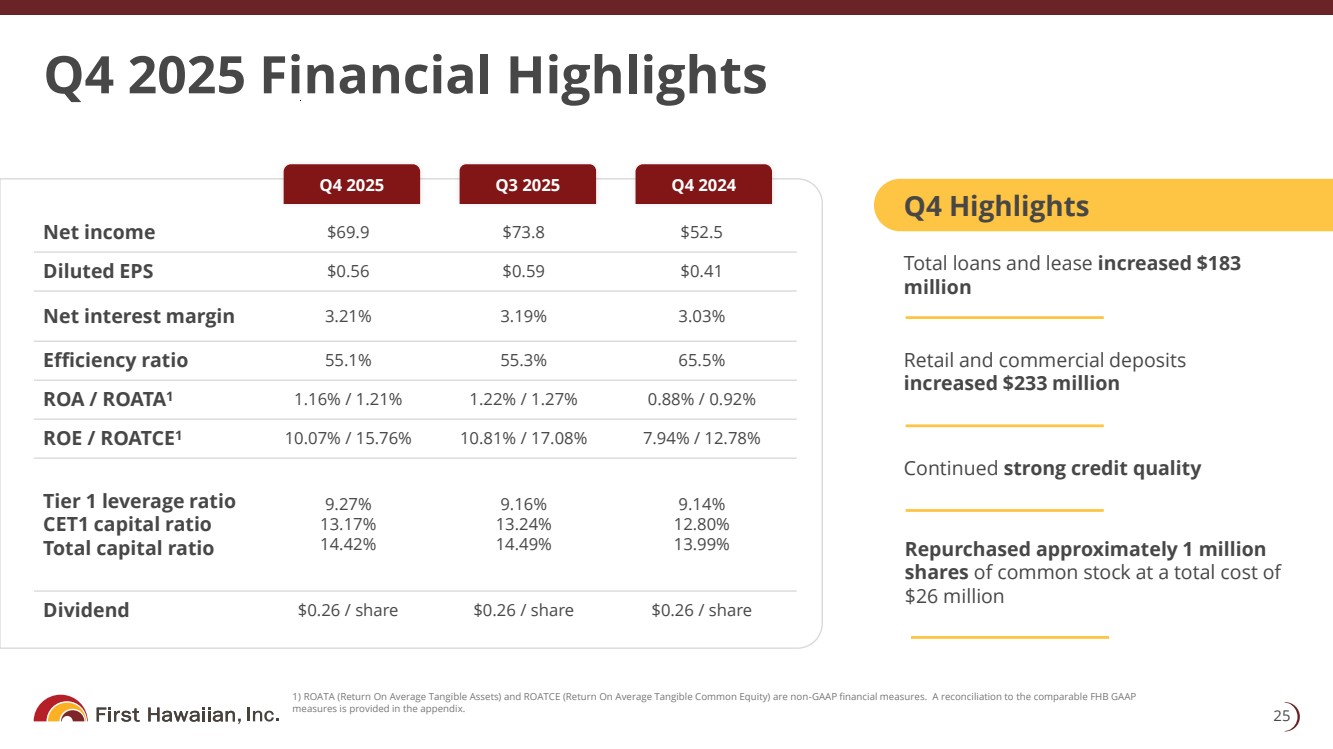
Q4 2025 Financial Highlights 25 Total loans and lease increased $183 million Retail and commercial deposits increased $233 million Q4 Highlights $52.5 $73.8 $69.9 Net income $0.41 $0.59 $0.56 Diluted EPS 3.03% 3.19% 3.21% Net interest margin 65.5% 55.3% 55.1% Efficiency ratio 0.88% / 0.92% 1.22% / 1.27% 1.16% / 1.21% ROA / ROATA 1 7.94% / 12.78% 10.81% / 17.08% 10.07% / 15.76% ROE / ROATCE 1 9.14% 12.80% 13.99% 9.16% 13.24% 14.49% 9.27% 13.17% 14.42% Tier 1 leverage ratio CET1 capital ratio Total capital ratio $0.26 / share $0.26 / share $0.26 / share Dividend Q4 2025 Q3 2025 Q4 2024 Continued strong credit quality 1) ROATA (Return On Average Tangible Assets) and ROATCE (Return On Average Tangible Common Equity) are non - GAAP financial measur es. A reconciliation to the comparable FHB GAAP measures is provided in the appendix. Repurchased approximately 1 million shares of common stock at a total cost of $26 million
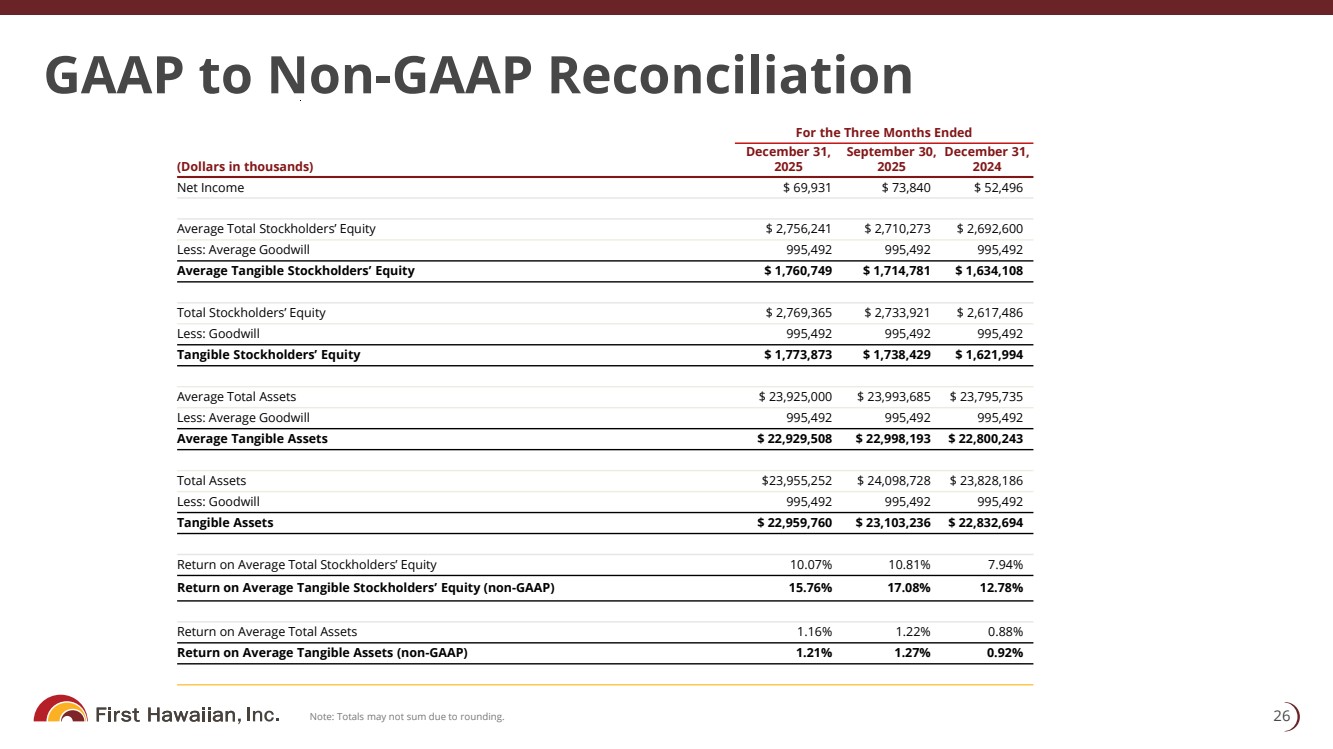
GAAP to Non - GAAP Reconciliation 26 Note: Totals may not sum due to rounding. For the Three Months Ended December 31, 2024 September 30, 2025 December 31, 2025 (Dollars in thousands) $ 52,496 $ 73,840 $ 69,931 Net Income $ 2,692,600 $ 2,710,273 $ 2,756,241 Average Total Stockholders’ Equity 995,492 995,492 995,492 Less: Average Goodwill $ 1,634,108 $ 1,714,781 $ 1,760,749 Average Tangible Stockholders’ Equity $ 2,617,486 $ 2,733,921 $ 2,769,365 Total Stockholders’ Equity 995,492 995,492 995,492 Less: Goodwill $ 1,621,994 $ 1,738,429 $ 1,773,873 Tangible Stockholders’ Equity $ 23,795,735 $ 23,993,685 $ 23,925,000 Average Total Assets 995,492 995,492 995,492 Less: Average Goodwill $ 22,800,243 $ 22,998,193 $ 22,929,508 Average Tangible Assets $ 23,828,186 $ 24,098,728 $23,955,252 Total Assets 995,492 995,492 995,492 Less: Goodwill $ 22,832,694 $ 23,103,236 $ 22,959,760 Tangible Assets 7.94% 10.81% 10.07% Return on Average Total Stockholders’ Equity 12.78% 17.08% 15.76% Return on Average Tangible Stockholders’ Equity (non - GAAP) 0.88% 1.22% 1.16% Return on Average Total Assets 0.92% 1.27% 1.21% Return on Average Tangible Assets (non - GAAP)
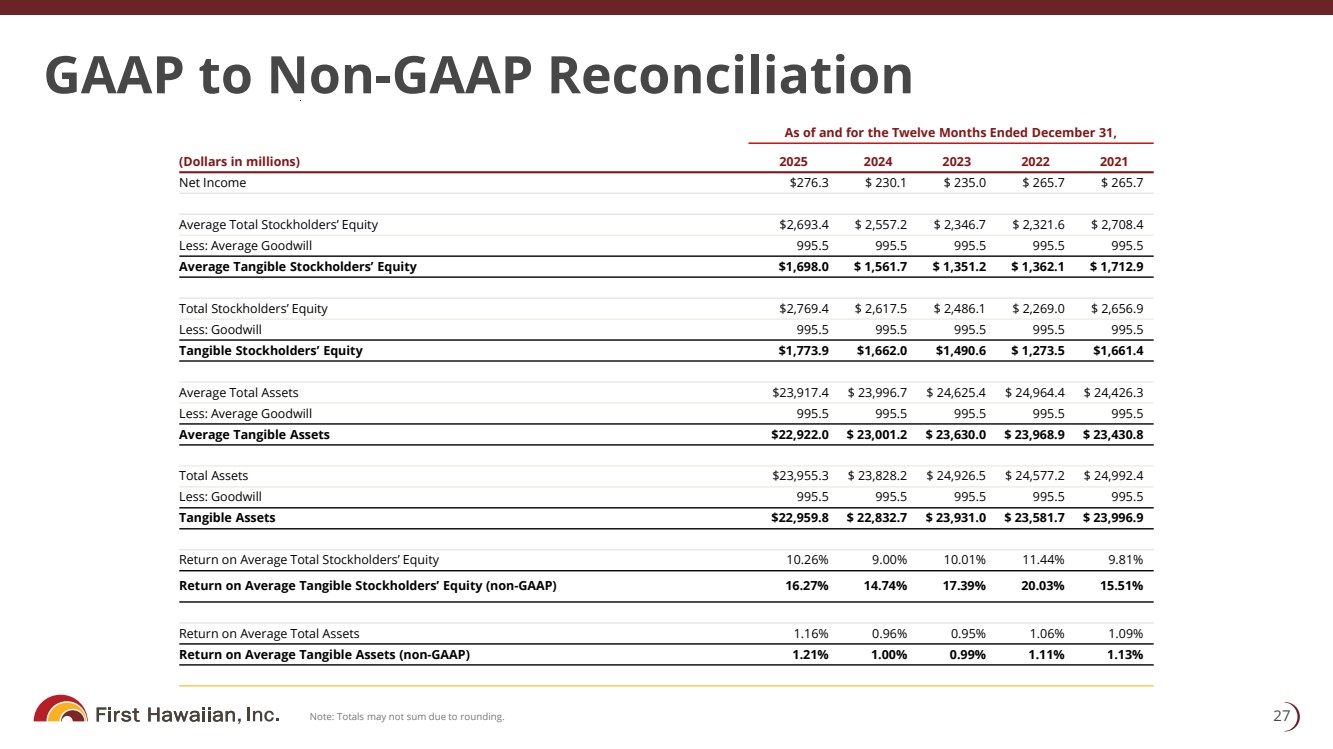
GAAP to Non - GAAP Reconciliation 27 Note: Totals may not sum due to rounding. As of and for the Twelve Months Ended December 31, 2021 2022 2023 2024 2025 (Dollars in millions) $ 265.7 $ 265.7 $ 235.0 $ 230.1 $276.3 Net Income $ 2,708.4 $ 2,321.6 $ 2,346.7 $ 2,557.2 $2,693.4 Average Total Stockholders’ Equity 995.5 995.5 995.5 995.5 995.5 Less: Average Goodwill $ 1,712.9 $ 1,362.1 $ 1,351.2 $ 1,561.7 $1,698.0 Average Tangible Stockholders’ Equity $ 2,656.9 $ 2,269.0 $ 2,486.1 $ 2,617.5 $2,769.4 Total Stockholders’ Equity 995.5 995.5 995.5 995.5 995.5 Less: Goodwill $1,661.4 $ 1,273.5 $1,490.6 $1,662.0 $1,773.9 Tangible Stockholders’ Equity $ 24,426.3 $ 24,964.4 $ 24,625.4 $ 23,996.7 $23,917.4 Average Total Assets 995.5 995.5 995.5 995.5 995.5 Less: Average Goodwill $ 23,430.8 $ 23,968.9 $ 23,630.0 $ 23,001.2 $22,922.0 Average Tangible Assets $ 24,992.4 $ 24,577.2 $ 24,926.5 $ 23,828.2 $23,955.3 Total Assets 995.5 995.5 995.5 995.5 995.5 Less: Goodwill $ 23,996.9 $ 23,581.7 $ 23,931.0 $ 22,832.7 $22,959.8 Tangible Assets 9.81% 11.44% 10.01% 9.00% 10.26% Return on Average Total Stockholders’ Equity 15.51% 20.03% 17.39% 14.74% 16.27% Return on Average Tangible Stockholders’ Equity (non - GAAP) 1.09% 1.06% 0.95% 0.96% 1.16% Return on Average Total Assets 1.13% 1.11% 0.99% 1.00% 1.21% Return on Average Tangible Assets (non - GAAP)