General Dynamics Reports Second-Quarter 2025 Financial Results
July 23, 2025
•Revenue $13 billion, up 8.9% from year-ago quarter
•Diluted EPS $3.74, up 14.7% from year-ago quarter
•$1.6 billion cash from operating activities, 158% of net earnings
•Very strong order activity in Marine and Aerospace segments
RESTON, Va. – General Dynamics (NYSE: GD) today reported second-quarter 2025 operating earnings of $1.3 billion, or $3.74 per diluted share (EPS), on revenue of $13 billion. Compared with the year-ago quarter, revenue increased 8.9%, operating earnings increased 12.9%, and diluted EPS increased 14.7%. Operating margin of 10.0% was a 30-basis-point expansion from the year-ago quarter.
“During the first half of the year, each of our four segments achieved growth in revenue and earnings, with margins on a companywide basis expanding 50 basis points over the same period last year,” said Phebe Novakovic, chairman and chief executive officer. “Our strong cash flow and healthy backlog position us well to have a good second half.”
Cash and Capital Deployment
Net cash provided by operating activities in the quarter totaled $1.6 billion, or 158% of net earnings. During the quarter, the company paid $402 million in dividends, invested $198 million in capital expenditures, and reduced total debt by $897 million. The company ended the quarter with $8.7 billion in total debt and $1.5 billion in cash and equivalents on hand.
Orders and Backlog
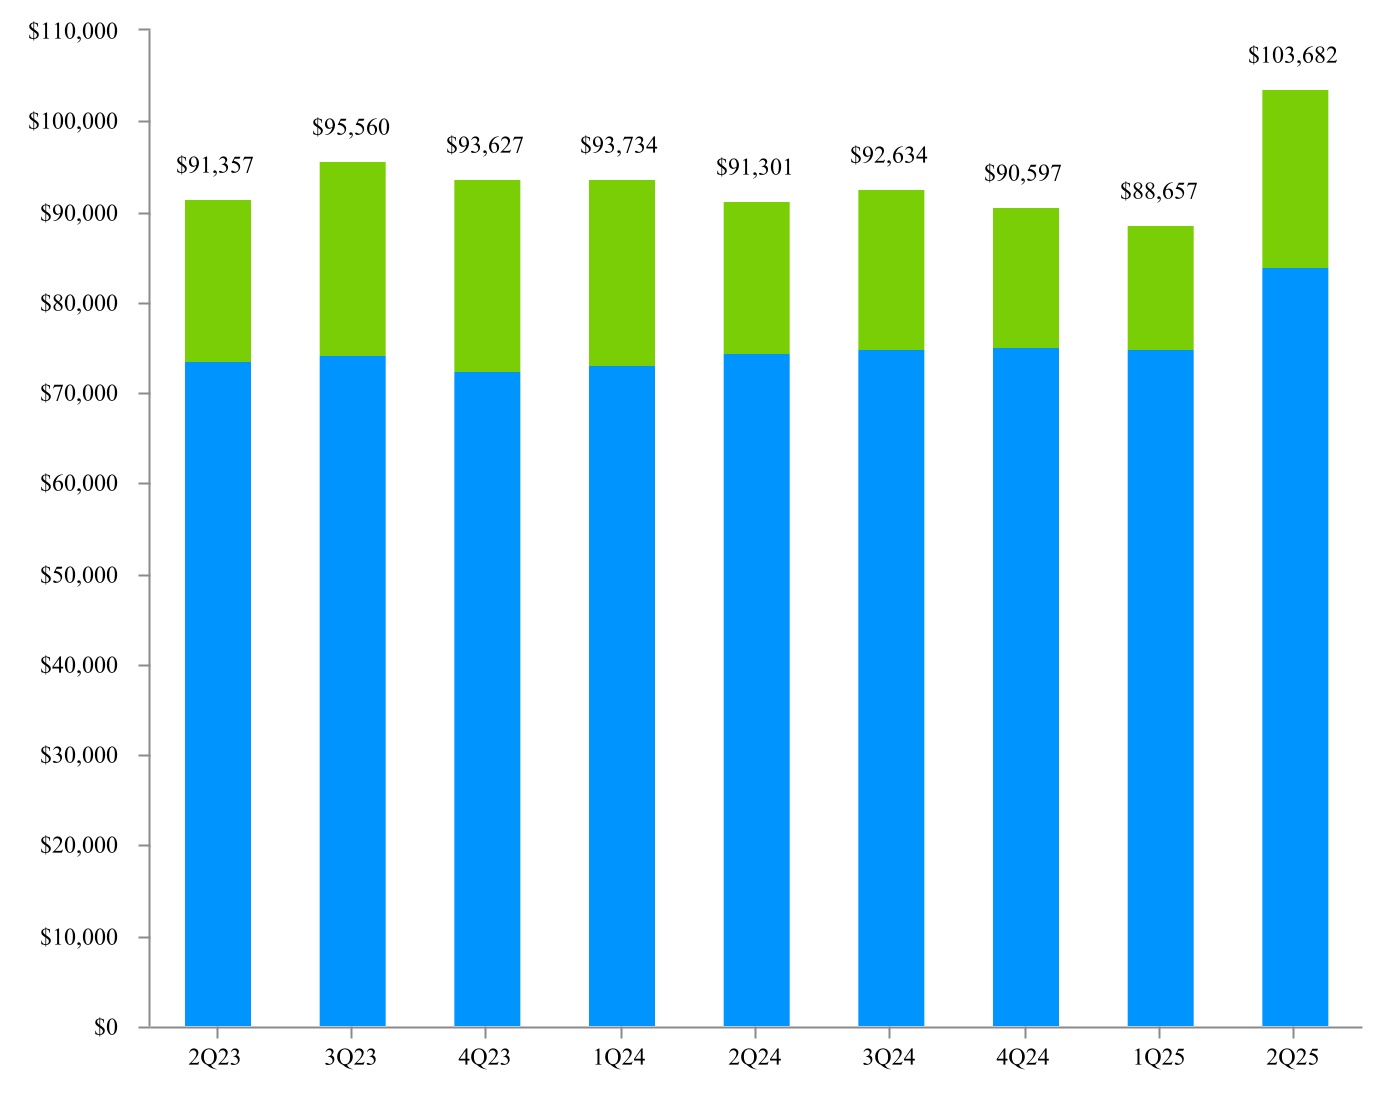
Consolidated book-to-bill ratio, defined as orders divided by revenue, was 2.2-to-1 for the quarter. Book-to-bill was 2.4-to-1 for the defense segments and 1.3-to-1 for the aerospace segment. On a companywide basis, orders totaled $28.3 billion. Backlog at the end of the quarter was $103.7 billion. Estimated potential contract value, representing management’s estimate of additional value in unfunded indefinite delivery, indefinite quantity (IDIQ) contracts and unexercised options, was $57.5 billion. Total estimated contract value, the sum of all backlog components, was $161.2 billion.
– more –
About General Dynamics
Headquartered in Reston, Virginia, General Dynamics is a global aerospace and defense company that offers a broad portfolio of products and services in business aviation; ship construction and repair; land combat vehicles, weapons systems and munitions; and technology products and services. General Dynamics employs more than 110,000 people worldwide and generated $47.7 billion in revenue in 2024. More information is available at www.gd.com.
WEBCAST INFORMATION: General Dynamics will webcast its second-quarter 2025 financial results conference call at 9 a.m. EDT on Wednesday, July 23, 2025. The webcast will be a listen-only audio event available at www.gd.com. An on-demand replay of the webcast will be available by telephone two hours after the end of the call through July 30, 2025, at 800-770-2030 (international: +1 609-800-9909), conference ID 4299949. Charts furnished to investors and securities analysts in connection with General Dynamics’ announcement of its financial results are available at www.gd.com.
This press release contains forward-looking statements (FLS), including statements about the company’s future operational and financial performance, which are based on management’s expectations, estimates, projections and assumptions. Words such as “expects,” “anticipates,” “plans,” “believes,” “forecasts,” “scheduled,” “outlook,” “estimates,” “should” and variations of these words and similar expressions are intended to identify FLS. In making FLS, we rely on assumptions and analyses based on our experience and perception of historical trends; current conditions and expected future developments; and other factors, estimates and judgments we consider reasonable and appropriate based on information available to us at the time. FLS are made pursuant to the safe harbor provisions of the Private Securities Litigation Reform Act of 1995, as amended. FLS are not guarantees of future performance and involve factors, risks and uncertainties that are difficult to predict. Actual future results and trends may differ materially from what is forecast in the FLS. All FLS speak only as of the date they were made. We do not undertake any obligation to update or publicly release revisions to FLS to reflect events, circumstances or changes in expectations after the date of this press release. Additional information regarding these factors is contained in the company’s filings with the SEC, and these factors may be revised or supplemented in future SEC filings. In addition, this press release contains some financial measures not prepared in accordance with U.S. generally accepted accounting principles (GAAP). While we believe these non-GAAP metrics provide useful information for investors, there are limitations associated with their use, and our calculations of these metrics may not be comparable to similarly titled measures of other companies. Non-GAAP metrics should not be considered in isolation from, or as a substitute for, GAAP measures. Reconciliations to comparable GAAP measures and other information relating to our non-GAAP measures are included in other filings with the SEC, which are available at investorrelations.gd.com.
– more –
EXHIBIT A
CONSOLIDATED STATEMENT OF EARNINGS - (UNAUDITED)
DOLLARS IN MILLIONS, EXCEPT PER SHARE AMOUNTS
Three Months Ended
Variance
June 29, 2025
June 30, 2024
$
%
Revenue
$
13,041
$
11,976
$
1,065
8.9
%
Operating costs and expenses
(11,736)
(10,820)
(916)
Operating earnings
1,305
1,156
149
12.9
%
Other, net
15
18
(3)
Interest, net
(88)
(84)
(4)
Earnings before income tax
1,232
1,090
142
13.0
%
Provision for income tax, net
(218)
(185)
(33)
Net earnings
$
1,014
$
905
$
109
12.0
%
Earnings per share—basic
$
3.78
$
3.30
$
0.48
14.5
%
Basic weighted average shares outstanding
268.1
274.1
Earnings per share—diluted
$
3.74
$
3.26
$
0.48
14.7
%
Diluted weighted average shares outstanding
270.9
277.7
– more –
EXHIBIT B
CONSOLIDATED STATEMENT OF EARNINGS - (UNAUDITED)
DOLLARS IN MILLIONS, EXCEPT PER SHARE AMOUNTS
Six Months Ended
Variance
June 29, 2025
June 30, 2024
$
%
Revenue
$
25,264
$
22,707
$
2,557
11.3
%
Operating costs and expenses
(22,691)
(20,515)
(2,176)
Operating earnings
2,573
2,192
381
17.4
%
Other, net
36
32
4
Interest, net
(177)
(166)
(11)
Earnings before income tax
2,432
2,058
374
18.2
%
Provision for income tax, net
(424)
(354)
(70)
Net earnings
$
2,008
$
1,704
$
304
17.8
%
Earnings per share—basic
$
7.48
$
6.22
$
1.26
20.3
%
Basic weighted average shares outstanding
268.6
273.8
Earnings per share—diluted
$
7.40
$
6.14
$
1.26
20.5
%
Diluted weighted average shares outstanding
271.3
277.4
– more –
EXHIBIT C
REVENUE AND OPERATING EARNINGS BY SEGMENT - (UNAUDITED)
DOLLARS IN MILLIONS
Three Months Ended
Variance
June 29, 2025
June 30, 2024
$
%
Revenue:
Aerospace
$
3,062
$
2,940
$
122
4.1
%
Marine Systems
4,220
3,453
767
22.2
%
Combat Systems
2,283
2,288
(5)
(0.2)
%
Technologies
3,476
3,295
181
5.5
%
Total
$
13,041
$
11,976
$
1,065
8.9
%
Operating earnings:
Aerospace
$
403
$
319
$
84
26.3
%
Marine Systems
291
245
46
18.8
%
Combat Systems
324
313
11
3.5
%
Technologies
332
320
12
3.8
%
Corporate
(45)
(41)
(4)
(9.8)
%
Total
$
1,305
$
1,156
$
149
12.9
%
Operating margin:
Aerospace
13.2
%
10.9
%
Marine Systems
6.9
%
7.1
%
Combat Systems
14.2
%
13.7
%
Technologies
9.6
%
9.7
%
Total
10.0
%
9.7
%
– more –
EXHIBIT D
REVENUE AND OPERATING EARNINGS BY SEGMENT - (UNAUDITED)
DOLLARS IN MILLIONS
Six Months Ended
Variance
June 29, 2025
June 30, 2024
$
%
Revenue:
Aerospace
$
6,088
$
5,024
$
1,064
21.2
%
Marine Systems
7,809
6,784
1,025
15.1
%
Combat Systems
4,459
4,390
69
1.6
%
Technologies
6,908
6,509
399
6.1
%
Total
$
25,264
$
22,707
$
2,557
11.3
%
Operating earnings:
Aerospace
$
835
$
574
$
261
45.5
%
Marine Systems
541
477
64
13.4
%
Combat Systems
615
595
20
3.4
%
Technologies
660
615
45
7.3
%
Corporate
(78)
(69)
(9)
(13.0)
%
Total
$
2,573
$
2,192
$
381
17.4
%
Operating margin:
Aerospace
13.7
%
11.4
%
Marine Systems
6.9
%
7.0
%
Combat Systems
13.8
%
13.6
%
Technologies
9.6
%
9.4
%
Total
10.2
%
9.7
%
– more –
EXHIBIT E
CONSOLIDATED BALANCE SHEET
DOLLARS IN MILLIONS
(Unaudited)
June 29, 2025
December 31, 2024
ASSETS
Current assets:
Cash and equivalents
$
1,523
$
1,697
Accounts receivable
3,613
2,977
Unbilled receivables
8,412
8,248
Inventories
9,889
9,724
Other current assets
1,629
1,740
Total current assets
25,066
24,386
Noncurrent assets:
Property, plant and equipment, net
6,556
6,467
Intangible assets, net
1,437
1,520
Goodwill
20,876
20,556
Other assets
2,953
2,951
Total noncurrent assets
31,822
31,494
Total assets
$
56,888
$
55,880
LIABILITIES AND SHAREHOLDERS’ EQUITY
Current liabilities:
Short-term debt and current portion of long-term debt
$
1,204
$
1,502
Accounts payable
3,078
3,344
Customer advances and deposits
10,678
9,491
Other current liabilities
3,419
3,487
Total current liabilities
18,379
17,824
Noncurrent liabilities:
Long-term debt
7,508
7,260
Other liabilities
7,421
8,733
Total noncurrent liabilities
14,929
15,993
Shareholders’ equity:
Common stock
482
482
Surplus
4,173
4,062
Retained earnings
42,695
41,487
Treasury stock
(22,975)
(22,450)
Accumulated other comprehensive loss
(795)
(1,518)
Total shareholders’ equity
23,580
22,063
Total liabilities and shareholders’ equity
$
56,888
$
55,880
– more –
EXHIBIT F
CONSOLIDATED STATEMENT OF CASH FLOWS - (UNAUDITED)
DOLLARS IN MILLIONS
Six Months Ended
June 29, 2025
June 30, 2024
Cash flows from operating activities—continuing operations:
Net earnings
$
2,008
$
1,704
Adjustments to reconcile net earnings to net cash from operating activities:
Depreciation of property, plant and equipment
325
311
Amortization of intangible and finance lease right-of-use assets
121
117
Equity-based compensation expense
89
87
Deferred income tax benefit
(98)
(90)
(Increase) decrease in assets, net of effects of business acquisitions:
Accounts receivable
(612)
(158)
Unbilled receivables
(200)
(601)
Inventories
(207)
(1,152)
Increase (decrease) in liabilities, net of effects of business acquisitions:
Accounts payable
(261)
(125)
Customer advances and deposits
106
169
Other, net
179
274
Net cash provided by operating activities
1,450
536
Cash flows from investing activities:
Capital expenditures
(340)
(360)
Other, net
124
53
Net cash used by investing activities
(216)
(307)
Cash flows from financing activities:
Repayment of fixed-rate notes
(1,500)
—
Proceeds from fixed-rate notes
747
—
Proceeds from commercial paper, net
696
—
Dividends paid
(785)
(750)
Purchases of common stock
(600)
(139)
Other, net
39
111
Net cash used by financing activities
(1,403)
(778)
Net cash used by discontinued operations
(5)
(2)
Net decrease in cash and equivalents
(174)
(551)
Cash and equivalents at beginning of period
1,697
1,913
Cash and equivalents at end of period
$
1,523
$
1,362
– more –
EXHIBIT G
ADDITIONAL FINANCIAL INFORMATION - (UNAUDITED)
DOLLARS IN MILLIONS, EXCEPT PER SHARE AMOUNTS
Other Financial Information:
June 29, 2025
December 31, 2024
Debt-to-equity (a)
36.9
%
39.7
%
Book value per share (b)
$
87.66
$
81.61
Shares outstanding
268,993,342
270,340,502
Second Quarter
Six Months
2025
2024
2025
2024
Income tax (payments) refunds, net
$
(202)
$
81
$
(236)
$
48
Company-sponsored research and development (c)
$
119
$
147
$
220
$
284
Return on sales (d)
7.8
%
7.6
%
7.9
%
7.5
%
Non-GAAP Financial Measures:
Second Quarter
Six Months
2025
2024
2025
2024
Free cash flow:
Net cash provided by operating activities
$
1,598
$
814
$
1,450
$
536
Capital expenditures
(198)
(201)
(340)
(360)
Free cash flow (e)
$
1,400
$
613
$
1,110
$
176
June 29, 2025
December 31, 2024
Net debt:
Total debt
$
8,712
$
8,762
Less cash and equivalents
1,523
1,697
Net debt (f)
$
7,189
$
7,065
(a)Debt-to-equity ratio is calculated as total debt divided by total equity as of the end of the period.
(b)Book value per share is calculated as total equity divided by total outstanding shares as of the end of the period.
(c)Includes independent research and development and Aerospace product-development costs.
(d)Return on sales is calculated as net earnings divided by revenue.
(e)We define free cash flow as net cash from operating activities less capital expenditures. We believe free cash flow is a useful measure for investors because it portrays our ability to generate cash from our businesses for purposes such as repaying debt, funding business acquisitions, repurchasing our common stock and paying dividends. We use free cash flow to assess the quality of our earnings and as a key performance measure in evaluating management.
(f)We define net debt as short- and long-term debt (total debt) less cash and equivalents. We believe net debt is a useful measure for investors because it reflects the borrowings that support our operations and capital deployment strategy. We use net debt as an important indicator of liquidity and financial position.
– more –
EXHIBIT H
BACKLOG - (UNAUDITED)
DOLLARS IN MILLIONS
Funded
Unfunded
Total Backlog
Estimated
Potential
Contract Value*
Total Estimated Contract Value
Second Quarter 2025:
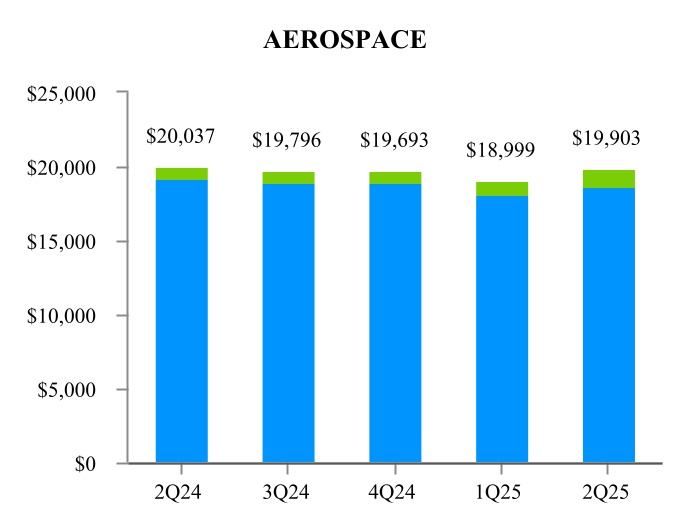
Aerospace
$
18,676
$
1,227
$
19,903
$
1,165
$
21,068
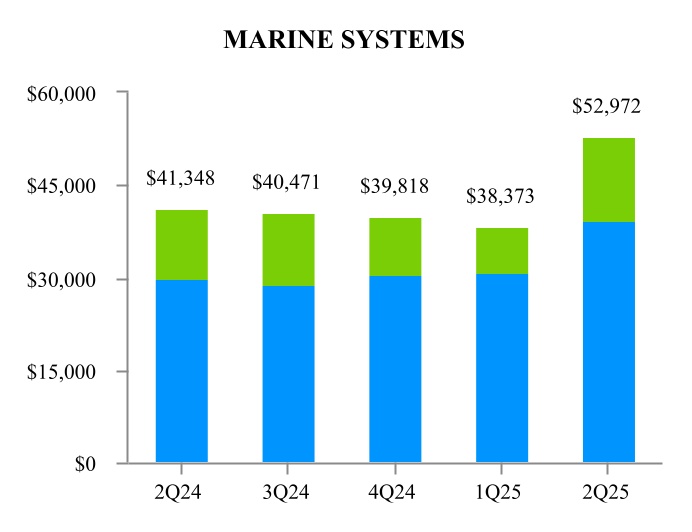
Marine Systems
39,298
13,674
52,972
14,708
67,680
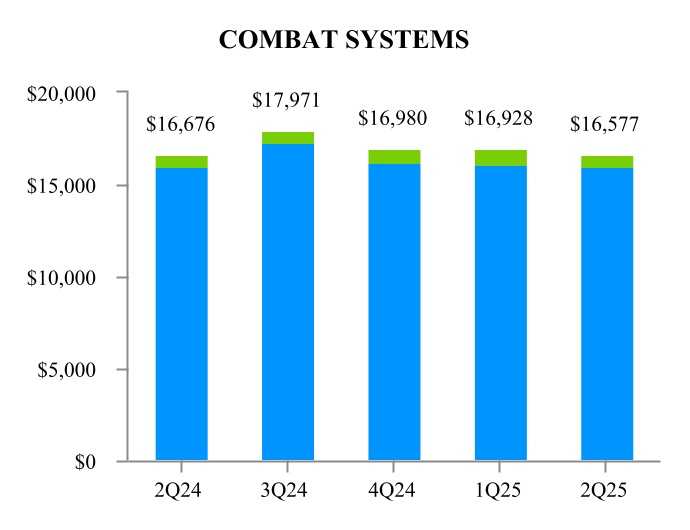
Combat Systems
15,961
616
16,577
9,592
26,169
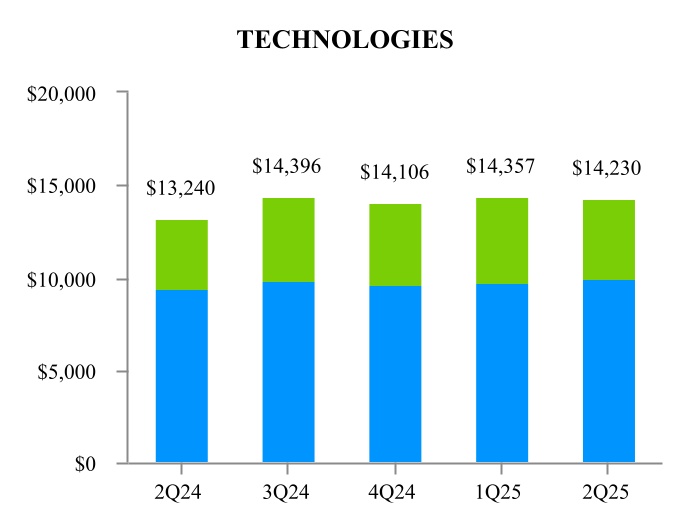
Technologies
9,945
4,285
14,230
32,011
46,241
Total
$
83,880
$
19,802
$
103,682
$
57,476
$
161,158
First Quarter 2025:
Aerospace
$
18,171
$
828
$
18,999
$
1,090
$
20,089
Marine Systems
30,882
7,491
38,373
10,261
48,634
Combat Systems
16,129
799
16,928
8,649
25,577
Technologies
9,751
4,606
14,357
32,670
47,027
Total
$
74,933
$
13,724
$
88,657
$
52,670
$
141,327
Second Quarter 2024:
Aerospace
$
19,126
$
911
$
20,037
$
372
$
20,409
Marine Systems
29,912
11,436
41,348
3,983
45,331
Combat Systems
16,003
673
16,676
5,816
22,492
Technologies
9,365
3,875
13,240
28,283
41,523
Total
$
74,406
$
16,895
$
91,301
$
38,454
$
129,755
*The estimated potential contract value includes work awarded on unfunded indefinite delivery, indefinite quantity (IDIQ) contracts and unexercised options associated with existing firm contracts, including options and other agreements with existing customers to purchase new aircraft and aircraft services. We recognize options in backlog when the customer exercises the option and establishes a firm order. For IDIQ contracts, we evaluate the amount of funding we expect to receive and include this amount in our estimated potential contract value. The actual amount of funding received in the future may be higher or lower than our estimate of potential contract value.
– more –
EXHIBIT H-1
BACKLOG - (UNAUDITED)
DOLLARS IN MILLIONS
Funded Backlog
Unfunded Backlog
– more –
EXHIBIT H-2
BACKLOG BY SEGMENT - (UNAUDITED)
DOLLARS IN MILLIONS
Funded Backlog
Unfunded Backlog
– more –
EXHIBIT I
AEROSPACE SUPPLEMENTAL DATA - (UNAUDITED)
DOLLARS IN MILLIONS
Second Quarter
Six Months
2025
2024
2025
2024
Gulfstream Aircraft Deliveries (units):
Large-cabin aircraft
32
31
62
52
Mid-cabin aircraft
6
6
12
9
Total
38
37
74
61
Aerospace Book-to-Bill:
Orders*
$
4,003
$
2,673
$
6,364
$
5,099
Revenue
3,062
2,940
6,088
5,024
Book-to-Bill Ratio
1.3x
0.9x
1.0x
1.0x
*Does not include customer defaults, liquidated damages, cancellations, foreign exchange fluctuations and other backlog adjustments.