.2 Ally Financial Inc. 4Q 2025 Earnings Review January 21, 2026 Contact Ally Investor Relations at (866) 710-4623 or investor.relations@ally.com
4Q 2025 Preliminary Results Forward-Looking Statements and Additional Information This presentation and related communications should be read in conjunction with the financial statements, notes, and other information contained in our Annual Reports on Form 10-K, Quarterly Reports on Form 10-Q, and Current Reports on Form 8-K. This information is preliminary and based on company and third-party data available at the time of the presentation or related communication. This presentation and related communications contain forward-looking statements within the meaning of the Private Securities Litigation Reform Act of 1995. These statements can be identified by the fact that they do not relate strictly to historical or current facts—such as statements about the outlook for financial and operating metrics and performance and future capital allocation and actions. Forward-looking statements often use words such as “believe,” “expect,” “anticipate,” “intend,” “pursue,” “seek,” “continue,” “estimate,” “project,” “outlook,” “forecast,” “potential,” “target,” “objective,” “trend,” “plan,” “goal,” “initiative,” “priorities,” or other words of comparable meaning or future-tense or conditional verbs such as “may,” “will,” “should,” “would,” or “could.” Forward-looking statements convey our expectations, intentions, or forecasts about future events, circumstances, or results. All forward-looking statements, by their nature, are subject to assumptions, risks, and uncertainties, which may change over time and many of which are beyond our control. In particular, forward-looking statements about Ally’s outlook, including expectations regarding net interest margin, adjusted other revenue, net-charge offs, non-interest expenses and average earning assets, and other forward-looking statements are based on our current expectations and are subject to various important factors that could cause actual results to differ materially, including general economic conditions, expectations regarding interest rates and inflation, monetary and fiscal policies in the United States and other jurisdictions, the composition of our balance sheet, including with respect to our loan and securities portfolios, the impact of our strategic initiatives, including recent initiatives involving our Credit Card and Mortgage operations, demand for new and used vehicles, demand for auto loans and leases and the impact of escalating tariffs and other trade policies on us, our customers and our strategic partners, and the economic impacts, volatility and uncertainty resulting therefrom. You should not rely on any forward-looking statement as a prediction or guarantee about the future. Actual future objectives, strategies, plans, prospects, performance, conditions, or results may differ materially from those set forth in any forward-looking statement. Some of the factors that may cause actual results or other future events or circumstances to differ from those in forward-looking statements are described above and in our Annual Report on Form 10-K for the year ended December 31, 2024, our subsequent Quarterly Reports on Form 10-Q or Current Reports on Form 8-K, or other applicable documents that are filed or furnished with the U.S. Securities and Exchange Commission (collectively, our “SEC filings”). Any forward-looking statement made by us or on our behalf speaks only as of the date that it was made. We do not undertake to update any forward-looking statement to reflect the impact of events, circumstances, or results that arise after the date that the statement was made, except as required by applicable securities laws. You, however, should consult further disclosures (including disclosures of a forward-looking nature) that we may make in any subsequent SEC filings. This presentation and related communications contain specifically identified non-GAAP financial measures, which supplement the results that are reported according to U.S. generally accepted accounting principles (“GAAP”). These non-GAAP financial measures may be useful to investors but should not be viewed in isolation from, or as a substitute for, GAAP results. Differences between non-GAAP financial measures and comparable GAAP financial measures are reconciled in the presentation. This document also includes forward-looking non-GAAP financial measures, such as outlooks for Net Interest Margin (ex. OID), Adjusted Other Revenue and Adjusted Noninterest Expense. We are unable to provide a reconciliation of these forward-looking non-GAAP financial measures to their most directly comparable GAAP financial measures because we are unable to provide, without unreasonable effort, a meaningful or accurate calculation or estimation of amounts that would be necessary for the reconciliation due to the inherent difficulty in forecasting and quantifying the occurrence and financial impact of various items that have not yet occurred, are out of our control or cannot be reasonably predicted. Forward- looking non-GAAP financial measures may vary materially from the corresponding GAAP financial measures. Unless the context otherwise requires, the following definitions apply. The term “loans” means the following consumer and commercial products associated with our direct and indirect financing activities: loans, retail installment sales contracts, lines of credit, and other financing products excluding operating leases. The term “operating leases” means consumer- and commercial-vehicle lease agreements where Ally is the lessor and the lessee is generally not obligated to acquire ownership of the vehicle at lease-end or compensate Ally for the vehicle’s residual value. The terms “lend,” “finance,” and “originate” mean our direct extension or origination of loans, our purchase or acquisition of loans, or our purchase of operating leases, as applicable. The term “consumer” means all consumer products associated with our loan and operating-lease activities and all commercial retail installment sales contracts. The term “commercial” means all commercial products associated with our loan activities, other than commercial retail installment sales contracts. The term “partnerships” means business arrangements rather than partnerships as defined by law. 2
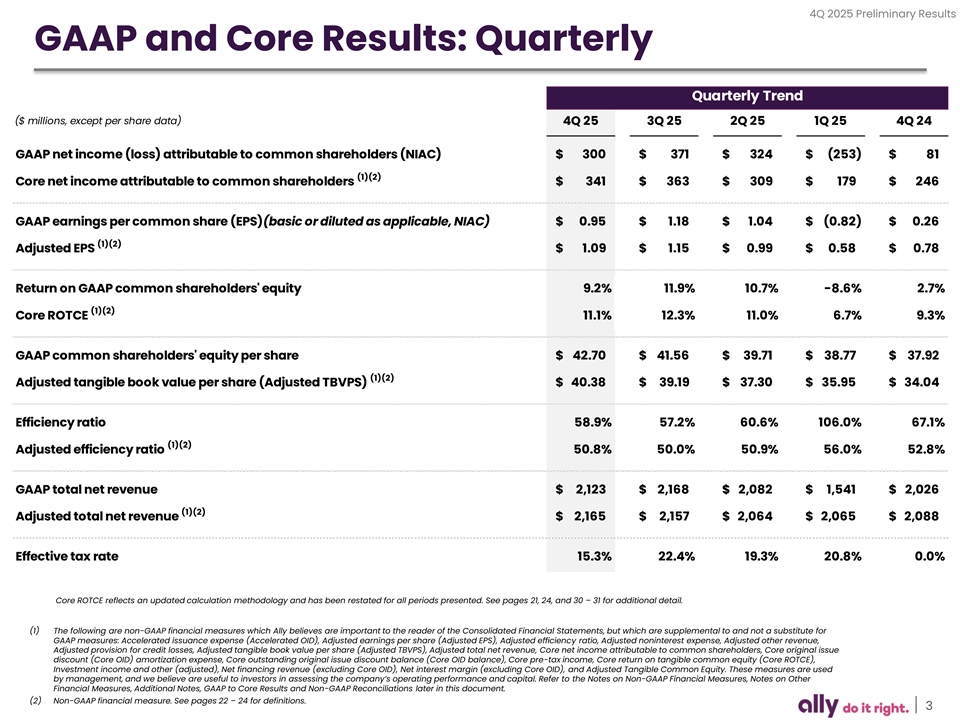
4Q 2025 Preliminary Results GAAP and Core Results: Quarterly Quarterly Trend ($ millions, except per share data) 4Q 25 3Q 25 2Q 25 1Q 25 4Q 24 GAAP net income (loss) attributable to common shareholders (NIAC) $ 300 $ 371 $ 3 24 $ (253) $ 81 (1)(2) Core net income attributable to common shareholders $ 341 $ 3 63 $ 309 $ 179 $ 246 GAAP earnings per common share (EPS)(basic or diluted as applicable, NIAC) $ 0.95 $ 1.18 $ 1.04 $ ( 0.82) $ 0.26 (1)(2) Adjusted EPS $ 1.09 $ 1.15 $ 0.99 $ 0 .58 $ 0.78 Return on GAAP common shareholders' equity 9.2% 11.9% 10.7% -8.6% 2.7% (1)(2) Core ROTCE 11.1% 12.3% 11.0% 6.7% 9.3% GAAP common shareholders' equity per share $ 42.70 $ 4 1.56 $ 39.71 $ 38.77 $ 37.92 (1)(2) Adjusted tangible book value per share (Adjusted TBVPS) $ 40.38 $ 3 9.19 $ 3 7.30 $ 35.95 $ 34.04 Efficiency ratio 58.9% 57.2% 60.6% 106.0% 67.1% (1)(2) Adjusted efficiency ratio 50.8% 50.0% 50.9% 56.0% 52.8% GAAP total net revenue $ 2,123 $ 2,168 $ 2,082 $ 1,541 $ 2,026 (1)(2) Adjusted total net revenue $ 2,165 $ 2,157 $ 2,064 $ 2,065 $ 2 ,088 Effective tax rate 15.3% 22.4% 19.3% 20.8% 0.0% Core ROTCE reflects an updated calculation methodology and has been restated for all periods presented. See pages 21, 24, and 30 – 31 for additional detail. (1) The following are non-GAAP financial measures which Ally believes are important to the reader of the Consolidated Financial Statements, but which are supplemental to and not a substitute for GAAP measures: Accelerated issuance expense (Accelerated OID), Adjusted earnings per share (Adjusted EPS), Adjusted efficiency ratio, Adjusted noninterest expense, Adjusted other revenue, Adjusted provision for credit losses, Adjusted tangible book value per share (Adjusted TBVPS), Adjusted total net revenue, Core net income attributable to common shareholders, Core original issue discount (Core OID) amortization expense, Core outstanding original issue discount balance (Core OID balance), Core pre-tax income, Core return on tangible common equity (Core ROTCE), Investment income and other (adjusted), Net financing revenue (excluding Core OID), Net interest margin (excluding Core OID), and Adjusted Tangible Common Equity. These measures are used by management, and we believe are useful to investors in assessing the company’s operating performance and capital. Refer to the Notes on Non-GAAP Financial Measures, Notes on Other Financial Measures, Additional Notes, GAAP to Core Results and Non-GAAP Reconciliations later in this document. (2) Non-GAAP financial measure. See pages 22 – 24 for definitions. 3
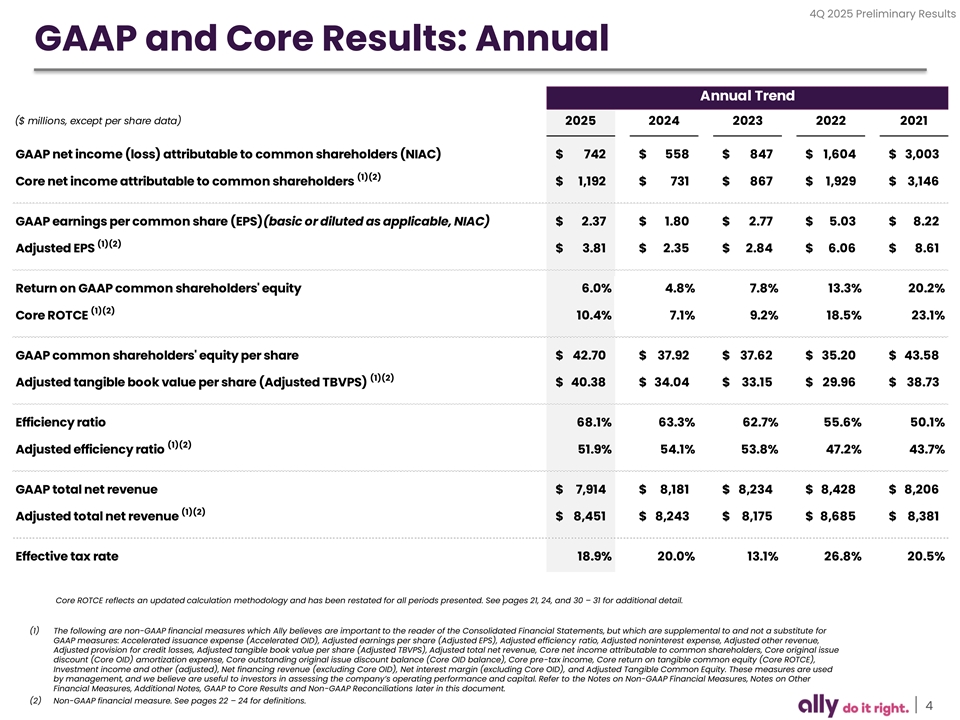
4Q 2025 Preliminary Results GAAP and Core Results: Annual Annual Trend ($ millions, except per share data) 2025 2024 2023 2022 2021 GAAP net income (loss) attributable to common shareholders (NIAC) $ 742 $ 558 $ 847 $ 1,604 $ 3,003 (1)(2) Core net income attributable to common shareholders $ 1 ,192 $ 731 $ 8 67 $ 1 ,929 $ 3,146 GAAP earnings per common share (EPS)(basic or diluted as applicable, NIAC) $ 2.37 $ 1.80 $ 2.77 $ 5.03 $ 8.22 (1)(2) Adjusted EPS $ 3.81 $ 2.35 $ 2.84 $ 6.06 $ 8.61 Return on GAAP common shareholders' equity 6.0% 4.8% 7.8% 13.3% 20.2% (1)(2) Core ROTCE 10.4% 7.1% 9.2% 18.5% 23.1% GAAP common shareholders' equity per share $ 42.70 $ 37.92 $ 37.62 $ 35.20 $ 43.58 (1)(2) Adjusted tangible book value per share (Adjusted TBVPS) $ 4 0.38 $ 34.04 $ 33.15 $ 29.96 $ 3 8.73 Efficiency ratio 68.1% 63.3% 62.7% 55.6% 50.1% (1)(2) Adjusted efficiency ratio 51.9% 54.1% 53.8% 47.2% 43.7% GAAP total net revenue $ 7, 914 $ 8,181 $ 8,234 $ 8 ,428 $ 8,206 (1)(2) Adjusted total net revenue $ 8 ,451 $ 8,243 $ 8,175 $ 8,685 $ 8,381 Effective tax rate 18.9% 20.0% 13.1% 26.8% 20.5% Core ROTCE reflects an updated calculation methodology and has been restated for all periods presented. See pages 21, 24, and 30 – 31 for additional detail. (1) The following are non-GAAP financial measures which Ally believes are important to the reader of the Consolidated Financial Statements, but which are supplemental to and not a substitute for GAAP measures: Accelerated issuance expense (Accelerated OID), Adjusted earnings per share (Adjusted EPS), Adjusted efficiency ratio, Adjusted noninterest expense, Adjusted other revenue, Adjusted provision for credit losses, Adjusted tangible book value per share (Adjusted TBVPS), Adjusted total net revenue, Core net income attributable to common shareholders, Core original issue discount (Core OID) amortization expense, Core outstanding original issue discount balance (Core OID balance), Core pre-tax income, Core return on tangible common equity (Core ROTCE), Investment income and other (adjusted), Net financing revenue (excluding Core OID), Net interest margin (excluding Core OID), and Adjusted Tangible Common Equity. These measures are used by management, and we believe are useful to investors in assessing the company’s operating performance and capital. Refer to the Notes on Non-GAAP Financial Measures, Notes on Other Financial Measures, Additional Notes, GAAP to Core Results and Non-GAAP Reconciliations later in this document. (2) Non-GAAP financial measure. See pages 22 – 24 for definitions. 4
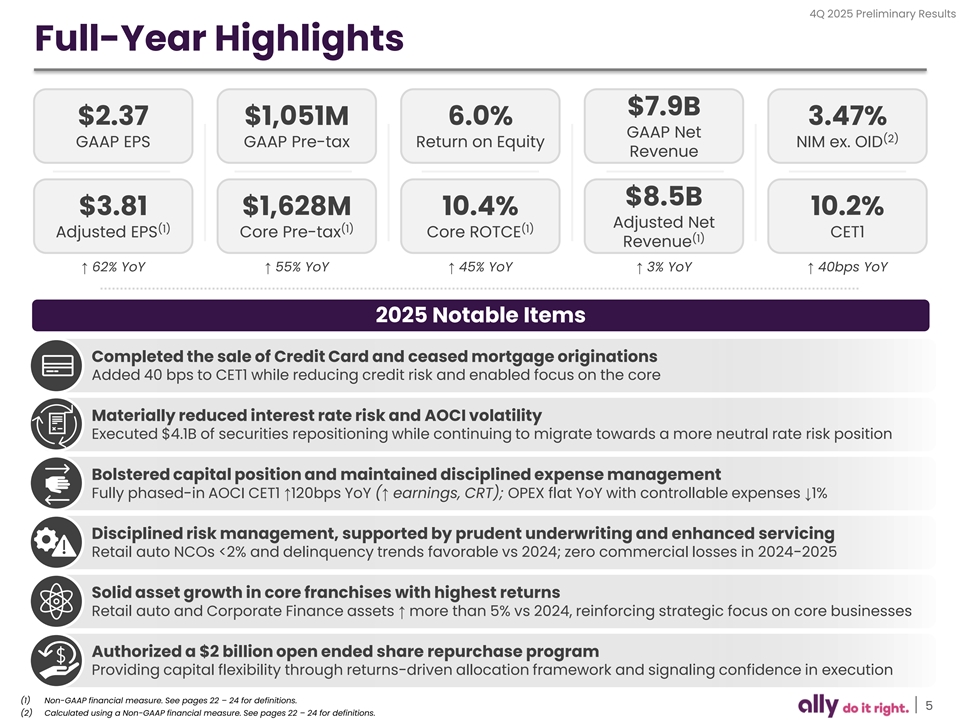
4Q 2025 Preliminary Results Full-Year Highlights $7.9B $2.37 $1,051M 6.0% 3.47% GAAP Net (2) GAAP EPS GAAP Pre-tax Return on Equity NIM ex. OID Revenue $8.5B $3.81 $1,628M 10.4% 10.2% Adjusted Net (1) (1) (1) Adjusted EPS Core Pre-tax Core ROTCE CET1 (1) Revenue ↑ 62% YoY↑ 55% YoY↑ 45% YoY↑ 3% YoY↑ 40bps YoY 2025 Notable Items Completed the sale of Credit Card and ceased mortgage originations Added 40 bps to CET1 while reducing credit risk and enabled focus on the core Materially reduced interest rate risk and AOCI volatility Executed $4.1B of securities repositioning while continuing to migrate towards a more neutral rate risk position Bolstered capital position and maintained disciplined expense management Fully phased-in AOCI CET1 ↑120bps YoY (↑ earnings, CRT); OPEX flat YoY with controllable expenses ↓1% Disciplined risk management, supported by prudent underwriting and enhanced servicing Retail auto NCOs <2% and delinquency trends favorable vs 2024; zero commercial losses in 2024-2025 Solid asset growth in core franchises with highest returns Retail auto and Corporate Finance assets ↑ more than 5% vs 2024, reinforcing strategic focus on core businesses Authorized a $2 billion open ended share repurchase program Providing capital flexibility through returns-driven allocation framework and signaling confidence in execution (1) Non-GAAP financial measure. See pages 22 – 24 for definitions. 5 (2) Calculated using a Non-GAAP financial measure. See pages 22 – 24 for definitions.
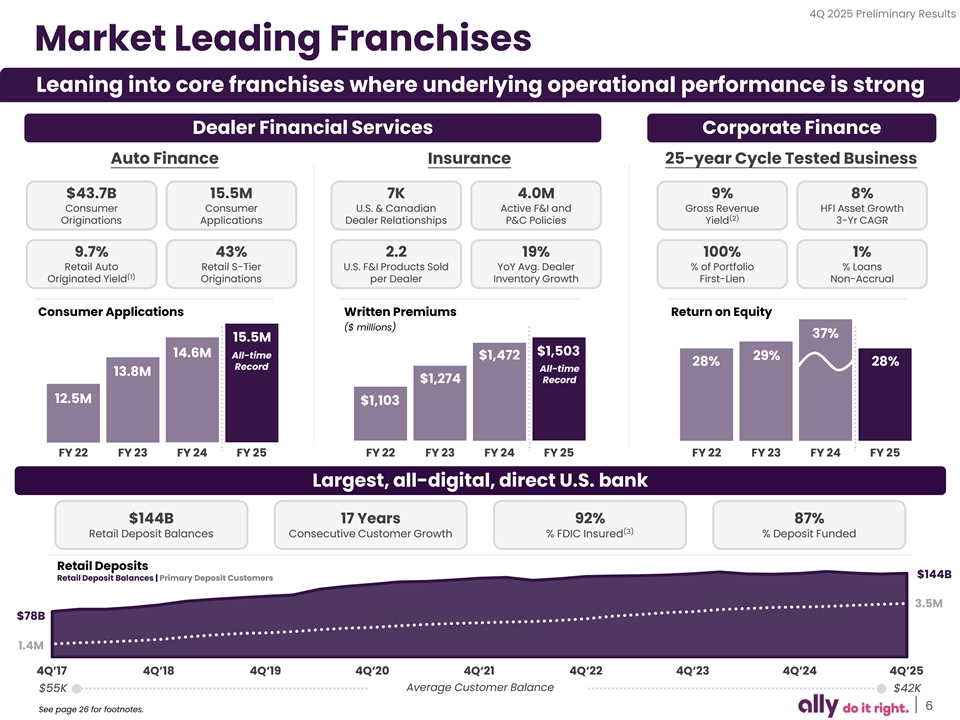
4Q 2025 Preliminary Results Market Leading Franchises Leaning into core franchises where underlying operational performance is strong Dealer Financial Services Corporate Finance Auto Finance Insurance 25-year Cycle Tested Business $43.7B 15.5M 7K 4.0M 9% 8% Consumer Consumer U.S. & Canadian Active F&I and Gross Revenue HFI Asset Growth (2) Originations Applications Dealer Relationships P&C Policies Yield 3-Yr CAGR 9.7% 43% 2.2 19% 100% 1% Retail Auto Retail S-Tier U.S. F&I Products Sold YoY Avg. Dealer % of Portfolio % Loans (1) Originated Yield Originations per Dealer Inventory Growth First-Lien Non-Accrual Consumer Applications Written Premiums Return on Equity ($ millions) 37% 15.5M $1,503 14.6M All-time $1,472 29% 28% 28% Record All-time 13.8M Record $1,274 12.5M $1,103 FY 22 FY 23 FY 24 FY 25 FY 22 FY 23 FY 24 FY 25 FY 22 FY 23 FY 24 FY 25 Largest, all-digital, direct U.S. bank $144B 17 Years 92% 87% (3) Retail Deposit Balances Consecutive Customer Growth % FDIC Insured % Deposit Funded Retail Deposits $144B Retail Deposit Balances | Primary Deposit Customers 3.5M $78B 1.4M 4Q’17 4Q’18 4Q‘19 4Q‘20 4Q‘21 4Q‘22 4Q‘23 4Q’24 4Q’25 Average Customer Balance $55K $42K 6 See page 26 for footnotes.
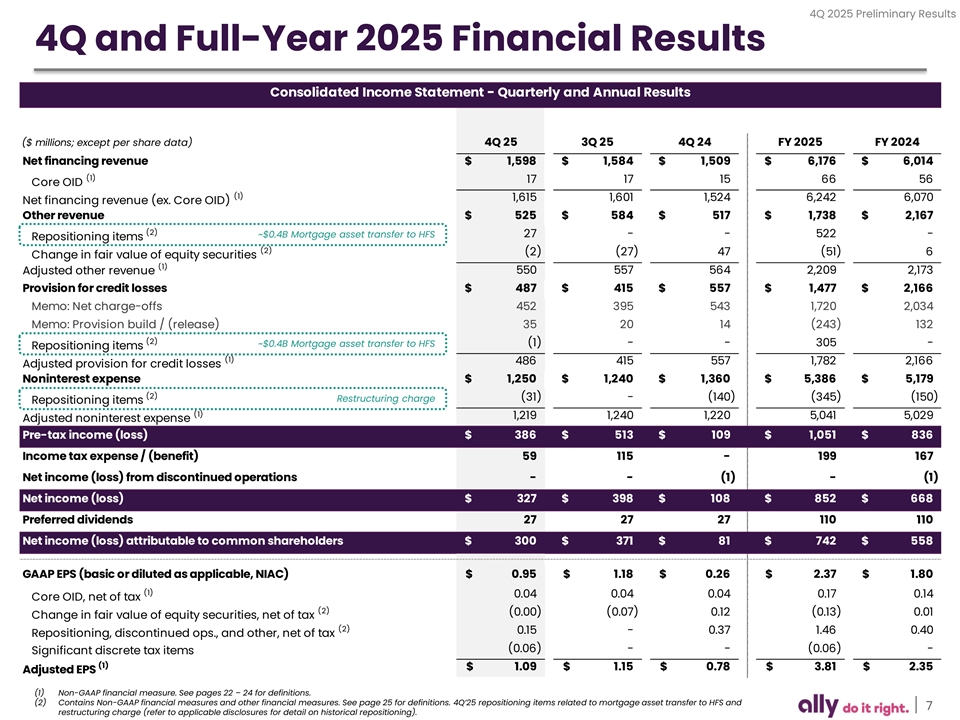
4Q 2025 Preliminary Results 4Q and Full-Year 2025 Financial Results Consolidated Income Statement - Quarterly and Annual Results ($ millions; except per share data) 4Q 25 3Q 25 4Q 24 FY 2025 FY 2024 Net financing revenue $ 1,598 $ 1 ,584 $ 1,509 $ 6,176 $ 6 ,014 (1) 17 17 15 66 56 Core OID (1) 1,615 1,601 1,524 6,242 6 ,070 Net financing revenue (ex. Core OID) Other revenue $ 525 $ 584 $ 517 $ 1,738 $ 2,167 (2) ~$0.4B Mortgage asset transfer to HFS 27 - - 522 - Repositioning items (2) (2) (27) 47 (51) 6 Change in fair value of equity securities (1) 550 557 564 2 ,209 2 ,173 Adjusted other revenue Provision for credit losses $ 487 $ 415 $ 557 $ 1,477 $ 2,166 Memo: Net charge-offs 4 52 395 5 43 1 ,720 2,034 Memo: Provision build / (release) 35 20 14 (243) 1 32 (2) ~$0.4B Mortgage asset transfer to HFS (1) - - 305 - Repositioning items (1) 486 415 557 1,782 2,166 Adjusted provision for credit losses Noninterest expense $ 1,250 $ 1,240 $ 1,360 $ 5,386 $ 5 ,179 (2) Restructuring charge (31) - ( 140) (345) (150) Repositioning items (1) 1,219 1 ,240 1,220 5,041 5 ,029 Adjusted noninterest expense Pre-tax income (loss) $ 386 $ 5 13 $ 109 $ 1,051 $ 836 Income tax expense / (benefit) 59 115 - 199 167 Net income (loss) from discontinued operations - - (1) - (1) Net income (loss) $ 327 $ 3 98 $ 108 $ 852 $ 668 Preferred dividends 27 27 27 110 110 Net income (loss) attributable to common shareholders $ 300 $ 371 $ 81 $ 742 $ 558 GAAP EPS (basic or diluted as applicable, NIAC) $ 0.95 $ 1 .18 $ 0 .26 $ 2.37 $ 1.80 (1) 0.04 0.04 0.04 0.17 0.14 Core OID, net of tax (2) (0.00) (0.07) 0.12 (0.13) 0.01 Change in fair value of equity securities, net of tax (2) 0.15 - 0.37 1 .46 0.40 Repositioning, discontinued ops., and other, net of tax (0.06) - - (0.06) - Significant discrete tax items (1) $ 1 .09 $ 1 .15 $ 0 .78 $ 3.81 $ 2.35 Adjusted EPS (1) Non-GAAP financial measure. See pages 22 – 24 for definitions. (2) Contains Non-GAAP financial measures and other financial measures. See page 25 for definitions. 4Q’25 repositioning items related to mortgage asset transfer to HFS and 7 restructuring charge (refer to applicable disclosures for detail on historical repositioning).
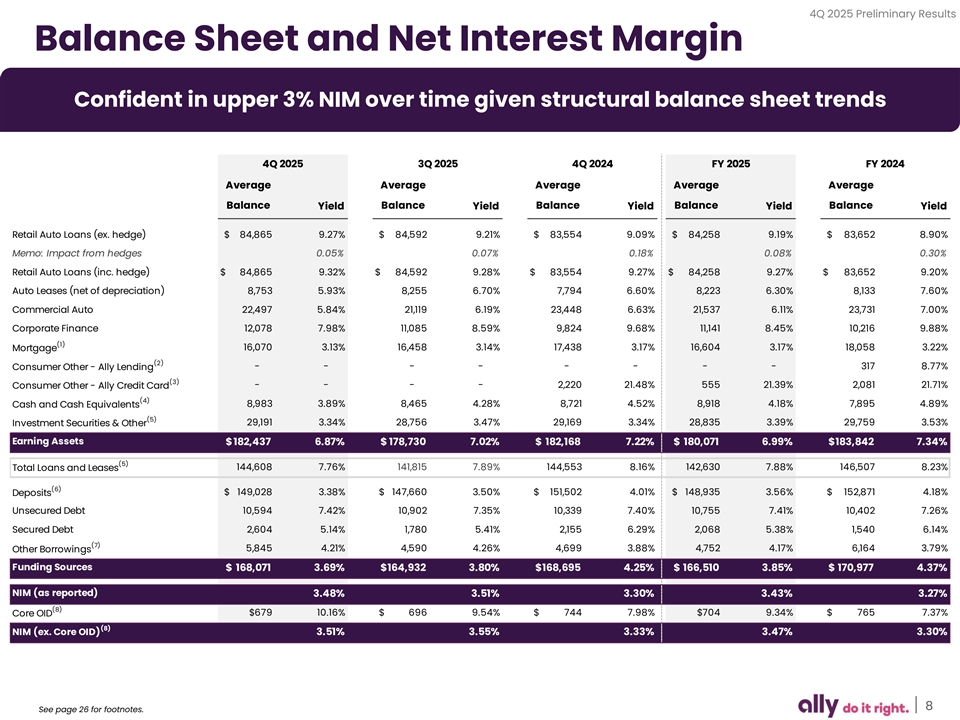
4Q 2025 Preliminary Results Balance Sheet and Net Interest Margin Confident in upper 3% NIM over time given structural balance sheet trends 4Q 2025 3Q 2025 4Q 2024 FY 2025 FY 2024 Average Average Average Average Average Balance Yield Balance Yield Balance Yield Balance Yield Balance Yield Retail Auto Loans (ex. hedge) $ 84,865 9.27% $ 84,592 9.21% $ 83,554 9.09% $ 84,258 9.19% $ 83,652 8.90% Memo: Impact from hedges 0.05% 0.07% 0.18% 0.08% 0.30% Retail Auto Loans (inc. hedge) $ 84,865 9.32% $ 84,592 9.28% $ 83,554 9.27% $ 84,258 9.27% $ 83,652 9.20% Auto Leases (net of depreciation) 8,753 5.93% 8,255 6.70% 7,794 6.60% 8,223 6.30% 8,133 7.60% Commercial Auto 22,497 5.84% 21,119 6.19% 23,448 6.63% 21,537 6.11% 23,731 7.00% Corporate Finance 12,078 7.98% 11,085 8.59% 9,824 9.68% 1 1,141 8.45% 10,216 9.88% (1) 16,070 3.13% 16,458 3.14% 17,438 3.17% 1 6,604 3.17% 1 8,058 3.22% Mortgage (2) - - - - - - - - 3 17 8.77% Consumer Other - Ally Lending (3) - - - - 2,220 21.48% 555 21.39% 2 ,081 21.71% Consumer Other - Ally Credit Card (4) 8,983 3.89% 8,465 4.28% 8,721 4.52% 8,918 4.18% 7,895 4.89% Cash and Cash Equivalents (5) 29,191 3.34% 28,756 3.47% 29,169 3.34% 28,835 3.39% 29,759 3.53% Investment Securities & Other Earning Assets $ 182,437 6.87% $ 178,730 7.02% $ 182,168 7.22% $ 180,071 6.99% $ 183,842 7.34% (5) Total Loans and Leases 144,608 7.76% 141,815 7.89% 144,553 8.16% 1 42,630 7.88% 146,507 8.23% (6) Deposits $ 149,028 3.38% $ 147,660 3.50% $ 151,502 4.01% $ 148,935 3.56% $ 1 52,871 4.18% Unsecured Debt 1 0,594 7.42% 10,902 7.35% 10,339 7.40% 10,755 7.41% 10,402 7.26% Secured Debt 2,604 5.14% 1 ,780 5.41% 2 ,155 6.29% 2,068 5.38% 1,540 6.14% (7) Other Borrowings 5,845 4.21% 4,590 4.26% 4,699 3.88% 4 ,752 4.17% 6,164 3.79% Funding Sources $ 168,071 3.69% $1 64,932 3.80% $1 68,695 4.25% $ 166,510 3.85% $ 170,977 4.37% NIM (as reported) 3.48% 3.51% 3.30% 3.43% 3.27% (8) $679 10.16% $ 696 9.54% $ 744 7.98% $704 9.34% $ 765 7.37% Core OID (8) NIM (ex. Core OID) 3.51% 3.55% 3.33% 3.47% 3.30% 8 See page 26 for footnotes.
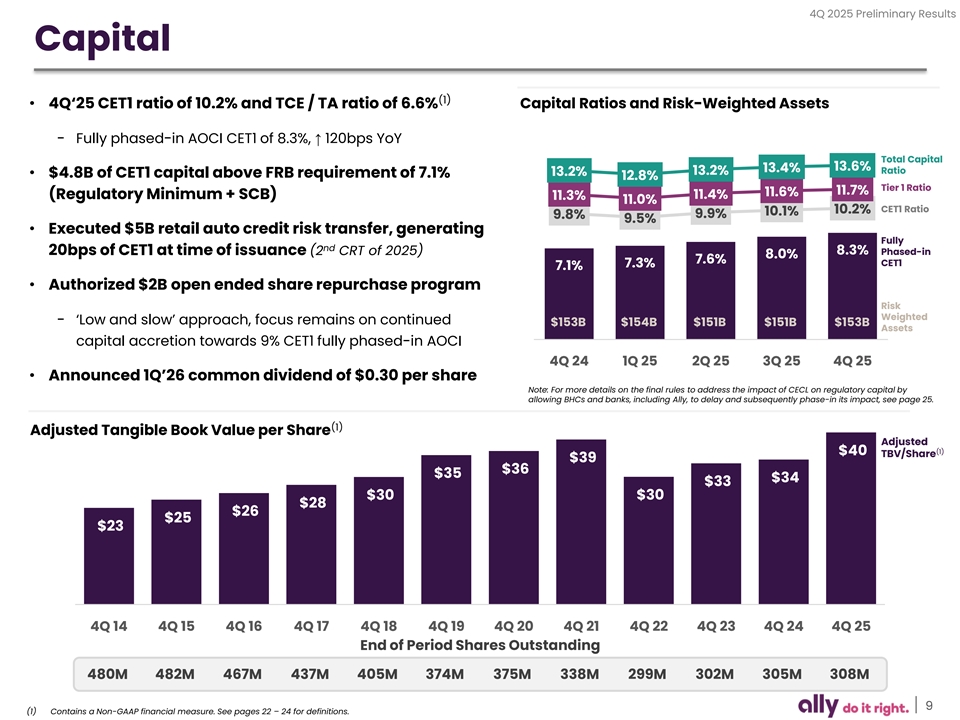
4Q 2025 Preliminary Results Capital (1) • 4Q‘25 CET1 ratio of 10.2% and TCE / TA ratio of 6.6% Capital Ratios and Risk-Weighted Assets − Fully phased-in AOCI CET1 of 8.3%, ↑ 120bps YoY Total Capital 13.6% 13.4% 13.2% Ratio 13.2% • $4.8B of CET1 capital above FRB requirement of 7.1% 12.8% Tier 1 Ratio 11.7% 11.6% 11.4% (Regulatory Minimum + SCB) 11.3% 11.0% CET1 Ratio 10.2% 10.1% 9.8% 9.9% 9.5% • Executed $5B retail auto credit risk transfer, generating Fully nd 8.3% Phased-in 20bps of CET1 at time of issuance (2 CRT of 2025) 8.0% 7.6% CET1 7.3% 7.1% • Authorized $2B open ended share repurchase program Risk Weighted − ‘Low and slow’ approach, focus remains on continued $153B $154B $151B $151B $153B Assets capital accretion towards 9% CET1 fully phased-in AOCI 4Q 24 1Q 25 2Q 25 3Q 25 4Q 25 • Announced 1Q’26 common dividend of $0.30 per share Note: For more details on the final rules to address the impact of CECL on regulatory capital by allowing BHCs and banks, including Ally, to delay and subsequently phase-in its impact, see page 25. (1) Adjusted Tangible Book Value per Share Adjusted (1) $40 TBV/Share $39 $36 $35 $34 $33 $30 $30 $28 $26 $25 $23 4Q 14 4Q 15 4Q 16 4Q 17 4Q 18 4Q 19 4Q 20 4Q 21 4Q 22 4Q 23 4Q 24 4Q 25 End of Period Shares Outstanding 480M 482M 467M 437M 405M 374M 375M 338M 299M 302M 305M 308M 9 (1) Contains a Non-GAAP financial measure. See pages 22 – 24 for definitions.
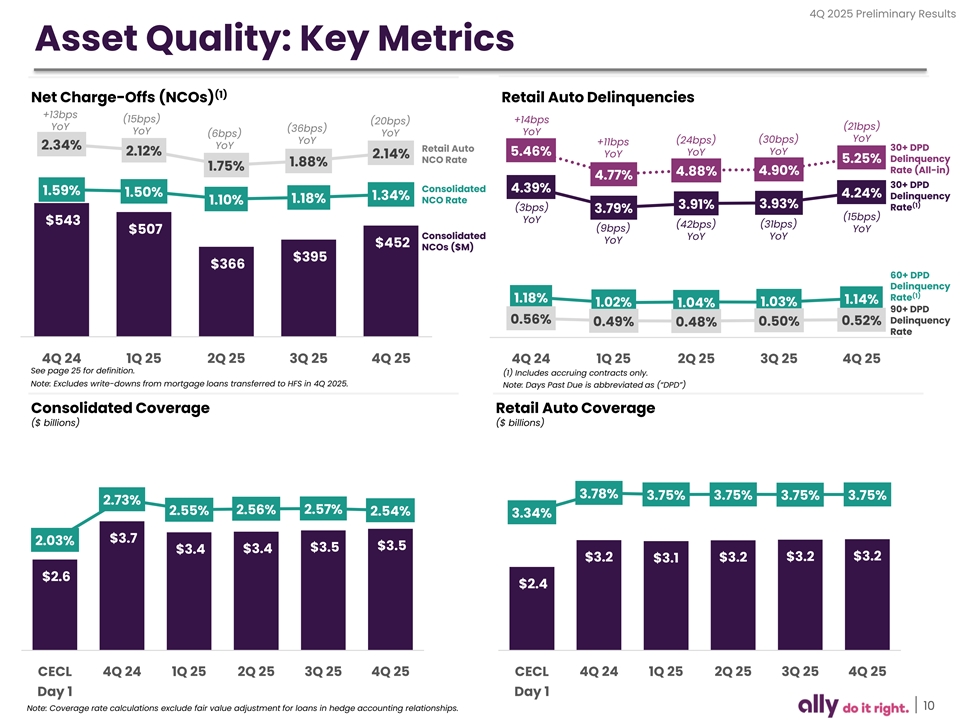
4Q 2025 Preliminary Results Asset Quality: Key Metrics (1) Net Charge-Offs (NCOs) Retail Auto Delinquencies +13bps (15bps) +14bps (20bps) YoY (21bps) (36bps) YoY YoY (6bps) YoY (30bps) YoY YoY (24bps) +11bps 2.34% YoY 30+ DPD Retail Auto YoY 2.12% 5.46% YoY YoY 2.14% NCO Rate 5.25% Delinquency 1.88% 1.75% Rate (All-in) 4.90% 4.88% 4.77% 30+ DPD Consolidated 4.39% 1.59% 1.50% 4.24% 1.34% Delinquency 1.18% NCO Rate 1.10% 3.93% (1) 3.91% (3bps) Rate 3.79% (15bps) YoY $543 (42bps) (31bps) (9bps) YoY $507 Consolidated YoY YoY YoY $452 NCOs ($M) $395 $366 60+ DPD Delinquency (1) Rate 1.18% 1.14% 1.02% 1.03% 1.04% 90+ DPD 0.56% Delinquency 0.52% 0.49% 0.48% 0.50% Rate 4Q 24 1Q 25 2Q 25 3Q 25 4Q 25 4Q 24 1Q 25 2Q 25 3Q 25 4Q 25 See page 25 for definition. (1) Includes accruing contracts only. Note: Excludes write-downs from mortgage loans transferred to HFS in 4Q 2025. Note: Days Past Due is abbreviated as (“DPD”) Consolidated Coverage Retail Auto Coverage ($ billions) ($ billions) 3.78% 3.75% 3.75% 3.75% 3.75% 2.73% 2.56% 2.57% 2.55% 2.54% 3.34% $3.7 2.03% $3.5 $3.5 $3.4 $3.4 $3.2 $3.2 $3.2 $3.1 $3.2 $2.6 $2.4 CECL 4Q 24 1Q 25 2Q 25 3Q 25 4Q 25 CECL 4Q 24 1Q 25 2Q 25 3Q 25 4Q 25 Day 1 Day 1 Note: Coverage rate calculations exclude fair value adjustment for loans in hedge accounting relationships. 10
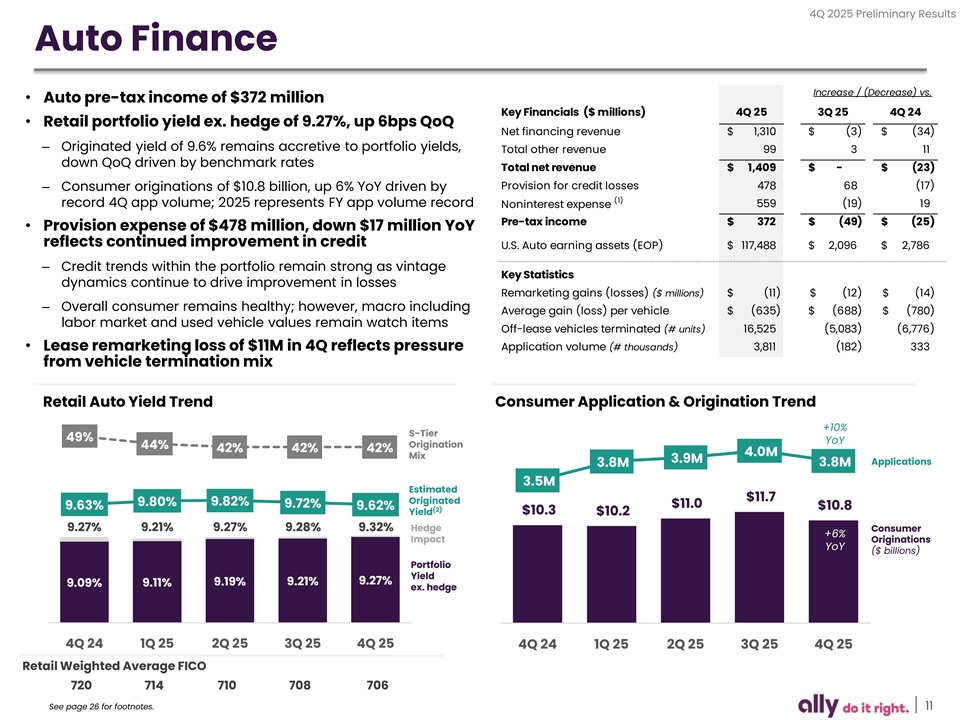
4Q 2025 Preliminary Results Auto Finance Increase / (Decrease) vs. • Auto pre-tax income of $372 million Key Financials ($ millions) 4Q 25 3Q 25 4Q 24 • Retail portfolio yield ex. hedge of 9.27%, up 6bps QoQ Net financing revenue $ 1 ,310 $ (3) $ (34) – Originated yield of 9.6% remains accretive to portfolio yields, Total other revenue 99 3 11 down QoQ driven by benchmark rates Total net revenue $ 1,409 $ - $ (23) Provision for credit losses 4 78 68 (17) – Consumer originations of $10.8 billion, up 6% YoY driven by (1) record 4Q app volume; 2025 represents FY app volume record Noninterest expense 559 (19) 19 Pre-tax income $ 372 $ (49) $ (25) • Provision expense of $478 million, down $17 million YoY reflects continued improvement in credit U.S. Auto earning assets (EOP) $ 117,488 $ 2,096 $ 2 ,786 – Credit trends within the portfolio remain strong as vintage Key Statistics dynamics continue to drive improvement in losses Remarketing gains (losses) ($ millions) $ (11) $ (12) $ ( 14) – Overall consumer remains healthy; however, macro including Average gain (loss) per vehicle $ ( 635) $ ( 688) $ ( 780) labor market and used vehicle values remain watch items Off-lease vehicles terminated (# units) 16,525 (5,083) (6,776) • Lease remarketing loss of $11M in 4Q reflects pressure Application volume (# thousands) 3,811 (182) 333 from vehicle termination mix Retail Auto Yield Trend Consumer Application & Origination Trend +10% S-Tier 49% YoY Origination 44% 42% 42% 42% 4.0M Mix 3.9M Applications 3.8M 3.8M 3.5M Estimated $11.7 Originated 9.82% 9.80% 9.72% $11.0 9.63% 9.62% $10.8 (2) Yield $10.3 $10.2 9.27% 9.21% 9.27% 9.28% 9.32% Hedge Consumer +6% Impact Originations YoY ($ billions) Portfolio Yield 9.19% 9.21% 9.27% 9.09% 9.11% ex. hedge 4Q 24 1Q 25 2Q 25 3Q 25 4Q 25 4Q 24 1Q 25 2Q 25 3Q 25 4Q 25 Retail Weighted Average FICO 720 714 710 708 706 See page 26 for footnotes. 11
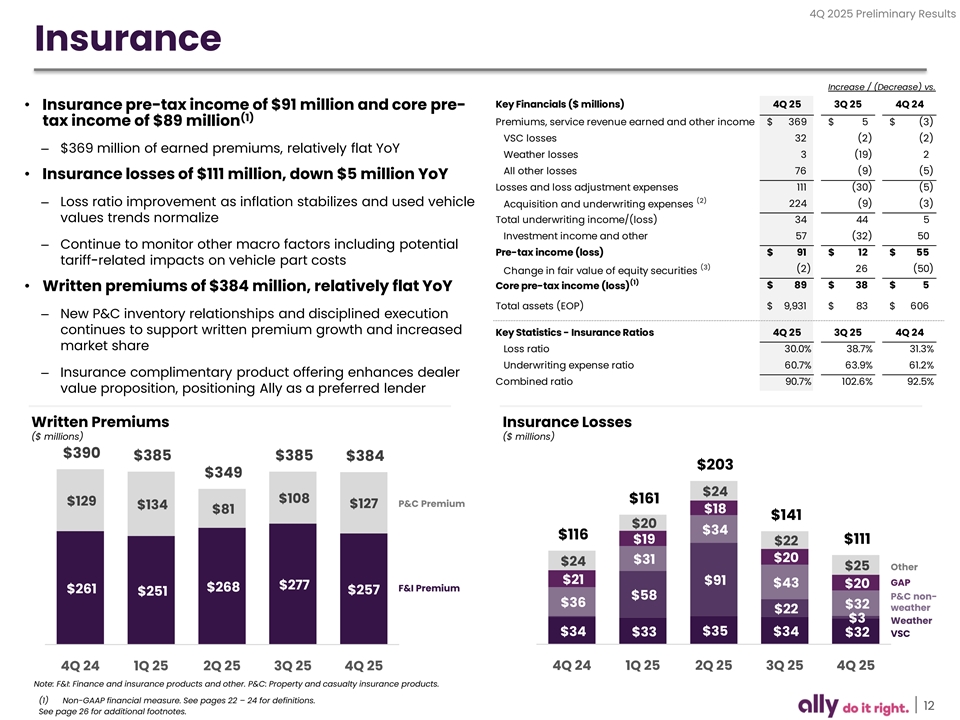
4Q 2025 Preliminary Results Insurance Increase / (Decrease) vs. Key Financials ($ millions) 4Q 25 3Q 25 4Q 24 • Insurance pre-tax income of $91 million and core pre- (1) Premiums, service revenue earned and other income $ 369 $ 5 $ (3) tax income of $89 million VSC losses 32 (2) (2) – $369 million of earned premiums, relatively flat YoY Weather losses 3 ( 19) 2 All other losses 76 (9) (5) • Insurance losses of $111 million, down $5 million YoY Losses and loss adjustment expenses 111 ( 30) (5) (2) – Loss ratio improvement as inflation stabilizes and used vehicle 224 (9) (3) Acquisition and underwriting expenses values trends normalize Total underwriting income/(loss) 34 44 5 Investment income and other 57 (32) 50 – Continue to monitor other macro factors including potential Pre-tax income (loss) $ 91 $ 12 $ 55 tariff-related impacts on vehicle part costs (3) (2) 26 (50) Change in fair value of equity securities (1) $ 89 $ 38 $ 5 Core pre-tax income (loss) • Written premiums of $384 million, relatively flat YoY Total assets (EOP) $ 9,931 $ 83 $ 606 – New P&C inventory relationships and disciplined execution continues to support written premium growth and increased Key Statistics - Insurance Ratios 4Q 25 3Q 25 4Q 24 market share Loss ratio 30.0% 38.7% 31.3% Underwriting expense ratio 60.7% 63.9% 61.2% – Insurance complimentary product offering enhances dealer Combined ratio 90.7% 102.6% 92.5% value proposition, positioning Ally as a preferred lender Written Premiums Insurance Losses ($ millions) ($ millions) $390 $385 $385 $384 $203 $349 $24 $108 $161 $129 P&C Premium $127 $134 $18 $81 $141 $20 $34 $116 $19 $111 $22 $20 $31 $24 $25 Other $21 $91 GAP $43 $20 $277 $268 F&I Premium $261 $257 $251 $58 P&C non- $36 $32 weather $22 $3 Weather $34 $35 $34 $33 $32 VSC 4Q 24 1Q 25 2Q 25 3Q 25 4Q 25 4Q 24 1Q 25 2Q 25 3Q 25 4Q 25 Note: F&I: Finance and insurance products and other. P&C: Property and casualty insurance products. (1) Non-GAAP financial measure. See pages 22 – 24 for definitions. 12 See page 26 for additional footnotes.
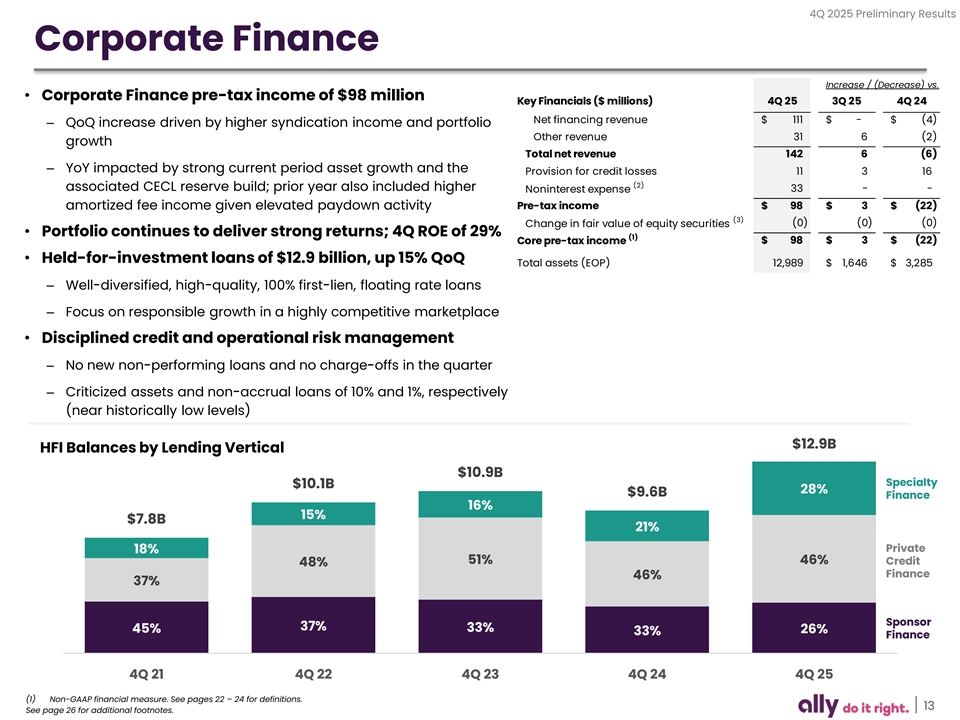
4Q 2025 Preliminary Results Corporate Finance Increase / (Decrease) vs. • Corporate Finance pre-tax income of $98 million Key Financials ($ millions) 4Q 25 3Q 25 4Q 24 Net financing revenue $ 111 $ - $ ( 4) – QoQ increase driven by higher syndication income and portfolio Other revenue 31 6 (2) growth Total net revenue 142 6 (6) – YoY impacted by strong current period asset growth and the Provision for credit losses 11 3 16 (2) associated CECL reserve build; prior year also included higher 33 - - Noninterest expense amortized fee income given elevated paydown activity Pre-tax income $ 98 $ 3 $ (22) (3) (0) (0) (0) Change in fair value of equity securities • Portfolio continues to deliver strong returns; 4Q ROE of 29% (1) Core pre-tax income $ 98 $ 3 $ (22) • Held-for-investment loans of $12.9 billion, up 15% QoQ Total assets (EOP) 12,989 $ 1,646 $ 3,285 – Well-diversified, high-quality, 100% first-lien, floating rate loans – Focus on responsible growth in a highly competitive marketplace • Disciplined credit and operational risk management – No new non-performing loans and no charge-offs in the quarter – Criticized assets and non-accrual loans of 10% and 1%, respectively (near historically low levels) $12.9B HFI Balances by Lending Vertical $10.9B Specialty $10.1B 28% $9.6B Finance 16% 15% $7.8B 21% Private 18% 51% 46% Credit 48% Finance 46% 37% Sponsor 37% 33% 45% 26% 33% Finance 4Q 21 4Q 22 4Q 23 4Q 24 4Q 25 (1) Non-GAAP financial measure. See pages 22 – 24 for definitions. 13 See page 26 for additional footnotes.
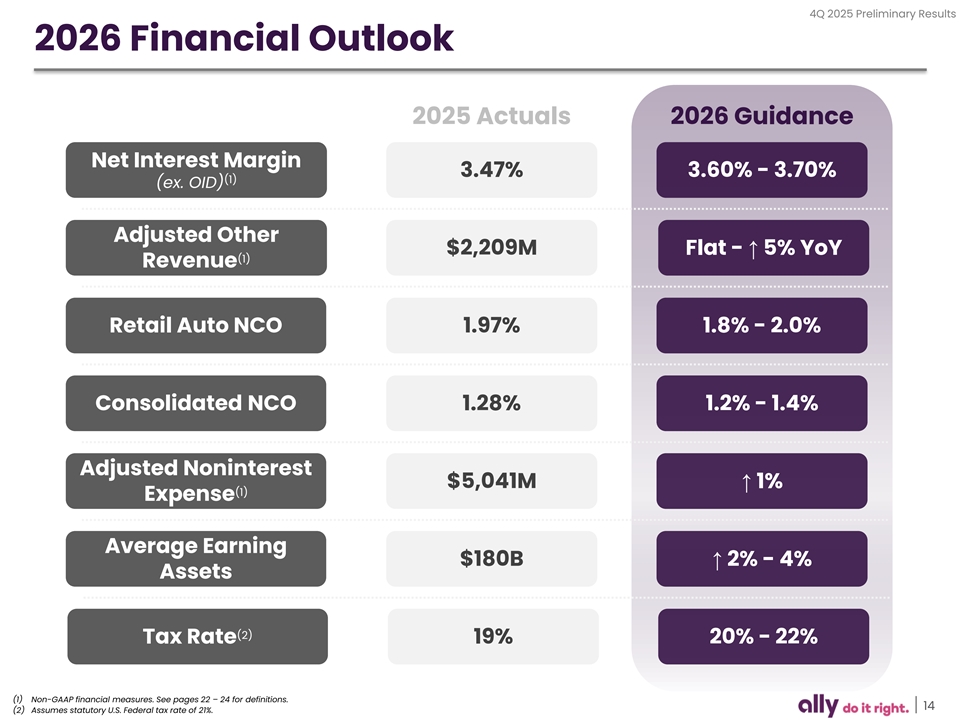
4Q 2025 Preliminary Results 2026 Financial Outlook 2025 Actuals 2026 Guidance Net Interest Margin 3.47% 3.60% - 3.70% (1) (ex. OID) Adjusted Other $2,209M Flat - ↑ 5% YoY (1) Revenue Retail Auto NCO 1.97% 1.8% - 2.0% Consolidated NCO 1.28% 1.2% - 1.4% Adjusted Noninterest $5,041M↑ 1% (1) Expense Average Earning $180B↑ 2% - 4% Assets (2) Tax Rate 19% 20% - 22% (1) Non-GAAP financial measures. See pages 22 – 24 for definitions. 14 (2) Assumes statutory U.S. Federal tax rate of 21%.
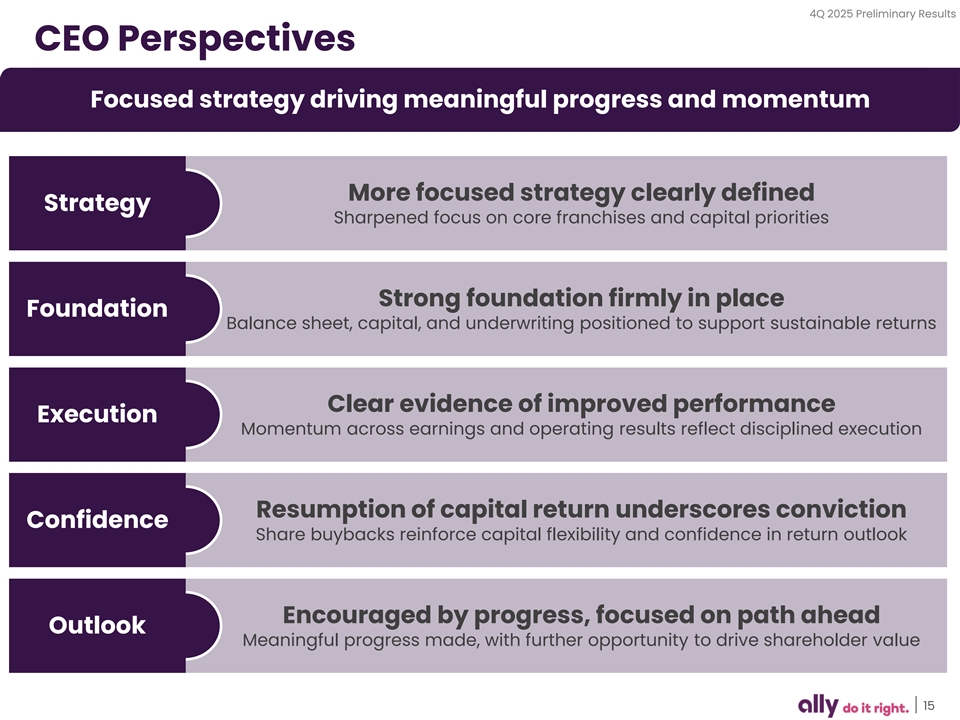
4Q 2025 Preliminary Results CEO Perspectives Focused strategy driving meaningful progress and momentum More focused strategy clearly defined Strategy Sharpened focus on core franchises and capital priorities Strong foundation firmly in place Foundation Balance sheet, capital, and underwriting positioned to support sustainable returns Clear evidence of improved performance Execution Momentum across earnings and operating results reflect disciplined execution Resumption of capital return underscores conviction Confidence Share buybacks reinforce capital flexibility and confidence in return outlook Encouraged by progress, focused on path ahead Outlook Meaningful progress made, with further opportunity to drive shareholder value 15

Supplemental
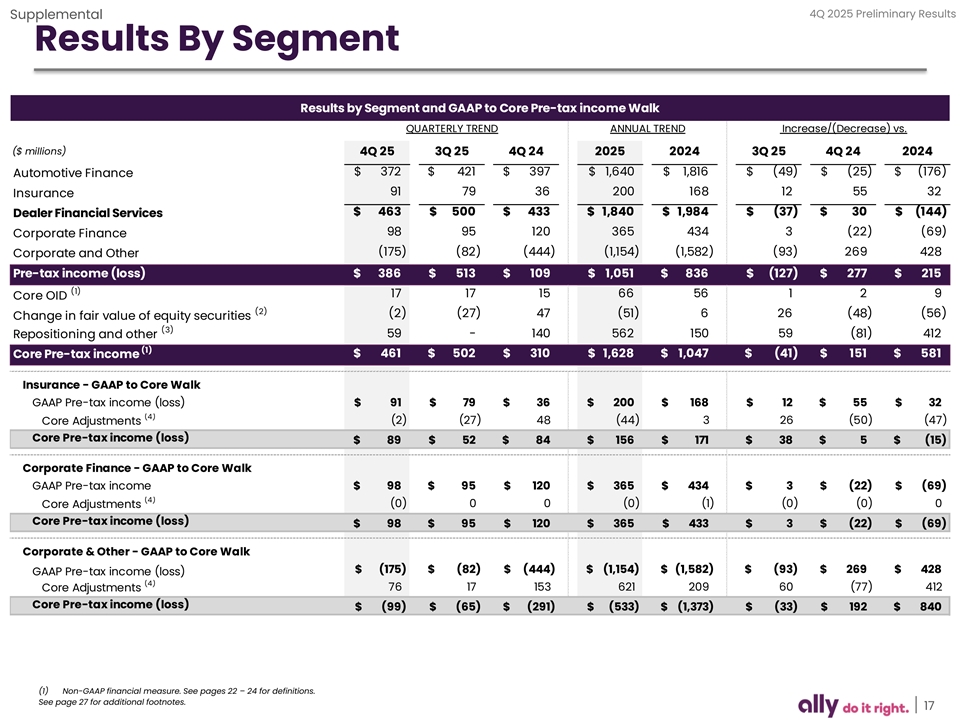
4Q 2025 Preliminary Results Supplemental Results By Segment Results by Segment and GAAP to Core Pre-tax income Walk QUARTERLY TREND ANNUAL TREND Increase/(Decrease) vs. ($ millions) 4Q 25 3Q 25 4Q 24 2025 2024 3Q 25 4Q 24 2024 $ 372 $ 4 21 $ 397 $ 1,640 $ 1,816 $ ( 49) $ (25) $ ( 176) Automotive Finance 91 79 36 200 168 12 55 32 Insurance $ 463 $ 500 $ 433 $ 1,840 $ 1,984 $ ( 37) $ 30 $ ( 144) Dealer Financial Services 98 95 120 3 65 434 3 ( 22) (69) Corporate Finance (175) (82) ( 444) (1,154) ( 1,582) (93) 2 69 428 Corporate and Other Pre-tax income (loss) $ 3 86 $ 5 13 $ 1 09 $ 1 ,051 $ 8 36 $ (127) $ 2 77 $ 2 15 (1) 17 17 15 66 56 1 2 9 Core OID (2) ( 2) ( 27) 47 (51) 6 26 ( 48) ( 56) Change in fair value of equity securities (3) 59 - 140 5 62 150 59 ( 81) 412 Repositioning and other (1) $ 4 61 $ 5 02 $ 3 10 $ 1 ,628 $ 1 ,047 $ ( 41) $ 1 51 $ 581 Core Pre-tax income Insurance - GAAP to Core Walk GAAP Pre-tax income (loss) $ 91 $ 79 $ 36 $ 20 0 $ 168 $ 12 $ 55 $ 32 (4) (2) (27) 48 (44) 3 26 (50) (47) Core Adjustments Core Pre-tax income (loss) $ 89 $ 52 $ 84 $ 156 $ 1 71 $ 38 $ 5 $ (15) Corporate Finance - GAAP to Core Walk GAAP Pre-tax income $ 98 $ 95 $ 1 20 $ 365 $ 434 $ 3 $ (22) $ ( 69) (4) Core Adjustments (0) 0 0 (0) (1) (0) (0) 0 Core Pre-tax income (loss) $ 98 $ 95 $ 1 20 $ 3 65 $ 433 $ 3 $ ( 22) $ ( 69) Corporate & Other - GAAP to Core Walk $ (175) $ (82) $ (444) $ ( 1,154) $ (1,582) $ ( 93) $ 26 9 $ 428 GAAP Pre-tax income (loss) (4) 76 17 153 621 209 60 (77) 412 Core Adjustments Core Pre-tax income (loss) $ (99) $ (65) $ (291) $ (533) $ ( 1,373) $ ( 33) $ 192 $ 8 40 (1) Non-GAAP financial measure. See pages 22 – 24 for definitions. See page 27 for additional footnotes. 17
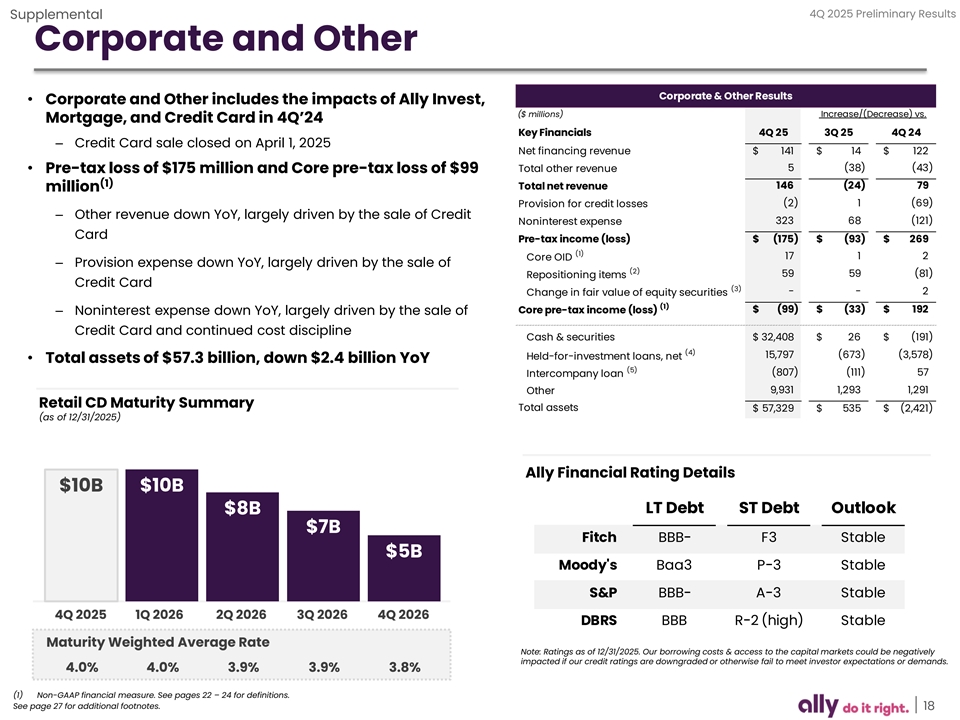
4Q 2025 Preliminary Results Supplemental Corporate and Other Corporate & Other Results • Corporate and Other includes the impacts of Ally Invest, ($ millions) Increase/(Decrease) vs. Mortgage, and Credit Card in 4Q’24 Key Financials 4Q 25 3Q 25 4Q 24 – Credit Card sale closed on April 1, 2025 Net financing revenue $ 141 $ 14 $ 122 Total other revenue 5 (38) (43) • Pre-tax loss of $175 million and Core pre-tax loss of $99 (1) Total net revenue 146 (24) 79 million (2) 1 (69) Provision for credit losses – Other revenue down YoY, largely driven by the sale of Credit 323 68 (121) Noninterest expense Card Pre-tax income (loss) $ (175) $ (93) $ 269 (1) 17 1 2 Core OID – Provision expense down YoY, largely driven by the sale of (2) 59 59 (81) Repositioning items Credit Card (3) - - 2 Change in fair value of equity securities (1) Core pre-tax income (loss) $ (99) $ (33) $ 192 – Noninterest expense down YoY, largely driven by the sale of Credit Card and continued cost discipline Cash & securities $ 32,408 $ 26 $ ( 191) (4) 15,797 ( 673) (3,578) Held-for-investment loans, net • Total assets of $57.3 billion, down $2.4 billion YoY (5) ( 807) ( 111) 57 Intercompany loan 9,931 1,293 1,291 Other Retail CD Maturity Summary Total assets $ 57,329 $ 535 $ (2,421) (as of 12/31/2025) Ally Financial Rating Details $10B $10B LT Debt ST Debt Outlook $8B $7B Fitch BBB- F3 Stable $5B Moody's Baa3 P-3 Stable S&P BBB- A-3 Stable 4Q 2025 1Q 2026 2Q 2026 3Q 2026 4Q 2026 DBRS BBB R-2 (high) Stable Maturity Weighted Average Rate Note: Ratings as of 12/31/2025. Our borrowing costs & access to the capital markets could be negatively impacted if our credit ratings are downgraded or otherwise fail to meet investor expectations or demands. 4.0% 4.0% 3.9% 3.9% 3.8% (1) Non-GAAP financial measure. See pages 22 – 24 for definitions. See page 27 for additional footnotes. 18
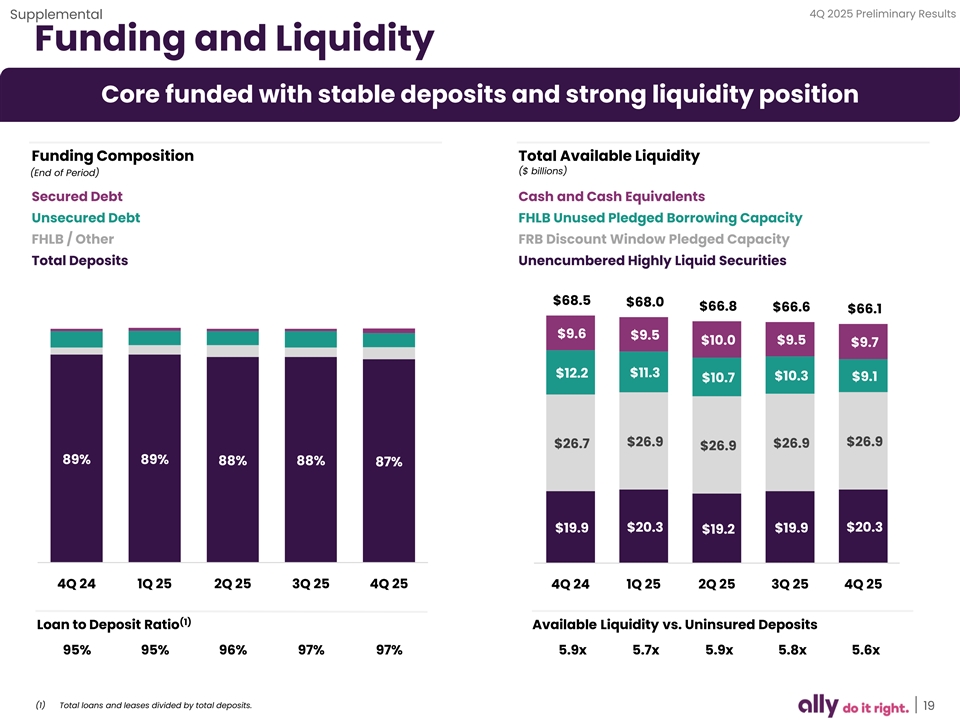
4Q 2025 Preliminary Results Supplemental Funding and Liquidity Core funded with stable deposits and strong liquidity position Funding Composition Total Available Liquidity ($ billions) (End of Period) Secured Debt Cash and Cash Equivalents Unsecured Debt FHLB Unused Pledged Borrowing Capacity FHLB / Other FRB Discount Window Pledged Capacity Total Deposits Unencumbered Highly Liquid Securities $68.5 $68.0 $66.8 $66.6 $66.1 $9.6 $9.5 $10.0 $9.5 $9.7 $12.2 $11.3 $10.3 $9.1 $10.7 $26.9 $26.9 $26.7 $26.9 $26.9 89% 89% 88% 88% 87% $20.3 $20.3 $19.9 $19.9 $19.2 4Q 24 1Q 25 2Q 25 3Q 25 4Q 25 4Q 24 1Q 25 2Q 25 3Q 25 4Q 25 (1) Loan to Deposit Ratio Available Liquidity vs. Uninsured Deposits 95% 95% 96% 97% 97% 5.9x 5.7x 5.9x 5.8x 5.6x (1) Total loans and leases divided by total deposits. 19
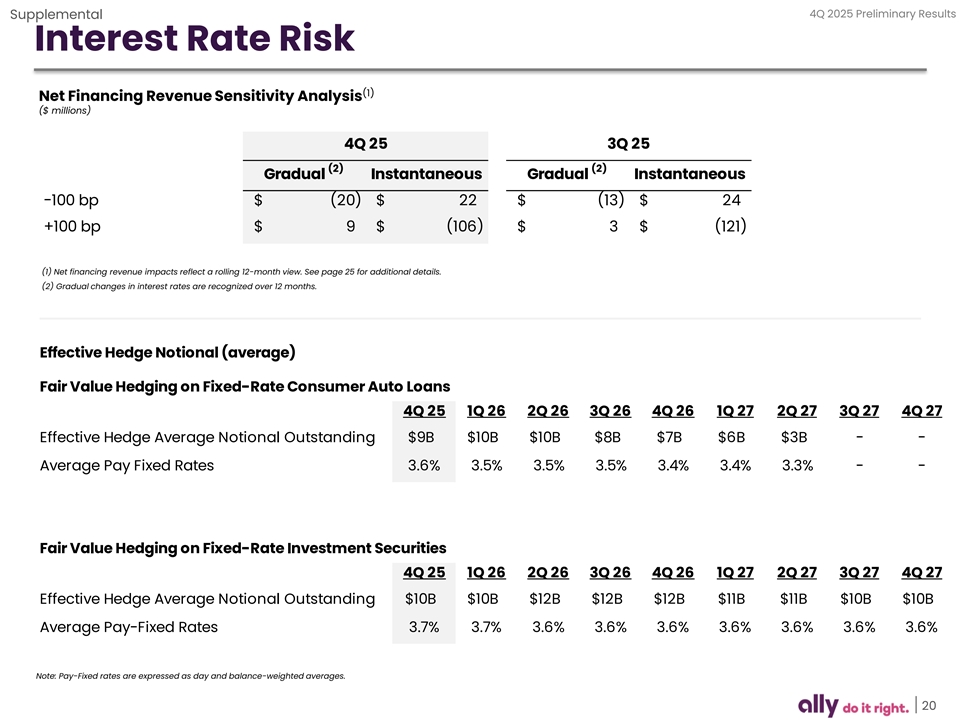
4Q 2025 Preliminary Results Supplemental Interest Rate Risk (1) Net Financing Revenue Sensitivity Analysis ($ millions) 4Q 25 3Q 25 (2) (2) Gradual Instantaneous Gradual Instantaneous -100 bp $ (20) $ 22 $ (13) $ 24 +100 bp $ 9 $ (106) $ 3 $ (121) (1) Net financing revenue impacts reflect a rolling 12-month view. See page 25 for additional details. (2) Gradual changes in interest rates are recognized over 12 months. Effective Hedge Notional (average) Fair Value Hedging on Fixed-Rate Consumer Auto Loans 4Q 25 1Q 26 2Q 26 3Q 26 4Q 26 1Q 27 2Q 27 3Q 27 4Q 27 Effective Hedge Average Notional Outstanding $9B $10B $10B $8B $7B $6B $3B - - Average Pay Fixed Rates 3.6% 3.5% 3.5% 3.5% 3.4% 3.4% 3.3% - - Fair Value Hedging on Fixed-Rate Investment Securities 4Q 25 1Q 26 2Q 26 3Q 26 4Q 26 1Q 27 2Q 27 3Q 27 4Q 27 Effective Hedge Average Notional Outstanding $10B $10B $12B $12B $12B $11B $11B $10B $10B Average Pay-Fixed Rates 3.7% 3.7% 3.6% 3.6% 3.6% 3.6% 3.6% 3.6% 3.6% Note: Pay-Fixed rates are expressed as day and balance-weighted averages. 20
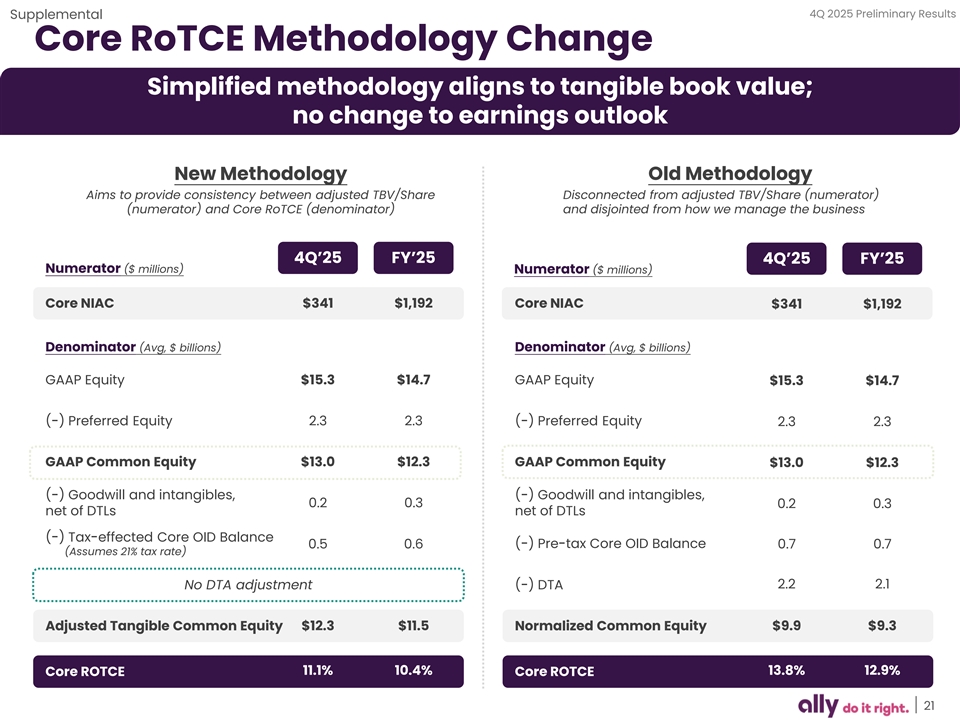
4Q 2025 Preliminary Results Supplemental Core RoTCE Methodology Change Simplified methodology aligns to tangible book value; no change to earnings outlook New Methodology Old Methodology Aims to provide consistency between adjusted TBV/Share Disconnected from adjusted TBV/Share (numerator) (numerator) and Core RoTCE (denominator) and disjointed from how we manage the business 4Q’25 FY’25 4Q’25 FY’25 Numerator ($ millions) Numerator ($ millions) Core NIAC $341 $1,192 Core NIAC $341 $1,192 Denominator (Avg, $ billions) Denominator (Avg, $ billions) GAAP Equity $15.3 $14.7 GAAP Equity $15.3 $14.7 (-) Preferred Equity 2.3 2.3 (-) Preferred Equity 2.3 2.3 GAAP Common Equity $13.0 $12.3 GAAP Common Equity $13.0 $12.3 (-) Goodwill and intangibles, (-) Goodwill and intangibles, 0.2 0.3 0.2 0.3 net of DTLs net of DTLs (-) Tax-effected Core OID Balance (-) Pre-tax Core OID Balance 0.5 0.6 0.7 0.7 (Assumes 21% tax rate) No DTA adjustment (-) DTA 2.2 2.1 Adjusted Tangible Common Equity $12.3 $11.5 Normalized Common Equity $9.9 $9.3 11.1% 10.4% 13.8% 12.9% Core ROTCE Core ROTCE 21
4Q 2025 Preliminary Results Supplemental Notes on Non-GAAP Financial Measures The following are non-GAAP financial measures which Ally believes are important to the reader of the Consolidated Financial Statements, but which are supplemental to and not a substitute for GAAP measures: Accelerated issuance expense (Accelerated OID), Adjusted earnings per share (Adjusted EPS), Adjusted efficiency ratio, Adjusted noninterest expense, Adjusted other revenue, Adjusted provision for Credit Losses, Adjusted tangible book value per share (Adjusted TBVPS), Adjusted total net revenue, Core net income attributable to common shareholders, Core original issue discount (Core OID) amortization expense, Core outstanding original issue discount balance (Core OID balance), Core pre-tax income, Core return on tangible common equity (Core ROTCE), Investment income and other (adjusted), Net financing revenue (excluding Core OID), Net interest margin (excluding Core OID), and Adjusted Tangible Common Equity. These measures are used by management, and we believe are useful to investors in assessing the company’s operating performance and capital. For calculation methodology, refer to the Reconciliation to GAAP later in this document. 1) Accelerated issuance expense (Accelerated OID) is the recognition of issuance expenses related to calls of redeemable debt. 2) Adjusted earnings per share (Adjusted EPS) is a non-GAAP financial measure that adjusts GAAP EPS for revenue and expense items that are typically strategic in nature or that management otherwise does not view as reflecting the operating performance of the company. Management believes Adjusted EPS can help the reader better understand the operating performance of the core businesses and their ability to generate earnings. In the numerator of Adjusted EPS, GAAP net income attributable to common shareholders is adjusted for the following items: (1) excludes discontinued operations, net of tax, as Ally is primarily a domestic company and sales of international businesses and other discontinued operations in the past have significantly impacted GAAP EPS, (2) adds back the tax-effected non-cash Core OID, (3) adjusts for tax- effected repositioning and other which are primarily related to the extinguishment of high-cost legacy debt, strategic activities and significant other one-time items, (4) change in fair value of equity securities, (5) excludes significant discrete tax items that do not relate to the operating performance of the core businesses, and adjusts for preferred stock capital actions that have been taken by the company to normalize its capital structure, as applicable for respective periods. See pages 28 – 29 for calculation methodology and details. 3) Adjusted efficiency ratio is a non-GAAP financial measure that management believes is helpful to readers in comparing the efficiency of its core banking and lending businesses with those of its peers. See pages 34 – 35 for calculation details. (1) In the numerator of Adjusted efficiency ratio, total noninterest expense is adjusted for Rep and warrant expense, Insurance segment expense, and repositioning and other which are primarily related to the extinguishment of high-cost legacy debt, strategic activities, restructuring and significant other one-time items, as applicable for respective periods. (2) In the denominator, total net revenue is adjusted for Core OID, Insurance segment revenue, and repositioning and other which are primarily related to the extinguishment of high-cost legacy debt, strategic activities, restructuring and significant other one-time items, as applicable for respective periods. See page 12 for the combined ratio for the Insurance segment which management uses as a primary measure of underwriting profitability for the Insurance segment. 4) Adjusted noninterest expense is a non-GAAP financial measure that adjusts GAAP noninterest expense for repositioning items. Management believes adjusted noninterest expense is a helpful financial metric because it enables the reader to better understand the business' expenses excluding nonrecurring items. See pages 36 – 37 for calculation methodology and details. 5) Adjusted other revenue is a non-GAAP financial measure that adjusts GAAP other revenue for OID expenses, repositioning, and change in fair value of equity securities. Management believes adjusted other revenue is a helpful financial metric because it enables the reader to better understand the business' ability to generate other revenue. See pages 36 – 37 for calculation methodology and details. 6) Adjusted provision for credit losses is a non-GAAP financial measure that adjusts GAAP provision for credit losses for repositioning items. Management believes adjusted provision for credit losses is a helpful financial metric because it enables the reader to better understand the business’ expenses excluding nonrecurring items. See pages 36 – 37 for calculation methodology and details. 22
4Q 2025 Preliminary Results Supplemental Notes on Non-GAAP Financial Measures 7) Adjusted tangible book value per share (Adjusted TBVPS) is a non-GAAP financial measure that reflects the book value of equity attributable to shareholders even if Core OID balance were accelerated immediately through the financial statements. As a result, management believes Adjusted TBVPS provides the reader with an assessment of value that is more conservative than GAAP common shareholder’s equity per share. Adjusted TBVPS generally adjusts common equity for: (1) goodwill and identifiable intangibles, net of DTLs and (2) tax-effected Core OID balance to reduce tangible common equity in the event the corresponding discounted bonds are redeemed/tendered. Note: In December 2017, tax-effected Core OID balance was adjusted from a statutory U.S. Federal tax rate of 35% to 21% (“rate”) as a result of changes to U.S. tax law. The adjustment conservatively increased the tax-effected Core OID balance and consequently reduced Adjusted TBVPS as any acceleration of the non-cash charge in future periods would flow through the financial statements at a 21% rate versus a previously modeled 35% rate. See pages 32 – 33 for calculation methodology and details. 8) Adjusted total net revenue is a non-GAAP financial measure that management believes is helpful for readers to understand the ongoing ability of the company to generate revenue. For purposes of this calculation, GAAP net financing revenue is adjusted by excluding Core OID to calculate net financing revenue ex. core OID. GAAP other revenue is adjusted for OID expenses, repositioning, and change in fair value of equity securities to calculate adjusted other revenue. Adjusted total net revenue is calculated by adding net financing revenue ex. core OID to adjusted other revenue. See pages 36 – 37 for calculation methodology and details. 9) Core net income attributable to common shareholders is a non-GAAP financial measure that serves as the numerator in the calculations of Adjusted EPS and Core ROTCE and that, like those measures, is believed by management to help the reader better understand the operating performance of the core businesses and their ability to generate earnings. Core net income attributable to common shareholders adjusts GAAP net income attributable to common shareholders for discontinued operations net of tax, tax-effected Core OID expense, tax-effected repositioning and other primarily related to the extinguishment of high-cost legacy debt and strategic activities and significant other one-time items, preferred stock capital actions, significant discrete tax items and tax-effected changes in equity investments measured at fair value, as applicable for respective periods. See pages 28 – 31 for calculation methodology and details. 10) Core original issue discount (Core OID) amortization expense is a non-GAAP financial measure for OID and is believed by management to help the reader better understand the activity removed from: Core pre-tax income (loss), Core net income (loss) attributable to common shareholders, Adjusted EPS, Core ROTCE, Adjusted efficiency ratio, Adjusted total net revenue, and Net financing revenue (excluding Core OID). Core OID is primarily related to bond exchange OID which excludes international operations and future issuances. Core OID for all periods shown is applied to the pre-tax income of the Corporate and Other segment. See pages 36 – 37 for calculation methodology and details. 11) Core outstanding original issue discount balance (Core OID balance) is a non-GAAP financial measure for outstanding OID and is believed by management to help the reader better understand the balance removed from Core ROTCE and Adjusted TBVPS. Core OID balance is primarily related to bond exchange OID which excludes international operations and future issuances. See pages 36 – 37 for calculation methodology and details. 12) Core pre-tax income is a non-GAAP financial measure that adjusts pre-tax income from continuing operations by excluding (1) Core OID, and (2) change in fair value of equity securities (change in fair value of equity securities impacts the Insurance and Corporate Finance segments), and (3) Repositioning and other which are primarily related to the extinguishment of high-cost legacy debt, strategic activities and significant other one-time items, as applicable for respective periods or businesses. Management believes core pre-tax income can help the reader better understand the operating performance of the core businesses and their ability to generate earnings. See page 17 for calculation methodology and details. 23
4Q 2025 Preliminary Results Supplemental Notes on Non-GAAP Financial Measures 13) Core return on tangible common equity (Core ROTCE) is a non-GAAP financial measure that management believes is helpful for readers to better understand the ongoing ability of the company to generate returns on its equity base that supports core operations. For purposes of this calculation, tangible common equity is adjusted for tax- effected Core OID balance. Ally’s Core net income attributable to common shareholders for purposes of calculating Core ROTCE is based on the actual effective tax rate for the period adjusted for significant discrete tax items including tax reserve releases, which aligns with the methodology used in calculating adjusted earnings per share. See pages 30 – 31 for calculation details. (1) In the numerator of Core ROTCE, GAAP net income attributable to common shareholders is adjusted for discontinued operations net of tax, tax-effected Core OID, tax-effected repositioning and other which are primarily related to the extinguishment of high-cost legacy debt, strategic activities and significant other one- time items, change in fair value of equity securities, significant discrete tax items, and preferred stock capital actions, as applicable for respective periods. (2) In the denominator, GAAP shareholder’s equity is adjusted for goodwill and identifiable intangibles net of DTL, and tax-effected Core OID balance. 14) Investment income and other (adjusted) is a non-GAAP financial measure that adjusts GAAP investment income and other for repositioning, and the change in fair value of equity securities. Management believes investment income and other (adjusted) is a helpful financial metric because it enables the reader to better understand the business' ability to generate investment income. 15) Net financing revenue excluding core OID is calculated using a non-GAAP measure that adjusts net financing revenue by excluding Core OID. The Core OID balance is primarily related to bond exchange OID which excludes international operations and future issuances. Management believes net financing revenue ex. Core OID is a helpful financial metric because it enables the reader to better understand the business' ability to generate revenue. See pages 36 – 37 for calculation methodology and details. 16) Net interest margin excluding core OID is calculated using a non-GAAP measure that adjusts net interest margin by excluding Core OID. The Core OID balance is primarily related to bond exchange OID which excludes international operations and future issuances. Management believes net interest margin ex. Core OID is a helpful financial metric because it enables the reader to better understand the business' profitability and margins. See page 8 for calculation methodology and details. 17) Adjusted Tangible Common Equity is a non-GAAP financial measure that is defined as common stockholders’ equity less goodwill and identifiable intangible assets, net of deferred tax liabilities. Ally considers various measures when evaluating capital adequacy, including tangible common equity. Ally believes that tangible common equity is important because we believe readers may assess our capital adequacy using this measure. Additionally, presentation of this measure allows readers to compare certain aspects of our capital adequacy on the same basis to other companies in the industry. For purposes of calculating Core return on tangible common equity (Core ROTCE), tangible common equity is further adjusted for tax-effected Core OID balance. See pages 30 – 31 for calculation methodology and details. 24
4Q 2025 Preliminary Results Supplemental Notes on Other Financial Measures 1) Change in fair value of equity securities impacts the Insurance, Corporate Finance and Corporate and Other segments. The change reflects fair value adjustments to equity securities that are reported at fair value. Management believes the change in fair value of equity securities should be removed from select financial measures because it enables the reader to better understand the business’ ongoing ability to generate revenue and income. 2) Estimated impact of CECL on regulatory capital per final rule issued by U.S. banking agencies - In December 2018, the FRB and other U.S. banking agencies approved a final rule to address the impact of CECL on regulatory capital by allowing BHCs and banks, including Ally, the option to phase in the day-one impact of CECL over a three-year period. In March 2020, the FRB and other U.S. banking agencies issued an interim final rule that became effective on March 31, 2020 and provided an alternative option for banks to temporarily delay the impacts of CECL, relative to the incurred loss methodology for estimating the allowance for loan losses, on regulatory capital. A final rule that was largely unchanged from the March 2020 interim final rule was issued by the FRB and other U.S. banking agencies in August 2020, and became effective in September 2020. For regulatory capital purposes, these rules permitted us to delay recognizing the estimated impact of CECL on regulatory capital until after a two-year deferral period, which for us extended through December 31, 2021. Beginning on January 1, 2022, we are required to phase in 25% of the previously deferred estimated capital impact of CECL, with an additional 25% to be phased in at the beginning of each subsequent year until fully phased in by the first quarter of 2025. Under these rules, firms that adopt CECL and elect the five-year transition will calculate the estimated impact of CECL on regulatory capital as the day-one impact of adoption plus 25% of the subsequent change in allowance during the two-year deferral period, which according to the final rule approximates the impact of CECL relative to an incurred loss model. We adopted this transition option during the first quarter of 2020, and phased in the regulatory capital impacts of CECL from January 1, 2022, to January 1, 2025, based on this 5-year transition period. 3) Estimated retail auto originated yield is a financial measure determined by calculating the estimated average annualized yield for loans originated during the period. At this time there currently is no comparable GAAP financial measure for Estimated Retail Auto Originated Yield and therefore this forecasted estimate of yield at the time of origination cannot be quantitatively reconciled to comparable GAAP information. 4) Interest rate risk modeling – We prepare our forward-looking baseline forecasts of net financing revenue taking into consideration anticipated future business growth, asset/liability positioning, and interest rates based on the implied forward curve. The analysis is highly dependent upon a variety of assumptions including the repricing characteristics of retail deposits with both contractual and non-contractual maturities. We continually monitor industry and competitive repricing activity along with other market factors when contemplating deposit pricing actions. Please see our SEC filings for more details. 5) Net charge-off ratios are calculated as annualized net charge-offs divided by average outstanding finance receivables and loans excluding loans measured at fair value and loans held-for-sale. 6) Repositioning is primarily related to the extinguishment of high-cost legacy debt, strategic activities, restructuring, amounts related to nonrecurring business transactions or pending transactions, and significant other one-time items. 7) U.S. consumer auto originations New Retail – standard and subvented rate new vehicle loans; Lease – new vehicle lease originations; Used – used vehicle loans Nonprime – originations with a FICO® score of less than 620 25
4Q 2025 Preliminary Results Supplemental Additional Notes Page – 6 | Market Leading Franchises (1) Estimated Retail Auto Originated Yield is a forward-looking financial measure. See page 25 for details. (2) Gross Revenue Yield expressed as gross interest income plus other revenue divided by average earning assets. (3) FDIC insured percentage excludes affiliate and intercompany deposits. Page – 8 | Balance Sheet and Net Interest Margin (1) Mortgage loans in run-off at the Corporate and Other segment. (2) Unsecured lending from point-of-sale financing. Moved to assets of operations held-for-sale (HFS) on 12/31/23; sale of Ally Lending closed 3/1/24. (3) Credit card assets moved to assets of operations held-for-sale (HFS) on 3/31/25; sale of Credit Card closed 4/1/25. (4) Includes interest expense related to margin received on derivative contracts. Excluding this expense, annualized yields were 3.88% for 4Q’25, 4.28% for 3Q’25, and 4.68% for 4Q’24. Annualized yields excluding this expense for FY2025 and FY2024 were 4.21% and 5.15%, respectively. (5) Includes Community Reinvestment Act and other held-for-sale (HFS) loans. (6) Includes retail, brokered, and other deposits (inclusive of sweep deposits, mortgage escrow, and other deposits). (7) Includes FHLB borrowings and Repurchase Agreements. (8) Calculated using a Non-GAAP financial measure. See pages 22 – 24 for definitions. Page – 11 | Auto Finance (1) Noninterest expense includes corporate allocations of $193 million in 4Q 2025, $197 million in 3Q 2025, and $179 million in 4Q 2024. (2) Estimated Retail Auto Originated Yield is a forward-looking financial measure. See page 25 for details. Page – 12 | Insurance (2) Acquisition and underwriting expenses includes corporate allocations of $21 million in 4Q 2025, $24 million in 3Q 2025, and $21 million in 4Q 2024. (3) Change in fair value of equity securities impacts the Insurance segment. The change reflects fair value adjustments to equity securities that are reported at fair value. Management believes the change in fair value of equity securities should be removed from select financial measures because it enables the reader to better understand the business’ ongoing ability to generate revenue and income. Page – 13 | Corporate Finance (2) Noninterest expense includes corporate allocations of $11 million in 4Q 2025, $11 million in 3Q 2025, and $10 million in 4Q 2024. (3) Change in fair value of equity securities impacts the Corporate Finance segment. The change reflects fair value adjustments to equity securities that are reported at fair value. Management believes the change in fair value of equity securities should be removed from select financial measures because it enables the reader to better understand the business’ ongoing ability to generate revenue and income. 26
4Q 2025 Preliminary Results Supplemental Additional Notes Page – 17 | Results by Segment (2) Change in fair value of equity securities impacts the Insurance, Corporate Finance and Corporate and Other segments. The change reflects fair value adjustments to equity securities that are reported at fair value. Management believes the change in fair value of equity securities should be removed from select financial measures because it enables the reader to better understand the business’ ongoing ability to generate revenue and income. (3) Repositioning and other are primarily related to the extinguishment of high-cost legacy debt, strategic activities, restructuring, and significant other one-time items, as applicable for respective periods or businesses. (4) Includes adjustments for non-GAAP measures Core OID expense, change in fair value of equity securities, and repositioning. Page – 18 | Corporate and Other (2) Repositioning and other are primarily related to the extinguishment of high-cost legacy debt, strategic activities, restructuring, and significant other one-time items, as applicable for respective periods or businesses. (3) Change in fair value of equity securities impacts the Corporate and Other segments. The change reflects fair value adjustments to equity securities that are reported at fair value. Management believes the change in fair value of equity securities should be removed from select financial measures because it enables the reader to better understand the business’ ongoing ability to generate revenue and income. (4) HFI consumer mortgage portfolio in all periods and Ally credit card portfolio in 4Q 2024. (5) Intercompany loan related to activity between Insurance and Corporate. 27
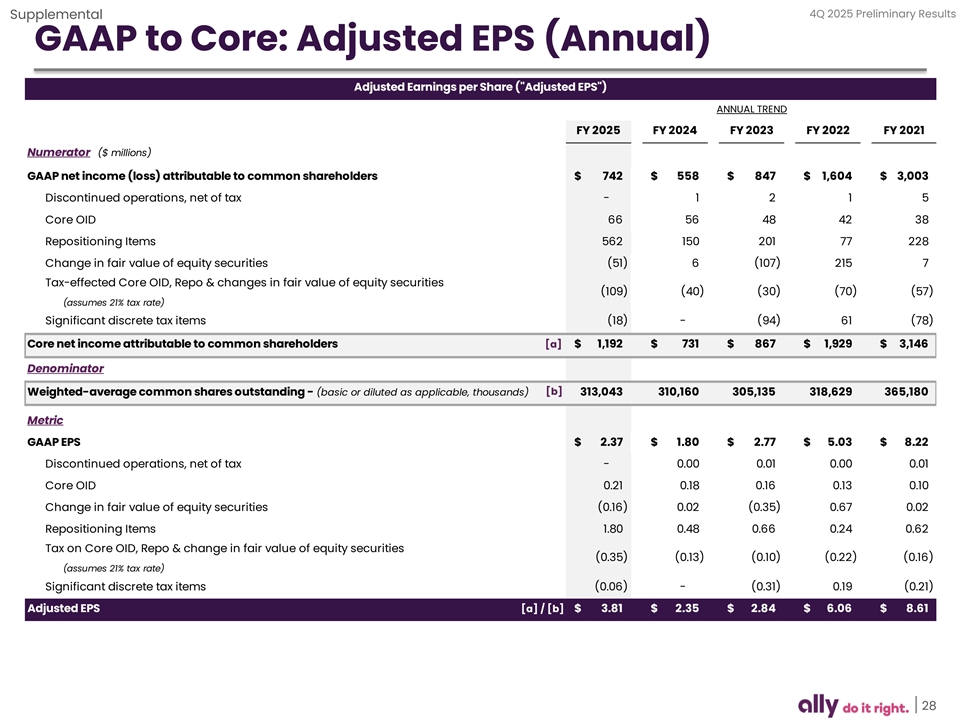
4Q 2025 Preliminary Results Supplemental GAAP to Core: Adjusted EPS (Annual) Adjusted Earnings per Share ( Adjusted EPS ) ANNUAL TREND FY 2025 FY 2024 FY 2023 FY 2022 FY 2021 Numerator ($ millions) GAAP net income (loss) attributable to common shareholders $ 742 $ 558 $ 847 $ 1 ,604 $ 3,003 Discontinued operations, net of tax - 1 2 1 5 Core OID 66 56 48 42 38 Repositioning Items 562 150 201 77 228 Change in fair value of equity securities (51) 6 ( 107) 215 7 Tax-effected Core OID, Repo & changes in fair value of equity securities (109) ( 40) (30) (70) (57) (assumes 21% tax rate) Significant discrete tax items (18) - ( 94) 61 (78) Core net income attributable to common shareholders [a] $ 1 ,192 $ 731 $ 8 67 $ 1 ,929 $ 3,146 Denominator [b] Weighted-average common shares outstanding - (basic or diluted as applicable, thousands) 313,043 310,160 305,135 318,629 365,180 Metric GAAP EPS $ 2.37 $ 1.80 $ 2.77 $ 5.03 $ 8.22 Discontinued operations, net of tax - 0.00 0.01 0.00 0.01 Core OID 0.21 0.18 0.16 0.13 0.10 Change in fair value of equity securities (0.16) 0.02 (0.35) 0.67 0.02 Repositioning Items 1.80 0.48 0.66 0.24 0.62 Tax on Core OID, Repo & change in fair value of equity securities (0.35) ( 0.13) (0.10) ( 0.22) (0.16) (assumes 21% tax rate) Significant discrete tax items (0.06) - ( 0.31) 0.19 (0.21) Adjusted EPS [a] / [b] $ 3.81 $ 2.35 $ 2.84 $ 6 .06 $ 8.61 28
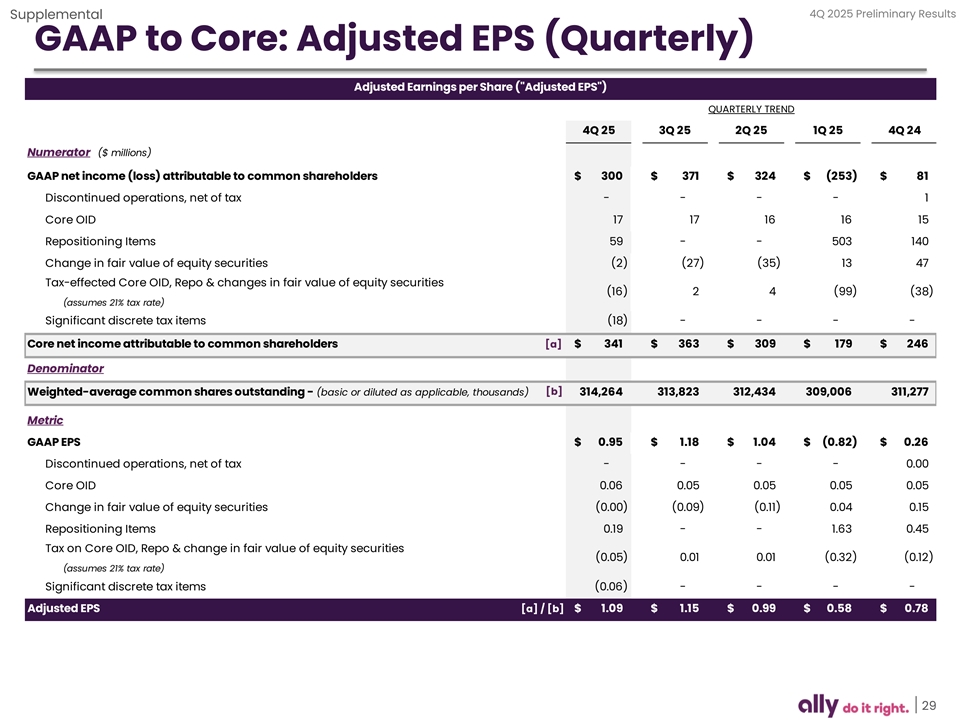
4Q 2025 Preliminary Results Supplemental GAAP to Core: Adjusted EPS (Quarterly) Adjusted Earnings per Share ( Adjusted EPS ) QUARTERLY TREND 4Q 25 3Q 25 2Q 25 1Q 25 4Q 24 Numerator ($ millions) GAAP net income (loss) attributable to common shareholders $ 300 $ 371 $ 3 24 $ (253) $ 81 Discontinued operations, net of tax - - - - 1 Core OID 17 17 16 16 15 Repositioning Items 59 - - 503 140 Change in fair value of equity securities (2) (27) (35) 13 47 Tax-effected Core OID, Repo & changes in fair value of equity securities (16) 2 4 (99) ( 38) (assumes 21% tax rate) Significant discrete tax items ( 18) - - - - Core net income attributable to common shareholders [a] $ 341 $ 3 63 $ 309 $ 179 $ 246 Denominator [b] Weighted-average common shares outstanding - (basic or diluted as applicable, thousands) 314,264 313,823 312,434 3 09,006 3 11,277 Metric GAAP EPS $ 0.95 $ 1.18 $ 1.04 $ (0.82) $ 0.26 Discontinued operations, net of tax - - - - 0.00 Core OID 0.06 0.05 0.05 0.05 0.05 Change in fair value of equity securities (0.00) ( 0.09) (0.11) 0.04 0.15 Repositioning Items 0.19 - - 1.63 0.45 Tax on Core OID, Repo & change in fair value of equity securities (0.05) 0.01 0.01 (0.32) ( 0.12) (assumes 21% tax rate) Significant discrete tax items (0.06) - - - - Adjusted EPS [a] / [b] $ 1.09 $ 1.15 $ 0.99 $ 0.58 $ 0.78 29
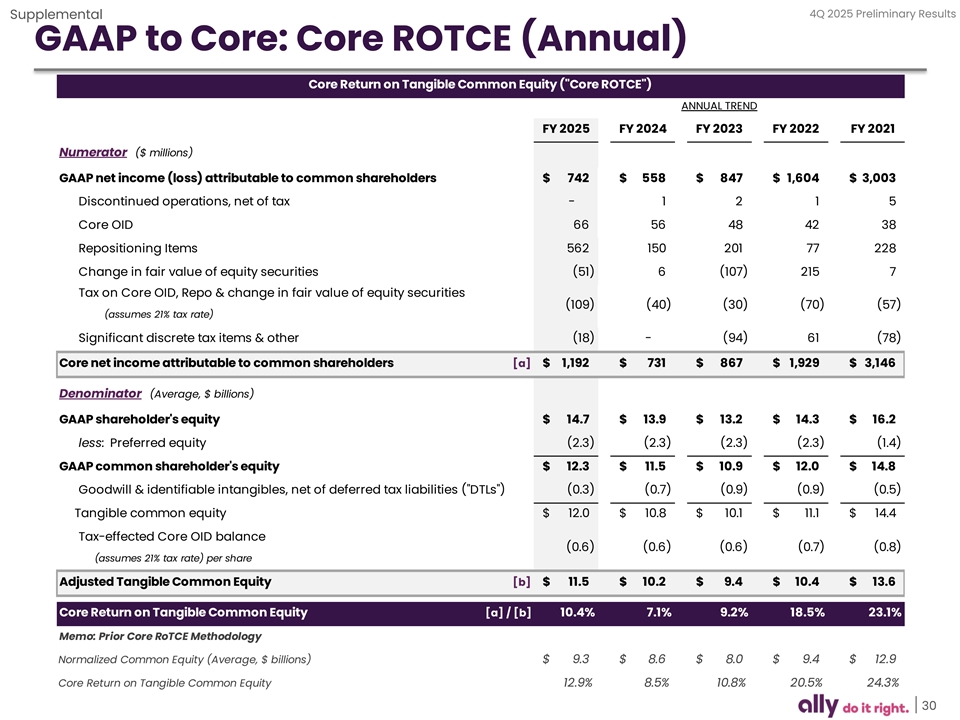
4Q 2025 Preliminary Results Supplemental GAAP to Core: Core ROTCE (Annual) Core Return on Tangible Common Equity ( Core ROTCE ) ANNUAL TREND FY 2025 FY 2024 FY 2023 FY 2022 FY 2021 Numerator ($ millions) GAAP net income (loss) attributable to common shareholders $ 742 $ 558 $ 847 $ 1,604 $ 3 ,003 Discontinued operations, net of tax - 1 2 1 5 Core OID 66 56 48 42 38 Repositioning Items 562 150 201 77 228 Change in fair value of equity securities (51) 6 (107) 215 7 Tax on Core OID, Repo & change in fair value of equity securities (109) (40) (30) (70) (57) (assumes 21% tax rate) Significant discrete tax items & other (18) - (94) 61 (78) Core net income attributable to common shareholders [a] $ 1,192 $ 731 $ 867 $ 1,929 $ 3 ,146 Denominator (Average, $ billions) GAAP shareholder's equity $ 14.7 $ 13.9 $ 13.2 $ 14.3 $ 16.2 less: Preferred equity (2.3) (2.3) (2.3) (2.3) (1.4) GAAP common shareholder's equity $ 12.3 $ 11.5 $ 10.9 $ 12.0 $ 1 4.8 Goodwill & identifiable intangibles, net of deferred tax liabilities ( DTLs ) (0.3) (0.7) (0.9) (0.9) (0.5) Tangible common equity $ 12.0 $ 10.8 $ 10.1 $ 11.1 $ 14.4 Tax-effected Core OID balance (0.6) (0.6) (0.6) (0.7) (0.8) (assumes 21% tax rate) per share Adjusted Tangible Common Equity [b] $ 11.5 $ 10.2 $ 9.4 $ 1 0.4 $ 13.6 Core Return on Tangible Common Equity [a] / [b] 10.4% 7.1% 9.2% 18.5% 23.1% Memo: Prior Core RoTCE Methodology Normalized Common Equity (Average, $ billions) $ 9.3 $ 8.6 $ 8.0 $ 9.4 $ 12.9 Core Return on Tangible Common Equity 12.9% 8.5% 10.8% 20.5% 24.3% 30
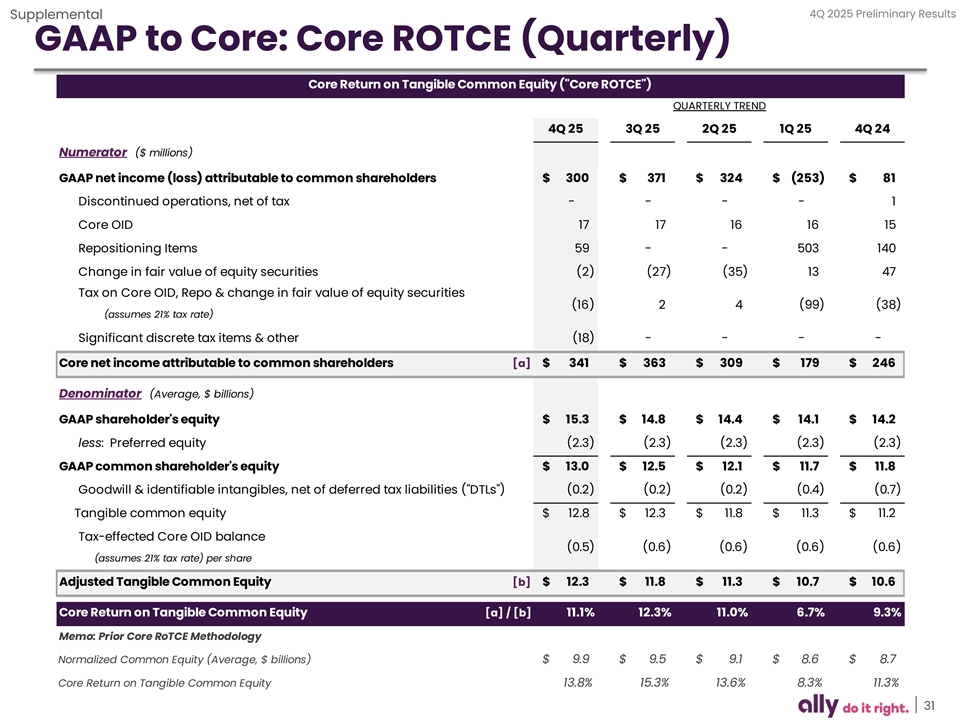
4Q 2025 Preliminary Results Supplemental GAAP to Core: Core ROTCE (Quarterly) Core Return on Tangible Common Equity ( Core ROTCE ) QUARTERLY TREND 4Q 25 3Q 25 2Q 25 1Q 25 4Q 24 Numerator ($ millions) GAAP net income (loss) attributable to common shareholders $ 300 $ 371 $ 324 $ (253) $ 81 Discontinued operations, net of tax - - - - 1 Core OID 17 17 16 16 15 Repositioning Items 59 - - 503 140 Change in fair value of equity securities (2) (27) (35) 13 47 Tax on Core OID, Repo & change in fair value of equity securities ( 16) 2 4 (99) (38) (assumes 21% tax rate) Significant discrete tax items & other (18) - - - - Core net income attributable to common shareholders [a] $ 341 $ 363 $ 309 $ 179 $ 246 Denominator (Average, $ billions) GAAP shareholder's equity $ 15.3 $ 14.8 $ 14.4 $ 14.1 $ 14.2 less: Preferred equity (2.3) (2.3) (2.3) (2.3) (2.3) GAAP common shareholder's equity $ 13.0 $ 12.5 $ 12.1 $ 11.7 $ 11.8 Goodwill & identifiable intangibles, net of deferred tax liabilities ( DTLs ) (0.2) (0.2) (0.2) (0.4) (0.7) Tangible common equity $ 12.8 $ 12.3 $ 11.8 $ 11.3 $ 11.2 Tax-effected Core OID balance (0.5) (0.6) (0.6) (0.6) (0.6) (assumes 21% tax rate) per share Adjusted Tangible Common Equity [b] $ 12.3 $ 11.8 $ 11.3 $ 10.7 $ 10.6 Core Return on Tangible Common Equity [a] / [b] 11.1% 12.3% 11.0% 6.7% 9.3% Memo: Prior Core RoTCE Methodology Normalized Common Equity (Average, $ billions) $ 9.9 $ 9.5 $ 9.1 $ 8.6 $ 8.7 Core Return on Tangible Common Equity 13.8% 15.3% 13.6% 8.3% 11.3% 31
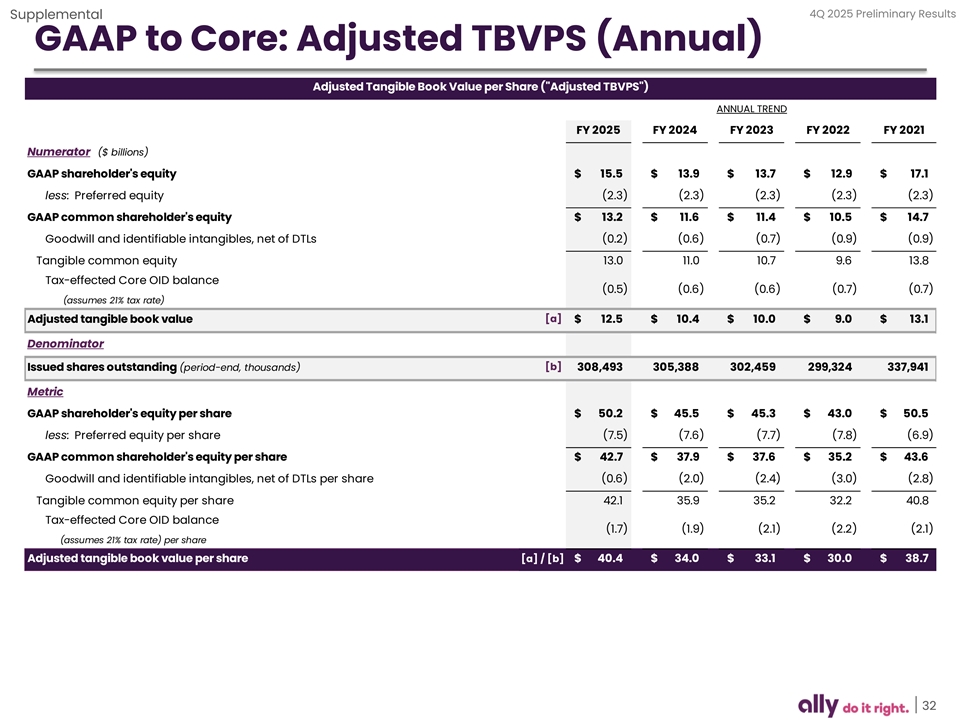
4Q 2025 Preliminary Results Supplemental GAAP to Core: Adjusted TBVPS (Annual) Adjusted Tangible Book Value per Share ( Adjusted TBVPS ) ANNUAL TREND FY 2025 FY 2024 FY 2023 FY 2022 FY 2021 Numerator ($ billions) GAAP shareholder's equity $ 15.5 $ 13.9 $ 13.7 $ 1 2.9 $ 17.1 less: Preferred equity (2.3) (2.3) (2.3) (2.3) (2.3) GAAP common shareholder's equity $ 13.2 $ 11.6 $ 11.4 $ 10.5 $ 1 4.7 Goodwill and identifiable intangibles, net of DTLs (0.2) ( 0.6) (0.7) (0.9) (0.9) Tangible common equity 13.0 11.0 1 0.7 9.6 13.8 Tax-effected Core OID balance (0.5) ( 0.6) ( 0.6) (0.7) (0.7) (assumes 21% tax rate) Adjusted tangible book value [a] $ 12.5 $ 10.4 $ 10.0 $ 9.0 $ 13.1 Denominator Issued shares outstanding (period-end, thousands) [b] 308,493 305,388 302,459 2 99,324 337,941 Metric GAAP shareholder's equity per share $ 50.2 $ 45.5 $ 45.3 $ 43.0 $ 5 0.5 less: Preferred equity per share (7.5) (7.6) (7.7) (7.8) (6.9) GAAP common shareholder's equity per share $ 4 2.7 $ 37.9 $ 3 7.6 $ 35.2 $ 43.6 Goodwill and identifiable intangibles, net of DTLs per share ( 0.6) (2.0) (2.4) (3.0) (2.8) Tangible common equity per share 42.1 35.9 35.2 32.2 40.8 Tax-effected Core OID balance (1.7) (1.9) (2.1) (2.2) (2.1) (assumes 21% tax rate) per share Adjusted tangible book value per share [a] / [b] $ 4 0.4 $ 34.0 $ 33.1 $ 30.0 $ 38.7 32
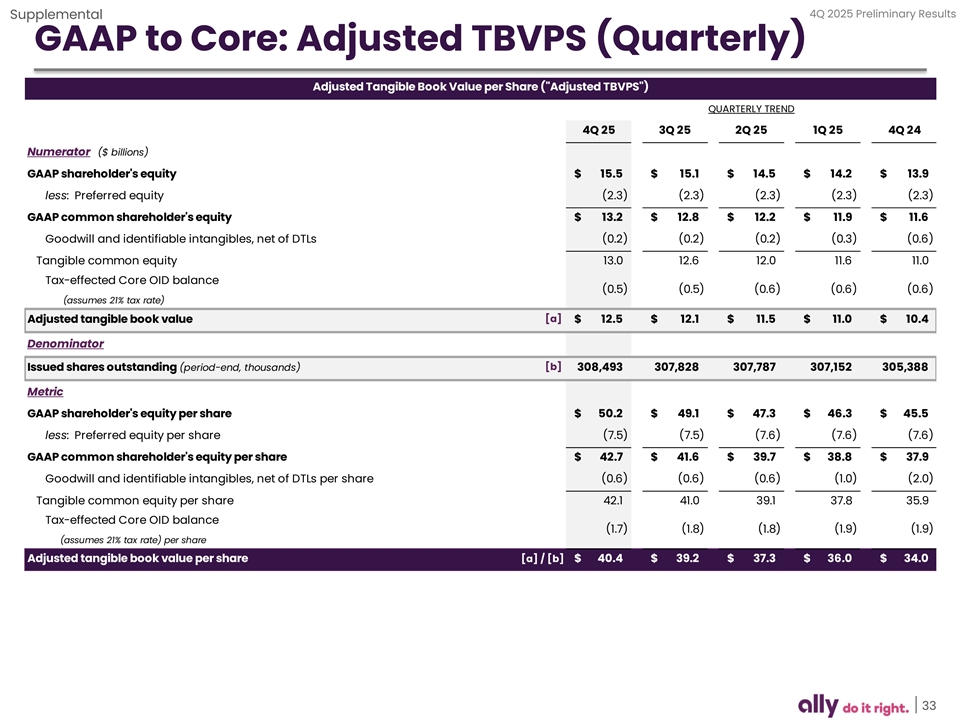
4Q 2025 Preliminary Results Supplemental GAAP to Core: Adjusted TBVPS (Quarterly) Adjusted Tangible Book Value per Share ( Adjusted TBVPS ) QUARTERLY TREND 4Q 25 3Q 25 2Q 25 1Q 25 4Q 24 Numerator ($ billions) GAAP shareholder's equity $ 15.5 $ 15.1 $ 14.5 $ 14.2 $ 13.9 less: Preferred equity (2.3) (2.3) (2.3) (2.3) (2.3) GAAP common shareholder's equity $ 1 3.2 $ 12.8 $ 12.2 $ 11.9 $ 11.6 Goodwill and identifiable intangibles, net of DTLs (0.2) (0.2) (0.2) (0.3) ( 0.6) Tangible common equity 13.0 12.6 12.0 11.6 11.0 Tax-effected Core OID balance (0.5) (0.5) (0.6) ( 0.6) (0.6) (assumes 21% tax rate) Adjusted tangible book value [a] $ 12.5 $ 1 2.1 $ 11.5 $ 11.0 $ 10.4 Denominator Issued shares outstanding (period-end, thousands) [b] 308,493 307,828 307,787 3 07,152 305,388 Metric GAAP shareholder's equity per share $ 50.2 $ 49.1 $ 47.3 $ 46.3 $ 45.5 less: Preferred equity per share (7.5) (7.5) (7.6) (7.6) (7.6) GAAP common shareholder's equity per share $ 4 2.7 $ 41.6 $ 39.7 $ 38.8 $ 37.9 Goodwill and identifiable intangibles, net of DTLs per share (0.6) (0.6) ( 0.6) (1.0) (2.0) Tangible common equity per share 42.1 41.0 39.1 37.8 35.9 Tax-effected Core OID balance (1.7) (1.8) (1.8) (1.9) (1.9) (assumes 21% tax rate) per share Adjusted tangible book value per share [a] / [b] $ 4 0.4 $ 39.2 $ 37.3 $ 36.0 $ 34.0 33
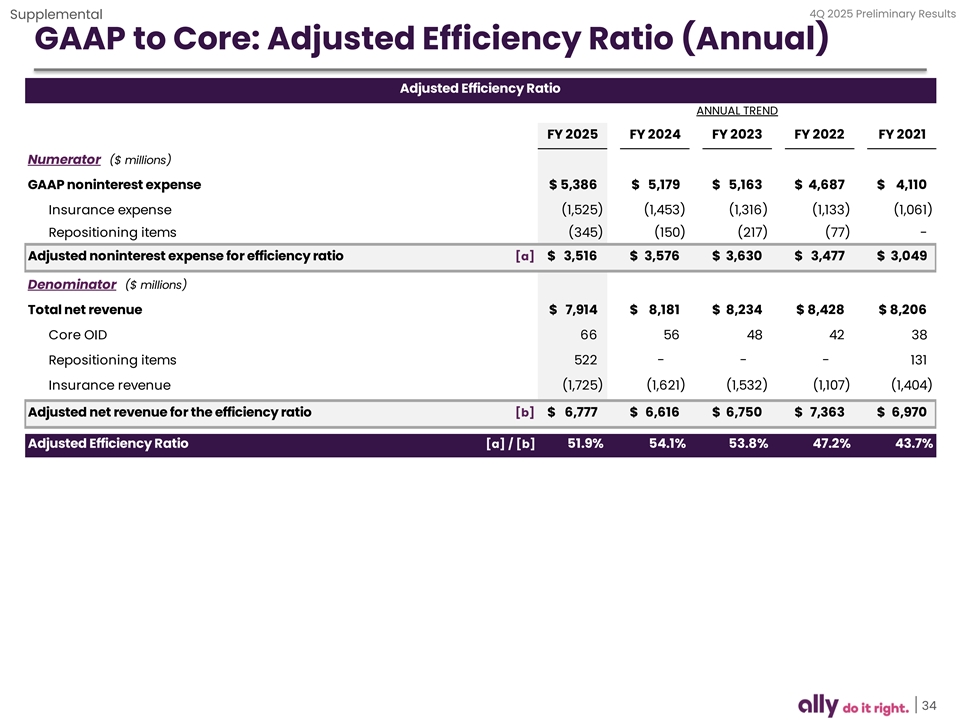
4Q 2025 Preliminary Results Supplemental GAAP to Core: Adjusted Efficiency Ratio (Annual) Adjusted Efficiency Ratio ANNUAL TREND FY 2025 FY 2024 FY 2023 FY 2022 FY 2021 Numerator ($ millions) GAAP noninterest expense $ 5,386 $ 5,179 $ 5 ,163 $ 4 ,687 $ 4 ,110 Insurance expense (1,525) (1,453) ( 1,316) (1,133) (1,061) Repositioning items (345) ( 150) (217) ( 77) - Adjusted noninterest expense for efficiency ratio [a] $ 3,516 $ 3,576 $ 3,630 $ 3,477 $ 3 ,049 Denominator ($ millions) Total net revenue $ 7,914 $ 8,181 $ 8 ,234 $ 8 ,428 $ 8,206 Core OID 66 56 48 42 38 Repositioning items 522 - - - 131 Insurance revenue (1,725) (1,621) ( 1,532) (1,107) ( 1,404) Adjusted net revenue for the efficiency ratio [b] $ 6,777 $ 6,616 $ 6 ,750 $ 7,363 $ 6,970 Adjusted Efficiency Ratio [a] / [b] 51.9% 54.1% 53.8% 47.2% 43.7% 34
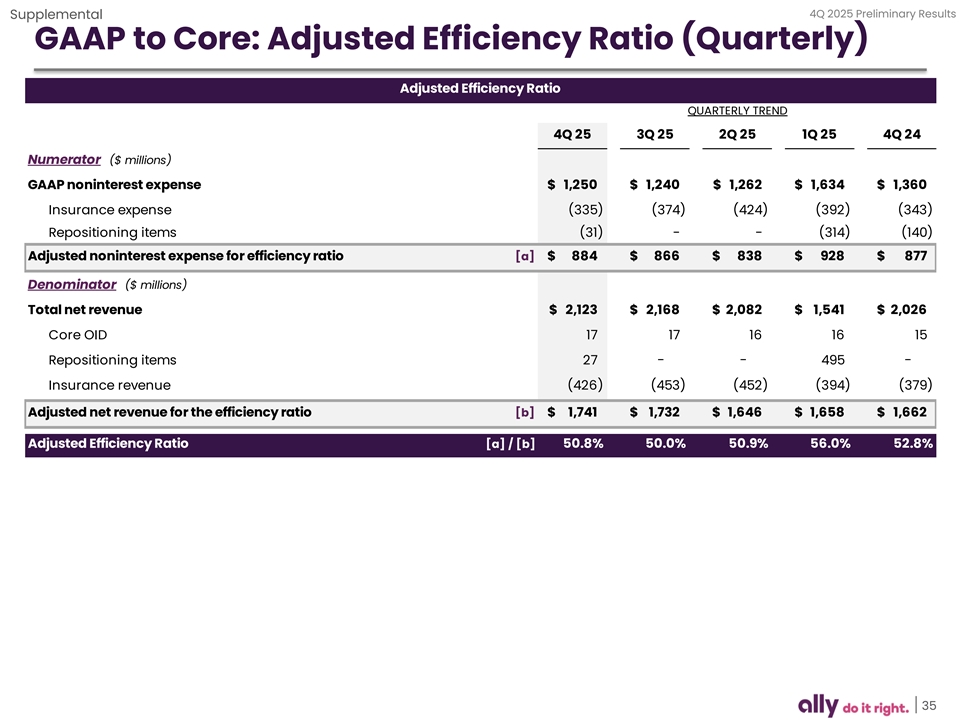
4Q 2025 Preliminary Results Supplemental GAAP to Core: Adjusted Efficiency Ratio (Quarterly) Adjusted Efficiency Ratio QUARTERLY TREND 4Q 25 3Q 25 2Q 25 1Q 25 4Q 24 Numerator ($ millions) GAAP noninterest expense $ 1,250 $ 1 ,240 $ 1 ,262 $ 1,634 $ 1,360 Insurance expense (335) (374) ( 424) (392) (343) Repositioning items (31) - - ( 314) ( 140) Adjusted noninterest expense for efficiency ratio [a] $ 884 $ 866 $ 838 $ 928 $ 877 Denominator ($ millions) Total net revenue $ 2 ,123 $ 2,168 $ 2,082 $ 1,541 $ 2,026 Core OID 17 17 16 16 15 Repositioning items 27 - - 495 - Insurance revenue ( 426) ( 453) ( 452) ( 394) (379) Adjusted net revenue for the efficiency ratio [b] $ 1,741 $ 1,732 $ 1,646 $ 1,658 $ 1,662 Adjusted Efficiency Ratio [a] / [b] 50.8% 50.0% 50.9% 56.0% 52.8% 35
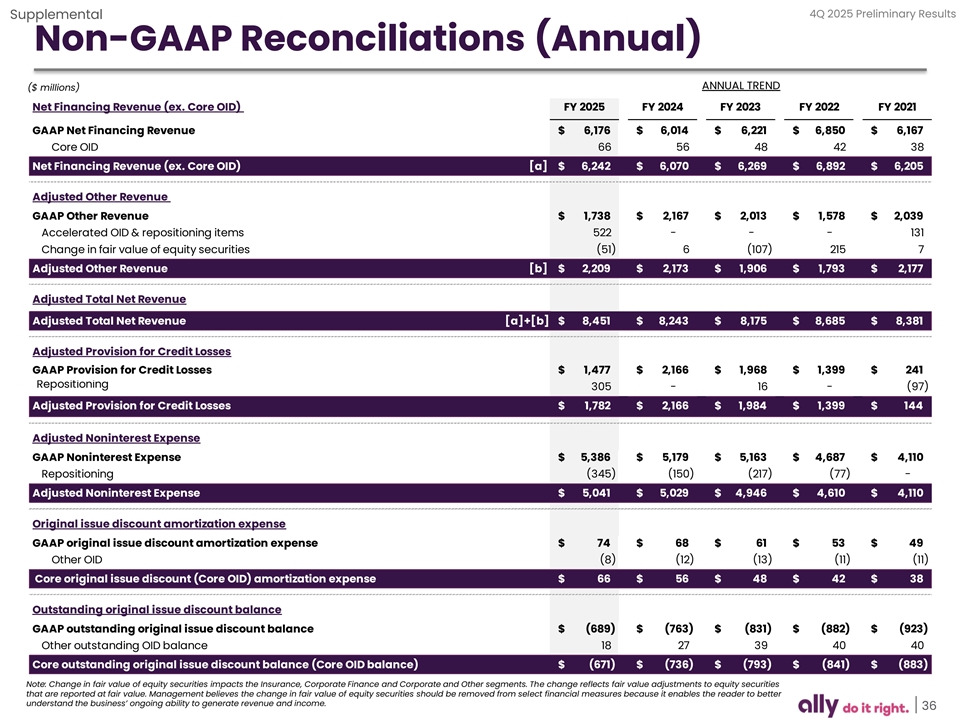
4Q 2025 Preliminary Results Supplemental Non-GAAP Reconciliations (Annual) ANNUAL TREND ($ millions) Net Financing Revenue (ex. Core OID) FY 2025 FY 2024 FY 2023 FY 2022 FY 2021 GAAP Net Financing Revenue $ 6,176 $ 6,014 $ 6,221 $ 6 ,850 $ 6,167 Core OID 66 56 48 42 38 Net Financing Revenue (ex. Core OID) [a] $ 6,242 $ 6,070 $ 6,269 $ 6,892 $ 6,205 Adjusted Other Revenue GAAP Other Revenue $ 1,738 $ 2,167 $ 2,013 $ 1,578 $ 2,039 Accelerated OID & repositioning items 522 - - - 131 Change in fair value of equity securities (51) 6 (107) 215 7 Adjusted Other Revenue [b] $ 2,209 $ 2,173 $ 1 ,906 $ 1,793 $ 2 ,177 Adjusted Total Net Revenue Adjusted Total Net Revenue [a]+[b] $ 8,451 $ 8,243 $ 8,175 $ 8,685 $ 8 ,381 Adjusted Provision for Credit Losses GAAP Provision for Credit Losses $ 1,477 $ 2,166 $ 1,968 $ 1 ,399 $ 2 41 Repositioning 305 - 16 - (97) Adjusted Provision for Credit Losses $ 1,782 $ 2,166 $ 1,984 $ 1 ,399 $ 144 Adjusted Noninterest Expense GAAP Noninterest Expense $ 5 ,386 $ 5,179 $ 5,163 $ 4 ,687 $ 4,110 Repositioning (345) ( 150) (217) (77) - Adjusted Noninterest Expense $ 5,041 $ 5,029 $ 4,946 $ 4,610 $ 4,110 Original issue discount amortization expense GAAP original issue discount amortization expense $ 74 $ 68 $ 61 $ 53 $ 49 Other OID ( 8) (12) (13) ( 11) ( 11) Core original issue discount (Core OID) amortization expense $ 66 $ 56 $ 48 $ 42 $ 38 Outstanding original issue discount balance GAAP outstanding original issue discount balance $ (689) $ (763) $ ( 831) $ (882) $ (923) Other outstanding OID balance 18 27 39 40 40 Core outstanding original issue discount balance (Core OID balance) $ (671) $ (736) $ (793) $ (841) $ ( 883) Note: Change in fair value of equity securities impacts the Insurance, Corporate Finance and Corporate and Other segments. The change reflects fair value adjustments to equity securities that are reported at fair value. Management believes the change in fair value of equity securities should be removed from select financial measures because it enables the reader to better understand the business’ ongoing ability to generate revenue and income. 36
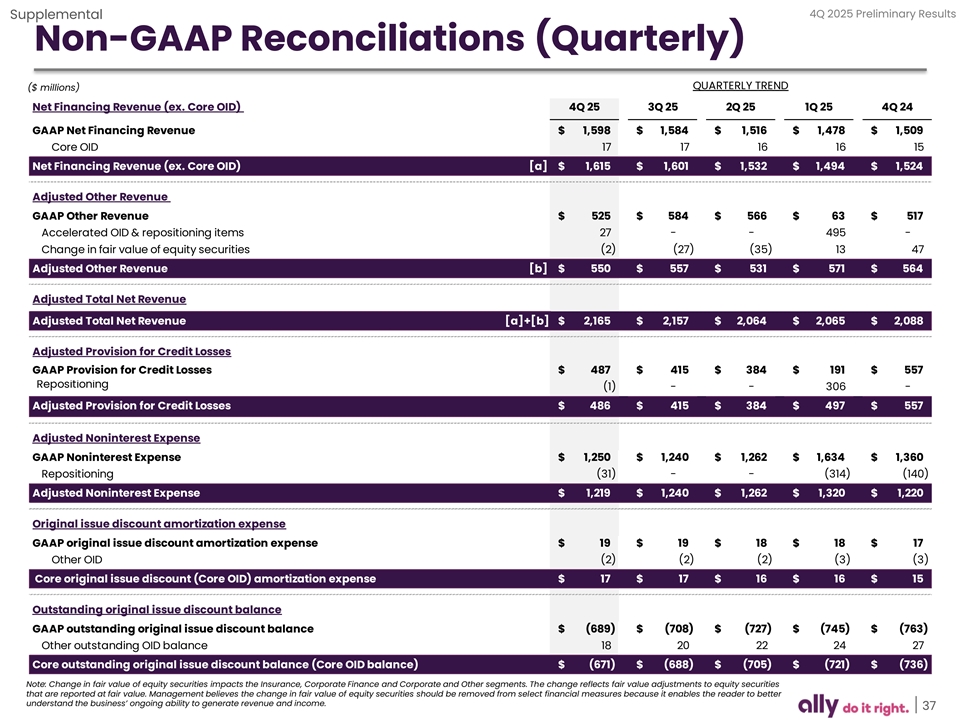
4Q 2025 Preliminary Results Supplemental Non-GAAP Reconciliations (Quarterly) QUARTERLY TREND ($ millions) Net Financing Revenue (ex. Core OID) 4Q 25 3Q 25 2Q 25 1Q 25 4Q 24 GAAP Net Financing Revenue $ 1,598 $ 1,584 $ 1,516 $ 1 ,478 $ 1,509 Core OID 17 17 16 16 15 Net Financing Revenue (ex. Core OID) [a] $ 1 ,615 $ 1,601 $ 1,532 $ 1,494 $ 1 ,524 Adjusted Other Revenue GAAP Other Revenue $ 525 $ 584 $ 5 66 $ 63 $ 517 Accelerated OID & repositioning items 27 - - 495 - Change in fair value of equity securities (2) ( 27) (35) 13 47 Adjusted Other Revenue [b] $ 550 $ 557 $ 5 31 $ 571 $ 564 Adjusted Total Net Revenue Adjusted Total Net Revenue [a]+[b] $ 2,165 $ 2,157 $ 2 ,064 $ 2,065 $ 2,088 Adjusted Provision for Credit Losses GAAP Provision for Credit Losses $ 487 $ 415 $ 384 $ 1 91 $ 557 Repositioning (1) - - 306 - Adjusted Provision for Credit Losses $ 486 $ 415 $ 384 $ 4 97 $ 557 Adjusted Noninterest Expense GAAP Noninterest Expense $ 1,250 $ 1,240 $ 1,262 $ 1,634 $ 1,360 Repositioning (31) - - (314) (140) Adjusted Noninterest Expense $ 1,219 $ 1,240 $ 1,262 $ 1,320 $ 1,220 Original issue discount amortization expense GAAP original issue discount amortization expense $ 19 $ 19 $ 18 $ 18 $ 17 Other OID (2) (2) (2) ( 3) (3) Core original issue discount (Core OID) amortization expense $ 17 $ 17 $ 16 $ 16 $ 15 Outstanding original issue discount balance GAAP outstanding original issue discount balance $ ( 689) $ (708) $ ( 727) $ (745) $ (763) Other outstanding OID balance 18 20 22 24 27 Core outstanding original issue discount balance (Core OID balance) $ (671) $ ( 688) $ (705) $ (721) $ (736) Note: Change in fair value of equity securities impacts the Insurance, Corporate Finance and Corporate and Other segments. The change reflects fair value adjustments to equity securities that are reported at fair value. Management believes the change in fair value of equity securities should be removed from select financial measures because it enables the reader to better understand the business’ ongoing ability to generate revenue and income. 37