.3 FOURTH QUARTER 2025 FINANCIAL SUPPLEMENT
ALLY FINANCIAL INC. FORWARD-LOOKING STATEMENTS AND ADDITIONAL INFORMATION This document and related communications should be read in conjunction with the financial statements, notes, and other information contained in our Annual Reports on Form 10-K, Quarterly Reports on Form 10-Q, and Current Reports on Form 8-K. This information is preliminary and based on company and third-party data available at the time of the presentation or related communication. This document and related communications contain forward-looking statements within the meaning of the Private Securities Litigation Reform Act of 1995. These statements can be identified by the fact that they do not relate strictly to historical or current facts—such as statements about the outlook for financial and operating metrics and performance and future capital allocation and actions. Forward-looking statements often use words such as “believe,” “expect,” “anticipate,” “intend,” “pursue,” “seek,” “continue,” “estimate,” “project,” “outlook,” “forecast,” “potential,” “target,” “objective,” “trend,” “plan,” “goal,” “initiative,” “priorities,” or other words of comparable meaning or future-tense or conditional verbs such as “may,” “will,” “should,” “would,” or “could.” Forward-looking statements convey our expectations, intentions, or forecasts about future events, circumstances, or results. All forward-looking statements, by their nature, are subject to assumptions, risks, and uncertainties, which may change over time and many of which are beyond our control. In particular, forward-looking statements about Ally’s outlook, including expectations regarding net interest margin, adjusted other revenue, net-charge offs, non-interest expenses and average earning assets, and other forward-looking statements are based on our current expectations and are subject to various important factors that could cause actual results to differ materially, including general economic conditions, expectations regarding interest rates and inflation, monetary and fiscal policies in the United States and other jurisdictions, the composition of our balance sheet, including with respect to our loan and securities portfolios, the impact of our strategic initiatives, including recent initiatives involving our Credit Card and Mortgage operations, demand for new and used vehicles, demand for auto loans and leases and the impact of escalating tariffs and other trade policies on us, our customers and our strategic partners, and the economic impacts, volatility and uncertainty resulting therefrom. You should not rely on any forward-looking statement as a prediction or guarantee about the future. Actual future objectives, strategies, plans, prospects, performance, conditions, or results may differ materially from those set forth in any forward-looking statement. Some of the factors that may cause actual results or other future events or circumstances to differ from those in forward-looking statements are described above and in our Annual Report on Form 10-K for the year ended December 31, 2024, our subsequent Quarterly Reports on Form 10-Q or Current Reports on Form 8-K, or other applicable documents that are filed or furnished with the U.S. Securities and Exchange Commission (collectively, our “SEC filings”). Any forward-looking statement made by us or on our behalf speaks only as of the date that it was made. We do not undertake to update any forward-looking statement to reflect the impact of events, circumstances, or results that arise after the date that the statement was made, except as required by applicable securities laws. You, however, should consult further disclosures (including disclosures of a forward-looking nature) that we may make in any subsequent SEC filings. This document and related communications contain specifically identified non-GAAP financial measures, which supplement the results that are reported according to U.S. generally accepted accounting principles (“GAAP”). These non-GAAP financial measures may be useful to investors but should not be viewed in isolation from, or as a substitute for, GAAP results. Differences between non-GAAP financial measures and comparable GAAP financial measures are reconciled in the presentation. This presentation also includes forward-looking non-GAAP financial measures, such as outlooks for Net Interest Margin (ex. OID), Adjusted Other Revenue and Adjusted Noninterest Expense. We are unable to provide a reconciliation of these forward-looking non-GAAP financial measures to their most directly comparable GAAP financial measures because we are unable to provide, without unreasonable effort, a meaningful or accurate calculation or estimation of amounts that would be necessary for the reconciliation due to the inherent difficulty in forecasting and quantifying the occurrence and financial impact of various items that have not yet occurred, are out of our control or cannot be reasonably predicted. Forward-looking non-GAAP financial measures may vary materially from the corresponding GAAP financial measures. Unless the context otherwise requires, the following definitions apply. The term “loans” means the following consumer and commercial products associated with our direct and indirect financing activities: loans, retail installment sales contracts, lines of credit, and other financing products excluding operating leases. The term “operating leases” means consumer- and commercial-vehicle lease agreements where Ally is the lessor and the lessee is generally not obligated to acquire ownership of the vehicle at lease-end or compensate Ally for the vehicle’s residual value. The terms “lend,” “finance,” and “originate” mean our direct extension or origination of loans, our purchase or acquisition of loans, or our purchase of operating leases, as applicable. The term “consumer” means all consumer products associated with our loan and operating-lease activities and all commercial retail installment sales contracts. The term “commercial” means all commercial products associated with our loan activities, other than commercial retail installment sales contracts. The term “partnerships” means business arrangements rather than partnerships as defined by law. consumer products associated with our loan and operating-lease activities and all commercial retail installment sales contracts. The term “commercial” means all commercial products associated with our loan activities, other than commercial retail installment sales contracts. The term “partnerships” means business arrangements rather than partnerships as defined by law. 2
ALLY FINANCIAL INC. TABLE OF CONTENTS Page(s) Consolidated Results Consolidated Financial Highlights 4 Consolidated Income Statement 5 Consolidated Period-End Balance Sheet 6 Consolidated Average Balance Sheet 7 Segment Detail Segment Highlights 8 Automotive Finance 9-10 Insurance 11 Corporate Finance 12 Corporate and Other 13 Credit Related Information 14-15 Supplemental Detail Capital 16 Liquidity and Deposits 17 Net Interest Margin 18 Earnings Per Share Related Information 19 Adjusted Tangible Book Per Share Related Information 20 Core ROTCE Related Information 21 Adjusted Efficiency Ratio Related Information 22 3
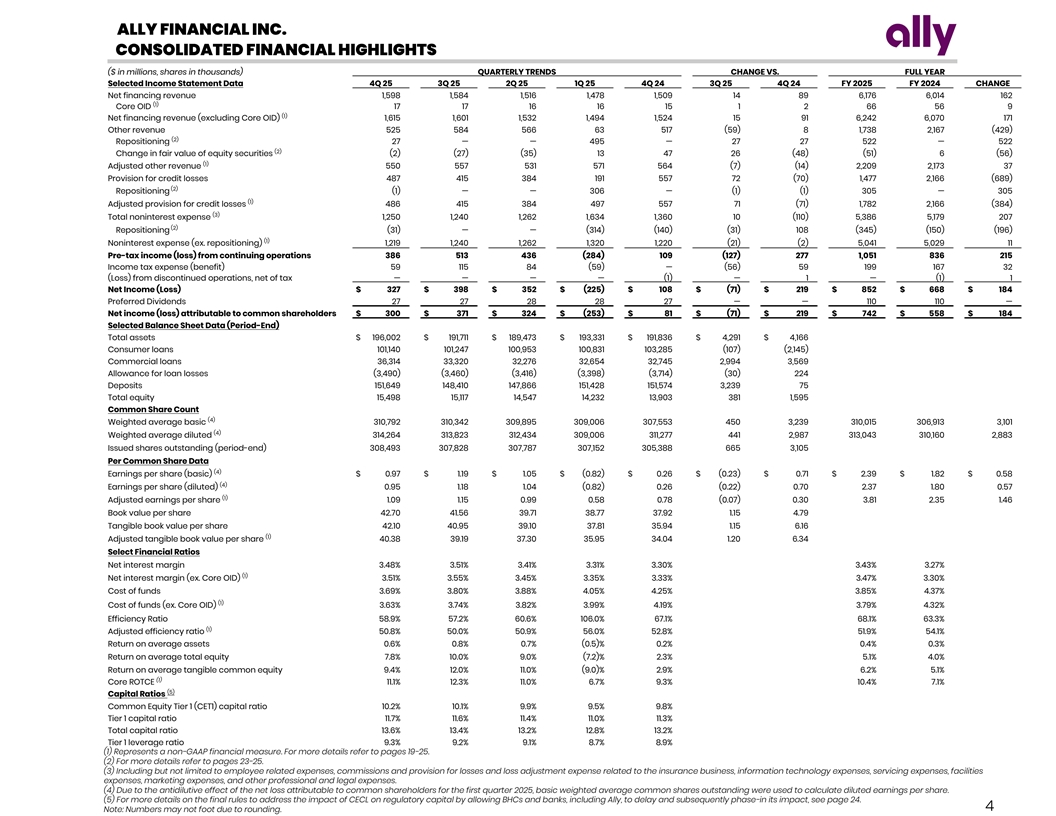
ALLY FINANCIAL INC. CONSOLIDATED FINANCIAL HIGHLIGHTS ($ in millions, shares in thousands) QUARTERLY TRENDS CHANGE VS. FULL YEAR Selected Income Statement Data 4Q 25 3Q 25 2Q 25 1Q 25 4Q 24 3Q 25 4Q 24 FY 2025 FY 2024 CHANGE Net financing revenue 1,598 1,584 1,516 1,478 1,509 14 89 6,176 6,014 162 (1) Core OID 17 17 16 16 15 1 2 66 56 9 (1) Net financing revenue (excluding Core OID) 1,615 1,601 1,532 1,494 1,524 15 91 6,242 6,070 171 Other revenue 525 584 566 63 517 (59) 8 1,738 2,167 (429) (2) Repositioning 27 — — 495 — 27 27 522 — 522 (2) Change in fair value of equity securities (2) (27) (35) 13 47 26 (48) (51) 6 (56) (1) Adjusted other revenue 550 557 531 571 564 (7) (14) 2,209 2,173 37 Provision for credit losses 487 415 384 191 557 72 (70) 1,477 2,166 (689) (2) Repositioning (1) — — 306 — (1) (1) 305 — 305 (1) Adjusted provision for credit losses 486 415 384 497 557 71 (71) 1,782 2,166 (384) (3) Total noninterest expense 1,250 1,240 1,262 1,634 1,360 10 (110) 5,386 5,179 207 (2) Repositioning (31) — — (314) (140) (31) 108 (345) (150) (196) (1) Noninterest expense (ex. repositioning) 1,219 1,240 1,262 1,320 1,220 (21) (2) 5,041 5,029 11 Pre-tax income (loss) from continuing operations 386 513 436 (284) 109 (127) 277 1,051 836 215 Income tax expense (benefit) 59 115 84 (59) — (56) 59 199 167 32 (Loss) from discontinued operations, net of tax — — — — (1) — 1 — (1) 1 Net Income (Loss) $ 327 $ 398 $ 352 $ (225) $ 108 $ (71) $ 219 $ 852 $ 668 $ 184 Preferred Dividends 27 27 28 28 27 — — 110 110 — Net income (loss) attributable to common shareholders $ 300 $ 371 $ 324 $ (253) $ 81 $ (71) $ 219 $ 742 $ 558 $ 184 Selected Balance Sheet Data (Period-End) Total assets $ 196,002 $ 191,711 $ 189,473 $ 193,331 $ 191,836 $ 4,291 $ 4,166 Consumer loans 101,140 101,247 100,953 100,831 103,285 (107) (2,145) Commercial loans 36,314 33,320 32,276 32,654 32,745 2,994 3,569 Allowance for loan losses (3,490) (3,460) (3,416) (3,398) (3,714) (30) 224 Deposits 151,649 148,410 147,866 151,428 151,574 3,239 75 Total equity 15,498 15,117 14,547 14,232 13,903 381 1,595 Common Share Count (4) Weighted average basic 310,792 310,342 309,895 309,006 307,553 450 3,239 310,015 306,913 3,101 (4) Weighted average diluted 314,264 313,823 312,434 309,006 311,277 441 2,987 313,043 310,160 2,883 Issued shares outstanding (period-end) 308,493 307,828 307,787 307,152 305,388 665 3,105 Per Common Share Data (4) Earnings per share (basic) $ 0.97 $ 1.19 $ 1.05 $ (0.82) $ 0.26 $ (0.23) $ 0.71 $ 2.39 $ 1.82 $ 0.58 (4) Earnings per share (diluted) 0.95 1.18 1.04 (0.82) 0.26 (0.22) 0.70 2.37 1.80 0.57 (1) Adjusted earnings per share 1.09 1.15 0.99 0.58 0.78 (0.07) 0.30 3.81 2.35 1.46 Book value per share 42.70 41.56 39.71 38.77 37.92 1.15 4.79 Tangible book value per share 42.10 40.95 39.10 37.81 35.94 1.15 6.16 (1) Adjusted tangible book value per share 40.38 39.19 37.30 35.95 34.04 1.20 6.34 Select Financial Ratios Net interest margin 3 .48% 3 .51% 3.41 % 3.31% 3.30 % 3 .43 % 3.27 % (1) Net interest margin (ex. Core OID) 3 .51 % 3.55% 3 .45% 3.35% 3.33% 3.47 % 3.30% Cost of funds 3.69% 3.80 % 3 .88 % 4 .05 % 4 .25 % 3.85 % 4.37% (1) Cost of funds (ex. Core OID) 3.63% 3.74 % 3 .82% 3.99 % 4.19% 3.79% 4.32% Efficiency Ratio 5 8.9% 57.2 % 60.6 % 106.0% 6 7.1% 68.1% 63.3% (1) Adjusted efficiency ratio 50.8 % 50.0% 5 0.9% 56.0% 52.8% 5 1.9% 5 4.1 % Return on average assets 0.6% 0 .8 % 0.7% ( 0.5) % 0 .2 % 0 .4 % 0.3% Return on average total equity 7.8% 1 0.0% 9 .0 % ( 7.2)% 2 .3 % 5.1% 4 .0% Return on average tangible common equity 9 .4% 12.0% 11.0% (9.0) % 2.9 % 6 .2% 5.1 % (1) Core ROTCE 1 1.1% 12.3% 11.0 % 6.7% 9 .3 % 10.4% 7 .1 % (5) Capital Ratios Common Equity Tier 1 (CET1) capital ratio 1 0.2% 10.1 % 9.9% 9 .5 % 9.8% Tier 1 capital ratio 11.7% 1 1.6% 1 1.4% 11.0% 11.3% Total capital ratio 1 3.6% 1 3.4% 13.2% 12.8 % 1 3.2 % Tier 1 leverage ratio 9.3% 9 .2% 9.1% 8.7 % 8.9% (1) Represents a non-GAAP financial measure. For more details refer to pages 19-25. (2) For more details refer to pages 23-25. (3) Including but not limited to employee related expenses, commissions and provision for losses and loss adjustment expense related to the insurance business, information technology expenses, servicing expenses, facilities expenses, marketing expenses, and other professional and legal expenses. (4) Due to the antidilutive effect of the net loss attributable to common shareholders for the first quarter 2025, basic weighted average common shares outstanding were used to calculate diluted earnings per share. (5) For more details on the final rules to address the impact of CECL on regulatory capital by allowing BHCs and banks, including Ally, to delay and subsequently phase-in its impact, see page 24. 4 Note: Numbers may not foot due to rounding.
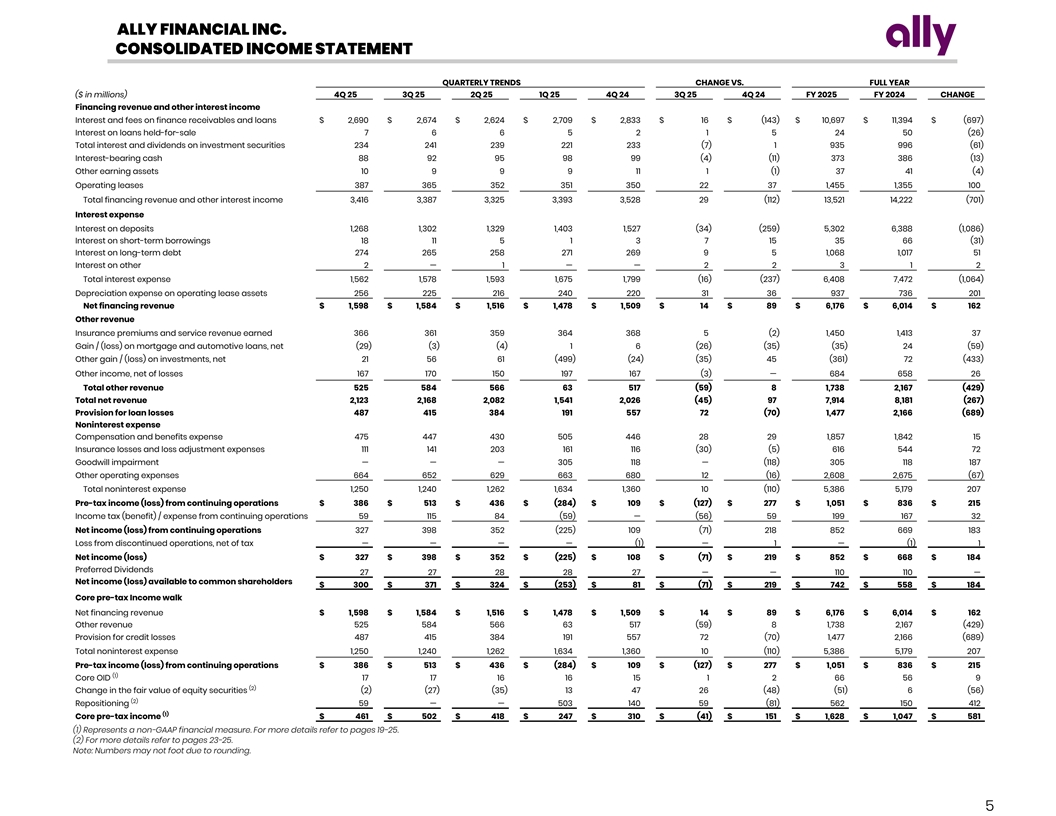
ALLY FINANCIAL INC. CONSOLIDATED INCOME STATEMENT QUARTERLY TRENDS CHANGE VS. FULL YEAR ($ in millions) 4Q 25 3Q 25 2Q 25 1Q 25 4Q 24 3Q 25 4Q 24 FY 2025 FY 2024 CHANGE Financing revenue and other interest income Interest and fees on finance receivables and loans $ 2,690 $ 2,674 $ 2,624 $ 2,709 $ 2,833 $ 16 $ (143) $ 10,697 $ 11,394 $ (697) Interest on loans held-for-sale 7 6 6 5 2 1 5 24 50 (26) Total interest and dividends on investment securities 234 241 239 221 233 (7) 1 935 996 (61) Interest-bearing cash 88 92 95 98 99 (4) (11) 373 386 (13) Other earning assets 10 9 9 9 11 1 (1) 37 41 (4) Operating leases 387 365 352 351 350 22 37 1,455 1,355 100 Total financing revenue and other interest income 3,416 3,387 3,325 3,393 3,528 29 (112) 13,521 14,222 (701) Interest expense Interest on deposits 1,268 1,302 1,329 1,403 1,527 (34) (259) 5,302 6,388 (1,086) Interest on short-term borrowings 18 11 5 1 3 7 15 35 66 (31) Interest on long-term debt 274 265 258 271 269 9 5 1,068 1,017 51 Interest on other 2 — 1 — — 2 2 3 1 2 Total interest expense 1,562 1,578 1,593 1,675 1,799 (16) (237) 6,408 7,472 (1,064) Depreciation expense on operating lease assets 256 225 216 240 220 31 36 937 736 201 Net financing revenue $ 1,598 $ 1,584 $ 1,516 $ 1,478 $ 1,509 $ 14 $ 89 $ 6,176 $ 6,014 $ 162 Other revenue Insurance premiums and service revenue earned 366 361 359 364 368 5 (2) 1,450 1,413 37 Gain / (loss) on mortgage and automotive loans, net (29) (3) (4) 1 6 (26) (35) (35) 24 (59) Other gain / (loss) on investments, net 21 56 61 (499) (24) (35) 45 (361) 72 (433) Other income, net of losses 167 170 150 197 167 (3) — 684 658 26 Total other revenue 525 584 566 63 517 (59) 8 1,738 2,167 (429) Total net revenue 2,123 2,168 2,082 1,541 2,026 (45) 97 7,914 8,181 (267) Provision for loan losses 487 415 384 191 557 72 (70) 1,477 2,166 (689) Noninterest expense Compensation and benefits expense 475 447 430 505 446 28 29 1,857 1,842 15 Insurance losses and loss adjustment expenses 111 141 203 161 116 (30) (5) 616 544 72 Goodwill impairment — — — 305 118 — (118) 305 118 187 Other operating expenses 664 652 629 663 680 12 (16) 2,608 2,675 (67) Total noninterest expense 1,250 1,240 1,262 1,634 1,360 10 (110) 5,386 5,179 207 Pre-tax income (loss) from continuing operations $ 386 $ 513 $ 436 $ (284) $ 109 $ (127) $ 277 $ 1,051 $ 836 $ 215 Income tax (benefit) / expense from continuing operations 59 115 84 (59) — (56) 59 199 167 32 Net income (loss) from continuing operations 327 398 352 (225) 109 (71) 218 852 669 183 Loss from discontinued operations, net of tax — — — — (1) — 1 — (1) 1 Net income (loss) $ 327 $ 398 $ 352 $ (225) $ 108 $ (71) $ 219 $ 852 $ 668 $ 184 Preferred Dividends 27 27 28 28 27 — — 110 110 — Net income (loss) available to common shareholders $ 300 $ 371 $ 324 $ (253) $ 81 $ (71) $ 219 $ 742 $ 558 $ 184 Core pre-tax Income walk Net financing revenue $ 1,598 $ 1,584 $ 1,516 $ 1,478 $ 1,509 $ 14 $ 89 $ 6,176 $ 6,014 $ 162 Other revenue 525 584 566 63 517 (59) 8 1,738 2,167 (429) Provision for credit losses 487 415 384 191 557 72 (70) 1,477 2,166 (689) Total noninterest expense 1,250 1,240 1,262 1,634 1,360 10 (110) 5,386 5,179 207 Pre-tax income (loss) from continuing operations $ 386 $ 513 $ 436 $ (284) $ 109 $ (127) $ 277 $ 1,051 $ 836 $ 215 (1) Core OID 17 17 16 16 15 1 2 66 56 9 (2) Change in the fair value of equity securities (2) (27) (35) 13 47 26 (48) (51) 6 (56) (2) Repositioning 59 — — 503 140 59 (81) 562 150 412 (1) Core pre-tax income $ 461 $ 502 $ 418 $ 247 $ 310 $ (41) $ 151 $ 1,628 $ 1,047 $ 581 (1) Represents a non-GAAP financial measure. For more details refer to pages 19-25. (2) For more details refer to pages 23-25. Note: Numbers may not foot due to rounding. 5
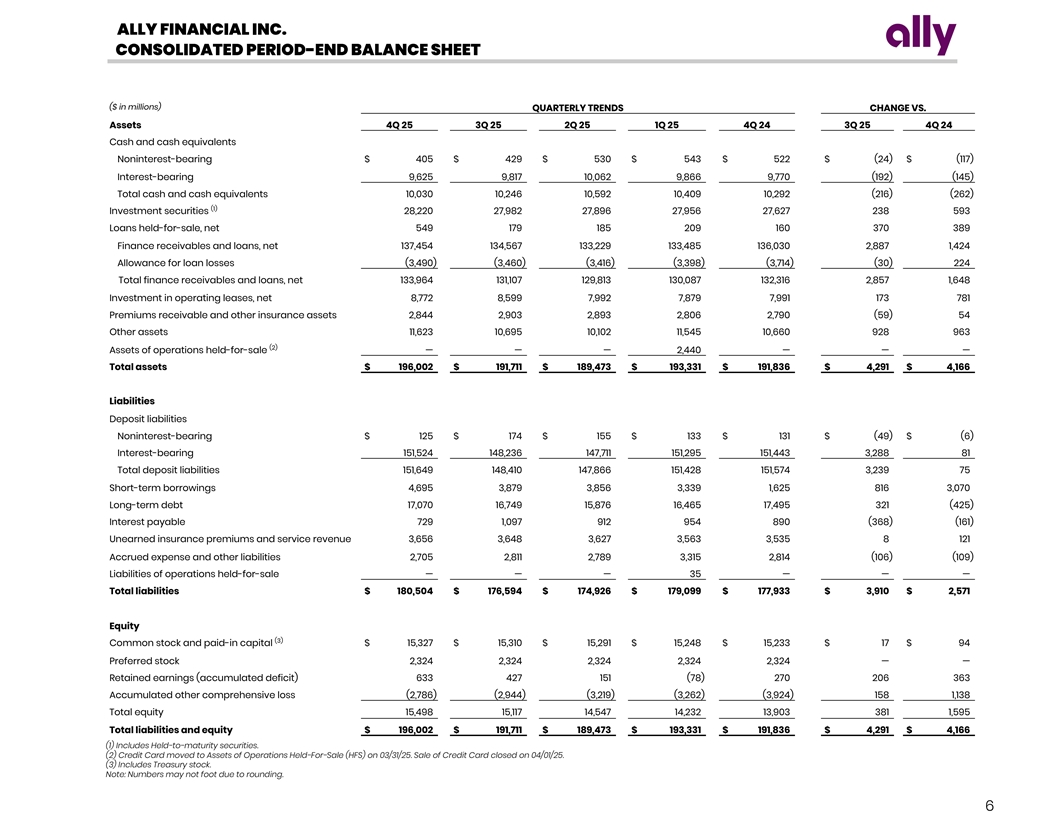
ALLY FINANCIAL INC. CONSOLIDATED PERIOD-END BALANCE SHEET ($ in millions) QUARTERLY TRENDS CHANGE VS. Assets 4Q 25 3Q 25 2Q 25 1Q 25 4Q 24 3Q 25 4Q 24 Cash and cash equivalents Noninterest-bearing $ 405 $ 429 $ 530 $ 543 $ 522 $ (24) $ (117) Interest-bearing 9,625 9,817 10,062 9,866 9,770 (192) (145) Total cash and cash equivalents 10,030 10,246 10,592 10,409 10,292 (216) (262) (1) Investment securities 28,220 27,982 27,896 27,956 27,627 238 593 Loans held-for-sale, net 549 179 185 209 160 370 389 Finance receivables and loans, net 137,454 134,567 133,229 133,485 136,030 2,887 1,424 Allowance for loan losses (3,490) (3,460) (3,416) (3,398) (3,714) (30) 224 Total finance receivables and loans, net 133,964 131,107 129,813 130,087 132,316 2,857 1,648 Investment in operating leases, net 8,772 8,599 7,992 7,879 7,991 173 781 Premiums receivable and other insurance assets 2,844 2,903 2,893 2,806 2,790 (59) 54 Other assets 11,623 10,695 10,102 11,545 10,660 928 963 (2) Assets of operations held-for-sale — — — 2,440 — — — Total assets $ 196,002 $ 191,711 $ 189,473 $ 193,331 $ 191,836 $ 4,291 $ 4,166 Liabilities Deposit liabilities Noninterest-bearing $ 125 $ 174 $ 155 $ 133 $ 131 $ (49) $ (6) Interest-bearing 151,524 148,236 147,711 151,295 151,443 3,288 81 Total deposit liabilities 151,649 148,410 147,866 151,428 151,574 3,239 75 Short-term borrowings 4,695 3,879 3,856 3,339 1,625 816 3,070 Long-term debt 17,070 16,749 15,876 16,465 17,495 321 (425) Interest payable 729 1,097 912 954 890 (368) (161) Unearned insurance premiums and service revenue 3,656 3,648 3,627 3,563 3,535 8 121 Accrued expense and other liabilities 2,705 2,811 2,789 3,315 2,814 (106) (109) Liabilities of operations held-for-sale — — — 35 — — — Total liabilities $ 180,504 $ 176,594 $ 174,926 $ 179,099 $ 177,933 $ 3,910 $ 2,571 Equity (3) Common stock and paid-in capital $ 15,327 $ 15,310 $ 15,291 $ 15,248 $ 15,233 $ 17 $ 94 Preferred stock 2,324 2,324 2,324 2,324 2,324 — — Retained earnings (accumulated deficit) 633 427 151 (78) 270 206 363 Accumulated other comprehensive loss (2,786) (2,944) (3,219) (3,262) (3,924) 158 1,138 Total equity 15,498 15,117 14,547 14,232 13,903 381 1,595 Total liabilities and equity $ 196,002 $ 191,711 $ 189,473 $ 193,331 $ 191,836 $ 4,291 $ 4,166 (1) Includes Held-to-maturity securities. (2) Credit Card moved to Assets of Operations Held-For-Sale (HFS) on 03/31/25. Sale of Credit Card closed on 04/01/25. (3) Includes Treasury stock. Note: Numbers may not foot due to rounding. 6
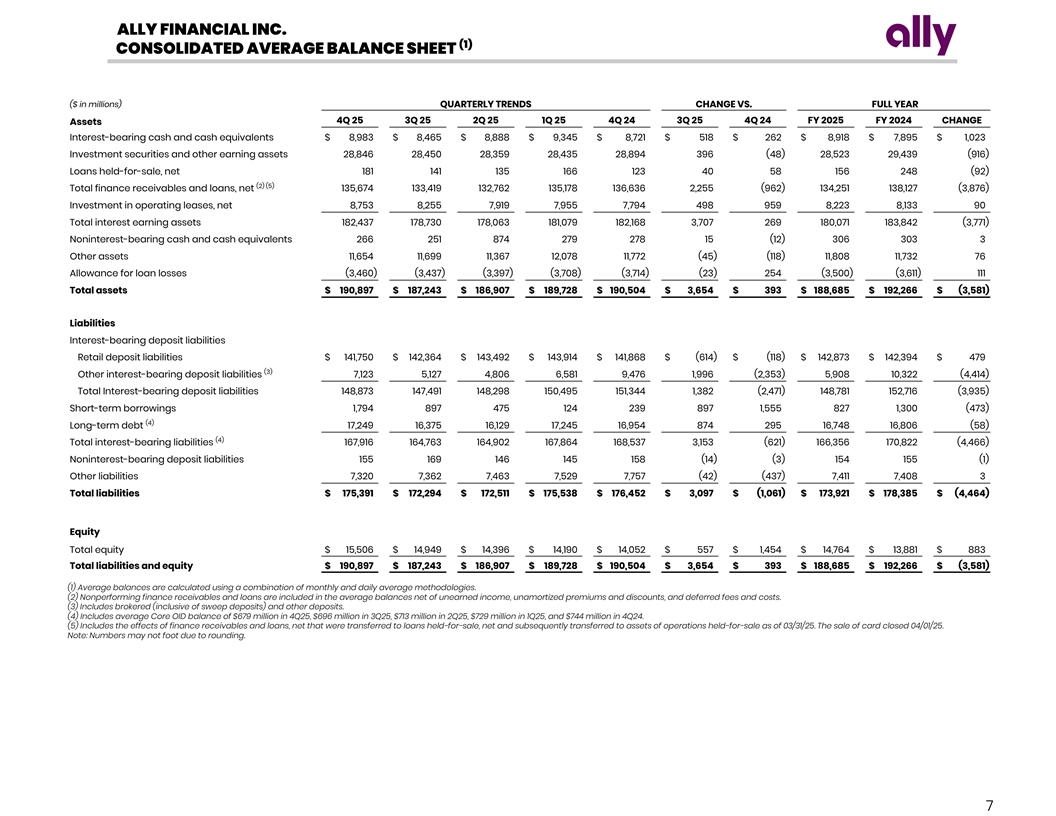
ALLY FINANCIAL INC. (1) CONSOLIDATED AVERAGE BALANCE SHEET ($ in millions) QUARTERLY TRENDS CHANGE VS. FULL YEAR 4Q 25 3Q 25 2Q 25 1Q 25 4Q 24 3Q 25 4Q 24 FY 2025 FY 2024 CHANGE Assets Interest-bearing cash and cash equivalents $ 8,983 $ 8,465 $ 8,888 $ 9,345 $ 8,721 $ 518 $ 262 $ 8,918 $ 7,895 $ 1,023 Investment securities and other earning assets 28,846 28,450 28,359 28,435 28,894 396 (48) 28,523 29,439 (916) Loans held-for-sale, net 181 141 135 166 123 40 58 156 248 (92) (2) (5) Total finance receivables and loans, net 135,674 133,419 132,762 135,178 136,636 2,255 (962) 134,251 138,127 (3,876) Investment in operating leases, net 8,753 8,255 7,919 7,955 7,794 498 959 8,223 8,133 90 Total interest earning assets 182,437 178,730 178,063 181,079 182,168 3,707 269 180,071 183,842 (3,771) Noninterest-bearing cash and cash equivalents 266 251 874 279 278 15 (12) 306 303 3 Other assets 11,654 11,699 11,367 12,078 11,772 (45) (118) 11,808 11,732 76 Allowance for loan losses (3,460) (3,437) (3,397) (3,708) (3,714) (23) 254 (3,500) (3,611) 111 Total assets $ 190,897 $ 187,243 $ 186,907 $ 189,728 $ 190,504 $ 3,654 $ 393 $ 188,685 $ 192,266 $ (3,581) Liabilities Interest-bearing deposit liabilities Retail deposit liabilities $ 141,750 $ 142,364 $ 143,492 $ 143,914 $ 141,868 $ (614) $ (118) $ 142,873 $ 142,394 $ 479 (3) Other interest-bearing deposit liabilities 7,123 5,127 4,806 6,581 9,476 1,996 (2,353) 5,908 10,322 (4,414) Total Interest-bearing deposit liabilities 148,873 147,491 148,298 150,495 151,344 1,382 (2,471) 148,781 152,716 (3,935) Short-term borrowings 1,794 897 475 124 239 897 1,555 827 1,300 (473) (4) Long-term debt 17,249 16,375 16,129 17,245 16,954 874 295 16,748 16,806 (58) (4) Total interest-bearing liabilities 167,916 164,763 164,902 167,864 168,537 3,153 (621) 166,356 170,822 (4,466) Noninterest-bearing deposit liabilities 155 169 146 145 158 (14) (3) 154 155 (1) Other liabilities 7,320 7,362 7,463 7,529 7,757 (42) (437) 7,411 7,408 3 Total liabilities $ 175,391 $ 172,294 $ 172,511 $ 175,538 $ 176,452 $ 3,097 $ (1,061) $ 173,921 $ 178,385 $ (4,464) Equity Total equity $ 15,506 $ 14,949 $ 14,396 $ 14,190 $ 14,052 $ 557 $ 1,454 $ 14,764 $ 13,881 $ 883 Total liabilities and equity $ 190,897 $ 187,243 $ 186,907 $ 189,728 $ 190,504 $ 3,654 $ 393 $ 188,685 $ 192,266 $ (3,581) (1) Average balances are calculated using a combination of monthly and daily average methodologies. (2) Nonperforming finance receivables and loans are included in the average balances net of unearned income, unamortized premiums and discounts, and deferred fees and costs. (3) Includes brokered (inclusive of sweep deposits) and other deposits. (4) Includes average Core OID balance of $679 million in 4Q25, $696 million in 3Q25, $713 million in 2Q25, $729 million in 1Q25, and $744 million in 4Q24. (5) Includes the effects of finance receivables and loans, net that were transferred to loans held-for-sale, net and subsequently transferred to assets of operations held-for-sale as of 03/31/25. The sale of card closed 04/01/25. Note: Numbers may not foot due to rounding. 7
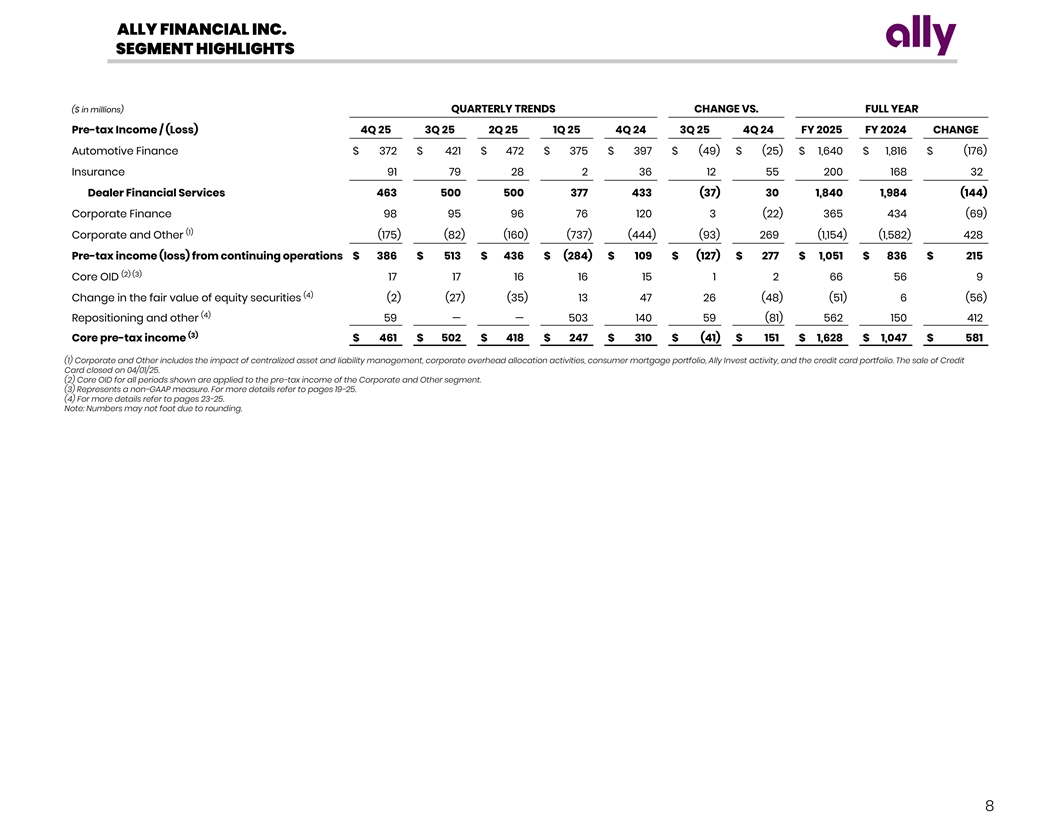
ALLY FINANCIAL INC. SEGMENT HIGHLIGHTS ($ in millions) QUARTERLY TRENDS CHANGE VS. FULL YEAR Pre-tax Income / (Loss) 4Q 25 3Q 25 2Q 25 1Q 25 4Q 24 3Q 25 4Q 24 FY 2025 FY 2024 CHANGE Automotive Finance $ 372 $ 421 $ 472 $ 375 $ 397 $ (49) $ (25) $ 1,640 $ 1,816 $ (176) Insurance 91 79 28 2 36 12 55 200 168 32 Dealer Financial Services 463 500 500 377 433 (37) 30 1,840 1,984 (144) Corporate Finance 98 95 96 76 120 3 (22) 365 434 (69) (1) Corporate and Other (175) (82) (160) (737) (444) (93) 269 (1,154) (1,582) 428 Pre-tax income (loss) from continuing operations $ 386 $ 513 $ 436 $ (284) $ 109 $ (127) $ 277 $ 1,051 $ 836 $ 215 (2) (3) Core OID 17 17 16 16 15 1 2 66 56 9 (4) Change in the fair value of equity securities (2) (27) (35) 13 47 26 (48) (51) 6 (56) (4) Repositioning and other 59 — — 503 140 59 (81) 562 150 412 (3) Core pre-tax income $ 461 $ 502 $ 418 $ 247 $ 310 $ (41) $ 151 $ 1,628 $ 1,047 $ 581 (1) Corporate and Other includes the impact of centralized asset and liability management, corporate overhead allocation activities, consumer mortgage portfolio, Ally Invest activity, and the credit card portfolio. The sale of Credit Card closed on 04/01/25. (2) Core OID for all periods shown are applied to the pre-tax income of the Corporate and Other segment. (3) Represents a non-GAAP measure. For more details refer to pages 19-25. (4) For more details refer to pages 23-25. Note: Numbers may not foot due to rounding. 8
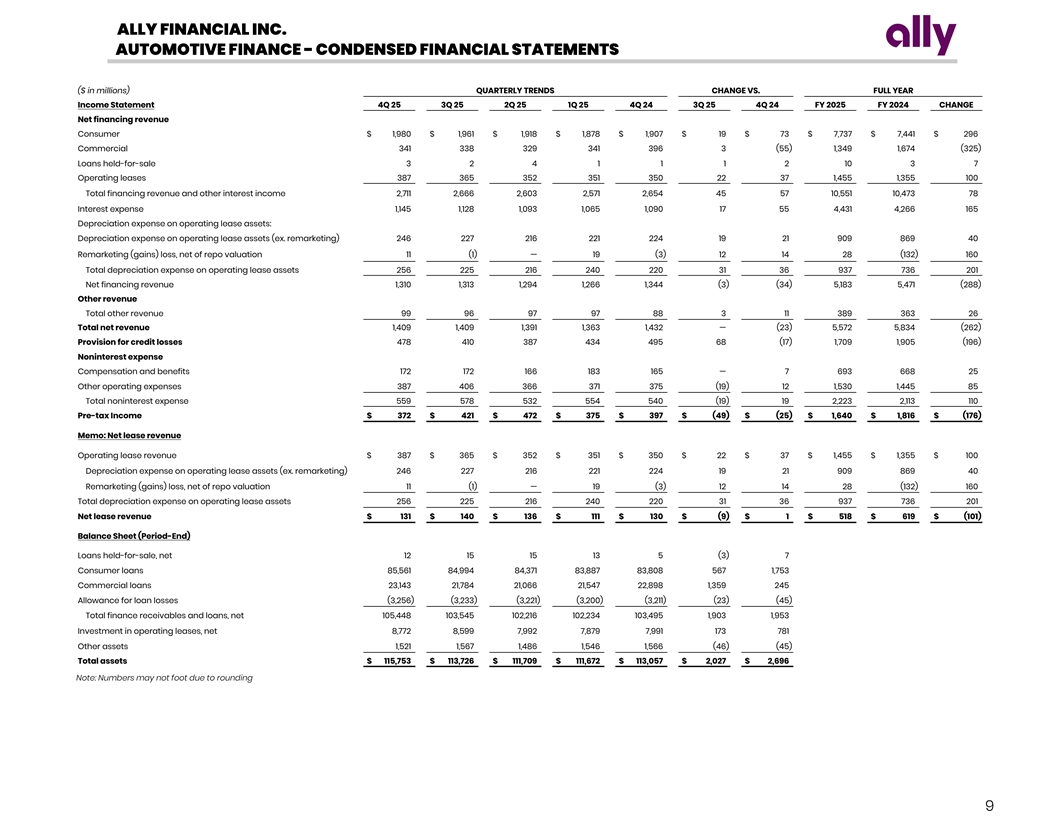
ALLY FINANCIAL INC. AUTOMOTIVE FINANCE - CONDENSED FINANCIAL STATEMENTS ($ in millions) QUARTERLY TRENDS CHANGE VS. FULL YEAR Income Statement 4Q 25 3Q 25 2Q 25 1Q 25 4Q 24 3Q 25 4Q 24 FY 2025 FY 2024 CHANGE Net financing revenue Consumer $ 1,980 $ 1,961 $ 1,918 $ 1,878 $ 1,907 $ 19 $ 73 $ 7,737 $ 7,441 $ 296 Commercial 341 338 329 341 396 3 (55) 1,349 1,674 (325) Loans held-for-sale 3 2 4 1 1 1 2 10 3 7 Operating leases 387 365 352 351 350 22 37 1,455 1,355 100 Total financing revenue and other interest income 2,711 2,666 2,603 2,571 2,654 45 57 10,551 10,473 78 Interest expense 1,145 1,128 1,093 1,065 1,090 17 55 4,431 4,266 165 Depreciation expense on operating lease assets: Depreciation expense on operating lease assets (ex. remarketing) 246 227 216 221 224 19 21 909 869 40 Remarketing (gains) loss, net of repo valuation 11 (1) — 19 (3) 12 14 28 (132) 160 Total depreciation expense on operating lease assets 256 225 216 240 220 31 36 937 736 201 Net financing revenue 1,310 1,313 1,294 1,266 1,344 (3) (34) 5,183 5,471 (288) Other revenue Total other revenue 99 96 97 97 88 3 11 389 363 26 Total net revenue 1,409 1,409 1,391 1,363 1,432 — (23) 5,572 5,834 (262) Provision for credit losses 478 410 387 434 495 68 (17) 1,709 1,905 (196) Noninterest expense Compensation and benefits 172 172 166 183 165 — 7 693 668 25 Other operating expenses 387 406 366 371 375 (19) 12 1,530 1,445 85 Total noninterest expense 559 578 532 554 540 (19) 19 2,223 2,113 110 Pre-tax Income $ 372 $ 421 $ 472 $ 375 $ 397 $ (49) $ (25) $ 1,640 $ 1,816 $ (176) Memo: Net lease revenue Operating lease revenue $ 387 $ 365 $ 352 $ 351 $ 350 $ 22 $ 37 $ 1,455 $ 1,355 $ 100 Depreciation expense on operating lease assets (ex. remarketing) 246 227 216 221 224 19 21 909 869 40 Remarketing (gains) loss, net of repo valuation 11 (1) — 19 (3) 12 14 28 (132) 160 Total depreciation expense on operating lease assets 256 225 216 240 220 31 36 937 736 201 Net lease revenue $ 131 $ 140 $ 136 $ 111 $ 130 $ (9) $ 1 $ 518 $ 619 $ (101) Balance Sheet (Period-End) Loans held-for-sale, net 12 15 15 13 5 (3) 7 Consumer loans 85,561 84,994 84,371 83,887 83,808 567 1,753 Commercial loans 23,143 21,784 21,066 21,547 22,898 1,359 245 Allowance for loan losses (3,256) (3,233) (3,221) (3,200) (3,211) (23) (45) Total finance receivables and loans, net 105,448 103,545 102,216 102,234 103,495 1,903 1,953 Investment in operating leases, net 8,772 8,599 7,992 7,879 7,991 173 781 Other assets 1,521 1,567 1,486 1,546 1,566 (46) (45) Total assets $ 115,753 $ 113,726 $ 111,709 $ 111,672 $ 113,057 $ 2,027 $ 2,696 Note: Numbers may not foot due to rounding 9
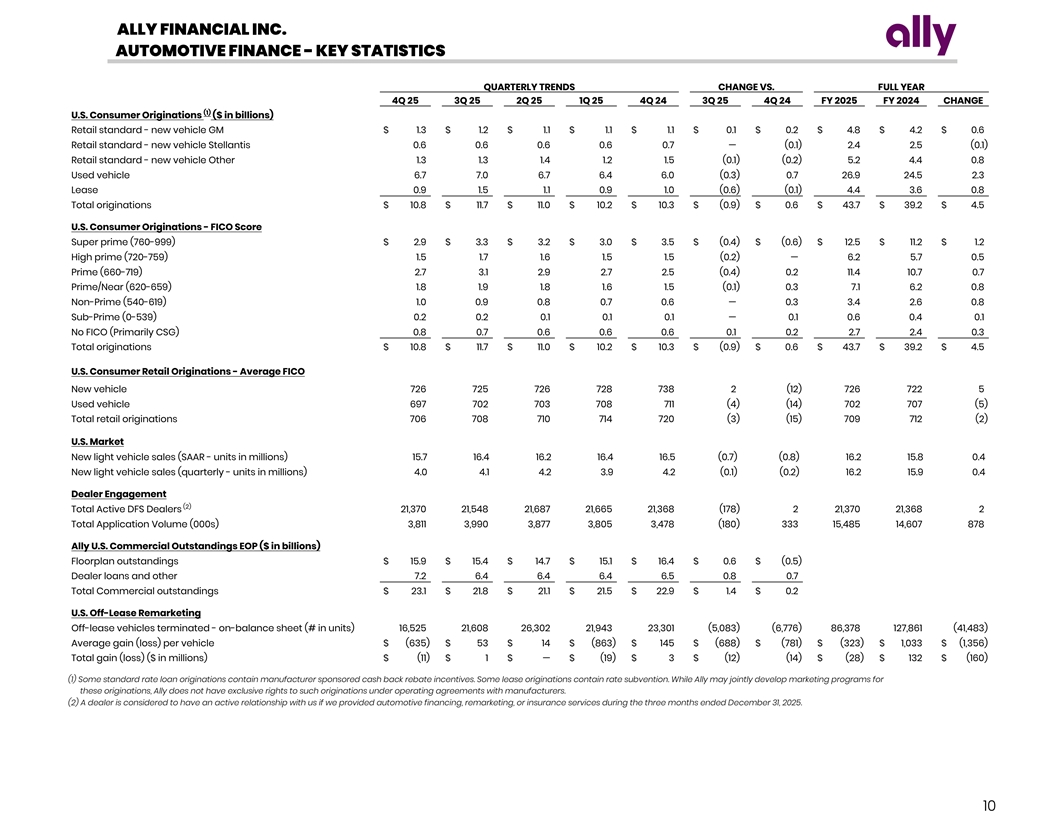
ALLY FINANCIAL INC. AUTOMOTIVE FINANCE - KEY STATISTICS QUARTERLY TRENDS CHANGE VS. FULL YEAR 4Q 25 3Q 25 2Q 25 1Q 25 4Q 24 3Q 25 4Q 24 FY 2025 FY 2024 CHANGE (1) U.S. Consumer Originations ($ in billions) Retail standard - new vehicle GM $ 1.3 $ 1.2 $ 1.1 $ 1.1 $ 1.1 $ 0.1 $ 0.2 $ 4.8 $ 4.2 $ 0.6 Retail standard - new vehicle Stellantis 0.6 0.6 0.6 0.6 0.7 — (0.1) 2.4 2.5 (0.1) Retail standard - new vehicle Other 1.3 1.3 1.4 1.2 1.5 (0.1) (0.2) 5.2 4.4 0.8 Used vehicle 6.7 7.0 6.7 6.4 6.0 (0.3) 0.7 26.9 24.5 2.3 Lease 0.9 1.5 1.1 0.9 1.0 (0.6) (0.1) 4.4 3.6 0.8 Total originations $ 10.8 $ 11.7 $ 11.0 $ 10.2 $ 10.3 $ (0.9) $ 0.6 $ 43.7 $ 39.2 $ 4.5 U.S. Consumer Originations - FICO Score Super prime (760-999) $ 2.9 $ 3.3 $ 3.2 $ 3.0 $ 3.5 $ (0.4) $ (0.6) $ 12.5 $ 11.2 $ 1.2 High prime (720-759) 1.5 1.7 1.6 1.5 1.5 (0.2) — 6.2 5.7 0.5 Prime (660-719) 2.7 3.1 2.9 2.7 2.5 (0.4) 0.2 11.4 10.7 0.7 Prime/Near (620-659) 1.8 1.9 1.8 1.6 1.5 (0.1) 0.3 7.1 6.2 0.8 Non-Prime (540-619) 1.0 0.9 0.8 0.7 0.6 — 0.3 3.4 2.6 0.8 Sub-Prime (0-539) 0.2 0.2 0.1 0.1 0.1 — 0.1 0.6 0.4 0.1 No FICO (Primarily CSG) 0.8 0.7 0.6 0.6 0.6 0.1 0.2 2.7 2.4 0.3 Total originations $ 10.8 $ 11.7 $ 11.0 $ 10.2 $ 10.3 $ (0.9) $ 0.6 $ 43.7 $ 39.2 $ 4.5 U.S. Consumer Retail Originations - Average FICO New vehicle 726 725 726 728 738 2 (12) 726 722 5 Used vehicle 697 702 703 708 711 (4) (14) 702 707 (5) Total retail originations 706 708 710 714 720 (3) (15) 709 712 (2) U.S. Market New light vehicle sales (SAAR - units in millions) 15.7 16.4 16.2 16.4 16.5 (0.7) (0.8) 16.2 15.8 0.4 New light vehicle sales (quarterly - units in millions) 4.0 4.1 4.2 3.9 4.2 (0.1) (0.2) 16.2 15.9 0.4 Dealer Engagement (2) Total Active DFS Dealers 21,370 21,548 21,687 21,665 21,368 (178) 2 21,370 21,368 2 Total Application Volume (000s) 3,811 3,990 3,877 3,805 3,478 (180) 333 15,485 14,607 878 Ally U.S. Commercial Outstandings EOP ($ in billions) Floorplan outstandings $ 15.9 $ 15.4 $ 14.7 $ 15.1 $ 16.4 $ 0.6 $ (0.5) Dealer loans and other 7.2 6.4 6.4 6.4 6.5 0.8 0.7 Total Commercial outstandings $ 23.1 $ 21.8 $ 21.1 $ 21.5 $ 22.9 $ 1.4 $ 0.2 U.S. Off-Lease Remarketing Off-lease vehicles terminated - on-balance sheet (# in units) 16,525 21,608 26,302 21,943 23,301 (5,083) (6,776) 86,378 127,861 (41,483) Average gain (loss) per vehicle $ (635) $ 53 $ 14 $ (863) $ 145 $ (688) $ (781) $ (323) $ 1,033 $ (1,356) Total gain (loss) ($ in millions) $ (11) $ 1 $ — $ (19) $ 3 $ (12) (14) $ (28) $ 132 $ (160) (1) Some standard rate loan originations contain manufacturer sponsored cash back rebate incentives. Some lease originations contain rate subvention. While Ally may jointly develop marketing programs for these originations, Ally does not have exclusive rights to such originations under operating agreements with manufacturers. (2) A dealer is considered to have an active relationship with us if we provided automotive financing, remarketing, or insurance services during the three months ended December 31, 2025. 10
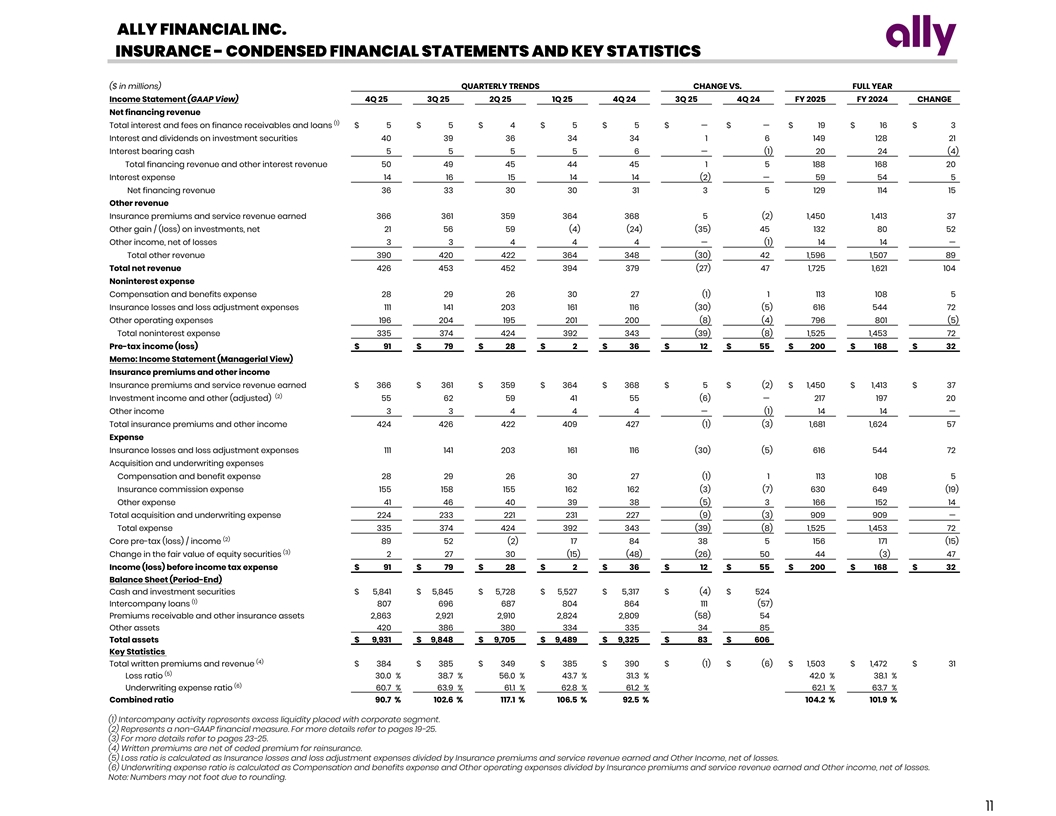
ALLY FINANCIAL INC. INSURANCE - CONDENSED FINANCIAL STATEMENTS AND KEY STATISTICS ($ in millions) QUARTERLY TRENDS CHANGE VS. FULL YEAR Income Statement (GAAP View) 4Q 25 3Q 25 2Q 25 1Q 25 4Q 24 3Q 25 4Q 24 FY 2025 FY 2024 CHANGE Net financing revenue (1) Total interest and fees on finance receivables and loans $ 5 $ 5 $ 4 $ 5 $ 5 $ — $ — $ 19 $ 16 $ 3 Interest and dividends on investment securities 40 39 36 34 34 1 6 149 128 21 Interest bearing cash 5 5 5 5 6 — (1) 20 24 (4) Total financing revenue and other interest revenue 50 49 45 44 45 1 5 188 168 20 Interest expense 14 16 15 14 14 (2) — 59 54 5 Net financing revenue 36 33 30 30 31 3 5 129 114 15 Other revenue Insurance premiums and service revenue earned 366 361 359 364 368 5 (2) 1,450 1,413 37 Other gain / (loss) on investments, net 21 56 59 (4) (24) (35) 45 132 80 52 Other income, net of losses 3 3 4 4 4 — (1) 14 14 — Total other revenue 390 420 422 364 348 (30) 42 1,596 1,507 89 Total net revenue 426 453 452 394 379 (27) 47 1,725 1,621 104 Noninterest expense Compensation and benefits expense 28 29 26 30 27 (1) 1 113 108 5 Insurance losses and loss adjustment expenses 111 141 203 161 116 (30) (5) 616 544 72 Other operating expenses 196 204 195 201 200 (8) (4) 796 801 (5) Total noninterest expense 335 374 424 392 343 (39) (8) 1,525 1,453 72 Pre-tax income (loss) $ 91 $ 79 $ 28 $ 2 $ 36 $ 12 $ 55 $ 200 $ 168 $ 32 Memo: Income Statement (Managerial View) Insurance premiums and other income Insurance premiums and service revenue earned $ 366 $ 361 $ 359 $ 364 $ 368 $ 5 $ (2) $ 1,450 $ 1,413 $ 37 (2) Investment income and other (adjusted) 55 62 59 41 55 (6) — 217 197 20 Other income 3 3 4 4 4 — (1) 14 14 — Total insurance premiums and other income 424 426 422 409 427 (1) (3) 1,681 1,624 57 Expense Insurance losses and loss adjustment expenses 111 141 203 161 116 (30) (5) 616 544 72 Acquisition and underwriting expenses Compensation and benefit expense 28 29 26 30 27 (1) 1 113 108 5 Insurance commission expense 155 158 155 162 162 (3) (7) 630 649 (19) Other expense 41 46 40 39 38 (5) 3 166 152 14 Total acquisition and underwriting expense 224 233 221 231 227 (9) (3) 909 909 — Total expense 335 374 424 392 343 (39) (8) 1,525 1,453 72 (2) Core pre-tax (loss) / income 89 52 (2) 17 84 38 5 156 171 (15) (3) Change in the fair value of equity securities 2 27 30 (15) (48) (26) 50 44 (3) 47 Income (loss) before income tax expense $ 91 $ 79 $ 28 $ 2 $ 36 $ 12 $ 55 $ 200 $ 168 $ 32 Balance Sheet (Period-End) Cash and investment securities $ 5,841 $ 5,845 $ 5,728 $ 5,527 $ 5,317 $ (4) $ 524 (1) Intercompany loans 807 696 687 804 864 111 (57) Premiums receivable and other insurance assets 2,863 2,921 2,910 2,824 2,809 (58) 54 Other assets 420 386 380 334 335 34 85 Total assets $ 9,931 $ 9,848 $ 9,705 $ 9,489 $ 9,325 $ 83 $ 606 Key Statistics (4) Total written premiums and revenue $ 384 $ 385 $ 349 $ 385 $ 390 $ (1) $ (6) $ 1,503 $ 1,472 $ 31 (5) Loss ratio 30.0 % 3 8.7 % 56.0 % 4 3.7 % 3 1.3 % 4 2.0 % 38.1 % (6) Underwriting expense ratio 60.7 % 6 3.9 % 61.1 % 6 2.8 % 61.2 % 6 2.1 % 63.7 % Combined ratio 9 0.7 % 1 02.6 % 117.1 % 106.5 % 92.5 % 104.2 % 101.9 % (1) Intercompany activity represents excess liquidity placed with corporate segment. (2) Represents a non-GAAP financial measure. For more details refer to pages 19-25. (3) For more details refer to pages 23-25. (4) Written premiums are net of ceded premium for reinsurance. (5) Loss ratio is calculated as Insurance losses and loss adjustment expenses divided by Insurance premiums and service revenue earned and Other Income, net of losses. (6) Underwriting expense ratio is calculated as Compensation and benefits expense and Other operating expenses divided by Insurance premiums and service revenue earned and Other income, net of losses. Note: Numbers may not foot due to rounding. 11
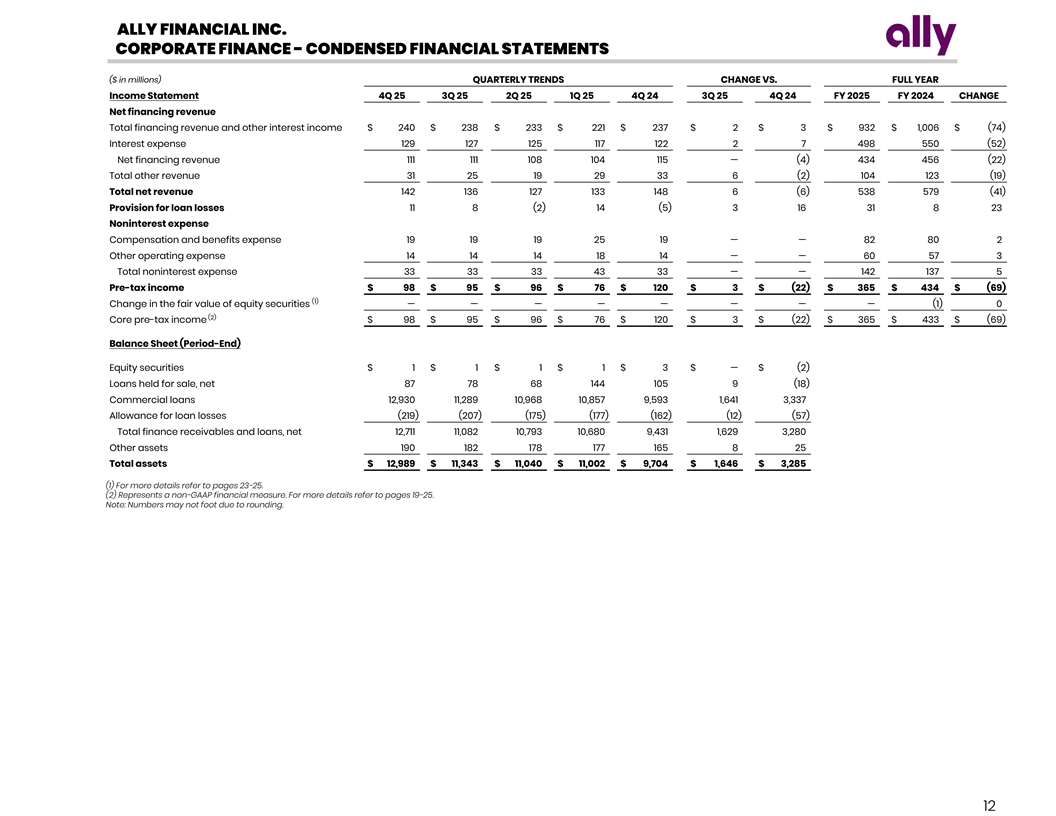
ALLY FINANCIAL INC. CORPORATE FINANCE - CONDENSED FINANCIAL STATEMENTS ($ in millions) QUARTERLY TRENDS CHANGE VS. FULL YEAR Income Statement 4Q 25 3Q 25 2Q 25 1Q 25 4Q 24 3Q 25 4Q 24 FY 2025 FY 2024 CHANGE Net financing revenue Total financing revenue and other interest income $ 240 $ 238 $ 233 $ 221 $ 237 $ 2 $ 3 $ 932 $ 1,006 $ (74) Interest expense 129 127 125 117 122 2 7 498 550 (52) Net financing revenue 111 111 108 104 115 — (4) 434 456 (22) Total other revenue 31 25 19 29 33 6 (2) 104 123 (19) Total net revenue 142 136 127 133 148 6 (6) 538 579 (41) Provision for loan losses 11 8 (2) 14 (5) 3 16 31 8 23 Noninterest expense Compensation and benefits expense 19 19 19 25 19 — — 82 80 2 Other operating expense 14 14 14 18 14 — — 60 57 3 Total noninterest expense 33 33 33 43 33 — — 142 137 5 Pre-tax income $ 98 $ 95 $ 96 $ 76 $ 120 $ 3 $ (22) $ 365 $ 434 $ (69) (1) Change in the fair value of equity securities — — — — — — — — (1) 0 (2) Core pre-tax income $ 98 $ 95 $ 96 $ 76 $ 120 $ 3 $ (22) $ 365 $ 433 $ (69) Balance Sheet (Period-End) Equity securities $ 1 $ 1 $ 1 $ 1 $ 3 $ — $ (2) Loans held for sale, net 87 78 68 144 105 9 (18) Commercial loans 12,930 11,289 10,968 10,857 9,593 1,641 3,337 Allowance for loan losses (219) (207) (175) (177) (162) (12) (57) Total finance receivables and loans, net 12,711 11,082 10,793 10,680 9,431 1,629 3,280 Other assets 190 182 178 177 165 8 25 Total assets $ 12,989 $ 11,343 $ 11,040 $ 11,002 $ 9,704 $ 1,646 $ 3,285 (1) For more details refer to pages 23-25. (2) Represents a non-GAAP financial measure. For more details refer to pages 19-25. Note: Numbers may not foot due to rounding. 12
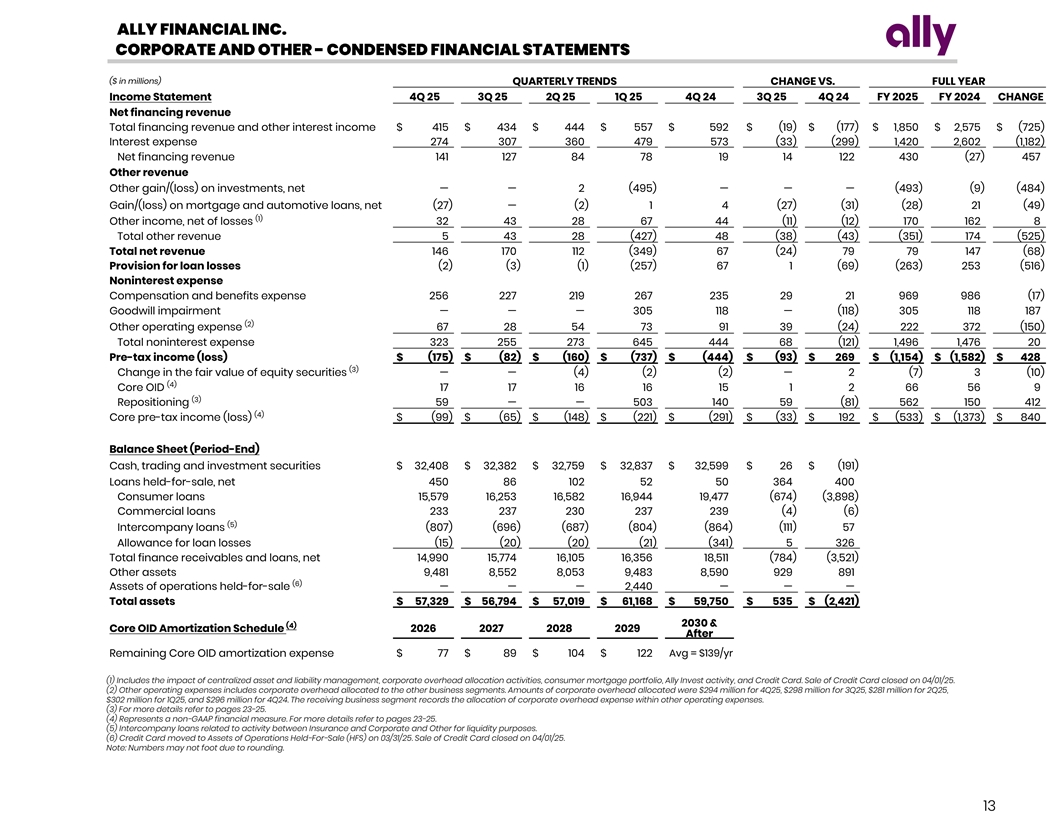
ALLY FINANCIAL INC. CORPORATE AND OTHER - CONDENSED FINANCIAL STATEMENTS ($ in millions) QUARTERLY TRENDS CHANGE VS. FULL YEAR Income Statement 4Q 25 3Q 25 2Q 25 1Q 25 4Q 24 3Q 25 4Q 24 FY 2025 FY 2024 CHANGE Net financing revenue Total financing revenue and other interest income $ 415 $ 434 $ 444 $ 557 $ 592 $ (19) $ (177) $ 1,850 $ 2,575 $ (725) Interest expense 274 307 360 479 573 (33) (299) 1,420 2,602 (1,182) Net financing revenue 141 127 84 78 19 14 122 430 (27) 457 Other revenue Other gain/(loss) on investments, net — — 2 (495) — — — (493) (9) (484) Gain/(loss) on mortgage and automotive loans, net (27) — (2) 1 4 (27) (31) (28) 21 (49) (1) Other income, net of losses 32 43 28 67 44 (11) (12) 170 162 8 Total other revenue 5 43 28 (427) 48 (38) (43) (351) 174 (525) Total net revenue 146 170 112 (349) 67 (24) 79 79 147 (68) Provision for loan losses (2) (3) (1) (257) 67 1 (69) (263) 253 (516) Noninterest expense Compensation and benefits expense 256 227 219 267 235 29 21 969 986 (17) Goodwill impairment — — — 305 118 — (118) 305 118 187 (2) Other operating expense 67 28 54 73 91 39 (24) 222 372 (150) Total noninterest expense 323 255 273 645 444 68 (121) 1,496 1,476 20 Pre-tax income (loss) $ (175) $ (82) $ (160) $ (737) $ (444) $ (93) $ 269 $ (1,154) $ (1,582) $ 428 (3) Change in the fair value of equity securities — — (4) (2) (2) — 2 (7) 3 (10) (4) Core OID 17 17 16 16 15 1 2 66 56 9 (3) Repositioning 59 — — 503 140 59 (81) 562 150 412 (4) Core pre-tax income (loss) $ (99) $ (65) $ (148) $ (221) $ (291) $ (33) $ 192 $ (533) $ (1,373) $ 840 Balance Sheet (Period-End) Cash, trading and investment securities $ 32,408 $ 32,382 $ 32,759 $ 32,837 $ 32,599 $ 26 $ (191) Loans held-for-sale, net 450 86 102 52 50 364 400 Consumer loans 15,579 16,253 16,582 16,944 19,477 (674) (3,898) Commercial loans 233 237 230 237 239 (4) (6) (5) Intercompany loans (807) (696) (687) (804) (864) (111) 57 Allowance for loan losses (15) (20) (20) (21) (341) 5 326 Total finance receivables and loans, net 14,990 15,774 16,105 16,356 18,511 (784) (3,521) Other assets 9,481 8,552 8,053 9,483 8,590 929 891 (6) Assets of operations held-for-sale — — — 2,440 — — — Total assets $ 57,329 $ 56,794 $ 57,019 $ 61,168 $ 59,750 $ 535 $ (2,421) 2030 & (4) Core OID Amortization Schedule 2026 2027 2028 2029 After Remaining Core OID amortization expense $ 77 $ 89 $ 104 $ 122 Avg = $139/yr (1) Includes the impact of centralized asset and liability management, corporate overhead allocation activities, consumer mortgage portfolio, Ally Invest activity, and Credit Card. Sale of Credit Card closed on 04/01/25. (2) Other operating expenses includes corporate overhead allocated to the other business segments. Amounts of corporate overhead allocated were $294 million for 4Q25, $298 million for 3Q25, $281 million for 2Q25, $302 million for 1Q25, and $296 million for 4Q24. The receiving business segment records the allocation of corporate overhead expense within other operating expenses. (3) For more details refer to pages 23-25. (4) Represents a non-GAAP financial measure. For more details refer to pages 23-25. (5) Intercompany loans related to activity between Insurance and Corporate and Other for liquidity purposes. (6) Credit Card moved to Assets of Operations Held-For-Sale (HFS) on 03/31/25. Sale of Credit Card closed on 04/01/25. Note: Numbers may not foot due to rounding. 13
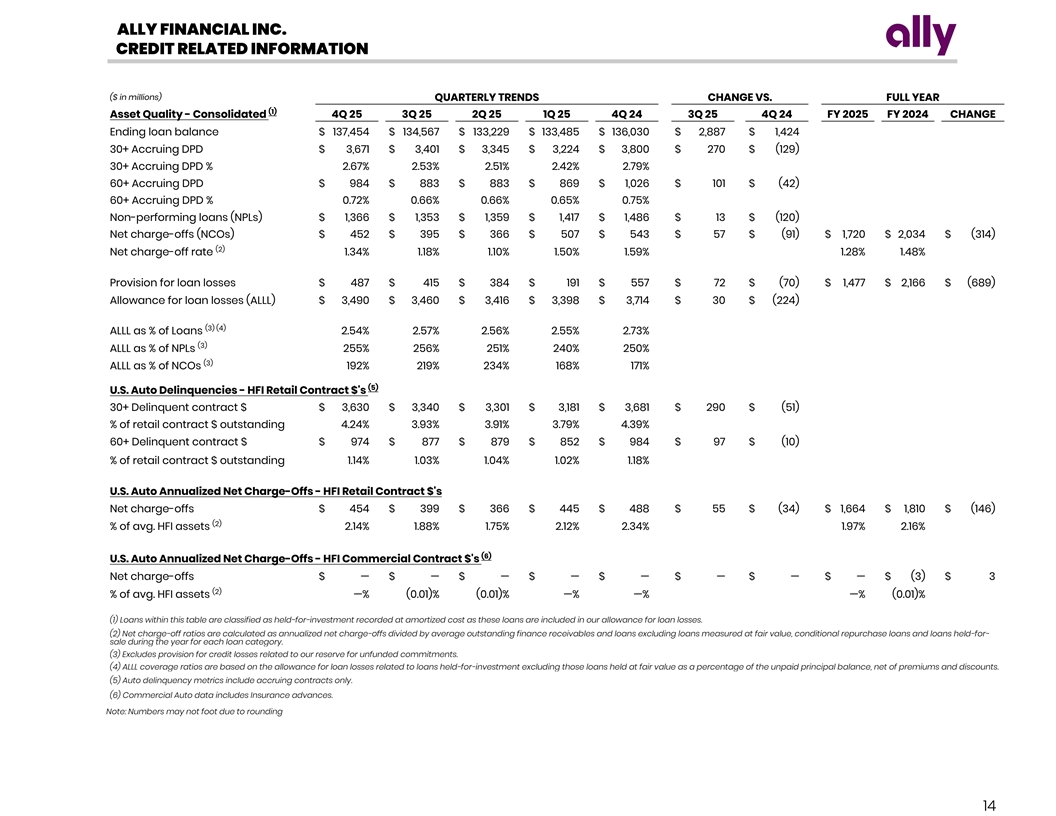
ALLY FINANCIAL INC. CREDIT RELATED INFORMATION ($ in millions) QUARTERLY TRENDS CHANGE VS. FULL YEAR (1) Asset Quality - Consolidated 4Q 25 3Q 25 2Q 25 1Q 25 4Q 24 3Q 25 4Q 24 FY 2025 FY 2024 CHANGE Ending loan balance $ 137,454 $ 134,567 $ 133,229 $ 133,485 $ 136,030 $ 2,887 $ 1,424 30+ Accruing DPD $ 3,671 $ 3,401 $ 3,345 $ 3,224 $ 3,800 $ 270 $ (129) 30+ Accruing DPD % 2 .67 % 2 .53% 2 .51% 2.42% 2.79% 60+ Accruing DPD $ 984 $ 883 $ 883 $ 869 $ 1,026 $ 101 $ (42) 60+ Accruing DPD % 0.72% 0.66% 0.66% 0 .65 % 0 .75 % Non-performing loans (NPLs) $ 1,366 $ 1,353 $ 1,359 $ 1,417 $ 1,486 $ 13 $ (120) Net charge-offs (NCOs) $ 452 $ 395 $ 366 $ 507 $ 543 $ 57 $ (91) $ 1,720 $ 2,034 $ (314) (2) Net charge-off rate 1.34 % 1.18 % 1 .10% 1.50% 1.59% 1 .28 % 1 .48 % Provision for loan losses $ 487 $ 415 $ 384 $ 191 $ 557 $ 72 $ (70) $ 1,477 $ 2,166 $ (689) Allowance for loan losses (ALLL) $ 3,490 $ 3,460 $ 3,416 $ 3,398 $ 3,714 $ 30 $ (224) (3) (4) ALLL as % of Loans 2 .54 % 2.57 % 2 .56% 2.55% 2.73 % (3) ALLL as % of NPLs 2 55% 256 % 251% 240% 250 % (3) ALLL as % of NCOs 192% 219% 2 34 % 168% 1 71% (5) U.S. Auto Delinquencies - HFI Retail Contract $'s 30+ Delinquent contract $ $ 3,630 $ 3,340 $ 3,301 $ 3,181 $ 3,681 $ 290 $ (51) % of retail contract $ outstanding 4 .24 % 3 .93 % 3 .91% 3.79% 4 .39% 60+ Delinquent contract $ $ 974 $ 877 $ 879 $ 852 $ 984 $ 97 $ (10) % of retail contract $ outstanding 1 .14 % 1 .03% 1.04% 1.02% 1.18% U.S. Auto Annualized Net Charge-Offs - HFI Retail Contract $'s Net charge-offs $ 454 $ 399 $ 366 $ 445 $ 488 $ 55 $ (34) $ 1,664 $ 1,810 $ (146) (2) % of avg. HFI assets 2.14 % 1.88% 1 .75 % 2 .12 % 2.34% 1.97% 2 .16 % (6) U.S. Auto Annualized Net Charge-Offs - HFI Commercial Contract $'s Net charge-offs $ — $ — $ — $ — $ — $ — $ — $ — $ (3) $ 3 (2) % of avg. HFI assets — % (0.01) % (0.01) % — % — % — % (0.01) % (1) Loans within this table are classified as held-for-investment recorded at amortized cost as these loans are included in our allowance for loan losses. (2) Net charge-off ratios are calculated as annualized net charge-offs divided by average outstanding finance receivables and loans excluding loans measured at fair value, conditional repurchase loans and loans held-for- sale during the year for each loan category. (3) Excludes provision for credit losses related to our reserve for unfunded commitments. (4) ALLL coverage ratios are based on the allowance for loan losses related to loans held-for-investment excluding those loans held at fair value as a percentage of the unpaid principal balance, net of premiums and discounts. (5) Auto delinquency metrics include accruing contracts only. (6) Commercial Auto data includes Insurance advances. Note: Numbers may not foot due to rounding 14
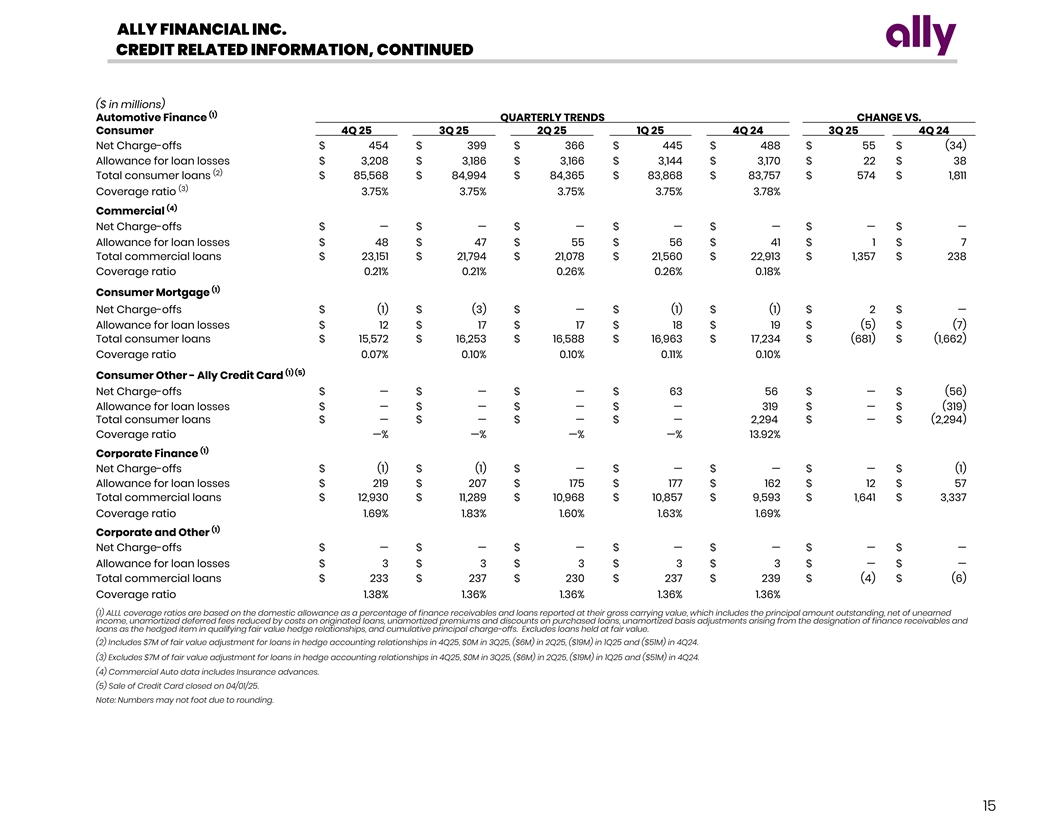
ALLY FINANCIAL INC. CREDIT RELATED INFORMATION, CONTINUED ($ in millions) (1) Automotive Finance QUARTERLY TRENDS CHANGE VS. Consumer 4Q 25 3Q 25 2Q 25 1Q 25 4Q 24 3Q 25 4Q 24 Net Charge-offs $ 454 $ 399 $ 366 $ 445 $ 488 $ 55 $ (34) Allowance for loan losses $ 3,208 $ 3,186 $ 3,166 $ 3,144 $ 3,170 $ 22 $ 38 (2) Total consumer loans $ 85,568 $ 84,994 $ 84,365 $ 83,868 $ 83,757 $ 574 $ 1,811 (3) Coverage ratio 3 .75 % 3.75% 3 .75 % 3 .75 % 3 .78 % (4) Commercial Net Charge-offs $ — $ — $ — $ — $ — $ — $ — Allowance for loan losses $ 48 $ 47 $ 55 $ 56 $ 41 $ 1 $ 7 Total commercial loans $ 23,151 $ 21,794 $ 21,078 $ 21,560 $ 22,913 $ 1,357 $ 238 Coverage ratio 0 .21 % 0 .21% 0.26% 0 .26% 0.18 % (1) Consumer Mortgage Net Charge-offs $ (1) $ (3) $ — $ (1) $ (1) $ 2 $ — Allowance for loan losses $ 12 $ 17 $ 17 $ 18 $ 19 $ (5) $ (7) Total consumer loans $ 15,572 $ 16,253 $ 16,588 $ 16,963 $ 17,234 $ (681) $ (1,662) Coverage ratio 0.07% 0 .10 % 0 .10 % 0 .11% 0 .10% (1) (5) Consumer Other - Ally Credit Card Net Charge-offs $ — $ — $ — $ 63 56 $ — $ (56) Allowance for loan losses $ — $ — $ — $ — 319 $ — $ (319) Total consumer loans $ — $ — $ — $ — 2,294 $ — $ (2,294) Coverage ratio — % —% —% — % 13.92% (1) Corporate Finance Net Charge-offs $ (1) $ (1) $ — $ — $ — $ — $ (1) Allowance for loan losses $ 219 $ 207 $ 175 $ 177 $ 162 $ 12 $ 57 Total commercial loans $ 12,930 $ 11,289 $ 10,968 $ 10,857 $ 9,593 $ 1,641 $ 3,337 Coverage ratio 1.69% 1 .83% 1 .60 % 1 .63 % 1 .69 % (1) Corporate and Other Net Charge-offs $ — $ — $ — $ — $ — $ — $ — Allowance for loan losses $ 3 $ 3 $ 3 $ 3 $ 3 $ — $ — Total commercial loans $ 233 $ 237 $ 230 $ 237 $ 239 $ (4) $ (6) Coverage ratio 1 .38 % 1 .36% 1.36% 1 .36% 1.36 % (1) ALLL coverage ratios are based on the domestic allowance as a percentage of finance receivables and loans reported at their gross carrying value, which includes the principal amount outstanding, net of unearned income, unamortized deferred fees reduced by costs on originated loans, unamortized premiums and discounts on purchased loans, unamortized basis adjustments arising from the designation of finance receivables and loans as the hedged item in qualifying fair value hedge relationships, and cumulative principal charge-offs. Excludes loans held at fair value. (2) Includes $7M of fair value adjustment for loans in hedge accounting relationships in 4Q25, $0M in 3Q25, ($6M) in 2Q25, ($19M) in 1Q25 and ($51M) in 4Q24. (3) Excludes $7M of fair value adjustment for loans in hedge accounting relationships in 4Q25, $0M in 3Q25, ($6M) in 2Q25, ($19M) in 1Q25 and ($51M) in 4Q24. (4) Commercial Auto data includes Insurance advances. (5) Sale of Credit Card closed on 04/01/25. Note: Numbers may not foot due to rounding. 15
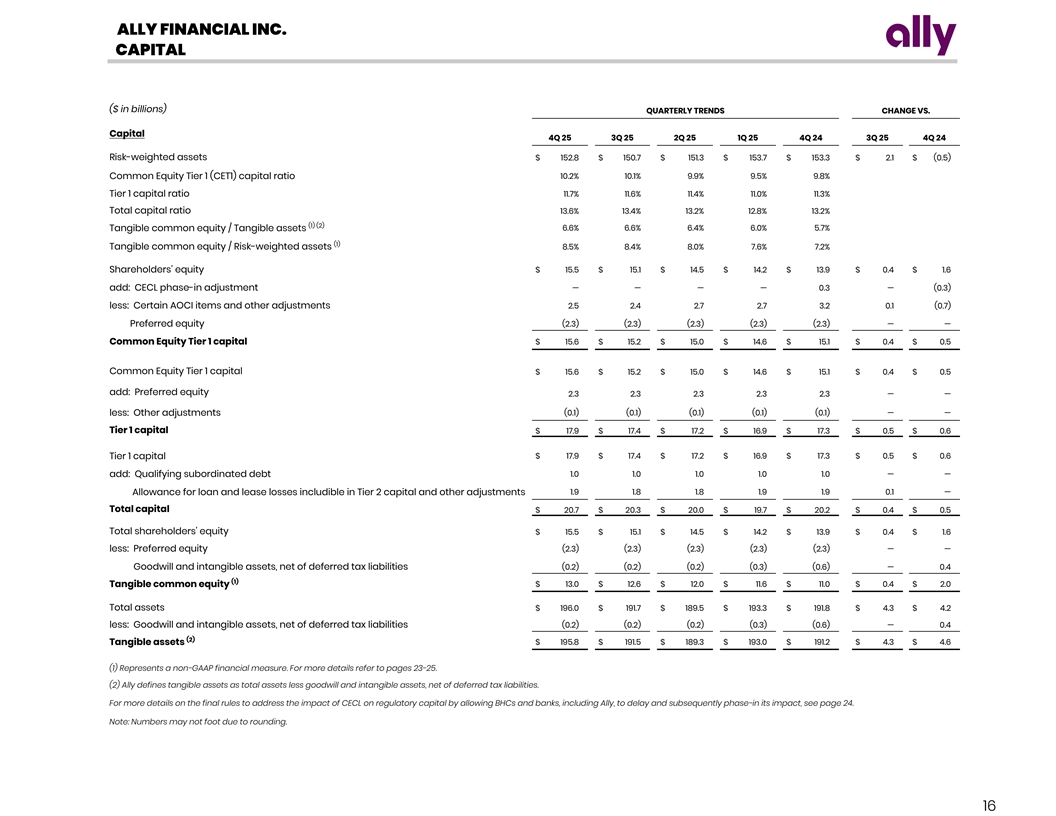
ALLY FINANCIAL INC. CAPITAL ($ in billions) QUARTERLY TRENDS CHANGE VS. Capital 4Q 25 3Q 25 2Q 25 1Q 25 4Q 24 3Q 25 4Q 24 Risk-weighted assets $ 152.8 $ 150.7 $ 151.3 $ 153.7 $ 153.3 $ 2.1 $ (0.5) 10.2 % 1 0.1% 9.9 % 9.5% 9 .8% Common Equity Tier 1 (CET1) capital ratio Tier 1 capital ratio 11.7 % 1 1.6% 1 1.4 % 1 1.0 % 11.3 % Total capital ratio 13.6% 1 3.4 % 1 3.2% 12.8% 13.2% (1) (2) 6 .6% 6 .6 % 6 .4% 6 .0% 5.7% Tangible common equity / Tangible assets (1) Tangible common equity / Risk-weighted assets 8.5 % 8 .4 % 8 .0 % 7 .6% 7.2 % Shareholders’ equity $ 15.5 $ 15.1 $ 14.5 $ 14.2 $ 13.9 $ 0.4 $ 1.6 add: CECL phase-in adjustment — — — — 0.3 — (0.3) less: Certain AOCI items and other adjustments 2.5 2.4 2.7 2.7 3.2 0.1 (0.7) Preferred equity (2.3) (2.3) (2.3) (2.3) (2.3) — — Common Equity Tier 1 capital $ 15.6 $ 15.2 $ 15.0 $ 14.6 $ 15.1 $ 0.4 $ 0.5 Common Equity Tier 1 capital $ 15.6 $ 15.2 $ 15.0 $ 14.6 $ 15.1 $ 0.4 $ 0.5 add: Preferred equity 2.3 2.3 2.3 2.3 2.3 — — less: Other adjustments (0.1) (0.1) (0.1) (0.1) (0.1) — — Tier 1 capital $ 17.9 $ 17.4 $ 17.2 $ 16.9 $ 17.3 $ 0.5 $ 0.6 $ 17.9 $ 17.4 $ 17.2 $ 16.9 $ 17.3 $ 0.5 $ 0.6 Tier 1 capital add: Qualifying subordinated debt 1.0 1.0 1.0 1.0 1.0 — — 1.9 1.8 1.8 1.9 1.9 0.1 — Allowance for loan and lease losses includible in Tier 2 capital and other adjustments Total capital $ 20.7 $ 20.3 $ 20.0 $ 19.7 $ 20.2 $ 0.4 $ 0.5 Total shareholders' equity $ 15.5 $ 15.1 $ 14.5 $ 14.2 $ 13.9 $ 0.4 $ 1.6 less: Preferred equity (2.3) (2.3) (2.3) (2.3) (2.3) — — Goodwill and intangible assets, net of deferred tax liabilities (0.2) (0.2) (0.2) (0.3) (0.6) — 0.4 (1) $ 13.0 $ 12.6 $ 12.0 $ 11.6 $ 11.0 $ 0.4 $ 2.0 Tangible common equity Total assets $ 196.0 $ 191.7 $ 189.5 $ 193.3 $ 191.8 $ 4.3 $ 4.2 less: Goodwill and intangible assets, net of deferred tax liabilities (0.2) (0.2) (0.2) (0.3) (0.6) — 0.4 (2) Tangible assets $ 195.8 $ 191.5 $ 189.3 $ 193.0 $ 191.2 $ 4.3 $ 4.6 (1) Represents a non-GAAP financial measure. For more details refer to pages 23-25. (2) Ally defines tangible assets as total assets less goodwill and intangible assets, net of deferred tax liabilities. For more details on the final rules to address the impact of CECL on regulatory capital by allowing BHCs and banks, including Ally, to delay and subsequently phase-in its impact, see page 24. Note: Numbers may not foot due to rounding. 16
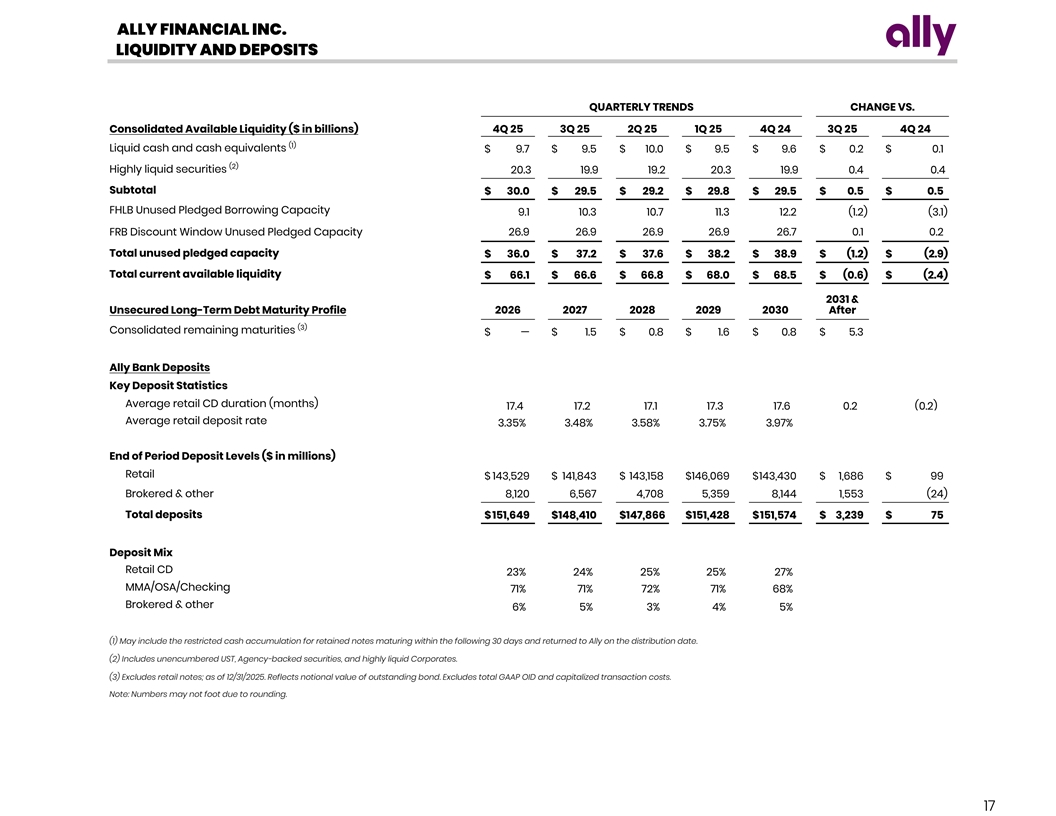
ALLY FINANCIAL INC. LIQUIDITY AND DEPOSITS QUARTERLY TRENDS CHANGE VS. Consolidated Available Liquidity ($ in billions) 4Q 25 3Q 25 2Q 25 1Q 25 4Q 24 3Q 25 4Q 24 (1) Liquid cash and cash equivalents $ 9.7 $ 9.5 $ 10.0 $ 9.5 $ 9.6 $ 0.2 $ 0.1 (2) Highly liquid securities 20.3 19.9 19.2 20.3 19.9 0.4 0.4 Subtotal $ 30.0 $ 29.5 $ 29.2 $ 29.8 $ 29.5 $ 0.5 $ 0.5 FHLB Unused Pledged Borrowing Capacity 9.1 10.3 10.7 11.3 12.2 (1.2) (3.1) FRB Discount Window Unused Pledged Capacity 26.9 26.9 26.9 26.9 26.7 0.1 0.2 Total unused pledged capacity $ 36.0 $ 37.2 $ 37.6 $ 38.2 $ 38.9 $ (1.2) $ (2.9) Total current available liquidity $ 66.1 $ 66.6 $ 66.8 $ 68.0 $ 68.5 $ (0.6) $ (2.4) 2031 & Unsecured Long-Term Debt Maturity Profile 2026 2027 2028 2029 2030 After (3) Consolidated remaining maturities $ — $ 1.5 $ 0.8 $ 1.6 $ 0.8 $ 5.3 Ally Bank Deposits Key Deposit Statistics Average retail CD duration (months) 17.4 17.2 17.1 17.3 17.6 0.2 (0.2) Average retail deposit rate 3.35% 3 .48 % 3 .58% 3 .75 % 3.97% End of Period Deposit Levels ($ in millions) Retail $ 143,529 $ 141,843 $ 143,158 $ 146,069 $ 143,430 $ 1,686 $ 99 Brokered & other 8,120 6,567 4,708 5,359 8,144 1,553 (24) Total deposits $ 151,649 $ 148,410 $ 147,866 $ 151,428 $ 151,574 $ 3,239 $ 75 Deposit Mix Retail CD 23% 24% 25% 25% 27 % MMA/OSA/Checking 71 % 7 1% 72 % 7 1 % 68% Brokered & other 6 % 5 % 3% 4 % 5% (1) May include the restricted cash accumulation for retained notes maturing within the following 30 days and returned to Ally on the distribution date. (2) Includes unencumbered UST, Agency-backed securities, and highly liquid Corporates. (3) Excludes retail notes; as of 12/31/2025. Reflects notional value of outstanding bond. Excludes total GAAP OID and capitalized transaction costs. Note: Numbers may not foot due to rounding. 17
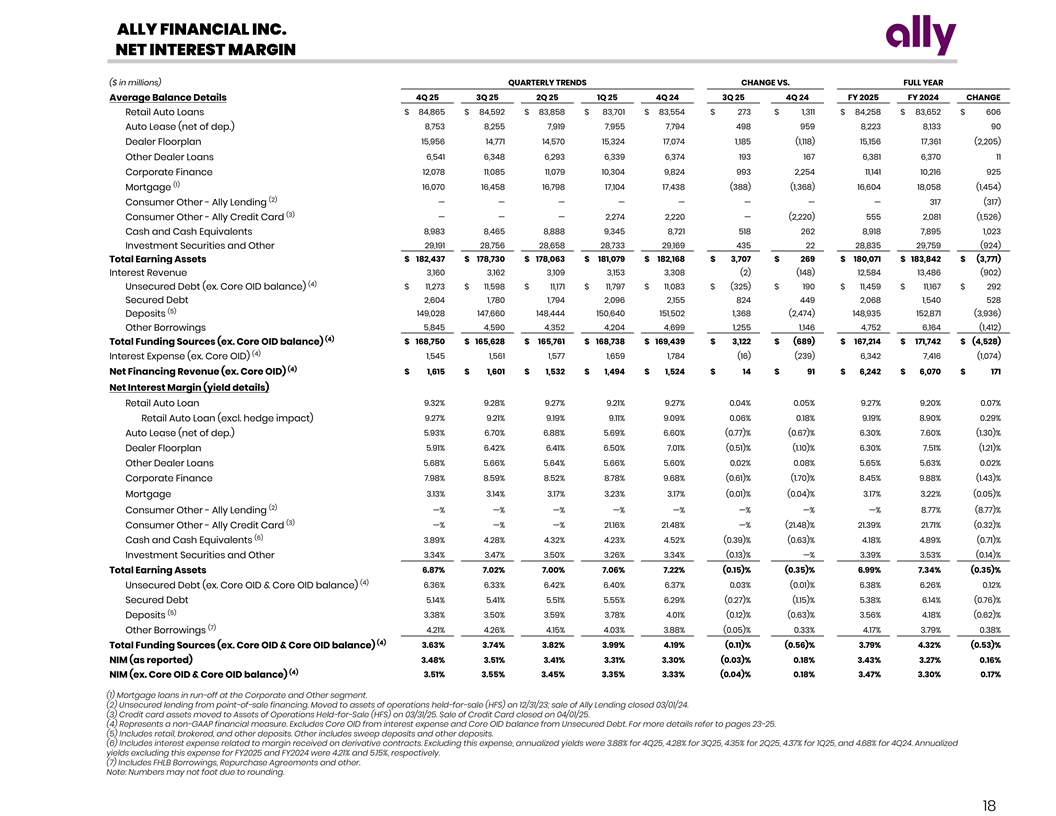
ALLY FINANCIAL INC. NET INTEREST MARGIN ($ in millions) QUARTERLY TRENDS CHANGE VS. FULL YEAR 4Q 25 3Q 25 2Q 25 1Q 25 4Q 24 3Q 25 4Q 24 FY 2025 FY 2024 CHANGE Average Balance Details $ 84,865 $ 84,592 $ 83,858 $ 83,701 $ 83,554 $ 273 $ 1,311 $ 84,258 $ 83,652 $ 606 Retail Auto Loans 8,753 8,255 7,919 7,955 7,794 498 959 8,223 8,133 90 Auto Lease (net of dep.) 15,956 14,771 14,570 15,324 17,074 1,185 (1,118) 15,156 17,361 (2,205) Dealer Floorplan Other Dealer Loans 6,541 6,348 6,293 6,339 6,374 193 167 6,381 6,370 11 12,078 11,085 11,079 10,304 9,824 993 2,254 11,141 10,216 925 Corporate Finance (1) Mortgage 16,070 16,458 16,798 17,104 17,438 (388) (1,368) 16,604 18,058 (1,454) (2) Consumer Other - Ally Lending — — — — — — — — 317 (317) (3) Consumer Other - Ally Credit Card — — — 2,274 2,220 — (2,220) 555 2,081 (1,526) Cash and Cash Equivalents 8,983 8,465 8,888 9,345 8,721 518 262 8,918 7,895 1,023 29,191 28,756 28,658 28,733 29,169 435 22 28,835 29,759 (924) Investment Securities and Other Total Earning Assets $ 182,437 $ 178,730 $ 178,063 $ 181,079 $ 182,168 $ 3,707 $ 269 $ 180,071 $ 183,842 $ (3,771) Interest Revenue 3,160 3,162 3,109 3,153 3,308 (2) (148) 12,584 13,486 (902) (4) $ 11,273 $ 11,598 $ 11,171 $ 11,797 $ 11,083 $ (325) $ 190 $ 11,459 $ 11,167 $ 292 Unsecured Debt (ex. Core OID balance) 2,604 1,780 1,794 2,096 2,155 824 449 2,068 1,540 528 Secured Debt (5) 149,028 147,660 148,444 150,640 151,502 1,368 (2,474) 148,935 152,871 (3,936) Deposits Other Borrowings 5,845 4,590 4,352 4,204 4,699 1,255 1,146 4,752 6,164 (1,412) (4) $ 168,750 $ 165,628 $ 165,761 $ 168,738 $ 169,439 $ 3,122 $ (689) $ 167,214 $ 171,742 $ (4,528) Total Funding Sources (ex. Core OID balance) (4) 1,545 1,561 1,577 1,659 1,784 (16) (239) 6,342 7,416 (1,074) Interest Expense (ex. Core OID) (4) Net Financing Revenue (ex. Core OID) $ 1,615 $ 1,601 $ 1,532 $ 1,494 $ 1,524 $ 14 $ 91 $ 6,242 $ 6,070 $ 171 Net Interest Margin (yield details) Retail Auto Loan 9 .32% 9 .28 % 9.27% 9 .21% 9 .27 % 0.04% 0 .05 % 9.27 % 9 .20% 0 .07% Retail Auto Loan (excl. hedge impact) 9 .27 % 9 .21 % 9 .19% 9 .11 % 9.09% 0 .06% 0 .18% 9.19 % 8.90 % 0 .29% Auto Lease (net of dep.) 5 .93% 6 .70 % 6.88% 5 .69% 6 .60% (0.77)% ( 0.67) % 6 .30% 7.60% (1.30)% 5 .91% 6 .42% 6 .41% 6 .50% 7.01 % (0.51)% ( 1.10) % 6.30 % 7 .51 % ( 1.21) % Dealer Floorplan Other Dealer Loans 5 .68% 5.66% 5 .64% 5 .66% 5.60% 0 .02% 0.08% 5 .65% 5 .63 % 0 .02% Corporate Finance 7 .98% 8.59% 8 .52 % 8.78 % 9.68 % ( 0.61)% ( 1.70)% 8 .45% 9.88 % (1.43) % Mortgage 3 .13% 3 .14 % 3 .17 % 3 .23% 3 .17% ( 0.01) % ( 0.04)% 3 .17% 3 .22% (0.05) % (2) Consumer Other - Ally Lending —% —% — % — % — % — % — % — % 8 .77% ( 8.77)% (3) Consumer Other - Ally Credit Card — % —% —% 21.16% 2 1.48% — % ( 21.48) % 21.39% 21.71% ( 0.32)% (6) 3 .89% 4 .28 % 4.32 % 4 .23 % 4 .52% (0.39)% ( 0.63)% 4 .18% 4 .89% ( 0.71) % Cash and Cash Equivalents Investment Securities and Other 3.34 % 3.47 % 3.50% 3 .26% 3.34% ( 0.13)% — % 3 .39% 3.53% (0.14)% Total Earning Assets 6.87% 7.02 % 7 .00% 7 .06% 7 .22 % ( 0.15)% ( 0.35) % 6.99 % 7 .34% (0.35) % (4) Unsecured Debt (ex. Core OID & Core OID balance) 6 .36 % 6 .33% 6.42 % 6 .40 % 6 .37 % 0 .03% (0.01) % 6.38% 6.26% 0 .12% 5 .14% 5 .41% 5 .51 % 5.55 % 6.29% (0.27)% ( 1.15) % 5 .38% 6 .14% (0.76) % Secured Debt (5) Deposits 3 .38 % 3 .50% 3.59 % 3 .78 % 4 .01 % ( 0.12) % ( 0.63) % 3 .56% 4 .18 % ( 0.62)% (7) Other Borrowings 4 .21 % 4 .26% 4 .15 % 4 .03 % 3 .88 % ( 0.05)% 0.33 % 4 .17% 3.79 % 0.38 % (4) Total Funding Sources (ex. Core OID & Core OID balance) 3 .63 % 3.74 % 3 .82 % 3 .99 % 4 .19% ( 0.11)% ( 0.56)% 3 .79% 4.32% ( 0.53)% 3.48 % 3.51% 3 .41% 3 .31% 3 .30% (0.03)% 0.18 % 3.43% 3.27 % 0 .16% NIM (as reported) (4) 3 .51 % 3.55% 3.45 % 3.35 % 3 .33% (0.04)% 0 .18 % 3 .47% 3.30% 0 .17% NIM (ex. Core OID & Core OID balance) (1) Mortgage loans in run-off at the Corporate and Other segment. (2) Unsecured lending from point-of-sale financing. Moved to assets of operations held-for-sale (HFS) on 12/31/23; sale of Ally Lending closed 03/01/24. (3) Credit card assets moved to Assets of Operations Held-for-Sale (HFS) on 03/31/25. Sale of Credit Card closed on 04/01/25. (4) Represents a non-GAAP financial measure. Excludes Core OID from interest expense and Core OID balance from Unsecured Debt. For more details refer to pages 23-25. (5) Includes retail, brokered, and other deposits. Other includes sweep deposits and other deposits. (6) Includes interest expense related to margin received on derivative contracts. Excluding this expense, annualized yields were 3.88% for 4Q25, 4.28% for 3Q25, 4.35% for 2Q25, 4.37% for 1Q25, and 4.68% for 4Q24. Annualized yields excluding this expense for FY2025 and FY2024 were 4.21% and 5.15%, respectively. (7) Includes FHLB Borrowings, Repurchase Agreements and other. Note: Numbers may not foot due to rounding. 18
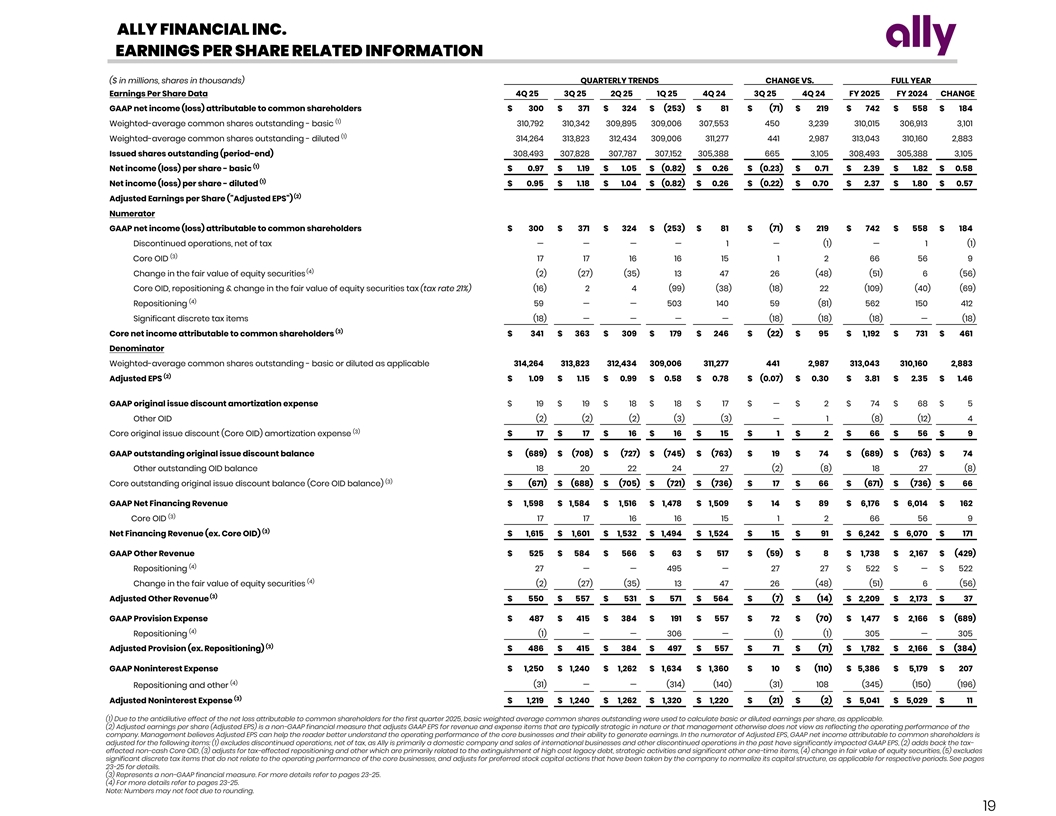
ALLY FINANCIAL INC. EARNINGS PER SHARE RELATED INFORMATION ($ in millions, shares in thousands) QUARTERLY TRENDS CHANGE VS. FULL YEAR Earnings Per Share Data 4Q 25 3Q 25 2Q 25 1Q 25 4Q 24 3Q 25 4Q 24 FY 2025 FY 2024 CHANGE GAAP net income (loss) attributable to common shareholders $ 300 $ 371 $ 324 $ (253) $ 81 $ (71) $ 219 $ 742 $ 558 $ 184 (1) Weighted-average common shares outstanding - basic 310,792 310,342 309,895 309,006 307,553 450 3,239 310,015 306,913 3,101 (1) Weighted-average common shares outstanding - diluted 314,264 313,823 312,434 309,006 311,277 441 2,987 313,043 310,160 2,883 Issued shares outstanding (period-end) 308,493 307,828 307,787 307,152 305,388 665 3,105 308,493 305,388 3,105 (1) Net income (loss) per share - basic $ 0.97 $ 1.19 $ 1.05 $ (0.82) $ 0.26 $ (0.23) $ 0.71 $ 2.39 $ 1.82 $ 0.58 (1) Net income (loss) per share - diluted $ 0.95 $ 1.18 $ 1.04 $ (0.82) $ 0.26 $ (0.22) $ 0.70 $ 2.37 $ 1.80 $ 0.57 (2) Adjusted Earnings per Share ( Adjusted EPS ) Numerator GAAP net income (loss) attributable to common shareholders $ 300 $ 371 $ 324 $ (253) $ 81 $ (71) $ 219 $ 742 $ 558 $ 184 Discontinued operations, net of tax — — — — 1 — (1) — 1 (1) (3) Core OID 17 17 16 16 15 1 2 66 56 9 (4) Change in the fair value of equity securities (2) (27) (35) 13 47 26 (48) (51) 6 (56) Core OID, repositioning & change in the fair value of equity securities tax (tax rate 21%) (16) 2 4 (99) (38) (18) 22 (109) (40) (69) (4) Repositioning 59 — — 503 140 59 (81) 562 150 412 Significant discrete tax items (18) — — — — (18) (18) (18) — (18) (3) Core net income attributable to common shareholders $ 341 $ 363 $ 309 $ 179 $ 246 $ (22) $ 95 $ 1,192 $ 731 $ 461 Denominator Weighted-average common shares outstanding - basic or diluted as applicable 314,264 313,823 312,434 309,006 311,277 441 2,987 313,043 310,160 2,883 (2) Adjusted EPS $ 1.09 $ 1.15 $ 0.99 $ 0.58 $ 0.78 $ (0.07) $ 0.30 $ 3.81 $ 2.35 $ 1.46 GAAP original issue discount amortization expense $ 19 $ 19 $ 18 $ 18 $ 17 $ — $ 2 $ 74 $ 68 $ 5 Other OID (2) (2) (2) (3) (3) — 1 (8) (12) 4 (3) Core original issue discount (Core OID) amortization expense $ 17 $ 17 $ 16 $ 16 $ 15 $ 1 $ 2 $ 66 $ 56 $ 9 GAAP outstanding original issue discount balance $ (689) $ (708) $ (727) $ (745) $ (763) $ 19 $ 74 $ (689) $ (763) $ 74 Other outstanding OID balance 18 20 22 24 27 (2) (8) 18 27 (8) (3) Core outstanding original issue discount balance (Core OID balance) $ (671) $ (688) $ (705) $ (721) $ (736) $ 17 $ 66 $ (671) $ (736) $ 66 GAAP Net Financing Revenue $ 1,598 $ 1,584 $ 1,516 $ 1,478 $ 1,509 $ 14 $ 89 $ 6,176 $ 6,014 $ 162 (3) Core OID 17 17 16 16 15 1 2 66 56 9 (3) Net Financing Revenue (ex. Core OID) $ 1,615 $ 1,601 $ 1,532 $ 1,494 $ 1,524 $ 15 $ 91 $ 6,242 $ 6,070 $ 171 GAAP Other Revenue $ 525 $ 584 $ 566 $ 63 $ 517 $ (59) $ 8 $ 1,738 $ 2,167 $ (429) (4) Repositioning 27 — — 495 — 27 27 $ 522 $ — $ 522 (4) Change in the fair value of equity securities (2) (27) (35) 13 47 26 (48) (51) 6 (56) (3) Adjusted Other Revenue $ 550 $ 557 $ 531 $ 571 $ 564 $ (7) $ (14) $ 2,209 $ 2,173 $ 37 GAAP Provision Expense $ 487 $ 415 $ 384 $ 191 $ 557 $ 72 $ (70) $ 1,477 $ 2,166 $ (689) (4) Repositioning (1) — — 306 — (1) (1) 305 — 305 (3) Adjusted Provision (ex. Repositioning) $ 486 $ 415 $ 384 $ 497 $ 557 $ 71 $ (71) $ 1,782 $ 2,166 $ (384) GAAP Noninterest Expense $ 1,250 $ 1,240 $ 1,262 $ 1,634 $ 1,360 $ 10 $ (110) $ 5,386 $ 5,179 $ 207 (4) Repositioning and other (31) — — (314) (140) (31) 108 (345) (150) (196) (3) Adjusted Noninterest Expense $ 1,219 $ 1,240 $ 1,262 $ 1,320 $ 1,220 $ (21) $ (2) $ 5,041 $ 5,029 $ 11 (1) Due to the antidilutive effect of the net loss attributable to common shareholders for the first quarter 2025, basic weighted average common shares outstanding were used to calculate basic or diluted earnings per share, as applicable. (2) Adjusted earnings per share (Adjusted EPS) is a non-GAAP financial measure that adjusts GAAP EPS for revenue and expense items that are typically strategic in nature or that management otherwise does not view as reflecting the operating performance of the company. Management believes Adjusted EPS can help the reader better understand the operating performance of the core businesses and their ability to generate earnings. In the numerator of Adjusted EPS, GAAP net income attributable to common shareholders is adjusted for the following items: (1) excludes discontinued operations, net of tax, as Ally is primarily a domestic company and sales of international businesses and other discontinued operations in the past have significantly impacted GAAP EPS, (2) adds back the tax- effected non-cash Core OID, (3) adjusts for tax-effected repositioning and other which are primarily related to the extinguishment of high cost legacy debt, strategic activities and significant other one-time items, (4) change in fair value of equity securities, (5) excludes significant discrete tax items that do not relate to the operating performance of the core businesses, and adjusts for preferred stock capital actions that have been taken by the company to normalize its capital structure, as applicable for respective periods. See pages 23-25 for details. (3) Represents a non-GAAP financial measure. For more details refer to pages 23-25. (4) For more details refer to pages 23-25. Note: Numbers may not foot due to rounding. 19
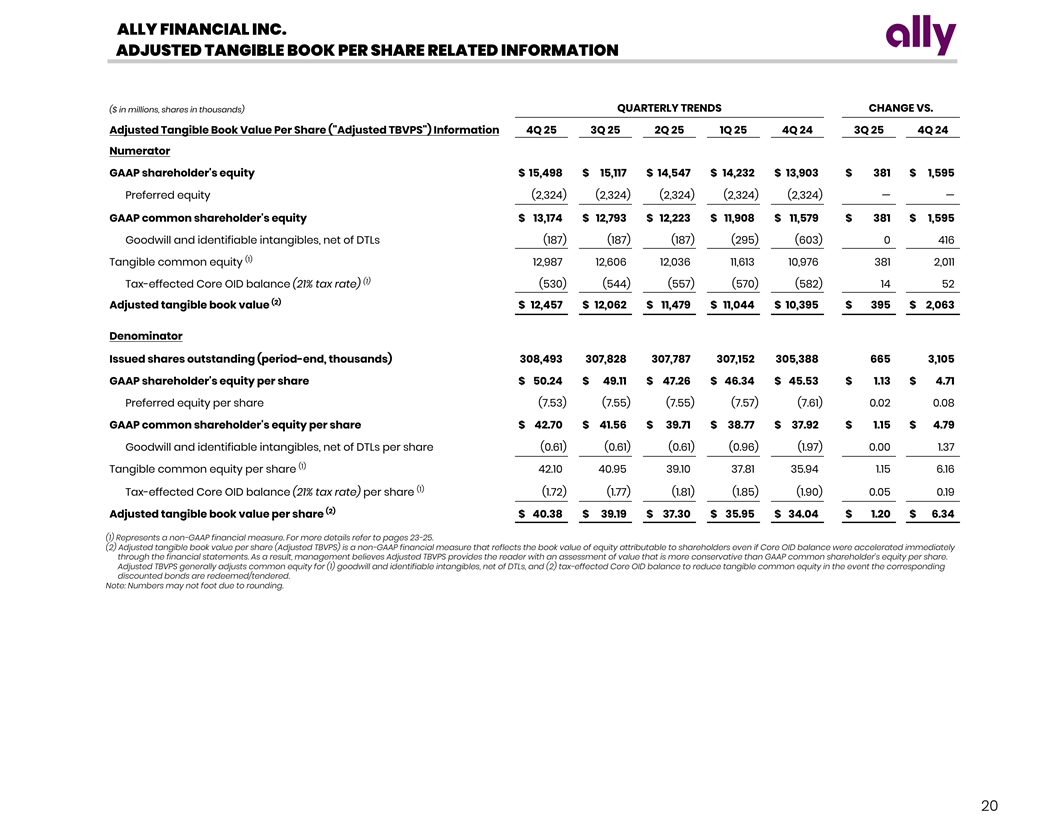
ALLY FINANCIAL INC. ADJUSTED TANGIBLE BOOK PER SHARE RELATED INFORMATION QUARTERLY TRENDS CHANGE VS. ($ in millions, shares in thousands) Adjusted Tangible Book Value Per Share ( Adjusted TBVPS ) Information 4Q 25 3Q 25 2Q 25 1Q 25 4Q 24 3Q 25 4Q 24 Numerator GAAP shareholder's equity $ 15,498 $ 15,117 $ 14,547 $ 14,232 $ 13,903 $ 381 $ 1,595 Preferred equity (2,324) (2,324) (2,324) (2,324) (2,324) — — GAAP common shareholder's equity $ 13,174 $ 12,793 $ 12,223 $ 11,908 $ 11,579 $ 381 $ 1,595 Goodwill and identifiable intangibles, net of DTLs (187) (187) (187) (295) (603) 0 416 (1) Tangible common equity 12,987 12,606 12,036 11,613 10,976 381 2,011 (1) Tax-effected Core OID balance (21% tax rate) (530) (544) (557) (570) (582) 14 52 (2) Adjusted tangible book value $ 12,457 $ 12,062 $ 11,479 $ 11,044 $ 10,395 $ 395 $ 2,063 Denominator Issued shares outstanding (period-end, thousands) 308,493 307,828 307,787 307,152 305,388 665 3,105 GAAP shareholder's equity per share $ 50.24 $ 49.11 $ 47.26 $ 46.34 $ 45.53 $ 1.13 $ 4.71 Preferred equity per share (7.53) (7.55) (7.55) (7.57) (7.61) 0.02 0.08 GAAP common shareholder's equity per share $ 42.70 $ 41.56 $ 39.71 $ 38.77 $ 37.92 $ 1.15 $ 4.79 Goodwill and identifiable intangibles, net of DTLs per share (0.61) (0.61) (0.61) (0.96) (1.97) 0.00 1.37 (1) Tangible common equity per share 42.10 40.95 39.10 37.81 35.94 1.15 6.16 (1) Tax-effected Core OID balance (21% tax rate) per share (1.72) (1.77) (1.81) (1.85) (1.90) 0.05 0.19 (2) Adjusted tangible book value per share $ 40.38 $ 39.19 $ 37.30 $ 35.95 $ 34.04 $ 1.20 $ 6.34 (1) Represents a non-GAAP financial measure. For more details refer to pages 23-25. (2) Adjusted tangible book value per share (Adjusted TBVPS) is a non-GAAP financial measure that reflects the book value of equity attributable to shareholders even if Core OID balance were accelerated immediately through the financial statements. As a result, management believes Adjusted TBVPS provides the reader with an assessment of value that is more conservative than GAAP common shareholder’s equity per share. Adjusted TBVPS generally adjusts common equity for (1) goodwill and identifiable intangibles, net of DTLs, and (2) tax-effected Core OID balance to reduce tangible common equity in the event the corresponding discounted bonds are redeemed/tendered. Note: Numbers may not foot due to rounding. 20
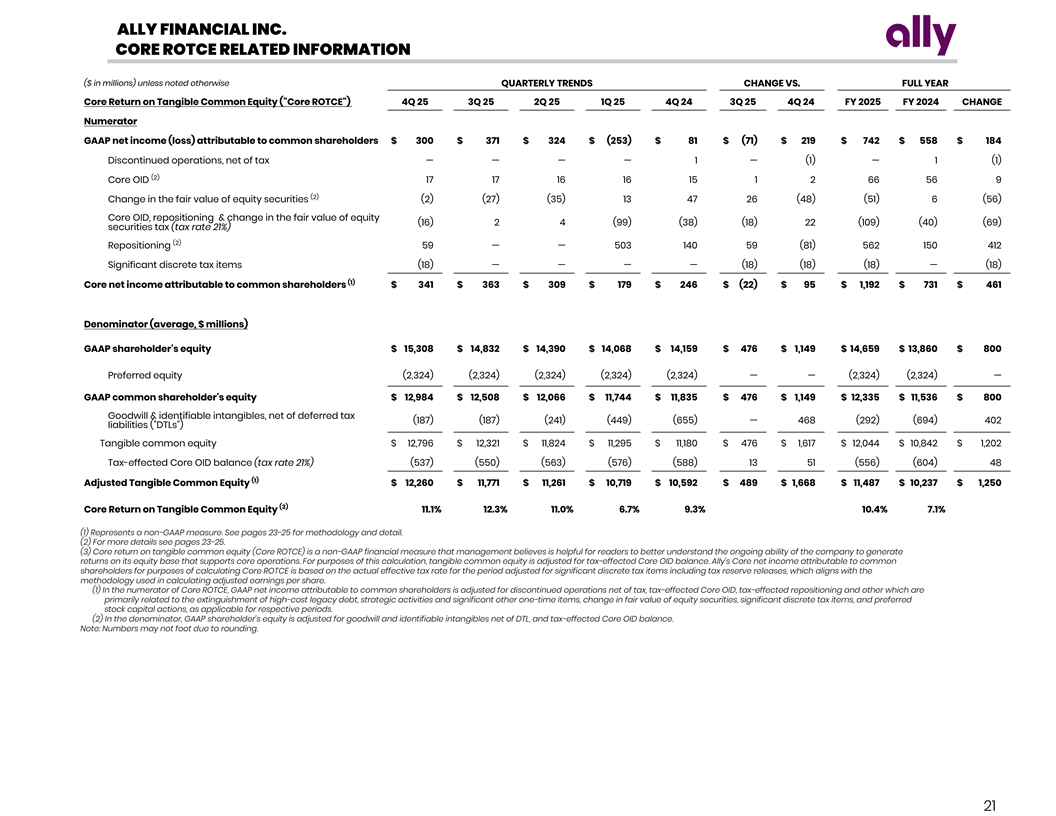
ALLY FINANCIAL INC. CORE ROTCE RELATED INFORMATION ($ in millions) unless noted otherwise QUARTERLY TRENDS CHANGE VS. FULL YEAR Core Return on Tangible Common Equity ( Core ROTCE ) 4Q 25 3Q 25 2Q 25 1Q 25 4Q 24 3Q 25 4Q 24 FY 2025 FY 2024 CHANGE Numerator GAAP net income (loss) attributable to common shareholders $ 300 $ 371 $ 324 $ (253) $ 81 $ (71) $ 219 $ 742 $ 558 $ 184 Discontinued operations, net of tax — — — — 1 — (1) — 1 (1) (2) Core OID 17 17 16 16 15 1 2 66 56 9 (2) Change in the fair value of equity securities (2) (27) (35) 13 47 26 (48) (51) 6 (56) Core OID, repositioning & change in the fair value of equity (16) 2 4 (99) (38) (18) 22 (109) (40) (69) securities tax (tax rate 21%) (2) Repositioning 59 — — 503 140 59 (81) 562 150 412 Significant discrete tax items (18) — — — — (18) (18) (18) — (18) (1) Core net income attributable to common shareholders $ 341 $ 363 $ 309 $ 179 $ 246 $ (22) $ 95 $ 1,192 $ 731 $ 461 Denominator (average, $ millions) GAAP shareholder's equity $ 15,308 $ 14,832 $ 14,390 $ 14,068 $ 14,159 $ 476 $ 1,149 $ 14,659 $ 13,860 $ 800 Preferred equity (2,324) (2,324) (2,324) (2,324) (2,324) — — (2,324) (2,324) — GAAP common shareholder's equity $ 12,984 $ 12,508 $ 12,066 $ 11,744 $ 11,835 $ 476 $ 1,149 $ 12,335 $ 11,536 $ 800 Goodwill & identifiable intangibles, net of deferred tax (187) (187) (241) (449) (655) — 468 (292) (694) 402 liabilities ( DTLs ) Tangible common equity $ 12,796 $ 12,321 $ 11,824 $ 11,295 $ 11,180 $ 476 $ 1,617 $ 12,044 $ 10,842 $ 1,202 Tax-effected Core OID balance (tax rate 21%) (537) (550) (563) (576) (588) 13 51 (556) (604) 48 (1) Adjusted Tangible Common Equity $ 12,260 $ 11,771 $ 11,261 $ 10,719 $ 10,592 $ 489 $ 1,668 $ 11,487 $ 10,237 $ 1,250 (3) Core Return on Tangible Common Equity 1 1.1 % 1 2.3 % 1 1.0 % 6 .7 % 9 .3% 1 0.4% 7 .1% (1) Represents a non-GAAP measure. See pages 23-25 for methodology and detail. (2) For more details see pages 23-25. (3) Core return on tangible common equity (Core ROTCE) is a non-GAAP financial measure that management believes is helpful for readers to better understand the ongoing ability of the company to generate returns on its equity base that supports core operations. For purposes of this calculation, tangible common equity is adjusted for tax-effected Core OID balance. Ally’s Core net income attributable to common shareholders for purposes of calculating Core ROTCE is based on the actual effective tax rate for the period adjusted for significant discrete tax items including tax reserve releases, which aligns with the methodology used in calculating adjusted earnings per share. (1) In the numerator of Core ROTCE, GAAP net income attributable to common shareholders is adjusted for discontinued operations net of tax, tax-effected Core OID, tax-effected repositioning and other which are primarily related to the extinguishment of high-cost legacy debt, strategic activities and significant other one-time items, change in fair value of equity securities, significant discrete tax items, and preferred stock capital actions, as applicable for respective periods. (2) In the denominator, GAAP shareholder’s equity is adjusted for goodwill and identifiable intangibles net of DTL, and tax-effected Core OID balance. Note: Numbers may not foot due to rounding. 21
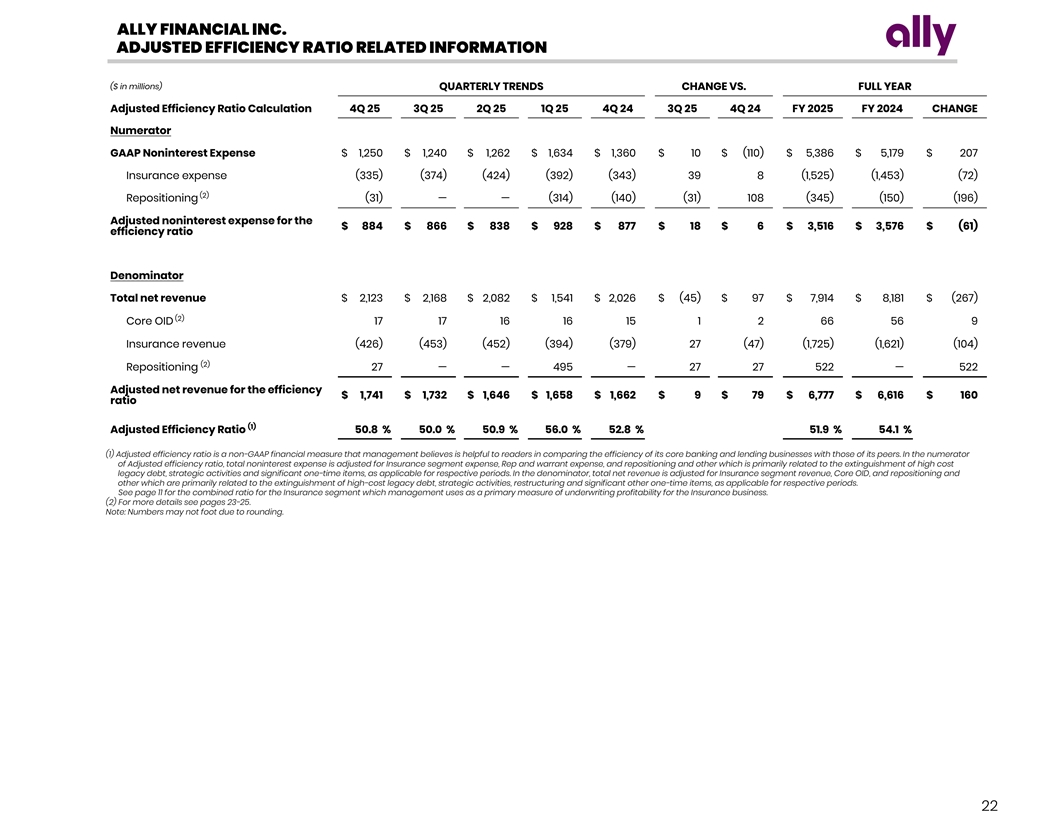
ALLY FINANCIAL INC. ADJUSTED EFFICIENCY RATIO RELATED INFORMATION ($ in millions) QUARTERLY TRENDS CHANGE VS. FULL YEAR Adjusted Efficiency Ratio Calculation 4Q 25 3Q 25 2Q 25 1Q 25 4Q 24 3Q 25 4Q 24 FY 2025 FY 2024 CHANGE Numerator GAAP Noninterest Expense $ 1,250 $ 1,240 $ 1,262 $ 1,634 $ 1,360 $ 10 $ (110) $ 5,386 $ 5,179 $ 207 Insurance expense (335) (374) (424) (392) (343) 39 8 (1,525) (1,453) (72) (2) Repositioning (31) — — (314) (140) (31) 108 (345) (150) (196) Adjusted noninterest expense for the $ 884 $ 866 $ 838 $ 928 $ 877 $ 18 $ 6 $ 3,516 $ 3,576 $ (61) efficiency ratio Denominator Total net revenue $ 2,123 $ 2,168 $ 2,082 $ 1,541 $ 2,026 $ (45) $ 97 $ 7,914 $ 8,181 $ (267) (2) Core OID 17 17 16 16 15 1 2 66 56 9 Insurance revenue (426) (453) (452) (394) (379) 27 (47) (1,725) (1,621) (104) (2) Repositioning 27 — — 495 — 27 27 522 — 522 Adjusted net revenue for the efficiency $ 1,741 $ 1,732 $ 1,646 $ 1,658 $ 1,662 $ 9 $ 79 $ 6,777 $ 6,616 $ 160 ratio (1) Adjusted Efficiency Ratio 5 0.8 % 5 0.0 % 50.9 % 56.0 % 5 2.8 % 51.9 % 54.1 % (1) Adjusted efficiency ratio is a non-GAAP financial measure that management believes is helpful to readers in comparing the efficiency of its core banking and lending businesses with those of its peers. In the numerator of Adjusted efficiency ratio, total noninterest expense is adjusted for Insurance segment expense, Rep and warrant expense, and repositioning and other which is primarily related to the extinguishment of high cost legacy debt, strategic activities and significant one-time items, as applicable for respective periods. In the denominator, total net revenue is adjusted for Insurance segment revenue, Core OID, and repositioning and other which are primarily related to the extinguishment of high-cost legacy debt, strategic activities, restructuring and significant other one-time items, as applicable for respective periods. See page 11 for the combined ratio for the Insurance segment which management uses as a primary measure of underwriting profitability for the Insurance business. (2) For more details see pages 23-25. Note: Numbers may not foot due to rounding. 22
ALLY FINANCIAL INC. The following are non-GAAP financial measures which Ally believes are important to the reader of the Consolidated Financial Statements, but which are supplemental to and not a substitute for GAAP measures: Accelerated issuance expense (Accelerated OID), Adjusted earnings per share (Adjusted EPS), Adjusted efficiency ratio, Adjusted noninterest expense, Adjusted other revenue, Adjusted tangible book value per share (Adjusted TBVPS), Adjusted total net revenue, Core net income attributable to common shareholders, Core original issue discount (Core OID) amortization expense, Core outstanding original issue discount balance (Core OID balance), Core pre-tax income, Core return on tangible common equity (Core ROTCE), Investment income and other (adjusted), Net financing revenue (excluding Core OID), Net interest margin (excluding Core OID), and Adjusted Tangible Common Equity. These measures are used by management and we believe are useful to investors in assessing the company’s operating performance and capital. 1) Accelerated issuance expense (Accelerated OID) is the recognition of issuance expenses related to calls of redeemable debt. 2) Adjusted earnings per share (Adjusted EPS) is a non-GAAP financial measure that adjusts GAAP EPS for revenue and expense items that are typically strategic in nature or that management otherwise does not view as reflecting the operating performance of the company. Management believes Adjusted EPS can help the reader better understand the operating performance of the core businesses and their ability to generate earnings. In the numerator of Adjusted EPS, GAAP net income attributable to common shareholders is adjusted for the following items: (1) excludes discontinued operations, net of tax, as Ally is primarily a domestic company and sales of international businesses and other discontinued operations in the past have significantly impacted GAAP EPS, (2) adds back the tax-effected non-cash Core OID, (3) adjusts for tax-effected repositioning and other which are primarily related to the extinguishment of high cost legacy debt, strategic activities and significant other one-time items, (4) excludes change in fair value of equity securities, (5) excludes significant discrete tax items that do not relate to the operating performance of the core businesses, and adjusts for preferred stock capital actions that have been taken by the company to normalize its capital structure, as applicable for respective periods. 3) Adjusted efficiency ratio is a non-GAAP financial measure that management believes is helpful to readers in comparing the efficiency of its core banking and lending businesses with those of its peers. (1) In the numerator of Adjusted efficiency ratio, total noninterest expense is adjusted for Rep and warrant expense, Insurance segment expense, and repositioning and other which are primarily related to the extinguishment of high-cost legacy debt, strategic activities and significant other one-time items, as applicable for respective periods. (2) In the denominator, total net revenue is adjusted for Core OID and Insurance segment revenue, and repositioning and other which are primarily related to the extinguishment of high-cost legacy debt, strategic activities, restructuring and significant other one-time items, as applicable for respective periods. 4) Adjusted noninterest expense is a non-GAAP financial measure that adjusts GAAP noninterest expense for repositioning items. Management believes adjusted noninterest expense is a helpful financial metric because it enables the reader better understand the business' expenses excluding nonrecurring items. 5) Adjusted other revenue is a non-GAAP financial measure that adjusts GAAP other revenue for OID expenses, repositioning, and change in fair value of equity securities. Management believes adjusted other revenue is a helpful financial metric because it enables the reader to better understand the business' ability to generate other revenue. 6) Adjusted Provision for Credit Losses is a non-GAAP financial measure that adjusts GAAP provision for credit losses for repositioning items. Management believes adjusted provision for credit losses is a helpful financial metric because it enables the reader better understand the business’ expenses excluding nonrecurring items. 7) Adjusted tangible book value per share (Adjusted TBVPS) is a non-GAAP financial measure that reflects the book value of equity attributable to shareholders even if Core OID balance were accelerated immediately through the financial statements. As a result, management believes Adjusted TBVPS provides the reader with an assessment of value that is more conservative than GAAP common shareholder’s equity per share. Adjusted TBVPS generally adjusts common equity for: (1) goodwill and identifiable intangibles, net of DTLs, and (2) tax-effected Core OID balance to reduce tangible common equity in the event the corresponding discounted bonds are redeemed/tendered. Note: In December 2017, tax- effected Core OID balance was adjusted from a statutory U.S. Federal tax rate of 35% to 21% (“rate”) as a result of changes to U.S. tax law. The adjustment conservatively increased the tax-effected Core OID balance and consequently reduced Adjusted TBVPS as any acceleration of the non-cash charge in future periods would flow through the financial statements at a 21% rate versus a previously modeled 35% rate. 8) Adjusted total net revenue is a non-GAAP financial measure that management believes is helpful for readers to understand the ongoing ability of the company to generate revenue. For purposes of this calculation, GAAP net financing revenue is adjusted by excluding Core OID to calculate net financing revenue ex. core OID. GAAP other revenue is adjusted for OID expenses, repositioning, and change in fair value of equity securities to calculate adjusted other revenue. Adjusted total net revenue is calculated by adding net financing revenue ex. core OID to adjusted other revenue. 9) Change in fair value of equity securities impacts the Insurance, Corporate Finance and Corporate and Other segments. The change reflects fair value adjustments to equity securities that are reported at fair value. Management believes the change in fair value of equity securities should be removed from select financial measures because it enables the reader to better understand the business’ ongoing ability to generate revenue and income. 23
ALLY FINANCIAL INC. The following are non-GAAP financial measures which Ally believes are important to the reader of the Consolidated Financial Statements, but which are supplemental to and not a substitute for GAAP measures: Accelerated issuance expense (Accelerated OID), Adjusted earnings per share (Adjusted EPS), Adjusted efficiency ratio, Adjusted noninterest expense, Adjusted other revenue, Adjusted tangible book value per share (Adjusted TBVPS), Adjusted total net revenue, Core net income attributable to common shareholders, Core original issue discount (Core OID) amortization expense, Core outstanding original issue discount balance (Core OID balance), Core pre-tax income, Core return on tangible common equity (Core ROTCE), Investment income and other (adjusted), Net financing revenue (excluding Core OID), Net interest margin (excluding Core OID), and Adjusted Tangible Common Equity. These measures are used by management and we believe are useful to investors in assessing the company’s operating performance and capital. 10) Core net income attributable to common shareholders is a non-GAAP financial measure that serves as the numerator in the calculations of Adjusted EPS and Core ROTCE and that, like those measures, is believed by management to help the reader better understand the operating performance of the core businesses and their ability to generate earnings. Core net income attributable to common shareholders adjusts GAAP net income attributable to common shareholders for discontinued operations net of tax, tax-effected Core OID expense, tax-effected repositioning and other primarily related to the extinguishment of high-cost legacy debt and strategic activities and significant other, preferred stock capital actions, significant discrete tax items and tax-effected changes in equity investments measured at fair value, as applicable for respective periods. 11) Core original issue discount (Core OID) amortization expense is a non-GAAP financial measure for OID and is believed by management to help the reader better understand the activity removed from: Core pre-tax income (loss), Core net income (loss) attributable to common shareholders, Adjusted EPS, Core ROTCE, Adjusted efficiency ratio, Adjusted total net revenue, and Net financing revenue (excluding Core OID). Core OID is primarily related to bond exchange OID which excludes international operations and future issuances. Core OID for all periods shown is applied to the pre-tax income of the Corporate and Other segment. 12) Core outstanding original issue discount balance (Core OID balance) is a non-GAAP financial measure for outstanding OID and is believed by management to help the reader better understand the balance removed from Core ROTCE and Adjusted TBVPS. Core OID balance is primarily related to bond exchange OID which excludes international operations and future issuances. 13) Core pre-tax income is a non-GAAP financial measure that adjusts pre-tax income from continuing operations by excluding (1) Core OID, and (2) change in fair value of equity securities (change in fair value of equity securities impacts the Insurance and Corporate Finance segments), and (3) Repositioning and other which are primarily related to the extinguishment of high cost legacy debt, strategic activities and significant other one-time items, as applicable for respective periods or businesses. Management believes core pre- tax income can help the reader better understand the operating performance of the core businesses and their ability to generate earnings. 14) Core return on tangible common equity (Core ROTCE) is a non-GAAP financial measure that management believes is helpful for readers to better understand the ongoing ability of the company to generate returns on its equity base that supports core operations. For purposes of this calculation, tangible common equity is adjusted for tax-effected Core OID balance. Ally’s Core net income attributable to common shareholders for purposes of calculating Core ROTCE is based on the actual effective tax rate for the period adjusted for significant discrete tax items including tax reserve releases, which aligns with the methodology used in calculating adjusted earnings per share. (1) In the numerator of Core ROTCE, GAAP net income attributable to common shareholders is adjusted for discontinued operations net of tax, tax-effected Core OID, tax-effected repositioning and other which are primarily related to the extinguishment of high-cost legacy debt, strategic activities and significant other one- time items, change in fair value of equity securities, significant discrete tax items, and preferred stock capital actions, as applicable for respective periods. (2) In the denominator, GAAP shareholder’s equity is adjusted for goodwill and identifiable intangibles net of DTL, and tax-effected Core OID balance. 15) Estimated impact of CECL on regulatory capital per final rule issued by U.S. banking agencies - In December 2018, the FRB and other U.S. banking agencies approved a final rule to address the impact of CECL on regulatory capital by allowing BHCs and banks, including Ally, the option to phase in the day-one impact of CECL over a three-year period. In March 2020, the FRB and other U.S. banking agencies issued an interim final rule that became effective on March 31, 2020 and provided an alternative option for banks to temporarily delay the impacts of CECL, relative to the incurred loss methodology for estimating the allowance for loan losses, on regulatory capital. A final rule that was largely unchanged from the March 2020 interim final rule was issued by the FRB and other U.S. banking agencies in August 2020, and became effective in September 2020. For regulatory capital purposes, these rules permitted us to delay recognizing the estimated impact of CECL on regulatory capital until after a two-year deferral period, which for us extended through December 31, 2021. Beginning on January 1, 2022, we are required to phase in 25% of the previously deferred estimated capital impact of CECL, with an additional 25% to be phased in at the beginning of each subsequent year until fully phased in by the first quarter of 2025. Under these rules, firms that adopt CECL and elect the five-year transition will calculate the estimated impact of CECL on regulatory capital as the day-one impact of adoption plus 25% of the subsequent change in allowance during the two-year deferral period, which according to the final rule approximates the impact of CECL relative to an incurred loss model. We adopted this transition option during the first quarter of 2020, and phased in the regulatory capital impacts of CECL from January 1, 2022, to January 1, 2025, in accordance with the five-year transition period. 16) Investment income and other (adjusted) is a non-GAAP financial measure that adjusts GAAP investment income and other for repositioning, and the change in fair value of equity securities. Management believes investment income and other (adjusted) is a helpful financial metric because it enables the reader to better understand the business' ability to generate investment income. 24
ALLY FINANCIAL INC. The following are non-GAAP financial measures which Ally believes are important to the reader of the Consolidated Financial Statements, but which are supplemental to and not a substitute for GAAP measures: Accelerated issuance expense (Accelerated OID), Adjusted earnings per share (Adjusted EPS), Adjusted efficiency ratio, Adjusted noninterest expense, Adjusted other revenue, Adjusted tangible book value per share (Adjusted TBVPS), Adjusted total net revenue, Core net income attributable to common shareholders, Core original issue discount (Core OID) amortization expense, Core outstanding original issue discount balance (Core OID balance), Core pre-tax income, Core return on tangible common equity (Core ROTCE), Investment income and other (adjusted), Net financing revenue (excluding Core OID), Net interest margin (excluding Core OID), and Adjusted Tangible Common Equity. These measures are used by management and we believe are useful to investors in assessing the company’s operating performance and capital. 17) Net financing revenue excluding core OID is calculated using a non-GAAP measure that adjusts net financing revenue by excluding Core OID. The Core OID balance is primarily related to bond exchange OID which excludes international operations and future issuances. Management believes net financing revenue ex. Core OID is a helpful financial metric because it enables the reader to better understand the business' ability to generate revenue. 18) Net interest margin excluding core OID is calculated using a non-GAAP measure that adjusts net interest margin by excluding Core OID. The Core OID balance is primarily related to bond exchange OID which excludes international operations and future issuances. Management believes net interest margin ex. Core OID is a helpful financial metric because it enables the reader to better understand the business' profitability and margins. 19) Repositioning is primarily related to the extinguishment of high-cost legacy debt, strategic activities, restructuring, amounts related to nonrecurring business transactions or pending transactions, and significant other one-time items. 20) Adjusted Tangible Common Equity is a non-GAAP financial measure that is defined as common stockholders’ equity less goodwill and identifiable intangible assets, net of deferred tax liabilities. Ally considers various measures when evaluating capital adequacy, including tangible common equity. Ally believes that tangible common equity is important because we believe readers may assess our capital adequacy using this measure. Additionally, presentation of this measure allows readers to compare certain aspects of our capital adequacy on the same basis to other companies in the industry. For purposes of calculating Core return on tangible common equity (Core ROTCE), tangible common equity is further adjusted for tax-effected Core OID balance. 25