☑ANNUAL REPORT PURSUANT TO SECTION 13 OR 15(d) OF THE SECURITIES EXCHANGE ACT OF 1934
FOR THE FISCAL YEAR ENDED DECEMBER 31, 2025
☐TRANSITION REPORT PURSUANT TO SECTION 13 OR 15(d) OF THE SECURITIES EXCHANGE ACT OF 1934
Commission File Number 1-2958
HUBBELL INCORPORATED
(Exact name of registrant as specified in its charter)
Connecticut
06-0397030
(State or other jurisdiction of incorporation or organization)
(I.R.S. Employer Identification No.)
40 Waterview Drive
Shelton
CT
06484
(Address of principal executive offices)
(Zip Code)
(475)
882-4000
(Registrant’s telephone number, including area code)
SECURITIES REGISTERED PURSUANT TO SECTION 12(b) OF THE ACT:
Title of each Class
Trading Symbol(s)
Name of Exchange on which Registered
Common Stock — par value $0.01 per share
HUBB
New York Stock Exchange
SECURITIES REGISTERED PURSUANT TO SECTION 12(g) OF THE ACT:
NONE
Indicate by check mark
•
if the registrant is a well-known seasoned issuer, as defined in Rule 405 of the Securities Act.
Yes
☑
No
☐
•
if the registrant is not required to file reports pursuant to Section 13 or 15(d) of the Securities Exchange Act of 1934.
Yes
☐
No
☑
•
whether the registrant (1) has filed all reports required to be filed by Section 13 or 15(d) of the Securities Exchange Act of 1934 during the preceding 12 months (or for such shorter period that the registrant was required to file such report), and (2) has been subject to such filing requirements for the past 90 days.
Yes
☑
No
☐
•
whether the registrant has submitted electronically every Interactive Data File required to be submitted and posted pursuant to Rule 405 of Regulation S-T (§232.405 of this chapter) during the preceding 12 months (or for such shorter period that the registrant was required to submit such files).
Yes
☑
No
☐
•
whether the registrant is a large accelerated filer, an accelerated filer, a non-accelerated filer, a smaller reporting company or an emerging growth company. See the definitions of “large accelerated filer,” “accelerated filer”, “smaller reporting company” and “emerging growth company” in Rule 12b-2 of the Exchange Act.
Large accelerated filer
☑
Accelerated filer ☐
Non-accelerated filer ☐
Smaller reporting company
☐
Emerging growth company
☐
If an emerging growth company, indicate by check mark if the registrant has elected not to use the extended transition period for complying with any new or revised financial accounting standard provided pursuant to Section 13(a) of the Exchange Act. ☐
•
whether the registrant has filed a report on and attestation to its management’s assessment of the effectiveness of its internal control over financial reporting under Section 404(b) of the Sarbanes-Oxley Act (15 U.S.C. 7262(b)) by the registered public accounting firm that prepared or issued its audit report.
☑
•
If securities are registered pursuant to Section 12(b) of the Act whether the financial statements of the registrant included in the filing reflect the correction of an error to previously issued financial statements.
☐
•
If securities are registered pursuant to Section 12(b) of the Act, whether any of those error corrections are restatements that required a recovery analysis of incentive-based compensation received by any of the registrant’s executive officers during the relevant recovery period pursuant to §240.10D-1(b).
☐
•whether the registrant is a shell company (as defined in Rule 12b-2 of the Exchange Act).
Yes
☐
No
☑
The aggregate market value of the voting and non-voting stock held by non-affiliates of the registrant as of June 30, 2025 was $21,586,750,695.* The number of shares outstanding of Hubbell common stock as of February 5, 2026 is 53,161,602.
DOCUMENTS INCORPORATED BY REFERENCE
Portions of the definitive proxy statement for the registrant’s 2026 annual meeting of shareholders to be filed with the Securities and Exchange Commission (the “SEC”), are incorporated by reference in answer to Part III of this Form 10-K.
*Calculated by excluding all shares held by Executive Officers and Directors of registrant without conceding that all such persons or entities are “affiliates” of registrant for purpose of the Federal Securities Laws.
Hubbell Incorporated (herein referred to as “Hubbell”, the “Company”, the “registrant”, “we”, “our” or “us”, which references shall include its divisions and subsidiaries as the context may require) was founded as a proprietorship in 1888, and was incorporated in Connecticut in 1905. Recognized for our innovation, quality, and deep commitment to serving our customers for over 135 years, Hubbell is a world-class manufacturer of electrical and utility solutions, with more than 75 brands used around the world. We provide utility and electrical solutions that enable our customers to operate critical infrastructure reliably and efficiently, and we empower and energize communities through innovative solutions supporting energy infrastructure In Front of the Meter, on The Edge, and Behind the Meter. In Front of the Meter is where utilities transmit and distribute energy to their customers. The Edge connects utilities with owners and operators and allows energy and data to be distributed back and forth. Behind the Meter is where owners and operators of building and other critical infrastructure consume energy.
Products are either sourced complete, manufactured or assembled by subsidiaries in the United States, Canada, Puerto Rico, Mexico, China, the United Kingdom ("UK"), Brazil, Australia, Spain, Ireland, and the Republic of the Philippines. The Company also participates in joint ventures in Hong Kong and the Republic of the Philippines, and maintains offices in Singapore, Italy, China, India, Mexico, South Korea, Chile, and countries in the Middle East.
The Company’s reporting segments consist of the Utility Solutions segment and the Electrical Solutions segment.
The Company’s annual report on Form 10-K, quarterly reports on Form 10-Q, current reports on Form 8-K, and all amendments to those reports are made available free of charge through the Investor Relations section of the Company’s website at http://www.hubbell.com as soon as reasonably practicable after such material is electronically filed with, or furnished to, the SEC. The information contained on the Company’s website or connected to our website is not incorporated by reference into this Annual Report on Form 10-K and should not be considered part of this report.
HUBBELL INCORPORATED- Form 10-K
3
Utility Solutions Segment
Hubbell Utility Solutions has leading positions In Front of the Meter and on The Edge. The Utility Solutions segment (63% of consolidated revenues in 2025, 64% in 2024 and 61% in 2023) consists of businesses that enable the grid to conduct, communicate and control energy across utility applications. The Utility Solutions segment provides critical components that allow the grid to reliably transmit and distribute energy, as well as the communications and controls technologies to make the grid smarter and more flexible. This includes utility transmission & distribution (T&D) components such as arresters, insulators, connectors, anchors, bushings, enclosures, cutouts and switches. The Utility Solutions segment also offers solutions that serve The Edge of the utility infrastructure, including smart meters, communications systems, and protection and control devices. Hubbell Utility Solutions supports the electrical distribution, electrical substation, electrical transmission, gas distribution, telecommunications, utility meters & AMI, and grid protection and controls markets. While Hubbell believes its sales in this area are not materially dependent upon any customer or group of customers, a substantial variability in purchases by electrical utilities would affect this segment.
Products of the Utility Solutions segment are sold under various brands and/or trademarks into the electrical distribution, substation and transmission markets as well as, markets for grid protection and controls, utility meters and advanced metering infrastructure and telcom and gas distribution markets. The products are sold into these markets primarily through distributors, or directly to utilities. Brands and/or trademarks of products of the Utility Solutions segment include:
•
Aclara®
•
Chance®
•
Anderson®
•
PenCell®
•
Fargo®
•
Hubbell®
•
Polycast®
•
Opti-loop Design®
•
Quazite®
•
Quadri*sil®
•
Trinetics®
•
Reuel®
•
Electro Composites®
•
USCO™
•
CDR™
•
RFL Design®
•
Hot Box®
•
PCORE®
•
Delmar™
•
Turner Electric®
•
EMC™
•
Longbow™
•
Ohio Brass®
•
Meramec®
•
Reliaguard®
•
Greenjacket®
•
Armorcast®
•
Beckwith Electric™
•
Continental®
•
R.W. Lyall™
•
Gas Breaker®
•
AEC™
•
Ripley®
•
Electro Industries / Gauge Tech™
•
Balestro™
•
Systems Control™
•
Nicor™
•
DMC Power®
4
HUBBELL INCORPORATED - Form 10-K
Electrical Solutions Segment
Hubbell Electrical Solutions is positioned Behind the Meter, consisting of businesses that are essential to managing power across a wide range of industries and applications. Hubbell Electrical Solutions provides the critical components that allow operators of buildings, factories, and other industrial infrastructure to connect, protect, wire and manage power reliability and efficiency. The Electrical Solutions segment (37% of consolidated revenues in 2025, 36% in 2024 and 39% in 2023) comprises businesses that sell stock and custom products including standard and special application wiring device products, rough-in electrical products, and connector and grounding products, as well as other electrical equipment.
Products of the Electrical Solutions segment have applications in the non-residential, light industrial, heavy industrial, datacenter, electric transmission and distribution, and renewables markets. Electrical Solutions segment products are typically used in and around industrial, commercial and institutional facilities by electrical contractors, maintenance personnel, electricians, utilities, and telecommunications companies. In addition, certain of our businesses design and manufacture industrial controls and communication systems used in the non-residential and industrial markets. Many of these products are designed such that they can also be used in harsh and hazardous locations where a potential for fire and explosion exists due to the presence of flammable gasses and vapors. Harsh and hazardous products are primarily used in the oil and gas (onshore and offshore) and mining industries. We also offer a variety of wiring devices and electrical products that have residential and utility applications.
In December 2023, the Company entered into a definitive agreement to sell its residential lighting business for a cash purchase price of $131 million, subject to customary adjustments. The residential lighting business sells indoor and outdoor lighting solutions. The business generated $187.1 million in sales in 2023. The transaction closed in the first quarter of 2024 and the Company recorded a pre-tax loss on the sale of $5.3 million, which is recorded within Total other expense in the Company’s Consolidated Statement of Income.
Products of the Electrical Solutions segment are sold under various brands and/or trademarks and are primarily sold through electrical and industrial distributors, home centers, retail and hardware outlets, and residential product oriented internet sites. Special application products are primarily sold through wholesale distributors to contractors, industrial customers and original equipment manufacturers (“OEMs”). Brands and/or trademarks of products of the Electrical Solutions segment include:
•
Hubbell®
•
Bell®
•
Raco®
•
Gleason Reel®
•
ACME Electric®
•
Kellems®
•
TayMac®
•
Hipotronics®
•
Powerohm®
•
EC&M Design®
•
Bryant®
•
Wiegmann®
•
AccelTex Solutions™
•
iDevices®
•
Austdac™
•
Burndy®
•
Killark®
•
GAI-Tronics®
•
Connector Products™
•
Chalmit™
•
CMC®
•
Hawke™
•
PCX™
•
Ventev®
HUBBELL INCORPORATED- Form 10-K
5
Information Applicable to Our Business
International Operations
The Company has several operations located outside of the United States. These operations manufacture, assemble and/or procure and market Hubbell products and services for both the Utility Solutions and Electrical Solutions segments.
See Note 20 — Industry Segments and Geographic Area Information in the Notes to Consolidated Financial Statements and Item 1A. Risk Factors relating to manufacturing in and sourcing from foreign countries.
Customers
We have an extensive customer base of distributors, wholesalers, electric utilities, OEMs, electrical contractors, telecommunications companies and retail and hardware outlets. We are not dependent on a single customer, however, our top ten customers account for approximately 42% of our Net sales.
Raw Materials
Raw materials used in the manufacture of Hubbell products primarily include steel, aluminum, brass, copper, bronze, zinc, nickel, plastics, elastomers and petrochemicals. Hubbell also purchases certain electrical and electronic components, including solenoids, printed circuit boards, integrated circuit chips and cord sets, from a number of suppliers. Hubbell is not materially dependent upon any one supplier for raw materials used in the manufacture of its products and equipment however the cost and supply of these materials may be affected by disruptions in availability of raw materials, components or sourced finished goods. See also Item 7A. Quantitative and Qualitative Disclosures about Market Risk.
Patents
Hubbell has approximately 3,250 active United States and foreign patents covering a portion of its products, which expire at various times. While Hubbell deems these patents to be of value, it does not consider its business to be dependent upon patent protection. Hubbell also licenses products under patents owned by others, as necessary, and grants licenses under certain of its patents.
Working Capital
Inventory, accounts receivable and accounts payable levels, payment terms and, where applicable, return policies are in accordance with the general practices of the electrical products industry and standard business procedures. Certain businesses require a portion of the transaction price to be paid in advance of transfer of control. These payments are treated as a contract liability and are classified in Other accrued liabilities in the Consolidated Balance Sheets. Contract assets primarily relate to performance obligations satisfied prior to payment that are recorded in Other current assets in the Consolidated Balance Sheets. See also Item 7. Management’s Discussion and Analysis of Financial Condition and Results of Operations.
6
HUBBELL INCORPORATED - Form 10-K
Backlog
Substantially all of the backlog existing at December 31, 2025 in the Electrical Solutions segment is expected to be shipped to customers in 2026. In the Utility Solutions segment, substantially all of the backlog existing at December 31, 2025 is expected to be shipped during 2026, along with approximately $20 million of backlog of contracts that span multiple years, primarily related to long-term contracts within the Utility Solutions segment to deliver and install meters and grid monitoring sensor technology. The backlog of orders believed to be firm at December 31, 2025 was $2,159 million compared to $1,898 million at December 31, 2024. Although this backlog is important, the majority of Hubbell’s revenues result from sales of inventoried products or products that have short periods of manufacture.
Competition
Hubbell experiences substantial competition in all categories of its business, but does not compete with the same companies in all of its product categories. The number and size of competitors vary considerably depending on the product line. Hubbell cannot specify with precision the number of competitors in each product category or their relative market position. However, some of its competitors are larger companies with substantial financial and other resources. Hubbell considers product performance, reliability, quality and technological innovation to be important factors relevant to all areas of its business and considers its reputation as a manufacturer of quality products to be an important factor in its business. In addition, product price, service levels and other factors can affect Hubbell’s ability to compete.
Environment
The Company is subject to various federal, state and local government requirements relating to the protection of employee health and safety and the environment. The Company believes that, as a general matter, its policies, practices and procedures are properly designed to prevent unreasonable risk of environmental damage and personal injury to its employees and its customers’ employees and that the handling, manufacture, use and disposal of hazardous or toxic substances are in accordance with environmental laws and regulations.
Like other companies engaged in similar businesses, the Company has incurred or acquired through business combinations, remedial response and voluntary cleanup costs for site contamination, and is a party to claims associated with environmental matters. Additional lawsuits, claims and costs involving environmental matters are likely to continue to arise in the future. However, considering past experience and reserves, the Company does not anticipate that these matters will have a material adverse effect on earnings, capital expenditures, financial condition or competitive position. See also Item 1A. Risk Factors and Note 15 — Commitments and Contingencies in the Notes to Consolidated Financial Statements.
HUBBELL INCORPORATED- Form 10-K
7
Human Capital
Our commitment to developing our employees is one of four pillars that guide Hubbell as a company. We recruit, hire, and develop talent that meets and anticipates the ever-changing needs of our enterprise and our stakeholders. Hubbell provides market-competitive compensation, health and well-being programs, and retirement benefits based on the countries and markets in which we operate to motivate market-leading performance.
As of December 31, 2025, Hubbell had approximately 18,000 salaried and hourly employees of whom approximately 10,900, or 61% are located in the United States. Approximately 2,425 of these U.S. employees are represented by 8 labor unions. Hubbell considers its labor relations to be satisfactory and regularly engages with its labor unions.
Hubbell strives to create a workplace where employees feel that their contributions are welcomed and valued, allowing them to fully engage their talents and training in their work, while generating personal satisfaction in their role within Hubbell.
Across the enterprise, there are a variety of ways we invest in our people to learn - on the job, in the classroom, through self-directed learning, or through leadership programs. We have expanded our learning management system (known as Hubbell University) to make new content and training available to our employees. The Company has also expanded leadership development programs to provide career development to employees at all levels and continues to expand its Campus Programs recruitment programs to foster a pipeline of early career talent at Hubbell.
The Company also encourages its employees to give back to their communities. The Company supports employees’ spirit of volunteerism in their communities throughout the year with its Volunteer Paid Time Off policy, which provides all U.S. employees with up to 8 hours of paid time off a year to volunteer with an eligible 501(c)(3) charity of their choice.
As a manufacturing company, we focus on protecting the health and safety of our employees and educate employees on how to Think Safe, Work Safe and Go Home Safe. We dedicate resources to track and monitor safety and recordable incidents using an enterprise-wide data management system. Through the Company’s myLife program, the Company also provides comprehensive, competitive benefits that retain and support our employees’ health, wealth and peace of mind.
In 2025 we conducted our fourth Elevate Employee Experience Survey (Elevate) across Hubbell. This survey provides our employees the opportunity to share perspectives on topics important to them. In 2025, Hubbell saw continued strong engagement with over 87% of Hubbell’s employees participating worldwide. The feedback provided through Elevate is then used to create action plans at all of Hubbell’s locations.
8
HUBBELL INCORPORATED - Form 10-K
Information about our Executive Officers
Name (1)
Age
Present Position
Business Experience
Gerben W. Bakker
61
Chairman of the Board, President and Chief Executive Officer
Present position since May 2021; previously President and Chief Executive Officer since October 2020; President and Chief Operating Officer, from June 2019 to October 2020; Group President, Power Systems, from February 2014 to June 2019; various other positions at Hubbell, from 1988 to 2014.
Joseph A. Capozzoli
51
Senior Vice President, Chief Financial Officer
Present position since January 2026; previously, Vice President, Enterprise Finance from October 2025 to December 2025, Vice President, Finance - Hubbell Electrical Solutions Segment from January 2023 to October 2025; Vice President, Business Transformation from January 2021 to January 2023; Vice President, Controller and Principal Accounting Officer from 2013 to January 2021.
Jonathan M. Del Nero
54
Vice President, Controller
Present position since January 2021; previously, Assistant Controller, from 2014 to January 2021.
Alyssa R. Flynn
54
Chief Human Resources Officer
Present position since February 2022; previously Vice President, Compensation, Benefits & HR Systems from 2014 to February 2022; Chief of Staff to the Chief Executive Officer from June 2021 to February 2022.
Gregory A. Gumbs
56
President, Utility Solutions Segment
Present position since July 2023; previously President and CEO, Bosch Rexroth, from September 2020 to June 2023; Vice President & General Manager Electrical Energy Automation Solutions Business, Eaton Corporation, from 2015 to May 2020.
Katherine A. Lane
48
Senior Vice President, General Counsel and Secretary
Present position since May 2021; previously Vice President, General Counsel and Secretary, from June 2019 to May 2021; Vice President, Acting General Counsel and Secretary, from March 2019 to June 2019; Vice President, Associate General Counsel, from 2017 to March 2019; various other positions at Hubbell, from 2010 to 2017.
Mark E. Mikes
61
President, Electrical Solutions Segment
Present position since July 2023; previously Division President, Hubbell Power Systems and Enterprise Operational Excellence from July 2022 to June, 2023; Division President, Hubbell Power Systems, November, from 2019 to July, 2022; various other position at Hubbell, from 1989 - November, 2019.
(1)As of February 12, 2026, there are no family relationships among any of the above executive officers and any of our Directors. For information related to our Board of Directors, refer to Item 10. Directors, Executive Officers and Corporate Governance.
HUBBELL INCORPORATED- Form 10-K
9
ITEM 1A Risk Factors
Our business, operating results, financial condition, and cash flows may be affected by a number of factors including, but not limited to those set forth below. Any one of these factors could cause our actual results to vary materially from recent results or future anticipated results. See also Item 7. Management’s Discussion and Analysis — “Executive Overview of the Business” and “Results of Operations”.
Industry and Economic Risks
Inflation and other unfavorable economic conditions may adversely affect our business results of operations and financial condition.
Our operating results can be sensitive to changes in general economic conditions, macro-economic effects of the U.S. government federal deficit, inflation, economic slowdowns, stagflation and recessions. Our sales are subject to market conditions that may cause customer demand for our products to be volatile and unpredictable. Product demand can be affected by fluctuations in domestic and international economic conditions, as well as currency fluctuations, commodity costs, and a variety of other factors.
We have in the past experienced, and may continue to experience, significant inflationary pressure across much of our business. Global supply chain issues and increased demand have in the past led to, and may continue to lead to, increased freight, labor and commodity costs. In addition, various factors, including the level of economic activity in China, the war between Ukraine and Russia and the conflict in the Middle East, have added, and may continue to add, to the volatility in energy costs. We have had to take various pricing actions to cover the increase in our costs associated with inflationary pressure and protect our margin profile. There can be no assurance that we will be able to maintain our margins in response to further changes in inflationary pressures.
In addition, macroeconomic effects such as increases in interest rates and other measures taken by central banks and other policy makers could have a negative effect on overall economic activity that could reduce our customers’ demand for our products. Adverse changes in demand could impact our business, collection of accounts receivable and our expected cash flow generation from current and acquired businesses, which may adversely impact our financial condition and results of operations.
We operate in markets that are subject to competitive pressures that could affect selling prices or demand for our products.
We compete on the basis of product performance, quality, service and/or price. Competitors' behavior related to these, among other areas, could potentially have significant impacts on our financial results. Our competitive strategy is to design and manufacture high quality products at the lowest possible cost. Our strategy is to also increase selling prices to offset rising costs of raw materials, components and logistics and supply chain matters when necessary. Competitive pricing pressures may not allow us to offset some or all of our increased costs through pricing actions. Alternatively, if raw material and component costs decline, the Company may not be able to maintain current pricing levels. Advancements in, and increased adoption of, artificial intelligence (AI), machine learning, automation, and other advanced technologies may result in a long-term competitive disadvantage. Although, we continuously evaluate and utilize technologies that are appropriate for our business, there can be no assurance that such technologies will result in improved operational efficiencies, cost reductions, or other anticipated benefits. Competition could also affect future selling prices or demand for our products which could have an adverse impact on our results of operations, financial condition and cash flows.
Volatility in currency exchange rates may adversely affect our financial condition, results of operations and cash flows.
Our international operations accounted for approximately 7% of our Net sales in 2025. We are exposed to the effects (both positive and negative) that fluctuating exchange rates have on translating the financial statements of our international operations, most of which are denominated in local currencies, into the U.S. dollar. Fluctuations in exchange rates may affect product demand and reported profits in our international operations. In addition, currency fluctuations may affect the prices we pay suppliers for materials used in our products, along with other local costs incurred in foreign countries for foreign entities with U.S. dollar functional currency. As a result, fluctuating exchange rates may adversely impact our results of operations and cash flows.
10
HUBBELL INCORPORATED - Form 10-K
Business and Operational Risks
Our ability to effectively develop and introduce new products could adversely affect our ability to compete.
New product introductions and the enhancement of existing products and services are key to the Company’s competitive strategy. The success of new product introductions is dependent on a number of factors, including, but not limited to, timely and successful development of new products, including software development, market acceptance of these products and the Company’s ability to manage the risks associated with these introductions. These risks include development and production capabilities, management of inventory levels to support anticipated demand, the risk that new products may have quality defects in the early stages of introduction, and obsolescence risk of existing products. The Company cannot predict with certainty the ultimate impact new product introductions could have on our results of operations, financial condition or cash flows.
We manufacture and source products and materials from various countries throughout the world. A disruption in the availability, price or quality of these products or materials could adversely affect our operating results.
Our business is subject to risks associated with global manufacturing and sourcing. We use a variety of raw materials in the production of our products including steel, aluminum, brass, copper, bronze, zinc, nickel, plastics, elastomers and petrochemicals. We also purchase certain electrical and electronic components, including solenoids, printed circuit boards, integrated circuit chips and cord sets from a number of suppliers. Certain of these materials are sourced from a limited number of suppliers. These materials may also be a key source of materials for many other companies in our industry or within industrial manufacturers in general. As such, in periods of rising demand for these materials, we may experience both increased costs and limited supply. Significant shortages in the availability of these materials or significant price increases could increase our operating costs and adversely impact the competitive positions of our products, which could adversely impact our results of operations. See also Risk Factor, “Changes in U.S. and international trade policies may adversely impact our business and operating results; changes in U.S. trade policies could have a material adverse effect on us.” We rely on materials, components and finished goods that are sourced from or manufactured in foreign countries including Mexico, China, and other international countries. Political instability in any country where we do business could have an adverse impact on our results of operations.
We rely on our suppliers to produce high quality materials, components and finished goods according to our specifications, including timely delivery. There is a risk that products may not meet our quality control procedure specifications which could adversely affect our ability to ship quality products to our customers on a timely basis and, could adversely affect our results of operations.
We may be required to recognize impairment charges for our goodwill and other intangible assets.
As of December 31, 2025, the net carrying value of our goodwill and other intangible assets totaled approximately $4,455 million. As required by generally accepted accounting principles, we periodically assess these assets to determine if they are impaired. Impairment of intangible assets may be triggered by developments both within and outside the Company’s control. Deteriorating economic conditions, technological changes, disruptions to our business, inability to effectively integrate acquired businesses, unexpected significant changes or planned changes in use of the assets, intensified competition, divestitures, market capitalization declines and other factors may impair our goodwill and other intangible assets. Any charges relating to such impairments could adversely affect our results of operations in the periods an impairment is recognized.
We engage in acquisitions and strategic investments and may encounter difficulty in obtaining appropriate acquisitions and in integrating these businesses.
Part of the Company’s growth strategy involves acquisitions. We have pursued and will continue to seek acquisitions and other strategic investments to complement and expand our existing businesses. The rate and extent to which acquisitions become available may affect our growth rate. The success of these transactions will depend on our ability to integrate these businesses into our operations and realize the planned synergies. We may encounter difficulties in integrating acquisitions into our operations and in managing strategic investments and foreign acquisitions and joint ventures may also present additional risk related to the integration of operations across different cultures and languages. Failure to effectively complete or manage acquisitions may adversely affect our existing businesses as well as our results of operations, financial condition and cash flows.
We may fail to realize all of the anticipated benefits of the acquisitions of Alliance USAcqCo 2, Inc. ("Ventev"), Nicor, Inc. ("Nicor"), Power Rose Acquisition, Inc. (and together with its subsidiaries, "DMC Power") and Northern Star Holdings, Inc. ("Systems Control") or those benefits may take longer to realize than expected.
The full benefits of the acquisitions of Ventev, Nicor, DMC Power and Systems Control, including the anticipated sales or growth opportunities, may not be realized as expected or may not be achieved within the anticipated time frame, or at all. Failure to achieve the anticipated benefits of the acquisitions of Ventev, Nicor, DMC Power and Systems Control could adversely affect our results of operations or cash flows and decrease or delay the expected accretive effects of the acquisitions of Ventev, Nicor, DMC Power and Systems Control.
HUBBELL INCORPORATED- Form 10-K
11
We may not be able to successfully implement initiatives, including our continuing restructuring activities that improve productivity and streamline operations to control or reduce costs.
Achieving our long-term profitability goals depends significantly on our ability to control or reduce our operating costs. Because many of our costs are affected by factors completely, or substantially outside our control, we generally must seek to control or reduce costs through productivity initiatives. If we are not able to identify and implement initiatives that control or reduce costs and increase operating efficiency, or if the cost savings initiatives we have implemented to date do not generate expected cost savings, our financial results could be adversely affected. Our efforts to control or reduce costs may include restructuring activities involving workforce reductions, facility consolidations and other cost reduction initiatives. If we do not successfully manage our current restructuring activities, or any other restructuring activities that we may undertake in the future, expected efficiencies and benefits may be delayed or not realized, and our operations and business could be disrupted, which could have an adverse effect on our results of operations, financial condition and cash flows.
We are subject to risks surrounding our information technology systems and industrial controls systems failures, and the use of emerging technologies, including artificial intelligence, as well as, network disruptions, breaches in data security and compliance with data privacy laws or regulations.
We are highly dependent on various software and information technology systems to record and process operational, human resources and financial transactions. The proper functioning of Hubbell’s information technology systems is critical to the successful operation of our business. Our information technology systems are susceptible to cyber threats, malware, phishing attacks, break-ins and similar events, breaches of physical security or tampering and manipulation of these systems by employees or unauthorized third parties. Information security risks also exist with respect to the use of portable electronic devices, such as smartphones and laptops, which are particularly vulnerable to loss and theft. Hubbell may also be subject to disruptions of any of our systems and our vendor’s systems arising from events that are wholly or partially beyond our control, such as natural disasters, acts of terrorism, cyber-attacks, computer viruses, and electrical/telecommunications outages or failures. All of these risks are also applicable where Hubbell relies on outside vendors to provide services, which may operate in an online, or “cloud,” environment. A failure of our information technology systems could adversely affect our ability to process orders, maintain proper levels of inventory, collect accounts receivable and pay expenses; all of which could have an adverse effect on our results of operations, financial condition and cash flows. In addition, security breaches could result in unauthorized disclosure of confidential information that may result in financial or reputational damage to the Company, as well as expose the Company to litigation and regulatory enforcement actions.
Hubbell also provides customers with industrial controls systems, or solutions that include software components that allow for the control and/or the communication of data from those solutions to Hubbell or customer systems. In addition to the risks noted above, there are other risks associated with these solutions. For example, control and/or data from these solutions may be integral to a customer’s operations. A failure of our technology to operate as designed or as a result of cyber threats could impact those operations, including by loss or destruction of data. Likewise, a customer’s failure to properly configure its own network is outside of the Company’s control and could result in a failure in functionality or security of our technology.
In addition, Hubbell is increasingly evaluating, developing, or utilizing artificial intelligence (“AI”), including machine learning, automation, and data‑driven analytics technologies, whether internally, embedded in third‑party software products, or integrated into customer‑facing solutions. The use of AI technologies introduces additional risks related to system reliability, data integrity, transparency, governance, and security. AI‑enabled systems may also increase the Company’s exposure to cybersecurity, data privacy, and intellectual property risks.
Hubbell is also subject to an increasing number of evolving data privacy and security laws and regulations that impose requirements on the Company and our technology prior to certain use or transfer, storing, processing, disclosure, and protection of data and prior to sale or use of certain technologies. Failure to comply with such laws and regulations could result in the imposition of fines, penalties and other costs. For example, the European Union’s General Data Protection Regulation, the European Union’s pending ePrivacy Regulation and the implementation of the ePrivacy Directive by the various European Union member states, and California’s Consumer Privacy Act of 2018 and Connected Device Privacy Act of 2018, as well as data privacy statutes implemented by other states, could all disrupt our ability to sell products and solutions or use and transfer data because such activities may not be in compliance with applicable law in certain jurisdictions.
We have continued to work on improving our utilization of our enterprise resource planning system, expanding standardization of business processes and performing implementations at our remaining businesses, as well as acquired businesses. We expect to incur additional costs related to future implementations, process reengineering efforts as well as enhancements and upgrades to the system. These system modifications and implementations could result in operating inefficiencies which could adversely impact our operating results and/or our ability to perform necessary business transactions.
12
HUBBELL INCORPORATED - Form 10-K
System failures, ineffective system implementation or disruptions, failure to comply with data privacy and security laws or regulations, IT system risk arising from the Company’s acquisition activity or the compromise of security with respect to internal or external systems or portable electronic devices could damage the Company’s systems or infrastructure, subject us to liability claims, or regulatory fines, penalties, or intervention, harm our reputation, interrupt our operations, disrupt customer operations, and adversely affect the Company’s internal control over financial reporting, business, financial condition, results of operations, or cash flows.
Our ability to access capital markets or failure to maintain our credit ratings may adversely affect our business.
Our ability to invest in our business and make strategic acquisitions may require access to the capital markets. If general economic and capital market conditions deteriorate significantly, it could impact our ability to access capital. Failure to maintain our credit ratings could also impact our ability to access credit markets and could increase our cost of borrowing. The capital and credit markets could deteriorate and market conditions could make it more difficult for us to access capital to finance our investments and acquisitions, which could adversely affect our results of operations, financial condition and cash flows.
Deterioration in the credit quality of, loss of, significant decline in business with, or pricing pressure from, our customers could have a material adverse effect on our operating results and financial condition.
We have an extensive customer base of distributors, wholesalers, electric utilities, OEMs, electrical contractors, telecommunications companies and retail and hardware outlets. We are not dependent on a single customer, however, our top ten customers account for approximately 42% of our Net sales. Deterioration in the credit quality of, loss of, significant decline in business with, or pricing pressure from, one or more of our major customers could adversely affect our results of operations, financial condition and cash flows.
We have outstanding indebtedness; our indebtedness may increase as we engage in acquisitions and other activities to support our growth strategies.
An increase in indebtedness and related debt service obligations could have negative consequences, including (i) requiring us to dedicate significant cash flow from operations to the payment of principal and interest on our indebtedness, which would reduce the funds we have available for other purposes, (ii) reducing our flexibility in planning for or reacting to changes in our business and market conditions and (iii) exposing us to interest rate risk since a portion of our debt obligations are at variable rates. These risks could increase if we are required to re-finance existing indebtedness at higher rates of interest.
We may incur significantly more indebtedness in the future. If we add new indebtedness and do not retire existing indebtedness, the risks described above could increase.
If the underlying investments of our defined benefit plans do not perform as expected, we may have to make additional contributions to these plans.
We sponsor certain pension and other postretirement defined benefit plans. The performance of the financial markets and interest rates impact these plan expenses and funding obligations. Significant changes in market interest rates, investment losses on plan assets and reductions in discount rates may increase our funding obligations and could adversely impact our results of operations, cash flows, and financial condition. Furthermore, there can be no assurance that the value of the defined benefit plan assets will be sufficient to meet future funding requirements.
Legal, Tax and Regulatory Risks
Evolving international tax frameworks may adversely affect our global tax position.
Governments worldwide and the Organisation for Economic Co-operation and Development (“OECD”) continue to advance extensive changes to the taxation of multinational enterprises, including global minimum tax rules under the OECD's Pillar Two initiative to address perceived tax abuse and inconsistencies between tax jurisdictions. As a result, countries in which we operate areat various stages of adopting and interpreting these rules, creating, uncertainty, in the application of new requirements. As jurisdictions implement these measures potentially with retroactive effect our effective tax rate, cash taxes, and financial results could be materially impacted.
Given the interpretive and evolving nature of tax laws, actual tax payments may differ from those currently recorded.
We are subject to income taxes as well as non-income based taxes, in both the United States and numerous foreign jurisdictions. The determination of the Company’s worldwide provision for income taxes and other tax liabilities requires judgment and is based on diverse legislative and regulatory structures that exist in the various jurisdictions where the Company operates. The U.S. Congress and the Treasury Department regularly consider modifications to corporate taxation, including adjustments to tax rates, deductive limitations, cross-border tax provisions, and administrative guidance. The nature and outcome of potential changes are uncertain. Although management believes its estimates are reasonable, the ultimate tax outcome may differ from the amounts recorded in the Company’s financial statements and may materially impact the Company’s financial results for the period when such determination is made. Tax authorities in many jurisdictions continue to intensify enforcement efforts and adopt new rules intended to counter perceived tax avoidance practices by multinational companies. These responses may include changes to transfer‑pricing standards, withholding tax rules, and anti‑base‑erosion measures. Resulting disputes, assessments, or requirements to revise our global tax arrangements could increase our tax obligations or compliance costs. While we estimate tax provisions based on our assessment of ongoing audits, actual outcomes may differ and could adversely impact our results, financial condition, or cash flows.
HUBBELL INCORPORATED- Form 10-K
13
Changes in U.S. and international trade policies may adversely impact our business and operating results; changes in U.S. trade policies could have a material adverse effect on us.
We cannot predict what changes to trade policy will be made, or the economic impact that changes to trade policy will have, including significant increases in tariffs on goods imported into the United States, particularly tariffs on products manufactured in Canada, Mexico, China, and in Europe and the length of time such tariffs may remain in place, or whether the entry into new bilateral or multilateral trade agreements will occur. The imposition of new tariffs, changes in trade policy or agreements or regulations, or the escalation of trade tensions between the United States and other countries or regions could adversely impact our business, financial condition and results of operations.
In prior years, the U.S. government has announced and, in some cases, implemented new approaches to trade policy, including renegotiating, or potentially terminating, certain existing bilateral or multi-lateral trade agreements, such as the North American Free Trade Agreement (“NAFTA”), which was replaced by the U.S.-Mexico-Canada Agreement on July 1, 2020, and is currently up for review in 2026, as well as implementing the imposition of additional tariffs on certain foreign goods, including finished products and raw materials such as steel and aluminum. Additionally, in 2025, the U.S. announced a series of significant new tariffs to be imposed on goods from a broad set of countries, including, but not limited to, Canada, China, Mexico, European Union member states and various other countries around the world. The U.S. also announced new tariffs on foreign steel and aluminum, which took effect in March 2025. Moreover, delays or other exceptions to the implementation of these new tariffs has increased, and may continue to increase uncertainty and impose obstacles to developing plans to mitigate the adverse effects of these trade actions. These and other changes in U.S. trade policy, and U.S. social, political, regulatory and economic conditions or in laws and policies governing foreign trade, manufacturing, development and investment in the territories and countries where we currently manufacture and sell products, and any resulting negative sentiments towards the United States as a result of such changes, could have an adverse effect on our business, financial condition and results of operations.
We utilize materials (such as steel, aluminum and copper), components and finished goods that are sourced from or manufactured in foreign countries, including Canada, China, Mexico and countries in Europe. Import tariffs and potential additional import tariffs have resulted or may result in increased prices for these imported goods and materials and, in some cases, may result or have resulted in price increases for domestically sourced goods and materials. Changes in U.S. trade policy have resulted in trade policy responses from other countries (and may result in additional ones in the future), including the adoption of reciprocal trade policies that could make it more difficult or costly for us to export our products or import goods and materials from those countries. These measures could also result in increased costs for goods imported into the U.S. or may lead to disruptions in the supply of goods and materials that could cause us to adjust our worldwide supply chain. This could require us to increase prices to our customers which may reduce demand, or, if we are unable to increase prices, result in lowering our margin on products sold.
Various countries, and regions, including, without limitation, Canada, China, Mexico, and Europe, have announced plans or intentions to impose or have imposed reciprocal tariffs on a wide range of U.S. products in retaliation for the recent U.S. tariffs. These actions could, in turn, result in additional tariffs being adopted by the U.S. These conditions and future actions could have a significant adverse effect on world trade and the world economy. To the extent that trade tariffs and other restrictions imposed by the United States increase the price of, or limit the amount of, raw materials and finished goods imported into the United States, the costs of our raw materials may be adversely affected and the demand from our customers for products and services may be diminished, which could adversely affect our revenues and profitability. Accordingly, the recent trade actions by the U.S. and the widespread uncertainty and international tensions resulting therefrom, including, without limitation, the effect on the value of the U.S. dollar relative to other currencies, may adversely affect demand for our products, disrupt our supply chains, increase manufacturing costs and adversely affect our revenues, costs of sales and production volumes, any of which could materially and adversely harm our business, financial condition and results of operations.
We cannot predict future trade policy or the terms of any renegotiated trade agreements and their impact on our business. The adoption and expansion of trade restrictions, the occurrence of a trade war, or other governmental action related to new tariffs or trade agreements or policies has the potential to adversely impact demand for our products, our costs, our customers, our suppliers, and the U.S. economy, which in turn could adversely impact our business, financial condition and results of operations.
14
HUBBELL INCORPORATED - Form 10-K
Our business and results of operations may be materially adversely affected by compliance with import and export laws.
We must comply with various laws and regulations relating to the import and export of products, services and technology from the U.S. and other countries having jurisdiction over our operations, which may affect our transactions with certain customers, business partners and other persons. In certain circumstances, export control and economic sanctions regulations may prohibit the export of certain products, services and technologies and in other circumstances, we may be required to obtain an export license before exporting a controlled item. The length of time required by the licensing processes can vary, potentially delaying the shipment of products or performance of services and the recognition of the corresponding revenue. In addition, failure to comply with any of these regulations could result in civil and criminal, monetary and non-monetary penalties, disruptions to our business, limitations on our ability to import and export products and services and damage to our reputation. Moreover, any changes in export control or sanctions regulations may further restrict the export of our products or services, and the possibility of such changes requires constant monitoring to ensure we remain compliant. Any restrictions on the export of our products or product lines could have a material adverse effect on our competitive position, results of operations, cash flows or financial condition.
We could incur significant and/or unexpected costs in our efforts to successfully avoid, manage, defend and litigate intellectual property matters.
The Company relies on certain patents, trademarks, copyrights, trade secrets and other intellectual property of which the Company cannot be certain that others have not and will not infringe upon. Intellectual property litigation could be costly and time consuming and the Company could incur significant legal expenses pursuing these claims against others.
From time to time, we receive notices from third parties alleging intellectual property infringement. Any dispute or litigation involving intellectual property could be costly and time-consuming due to the complexity and the uncertainty of intellectual property litigation. Our intellectual property portfolio may not be useful in asserting a counterclaim, or negotiating a license, in response to a claim of infringement or misappropriation. In addition, as a result of such claims, the Company may lose its rights to utilize critical technology or may be required to pay substantial damages or license fees with respect to the infringed rights or be required to redesign our products at a substantial cost, any of which could negatively impact our operating results. Even if we successfully defend against claims of infringement, we may incur significant costs that could adversely affect our results of operations, financial condition and cash flows. See Item 3 “Legal Proceedings” for a discussion of our legal proceedings.
We are subject to litigation and environmental regulations that may adversely impact our operating results.
We are a party to a number of legal proceedings and claims, including those involving product liability, intellectual property and environmental matters, which could be significant. It is not possible to predict with certainty the outcome of every claim and lawsuit. In the future, we could incur judgments or enter into settlements of lawsuits and claims that could have a materially adverse effect on our results of operations, cash flows, and financial condition. In addition, we maintain insurance coverage with respect to certain claims, which insurance may not provide adequate coverage against such claims. We establish reserves based on our assessment of contingencies, including contingencies related to legal claims asserted against us. Subsequent developments in legal proceedings may affect our assessment and estimates of the loss contingency recorded as a reserve and require us to make additional payments, which could have a materially adverse effect on our results of operations, financial condition and cash flow.
We are also subject to various laws and regulations relating to environmental protection and the discharge of materials into the environment, and we could incur substantial costs as a result of the noncompliance with or liability for clean up or other costs or damages under environmental laws. In addition, we could be affected by future laws or regulations, including those imposed in response to climate change concerns. Environmental laws and regulations have generally become stricter in recent years. Compliance with any future laws and regulations could result in a materially adverse effect on our business and financial results. See Item 3 “Legal Proceedings” for a discussion of our legal proceedings.
Our reputation and our ability to conduct business may be impaired by improper conduct by any of our employees, agents or business partners.
We cannot provide absolute assurance that our internal controls and compliance systems will always protect us from acts committed by our employees, agents or business partners that would violate U.S. and/or non-U.S. laws, including the laws governing payments to government officials, bribery, fraud, anti-kickback and false claims rules, competition, export and import compliance, money laundering and data privacy. In particular, the U.S. Foreign Corrupt Practices Act, the U.K. Bribery Act, and similar anti-bribery laws in other jurisdictions generally prohibit companies and their intermediaries from making improper payments to government officials for the purpose of obtaining or retaining business, and we operate in parts of the world that have experienced governmental corruption to some degree. Despite meaningful measures that we undertake to facilitate lawful conduct, which include training and internal control policies, these measures may not always prevent reckless or criminal acts by our employees or agents. Any such improper actions could damage our reputation and subject us to civil or criminal investigation in the United States and in other jurisdictions, could lead to substantial civil and criminal, monetary and non-monetary penalties and could cause us to incur significant legal and investigative fees.
HUBBELL INCORPORATED- Form 10-K
15
Regulations related to conflict-free minerals may cause us to incur additional expenses and may create challenges with our customers.
The Dodd-Frank Wall Street Reform and Consumer Protection Act contains provisions to improve transparency and accountability regarding the use of “conflict” minerals mined from the Democratic Republic of Congo and adjoining countries (“DRC”). The SEC has established annual disclosure and reporting requirements for those companies who use “conflict” minerals sourced from the DRC in their products. These requirements could limit the pool of suppliers who can provide conflict-free minerals and as a result, we cannot ensure that we will be able to obtain these conflict-free minerals at competitive prices. Compliance with these requirements may also increase our costs. In addition, we may face challenges with our customers if we are unable to sufficiently verify the origins of the minerals used in our products.
General Risk Factors
Our success depends on attracting and retaining qualified personnel.
Our ability to sustain and grow our business requires us to hire, retain and develop a highly skilled and diverse management team and workforce. Failure to ensure that we have the depth and breadth of personnel with the necessary skill set and experience, or the loss of key employees, could impede our ability to deliver our growth objectives and execute our strategy.
We face the potential harms of natural disasters, terrorism, acts of war, international conflicts or other disruptions to our operations.
Natural disasters, the economic uncertainty resulting from the spread of global pandemics, acts or threats of war or terrorism, international conflicts, and the actions taken by the United States and other governments in response to such events have in the past, and could in the future cause damage to or disrupt our business operations, our suppliers or our customers, and could create political or economic instability, any of which could have an adverse effect on our business. For example, increases in energy demand and supply disruptions caused by the conflict in Ukraine have resulted in significantly higher energy prices, particularly in Europe. Additionally, the conflict in the Middle East has added to the volatility in energy costs. Persistent high energy prices and the potential for further supply disruptions, may have an adverse impact on our business. Although it is not possible to predict such events or their consequences, these events could decrease demand for our products, make it difficult or impossible for us to deliver products, or disrupt our supply chain.
Global economic uncertainty could adversely affect us.
During periods of prolonged slow growth, or a downturn in conditions in the worldwide or domestic economies, we could experience reduced orders, payment delays, supply chain disruptions or other factors caused by economic challenges faced by our customers, prospective customers and suppliers. Depending upon their severity and duration, these conditions could have an adverse impact on our results of operations, financial condition and cash flows.
16
HUBBELL INCORPORATED - Form 10-K
ITEM 1B Unresolved Staff Comments
None.
ITEM 1C Cybersecurity
Risk Management and Strategy
Hubbell recognizes the importance of maintaining cybersecurity measures to safeguard our information systems and protect the confidentiality, integrity, and availability of our data, networks and technology assets. Cybersecurity related risks are included in the risk universe that our enterprise risk management program evaluates to assess top risks to the enterprise on an annual basis. To the extent the enterprise risk management process identifies a heightened cybersecurity-related risk, risk owners are assigned to develop mitigation plans, which are then tracked to completion. Cybersecurity related risks are also considered as part of our business continuity and resiliency planning. Business continuity plans establish risk management processes and procedures to mitigate interruptions to business activities, including from cybersecurity incidents.
Given the complexity and evolving nature of the cybersecurity threat landscape, Hubbell has a dedicated team of internal and external cybersecurity professionals, led by Hubbell’s Chief Information Security Officer (“CISO”), that regularly monitor alerts and meet to discuss threat levels, trends, and remediation. We engage a range of external experts, including cybersecurity assessors, consultants, and auditors in evaluating and testing our cybersecurity program. The engagement of third parties includes regular audits, threat assessments, and information system penetration tests. We also actively engage with key vendors, industry participants, legal counsel, and intelligence and law enforcement communities as part of our continuing efforts to evaluate and enhance the effectiveness of our cybersecurity policies and procedures. Hubbell further recognizes risks associated with the use of third-party service providers and has processes to identify material risks related to third parties. We conduct security assessments of third-party providers prior to their engagement and perform ongoing monitoring to ensure compliance with our cybersecurity standards. Our monitoring includes periodic assessments by the CISO and a team of cybersecurity professionals. Our cybersecurity risk management program is aligned to the National Institute of Standards and Technology Cyber Security Framework (NIST CSF).
We have not encountered any risks from cybersecurity threats, including as a result of any previous cybersecurity incidents, that have materially affected or are reasonably likely to affect our business strategy, results of operations or financial condition. Notwithstanding the extensive approach we take to cybersecurity, we may not be successful in preventing or mitigating a cybersecurity incident that could have a material adverse effect on us. See Item IA. Risk Factors for potential risks related to our information technology systems that we are subject to and that may materially adversely affect our business (“We are subject to risks surrounding our information technology systems and industrial controls systems failures, and the use of emerging technologies, including artificial intelligence, as well as, network disruptions, breaches in data security and compliance with data privacy laws or regulations.”).
Governance
Hubbell’s Board of Directors (the “Board”) recognizes the critical nature of managing risks associated with cybersecurity threats. The Audit Committee of the Board has been delegated oversight of risks associated with cybersecurity threats and has developed mechanisms to ensure effective oversight in managing such cybersecurity risks. The Audit Committee is composed of Board members with diverse expertise, including cybersecurity and technology, financial, and risk management experience.
HUBBELL INCORPORATED- Form 10-K
17
Hubbell’s cybersecurity program is managed by a dedicated CISO who has over a decade of information technology and program management experience. The CISO is responsible for leading our enterprise-wide cybersecurity program and assessing, monitoring, and managing our cybersecurity risks. These responsibilities include overseeing cybersecurity governance programs, testing our compliance with standards, remediating known risks, completing cybersecurity risk management activities related to acquisition due diligence and integration, and leading our employee cybersecurity training program. The CISO stays current with the latest developments in cybersecurity and the evolving threat landscape to inform cybersecurity prevention, detection, mitigation, and remediation efforts. The CISO implements and oversees processes for the regular monitoring of our information systems. This includes processes to identify potential vulnerabilities. In the event of a cybersecurity incident, the CISO is equipped with a detailed incident response plan which outlines the steps to be followed from incident detection to mitigation, notifications, and recovery. Notifications include functional areas (including legal), senior management and the Board, as applicable. We have adopted and enforce various enterprise-wide policies relating to cybersecurity, to ensure the ongoing protection of our systems, including policies to identify, classify, and protect company data, manage vulnerabilities, and perform user access reviews. We further conduct drills of our incident response plan to prepare incident response teams and provide cybersecurity training and phishing simulations throughout the year via our enterprise learning management systems.
The CISO provides regular (but not less than quarterly) updates to the Audit Committee. These updates include a broad range of topics, including the current cybersecurity and emerging threat landscape, the status of ongoing cybersecurity initiatives and strategies, incident reports, and the results of internal and external assessments of our information systems. The CISO, in his capacity, regularly informs our Chairman, President and Chief Executive Officer; SVP, Chief Financial Officer; and SVP, General Counsel and Secretary on aspects related to cybersecurity risks and incidents. This ensures that the highest levels of management, including the Company’s Disclosure Committee, are made aware of Hubbell’s cybersecurity posture and potential cybersecurity risks. Furthermore, any material cybersecurity matters, and strategic cybersecurity risk management matters are promptly escalated to the Audit Committee of the Board.
ITEM 2 Properties
As of December 31, 2025, Hubbell’s global headquarters are located in leased office space in Shelton, Connecticut. The Utility Solutions segment operates 2 warehouse facilities and 35 manufacturing facilities globally, totaling approximately 5.7 million square feet. The Electrical Solutions segment operates 7 warehouse facilities and 22 manufacturing facilities globally, totaling approximately 4.1 million square feet. The Company believes its manufacturing and warehousing facilities are adequate to carry on its business activities.
ITEM 5 Market for the Registrant’s Common Equity, Related Stockholder Matters and Issuer Purchases of Equity Securities
The Company’s common stock trades on the New York Stock Exchange under the symbol, “HUBB”.
The number of common shareholders of record on January 31, 2026 was 970.
Our dividends are declared at the discretion of our Board of Directors. In October 2025, the Company’s Board of Directors approved an increase in the common stock dividend rate from $1.32 to $1.42 per share per quarter. The increased quarterly dividend payment commenced with the December 15, 2025 payment made to the shareholders of record on November 28, 2025.
The information required by Item 5 with respect to securities authorized for issuance under equity compensation plans is incorporated herein by reference to Part III, Item 12 of this Form 10-K.
Issuer Purchases of Equity Securities
On October 21, 2022, we announced that the Board of Directors had approved a share repurchase program that authorized the repurchase of up to $300 million of common stock, which expired on October 21, 2025. On February 12, 2025 the Board of Directors approved a share repurchase program that authorized the repurchase of up to $500 million of common stock and expires in February 2028. We had a total outstanding share repurchase authorization of approximately $500.0 million at December 31, 2025. Subject to numerous factors, including market conditions and alternative uses of cash, we may conduct discretionary repurchases through open market or privately negotiated transactions, which may include repurchases under plans complying with Rules 10b5-1 and 10b-18 under the Securities Exchange Act of 1934, as amended.
There were no share repurchases during the quarter ended December 31, 2025.
HUBBELL INCORPORATED- Form 10-K
19
Corporate Performance Graph
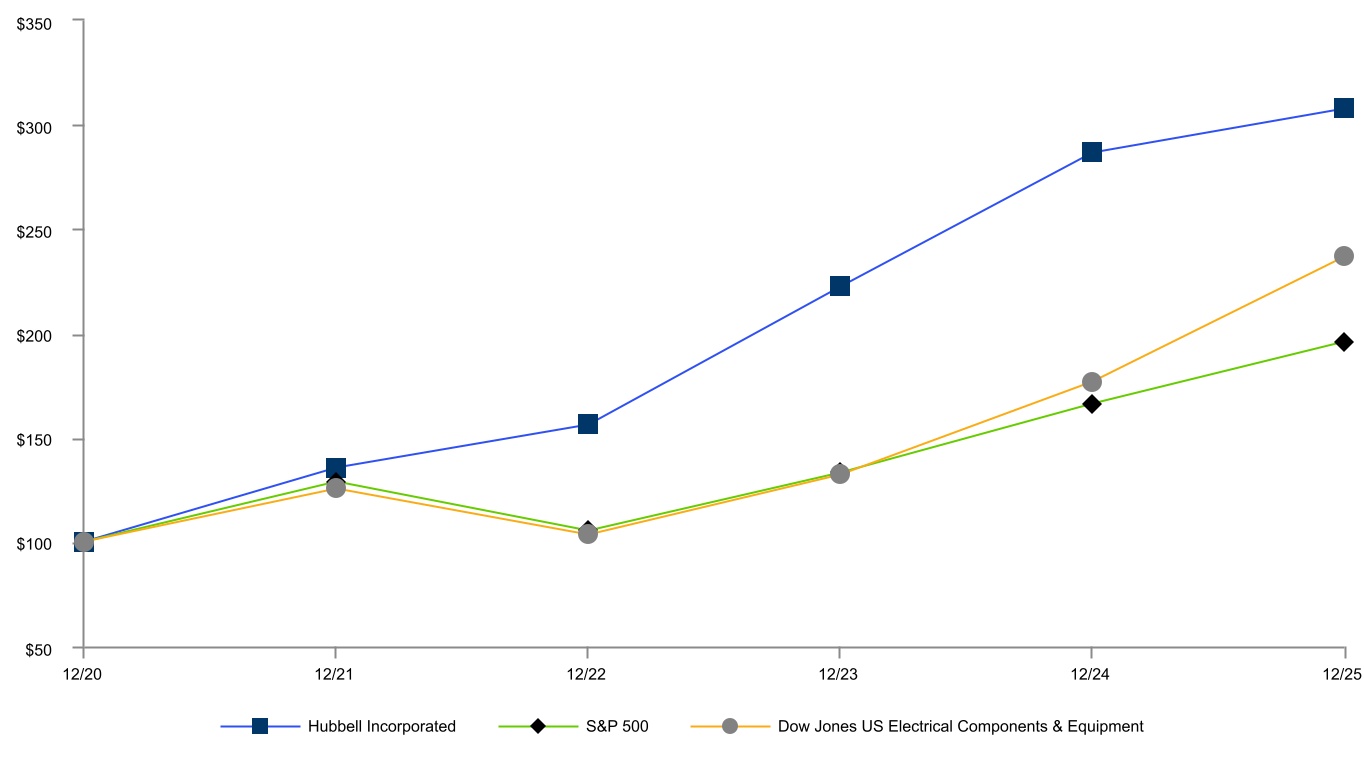
The following graph compares the total return to shareholders on the Company’s common stock during the five years ended December 31, 2025, with a cumulative total return on the (i) the S&P 500 index and (ii) the Dow Jones U.S. Electrical Components & Equipment Index (“DJUSEC”). The Company is a member of the S&P 500. The comparison assumes $100 was invested on December 31, 2020 in the Company’s common stock and in each of the foregoing indices and assumes reinvestment of dividends.
COMPARISON OF 5 YEAR CUMULATIVE TOTAL RETURN
Among Hubbell Incorporated, the S&P 500 Index and
the Dow Jones US Electrical Components & Equipment Index
12/20
12/21
12/22
12/23
12/24
12/25
Hubbell, Incorporated
100.00
135.59
155.99
222.14
286.40
307.70
S&P 500
100.00
128.71
105.40
133.10
166.40
196.16
Dow Jones US Electrical Components & Equipment
100.00
125.35
103.42
132.15
176.57
236.57
20
HUBBELL INCORPORATED - Form 10-K
ITEM 6 [Reserved]
HUBBELL INCORPORATED- Form 10-K
21
ITEM 7 Management’s Discussion and Analysis of Financial Condition and Results of Operations
The following discussion should be read in conjunction with the consolidated financial statements and accompanying notes included in Part II, Item 8 of this Annual Report on Form 10-K. This section of this Form 10-K generally discusses 2025, 2024 and 2023 items and year-to-year comparisons between 2025 and 2024 and between 2024 and 2023.
Executive Overview of the Business
Hubbell is a global manufacturer of quality electrical products and utility solutions for a broad range of customer and end market applications. We provide utility and electrical solutions that enable our customers to operate critical infrastructure reliably and efficiently, and we empower and energize communities through innovative solutions supporting energy infrastructure In Front of the Meter, on The Edge, and Behind the Meter. In Front of the Meter is where utilities transmit and distribute energy to their customers. The Edge connects utilities with owner/operators and allows energy and data to be distributed back and forth. Behind the Meter is where owners and operators of buildings, and other critical infrastructure consume energy. Products are either sourced complete, manufactured or assembled by subsidiaries in the United States, Canada, Puerto Rico, Mexico, China, the UK, Brazil, Australia, Spain, Ireland, and the Republic of the Philippines. The Company also participates in joint ventures in Hong Kong and the Republic of the Philippines, and maintains offices in Singapore, Italy, China, India, Mexico, South Korea, Chile, and countries in the Middle East. The Company employed approximately 18,000 individuals worldwide as of December 31, 2025.
The Company’s reporting segments consist of the Utility Solutions segment and Electrical Solutions segment. The Company’s long-term strategy is to: serve its customers with reliable and innovative electrical and related infrastructure solutions with desired brands and high-quality service, delivered through a competitive cost structure; to complement organic revenue growth with acquisitions that enhance its product offerings; and to allocate capital effectively to create shareholder value.
Our strategy to complement organic revenue growth with acquisitions is focused on acquiring assets that extend our capabilities, expand our product offerings, and present opportunities to compete in core, adjacent or complementary markets. In 2025 we invested $958 million in acquisitions that meet these objectives. Refer to Note 3 - Business Acquisitions and Dispositions in the Notes to Consolidated Financial Statements for further details on these acquisitions.
Our strategy to deliver products through a competitive cost structure has resulted in an ongoing program of restructuring and related activities. Our restructuring and related efforts include the consolidation of manufacturing and distribution facilities, and workforce actions, as well as streamlining and consolidating our back-office functions. The primary objectives of our restructuring and related activities are to optimize our manufacturing footprint, cost structure and effectiveness and the efficiency of our workforce.
Our goal is to have pricing and productivity programs that offset the impact of cost increases as well as pay for investments in key growth areas. Our cost structure may be subject to material and production cost increases from inflationary periods within the U.S. and global economies, and from trade and other tensions. In particular, we have been subject to recent periods of inflationary pressure in the global economy and also subject to cost increases as a result of tariff and other material cost increases from trade actions by the U.S. and other countries. Because material costs are approximately half of our cost of goods sold, volatility in this area can significantly impact profitability. Our pricing and productivity programs are intended to mitigate the risk to our operating margins related to these inflationary pressures and cost increases as a result of tariffs. Refer to our risk factor; Changes in U.S. and international trade policies may adversely impact our business and operating results; changes in U.S. trade policies could have a material adverse effect on us for additional information.
Our sales are subject to market conditions that may cause customer demand for our products to be volatile. Product demand can be affected by fluctuations in domestic and international economic conditions, as well as currency fluctuations, commodity costs, and a variety of other factors. Accordingly, there can be no assurance that we will be able to maintain our margins in response to further changes in inflationary pressures.
22
HUBBELL INCORPORATED - Form 10-K
Results of Operations
Our operations are classified into two reportable segments: Utility Solutions and Electrical Solutions. For a complete description of the Company’s segments, see Part I, Item 1 of this Annual Report on Form 10-K. Within these segments, Hubbell serves customers in end markets that include utility transmission, substation and distribution markets, data center and industrial markets, as well as markets for utility meters and grid protection and controls, non-residential, telecom and gas distribution products.
In the second quarter of 2025, the Company elected to change its method of accounting for certain inventories in the United States from the last-in, first out (LIFO) method to the first-in, first out (FIFO) method. The change to the FIFO method of accounting for these inventories is preferable because it provides better matching of costs and revenues, conforms the Company's inventory to a single method of accounting and improves comparability with the Company's peers. To provide historical information on a basis consistent with the change to FIFO, the Company has recast certain historical financial information to conform to the updated method of inventory accounting. The recast financial information does not represent a restatement of previously issued financial statements. Refer to Note 1 – Significant Accounting Policies within the Notes to Consolidated Financial Statements for additional information.
Unless specified otherwise, all comparisons of 2025 results are with 2024 results, and all comparisons of 2024 results are with 2023 results.
In 2025, Net sales increased by 3.8% or $216 million and organic Net sales(1) increased by $186 million on favorable price realization and higher unit volumes, as further discussed in segment results below. Operating margin increased in 2025, by 130 basis points and adjusted operating margin(1) increased by 80 basis points, driven by favorable price realization and improved operational productivity. Those increases were partially offset by material and other cost inflation, including tariff expense. Net income attributable to Hubbell increased by 13.9% in 2025 compared to the prior year and diluted earnings per share increased by 14.9%. Adjusted net income attributable to Hubbell(1) increased by 8.8% in 2025 compared to the prior year and adjusted diluted earnings per share(1) increased by 9.8% in 2025.
Operating cash flow increased in 2025 to $1,029.8 million. as compared to $991.2 million in the prior year and free cash flow(2) increased in 2025 to $874.7 million as compared to $810.8 million in the prior year. In 2025 we paid $286.6 million in shareholder dividends, an increase of 7.2% as compared to the prior year. In 2025 we also invested $958.3 million in acquisitions within high growth markets, made $155.1 million of capital expenditures supporting footprint optimization, automation and productivity initiatives, and repurchased $225.0 million of shares.
(1) Organic Net sales, adjusted operating margin, adjusted net income attributable to Hubbell and adjusted diluted earnings per share are non-GAAP financial measures. See “Adjusted Operating Measures” below for a reconciliation to the comparable GAAP financial measures.
(2) Free cash flow is a non-GAAP financial measure. See “Adjusted Operating Measures” and “Financial Condition, Liquidity and Capital Resources - Cash Flow” below for a reconciliation to the comparable GAAP financial measure.
SUMMARY OF CONSOLIDATED RESULTS (IN MILLIONS, EXCEPT PER SHARE DATA)
For the Year Ending December 31,
2025
% of Net sales
2024
% of Net sales
2023
% of Net sales
Net sales
$
5,844.6
$
5,628.5
$
5,372.9
Cost of goods sold
3,780.5
64.7
%
3,722.9
66.1
%
3,495.9
65.1
%
Gross profit
2,064.1
35.3
%
1,905.6
33.9
%
1,877.0
34.9
%
Selling & administrative expenses
855.3
14.6
%
812.5
14.5
%
849.6
15.8
%
Operating income
1,208.8
20.7
%
1,093.1
19.4
%
1,027.4
19.1
%
Net income
891.9
15.3
%
784.7
13.9
%
757.6
14.1
%
Less: Net income attributable to noncontrolling interest
(4.8)
(0.1)
%
(5.7)
(0.1)
%
(6.2)
(0.1)
%
Net income attributable to Hubbell Incorporated
887.1
15.2
%
779.0
13.8
%
751.4
14.0
%
Less: Earnings allocated to participating securities
(1.5)
(1.5)
(1.8)
Net income available to common shareholders
$
885.6
$
777.5
$
749.6
Average number of diluted shares outstanding
53.5
54.0
54.0
DILUTED EARNINGS PER SHARE
$
16.54
$
14.39
$
13.89
Adjusted Operating Measures
In the following discussion of results of operations, we refer to “adjusted” operating measures. We believe those adjusted measures, which exclude the impact of certain costs, gains and losses, may provide investors with useful information regarding our underlying performance from period to period and allow investors to understand our results of operations without regard to items that, in management’s judgment, significantly affect the comparability of operating results, or we do not consider a component of our core operating performance.
Significant items impacting comparability comprise the following:
Transaction, integration and separation costs
The effect that acquisitions and divestitures may have on our results can fluctuate significantly based on the timing, size and number of transactions, and therefore result in significant volatility in the costs to complete transactions and to integrate or separate the businesses.
Transaction costs are primarily professional services and other fees incurred to complete the transactions. Integration and separation costs are the internal and external incremental costs directly relating to these activities for the acquired or divested business.
The acquisition and integration of DMC Power resulted in significant transaction and integration costs, and the acquisitions and disposition completed by the Company in the fourth quarter of 2023 resulted in a significant increase in transaction, integration and separation costs. As a result, we believe excluding such costs relating to these transactions provides useful and more comparable information for investors to better assess our operating performance from period to period.
Gains or losses on disposition of a business
The Company believes excluding these gains or losses will enhance management's and investors' ability to analyze underlying business performance and facilitate comparisons of our financial results over multiple periods. In the first quarter of 2024 the Company recognized a $5.3 million pre-tax loss on the disposition of the residential lighting business and also recognized $6.8 million of income tax expense relating to that transaction, primarily driven by differences between book and tax basis in goodwill. In the second quarter of 2025 the Company recognized a $0.4 million pre-tax loss on the disposition of a product line in the Electrical Solutions segment. Those losses and the related income tax expense are excluded from our adjusted operating measures.
Amortization of intangible assets
Adjusted operating measures also exclude non-cash amortization of all intangible assets associated with our business acquisitions, including inventory step-up amortization associated with those acquisitions. The intangible assets associated with our business acquisitions arise from the allocation of the purchase price using the acquisition method of accounting in accordance with Accounting Standards Codification 805, “Business Combinations.” These assets consist primarily of customer relationships, developed technology, trademarks and tradenames, and patents, as reported in Note 6 – Goodwill and Other Intangible Assets, under the heading “Total Definite-Lived Intangibles” within the Notes to Consolidated Financial Statements.
The Company believes that the exclusion of these non-cash expenses (i) enhances management’s and investors’ ability to analyze underlying business performance, (ii) facilitates comparisons of our financial results over multiple periods, and (iii) provides more relevant comparisons of our results with the results of other companies as the amortization expense associated with these assets may fluctuate significantly from period to period based on the timing, size, nature, and number of acquisitions. Although we exclude amortization of these acquired intangible assets and inventory step-up from our non-GAAP results, we believe that it is important for investors to understand that revenue generated, in part, from such intangibles is included within revenue in determining adjusted net income attributable to Hubbell Incorporated.
Adjusted results also exclude the income tax effects of the above adjustments which are calculated using the statutory tax rate, taking into consideration the nature of the item and the relevant taxing jurisdiction, unless otherwise noted.
The Company excludes these non-core items because we believe it enhances management’s and investors’ ability to analyze underlying business performance and facilitates comparisons of our financial results over multiple periods. Refer to the reconciliation of non-GAAP measures presented below and Note 3 – Business Acquisitions and Dispositions to the Consolidated Financial Statements for additional information.
24
HUBBELL INCORPORATED - Form 10-K
Organic net sales (or organic net sales growth), a non-GAAP measure, represents Net sales according to U.S. GAAP, less Net sales from acquisitions and divestitures during the first twelve months of ownership or divestiture, respectively, less the effect of fluctuations in Net sales from foreign currency exchange. The period-over-period effect of fluctuations in Net sales from foreign currency exchange is calculated as the difference between local currency Net sales of the prior period translated at the current period exchange rate as compared to the same local currency Net sales translated at the prior period exchange rate. We believe this measure provides management and investors with a more complete understanding of the underlying operating results and trends of established, ongoing operations by excluding the effect of acquisitions, dispositions and foreign currency as these activities can obscure underlying trends. When comparing Net sales growth between periods, excluding the effects of acquisitions, business dispositions and currency exchange rates, those effects are different when comparing results for different periods. For example, because Net sales from acquisitions are considered inorganic from the date we complete an acquisition through the end of the first year following the acquisition, Net sales from such acquisitions are reflected as organic net sales thereafter.
There are limitations to the use of non-GAAP measures. Non-GAAP measures do not present complete financial results. We compensate for this limitation by providing a reconciliation between our non-GAAP financial measures and the respective most directly comparable financial measure calculated and presented in accordance with GAAP. Because non-GAAP financial measures are not standardized, it may not be possible to compare these financial measures with other companies’ non-GAAP financial measures having the same or similar names. These financial measures should not be considered in isolation from, as substitutes for, or alternative measures of, reported GAAP financial results, and should be viewed in conjunction with the most comparable GAAP financial measures and the provided reconciliations thereto. We believe, however, that these non-GAAP financial measures, when viewed together with our GAAP results and related reconciliations, provide a more complete understanding of our business. We strongly encourage investors to review our consolidated financial statements and publicly filed reports in their entirety and not rely on any single financial measure.
The following table reconciles Adjusted operating income, a non-GAAP measure, to Operating income, the directly comparable GAAP financial measure (in millions):
For the Year Ended December 31,
2025
% of Net sales
2024
% of Net sales
2023
% of Net sales
Operating income (GAAP measure)
$
1,208.8
20.7
%
$
1,093.1
19.4
%
$
1,027.4
19.1
%
Amortization of acquisition-related intangible assets
109.6
1.9
%
127.3
2.3
%
76.8
1.4
%
Transaction, integration & separation costs
7.0
0.1
%
13.8
0.2
%
13.5
0.3
%
Adjusted operating income (non-GAAP measure)
$
1,325.4
22.7
%
$
1,234.2
21.9
%
$
1,117.7
20.8
%
The following table reconciles Adjusted net income attributable to Hubbell Incorporated, Adjusted net income available to common shareholders, and the diluted per share amounts thereof, each a non-GAAP measure, to the directly comparable GAAP financial measures (in millions, except per share data).
For the Year Ended December 31,
2025
Diluted Per Share
2024
Diluted Per Share
2023
Diluted Per Share
Net income attributable to Hubbell Incorporated (GAAP measure)
$
887.1
$
16.54
$
779.0
$
14.39
$
751.4
$
13.89
Amortization of acquisition-related intangible assets
109.6
2.06
127.3
2.37
76.8
1.42
Transaction, integration & separation costs
7.0
0.14
13.8
0.26
13.5
0.25
Loss on disposition of business
0.4
0.01
5.3
0.10
—
—
Subtotal
$
1,004.1
18.75
$
925.4
17.12
$
841.7
15.56
Income tax effects(1)
27.3
0.51
27.4
0.50
20.7
0.36
Adjusted net income attributable to Hubbell Incorporated (non-GAAP measure)
$
976.8
$
18.24
$
898.0
$
16.62
$
821.0
$
15.20
Less: Earnings allocated to participating securities
(1.6)
(0.03)
(1.7)
(0.03)
(1.9)
(0.03)
Adjusted net income available to common shareholders (non-GAAP measure)
$
975.2
$
18.21
$
896.3
$
16.59
$
819.1
$
15.17
(1) The income tax effects are calculated using the statutory tax rate, taking into consideration the nature of the item and the relevant taxing jurisdiction, unless otherwise noted.
HUBBELL INCORPORATED- Form 10-K
25
The following table reconciles our Organic Net sales growth to the directly comparable GAAP financial measure (in millions and percentage change):
For the Year Ended December 31,
2025
Inc/(Dec) %
2024
Inc/(Dec) %
2023
Inc/(Dec) %
Net sales growth (GAAP measure)
$
216.1
3.8
$
255.6
4.7
$
425.0
8.6
Impact of acquisitions
56.4
1.0
421.0
7.8
96.6
1.9
Impact of divestitures
(21.1)
(0.4)
(163.0)
(3.0)
—
—
Foreign currency exchange
(5.0)
(0.1)
(4.4)
(0.1)
3.1
0.1
Organic Net sales growth (non-GAAP measure)
$
185.8
3.3
$
2.0
—
$
325.3
6.6
2025 Compared to 2024
Net Sales
Net sales of $5,844.6 million in 2025 increased by $216.1 million, or 3.8%, compared to 2024. Organic net sales increased by 3.3% driven by a low single digit percentage increase in price realization, and a low single digit percentage increase in unit volumes. Acquisitions net of divestitures contributed 0.6% to net sales growth. These changes are discussed in more detail in the Segment Results section below.
Cost of Goods Sold and Gross Profit
As a percentage of net sales, cost of goods sold decreased by 140 basis points to 64.7% and gross profit margin expanded to 35.3% in 2025. The increase in gross profit margin includes approximately four percentage points of margin expansion driven by favorable price realization, improved operational productivity, and lower acquisition-related intangible amortization expense, which was partially offset by three points of margin contraction due to material and other cost inflation, including tariff expense.
Selling & Administrative Expenses
Selling and administrative expense in 2025 was $855.3 million and increased by $42.8 million compared to the prior year. This increase was driven by higher acquisition-related intangible amortization expense and the selling and administration expense added by our 2025 acquisitions, as well as and higher employee compensation and benefits, partially offset by lower transaction, integration and separation costs as compared to the prior year. Selling and administrative expense as a percentage of Net sales increased by 10 basis points to 14.6% in 2025.
Total Other Expense
Total other expense increased by $3.4 million in 2025 to $89.7 million compared to the prior year. That increase is primarily due TSA income in 2024 related to the disposal of the residential lighting business that did not repeat in 2025, higher non-service pension costs in the current year, and the impact of foreign currency exchange. Those drivers were partially offset by a $9.7 million decrease in net interest expense driven by lower average term loan borrowings outstanding in 2025, along with a $4.9 million net decrease on losses recognized on business dispositions, primarily due to the disposal of the residential lighting business in the first quarter of 2024.
Income Taxes
The effective tax rate decreased to 20.3% in 2025 compared to 22.1% in 2024, primarily due to a larger income tax benefit in 2025 from international restructurings as compared to the prior year, as well as the income tax costs from the sale of our residential lighting business in the first quarter of 2024.
Net Income Attributable to Hubbell Incorporated and Earnings Per Diluted Share
Net income attributable to Hubbell Incorporated was $887.1 million in 2025 and increased 13.9% as compared to 2024. As a result, earnings per diluted share in 2025 increased 14.9% compared to 2024. Adjusted net income attributable to Hubbell Incorporated, which excludes amortization of acquisition-related intangibles, as well as transaction, integration & separation costs, and a loss on disposition of a business, was $976.8 million in 2025 and increased 8.8% as compared to 2024.
26
HUBBELL INCORPORATED - Form 10-K
Segment Results
Utility Solutions
The following table reconciles our Utility Solutions segment adjusted operating income and adjusted operating margin to the directly comparable GAAP financial measure (in millions and percentage):
For the Year Ended December 31,
(in millions)
2025
2024
Net sales
$
3,672.3
$
3,600.7
Operating income (GAAP measure)
$
789.9
$
731.8
Amortization of acquisition-related intangible assets
90.2
111.2
Transaction, integration & separation costs
6.5
6.5
Adjusted operating income
$
886.6
$
849.5
Operating margin (GAAP measure)
21.5
%
20.3
%
Adjusted operating margin
24.1
%
23.6
%
The following table reconciles our Utility Solutions segment Organic Net sales growth to the directly comparable GAAP financial measure (in millions and percentage change):
For the Year Ended December 31,
Utility Solutions
2025
Inc/(Dec) %
2024
Inc/(Dec) %
Net sales growth (GAAP measure)
$
71.6
2.0
$
339.0
10.4
Impact of acquisitions
35.4
1.0
421.0
12.9
Impact of divestitures
—
—
—
—
Foreign currency exchange
(2.9)
(0.1)
(3.7)
(0.1)
Organic Net sales growth (decline) (non-GAAP measure)
$
39.1
1.1
$
(78.3)
(2.4)
Net sales in the Utility Solutions segment in 2025 were approximately $3.7 billion, an increase of 2.0% as compared to 2024. This increase was driven by a 1.1% increase in organic net sales from a low single digit increase in price, partially offset by a low single digit percentage decrease in unit volumes. Acquisitions also added 1.0% to net sales as compared to the prior year. Strong substation, transmission and distribution markets drove volume growth year over year, but that growth was more than offset by a decrease in volume within Grid Automation products from weak advanced metering infrastructure and meter project activity in the year.
Operating income in the Utility Solutions segment in 2025 was $789.9 million an increase of 7.9% compared to 2024. Operating margin increased by 120 basis points to 21.5% in 2025. Excluding amortization of acquisition-related intangibles and transaction, integration & separation costs, the adjusted operating margin increased by 50 basis points to 24.1% as compared to the prior year. The increase in operating margin and adjusted operating margin includes approximately three percentage points of margin expansion from favorable price realization and improved operational productivity. Those factors were partially offset by approximately two percentage points of margin contraction due to material and other cost inflation, including tariff expense.
HUBBELL INCORPORATED- Form 10-K
27
Electrical Solutions
The following table reconciles our Electrical Solutions segment adjusted operating income and adjusted operating margin to the directly comparable GAAP measure (in million and percentage):
For the Year Ended December 31,
(in millions)
2025
2024
Net sales
$
2,172.3
$
2,027.8
Operating income (GAAP measure)
$
418.9
$
361.3
Amortization of acquisition-related intangible assets
19.4
16.1
Transaction, integration & separation costs
0.5
7.3
Adjusted operating income
$
438.8
$
384.7
Operating margin (GAAP measure)
19.3
%
17.8
%
Adjusted operating margin
20.2
%
19.0
%
The following table reconciles our Electrical Solutions segment Organic Net sales growth to the directly comparable GAAP financial measure (in millions and percentage change):
For the Year Ended December 31,
Electrical Solutions
2025
Inc/(Dec) %
2024
Inc/(Dec) %
Net sales growth (decline) (GAAP measure)
$
144.5
7.1
$
(83.4)
(3.9)
Impact of acquisitions
21.0
1.0
—
—
Impact of divestitures
(21.1)
(1.0)
(163.0)
(7.7)
Foreign currency exchange
(2.1)
(0.1)
(0.7)
—
Organic Net sales growth (non-GAAP measure)
$
146.7
7.2
$
80.3
3.8
Net sales of the Electrical Solutions segment in 2025 were approximately $2.2 billion, an increase of $144.5 million, or 7.1% as compared to 2024. The increase includes 7.2% growth in organic net sales, driven by a mid single digit percentage increase in price realization and a low single digit percentage increase in unit volumes. This was partially offset by a 0.1% decline from foreign currency exchange. Volume growth was driven primarily by strength in the datacenter and light industrial markets, partially offset by softness in the non-residential and heavy industrial markets.
Operating income of the Electrical Solutions segment in 2025 was $418.9 million and increased approximately 15.9% compared to 2024, while operating margin in 2025 increased by 150 basis points to 19.3%. Excluding amortization of acquisition-related intangibles and transaction, integration & separation costs, the adjusted operating margin increased by 120 basis points to 20.2% in 2025. The increase in the operating margin and adjusted operating margin in 2025 was primarily due to approximately six percentage points of margin expansion from favorable price realization, improved operational productivity and higher unit volumes. Those factors were partially offset by approximately five percentage points of margin contraction driven by higher material and other cost inflation, including tariff expense and unfavorable business mix.
28
HUBBELL INCORPORATED - Form 10-K
2024 Compared to 2023
Net Sales
Net sales of $5,628.5 million in 2024 increased by $255.6 million, or 4.7%, compared to 2023. Organic net sales were flat driven by a low single digit percentage increase in price realization, partially offset by a low single digit percentage decrease in unit volume. Acquisitions net of divestitures contributed 4.8% to net sales growth. These changes are discussed in more detail in the Segment Results section below.
Cost of Goods Sold and Gross Profit
As a percentage of net sales, cost of goods sold increased by 100 basis points to 66.1% and gross profit margin declined to 33.9% in 2024. The decline in gross profit margin includes approximately four percentage points of margin contraction due to higher intangible amortization expense, material and other cost inflation and lower volume, which was partially offset by approximately three percentage points of margin expansion driven by favorable price realization, productivity and cost management.
Selling & Administrative Expenses
S&A expense in 2024 was $812.5 million and decreased by $37.1 million compared to the prior year. This decrease was driven by lower employee incentive costs and lower professional services in 2024, transaction costs in 2023 that did not repeat in 2024, partially offset by the addition of S&A expense including intangible amortization expense related to our 2023 acquisitions. S&A expense as a percentage of Net sales decreased by 130 basis points to 14.5% in 2024.
Total Other Expense
Total other expense increased by $31.1 million in 2024 to $86.3 million compared to the prior year, primarily due to a $37.1 million increase in net interest expense and a $5.3 million loss recognized on the disposition of the residential lighting business in 2024, partially offset by $7.2 million in 2024 of TSA income related to the disposal of the residential lighting business and lower non service pension cost. The increase in interest expense was primarily attributable to debt incurred in connection with the acquisition of Northern Star Holdings, Inc. ("Systems Control").
Income Taxes
The effective tax rate was 22.1% in both 2024 and 2023 as the income tax expense related to the sale of the residential lighting business in the first quarter of 2024, was largely offset by the tax benefit of an international restructuring completed in the third quarter of the year.
Net Income Attributable to Hubbell Incorporated and Earnings Per Diluted Share
Net income attributable to Hubbell Incorporated was $779.0 million in 2024 and increased 3.7% as compared to 2023. As a result, earnings per diluted share in 2024 increased 3.6% compared to 2023. Adjusted net income attributable to Hubbell Incorporated, which excluded amortization of acquisition-related intangibles and transaction, integration & separation costs in both periods, and a loss on disposition of a business in 2024 was $898.0 million in 2024 and increased 9.4% as compared to 2023.
HUBBELL INCORPORATED- Form 10-K
29
Segment Results
Utility Solutions
The following table reconciles our Utility Solutions segment adjusted operating income and adjusted operating margin to the directly comparable GAAP financial measure (in millions and percentage):
For the Year Ended December 31,
(in millions)
2024
2023
Net sales
$
3,600.7
$
3,261.7
Operating income (GAAP measure)
$
731.8
$
698.4
Amortization of acquisition-related intangible assets
111.2
58.3
Transaction, integration & separation costs
6.5
13.2
Adjusted operating income
$
849.5
$
769.9
Operating margin (GAAP measure)
20.3
%
21.4
%
Adjusted operating margin
23.6
%
23.6
%
The following table reconciles our Utility Solutions segment Organic Net sales growth to the directly comparable GAAP financial measure (in millions and percentage change):
For the Year Ended December 31,
Utility Solutions
2024
Inc/(Dec) %
2023
Inc/(Dec) %
Net sales growth (GAAP measure)
$
339.0
10.4
$
390.6
13.6
Impact of acquisitions
421.0
12.9
52.7
1.8
Impact of divestitures
—
—
—
—
Foreign currency exchange
(3.7)
(0.1)
1.6
0.1
Organic Net sales (decline) growth (non-GAAP measure)
$
(78.3)
(2.4)
$
336.3
11.7
Net sales in the Utility Solutions segment in 2024 were approximately $3.6 billion, an increase of 10.4% as compared to 2023. This increase was driven by a 12.9% increase in net sales from acquisitions, partially offset by a 2.4% decrease in organic net sales driven by a mid single digit percentage decrease in unit volumes partially offset by a low single digit increase in price realization. The decrease in unit volume resulted largely from volume declines in enclosures products primarily driven by prior weakness in the telecom market, as well as customer inventory management in distribution markets. These factors were partially offset by strong growth in transmission and substation markets and in grid automation projects.
Operating income in the Utility Solutions segment in 2024 was $731.8 million an increase of 4.8% compared to 2023. Operating margin declined by 110 basis points to 20.3% in 2024. Excluding amortization of acquisition-related intangibles and transaction, integration & separation costs, the adjusted operating margin was flat as compared to the prior year. The decrease in operating margin includes approximately three percentage points of margin expansion from favorable price realization, improved productivity and cost management, but that expansion was more than offset by approximately four percentage points of margin contraction due to material and other cost inflation, higher acquisition-related intangible amortization and lower unit volume. The impact of lower unit volume includes approximately 130 basis points from enclosures products, driven primarily by prior weakness in the telecom market.
30
HUBBELL INCORPORATED - Form 10-K
Electrical Solutions
The following table reconciles our Electrical Solutions segment adjusted operating income and adjusted operating margin to the directly comparable GAAP measure (in million and percentage):
For the Year Ended December 31,
(in millions)
2024
2023
Net sales
$
2,027.8
$
2,111.2
Operating income (GAAP measure)
$
361.3
$
329.0
Amortization of acquisition-related intangible assets
16.1
18.5
Transaction, integration & separation costs
7.3
0.3
Adjusted operating income
$
384.7
$
347.8
Operating margin (GAAP measure)
17.8
%
15.6
%
Adjusted operating margin
19.0
%
16.5
%
The following table reconciles our Electrical Solutions segment Organic Net sales growth to the directly comparable GAAP financial measure (in millions and percentage change):
For the Year Ended December 31,
Electrical Solutions
2024
Inc/(Dec) %
2023
Inc/(Dec) %
Net sales (decline) growth (GAAP measure)
$
(83.4)
(3.9)
$
34.4
1.7
Impact of acquisitions
—
—
43.9
2.1
Impact of divestitures
(163.0)
(7.7)
—
—
Foreign currency exchange
(0.7)
—
1.5
0.1
Organic Net sales growth (decline) (non-GAAP measure)
$
80.3
3.8
$
(11.0)
(0.5)
Net sales of the Electrical Solutions segment in 2024 were approximately $2.0 billion, a decrease of $83.4 million, or 3.9% as compared to 2023. The decrease includes 3.8% growth in organic net sales, that was more than offset by a 7.7% decline in net sales resulting from the disposition of the residential lighting business during the first quarter of 2024. The increase in organic net sales was driven by a low single digit percentage increase in unit volumes and a low single digit percentage increase in price realization. Volume growth was driven primarily by strength in renewables markets and datacenter balance-of-system products, while industrial markets were solid and non residential markets were soft.
Operating income of the Electrical Solutions segment in 2024 was $361.3 million and increased approximately 9.8% compared to 2023, while operating margin in 2024 increased by 220 basis points to 17.8%. Excluding amortization of acquisition-related intangibles and transaction, integration & separation costs, the adjusted operating margin increased by 250 basis points to 19.0% in 2024. The increase in the operating margin and adjusted operating margin in 2024 was primarily due to approximately five percentage points of margin expansion from favorable price realization, improved productivity and higher volume. The disposition of the residential lighting business also contributed to the expansion. Those factors were partially offset by approximately three percentage points of margin contraction driven by higher material and other cost inflation.
HUBBELL INCORPORATED- Form 10-K
31
Financial Condition, Liquidity and Capital Resources
Cash Flow
For the Year Ended December 31,
(in millions)
2025
2024
Net cash provided by (used in):
Operating activities
$
1,029.8
$
991.2
Investing activities
(1,094.6)
(59.1)
Financing activities
203.6
(923.4)
Effect of foreign currency exchange rate changes on cash and cash equivalents
13.9
(16.4)
NET CHANGE IN CASH AND CASH EQUIVALENTS
$
152.7
$
(7.7)
The following table reconciles our cash flows from operating activities to free cash flows for 2025 and 2024:
For the Year Ended December 31,
(in millions)
2025
2024
Net cash provided by operating activities (GAAP measure)
$
1,029.8
$
991.2
Less: Capital expenditures
(155.1)
(180.4)
Free cash flow
$
874.7
$
810.8
Free cash flow as a percent of net income attributable to Hubbell
98.6
%
104.1
%
Free cash flow is a non-GAAP measure that we define as cash flow from operations less capital expenditures. Management believes that free cash flow provides useful information regarding Hubbell’s ability to generate cash without reliance on external financing. In addition, management uses free cash flow to evaluate the resources available for investments in the business, strategic acquisitions and further strengthening the balance sheet.
2025 Compared to 2024
Cash provided by operating activities was $1,029.8 million in 2025 compared to $991.2 million in 2024. The increase was primarily due to higher net income in 2025, partially offset by an increase in cash used for working capital and an increase in cash used for contributions to pension plans in 2025 compared to 2024.
Cash used in investing activities was $1,094.6 million in 2025 compared to cash used of $59.1 million in 2024. That change was driven by $958.3 million of cash used in 2025 to acquire Alliance USAcqCo 2, Inc. ("Ventev"), Nicor, Inc. ("Nicor") and Power Rose Acquisition, Inc. (and together with its subsidiaries, "DMC Power"), as compared to $122.9 million of cash proceeds in 2024 from the disposition of our residential lighting business.
Cash provided by financing activities was $203.6 million in 2025 as compared to $923.4 million of cash used by financing activities in 2024. The change in cash flows reflects $600 million of cash provided in December 2025 from the Term Loan issued to partially fund the acquisition of DMC Power, as compared to cash used in 2024 to repay a previously issued Term Loan, along with an increase in dividends paid and higher share repurchases in 2025 compared to 2024.
The favorable impact of foreign currency exchange rates on cash was $13.9 million in 2025 as compared to an unfavorable effect of $16.4 million in 2024. The favorable impact in 2025 was primarily related to strengthening in the British Pound, Brazilian Real, Mexican Peso, and Canadian Dollar compared to the U.S. Dollar.
32
HUBBELL INCORPORATED - Form 10-K
Investments in the Business
Investments in our business include cash outlays for the acquisitions of businesses as well as expenditures to maintain the operation of our equipment and facilities and invest in restructuring activities.
In the first quarter of 2025, the Company acquired Ventev for approximately $73 million. Ventev is a leading manufacturer and provider of a complete ecosystem of solutions to power, protect, and connect wireless networks. The Ventev business has been added to the Electrical Solutions segment.
In the third quarter of 2025, the Company acquired Nicor for approximately $56 million. Nicor designs and manufactures water metering endpoint solutions to integrate and optimize advanced metering infrastructure networks. Such solutions include polymer meter box lids and covers. Nicor has been added to the Utility Solutions segment.
On October 1, 2025, the Company acquired DMC Power for approximately $829 million, net of cash acquired, subject to customary purchase price adjustments. DMC Power is a provider of swaged connection systems and tooling for utility substation and transmission markets. DMC Power has been added to the Utility Solutions segment.
For more information related to acquisitions completed in 2025, refer to Note 3 - Business Acquisitions and Dispositions in the Notes to Consolidated Financial Statements, which is incorporated herein by reference.
During 2025, we invested $155.1 million in capital expenditures on automation, productivity initiatives and maintenance, and we also continue to invest in restructuring and related programs to maintain a competitive cost structure, to drive operational efficiencies and to mitigate the impact of rising material costs and administrative cost inflation. We expect investments in restructuring and related activities to continue in 2026 as we continue to invest in previously initiated actions and initiatives, further footprint consolidation, and other cost reduction initiatives.
In connection with our restructuring and related actions, we have incurred restructuring costs as defined by U.S. GAAP, which are primarily severance and employee benefits, asset impairments, and accelerated depreciation, as well as facility closure, contract termination and certain pension costs that are directly related to restructuring actions. We also incurred restructuring-related costs, which are costs associated with our business transformation initiatives, including the consolidation of back-office functions and streamlining of our processes, and certain other costs and gains associated with restructuring actions. We refer to these costs on a combined basis as “restructuring and related costs”, which is a non-GAAP measure. We believe this non-GAAP measure provides investors with useful information regarding our underlying performance from period to period. Restructuring costs are predominantly settled in cash from our operating activities and are generally settled within one year, with the exception of asset impairments, which are non-cash.
The table below presents the restructuring and related costs incurred in 2025, additional expected costs, and the expected completion date of restructuring actions that had been initiated as of December 31, 2025 and in prior years (in millions):
Costs Incurred in 2025
Additional Expected Costs
Expected Completion Date
2025 Restructuring Actions
$
9.1
$
1.9
2026
2024 and Prior Restructuring Actions
2.9
2.1
2026
Restructuring cost (GAAP measure)
$
12.0
$
4.0
Restructuring-related costs
4.9
0.2
Restructuring and related costs (Non-GAAP measure)
$
16.9
$
4.2
Stock Repurchase Program
On October 21, 2022, we announced that the Board of Directors had approved a share repurchase program that authorized the repurchase of up to $300 million of common stock, which expired in October 21, 2025. On February 12, 2025 the Board of Directors approved a stock repurchase program that authorized the repurchase of up to $500 million of common stock and expires in February 2028. We had a total outstanding share repurchase authorization of approximately $500.0 million at December 31, 2025. Subject to numerous factors, including market conditions and alternative uses of cash, we may conduct discretionary repurchases through open market or privately negotiated transactions, which may include repurchases under plans complying with Rules 10b5-1 and 10b-18 under the Securities Exchange Act of 1934, as amended.
HUBBELL INCORPORATED- Form 10-K
33
Debt to Capital
At December 31, 2025 and 2024, the Company had $2,036.3 million and $1,442.7 million, respectively, of long-term debt outstanding, net of unamortized discount and the unamortized balance of capitalized debt issuance costs. At December 31, 2025, the Company had no long-term debt with maturities due within the next 12 months.
2025 Term Loan
On September 29, 2025, the Company entered into a Term Loan Agreement (the "2025 Term Loan Agreement") with a syndicate of lenders and JPMorgan Chase Bank, N.A., as administrative agent. On October 1, 2025, the Company borrowed $600 million under the 2025 Term Loan Agreement (the "2025 Term Loan") on an unsecured basis to finance a portion of the DMC Power purchase price. The 2025 Term Loan was made in a single borrowing and will be due and payable on September 29, 2028. The 2025 Term Loan bears interest based on the Term SOFR Rate (as defined in the 2025 Term Loan Agreement), plus an applicable interest addition based on Hubbell's credit ratings. The interest rate on the 2025 Term Loan as of December 31, 2025 was 4.99%. Hubbell also paid the lenders certain customary fees in connection with the 2025 Term Loan Agreement.
The 2025 Term Loan Agreement contains representations and warranties and affirmative and negative covenants customary for unsecured financing of this type, as well as a financial covenant requiring that, as of the last day of each fiscal quarter, the ratio of total indebtedness to total capitalization shall not be greater than 65%. The Company was in compliance with this covenant as of December 31, 2025.
2023 Term Loan
In connection with the December 2023 acquisition of Systems Control, the Company entered into a Term Loan Agreement (the “2023 Term Loan Agreement”) with a syndicate of lenders under which the Company borrowed $600 million on an unsecured basis (the "2023 Term Loan"). Borrowings under the 2023 Term Loan Agreement bore interest generally at either the adjusted term SOFR rate plus an applicable margin (determined by a ratings based grid) or the alternative base rate. The outstanding principal amount under the 2023 Term Loan Agreement was due and payable in full at maturity in December 2026. During the fourth quarter of 2024, the Company repaid the remainder of the 2023 Term Loan and no balance was outstanding at December 31, 2025 or December 31, 2024.
2025 Credit Facility
On March 25, 2025, the Company, as borrower, and each foreign subsidiary borrower from time to time party thereto (collectively, the “Foreign Subsidiary Borrowers”) entered into a five-year credit agreement with a syndicate of lenders and JPMorgan Chase Bank, N.A., as administrative agent, that provides for a $1.0 billion committed unsecured revolving credit facility (the “Revolving Credit Agreement”). The obligations of the Foreign Subsidiary Borrowers (if any) under the Revolving Credit Agreement are guaranteed by the Company.
Commitments under the Revolving Credit Agreement may be conditionally increased to an aggregate amount not to exceed $1.5 billion. The Revolving Credit Agreement includes a $50.0 million sub-limit for the issuance of letters of credit. The sum of the dollar amount of loans and letters of credit to the Foreign Subsidiary Borrowers under the Revolving Credit Agreement may not exceed $100.0 million.
The interest rate applicable to borrowings under the Revolving Credit Agreement is either (i) the alternate base rate (as defined in the Revolving Credit Agreement) or (ii) the term SOFR rate (as defined in the Revolving Credit Agreement) plus an applicable margin based on the Company's credit ratings.
All revolving loans outstanding under the Revolving Credit Agreement will be due and payable on March 25, 2030. The Revolving Credit Agreement provides for up to two one-year maturity extensions. As of December 31, 2025, the credit facility was undrawn.
The Revolving Credit Agreement contains a sole financial covenant requiring that, as of the last day of each fiscal quarter, the ratio of total indebtedness to total capitalization shall not be greater than 65%. The Company was in compliance with this covenant as of December 31, 2025.
Unsecured Senior Notes
On November 14, 2025, the Company completed a public offering of $400 million aggregate principal amount of its 4.800% Senior Notes due 2035 (the “2035 Notes”). The net proceeds from the offering were approximately $392.7 million after deducting the underwriting discount and estimated offering expenses payable by the Company. The 2035 Notes bear interest at a rate of 4.800% per annum from November 14, 2025. Interest on the 2035 Notes is payable semi-annually in arrears on May 15 and November 15 of each year, beginning on May 15, 2026. The 2035 Notes will mature on November 15, 2035.
34
HUBBELL INCORPORATED - Form 10-K
The Company used the net proceeds from the offering of the 2035 Notes, together with cash on hand, on December 1, 2025 to redeem in full all of the Company’s outstanding 3.350% Senior Notes due in 2026 for an aggregate principal amount of $400 million, which had a stated maturity date of March 1, 2026 (the "2026 Notes"), and to pay the accrued interest in respect thereof.
At December 31, 2024, the Company had an outstanding principal amount of $400 million in 2026 Notes and other unsecured, senior notes in principal amounts of $300 million due in 2027 (the "2027 Notes"), $450 million due in 2028 (the "2028 Notes"), and $300 million due in 2031 (the "2031 Notes'). At December 31, 2025 the 2027 Notes, 2028 Notes, and 2031 Notes remained outstanding in addition to the 2035 Notes.
The carrying value of the unsecured, senior notes (the "Notes"), net of unamortized discount and the unamortized balance of capitalized debt issuance costs, was $2,036.3 million and $1,442.7 million at December 31, 2025 and December 31, 2024, respectively.
The Notes are callable at any time at specified prices and are only subject to accelerated payment prior to maturity upon customary events of default, or upon a change in control triggering event as defined in the indenture governing the Notes, as supplemented. The Company was in compliance with all covenants (none of which are financial) as of December 31, 2025.
Short-term Debt
At December 31, 2025 and 2024, the Company had $289.1 million and $125.4 million, respectively, of short-term debt is composed of:
◦$287.0 million of commercial paper borrowings outstanding at December 31, 2025, and $123.0 million of commercial paper borrowings outstanding at December 31, 2024. The increase in commercial paper during 2025 was used for the repurchase of $225.0 million of treasury stock and to partially fund the acquisitions of Ventev, Nicor and DMC Power.
◦The Company had $2.1 million and $2.4 million of short-term debt outstanding at December 31, 2025 and December 31, 2024, respectively, which consisted of amounts outstanding under our commercial card program.
Net debt, defined as total debt less cash and investments, is a non-GAAP measure that may not be comparable to definitions used by other companies. We consider net debt to be a useful measure of our financial leverage for evaluating the Company’s ability to meet its funding needs.
The following table sets forth the reconciliation of net debt at December 31, 2025 and 2024:
December 31,
(in millions)
2025
2024
Total Debt (GAAP measure)
$
2,325.4
$
1,568.1
Total Hubbell Incorporated Shareholders’ Equity
3,847.9
3,396.2
TOTAL CAPITAL (GAAP measure)
$
6,173.3
$
4,964.3
Total Debt to Total Capital (GAAP measure)
38
%
32
%
Cash and Investments
$
596.3
$
429.9
NET DEBT (non-GAAP measure)
$
1,729.1
$
1,138.2
Net Debt to Total Capital (non-GAAP measure)
28
%
23
%
Liquidity
We measure liquidity on the basis of our ability to meet short-term and long-term operational funding needs, to fund additional investments, including acquisitions, and to make dividend payments to shareholders. Significant factors affecting the management of liquidity are cash flows from operating activities, capital expenditures, cash dividend payments, stock repurchases, access to bank lines of credit and our ability to attract long-term capital with satisfactory terms.
In 2025, we returned capital to our shareholders through dividends and share repurchases. These activities were funded primarily with cash flows from operations.
◦In 2025, cash used for share repurchases was $225.0 million.
◦Dividends paid on our common stock in 2025 were $286.6 million.
HUBBELL INCORPORATED- Form 10-K
35
We also require cash outlays to fund our operations, capital expenditures, and working capital requirements to accommodate anticipated levels of business activity, as well as our rate of cash dividends and potential future acquisitions. We have contractual obligations for long-term debt, operating leases, purchase obligations, and certain other long-term liabilities, including defined benefit retirement obligations and other benefits. Refer to Note 12 - Debt and Note 23 - Leases in the Notes to the Consolidated Financial Statements for further details on anticipated cash outflows. Contractual purchase obligations as of December 31, 2025 are approximately $570 with the vast majority expected to be satisfied in 2026.
Our purchase obligations include amounts committed under legally enforceable contracts or purchase orders for goods and services with defined terms as to price, quantity, delivery and termination liability. These obligations primarily consist of inventory purchases made in the normal course of business to meet operational requirements and commitments for equipment purchases. As of December 31, 2025, we have $58.9 million of uncertain tax positions reflected in our Consolidated Balance Sheet. We are unable to make a reasonable estimate regarding the timing of settlement of these uncertain tax positions and, as a result, they have been excluded from the disclosure. See Note 13 — Income Taxes in the Notes to Consolidated Financial Statements.
Our sources of funds and available resources to meet these funding needs are as follows:
◦Cash flows from operating activities and existing cash resources: In addition to our cash flows from operating activities, we also had $482.5 million of cash and cash equivalents at December 31, 2025, of which approximately 12% was held inside the United States and the remainder held internationally.
◦Our Revolving Credit Agreement provides a $1.0 billion committed revolving credit facility and commitments under the Revolving Credit Agreement may be increased (subject to certain conditions) to an aggregate amount not to exceed $1.5 billion. Annual commitment fees to support availability under the Revolving Credit Agreement are not material. Although not the principal source of liquidity, we believe our Revolving Credit Agreement is capable of providing significant financing flexibility at reasonable rates of interest and is an attractive alternative source of funding in the event that commercial paper markets experience disruption. However, an increase in usage of the Revolving Credit Agreement related to growth or a significant deterioration in the results of our operations or cash flows could cause our borrowing costs to increase and/or our ability to borrow could be restricted. We have not entered into any guarantees that could give rise to material unexpected cash requirements. The full $1.0 billion of borrowing capacity under the Revolving Credit Agreement was available to the Company at December 31, 2025.
◦In addition to our commercial paper program and existing revolving credit facility, we also have the ability to obtain additional financing through the issuance of long-term debt. Considering our current credit rating, historical earnings performance, and financial position, we believe that we would be able to obtain additional long-term debt financing on attractive terms.
◦The Company also maintains other lines of credit that are primarily used to support the issuance of letters of credit. Interest rates and other terms of borrowing under these lines of credit vary from country to country, depending on local market conditions. At December 31, 2025 and 2024, total availability under these lines was $58.2 million and $55.3 million, respectively, of which $21.5 million and $41.1 million was utilized to support letters of credit and the remaining amount was unused. The annual commitment fees associated with these lines of credit are not material.
Pension Funding Status
We have a number of funded and unfunded non-contributory U.S. and foreign defined benefit pension plans. Benefits under these plans are generally provided based on either years of service and final average pay or a specified dollar amount per year of service. The funded status of our qualified, defined benefit pension plans is dependent upon many factors including future returns on invested pension assets, the level of market interest rates, employee earnings and employee demographics.
Changes in the value of the defined benefit plan assets and liabilities will affect the amount of pension expense ultimately recognized. Although differences between actuarial assumptions and actual results are no longer deferred for balance sheet purposes, deferral is still permitted for pension expense purposes. Unrecognized gains and losses in excess of an annual calculated minimum amount (the greater of 10% of the projected benefit obligation or 10% of the market value of assets) have been amortized and recognized in net periodic pension cost. Effective January 1, 2020, the amortization of unrecognized gains and losses of all of the Company’s qualified defined benefit pension plans is recognized over the remaining life expectancy of participants, as all participants are considered inactive as a result of plan amendments. During 2025 and 2024, we recorded $11.3 million and $9.9 million, respectively, of pension expense related to the amortization of these unrecognized losses.
In 2025 and 2024, we contributed $41.4 million and $1.3 million, respectively, to our qualified foreign and domestic defined benefit pension plans. These contributions have improved the funded status of those plans. The anticipated level of pension funding in 2026 is not expected to have a significant impact on our overall liquidity.
36
HUBBELL INCORPORATED - Form 10-K
Assumptions
The following assumptions were used to determine projected pension and other benefit obligations at the measurement date and the net periodic benefit costs for the year:
Pension Benefits
Other Benefits
2025
2024
2025
2024
Weighted-average assumptions used to determine benefit obligations at December 31,
Discount rate
5.49
%
5.58
%
5.50
%
5.60
%
Rate of compensation increase
0.08
%
0.08
%
5.00
%
5.00
%
Weighted-average assumptions used to determine net periodic benefit cost for years ended December 31,
Discount rate
5.58
%
5.16
%
5.60
%
5.20
%
Expected return on plan assets
5.75
%
5.93
%
N/A
N/A
Rate of compensation increase
0.08
%
0.08
%
5.00
%
5.00
%
At the end of each year, we estimate the expected long-term rate of return on pension plan assets based on the strategic asset allocation for our plans. In making this determination, we utilize expected rates of return for each asset class based upon current market conditions and expected risk premiums for each asset class. A one percentage point change in the expected long-term rate of return on our pension fund assets would have an impact of approximately $5.1 million on 2026 pretax pension expense. The expected long-term rate of return is applied to the fair market value of pension fund assets to produce the expected return on fund assets that is included in pension expense.
The difference between this expected return and the actual return on plan assets was recognized at December 31, 2025 for balance sheet purposes, but continues to be deferred for expense purposes. The net deferral of past asset gains (losses) ultimately affects future pension expense through the amortization of gains (losses) with an offsetting adjustment to Hubbell shareholders’ equity through Accumulated other comprehensive loss.
At the end of each year, we determine the discount rate to be used to calculate the present value of our pension plan liabilities. For our U.S. and Canadian pension plans, this discount rate is determined by matching the expected cash flows associated with our benefit obligations to the expected cash flows of a hypothetical portfolio of high quality, fixed income debt instruments with maturities that closely match the expected funding period of our pension liabilities. As of December 31, 2025, we used a discount rate of 5.50% for our U.S. pension plans compared to a discount rate of 5.60% used in 2024. For our Canadian pension plan, we used a discount rate of 4.86% in 2025, compared to a 4.58% discount rate used in 2024.
For our UK pension plan the discount rate was derived using a full yield curve and uses plan specific cash flows. The derived discount rate is the single discount rate equivalent to discounting these liability cash flows at the term-dependent spot rates of AA corporate bonds. This methodology resulted in a December 31, 2025 discount rate for the UK pension plan of 5.55% as compared to a discount rate of 5.60% used in 2024.
A decrease of one percentage point in the discount rate would increase our 2026 pretax pension expense by approximately $0.2 million. A discount rate increase of one percentage point would decrease our 2026 pretax pension expense by $0.4 million.
In 2025 and 2024 we used the Pri-2012 mortality table and the MP-2021 projection scale from 2012 to calculate the present value of our pension plan liabilities in the U.S. In 2024, the Pri-2012 mortality table was adjusted to reflect plan specific geospatial characteristics as appropriate. The plan specific adjusted Pri-2012 mortality table with generational projection from 2012 using Scale MP-2021 was chosen as the best estimate based on the observed and anticipated experience of the plans after considering alternative tables.
Other Post-Employment Benefits (“OPEB”)
The Company also has a number of health care and life insurance benefit plans covering eligible employees who reached retirement age while working for the Company. These benefits have been discontinued for substantially all future retirees. These plans are not funded and, therefore, no assumed rate of return on assets is required. We use a similar methodology to derive the discount rate for our post employment benefit plan obligations that we use for our pension plans. As of December 31, 2025, the Company used a discount rate of 5.50% to determine the projected benefit obligation compared to a discount rate of 5.60% used in 2024.
In accordance with the accounting guidance for retirement benefits, we recorded to Accumulated other comprehensive loss, within Hubbell shareholders’ equity, a benefit, net of tax, of $6.9 million in 2025 and $6.1 million in 2024, respectively, related to the annual remeasurement of the OPEB plans and the amortization of prior service credits and net actuarial gains.
HUBBELL INCORPORATED- Form 10-K
37
Off-Balance Sheet Arrangements
Off-balance sheet arrangements are defined as any transaction, agreement or other contractual arrangement to which an entity that is not included in our consolidated results is a party, under which we, whether or not a party to the arrangement, have, or in the future may have: (1) an obligation under a direct or indirect guarantee or similar arrangement, (2) a retained or contingent interest in assets transferred to an unconsolidated entity or similar arrangement that serves as credit, liquidity or market risk support to such entity for such assets, (3) an obligation or liability, including a contingent obligation or liability, under a contract that would be accounted for as a derivative instrument, except that it is excluded from the scope of FASB ASC Topic 815, or (4) an obligation, including a contingent obligation, arising out of a variable interest in an unconsolidated entity that is held by, and material to, the Company, where such entity provides financing, liquidity, market risk or credit risk support to, or engages in leasing, hedging or research and development services with, the Company.
We do not have any off-balance sheet arrangements (as defined above), which have or are likely to have a current or future material effect on our financial condition, results of operations, liquidity, capital expenditures, capital resources or cash flows.
38
HUBBELL INCORPORATED - Form 10-K
Critical Accounting Estimates
Note 1 — Significant Accounting Policies in the Notes to Consolidated Financial Statements describes the significant accounting policies used in the preparation of our financial statements.
Use of Estimates
We are required to make assumptions and estimates and apply judgments in the preparation of our financial statements that affect the reported amounts of assets and liabilities, revenues and expenses and related disclosures. We base our assumptions, estimates and judgments on historical experience, current trends and other factors deemed relevant by management, such as projections of future performance. We continually review these estimates and their underlying assumptions to ensure they are appropriate for the circumstances. Changes in estimates and assumptions used by us could have a material impact on our financial results, and actual results could differ significantly from those estimates. We believe that the following estimates are among the most critical in fully understanding and evaluating our reported financial results. These items utilize assumptions and estimates about the effect of future events that are inherently uncertain and are based on our judgment.
Revenue Recognition
The Company recognizes revenue when performance obligations identified under the terms of contracts with its customers are satisfied, which generally occurs, for products, upon the transfer of control in accordance with the contractual terms and conditions of the sale. The majority of the Company’s revenue associated with products is recognized at a point in time when the product is shipped to the customer, with a relatively small amount of transactions in the Utility Solutions segment recognized upon delivery of the product at the contractually specified destination.
The Company also has performance obligations, primarily within the Utility Solutions segment, that are recognized over-time due to the customized nature of the product and the Company’s enforceable right to receive payment for work performed to date in the event of a cancellation. The Company uses an input measure to determine the extent of progress towards completion of the performance obligation, which the Company believes best depicts the transfer of control to the customer. Under this method, revenue recognition is based upon the ratio of costs incurred to date compared with estimated total costs to complete.
Revenue from service contracts and post-shipment performance obligations is approximately one percent of total annual consolidated net revenue and those service contracts and post-shipment obligations are primarily within the Utility Solutions segment. Revenue from service contracts and post-shipment performance obligations is recognized when or as those obligations are satisfied. The Company primarily offers assurance-type standard warranties that do not represent separate performance obligations and on occasion will separately offer and price extended warranties that are separate performance obligations for which the associated revenue is recognized over-time based on the extended warranty period. The Company records amounts billed to customers for reimbursement of shipping and handling costs within revenue. Shipping and handling costs associated with outbound freight after control over a product has transferred to a customer are accounted for as fulfillment costs and are included in cost of goods sold. Sales taxes and other usage-based taxes are excluded from revenue.
Certain businesses require a portion of the transaction price to be paid in advance of transfer of control. Advance payments are not considered a significant financing component as they are received less than one year before the related performance obligations are satisfied. In addition, in the Utility Solutions segment, certain businesses offer annual maintenance service contracts that require payment at the beginning of the contract period. These payments are treated as a contract liability and are classified in Other accrued liabilities in the Consolidated Balance Sheet. Once control transfers to the customer and the Company meets the revenue recognition criteria, the deferred revenue is recognized in the Consolidated Statement of Income. The deferred revenue relating to the annual maintenance service contracts is recognized in the Consolidated Statement of Income on a straight line basis over the expected term of the contract.
The Company has certain arrangements that require us to estimate at the time of sale the amounts of variable consideration that should not be recorded as revenue as certain amounts are not expected to be collected from customers, as well as an estimate of the value of the product to be returned. The Company principally relies on historical experience, specific customer agreements and anticipated future trends to estimate these amounts at the time of shipment and to reduce the transaction price. These arrangements include sales discounts and allowances based on sales volumes, specific programs and special pricing allowances, and returned goods, as are customary in the electrical products industry. Customer returns have historically been approximately one percent of gross sales.
Inventory Valuation
Inventories are stated at the lower of cost and net realizable value. The cost is primarily determined utilizing average cost or first-in, first-out (FIFO) methods of inventory accounting. We routinely evaluate the carrying value of our inventories to ensure they are carried at the lower of FIFO or average cost or market value. Such evaluation is based on our judgment and use of estimates, including sales forecasts, gross margins for particular product groupings, planned dispositions of product lines, technological events and overall industry trends. In addition, the evaluation is based on changes in inventory management practices which may influence the timing of exiting products and method of disposing of excess inventory.
HUBBELL INCORPORATED- Form 10-K
39
Excess inventory is generally identified by comparing future expected inventory usage to actual on-hand quantities. Inventory values are reduced for on-hand inventory in excess of pre-defined usage forecasts. Forecast usage is primarily determined by projecting historical (actual) sales and inventory usage levels forward to future periods. Changes in these estimates may necessitate future adjustments to inventory values.
Employee Benefits Costs and Funding
We sponsor domestic and foreign defined benefit pension, defined contribution and other postretirement plans. Significant assumptions used in the accounting for these employee benefit plans include the discount rate, expected return on the pension fund assets, rate of increase in employee compensation levels and health care cost increase projections. These assumptions are determined based on Company data and appropriate market indicators, and are evaluated each year as of the plans’ measurement dates. Further discussion of the assumptions used in 2025 and 2024 are included above under “Pension Funding Status” and in Note 11 — Retirement Benefits in the Notes to Consolidated Financial Statements.
Taxes
We account for income taxes in accordance with the applicable accounting guidance which requires that deferred tax assets and liabilities be recognized using enacted tax rates for the effect of temporary differences between the book and tax basis of recorded assets and liabilities. Additionally, deferred tax assets are required to be reduced by a valuation allowance if it is more-likely-than-not that some portion or all of a deferred tax asset will not be realized. The factors used to assess the likelihood of realization of deferred tax assets are the forecast of future taxable income, available tax planning strategies that could be implemented to realize the net deferred tax assets, and future reversals of deferred tax liabilities. Failure to achieve forecasted taxable income can affect the ultimate realization of net deferred tax assets.
We operate within multiple taxing jurisdictions and are subject to audit in these jurisdictions. The Internal Revenue Service (“IRS”) and other tax authorities routinely review our tax returns. These audits can involve complex issues, which may require an extended period of time to resolve. The Company records uncertain tax positions when it has determined that it is more-likely-than-not that a tax position will not be sustained upon examination by taxing authorities based on the technical merits of the position. The Company uses the criteria established in the accounting guidance to determine whether an item meets the definition of more-likely-than-not. The Company’s policy is to recognize these uncertain tax positions when the more-likely-than-not threshold is met, when the statute of limitations has expired or upon settlement. In management’s opinion, adequate provision has been made for potential adjustments arising from any examinations. See Note 13 — Income Taxes in the Notes to Consolidated Financial Statements.
Valuation of Long-Lived Assets, Goodwill, and Indefinite-Lived Intangible Assets
Our long-lived assets include land, buildings, equipment, molds and dies, software, goodwill and other intangible assets. Long-lived assets, other than land, goodwill and indefinite-lived intangibles, are depreciated over their estimated useful lives. The assets and liabilities of acquired businesses are recorded under the acquisition method of accounting at their estimated fair values at the dates of acquisition. Goodwill represents purchase price in excess of fair values assigned to the underlying identifiable net assets of acquired businesses. Intangible assets primarily consist of patents, tradenames, developed technology and customer related intangibles.
Goodwill and indefinite-lived intangible assets are reviewed annually for impairment unless circumstances dictate the need for more frequent assessment. We perform our annual goodwill impairment testing as of April 1st of each year. The accounting guidance provides entities an option of performing a qualitative assessment (the “Step-zero” test) before performing a quantitative analysis. If the entity determines, on the basis of certain qualitative factors, that it is more-likely-than-not that the goodwill is not impaired, the entity would not need to proceed to the quantitative goodwill impairment testing process as prescribed in the guidance. If the Company does not elect to complete the qualitative assessment, the Company completes the quantitative assessment whereby the estimated fair value of each reporting unit is compared to its carrying value.
The Company completed its annual goodwill impairment test as of April 1, 2025. For each of the Company’s reporting units, the Company elected to utilize the quantitative goodwill impairment testing process, as permitted in the accounting guidance, by comparing the estimated fair value of the reporting units to their carrying values. As of April 1, 2025, the impairment testing resulted in implied fair values for each reporting unit that significantly exceeded such reporting unit’s carrying value, including goodwill. The Company did not have any reporting units with zero or negative carrying amounts.
40
HUBBELL INCORPORATED - Form 10-K
The organizational changes described in Note 2 - Revenue resulted in a change in the Company’s reporting units within the Electrical Solutions segment. As a result of the change in reporting units, the Company performed an interim goodwill impairment assessment during the third quarter of 2025, for the reporting units within the Electrical Solutions segment. Because the changes did not affect the Utility Solutions segment, no interim goodwill impairment assessment was required for that segment. For this interim assessment, the Company elected to utilize the quantitative goodwill impairment testing process, as permitted in the accounting guidance, by comparing the estimated fair value of the reporting units to their carrying values. The interim impairment testing resulted in implied fair values for each reporting unit that significantly exceeded such reporting unit’s carrying value, including goodwill. The Company did not have any reporting units with zero or negative carrying amounts.
The goodwill impairment test requires judgment, including the identification of reporting units, assigning assets and liabilities to reporting units, and determining the fair value of each reporting unit. Significant judgments required to estimate the fair value of reporting units include estimating future cash flows, determining appropriate discount rates and other assumptions, including assumptions about secular economic and market conditions. The Company uses internal discounted cash flow models to estimate fair value. These cash flow estimates are derived from historical experience, third-party end market data, and future long-term business plans and include assumptions of future sales growth, gross margin, operating margin, terminal growth rate, and the application of an appropriate discount rate. Significant changes in these estimates and assumptions could materially affect the determination of fair value and/or goodwill impairment for each reporting unit. We corroborate the values determined from our discounted cash flow models by reconciling the sum of the estimated fair values of each reporting unit to our market capitalization at the testing date, including consideration of a control premium. We have not recorded any goodwill impairments since the initial adoption of the accounting guidance in 2002.
The identification and measurement of impairment of indefinite-lived intangible assets involves either an assessment of qualitative factors to determine whether events or circumstances indicate that it is more-likely-than-not that an indefinite-lived intangible asset is impaired or a quantitative assessment whereby the estimated fair value of each indefinite-lived intangible asset is compared to its carrying value. If it is more-likely-than-not that the asset is impaired, the estimated fair value of the indefinite-lived intangibles will be determined using discounted cash flow estimates. If the carrying value of these assets exceeds the estimated fair value, the carrying value will be reduced to the estimated fair value. For the Company’s annual impairment test as of April 1, 2025, the Company elected to utilize the quantitative impairment testing process as permitted in the accounting guidance. The estimated fair value was determined utilizing an income approach (relief from royalty method). Significant judgment is required to estimate the fair value of the indefinite-lived intangible assets including assumptions for future revenues, discount rates, royalty rates, and other assumptions, including assumptions about secular economic and market conditions. Significant changes in these estimates and assumptions could affect the determination of fair value and/or impairment for each indefinite-lived intangible asset. As of April 1, 2025, the impairment testing resulted in estimated fair values for each indefinite-lived intangible asset that significantly exceeded the carrying values and there were no indefinite-lived intangible assets at risk of failing the quantitative impairment test. We did not record any impairments related to indefinite-lived intangible assets in 2025, 2024, or 2023.
HUBBELL INCORPORATED- Form 10-K
41
Forward-Looking Statements
Some of the information included in this Management’s Discussion and Analysis of Financial Condition and Results of Operations, and elsewhere in this Form 10-K, contain “forward-looking statements” as defined by the Private Securities Litigation Reform Act of 1995. These statements generally relate to our expectations and beliefs regarding our financial results, condition and outlook, projections of future performance, anticipated growth and end markets, changes in operating results, market conditions and economic conditions, expected capital resources, liquidity, financial performance, pension funding and results of operations, plans, strategies, opportunities, developments and productivity initiatives, competitive positioning, and trends in particular markets or industries. In addition, all statements regarding the expected financial impact of the integration of acquisitions, adoption of updated accounting standards and any expected effects of such adoption, and intent to continue repurchasing shares of common stock, as well as other statements that are not strictly historic in nature, are forward-looking. Forward-looking statements may be identified by the use of words, such as “believe”, “expect”, “anticipate”, “intend”, “depend”, “should”, “plan”, “estimated”, “predict”, “could”, “may”, “subject to”, “continues”, “growing”, “prospective”, “forecast”, “projected”, “purport”, “might”, “if”, “contemplate”, “potential”, “pending,” “target”, “goals”, “scheduled”, “will”, “will likely be”, and similar words and phrases. Such forward-looking statements are based on our current expectations and involve numerous assumptions, known and unknown risks, uncertainties and other factors, which may cause actual and future performance or the Company’s achievements to be materially different from any future results, performance, or achievements expressed or implied by such forward-looking statements. Such factors include, but are not limited to:
•Impact of trade tariffs, import quotas or other trade actions, restrictions or measures taken by the United States, China, Mexico, the United Kingdom, member states of the European Union, and other countries, including the recent and ongoing potential changes in U.S. trade policies, that may be made by the current or a future presidential administration and changes in trade policies in other countries made in response to changes in the U.S. trade policies.
•The general impact of inflation on our business, including the impact on raw materials costs, elevated interest rates and increased energy costs and our ability to implement and maintain pricing actions that we have taken to cover higher costs and protect our margin profile.
•Economic and business conditions in particular industries, markets or geographic regions, as well the potential for macro-economic effects of the U.S. government federal deficit, and continued inflation, a significant economic slowdown, stagflation or recession.
•Effects of unfavorable foreign currency exchange rates and the potential use of hedging instruments to hedge the exposure to fluctuating rates of foreign currency exchange on inventory purchases.
•Supply chain disruptions and availability, costs and quantity of raw materials, purchased components, energy and freight.
•Changes in demand for our products, market conditions, product quality, or product availability adversely affecting sales levels.
•Ability to effectively develop and introduce new products.
•Changes in markets or competition adversely affecting realization of price increases.
•Continued softness in the grid automation market of Utility Solutions and residential market of Electrical Solutions.
•Failure to achieve projected levels of efficiencies, and maintain cost savings and cost reduction measures, including those expected as a result of our lean initiatives and strategic sourcing plans.
•Failure to comply with import and export laws.
•Changes relating to impairment of our goodwill and other intangible assets.
•Inability to access capital markets or failure to maintain our credit ratings.
•Changes in expected or future levels of operating cash flow, indebtedness and capital spending.
•Regulatory issues, and extensive worldwide changes to the taxation of multinational enterprises, including global minimum tax rules under the OECD’s Pillar Two initiative and potential modifications to corporate taxation by the U.S. government, including adjustments to tax rates, deduction limitations, cross-border tax provisions, and administrative guidance.
•A major disruption in one or more of our manufacturing or distribution facilities or headquarters, including the impact of plant consolidations and relocations.
•Changes in our relationships with, or the financial condition or performance of, key distributors and other customers, agents or business partners which could adversely affect our results of operations.
•Impact of productivity improvements on lead times, quality and delivery of product.
•Anticipated future contributions and assumptions including increases in interest rates and changes in plan assets with respect to pensions and other retirement benefits, as well as pension withdrawal liabilities.
•Adjustments to product warranty accruals in response to claims incurred, historical experiences and known costs.
•Unexpected costs or charges, certain of which might be outside of our control.
•Changes in strategy due to economic conditions or other conditions outside of our control affecting anticipated future global product sourcing levels.
•Ability to carry out future acquisitions and strategic investments in our core businesses as well as the acquisition related costs.
•Ability to successfully manage and integrate acquired businesses, such as the acquisitions of Systems Control, Ventev, Nicor and DMC Power, as well as the failure to realize expected synergies and benefits anticipated when we make an acquisition due to potential adverse reactions or changes to business or employee relationships resulting from completion of the transaction, competitive responses to the transaction, the possibility that the anticipated benefits of the transaction are not realized when expected or at all, including as a result of the impact of, or problems arising from, the integration of an acquired business, diversion of management’s attention from ongoing business operations and opportunities, and litigation relating to the transaction.
42
HUBBELL INCORPORATED - Form 10-K
•The impact of certain divestitures, including the benefits and costs of the sale of the residential lighting business.
•The ability to effectively implement Enterprise Resource Planning systems without disrupting operational and financial processes.
•The ability of government customers to meet their financial obligations.
•Political unrest and military actions in foreign countries, including the conflicts in Ukraine and the Middle East and trade tensions with China, as well as the impact on world markets and energy supplies and prices resulting therefrom.
•The impact of potential natural disasters or additional public health emergencies on our financial condition and results of operations.
•Failure of information technology systems, cybersecurity breaches, cyber threats, malware, phishing attacks, break-ins and similar events resulting in unauthorized disclosure of confidential information or disruptions or damage to information technology systems that could cause interruptions to our operations or adversely affect our internal control over financial reporting.
•Incurring significant and/or unexpected costs to avoid manage, defend and litigate intellectual property matters.
•Future repurchases of common stock under our common stock repurchase program.
•Changes in accounting principles, interpretations, or estimates.
•Failure to comply with any laws and regulations, including those related to data privacy and information security, environmental and conflict-free minerals.
•The outcome of environmental, legal and tax contingencies or costs compared to amounts provided for such contingencies, including contingencies or costs with respect to pension withdrawal liabilities.
•Improper conduct by any of our employees, agents or business partners that damages our reputation or subjects us to civil or criminal liability.
•Our ability to hire, retain and develop qualified personnel.
•Adverse changes in foreign currency exchange rates and the potential use of hedging instruments to hedge the exposure to fluctuating rates of foreign currency exchange on inventory purchases.
•Other factors described in our Securities and Exchange Commission filings, including the “Business”, “Risk Factors”, “Management’s Discussion and Analysis of Financial Condition and Results of Operations,” and “Quantitative and Qualitative Disclosures about Market Risk” sections in this Annual Report on Form 10-K for the year ended December 31, 2025.
Any such forward-looking statements are not guarantees of future performances and actual results, developments and business decisions may differ from those contemplated by such forward-looking statements. The Company disclaims any duty to update any forward-looking statement, all of which are expressly qualified by the foregoing, other than as required by law.
ITEM 7A Quantitative and Qualitative Disclosures about Market Risk
In the operation of our business, we have various exposures to areas of risk related to factors within and outside the control of management. Significant areas of risk and our strategies to manage the exposure are discussed below.
Foreign Currency Risk
We face transactional exchange rate risk from the purchase and sale of goods and services in currencies other than our functional currency or the functional currency of an applicable subsidiary. As such, our operating results could be affected by changes in foreign currency exchange rates or weak economic conditions in the foreign markets in which we sell our products, purchase goods or otherwise incur costs to operate foreign subsidiaries. As a percentage of the Company’s total Net sales, the net sales of foreign operations, for which transactions are primarily in local currencies were 7% in 2025, 8% in 2024 and 8% in 2023, with the Canadian, UK, and Brazilian operations representing approximately 33%,24%, and 19%, respectively, of 2025 total international Net sales. To manage this exposure, we closely monitor the working capital requirements of our international units and we may enter into forward foreign exchange contracts to mitigate risk related to receipts from customers and payments to suppliers.
Additionally, we are subject to foreign exchange translation risk due to changes in the value of foreign currencies in relation to our reporting currency, the U.S. Dollar. The translation risk is primarily concentrated in the exchange rate between the U.S. Dollar and the Brazilian Real, British Pound and Canadian Dollar. As the U.S. Dollar strengthens against these currencies on which we transact business, revenue and income will generally be negatively impacted, and if the U.S. Dollar weakens, revenue and income will generally be positively impacted. Accordingly, we estimate a hypothetical 10% movement of the U.S. Dollar against the various foreign exchanges rate we translate from, in aggregate would impact operating profit by approximately $6.7 million.
HUBBELL INCORPORATED- Form 10-K
43
Interest Rate Risk
Our financial results are subject to interest rate fluctuations to the extent there is a difference between the amount of our interest-earning assets and the amount of interest-bearing liabilities. The principal objectives of our investment management activities are to preserve capital while earning net investment income that is commensurate with acceptable levels of interest rate, default and liquidity risk, taking into account our funding needs. As part of our investment management strategy, we may use derivative financial products such as interest rate hedges and interest rate swaps.
From time to time or when required, we issue commercial paper, which exposes us to changes in interest rates. Our cash position includes amounts denominated in foreign currencies. We manage our worldwide cash requirements by considering available funds held by our subsidiaries and the cost effectiveness with which these funds can be accessed.
As of December 31, 2025, the long-term debt outstanding related to the fixed-rate senior notes was $1,450.0 million. The senior notes are not exposed to interest rate risk as the bonds are at a fixed-rate until maturity.
As of December 31, 2025 the Company had $600.0 million outstanding from the Term Loan Agreement, and the interest rate is variable based on the adjusted term SOFR rate. As of December 31, 2025 the Company also had $289.1 million of short-term debt, primarily commercial paper that was floating rate debt. A 100 basis point rise or decline in interest rates would not be significant to our financial condition or results of operations.
The following table presents cost and weighted average interest rate information related to financial instruments that are sensitive to changes in interest rates, by maturity at December 31, 2025 (dollars in millions):
2026
2027
2028
2029
2030
Thereafter
Total
Fair Value 12/31/25
ASSETS
Available-for-sale investments
$
12.5
$
17.5
$
16.3
$
14.2
$
3.7
$
13.8
$
78.0
$
78.4
Avg. interest rate
4.26
%
3.88
%
5.00
%
4.94
%
4.63
%
4.91
%
LIABILITIES
Long-term debt
$
—
$
300.0
$
1,050.0
$
—
$
—
$
700.0
$
2,050.0
$
2,008.3
Avg. interest rate
—
%
3.15
%
4.35
%
—
%
—
%
3.73
%
We use derivative financial instruments only if they are matched with a specific asset, liability, or proposed future transaction. We do not speculate or use leverage when trading a financial derivative product.
44
HUBBELL INCORPORATED - Form 10-K
ITEM 8 Financial Statements and Supplementary Data
All other schedules are omitted because they are not applicable or the required information is shown in the consolidated financial statements or notes thereto.
HUBBELL INCORPORATED- Form 10-K
45
Reports of Management
Report on Management’s Responsibility for Financial Statements
Our management is responsible for the preparation, integrity and fair presentation of our published financial statements. The financial statements have been prepared in accordance with accounting principles generally accepted in the United States of America and include amounts based on informed judgments made by management.
We believe it is critical to provide investors and other users of our financial statements with information that is relevant, objective, understandable and timely, so that they can make informed decisions. As a result, we have established and maintain systems and practices and internal control processes designed to provide reasonable, but not absolute, assurance that transactions are properly executed and recorded and that our policies and procedures are carried out appropriately. Management strives to recruit, train and retain high quality people to ensure that controls are designed, implemented and maintained in a high-quality, reliable manner.
Our independent registered public accounting firm audited our financial statements and the effectiveness of our internal control over financial reporting in accordance with standards established by the Public Company Accounting Oversight Board (United States). Their report appears on the next page within this Annual Report on Form 10-K.
Our Board of Directors normally meets at least eight times per year to provide oversight, to review corporate strategies and operations, and to assess management’s conduct of the business. The Board of Directors also schedules additional meetings on an as needed basis. The Audit Committee of our Board of Directors is composed of at least three individuals all of whom must be “independent” under current New York Stock Exchange listing standards and regulations adopted by the SEC under the federal securities laws. The Audit Committee meets regularly with our internal auditors and independent registered public accounting firm, as well as, management to review, among other matters, accounting, auditing, internal controls and financial reporting issues and practices. Both the internal auditors and independent registered public accounting firm have full, unlimited access to the Audit Committee.
Management’s Annual Report on Internal Control over Financial Reporting
Management is responsible for establishing and maintaining adequate systems of internal control over financial reporting as defined by Rules 13a-15(f) and 15d-15(f) under the Securities Exchange Act of 1934, as amended. Our internal control over financial reporting is designed to provide reasonable assurance regarding the reliability of financial reporting and the preparation of financial statements for external reporting purposes in accordance with generally accepted accounting principles in the United States of America. Because of its inherent limitations, internal control over financial reporting may not prevent or detect misstatements. Management has assessed the effectiveness of our internal control over financial reporting as of December 31, 2025.
In the year ended December 31, 2025, the Company acquired Nicor, Inc. and Power Rose Acquisition, Inc. (and together with its subsidiaries, "DMC Power"), for an aggregate purchase price of approximately $885 million, net of cash acquired. Because the Company has not yet fully incorporated the internal controls and procedures of the acquired entities into the Company's internal control over financial reporting, management excluded these businesses from its assessment of the effectiveness of internal control over financial reporting as of December 31, 2025. These entities accounted for approximately 4% of the Company's total assets excluding intangibles and goodwill as of December 31, 2025 and approximately 1% of the Company's net sales for the year then ended December 31, 2025.
In making this assessment, management used the criteria set forth in Internal Control-Integrated Framework (2013 framework) issued by the Committee of Sponsoring Organizations of the Treadway Commission (“COSO”). Based on this assessment, management concluded that our internal control over financial reporting was effective at a reasonable assurance level as of December 31, 2025.
The effectiveness of our internal control over financial reporting as of December 31, 2025 has been audited by PricewaterhouseCoopers LLP, our independent registered public accounting firm as stated in their report which is included below within this Annual Report on Form 10-K.
/s/ GERBEN W. BAKKER
/s/ JOSEPH A. CAPOZZOLI
Gerben W. Bakker
Joseph A. Capozzoli
Chairman of the Board, President and Chief Executive Officer
Senior Vice President, Chief Financial Officer
46
HUBBELL INCORPORATED - Form 10-K
Report of Independent Registered Public Accounting Firm
Tothe Board of Directors and Shareholders of Hubbell Incorporated
Opinions on the Financial Statements and Internal Control over Financial Reporting
We have audited the accompanying consolidated balance sheets of Hubbell Incorporated and its subsidiaries (the “Company”) as of December 31, 2025 and 2024, and the related consolidated statements of income, of comprehensive income, of changes in equity, and of cash flows for each of the three years in the period ended December 31, 2025, including the related notes and schedule of valuation and qualifying accounts and reserves for each of the three years in the period ended December 31, 2025 listed in the Index appearing under Item 8 (collectively referred to as the “consolidated financial statements”). We also have audited the Company's internal control over financial reporting as of December 31, 2025, based on criteria established in Internal Control - Integrated Framework (2013) issued by the Committee of Sponsoring Organizations of the Treadway Commission (COSO).
In our opinion, the consolidated financial statements referred to above present fairly, in all material respects, the financial position of the Company as of December 31, 2025 and 2024, and the results of its operations and its cash flows for each of the three years in the period ended December 31, 2025 in conformity with accounting principles generally accepted in the United States of America. Also in our opinion, the Company maintained, in all material respects, effective internal control over financial reporting as of December 31, 2025, based on criteria established in Internal Control - Integrated Framework (2013) issued by the COSO.
Change in Accounting Principle
As discussed in Note 1 to the consolidated financial statements, the Company changed the manner in which it accounts for certain inventories in 2025.
Basis for Opinions
The Company's management is responsible for these consolidated financial statements, for maintaining effective internal control over financial reporting, and for its assessment of the effectiveness of internal control over financial reporting, included in Management's Annual Report on Internal Control over Financial Reporting appearing under Item 8. Our responsibility is to express opinions on the Company’s consolidated financial statements and on the Company's internal control over financial reporting based on our audits. We are a public accounting firm registered with the Public Company Accounting Oversight Board (United States) (PCAOB) and are required to be independent with respect to the Company in accordance with the U.S. federal securities laws and the applicable rules and regulations of the Securities and Exchange Commission and the PCAOB.
We conducted our audits in accordance with the standards of the PCAOB. Those standards require that we plan and perform the audits to obtain reasonable assurance about whether the consolidated financial statements are free of material misstatement, whether due to error or fraud, and whether effective internal control over financial reporting was maintained in all material respects.
Our audits of the consolidated financial statements included performing procedures to assess the risks of material misstatement of the consolidated financial statements, whether due to error or fraud, and performing procedures that respond to those risks. Such procedures included examining, on a test basis, evidence regarding the amounts and disclosures in the consolidated financial statements. Our audits also included evaluating the accounting principles used and significant estimates made by management, as well as evaluating the overall presentation of the consolidated financial statements. Our audit of internal control over financial reporting included obtaining an understanding of internal control over financial reporting, assessing the risk that a material weakness exists, and testing and evaluating the design and operating effectiveness of internal control based on the assessed risk. Our audits also included performing such other procedures as we considered necessary in the circumstances. We believe that our audits provide a reasonable basis for our opinions.
As described in Management’s Annual Report on Internal Control over Financial Reporting, management has excluded Nicor, Inc., ("Nicor") and Power Rose Acquisition, Inc., ("Power Rose" and together with its subsidiaries, "DMC Power"), from its assessment of internal control over financial reporting as of December 31, 2025 because they were acquired by the Company in purchase business combinations in the year ended December 31, 2025. We have also excluded Nicor and DMC Power from our audit of internal control over financial reporting. Nicor and DMC Power are wholly-owned subsidiaries whose total assets and total revenues excluded from management’s assessment and our audit of internal control over financial reporting collectively represent approximately 4% and approximately 1%, respectively, of the related consolidated financial statement amounts as of and for the year ended December 31, 2025.
HUBBELL INCORPORATED- Form 10-K
47
Definition and Limitations of Internal Control over Financial Reporting
A company’s internal control over financial reporting is a process designed to provide reasonable assurance regarding the reliability of financial reporting and the preparation of financial statements for external purposes in accordance with generally accepted accounting principles. A company’s internal control over financial reporting includes those policies and procedures that (i) pertain to the maintenance of records that, in reasonable detail, accurately and fairly reflect the transactions and dispositions of the assets of the company; (ii) provide reasonable assurance that transactions are recorded as necessary to permit preparation of financial statements in accordance with generally accepted accounting principles, and that receipts and expenditures of the company are being made only in accordance with authorizations of management and directors of the company; and (iii) provide reasonable assurance regarding prevention or timely detection of unauthorized acquisition, use, or disposition of the company’s assets that could have a material effect on the financial statements.
Because of its inherent limitations, internal control over financial reporting may not prevent or detect misstatements. Also, projections of any evaluation of effectiveness to future periods are subject to the risk that controls may become inadequate because of changes in conditions, or that the degree of compliance with the policies or procedures may deteriorate.
Critical Audit Matters
The critical audit matters communicated beloware mattersarising from the current period audit of the consolidated financial statements that were communicated or required to be communicated to the audit committee and that (i) relate to accounts or disclosures that are material to the consolidated financial statements and (ii) involved our especially challenging, subjective, or complex judgments. The communication of critical audit matters does not alter in any way our opinion on the consolidatedfinancial statements, taken as a whole, and we are not, by communicating the critical audit matters below, providing separate opinions on the critical audit matters or on the accounts or disclosures to which they relate.
Revenue Recognition – Point in Time Product Revenue
As described in Notes 1 and 2 to the consolidated financial statements, the Company’s net sales were $5,844.6 million for the year ended December 31, 2025, the majority of which is point in time product revenue. Revenue is recognized when performance obligations identified under the terms of contracts with the Company’s customers are satisfied, which generally occurs, for products, upon the transfer of control in accordance with the contractual terms and conditions of the sale. The majority of the Company’s revenue associated with products is recognized at a point in time when the product is shipped to the customer, with a relatively small amount of transactions in the Utility Solutions segment recognized upon delivery of the product at the contractually specified destination. The Company has certain arrangements that include sales discounts and allowances based on sales volumes, specific programs and special pricing allowances, and returned goods, as are customary in the electrical products industry.
The principal consideration for our determination that performing procedures relating to revenue recognition for point in time product revenue is a critical audit matter is a high degree of auditor effort in performing procedures related to the Company’s revenue recognition.
Addressing the matter involved performing procedures and evaluating audit evidence in connection with forming our overall opinion on the consolidated financial statements. These procedures included testing the effectiveness of controls relating to the revenue recognition process, including controls over the recording of point in time product revenue upon the transfer of control.These procedures alsoincluded, among others (i) evaluating revenue recognized by either (a) testing revenue transactions, on a sample basis, by obtaining and inspecting source documents, such as invoices, purchase orders, proof of shipment or delivery, and cash receipts or (b) testing the issuance and settlement of invoices and credit memos, tracing transactions not settled to a detailed listing of accounts receivable, and testing the completeness and accuracy of data provided by management; (ii) evaluating customer invoice balances as of December 31, 2025 by (a) confirming, on a sample basis, outstanding customer invoice balances as of a date on or prior to December 31, 2025 and, for confirmations not returned, obtaining and inspecting source documents, such as invoices, purchase orders, proof of shipment or delivery, and subsequent cash receipts and (b) testing, on a sample basis, the issuance and settlement of invoices during the intervening period by obtaining and inspecting source documents, such as invoices, purchase orders, proof of shipment or delivery, and cash receipts; and (iii) testing, on a sample basis, sales discounts and allowances by obtaining and inspecting source documents, such as support for the nature of the sales discount or allowance amount and agreement with the customer.
Acquisition of DMC Power – Valuation of Customer Relationships
As described in Note 3 to the consolidated financial statements, on October 1, 2025, the Company acquired all of the issued and outstanding equity of DMC Power for approximately $829 million, net of cash acquired. The Company recognized intangible assets of $364.0 million, of which $290.0 million related to customer relationships. Management determined the preliminary fair values of the customer relationships intangible assets using a multi-period excess earnings method. The significant assumptions used in determining the preliminary fair values of the customer relationships intangible assets included revenue growth rates, gross margin, attrition rate, and discount rate.
48
HUBBELL INCORPORATED - Form 10-K
The principal considerations for our determination that performing procedures relating to the valuation of customer relationships acquired in the acquisition of DMC Power is a critical audit matter are (i) the significant judgment by management when developing the fair value estimate of the customer relationships acquired; (ii) a high degree of auditor judgment, subjectivity, and effort in performing procedures and evaluating management’s significant assumptions related to revenue growth rates, gross margin, attrition rate, and discount rate; and (iii) the audit effort involved the use of professionals with specialized skill and knowledge.
Addressing the matter involved performing procedures and evaluating audit evidence in connection with forming our overall opinion on the consolidated financial statements. These procedures included testing the effectiveness of controls relating to the acquisition accounting, including controls over management’s valuation of the customer relationships acquired. These procedures also included, among others (i) reading the purchase agreement; (ii) testing management’s process for developing the fair value estimate of the customer relationships acquired; (iii) evaluating the appropriateness of the multi-period excess earnings method used by management; (iv) testing the completeness and accuracy of the underlying data used in the multi-period excess earnings method; and (v) evaluating the reasonableness of the significant assumptions used by management related to revenue growth rates, gross margin, attrition rate, and discount rate. Evaluating management’s assumptions related to revenue growth rates and gross margin involved considering (i) the current and past performance of the DMC Power business; (ii) the consistency with external market and industry data; and (iii) whether the assumptions were consistent with evidence obtained in other areas of the audit. Professionals with specialized skill and knowledge were used to assist in evaluating (i) the appropriateness of the multi-period excess earnings method and (ii) the reasonableness of the attrition rate and discount rate assumptions.
/s/ PricewaterhouseCoopers LLP
Hartford, Connecticut
February 12, 2026
We have served as the Company’s auditor since at least 1961. We have not been able to determine the specific year we began serving as auditor of the Company.
HUBBELL INCORPORATED- Form 10-K
49
Consolidated Statement of Income
Year Ended December 31,
(in millions, except per share amounts)
2025
2024
2023
Net sales
$
5,844.6
$
5,628.5
$
5,372.9
Cost of goods sold
3,780.5
3,722.9
3,495.9
Gross profit
2,064.1
1,905.6
1,877.0
Selling & administrative expenses
855.3
812.5
849.6
Operating income
1,208.8
1,093.1
1,027.4
Loss on disposition of business (Note 3)
(0.4)
(5.3)
—
Interest expense, net
(64.1)
(73.8)
(36.7)
Other expense, net
(25.2)
(7.2)
(18.5)
Total other expense
(89.7)
(86.3)
(55.2)
Income before income taxes
1,119.1
1,006.8
972.2
Provision for income taxes
227.2
222.1
214.6
Net income
891.9
784.7
757.6
Less: Net income attributable to noncontrolling interest
(4.8)
(5.7)
(6.2)
Net income attributable to Hubbell Incorporated
$
887.1
$
779.0
$
751.4
Earnings per share
Basic earnings per share
$
16.63
$
14.49
$
13.98
Diluted earnings per share
$
16.54
$
14.39
$
13.89
See notes to consolidated financial statements.
50
HUBBELL INCORPORATED - Form 10-K
Consolidated Statement of Comprehensive Income
Year Ended December 31,
(in millions)
2025
2024
2023
Net income
$
891.9
$
784.7
$
757.6
Other comprehensive (loss) income:
Currency translation adjustment:
Foreign currency translation adjustments
48.7
(60.3)
22.9
Defined benefit pension and post-retirement plans, net of taxes of $(6.9), $4.6 and $(4.2)
23.6
(15.0)
10.2
Unrealized gain (loss) on investments, net of taxes of $(0.2), $0.0 and $(0.2)
0.7
(0.1)
0.6
Unrealized gains (losses) on cash flow hedges, net of taxes of $0.6, $(0.6) and $0.4
(1.3)
1.3
(0.9)
Other comprehensive (loss) income
71.7
(74.1)
32.8
Comprehensive income
963.6
710.6
790.4
Less: Comprehensive income attributable to noncontrolling interest
4.8
5.7
6.2
COMPREHENSIVE INCOME ATTRIBUTABLE TO HUBBELL
$
958.8
$
704.9
$
784.2
See notes to consolidated financial statements.
HUBBELL INCORPORATED- Form 10-K
51
Consolidated Balance Sheet
At December 31,
(in millions, except share and per share amounts)
2025
2024
ASSETS
Current Assets
Cash and cash equivalents
$
482.5
$
329.1
Short-term investments
15.4
15.9
Accounts receivable (net of allowances of $13.9 and $11.3)
856.9
756.0
Inventories, net
1,083.8
1,010.4
Other current assets
155.4
146.5
Total Current Assets
2,594.0
2,257.9
Property, Plant, and Equipment, net
841.2
726.6
Other Assets
Investments
98.4
84.9
Goodwill
3,060.8
2,500.8
Other intangible assets, net
1,394.3
1,080.0
Other long-term assets
240.1
197.5
TOTAL ASSETS
$
8,228.8
$
6,847.7
LIABILITIES AND EQUITY
Current Liabilities
Short-term debt
$
289.1
$
125.4
Accounts payable
570.5
541.7
Accrued salaries, wages and employee benefits
115.4
145.7
Accrued insurance
83.0
89.0
Other accrued liabilities
450.7
372.4
Total Current Liabilities
1,508.7
1,274.2
Long-term Debt
2,036.3
1,442.7
Other Non-Current Liabilities
825.9
720.2
TOTAL LIABILITIES
$
4,370.9
$
3,437.1
Commitments and Contingencies (see Note 15)
Hubbell Incorporated Shareholders’ Equity
Common stock, par value $0.01
Common stock - Authorized 200,000,000 shares, outstanding 53,253,805 and 53,759,976 shares
$
0.6
$
0.6
Additional paid-in capital
6.4
2.6
Retained earnings
4,155.7
3,779.5
Accumulated other comprehensive loss
(314.8)
(386.5)
Total Hubbell Incorporated Shareholders’ Equity
3,847.9
3,396.2
Noncontrolling interest
10.0
14.4
TOTAL EQUITY
3,857.9
3,410.6
TOTAL LIABILITIES AND EQUITY
$
8,228.8
$
6,847.7
See notes to consolidated financial statements.
52
HUBBELL INCORPORATED - Form 10-K
Consolidated Statement of Cash Flows
Year Ended December 31,
(in millions)
2025
2024
2023
Cash Flows from Operating Activities
Net income
$
891.9
$
784.7
$
757.6
Adjustments to reconcile net income to net cash provided by operating activities, net of acquisitions:
Depreciation and amortization
206.1
212.1
149.7
Deferred income taxes
11.0
2.0
(18.9)
Stock-based compensation
33.0
30.6
26.5
Loss on disposition of business
0.4
5.3
—
Loss on sale of assets
1.2
1.0
2.5
Changes in assets and liabilities, net of acquisitions:
(Increase) decrease in accounts receivable
(68.2)
22.2
(1.6)
Increase in inventories
(32.3)
(24.2)
(31.0)
Increase (decrease) in accounts payable
6.3
(13.6)
13.2
Increase (decrease) in current liabilities
33.3
(24.3)
(4.5)
Changes in other assets and liabilities, net
4.6
14.9
2.1
Contributions to qualified defined benefit pension plans
(41.4)
(1.3)
(20.0)
Other, net
(16.1)
(18.2)
5.2
NET CASH PROVIDED BY OPERATING ACTIVITIES
1,029.8
991.2
880.8
Cash Flows from Investing Activities
Capital expenditures
(155.1)
(180.4)
(165.7)
Acquisitions, net of cash acquired
(958.3)
5.9
(1,211.7)
Proceeds from disposal of business, net of cash
2.6
122.9
—
Purchases of available-for-sale investments
(25.2)
(21.0)
(25.4)
Proceeds from sales of available-for-sale investments
16.7
15.8
21.8
Other, net
24.7
(2.3)
0.8
NET CASH USED IN INVESTING ACTIVITIES
(1,094.6)
(59.1)
(1,380.2)
Cash Flows from Financing Activities
Issuance of long-term debt
1,000.0
—
600.0
Payment of long-term debt
(400.0)
(600.0)
—
Issuance of short-term debt
164.0
22.9
100.0
Payment of short-term debt
(0.3)
—
(2.2)
Payment of dividends
(286.6)
(267.3)
(245.5)
Debt issuance cost
(9.2)
—
(2.2)
Acquisition of common shares
(225.0)
(40.0)
(30.0)
Other
(39.3)
(39.0)
(31.6)
NET CASH PROVIDED BY (USED IN) FINANCING ACTIVITIES
203.6
(923.4)
388.5
Effect of foreign currency exchange rate changes on cash and cash equivalents
13.9
(16.4)
6.9
Increase (decrease) in cash, cash equivalents, and restricted cash
152.7
(7.7)
(104.0)
Cash and cash equivalents, beginning of year
329.1
336.1
440.5
Restricted cash, included in other assets, beginning of year
2.5
3.2
2.8
Less: Restricted cash, included in Other Assets
1.8
2.5
3.2
Cash and cash equivalents, end of year
$
482.5
$
329.1
$
336.1
See notes to consolidated financial statements.
HUBBELL INCORPORATED- Form 10-K
53
Consolidated Statement of Changes in Equity
(in millions, except per share amounts)
Common Stock
Additional Paid-in Capital
Retained Earnings
Accumulated Other Comprehensive Income (Loss)
Total Hubbell
Shareholders’
Equity
Non- controlling interest
BALANCE AT DECEMBER 31, 2022
$
0.6
$
—
$
2,840.6
$
(345.2)
$
2,496.0
$
9.7
Net income
—
—
751.4
—
751.4
6.2
Other comprehensive (loss) income
—
—
—
32.8
32.8
—
Stock-based compensation
—
26.9
—
—
26.9
—
Acquisition/surrender of common shares (1)
—
(21.4)
(36.6)
—
(58.0)
—
Cash dividends declared ($4.58 per share)
—
—
(246.0)
—
(246.0)
—
Dividends to noncontrolling interest
—
—
—
—
—
(3.6)
Directors deferred compensation
—
0.6
—
—
0.6
—
BALANCE AT DECEMBER 31, 2023
$
0.6
$
6.1
$
3,309.4
$
(312.4)
$
3,003.7
$
12.3
Net income
—
—
779.0
—
779.0
5.7
Other comprehensive (loss) income
—
—
—
(74.1)
(74.1)
—
Stock-based compensation
—
30.6
—
—
30.6
—
Acquisition/surrender of common shares (1)
—
(34.8)
(41.1)
—
(75.9)
—
Cash dividends declared ($4.98 per share)
—
—
(267.8)
—
(267.8)
—
Dividends to noncontrolling interest
—
—
—
—
—
(3.6)
Directors deferred compensation
—
0.7
—
—
0.7
—
BALANCE AT DECEMBER 31, 2024
$
0.6
$
2.6
$
3,779.5
$
(386.5)
$
3,396.2
$
14.4
Net income
—
—
887.1
—
887.1
4.8
Other comprehensive (loss) income
—
—
—
71.7
71.7
—
Stock-based compensation
—
33.0
—
—
33.0
—
Acquisition/surrender of common shares (1)
—
(28.4)
(223.9)
—
(252.3)
—
Cash dividends declared ($5.38 per share)
—
—
(287.0)
—
(287.0)
—
Dividends to noncontrolling interest
—
—
—
—
—
(9.2)
Directors deferred compensation
—
(0.8)
—
—
(0.8)
—
BALANCE AT DECEMBER 31, 2025
$
0.6
$
6.4
$
4,155.7
$
(314.8)
$
3,847.9
$
10.0
See notes to consolidated financial statements.
(1)For accounting purposes, the Company treats repurchased shares as constructively retired when acquired and accordingly charges the purchase price against Common Stock par value, Additional paid-in capital, to the extent available, and Retained earnings. The change in Retained earnings of $223.9 million, $41.1 million and $36.6 million in 2025, 2024 and 2023, respectively, reflects this accounting treatment.
54
HUBBELL INCORPORATED - Form 10-K
Notes to Consolidated Financial Statements
NOTE 1 Significant Accounting Policies
Basis of Presentation
The accompanying consolidated financial statements of the Company have been prepared in accordance with accounting principles generally accepted in the United States of America (“GAAP”).
Principles of Consolidation
The Consolidated Financial Statements include all wholly owned subsidiaries. All significant intercompany balances and transactions have been eliminated. The Company participates in two joint ventures that have been consolidated in accordance with the consolidation accounting guidance. An analysis is performed to determine which reporting entity, if any, has a controlling financial interest in a variable interest entity (“VIE”) with a primarily qualitative analysis. The qualitative analysis is based on identifying the party that has both the power to direct the activities that most significantly impact the VIE’s economic performance (the “power criterion”) and the obligation to absorb losses from or the right to receive benefits of the VIE that could potentially be significant to the VIE (the “losses/benefit criterion”). The party that meets both these criteria is deemed to have a controlling financial interest. The party with the controlling financial interest is considered to be the primary beneficiary and as a result is required to consolidate the VIE. The Company has a 50% interest in a joint venture in Hong Kong, established as Hubbell Asia Limited (“HAL”). The principal objective of HAL is to manage the operations of its wholly-owned manufacturing company in China. Under the accounting guidance, the Company is the primary beneficiary of HAL and as a result consolidates HAL.
This determination is based on the fact that HAL’s sole business purpose is to manufacture product exclusively for the Company (the power criterion) and the Company is financially responsible for ensuring HAL maintains a fixed operating margin (the losses/benefit criterion). The consolidation of HAL is not material to the Company’s consolidated financial statements.
Use of Estimates
The preparation of financial statements in accordance with GAAP requires management to make estimates and assumptions that affect the reported amounts in the Consolidated Financial Statements and accompanying Notes to Consolidated Financial Statements. Actual results could differ from the estimates that are used.
Revenue Recognition
The Company recognizes revenue when performance obligations identified under the terms of contracts with its customers are satisfied, which generally occurs, for products, upon the transfer of control in accordance with the contractual terms and conditions of the sale. The majority of the Company’s revenue associated with products is recognized at a point in time when the product is shipped to the customer, with a relatively small amount of transactions in the Utility Solutions segment recognized upon delivery of the product at the contractually specified destination.
The Company also has performance obligations, primarily within the Utility Solutions segment, that are recognized over time due to the customized nature of the product and the Company’s enforceable right to receive payment for work performed to date in the event of a cancellation. The Company uses an input measure to determine the extent of progress towards completion of the performance obligation, which the Company believes best depicts the transfer of control to the customer. Under this method, revenue recognition is based upon the ratio of costs incurred to date compared with estimated total costs to complete.
Revenue from service contracts and post-shipment performance obligations is approximately one percent of total annual consolidated net revenue and those service contracts and post-shipment obligations are primarily within the Utility Solutions segment. Revenue from service contracts and post-shipment performance obligations is recognized when or as those obligations are satisfied. The Company primarily offers assurance-type standard warranties that do not represent separate performance obligations and on occasion will separately offer and price extended warranties that are separate performance obligations for which the associated revenue is recognized over-time based on the extended warranty period. The Company records amounts billed to customers for reimbursement of shipping and handling costs within revenue. Shipping and handling costs associated with outbound freight after control over a product has transferred to a customer are accounted for as fulfillment costs and are included in cost of goods sold. Sales taxes and other usage-based taxes are excluded from revenue.
HUBBELL INCORPORATED- Form 10-K
55
Certain businesses require a portion of the transaction price to be paid in advance of transfer of control. Advance payments are not considered a significant financing component as they are received less than one year before the related performance obligations are satisfied. In addition, in the Utility Solutions segment, certain businesses offer annual maintenance service contracts that require payment at the beginning of the contract period. These payments are treated as a contract liability and are classified in Other accrued liabilities in the Consolidated Balance Sheet. Once control transfers to the customer and the Company meets the revenue recognition criteria, the deferred revenue is recognized in the Consolidated Statement of Income. The deferred revenue relating to the annual maintenance service contracts is recognized in the Consolidated Statement of Income on a straight line basis over the expected term of the contract.
The Company has certain arrangements that require us to estimate at the time of sale the amounts of variable consideration that should not be recorded as revenue as certain amounts are not expected to be collected from customers, as well as an estimate of the value of the product to be returned. The Company principally relies on historical experience, specific customer agreements and anticipated future trends to estimate these amounts at the time of shipment and to reduce the transaction price. These arrangements include sales discounts and allowances based on sales volumes, specific programs and special pricing allowances, and returned goods, as are customary in the electrical products industry. Customer returns have historically been approximately 1% of gross sales.
Shipping and Handling Costs
The Company records shipping and handling costs as part of Cost of goods sold in the Consolidated Statement of Income.
Foreign Currency Translation
The assets and liabilities of international subsidiaries are translated to U.S. dollars at exchange rates in effect at the end of the year, and income and expense items are translated at average exchange rates in effect during the year. The effects of exchange rate fluctuations on the translated amounts of foreign currency assets and liabilities are included as translation adjustments in Accumulated other comprehensive loss within Hubbell shareholders’ equity. Gains and losses from foreign currency transactions are included in results of operations.
Cash and Cash Equivalents
The carrying value of cash equivalents approximates fair value. Cash equivalents consist of highly liquid investments with original maturities to the Company of three months or less.
Investments
Investments in debt and equity securities are classified by individual security as available-for-sale, held-to-maturity or trading securities. Our available-for-sale securities, consisting of municipal bonds, are carried on the balance sheet at fair value with current period adjustments to carrying value recorded in Accumulated other comprehensive loss within Hubbell shareholders’ equity, net of tax. Realized gains and losses are recorded in income in the period of sale. The Company’s trading securities are carried on the balance sheet at fair value and consist primarily of debt and equity mutual funds. Gains and losses associated with these trading securities are reflected in the results of operations. The Company did not have any investments classified as held-to-maturity as of December 31, 2025 and 2024.
Accounts Receivable and Allowances
Trade accounts receivable are recorded at the invoiced amount and generally do not bear interest. The allowance for doubtful accounts is based on an estimated amount of probable credit losses in existing accounts receivable. The allowance is calculated based upon a combination of historical write-off experience, fixed percentages applied to aging categories and specific identification based upon a review of past due balances and problem accounts. Account balances are charged off against the allowance when it is determined that internal collection efforts should no longer be pursued. The Company also maintains a reserve for credit memos and cash discounts which are principally calculated based upon historical experience, specific customer agreements, and anticipated future trends.
Inventories
Inventories are stated at the lower of cost and net realizable value. The cost of foreign inventories and domestic inventories is determined utilizing first-in, first-out (FIFO) or average cost methods of inventory accounting. Reserves for excess and obsolete inventory are provided based on current assessments about future demand compared to on-hand quantities.
56
HUBBELL INCORPORATED - Form 10-K
In the second quarter of 2025, the Company elected to change its method of accounting for certain inventory in the U.S. from last in, first out ("LIFO") to first in, first out ("FIFO"). The change to FIFO is preferable because it provides a better matching of costs and revenues, conforms the Company's inventory to a single method of accounting and improves comparability with the Company's peers. The Company retrospectively applied this change in accounting principle to all prior periods resulting in a cumulative effect adjustment at January 1, 2023 to increase inventory by $178.2 million, to increase deferred income tax liabilities by $43.1 million and to increase retained earnings by $135.1 million (net of tax).
The table below illustrates the impacts for the years ended December 31, 2025, 2024 and 2023, respectively had the Company continued to report under the LIFO basis of accounting. The Consolidated Statement of Income at December 31, 2025, 2024 and 2023 have been retrospectively adjusted to reflect the change in accounting principle (in millions, except per share data):
For the Year Ended December, 31, 2025
For the Year Ended December, 31, 2024
For the Year Ended December, 31, 2023
As Computed Under LIFO
Impact of Change
As Reported
As Reported Under LIFO
Impact of Change FIFO
As Adjusted
As Reported Under LIFO
Impact of Change FIFO
As Adjusted
Consolidated Statement of Income
Net sales
$
5,844.6
$
—
$
5,844.6
$
5,628.5
$
—
$
5,628.5
$
5,372.9
$
—
$
5,372.9
Cost of goods sold
3,843.2
(62.7)
3,780.5
3,724.4
(1.5)
3,722.9
3,484.8
11.1
3,495.9
Operating Income
1,146.1
62.7
1,208.8
1,091.6
1.5
1,093.1
1,038.5
(11.1)
1,027.4
Income before income taxes
1,056.4
62.7
1,119.1
1,005.3
1.5
1,006.8
983.3
(11.1)
972.2
Provision for income taxes
212.3
14.9
227.2
221.8
0.3
222.1
217.3
(2.7)
214.6
Net income
844.1
47.8
891.9
783.5
1.2
784.7
766.0
(8.4)
757.6
Less: Net income attributable to noncontrolling interest
(4.8)
—
(4.8)
(5.7)
—
(5.7)
(6.2)
—
(6.2)
Net income attributable to Hubbell Incorporated
$
839.3
$
47.8
$
887.1
$
777.8
$
1.2
$
779.0
$
759.8
$
(8.4)
$
751.4
Earnings per share
Basic earnings per share
$
15.73
$
0.90
$
16.63
$
14.46
$
0.03
$
14.49
$
14.14
$
(0.16)
$
13.98
Diluted earnings per share
$
15.65
$
0.89
$
16.54
$
14.37
$
0.02
$
14.39
$
14.05
$
(0.16)
$
13.89
The Consolidated Balance Sheet at December 31, 2025 and December 31, 2024 have been retrospectively adjusted to reflect the change in accounting principle (in millions):
December 31, 2025
December 31, 2024
As Computed Under LIFO
Impact of Change
As Reported
As Reported Under LIFO
Impact of Change FIFO
As Adjusted
Condensed Balance Sheet
Inventories, net
$
852.5
$
231.3
$
1,083.8
$
841.8
$
168.6
$
1,010.4
Total Current Assets
2,362.7
231.3
2,594.0
2,089.3
168.6
2,257.9
Total Assets
7,997.5
231.3
8,228.8
6,679.1
168.6
6,847.7
Other Accrued Liabilities
422.6
28.1
450.7
372.4
—
372.4
Total Current Liabilities
1,480.6
28.1
1,508.7
1,274.2
—
1,274.2
Other Non-Current Liabilities
798.4
27.5
825.9
679.5
40.7
720.2
Total Liabilities
4,315.3
55.6
4,370.9
3,396.4
40.7
3,437.1
Hubbell Incorporated Shareholders' Equity
3,672.2
175.7
3,847.9
3,268.3
127.9
3,396.2
Total Equity
3,682.2
175.7
3,857.9
3,282.7
127.9
3,410.6
Total Liabilities and Equity
$
7,997.5
$
231.3
$
8,228.8
$
6,679.1
$
168.6
$
6,847.7
HUBBELL INCORPORATED- Form 10-K
57
The Consolidated Statement of Cash Flows for the years ended December 31, 2024 and December 31, 2023 have been retrospectively adjusted to reflect the change in accounting principle (in millions):
Year Ended December 31, 2024
Year Ended December 31, 2023
As Reported Under LIFO
Impact of Change FIFO
As Adjusted
As Reported Under LIFO
Impact of Change FIFO
As Adjusted
Condensed Statement of Cash Flows
Net income
$
783.5
$
1.2
$
784.7
$
766.0
$
(8.4)
$
757.6
Adjustments to reconcile net income to net cash provided by operating activities:
Deferred income taxes
1.7
0.3
2.0
(16.2)
(2.7)
(18.9)
Changes in assets and liabilities, excluding effects of acquisitions:
(Increase) Decrease in inventories, net
(22.7)
(1.5)
(24.2)
(42.1)
11.1
(31.0)
Net cash provided by operating activities
$
991.2
$
—
$
991.2
$
880.8
$
—
$
880.8
Property, Plant, and Equipment
Property, plant, and equipment values are stated at cost less accumulated depreciation and are depreciated over their estimated useful lives. Maintenance and repair expenditures that do not significantly increase the life of an asset are charged to expense when incurred. Leasehold improvements are amortized over the shorter of their economic lives or the lease term. Gains and losses arising on the disposal of property, plant and equipment are included in Operating income in the Consolidated Statement of Income.
Capitalized Computer Software Costs
Capitalized computer software costs, net of amortization, were $9.7 million and $6.3 million at December 31, 2025 and 2024, respectively. This balance is reflected in Other long-term assets in the Consolidated Balance Sheet. Capitalized computer software is for internal use and costs primarily consist of purchased materials, external services and salary costs for personnel dedicated to the projects. Software is amortized on a straight-line basis over appropriate periods, generally between three and five years. The Company recorded amortization expense of $3.8 million in 2025, $3.6 million in 2024 and $4.3 million in 2023 relating to capitalized computer software.
Goodwill and Other Intangible Assets
Goodwill represents purchase price in excess of fair values of the underlying net assets of acquired companies. Indefinite-lived intangible assets and goodwill are subject to annual impairment testing using the specific guidance and criteria described in the accounting guidance. The Company performs its goodwill impairment testing as of April 1st of each year, unless circumstances dictate the need for more frequent assessments. The accounting guidance provides entities with an option of performing a qualitative assessment (a “step-zero” test) before performing a quantitative analysis. If the entity determines, on the basis of certain qualitative factors, that it is more-likely-than-not that the goodwill is not impaired, the entity would not need to proceed to the quantitative goodwill impairment testing process as prescribed in the guidance. For each of the Company’s reporting units in 2025, the Company elected to utilize the quantitative goodwill impairment testing process, as permitted in the accounting guidance, by comparing the estimated fair value of the Company’s reporting units to their carrying values. If the fair value of the reporting unit exceeds its carrying value, no impairment exists.
Goodwill impairment testing requires judgment, including the identification of reporting units, assigning assets and liabilities to reporting units and determining the fair value of each reporting unit. Significant judgment is required to estimate the fair value of reporting units, including estimating future cash flows, determining appropriate discount rates and other assumptions, including assumptions about secular economic and market conditions. The Company uses internal discounted cash flow models to estimate fair value. These cash flow estimates are derived from historical experience, third party end market data, and future long-term business plans and include assumptions on future sales growth, gross margin, operating margin, terminal growth rate, and the application of an appropriate discount rate. Significant changes in these estimates and assumptions could materially affect the determination of fair value and/or goodwill impairment for each reporting unit. The Company believes that its estimated aggregate fair value of its reporting units is reasonable when compared to the Company’s market capitalization on the valuation date.
The Company completed its annual goodwill impairment test as of April 1, 2025. The impairment testing resulted in implied fair values for each reporting unit that significantly exceeded such reporting unit’s carrying value, including goodwill. Additionally, the Company did not have any reporting units with zero or negative carrying amounts. The Company has not recorded any goodwill impairments since the initial adoption of the accounting guidance in 2002.
58
HUBBELL INCORPORATED - Form 10-K
The organizational changes described in Note 2 - Revenue resulted in a change in the Company’s reporting units within the Electrical Solutions segment. As a result of the change in reporting units, the Company performed an interim goodwill impairment assessment during the third quarter of 2025, for the reporting units within the Electrical Solutions segment. Because the changes did not affect the Utility Solutions segment, no interim goodwill impairment assessment was required for that segment. For this interim assessment, the Company elected to utilize the quantitative goodwill impairment testing process, as permitted in the accounting guidance, by comparing the estimated fair value of the reporting units to their carrying values. The interim impairment testing resulted in implied fair values for each reporting unit that significantly exceeded such reporting unit’s carrying value, including goodwill.
The Company’s intangible assets consist primarily of customer relationships, tradenames, developed technology and patents. Intangible assets with definite lives are amortized over periods generally ranging from 5-30 years. The Company amortizes intangible assets with definite lives using either an accelerated method that reflects the pattern in which economic benefits of the intangible assets are consumed and results in higher amortization in the earlier years of the assets’ useful life, or using a straight line method. Approximately 90% of the gross value of definite-lived intangible assets follow an accelerated amortization method. These definite lived intangibles are tested for impairment whenever events or circumstances indicate that the carrying amount of an asset (asset group) may not be recoverable. An impairment loss is recognized when the carrying amount of an asset exceeds the estimated undiscounted cash flows used in determining the fair value of the asset. The Company did not record any material impairments related to its definite lived intangible assets in 2025, 2024 or 2023. The Company also has some tradenames that are considered to be indefinite-lived intangible assets. These indefinite-lived intangible assets are not amortized and are tested for impairment annually, unless circumstances dictate the need for more frequent assessment.
The identification and measurement of impairment of indefinite-lived intangible assets involves either an assessment of qualitative factors to determine whether events or circumstances indicate that it is more-likely-than-not that an indefinite-lived intangible asset is impaired or a quantitative assessment whereby the estimated fair value of each indefinite-lived intangible asset is compared to its carrying value. If it is more-likely-than-not that the asset is impaired, the estimated fair value of the indefinite lived intangibles will be determined using discounted cash flow estimates. If the carrying value of these assets exceeds the estimated fair value, the carrying value will be reduced to the estimated fair value.
For the Company’s annual impairment test as of April 1, 2025, the Company elected to utilize the quantitative impairment testing process as permitted in the accounting guidance. The estimated fair value was determined utilizing an income approach (relief from royalty method). Significant judgment is required to estimate the fair value of the indefinite-lived intangible assets, including assumptions for future revenues, discount rates, royalty rates, and other assumptions, including assumptions about secular economic and market conditions. Significant changes in these estimates and assumptions could affect the determination of fair value and/or impairment for each indefinite-lived intangible asset. As of April 1, 2025, the impairment testing resulted in estimated fair values for each indefinite-lived intangible asset that significantly exceeded the carrying values and there were no indefinite-lived intangible assets at risk of failing the quantitative impairment test.
The Company did not record any impairments related to indefinite-lived intangible assets in 2025, 2024 and 2023.
Other Long-Lived Assets
The Company reviews depreciable long-lived assets for impairment whenever events or changes in circumstances indicate that the carrying amount may not be fully recoverable. If such a change in circumstances occurs, the related estimated future undiscounted cash flows expected to result from the use of the asset group and its eventual disposition is compared to the carrying amount. If the sum of the expected cash flows is less than the carrying amount, an impairment charge is recorded. The impairment charge is measured as the amount by which the carrying amount exceeds the fair value of the asset. The fair value of impaired assets is determined using expected cash flow estimates, quoted market prices when available and appraisals as appropriate. The Company did not record any material impairment charges in 2025, 2024 or 2023.
Leases
We determine if an arrangement is a lease at inception. Operating leases are included as ROU assets within other long-term assets, and lease liabilities are included as other accrued liabilities, and other non-current liabilities in our Consolidated Balance Sheets. Finance leases are included in property, plant, and equipment, net, other accrued liabilities, and other non-current liabilities. The Company’s finance leases are immaterial.
ROU assets represent our right to use an underlying asset for the lease term and lease liabilities represent our obligation to make lease payments arising from the lease. ROU assets and liabilities are recognized at the lease commencement date based on the present value of lease payments over the lease term. As most of our leases do not provide an implicit rate, we use our incremental borrowing rate based on the information available at the commencement date in determining the present value of lease payments. We use an implicit rate when readily determinable. For leases existing as of January 1, 2019, we have elected to use the remaining lease term as of the adoption date in determining the incremental borrowing rate. Our determination of the lease term may include options to extend or terminate the lease when it is reasonably certain that we will exercise that option.
HUBBELL INCORPORATED- Form 10-K
59
We have lease agreements with lease and non-lease components, which are generally accounted for separately. Additionally, for our vehicle leases, we apply a portfolio approach regarding the assumed lease term.
Accrued Insurance
The Company retains a significant portion of the risks associated with workers’ compensation, medical, automobile and general liability insurance. The Company estimates self-insurance liabilities using a number of factors, including historical claims experience, demographic factors, and other actuarial assumptions. The accrued liabilities associated with these programs are based on the Company’s estimate of the ultimate costs to settle known claims as well as claims incurred but not reported as of the balance sheet date. The Company periodically reviews the assumptions with a third party actuary to determine the adequacy of these self-insurance reserves.
Accrued Warranty
The Company offers product warranties which cover defects on most of its products. These warranties primarily apply to products that are properly installed, maintained and used for their intended purposes. The Company accrues estimated warranty costs at the time of sale. Estimated warranty expenses, recorded in cost of goods sold, are based upon historical information such as past experience, product failure rates, or the estimated number of units to be repaired or replaced. Adjustments are made to the product warranty accrual as claims are incurred, additional information becomes known or as historical experience indicates.
Income Taxes
The Company operates within multiple taxing jurisdictions and is subject to audit in these jurisdictions. The IRS and other tax authorities routinely examine the Company’s tax returns. These audits can involve complex issues which may require an extended period of time to resolve. The Company makes adequate provisions for best estimates of exposures on previously filed tax returns. Deferred income taxes are recognized for the tax consequence of differences between financial statement carrying amounts and the tax basis of assets and liabilities by applying the currently enacted statutory tax rates in accordance with the accounting guidance for income taxes. The effect of a change in statutory tax rates is recognized in the period that includes the enactment date. Additionally, deferred tax assets are required to be reduced by a valuation allowance if it is more-likely-than-not that a portion or all of the deferred tax asset will not be realized. The Company uses factors to assess the likelihood of realization of deferred tax assets such as the forecast of future taxable income and available tax planning that could be implemented to realize the deferred tax assets.
In addition, the accounting guidance prescribes a recognition threshold and measurement attribute for the financial statement recognition and measurement of the tax position taken or expected to be taken in a tax return. For any amount of benefit to be recognized, it must be determined that it is more-likely-than-not that a tax position will be sustained upon examination by taxing authorities based on the technical merits of the position. The amount of benefit to be recognized is based on the Company’s assertion of the most likely outcome resulting from an examination, including resolution of any related appeals or litigation processes. Companies are required to reflect only those tax positions that are more-likely-than-not to be sustained. See Note 13 — Income Taxes for additional information.
Research and Development
Research and development expenditures represent costs to discover and/or apply new knowledge in developing a new product, process, or in bringing about a significant improvement to an existing product or process. Research and development expenses are recorded as a component of Cost of goods sold. Expenses for research and development were approximately 1% of Net Sales in 2025, 1% in 2024, and 2% in 2023.
Government Assistance
The Company records amounts received from government entities as a reduction of the associated expense. Amounts received related to depreciable assets are recognized as a reduction to depreciation expense. The total impact of government assistance was not material to the Company in 2025, 2024, and 2023.
60
HUBBELL INCORPORATED - Form 10-K
Retirement Benefits
The Company maintains various defined benefit pension plans for some of its U.S. and foreign employees. The accounting guidance for retirement benefits requires the Company to recognize the funded status of its defined benefit pension and postretirement plans as an asset or liability in the Consolidated Balance Sheet. Gains or losses, prior service costs or credits, and transition assets or obligations that have not yet been included in net periodic benefit cost as of the end of the year are recognized as components of Accumulated other comprehensive loss, net of tax, within Hubbell shareholders’ equity. The Company’s policy is to fund pension costs within the ranges prescribed by applicable regulations. In addition to providing defined benefit pension benefits, the Company provides health care and life insurance benefits for some of its active and retired employees. The Company’s policy is to fund these benefits through insurance premiums or as actual expenditures are made. See also Note 11 — Retirement Benefits.
Earnings Per Share
Restricted stock granted by the Company is considered a participating security since it contains a non-forfeitable right to dividends. As a result, the earnings per share accounting guidance requires the Company to use the two-class method for calculating earnings per share. The two-class method is an earnings allocation formula that determines earnings per share for common stock and participating securities. Basic earnings per share is calculated as net income available to common shareholders divided by the weighted average number of shares of common stock outstanding. Earnings per diluted share is calculated as net income available to common shareholders divided by the weighted average number of shares outstanding of common stock plus the incremental shares outstanding assuming the exercise of dilutive stock appreciation rights and performance shares. See also Note 18 — Earnings Per Share.
Stock-Based Compensation
The Company recognizes the grant-date fair value of all stock-based awards on a straight-line basis over their respective requisite service periods (generally equal to an award’s vesting period). A stock-based award is considered vested for expense attribution purposes when the retention of the award is no longer contingent on providing subsequent service. Accordingly, the Company generally recognizes compensation cost immediately for awards granted to retirement-eligible individuals or over the period from the grant date to the date retirement eligibility is achieved, if less than the stated vesting period. The expense is recorded in Cost of goods sold and Selling & Administrative expense in the Consolidated Statement of Income based on the recipients’ respective functions within the organization.
The Company records deferred tax assets for awards that will result in deductions on its tax returns, based upon the amount of compensation cost recognized and the statutory tax rate in the jurisdiction in which it will receive a deduction. See also Note 17 — Stock-Based Compensation.
Recently Adopted Accounting Pronouncements
In September 2022, the FASB issued ASU 2022-04, “Liabilities - Supplier Finance Programs (Subtopic 405-50: Disclosure of Supplier Finance Program Obligations)”, which the Company adopted in the first quarter of 2023, with the exception of the rollforward information, which was effective for the Company in the first quarter of 2024.
Payment Services Arrangements
The Company has ongoing agreements with financial institutions to facilitate the processing of vendor payables (“Payment Services Arrangement”). Under these agreements, the Company pays the financial institution the stated amount of confirmed invoices from participating suppliers on their original maturity date. The terms of the vendor payables are not affected by vendors participating in these agreements. As a result, the amounts owed are presented as accounts payable in the Company’s Consolidated Balance Sheet, of which $95.5 million and $101.9 million was outstanding at December 31, 2025 and December 31, 2024, respectively. Either party may terminate the agreements with 30 days written notice. Cash flows under the program are reported in operating activities in the Company’s Consolidated Statement of Cash Flows.
HUBBELL INCORPORATED- Form 10-K
61
The rollforward of the Company’s outstanding obligations confirmed as valid under the Payment Services Arrangements supplier finance program for the year ended December 31, 2025 and December 31, 2024, is as follows:
(in millions)
Year Ended December 31, 2025
Year Ended December 31, 2024
Confirmed obligations outstanding at the beginning of the period
$
101.9
$
101.3
Invoices confirmed during the period
322.9
348.7
Confirmed invoices paid during the period
(329.3)
(348.1)
Confirmed obligations outstanding at the end of the period
$
95.5
$
101.9
Commercial Card Program
In 2021, the Company entered into an agreement with a financial institution that allows participating suppliers to receive payment for outstanding invoices through a commercial purchasing card sponsored by a financial institution. The Company is required to settle such outstanding invoices through a consolidated payment to the financial institution 15 days after the commercial card billing cycle. The Company receives the benefit of extended payment terms and a rebate from the financial institution. Either party may terminate the agreement with 60 days written notice. The amount outstanding to the financial institution is presented as short-term debt in the Company’s Consolidated Balance Sheet, of which, $2.1 million and $2.4 million was outstanding at December 31, 2025 and December 31, 2024, respectively. Cash flows under the program are reported in financing activities in the Company’s Consolidated Statement of Cash Flows.
The rollforward of the Company’s outstanding obligations confirmed as valid under the commercial card supplier finance program for the year ended December 31, 2025 and December 31, 2024, is as follows:
(in millions)
Year Ended December 31, 2025
Year Ended December 31, 2024
Confirmed obligations outstanding at the beginning of the period
$
2.4
$
2.0
Invoices confirmed during the period
21.8
24.7
Confirmed invoices paid during the period
(22.1)
(24.3)
Confirmed obligations outstanding at the end of the period
$
2.1
$
2.4
In November 2023, the FASB issued ASU No. 2023-07, “Segment Reporting-Improvements to Reportable Segment Disclosures”, which adds a requirement for public entities to disclose its significant segment expense categories and amounts for each reportable segment for all periods presented. This information is required to be disclosed at both interim and annual periods. In addition, this ASU requires a public entity to disclose the title and position of the Chief Operating Decision Maker (“CODM”) in the consolidated financial statements. Public entities are also required to disclose how the CODM uses each reported measure of segment profit or loss to assess performance and allocate resources to the segments. The ASU is effective for public entities for fiscal years beginning after December 15, 2023, and interim periods in fiscal years beginning after December 15, 2024. The Company included the applicable disclosures within Note 20 - Industry Segments and Geographic Area Information.
In December 2023, the FASB issued ASU No. 2023-09, “Income Taxes: Improvements to Income Tax Disclosures”, which enhances the disaggregation of income tax disclosures. The ASU requires public entities on an annual basis to disclose specific categories in the rate reconciliation and provide additional information for reconciling items that meet a quantitative threshold equal to or greater than 5%. Public entities are required to provide an explanation of certain rate reconciling items if not otherwise evident, such as the nature, causes and judgment used to categorize the item. The ASU also requires disclosure of income taxes paid (net of refund received) detailed by federal, state/local and foreign, and amounts paid to individual jurisdictions that are equal or greater than 5% of total income taxes paid. The ASU is effective for public entities for fiscal years beginning after December 15, 2024 and for interim periods for fiscal years beginning after December 15, 2025. The Company adopted the ASU on a retrospective basis with the applicable disclosures included within Note 13 - Income Taxes.
Recently Issued Accounting Pronouncements Not Yet Adopted
In November 2024, the FASB issued ASU 2024-03,“Disaggregation of Income Statement Expenses (DISE),” which requires additional disclosure of the nature of expenses included in the income statement. The standard requires disclosures about specific types of expenses included in the expense captions presented on the face of the income statement as well as disclosures about selling expenses. The ASU is effective for annual reporting periods beginning after December 15, 2026, and interim reporting periods beginning after December 15, 2027. The requirements are required to be adopted prospectively with the option for retrospective application. The company is assessing the impact of adopting this standard on its financial statements and disclosures.
62
HUBBELL INCORPORATED - Form 10-K
In September 2025, the FASB issued ASU 2025-06, "Targeted Improvements to the Accounting for Internal-Use Software", which modernizes the accounting for software costs. The ASU is effective for public entities for fiscal years beginning after December 15, 2027, and interim periods for fiscal years beginning after December 15, 2027. The Company is assessing the impact of adopting this standard on its financial statements and disclosures.
In October 2025, the FASB issued ASU 2025-10, "Accounting for Government Grants Received by Business Entities", which establishes the accounting for business entities on the recognition, measurement, presentation, and disclosure of government grants. The ASU is effective for public entities for fiscal years beginning after December 15, 2028, and interim periods for fiscal years beginning after December 15, 2029. The Company is assessing the impact of adopting this standard on its financial statements and disclosures.
NOTE 2Revenue
The Company recognizes revenue when performance obligations identified under the terms of contracts with its customers are satisfied, which generally occurs, for products, upon the transfer of control in accordance with the contractual terms and conditions of the sale. Approximately two-thirds of the Company’s Net sales are to distributors who then sell directly into our end markets. Within the Utility Solutions segment, our businesses sell to distributors, with the majority of sales to the utility end markets and also directly into transmission and distribution utility markets. The majority of the Company’s revenue associated with products is recognized at a point in time when the product is shipped to the customer, with a relatively small amount of transactions, primarily in the Utility Solutions segment, recognized upon delivery of the product at the destination.
The Company also has performance obligations, primarily within the Utility Solutions segment, that are recognized over time due to the customized nature of the product and the Company’s enforceable right to receive payment for work performed to date in the event of a cancellation. The Company uses an input measure to determine the extent of progress towards completion of the performance obligation, which the Company believes best depicts the transfer of control to the customer. Under this method, revenue recognition is primarily based upon the ratio of costs incurred to date compared with estimated total costs to complete.
Revenue from service contracts and post-shipment performance obligations is recognized when or as those obligations are satisfied. The Company primarily offers assurance-type standard warranties that do not represent separate performance obligations and on occasion will separately offer and price extended warranties that are separate performance obligations for which the associated revenue is recognized over-time based on the extended warranty period. The Company records amounts billed to customers for reimbursement of shipping and handling costs within revenue. Shipping and handling costs associated with outbound freight after control over a product has transferred to a customer are accounted for as fulfillment costs and are included in cost of goods sold. Sales taxes and other usage-based taxes are excluded from revenue.
Certain businesses require a portion of the transaction price to be paid in advance of transfer of control. Advance payments are not considered a significant financing component as they are received less than one year before the related performance obligations are satisfied. In addition, in the Utility Solutions segment, certain businesses offer annual maintenance service contracts that require payment at the beginning of the contract period. These payments are treated as a contract liability and are classified in Other accrued liabilities in the Consolidated Balance Sheets. Once control transfers to the customer and the Company meets the revenue recognition criteria, the deferred revenue is recognized in the Consolidated Statements of Income. The deferred revenue relating to the annual maintenance service contracts is recognized in the Consolidated Statements of Income on a straight-line basis over the expected term of the contract.
The following table presents disaggregated revenue by business group. In January 2024, we internally reorganized certain businesses within our Utility Solutions segment, and in July 2024 and September 2025, we internally reorganized certain businesses within our Electrical Solutions segment. Those re-organizations streamline the organization and align the organization to better serve our customers. These changes had no impact to our reportable segments. In conjunction with these changes, prior period amounts have been reclassified to conform to the current organizational structure. In addition, the residential lighting business, included in the Retail and Builder section below, was sold in the first quarter of 2024.
HUBBELL INCORPORATED- Form 10-K
63
Twelve Months Ended December 31,
(in millions)
2025
2024
2023
Net sales
Grid Infrastructure
$
2,748.2
$
2,531.3
$
2,259.2
Grid Automation
924.1
1,069.4
1,002.5
Total Utility Solutions
$
3,672.3
$
3,600.7
$
3,261.7
Electrical Products
$
885.2
$
835.3
$
823.0
Industrial
1,287.1
1,171.3
1,101.1
Retail and Builder
—
21.2
187.1
Total Electrical Solutions
$
2,172.3
$
2,027.8
$
2,111.2
TOTAL
$
5,844.6
$
5,628.5
$
5,372.9
The following table presents disaggregated third-party Net sales by geographic location (on a geographic basis, the Company defines “international” as operations based outside of the United States and its possessions):
Twelve Months Ended December 31,
(in millions)
2025
2024
2023
Net sales
United States
$
3,518.9
$
3,428.2
$
3,090.7
International
153.4
172.5
171.0
Total Utility Solutions
$
3,672.3
$
3,600.7
$
3,261.7
United States
$
1,892.4
$
1,731.1
$
1,831.7
International
279.9
296.7
279.5
Total Electrical Solutions
$
2,172.3
$
2,027.8
$
2,111.2
TOTAL
$
5,844.6
$
5,628.5
$
5,372.9
Contract Balances
Our contract liabilities consist of advance payments for products as well as deferred revenue on service obligations and extended warranties. The current portion of deferred revenue is included in Other accrued liabilities and the non-current portion of deferred revenue is included in Other non-current liabilities in the Consolidated Balance Sheet.
Contract liabilities were $174.6 million as of December 31, 2025 compared to $148.0 million as of December 31, 2024. The $26.6 million increase in our contract liabilities balance was primarily due to a $115.6 million net increase in current year deferrals primarily due to timing of advance payments on certain orders, partially offset by the recognition of $89.0 million in revenue related to amounts that were recorded in contract liabilities at January 1, 2025. The ending balance of contract assets was $48.2 million and $38.0 million as of December 31, 2025, and December 31, 2024, respectively, which primarily relates to performance obligations satisfied prior to payment for Systems Control that are recorded in Other current assets in the Consolidated Balance Sheets. Credit losses recognized on our receivables and contract assets were immaterial in the twelve months ended December 31, 2025. See Note 1 – Significant Accounting Policies in the Notes to Consolidated Financial Statements for additional information.
Unsatisfied Performance Obligations
The Company has elected the practical expedient to disclose only the value of unsatisfied performance obligations for contracts with an original expected length greater than one year. As of December 31, 2025, the Company had approximately $20 million of unsatisfied performance obligations for contracts with an original expected length of greater than one year, primarily relating to long-term contracts of the Aclara business (within the Utility Solutions segment) to deliver and install meters, metering communications and grid monitoring sensor technology. The Company expects that substantially all of the unsatisfied performance obligations will be completed and recognized over the next 2 years.
HUBBELL INCORPORATED- Form 10-K
64
NOTE 3 Business Acquisitions and Dispositions
2025 Acquisitions
In the first quarter of 2025, the Company acquired all of the issued and outstanding equity of Alliance USAcqCo 2, Inc., a Delaware Corporation (“Ventev”) for approximately $73 million, net of cash acquired, subject to customary purchase price adjustments. Ventev is a leading manufacturer and provider of a complete ecosystem of solutions to power, protect, and connect wireless networks. The Ventev business has been added to the Electrical Solutions segment. We have recognized intangible assets of $34.5 million and goodwill of $40.0 million as a result of the acquisition. The $34.5 million of intangible assets consists primarily of customer relationships and trade names and will be amortized over a weighted average period of approximately 17 years.
In the third quarter of 2025, the Company acquired all of the issued and outstanding equity of Nicor, Inc., a Texas corporation ("Nicor") for approximately $56 million, net of cash acquired, subject to customary purchase price adjustments. Nicor designs and manufactures water metering endpoint solutions to integrate and optimize advanced metering infrastructure networks. Such solutions include polymer meter box lids and covers. Nicor has been added to the Utility Solutions segment. We have recognized intangible assets of $18.6 million and goodwill of $30.3 million as a result of the acquisition. The $18.6 million of intangible assets consists primarily of customer relationships and a trade name and will be amortized over a weighted average period of approximately 18 years.
On October 1, 2025, the Company acquired all of the issued and outstanding equity of Power Rose Acquisition, Inc., a Delaware corporation ("Power Rose" and together with its subsidiaries, "DMC Power") for approximately $829 million, net of cash acquired, subject to customary purchase price adjustments. DMC Power is a provider of swaged connection systems and tooling for utility substation and transmission markets. DMC Power has been added to the Utility Solutions segment. We have recognized intangible assets of $364.0 million and goodwill of $468.9 million as a result of the acquisition. The $364.0 million of intangible assets consists primarily of $290.0 million of customer relationships, with the remaining $74.0 million consisting of developed technology, trade names and backlog. The intangible assets will be amortized over a weighted average period of approximately 21 years.
The Company financed the acquisition of DMC Power with net proceeds from borrowings under a new unsecured term loan facility in the aggregate principal amount of $600.0 million and issuances of commercial paper.
We determined the preliminary fair values of the customer relationships intangible assets using an multi-period excess earnings method. The significant assumptions used in determining the preliminary fair values of the customer relationships intangible assets included revenue growth rates, gross margin, attrition rate, and discount rate. We determined the preliminary fair values of the developed technology, trade name and backlog intangible assets using an income approach. Accordingly, the fair value measurement of the customer relationships intangible assets, developed technology, trade name, and backlog intangible assets are classified in Level 3 of the fair value hierarchy.
These business acquisitions have been accounted for as business combinations and have resulted in the recognition of goodwill. The goodwill relates to a number of factors implied in the purchase price, including the future earnings and cash flow potential of the business as well as the complementary strategic fit and resulting synergies that such business acquisition brings to the Company’s existing operations. The goodwill related to the Ventev, Nicor and DMC Power acquisitions is not deductible for tax purposes.
Allocation of Consideration Transferred to Net Assets Acquired
The following table presents the preliminary determination of the fair values of identifiable assets acquired and liabilities assumed from the Company's 2025 acquisitions of Ventev, Nicor and DMC Power. The final determination of the fair value of certain assets and liabilities will be completed within the applicable one year measurement period as required by FASB ASC Topic 805, “Business Combinations.” As the Company finalizes the fair values of assets acquired and liabilities assumed, additional purchase price adjustments may be recorded during the measurement period. Fair value estimates are based on a complex series of judgments about future events and uncertainties and rely heavily on estimates and assumptions. The judgments used to determine the estimated fair value assigned to each class of assets acquired and liabilities assumed, as well as asset lives, can materially impact the Company's results of operations and financial position. The finalization of the purchase accounting assessment may result in a change in the valuation of assets acquired and liabilities assumed and may have a material impact on the Company's results of operations and financial position.
HUBBELL INCORPORATED- Form 10-K
65
The following table summarizes the preliminary fair values of the assets acquired and liabilities assumed at the date of acquisition for the Company's 2025 acquisitions of Ventev, Nicor and DMC Power (in millions):
Accounts receivable
$
32.3
Inventories
47.6
Other current assets
1.9
Property, plant and equipment
54.7
Other non-current assets
5.4
Intangible assets
417.1
Accounts payable
(12.6)
Other accrued liabilities
(16.1)
Deferred tax liabilities, net
(106.5)
Other non-current liabilities
(4.7)
Goodwill
539.2
Total Estimate of Consideration Transferred, Net of Cash Acquired
$
958.3
The Condensed Consolidated Financial Statements include the results of operations of the acquired businesses from their respective dates of acquisition. Pro forma information related to these acquisitions has not been included because the impact of net sales and earnings related to these acquisitions for the twelve months ended December 31, 2025 was not material to the Company’s condensed consolidated results of operations.
Cash used for the acquisition of businesses, net of cash acquired as reported in the Consolidated Statement of Cash Flows for the year ended December 31, 2025 is $958.3 million.
The purchase price allocation to identifiable intangible assets acquired for all of the 2025 acquisitions is as follows (in millions, except useful life amounts):
Estimated Fair Value
Weighted Average Estimated Useful Life
Patents, tradenames and trademarks
$
19.2
20
Customer relationships
338.5
23
Developed technology
55.0
10
Backlog
4.4
2
Total
$
417.1
Customer relationships and developed technology intangible assets acquired are amortized using an accelerated method that reflects the pattern in which economic benefits of the intangible assets are consumed and results in higher amortization in the earlier years of the asset’s useful life.
2023 Acquisitions
In the fourth quarter of 2023 the Company acquired Northern Star Holdings, Inc., (“Systems Control”) for approximately $1.1 billion, net of cash acquired, subject to customary purchase price adjustments. Systems Control is a manufacturer of substation control and relay panels, as well as turnkey substation control building solutions. This business is reported in the Utility Solutions segment. We have recognized intangible assets of $573.9 million and goodwill of $517.9 million as a result of this acquisition. The goodwill is attributable primarily to expected synergies, expanded market opportunities, and other expected benefits that the Company believes will result from combining its operations with the operations of Systems Control. For tax purposes, $138.8 million of the Systems Control historical goodwill is deductible. The incremental goodwill created as a result of the acquisition is not deductible for tax purposes. The intangible assets of $573.9 million consist primarily of customer relationships, tradenames and backlog and will be amortized over a weighted average period of approximately 19 years.
In the fourth quarter of 2023, the Company acquired all of the issued and outstanding shares of Indústria Eletromecânica Balestro Ltda. (“Balestro”) for a cash purchase price of approximately $87 million, net of cash acquired, subject to customary purchase price adjustments. Balestro is a company headquartered in Mogi Mirim, São Paulo, Brazil and designs, manufactures, and delivers top quality products for the electrical utility industry in Brazil and other countries in Latin America, as well as other parts of the world. This business is reported in the Utility Solutions segment. We have recognized intangible assets of $5.6 million and goodwill of $64.5 million as a result of this acquisition. The intangible assets of $5.6 million consist primarily of customer relationships, tradenames and backlog and will be amortized over a weighted average period of approximately 21 years. The goodwill is not expected to be deductible for tax purposes.
HUBBELL INCORPORATED- Form 10-K
66
In the second quarter of 2023, the Company acquired all of the issued and outstanding membership interests of EI Electronics LLC (“EIG”) for a cash purchase price of approximately $60 million, net of cash acquired, subject to customary purchase price adjustments. EIG offers fully integrated energy management and power quality monitoring solutions for the electric utility and commercial & industrial markets. This business is reported in the Utility Solutions segment. We have recognized intangible assets of $28.7 million and goodwill of $23.3 million as a result of this acquisition. The intangible assets of $28.7 million consist primarily of customer relationships, developed technology, a trade name and backlog and will be amortized over a weighted average period of approximately 14 years. All of the goodwill is expected to be deductible for tax purposes.
These business acquisitions have been accounted for as business combinations and have resulted in the recognition of goodwill. The goodwill relates to a number of factors implied in the purchase prices, including the future earnings and cash flow potential of the businesses as well as the complementary strategic fit and resulting synergies that such business acquisitions bring to the Company’s existing operations.
Allocation of Consideration Transferred to Net Assets Acquired
The following table presents the final determination of the fair value of identifiable assets acquired and liabilities assumed from the Company’s 2023 acquisitions. Fair value estimates are based on a complex series of judgments about future events and uncertainties and rely heavily on estimates and assumptions. The judgments used to determine the estimated fair value assigned to each class of assets acquired and liabilities assumed, as well as asset lives, can materially impact the Company’s results of operations (in millions):
Accounts receivable
$
71.5
Inventories
84.9
Other current assets
49.6
Property, plant and equipment
31.6
Other non-current assets
2.8
Intangible assets
608.2
Accounts payable
(17.5)
Other accrued liabilities
(85.1)
Deferred tax liabilities, net
(134.0)
Other non-current liabilities
(11.9)
Goodwill
605.7
Total Estimate of Consideration Transferred, Net of Cash Acquired
$
1,205.8
Cash used for the acquisition of businesses, net of cash acquired as reported in the Consolidated Statement of Cash Flows for the year ended December 31, 2023 is $1,211.7 million and net working capital settlements relating to acquisitions completed in previous years resulted in $5.9 million of cash receipts for the year ended December 31, 2024. These amounts exclude approximately $7.2 million of deferred purchase price related to the Balestro acquisition.
The purchase price allocation to identifiable intangible assets acquired for all of the 2023 acquisitions is as follows (in millions, except useful life amounts):
Estimated Fair Value
Weighted Average Estimated Useful Life
Patents, tradenames and trademarks
$
45.1
20
Customer relationships
503.0
21
Developed technology
8.5
10
Backlog
51.6
3
Total
$
608.2
Customer relationships and developed technology intangible assets acquired are amortized using an accelerated method that reflects the pattern in which economic benefits of the intangible assets are consumed and results in higher amortization in the earlier years of the asset’s useful life.
Supplemental Pro-forma Data
The results of operations for the 2023 acquisitions have been included in the Company’s consolidated financial statements for the period subsequent to the completion of the acquisitions on their respective dates. Acquisitions contributed sales of approximately $41.4 million and operating income of approximately $0.0 million, before any transaction costs described below, for the period from the completion of the acquisitions through December 31, 2023.
HUBBELL INCORPORATED- Form 10-K
67
The following unaudited supplemental pro-forma information presents consolidated results as if the acquisitions had been completed on January 1, 2022. Following that approach, for the purpose of the pro-forma results presented in the tables below, certain costs incurred by the Company during 2023 have been reclassified into the pro-forma 2022 period. Those reclassifications primarily include the following, which represent the amount of increase or (decrease) to reported results to arrive at the pro-forma results (in millions, except per share amounts).
Twelve Months Ended December 31,
Per Diluted Share
2023
2023
Transaction costs incurred in 2023(1)
$
11.2
$
0.21
Intangible amortization and inventory step up(2)
$
(20.7)
$
(0.38)
Interest expense(3)
$
1.2
$
0.02
(1)Transaction costs incurred in 2023 have been reclassified into the comparative pro-forma 2022 period.
(2)Intangible amortization and inventory step up amortization incurred in 2023 have been reclassified into the comparable pro-forma 2022 period and increased to reflect the assumption the transactions were completed on January 1, 2022. The pro-forma 2023 period includes the intangible amortization that would be incurred assuming that the transactions had been completed on January 1, 2022.
(3) Interest expense incurred in 2023, reflecting amounts incurred from the date of the acquisitions, has been reclassified into the pro-forma 2022 period and increased to reflect the assumption that the transactions were completed on January 1, 2022. The pro-forma 2023 period includes the interest expense that would have been incurred assuming the transactions had been completed on January 1, 2022.
The pro-forma results were calculated by combining the results of the Company with the stand-alone results of the acquisitions for the pre-acquisition periods, as described above:
Twelve Months Ended
(in millions, except per share amounts)
December 31, 2023
Net sales
$
5,762.1
Net income attributable to Hubbell
$
801.4
Earnings Per Share:
Basic
$
14.92
Diluted
$
14.81
The unaudited supplemental pro-forma financial information does not reflect the actual performance of the 2023 acquisitions in the periods presented and does not reflect the potential realization of cost savings relating to the integration of the acquisitions with Hubbell. Further, the pro-forma data should not be considered indicative of the results that would have occurred if the acquisitions and related financing had been consummated on January 1, 2022, nor are they indicative of future results.
Dispositions
In December 2023, the Company entered into a definitive agreement to sell its residential lighting business for a cash purchase price of $131 million, subject to customary adjustments. The Company concluded the business met the criteria for classification as held for sale in the fourth quarter of 2023. The residential lighting business is reported with the Electrical Solutions Segment. The transaction closed in the first quarter of 2024 and the Company recorded a pre-tax loss on the sale of $5.3 million, which is recorded within Total other expense in the Company’s Consolidated Statement of Income.
Under the terms of the transaction, Hubbell and the buyer entered into a transition services agreement (“TSA”), pursuant to which the Company agreed to provide certain administrative and operational services for a period of 12 months or less. Income from the TSA for the years ended December 31, 2025 and 2024 was $1.9 million and $7.2 million, respectively, and was recorded in Other expense, net in the Consolidated Statement of Income.
In the second quarter of 2025, the Company sold a product line from the Electrical Solutions segment for $2.6 million, and recognized a $0.4 million pre-tax loss on the disposition, which is recorded within Total other expense in the Company's Consolidated Statements of Income.
HUBBELL INCORPORATED- Form 10-K
68
NOTE 4 Receivables and Allowances
Receivables consist of the following components at December 31, (in millions):
2025
2024
Trade accounts receivable
$
879.4
$
780.1
Non-trade receivables
29.5
22.4
Accounts receivable, gross
908.9
802.5
Allowance for credit memos, returns and cash discounts
(38.1)
(35.2)
Allowance for doubtful accounts
(13.9)
(11.3)
Total allowances
(52.0)
(46.5)
ACCOUNTS RECEIVABLE, NET
$
856.9
$
756.0
NOTE 5 Inventories
Inventories are classified as follows at December 31, (in millions):
2025
2024
Raw material
$
455.0
$
409.9
Work-in-process
227.5
218.5
Finished goods
401.3
382.0
INVENTORIES, NET
$
1,083.8
$
1,010.4
See Note 1 regarding change in accounting method for inventories to FIFO from LIFO.
NOTE 6 Goodwill and Other Intangible Assets
Changes in the carrying amounts of goodwill for the years ended December 31, 2025 and 2024, by segment, were as follows (in millions):
Segment
Utility Solutions
Electrical Solutions
Total
BALANCE AT DECEMBER 31, 2023
$
1,897.5
$
635.9
$
2,533.4
Prior year acquisitions
(9.0)
—
(9.0)
Foreign currency translation
(20.1)
(3.5)
(23.6)
BALANCE AT DECEMBER 31, 2024
$
1,868.4
$
632.4
$
2,500.8
Current year dispositions(1)
—
(0.3)
(0.3)
Current year acquisitions(1)
499.2
40.0
539.2
Foreign currency translation
16.4
4.7
21.1
BALANCE AT DECEMBER 31, 2025
$
2,384.0
$
676.8
$
3,060.8
(1) Refer to Note 3 - Business Acquisitions and Dispositions for additional information.
The Company has not recorded any goodwill impairments since the initial adoption of the related accounting guidance in 2002.
Identifiable intangible assets are recorded in Other intangible assets, net in the Consolidated Balance Sheet. Identifiable intangible assets are comprised of the following (in millions):
HUBBELL INCORPORATED- Form 10-K
69
December 31, 2025
December 31, 2024
Gross Amount
Accumulated Amortization
Gross Amount
Accumulated Amortization
Definite-lived:
Patents, tradenames and trademarks
$
250.0
$
(104.7)
$
232.4
$
(95.2)
Customer relationships
1,633.6
(517.6)
1,290.0
(443.2)
Developed technology and other
278.6
(179.4)
221.4
(158.8)
TOTAL DEFINITE-LIVED INTANGIBLES
2,162.2
(801.7)
1,743.8
(697.2)
Indefinite-lived:
Tradenames and other
33.8
—
33.4
—
TOTAL OTHER INTANGIBLE ASSETS
$
2,196.0
$
(801.7)
$
1,777.2
$
(697.2)
Amortization expense associated with these definite-lived intangible assets was $103.6 million, $116.6 million and $73.5 million in 2025, 2024 and 2023, respectively. Amortization expense associated with these intangible assets is expected to be $111.5 million in 2026, $114.1 million in 2027, $109.5 million in 2028, $104.8 million in 2029 and $97.7 million in 2030. The Company amortizes intangible assets with definite lives using either an accelerated method that reflects the pattern in which economic benefits of the intangible assets are consumed and results in higher amortization in the earlier years of the assets’ useful life, or using a straight line method. Approximately 90% of the gross value of definite-lived intangible assets follow an accelerated amortization method.
70
HUBBELL INCORPORATED - Form 10-K
NOTE 7 Investments
At December 31, 2025 and December 31, 2024, the Company held investments classified as available-for-sale and investments classified as trading securities. Investments classified as available-for-sale consisted of municipal bonds with an amortized cost basis of $78.0 million as of December 31, 2025. Investments classified as trading securities were composed primarily of debt and equity mutual funds and are stated at fair market value based on current quotes.
The following table sets forth selected data with respect to the Company’s investments at December 31, (in millions):
2025
2024
Amortized Cost
Gross Unrealized Gains
Gross Unrealized Losses
Fair Value
Carrying Value
Amortized Cost
Gross Unrealized Gains
Gross Unrealized Losses
Fair Value
Carrying Value
Available-for-sale securities
$
78.0
$
0.8
$
(0.4)
$
78.4
$
78.4
$
70.1
$
0.1
$
(0.6)
$
69.6
$
69.6
Trading securities
13.5
19.0
—
32.5
32.5
13.5
14.6
—
28.1
28.1
TOTAL INVESTMENTS
$
91.5
$
19.8
$
(0.4)
$
110.9
$
110.9
$
83.6
$
14.7
$
(0.6)
$
97.7
$
97.7
Contractual maturities of our investments in available-for-sale securities at December 31, 2025 were as follows (in millions):
Amortized Cost
Fair Value
Available-for-sale securities
Due within 1 year
$
12.5
$
12.5
After 1 year but within 5 years
51.7
52.4
After 5 years but within 10 years
5.8
5.9
Due after 10 years
8.0
7.6
TOTAL
$
78.0
$
78.4
The total unrealized gain/(loss) recognized in the year relating to available-for-sale securities, net of tax, was $0.7 million and $(0.1) million for the year ended December 31, 2025 and 2024, respectively. These net unrealized gains/(losses) are included in Accumulated other comprehensive loss, net of tax. Net unrealized gains relating to trading securities have been reflected in the results of operations. The Company uses the specific identification method when identifying the cost basis used to calculate the gain or loss on these securities. Gains and losses for both available-for-sale and trading securities were not material in 2025, 2024 and 2023.
At December 31, 2025 and December 31, 2024, the Company had $78.4 million and $69.6 million, respectively, of available-for-sale municipal debt securities. These investments had an amortized cost of $78.0 million and $70.1 million, respectively. No allowance for credit losses related to our available-for-sale debt securities was recorded for the twelve months ended December 31, 2025. As of December 31, 2025 and December 31, 2024, the unrealized losses attributable to our available-for-sale debt securities was $0.4 million and $0.6 million, respectively. The fair value of available-for-sale debt securities with unrealized losses was $20.5 million at December 31, 2025 and $40.5 million at December 31, 2024.
NOTE 8 Property, Plant, and Equipment
Property, plant, and equipment, carried at cost, is summarized as follows at December 31, (in millions):
2025
2024
Land
$
37.9
$
34.8
Buildings and improvements
291.5
269.6
Machinery, tools, and equipment
1,225.8
1,089.8
Construction-in-progress
121.7
135.7
Gross property, plant, and equipment
1,676.9
1,529.9
Less accumulated depreciation
(835.7)
(803.3)
PROPERTY, PLANT, AND EQUIPMENT, NET
$
841.2
$
726.6
Depreciable lives on buildings range between 20-45years. Depreciable lives on machinery, tools, and equipment range between 3-15 years. The Company recorded depreciation expense of $92.8 million, $81.3 million and $71.9 million for 2025, 2024 and 2023, respectively.
HUBBELL INCORPORATED- Form 10-K
71
NOTE 9 Other Accrued Liabilities
Other accrued liabilities consist of the following at December 31, (in millions):
2025
2024
Customer program incentives
$
73.5
$
51.7
Accrued income taxes
27.5
21.4
Contract liabilities - deferred revenue
161.3
134.6
Customer refund liability
20.5
20.1
Accrued warranties(1)
15.2
20.6
Current operating lease liabilities
40.7
34.2
Other
112.0
89.8
TOTAL
$
450.7
$
372.4
(1)Refer to Note 21 – Guarantees for additional information regarding warranties.
NOTE 10 Other Non-Current Liabilities
Other non-current liabilities consist of the following at December 31, (in millions):
2025
2024
Pensions
$
117.4
$
167.1
Other post-employment benefits
10.3
12.9
Deferred tax liabilities
420.1
277.1
Accrued warranties long-term(1)
18.8
21.1
Non-current operating lease liabilities
121.2
117.3
Other
138.1
124.7
TOTAL
$
825.9
$
720.2
(1)Refer to Note 21 – Guarantees for additional information regarding warranties.
72
HUBBELL INCORPORATED - Form 10-K
NOTE 11 Retirement Benefits
The Company has funded and unfunded non-contributory U.S. and foreign defined benefit pension plans. Benefits under these plans are generally provided based on either years of service and final average pay or a specified dollar amount per year of service. The U.S. defined benefit pension plan has been closed to new participants since 2004, while the Canadian and UK defined benefit pension plans have been closed to new entrants since 2006 and 2007, respectively. These U.S., Canadian and UK employees are eligible instead for defined contribution plans.
The Company also has a number of health care and life insurance benefit plans covering eligible employees who reached retirement age while working for the Company. These benefits have been discontinued for substantially all future retirees. The Company anticipates future cost-sharing charges for its discontinued plans that are consistent with past practices. The Company uses a December 31 measurement date for all of its plans.
The Company’s U.S. defined benefit pension plans were approximately 89% of the $636.2 million total pension benefit obligations at December 31, 2025.
HUBBELL INCORPORATED- Form 10-K
73
The following table sets forth the reconciliation of beginning and ending balances of the benefit obligations and the plan assets for the Company’s defined benefit pension and other benefit plans at December 31, (in millions):
Pension Benefits
Other Benefits
2025
2024
2025
2024
Change in benefit obligation
Benefit obligation at beginning of year
$
657.1
$
674.9
$
14.2
$
16.1
Service cost
0.5
0.6
—
—
Interest cost
35.2
33.4
0.7
0.8
Plan participants’ contributions
—
—
—
—
Amendments
—
—
—
—
Actuarial (gain)/loss
(0.6)
5.4
(1.4)
(1.8)
Currency impact
4.4
(1.8)
—
—
Other
—
—
—
—
Benefits paid
(60.4)
(55.4)
(0.7)
(0.9)
Benefit obligation at end of year
$
636.2
$
657.1
$
12.8
$
14.2
Change in plan assets
Fair value of plan assets at beginning of year
$
499.0
$
543.1
$
—
$
—
Actual return on plan assets
44.8
5.2
—
—
Employer contributions
48.8
8.2
0.7
0.9
Plan participants’ contributions
—
—
—
—
Currency impact
4.5
(2.1)
—
—
Benefits paid
(60.4)
(55.4)
(0.7)
(0.9)
Fair value of plan assets at end of year
536.7
499.0
—
—
FUNDED STATUS
$
(99.5)
$
(158.1)
$
(12.8)
$
(14.2)
Amounts recognized in the consolidated balance sheet consist of:
Prepaid pensions (included in Other long-term assets)
$
23.8
$
15.5
$
—
$
—
Accrued benefit liability (short-term and long-term)
(123.3)
(173.6)
(12.8)
(14.2)
NET AMOUNT RECOGNIZED IN THE CONSOLIDATED BALANCE SHEET
$
(99.5)
$
(158.1)
$
(12.8)
$
(14.2)
Amounts recognized in Accumulated other comprehensive loss (income) consist of:
Net actuarial loss (gain)
$
226.1
$
251.6
$
(6.9)
$
(6.1)
Prior service cost
5.3
5.6
—
—
NET AMOUNT RECOGNIZED IN ACCUMULATED OTHER COMPREHENSIVE LOSS
$
231.4
$
257.2
$
(6.9)
$
(6.1)
The accumulated benefit obligation for all defined benefit pension plans was $636.2 million and $657.1 million at December 31, 2025 and 2024, respectively. Information with respect to plans with accumulated benefit obligations in excess of plan assets is as follows, (in millions):
2025
2024
Projected benefit obligation
$
450.1
$
468.8
Accumulated benefit obligation
$
450.1
$
468.8
Fair value of plan assets
$
326.8
$
295.2
74
HUBBELL INCORPORATED - Form 10-K
The following table sets forth the components of pension and other benefit costs for the years ended December 31, (in millions):
Pension Benefits
Other Benefits
2025
2024
2023
2025
2024
2023
Components of net periodic benefit cost:
Service cost
$
0.5
$
0.6
$
0.6
$
—
$
—
$
—
Interest cost
35.2
33.4
35.2
0.7
0.8
0.8
Expected return on plan assets
(28.6)
(30.8)
(28.1)
—
—
—
Amortization of prior service cost
0.4
0.4
0.4
—
—
—
Amortization of actuarial losses (gains)
11.3
9.9
10.4
(0.6)
(0.4)
(0.5)
Curtailment and settlement losses
—
—
—
—
—
—
Net periodic benefit cost
$
18.8
$
13.5
$
18.5
$
0.1
$
0.4
$
0.3
Changes recognized in other comprehensive loss (income), before tax:
Current year net actuarial (gain) loss
$
(16.7)
$
31.0
$
(4.6)
$
(1.4)
$
(1.8)
$
0.3
Current year prior service credit
—
—
—
—
—
—
Amortization of prior service (cost)
(0.4)
(0.4)
(0.4)
—
—
—
Amortization of net actuarial (losses) gains
(11.3)
(9.9)
(10.4)
0.6
0.4
0.6
Currency impact
2.6
(0.5)
1.8
—
—
—
Settlement adjustment
—
—
—
—
—
—
Curtailment adjustments
—
—
—
—
—
—
Total recognized in other comprehensive loss
(25.8)
20.2
(13.6)
(0.8)
(1.4)
0.9
TOTAL RECOGNIZED IN NET PERIODIC PENSION COST AND OTHER COMPREHENSIVE LOSS
$
(7.0)
$
33.7
$
4.9
$
(0.7)
$
(1.0)
$
1.2
The Company also maintains four primary defined contribution pension plans. The total cost of the Company’s defined contribution plans was $35.2 million in 2025, $36.7 million in 2024 and $32.3 million in 2023, excluding the employer match for the 401(k) plan. This cost is not included in the above net periodic benefit cost for the defined benefit pension plans.
As of December 31, 2025 the Company was not an active participant in any multi-employer pension plans.
HUBBELL INCORPORATED- Form 10-K
75
Assumptions
The following assumptions were used to determine the projected benefit obligations at the measurement date and the net periodic benefit cost for the year:
Pension Benefits
Other Benefits
2025
2024
2023
2025
2024
2023
Weighted-average assumptions used to determine benefit obligations at December 31,
Discount rate
5.49
%
5.58
%
5.16
%
5.50
%
5.60
%
5.20
%
Rate of compensation increase
0.08
%
0.08
%
0.08
%
5.00
%
5.00
%
5.00
%
Weighted-average assumptions used to determine net periodic benefit cost for years ended December 31,
Discount rate
5.58
%
5.16
%
5.46
%
5.60
%
5.20
%
5.50
%
Expected return on plan assets
5.75
%
5.93
%
5.68
%
N/A
N/A
N/A
Rate of compensation increase
0.08
%
0.08
%
0.08
%
5.00
%
5.00
%
3.93
%
At the end of each year, the Company determines the appropriate expected return on assets for each plan based upon its strategic asset allocation (see discussion below). In making this determination, the Company utilizes expected returns for each asset class based upon current market conditions and expected risk premiums for each asset class.
The Company also determines the discount rate to be used to calculate the present value of pension plan liabilities at the end of each year. The discount rate for the Company’s U.S. and Canadian pension plans is determined by matching the expected cash flows associated with its benefit obligations to the expected cash flows of a hypothetical portfolio of high quality, fixed income debt instruments with maturities that closely match the expected funding period of its pension liabilities. As of December 31, 2025, the Company used a discount rate of 5.50% for its U.S. pension plans compared to a discount rate of 5.60% used in 2024. For its Canadian pension plan, the Company used a discount rate of 4.86% as of December 31, 2025 compared to a 4.58% discount rate used in 2024.
For its UK pension plan, the discount rate was derived using a full yield curve and uses plan specific cash flows. The derived discount rate is the single discount rate equivalent to discounting these liability cash flows at the term-dependent spot rate of AA corporate bonds. This methodology resulted in a December 31, 2025 discount rate for the UK pension plan of 5.55% as compared to a discount rate of 5.60% used in 2024.
In 2025, 2024 and 2023, we used the Pri-2012 mortality table and the MP-2021 projection scale from 2012 to calculate the present value of our pension plan liabilities in the U.S. In 2024, the Pri-2012 mortality table was adjusted to reflect plan specific geospatial characteristics as appropriate. The plan specific adjusted Pri-2012 mortality table with generational projection from 2012 using Scale MP-2021 was chosen as the best estimate based on the observed and anticipated experience of the plans after considering alternative tables.
The rate of compensation increase assumption reflects the Company’s actual experience and best estimate of future increases.
The assumed health care cost trend rates used to determine the projected postretirement benefit obligation are as follows:
Other Benefits
2025
2024
2023
Assumed health care cost trend rates at December 31,
Health care cost trend assumed for next year
7.5
%
6.8
%
6.8
%
Rate to which the cost trend is assumed to decline
5.0
%
5.0
%
5.0
%
Year that the rate reaches the ultimate trend rate
2036
2031
2031
76
HUBBELL INCORPORATED - Form 10-K
Plan Assets
The Company’s combined targeted 2026 weighted average asset allocation for domestic and foreign pension plans and the actual weighted average asset allocation for domestic and foreign pension plans at December 31, 2025and2024 by asset category are as follows:
Percentage of Plan Assets
Target
Actual
Asset Category
2026
2025
2024
Equity securities
20
%
20
%
21
%
Debt securities & Cash
80
%
80
%
79
%
Alternative Investments
—
%
—
%
—
%
TOTAL
100
%
100
%
100
%
At the end of each year, the Company estimates the expected long-term rate of return on pension plan assets based on the strategic asset allocation for its plans. In making this determination, the Company utilizes expected rates of return for each asset class based upon current market conditions and expected risk premiums for each asset class. The Company has written investment policies and asset allocation guidelines for its domestic and foreign pension plans. In establishing these policies, the Company has considered that its various pension plans are a major retirement vehicle for most plan participants and has acted to discharge its fiduciary responsibilities with regard to the plans solely in the interest of such participants and their beneficiaries. The goal underlying the establishment of the investment policies is to provide that pension assets shall be invested in a prudent manner and so that, together with the expected contributions to the plans, the funds will be sufficient to meet the obligations of the plans as they become due.
To achieve this result, the Company conducts a periodic strategic asset allocation study to form a basis for the allocation of pension assets between various asset categories. Specific policy benchmark percentages are assigned to each asset category with minimum and maximum ranges established for each. The assets are then tactically managed within these ranges. Derivative investments include futures contracts used by the plan to adjust the level of its investments within an asset allocation category. The actual and target percentages reported in the preceding table reflect the economic exposure to each asset category, including the impact of derivative positions. All futures contracts are 100% supported by cash or cash equivalent investments. At no time may derivatives be utilized to leverage the asset portfolio. At December 31, 2025 and 2024, there were no holdings of Company stock in pension plan assets.
The Company’s other post-employment benefits are unfunded; therefore, no asset information is reported.
HUBBELL INCORPORATED- Form 10-K
77
The fair value of the Company’s pension plan assets at December 31, 2025 and 2024, by asset category are as follows (in millions):
Quoted Prices in Active Markets for Identical Assets
Quoted Prices in Active Market for Similar Asset
Significant Unobservable Inputs
Investments Priced Using Net Asset Value
Asset Category
Total
(Level 1)
(Level 2)
(Level 3)
Cash and cash equivalents
$
25.4
$
21.2
$
4.2
$
—
$
—
Equity securities:
Equity Mutual Funds
16.8
16.8
—
—
—
Common Pooled Equity Funds (a)
86.7
—
86.7
—
—
Fixed Income Securities:
U.S. Treasuries
44.3
—
44.3
—
—
State and Local Municipal Bonds
8.1
—
8.1
—
—
Sovereign Debt
6.9
—
6.9
—
—
Corporate Bonds (b)
133.7
—
133.7
—
—
Fixed Income Mutual Funds
16.3
16.3
—
—
—
Common Pooled Fixed Income Funds (c)
193.5
—
193.5
—
—
Asset Backed Securities
2.6
—
2.6
—
—
Alternative Investment Funds
0.4
—
—
—
0.4
Common Pooled Funds (d)
2.0
0.4
1.6
—
—
BALANCE AT DECEMBER 31, 2025
$
536.7
$
54.7
$
481.6
$
—
$
0.4
Quoted Prices in Active Markets for Identical Assets
Quoted Prices in Active Market for Similar Asset
Significant Unobservable Inputs
Investments Priced Using Net Asset Value
Asset Category
Total
(Level 1)
(Level 2)
(Level 3)
Cash and cash equivalents
$
3.0
$
1.1
$
1.9
$
—
$
—
Equity securities:
Equity Mutual Funds
14.7
14.7
—
—
—
Common Pooled Equity Funds (a)
87.6
—
87.6
—
—
Fixed Income Securities:
U.S. Treasuries
41.3
—
41.3
—
—
State and Local Municipal Bonds
7.6
—
7.6
—
—
Sovereign Debt
8.7
—
8.7
—
—
Corporate Bonds (b)
131.1
—
131.1
—
—
Fixed Income Mutual Funds
15.7
15.7
—
—
—
Common Pooled Fixed Income Funds (c)
186.8
—
186.8
—
—
Asset Backed Securities
—
—
—
—
—
Alternative Investment Funds
0.5
—
—
—
0.5
Common Pooled Funds (d)
2.0
0.4
1.6
—
—
BALANCE AT DECEMBER 31, 2024
$
499.0
$
31.9
$
466.6
$
—
$
0.5
(a)Investments in Common Pooled Equity Funds, including funds and fund products investing in various equity securities.
(b)Includes primarily investment grade bonds from diverse industries.
(c)Investments in Common Pooled Fixed Income Funds, including funds and fund products investing in various fixed income investments.
(d)Investments in Common Pooled Funds, consisting of equities and fixed income securities.
78
HUBBELL INCORPORATED - Form 10-K
Contributions
The Company contributed $1.3 million to its foreign qualified plans in 2024 and $40.0 million to its U.S. qualified plans and $1.4 million to its foreign qualified plans in 2025.
Estimated Future Benefit Payments
The following domestic and foreign benefit payments, which reflect future service, as appropriate, are expected to be paid as follows (in millions):
Pension Benefits
Other Benefits
2026
$
54.5
$
2.6
2027
$
53.9
$
1.1
2028
$
53.3
$
1.1
2029
$
52.7
$
1.0
2030
$
51.9
$
1.0
2031-2035
$
244.8
$
4.3
NOTE 12 Debt
The following table sets forth the Company’s long-term debt at December 31, (in millions):
Maturity
2025
2024
Senior notes at 3.35%
2026
$
—
$
399.2
Senior notes at 3.15%
2027
299.1
298.6
Senior notes at 3.50%
2028
448.5
447.7
Senior notes at 2.300%
2031
297.7
297.2
Senior notes at 4.800%
2035
392.1
—
Term loan
2028
598.9
—
TOTAL LONG-TERM DEBT(a)
$
2,036.3
$
1,442.7
(a)Long-term debt is presented net of debt issuance costs and unamortized discounts.
2025 Term Loan
On September 29, 2025, the Company entered into a Term Loan Agreement (the "2025 Term Loan Agreement") with a syndicate of lenders and JPMorgan Chase Bank, N.A., as administrative agent. On October 1, 2025, the Company borrowed $600 million under the Term Loan Agreement (the "2025 Loan") on an unsecured basis to finance the DMC Power acquisition. The 2025 Term Loan was made in a single borrowing and will be due and payable on September 29, 2028. The 2025 Term Loan bears interest based on the Term SOFR Rate (as defined in the 2025 Term Loan Agreement), plus an applicable interest addition based on Hubbell's credit ratings. The interest rate on the 2025 Term Loan as of December 31, 2025 was 4.99%. Hubbell also paid to the lenders certain customary fees in connection with the 2025 Term Loan Agreement.
The 2025 Term Loan Agreement contains representations and warranties and affirmative and negative covenants customary for an unsecured financing of this type, as well as a financial covenant requiring that, as of the last day of each fiscal quarter, the ratio of total indebtedness to total capitalization shall not be greater than 65%. The Company was in compliance with this covenant as of December 31, 2025.
2023 Term Loan
In December 2023, the Company entered into a Term Loan Agreement (the “2023 Term Loan Agreement”) with a syndicate of lenders under which the Company borrowed $600.0 million (the "2023 Term Loan") on an unsecured basis to partially finance the Systems Control acquisition, which was completed on December 12, 2023. Borrowings under the 2023 Term Loan Agreement bore interest generally at either the adjusted term SOFR rate plus an applicable margin (determined by a ratings based grid) or the alternative base rate. The principal amount of borrowings under the 2023 Term Loan Agreement amortized in equal quarterly installments of 2.5% in year one, 2.5% in year two, and 5% in year three, and the remaining borrowings under the 2023 Term Loan Agreement were due and payable in full at maturity in December 2026. The Company had the option to make principal payments in excess of the amortization schedule at its discretion; as such, during the fourth quarter of 2024, the Company repaid the remainder of the 2023 Term Loan and no balance was outstanding at December 31, 2025 or December 31, 2024.
2025 Credit Facility
On March 25, 2025, the Company, as borrower, and each foreign subsidiary borrower from time to time party thereto (collectively, the “Foreign Subsidiary Borrowers”) entered into a five-year credit agreement with a syndicate of lenders and JPMorgan Chase Bank, N.A., as administrative agent, that provides for a $1.0 billion committed unsecured revolving credit facility (the “Revolving Credit Agreement”). The obligations of the Foreign Subsidiary Borrowers (if any) under the Revolving Credit Agreement are guaranteed by the Company.
Commitments under the Revolving Credit Agreement may be conditionally increased to an aggregate amount not to exceed $1.5 billion. The Revolving Credit Agreement includes a $50.0 million sub-limit for the issuance of letters of credit. The sum of the dollar amount of loans and letters of credit to the Foreign Subsidiary Borrowers under the Revolving Credit Agreement may not exceed $100.0 million.
The interest rate applicable to borrowings under the Revolving Credit Agreement is either (i) the alternate base rate (as defined in the Revolving Credit Agreement) or (ii) the term SOFR rate (as defined in the Revolving Credit Agreement) plus an applicable margin based on the Company's credit ratings.
All revolving loans outstanding under the Revolving Credit Agreement will be due and payable on March 25, 2030. The Revolving Credit Agreement provides for up to twoone-year maturity extensions. As of December 31, 2025, the credit facility was undrawn.
The Revolving Credit Agreement contains a sole financial covenant requiring that, as of the last day of each fiscal quarter, the ratio of total indebtedness to total capitalization shall not be greater than 65%. The Company was in compliance with this covenant as of December 31, 2025.
Unsecured Senior Notes
On November 14, 2025, the Company completed a public offering of $400 million aggregate principal amount of its 4.800% Senior Notes due 2035 (the “2035 Notes” and collectively with those described below, the "Notes"). The net proceeds from the offering were approximately $392.7 million after deducting the underwriting discount and estimated offering expenses payable by the Company. The 2035 Notes bear interest at a rate of 4.800% per annum from November 14, 2025. Interest on the 2035 Notes is payable semi-annually in arrears on May 15 and November 15 of each year, beginning on May 15, 2026. The 2035 Notes will mature on November 15, 2035. The Company used the net proceeds from the offering of the 2035 Notes, together with cash on hand, on December 1, 2025, to redeem in full all of the Company’s outstanding 3.350% Senior Notes due in 2026 for an aggregate principal amount of $400 million, which had a stated maturity date of March 1, 2026 (the "2026 Notes"), and to pay the accrued interest in respect thereof.
On March 12, 2021, the Company completed a public offering of $300 million aggregate principal amount of its 2.300% Senior Notes due 2031 (the “2031 Notes”). The net proceeds from the offering were approximately $295.5 million after deducting the underwriting discount and estimated offering expenses payable by the Company. The 2031 Notes bear interest at a rate of 2.300% per annum from March 12, 2021. Interest on the 2031 Notes is payable semi-annually in arrears on March 15 and September 15 of each year, beginning on September 15, 2021. The 2031 Notes will mature on March 15, 2031. The 2031 Notes are callable at any time with a make whole premium and are only subject to accelerated payment prior to maturity in the event of a default (including as a result of the Company’s failure to meet certain non-financial covenants) under the indenture governing the notes or upon a change in control triggering event as defined in such indenture. The Company was in compliance with all non-financial covenants as of December 31, 2025.
In February 2018, the Company completed a public offering of $450 million of senior, unsecured, notes maturing in February 2028 and bearing interest at a fixed rate of 3.50% (the “2028 Notes”). Net proceeds from the issuance of the 2028 Notes were $442.6 million after deducting the discount on such notes and offering expenses paid by the Company. The 2028 Notes are callable at any time at specified prices and are only subject to accelerated payment prior to maturity upon customary events of a default under the indenture governing the 2028 Notes, as modified by the supplemental indenture creating such notes, or upon a change in control triggering event as defined in such indenture.
In August 2017, the Company completed a public debt offering of $300 million of long-term unsecured, unsubordinated notes maturing in August 2027 and bearing interest at a fixed rate of 3.15% (the “2027 Notes”). Net proceeds from the issuance were $294.6 million after deducting the discount on the notes and offering expenses paid by the Company.
The 2027 Notes, 2028 Notes, 2031 Notes, and 2035 Notes are all fixed rate indebtedness, are callable at any time with a make whole premium and are only subject to accelerated payment prior to maturity in the event of a default (including as a result of the Company’s failure to meet certain non-financial covenants) under the indenture governing the notes, as modified by the supplemental indentures creating such notes, or upon a change in control triggering event as defined in such indenture. The Company was in compliance with all non-financial covenants as of December 31, 2025.
80
HUBBELL INCORPORATED - Form 10-K
At December 31, 2025 and 2024, the Company had $289.1 million and $125.4 million, respectively, of short-term debt is composed of:
◦$287.0 million of commercial paper borrowings outstanding at December 31, 2025, and $123.0 million of commercial paper borrowings outstanding at December 31, 2024. The increase in commercial paper borrowings in 2025 was used for the repurchase of $225.0 million of treasury stock and to partially fund the acquisition of Ventev, Nicor and DMC Power.
◦The Company had $2.1 million and $2.4 million of short-term debt outstanding at December 31, 2025 and December 31, 2024, respectively, which consisted of amounts outstanding under our commercial card program.
Other information related to short-term debt at December 31, is summarized below:
2025
2024
Weighted average interest rate on short-term debt:
At year end
4.13
%
4.49
%
The Company maintains other lines of credit that are primarily used to support the issuance of letters of credit. Interest rates and other terms of borrowing under these lines of credit vary from country to country, depending on local market conditions. At December 31, 2025 and 2024 these lines totaled $58.2 million and $55.3 million, respectively, of which $21.5 million and $41.1 million was utilized to support letters of credit and the remaining amount was unused. The annual commitment fees associated with these lines of credit are not material.
Interest and fees paid related to total indebtedness was $77.6 million, $83.6 million and $49.9 million in 2025, 2024 and 2023, respectively.
HUBBELL INCORPORATED- Form 10-K
81
NOTE 13 Income Taxes
The following table sets forth selected data with respect to the Company’s income tax provisions for the years ended December 31, (in millions):
2025
2024
2023
Income before income taxes:
United States
$
968.1
$
851.3
$
836.9
International
151.0
155.5
135.3
TOTAL INCOME BEFORE INCOME TAXES
$
1,119.1
$
1,006.8
$
972.2
Provision for income taxes — current:
Federal
$
155.0
$
150.2
$
165.6
State
24.3
33.0
35.6
International
36.9
36.9
32.3
Total provision — current
$
216.2
$
220.1
$
233.5
Provision for income taxes — deferred:
Federal
$
28.3
$
12.6
$
(10.8)
State
0.8
(3.5)
(8.4)
International
(18.1)
(7.1)
0.3
Total provision — deferred
$
11.0
$
2.0
$
(18.9)
TOTAL PROVISION FOR INCOME TAXES
$
227.2
$
222.1
$
214.6
82
HUBBELL INCORPORATED - Form 10-K
Deferred tax assets and liabilities result from differences in the basis of assets and liabilities for tax and financial statement purposes. The components of the deferred tax assets/(liabilities) at December 31, were as follows (in millions):
2025
2024
Deferred tax assets:
Inventories
$
17.7
$
—
Lease liabilities
39.5
38.2
Income tax credits
10.4
23.9
Accrued liabilities
42.6
38.0
Pension
24.0
33.0
Post retirement and post employment benefits
3.1
3.4
Stock-based compensation
8.0
8.0
Loss carryforwards
11.1
10.4
Capitalized research expenditures
32.5
56.2
Miscellaneous other
24.1
23.3
Gross deferred tax assets
213.0
234.4
Valuation allowance
(19.7)
(34.1)
Total deferred tax assets, net of valuation allowance
193.3
200.3
Deferred tax liabilities:
Historical inventories including impact of accounting method change
(39.3)
(32.2)
Liability on undistributed foreign earnings
(5.6)
(5.3)
Goodwill and intangibles
(408.0)
(335.1)
Right-of-use assets
(38.0)
(36.8)
Property, plant, and equipment
(96.7)
(60.5)
Total deferred tax liabilities
(587.6)
(469.9)
TOTAL NET DEFERRED TAX LIABILITY
$
(394.3)
$
(269.6)
Deferred taxes are reflected in the Consolidated Balance Sheet as follows:
Non-current tax assets (included in Other long-term assets)
$
25.8
$
7.5
Non-current tax liabilities (included in Other Non-Current Liabilities)
(420.1)
(277.1)
TOTAL NET DEFERRED TAX LIABILITY
$
(394.3)
$
(269.6)
As of December 31, 2025, the Company had a total of $10.4 million of U.S. federal, state (net of federal benefit) and foreign tax credit carryforwards, available to offset future income taxes. As of December 31, 2025, $1.9 million of the tax credits may be carried forward indefinitely while the remaining $8.5 million will begin to expire at various times in 2026 through 2054. As of December 31, 2025, the Company had recorded tax benefits totaling $11.1 million for U.S. federal, state and foreign net operating loss carryforwards (“NOLs”). As of December 31, 2025, $5.2 million of NOLs may be carried forward indefinitely while the remaining $5.9 million will begin to expire at various times in 2026 through 2055. The tax benefit related to a portion of these NOLs has been adjusted to reflect an “ownership change” pursuant to Internal Revenue Code Section 382, which imposes an annual limitation on the utilization of pre-acquisition operating losses. The Company has recorded a net valuation allowance of $19.7 million on certain deferred tax assets including a portion of foreign and state tax credit carryforwards, capital loss carryforwards and NOLs that the Company anticipates will expire prior to utilization.
During 2025, the Company repatriated certain of its foreign earnings. As of December 31, 2025, the Company also anticipates repatriating certain of its foreign earnings in the future. The accompanying financial statements reflect the income tax expense associated with actual and anticipated remittances related to certain of our outside basis differences. The Company has not provided for the income tax effects of distributing the remaining undistributed foreign earnings as those amounts are either permanently reinvested or intended to be reinvested in our international operations. It is not practicable to estimate the tax cost associated with a remittance of such earnings.
HUBBELL INCORPORATED- Form 10-K
83
The Company paid cash income taxes (net of refunds) in the following jurisdictions (in millions):
2025
2024
2023
Federal
$
147.2
$
158.5
$
157.9
State payments
28.5
30.3
27.6
Foreign
38.6
36.5
29.5
TOTAL CASH TAXES PAID
$
214.3
$
225.3
$
215.0
The Company operates within multiple taxing jurisdictions and is subject to audit in these jurisdictions. The IRS and other tax authorities routinely audit the Company’s tax returns. These audits can involve complex issues which may require an extended period of time to resolve. In January 2023, the Company completed its 2018 U.S. federal tax examination with no material adjustments. The Company is currently not under a U.S. tax audit. The Company is under audit in Canada for the tax years 2020-2021. With few exceptions, the Company is no longer subject to state, local, or income tax examinations by tax authorities for years prior to 2021.
The following tax years, by major jurisdiction, are still subject to examination by taxing authorities:
Jurisdiction
Open Years
United States
2022-2025
UK
2022-2025
Puerto Rico
2021-2025
Canada
2020-2025
A reconciliation of the beginning and ending amount of unrecognized tax benefits is as follows (in millions):
2025
2024
2023
Unrecognized tax benefits at beginning of year
$
48.2
$
47.0
$
42.1
Additions based on tax positions relating to the current year
13.9
10.0
10.4
Reductions based on expiration of statute of limitations
(5.6)
(7.2)
(7.6)
Additions/(Subtractions) to tax positions relating to previous years
2.6
(0.4)
2.8
Settlements
(0.2)
(1.2)
(0.7)
TOTAL UNRECOGNIZED TAX BENEFITS
$
58.9
$
48.2
$
47.0
Included in the balance at December 31, 2025 are approximately $52.1 million of tax positions which, if in the future are determined to be recognizable, would affect the annual effective income tax rate. Additionally, there are $0.5 million of tax positions for which the ultimate deductibility is highly certain but for which there is uncertainty as to the timing of such deductibility. Because of the impact of deferred tax accounting, other than interest and penalties, the disallowance of the shorter deductibility period would not affect the annual effective tax rate but would accelerate the payment of cash to the applicable taxing authority to an earlier period. It is reasonably possible that in the next twelve months, because of changes in facts and circumstances, the unrecognized tax benefits may increase or decrease.
The Company’s policy is to record interest and penalties associated with the underpayment of income taxes within Provision for income taxes in the Consolidated Statement of Income. The Company recognized expense (benefit), before federal tax impact, related to interest and penalties of $0.9 million in 2025, $0.7 million in 2024 and $1.2 million in 2023. The Company had $9.5 million and $8.6 million accrued for the payment of interest and penalties as of December 31, 2025 and December 31, 2024, respectively.
84
HUBBELL INCORPORATED - Form 10-K
The consolidated effective income tax rate varied from the United States federal statutory income tax rate for the years ended December 31, as follows (in millions and percentage):
2025
2024
2023
Amount
Percentage
Amount
Percentage
Amount
Percentage
U.S. Federal Statutory Tax Rate
$
235.0
21.0
%
$
211.5
21.0
%
$
203.9
21.0
%
State and Local Income taxes, net of federal income tax effect (1)
20.3
1.8
23.4
2.3
22.9
2.4
Foreign Tax Effect (2)
(11.4)
(1.0)
(1.5)
(0.1)
4.6
0.5
Effect of Cross-Border Tax Laws
(5.2)
(0.5)
(5.7)
(0.6)
(1.2)
(0.1)
Tax Credits
(8.5)
(0.8)
(7.4)
(0.7)
(9.4)
(1.0)
Nontaxable or Nondeductible Items
(0.3)
—
5.4
0.5
0.9
0.1
Changes in Unrecognized Tax Benefits
(2.7)
(0.2)
(3.6)
(0.3)
(7.1)
(0.8)
EFFECTIVE TAX RATE
$
227.2
20.3
%
$
222.1
22.1
%
$
214.6
22.1
%
(1)In 2025, state and local income taxes in California, Illinois, New Jersey, Texas, Minnesota, Wisconsin, Pennsylvania, Florida and Georgia comprise the majority of the state and local income taxes, net of federal effect category. In 2024, state and local income taxes in California, Illinois, New Jersey, Florida, Minnesota, Texas, Wisconsin, Georgia and Pennsylvania comprise the majority of the state and local income taxes, net of federal effect category. In 2023, state and local income taxes in California, Illinois, New Jersey, Florida, Texas, Minnesota, Wisconsin, Pennsylvania, Georgia and Michigan comprise the majority of the state and local income taxes, net of federal effect category.
(2)Includes the income tax benefit from International Restructuring.
HUBBELL INCORPORATED- Form 10-K
85
NOTE 14 Financial Instruments and Fair Value Measurement
Financial Instruments
Concentrations of Credit Risk: Financial instruments which potentially subject the Company to significant concentrations of credit risk consist of trade receivables, cash equivalents and investments. The Company grants credit terms in the normal course of business to its customers. Due to the diversity of its product lines, the Company has an extensive customer base including electrical distributors and wholesalers, electric utilities, equipment manufacturers, electrical contractors, telecommunication companies and retail and hardware outlets. We are not dependent on a single customer, however, the Company’s top ten customers account for approximately 42% of its Net sales. As part of its ongoing procedures, the Company monitors the credit worthiness of its customers. Bad debt write-offs have historically been minimal. The Company places its cash and cash equivalents with financial institutions and limits the amount of exposure in any one institution.
At December 31, 2025, our accounts receivable balance was $856.9 million, net of allowances of $13.9 million. The allowance for doubtful accounts has increased by $2.6 million since December 31, 2024.
Fair Value: The carrying amounts reported in the Consolidated Balance Sheet for cash and cash equivalents, short-term investments, receivables, bank borrowings, accounts payable and accruals approximate their fair values given the immediate or short-term nature of these items. See also Note 7 — Investments.
Fair value measurements
At December 31, 2025 and 2024, the Company had $113.8 million and $100.8 million respectively, of investments carried on the balance sheet at fair value. Fair value is defined as the amount that would be received for selling an asset or paid to transfer a liability in an orderly transaction between market participants at the measurement date. The FASB fair value measurement guidance established a fair value hierarchy that prioritizes the inputs used to measure fair value. Refer to Note 7 — Investments for more information about these investments.
The three broad levels of the fair value hierarchy are as follows:
Level 1 - Quoted prices (unadjusted) in active markets for identical assets or liabilities.
Level 2 - Quoted prices for similar assets and liabilities in active markets or inputs that are observable for the asset or liability, either directly or indirectly.
Level 3 - Unobservable inputs for which little or no market data exists, therefore requiring a company to develop its own assumptions.
86
HUBBELL INCORPORATED - Form 10-K
The following tables show, by level within the fair value hierarchy, the Company’s financial assets and liabilities that are accounted for at fair value on a recurring basis at December 31, 2025 and 2024 (in millions):
Asset (Liability)
Quoted Prices in Active Markets for Identical Assets (Level 1)
Quoted Prices in Active Markets for Similar Assets (Level 2)
Unobservable inputs for which little or no market data exists (Level 3)
Total
Money market funds (a)
$
187.4
$
—
$
—
$
187.4
Time Deposits (d)
—
2.9
—
2.9
Available for sale investments
—
78.4
—
78.4
Trading securities
32.5
—
—
32.5
Deferred compensation plan liabilities
(32.5)
—
—
(32.5)
Derivatives:
Forward exchange contracts-Assets (b)
—
0.1
—
0.1
Forward exchange contracts-(Liabilities) (c)
—
(0.5)
—
(0.5)
BALANCE AT DECEMBER 31, 2025
$
187.4
$
80.9
$
—
$
268.3
Asset (Liability)
Quoted Prices in Active Markets for Identical Assets (Level 1)
Quoted Prices in Active Markets for Similar Assets (Level 2)
Unobservable inputs for which little or no market data exists (Level 3)
Total
Money market funds (a)
$
63.2
$
—
$
—
$
63.2
Time Deposits (d)
—
3.1
—
3.1
Available for sale investments
—
69.6
—
69.6
Trading securities
28.1
—
—
28.1
Deferred compensation plan liabilities
(28.1)
—
—
(28.1)
Derivatives:
Forward exchange contracts-Assets (b)
—
1.4
—
1.4
BALANCE AT DECEMBER 31, 2024
$
63.2
$
74.1
$
—
$
137.3
(a)Money market funds are included in Cash and cash equivalents in the Consolidated Balance Sheet.
(b)Forward exchange contracts-Assets are reflected in Other current assets in the Consolidated Balance Sheet.
(c)Forward exchange contracts-(Liabilities) are reflected in Other accrued liabilities in the Consolidated Balance Sheet.
(d)Time deposits are reflected in current and long term investments depending on their maturity date in the Consolidated Balance Sheet.
The methods and assumptions used to estimate the Level 2 fair values were as follows:
Forward exchange contracts – The fair value of forward exchange contracts were based on quoted forward foreign exchange prices at the reporting date.
Available-for-sale municipal bonds classified in Level 2 – The fair value of available-for-sale investments in municipal bonds is based on observable market-based inputs, other than quoted prices in active markets for identical assets.
Deferred compensation plan
The Company offers certain employees the opportunity to participate in non-qualified deferred compensation plans. A participant’s deferrals are invested in a variety of participant-directed debt and equity mutual funds that are classified as trading securities. During 2025 and 2024, the Company purchased $3.6 million and $4.9 million, respectively, of trading securities related to these deferred compensation plans. As a result of participant distributions, the Company sold $3.5 million and $3.0 million of these trading securities in 2025 and 2024, respectively. The unrealized gains and losses associated with these trading securities are directly offset by the changes in the fair value of the underlying deferred compensation plan obligation.
Long-term Debt
The total carrying value of long-term debt, net of unamortized discount and debt issuance costs, as of December 31, 2025 and December 31, 2024 was $2,036.3 million and $1,442.7 million, respectively. The estimated fair value of the long-term debt as of December 31, 2025 and December 31, 2024 was $2,008.3 million and $1,367.3 million, respectively, using quoted market prices in active markets for similar liabilities (Level 2).
HUBBELL INCORPORATED- Form 10-K
87
NOTE 15 Commitments and Contingencies
Legal and Environmental
The Company is subject to various legal proceedings arising in the normal course of its business. These proceedings include claims for damages arising out of use of the Company’s products, intellectual property, workers’ compensation and environmental matters. The Company is self-insured up to specified limits for certain types of claims, including product liability and workers’ compensation, and is fully self-insured for certain other types of claims, including environmental and intellectual property matters. The Company recognizes a liability for any contingency that in management’s judgment is probable of occurrence and can be reasonably estimated. We continually reassess the likelihood of adverse judgments and outcomes in these matters, as well as estimated ranges of possible losses based upon an analysis of each matter which includes advice of outside legal counsel and, if applicable, other experts.
The Company is subject to environmental laws and regulations which may require that it investigate and remediate the effects of potential contamination associated with past and present operations as well as those acquired through business combinations. Environmental liabilities are recorded when remedial efforts are probable and the costs can be reasonably estimated. The Company continues to monitor these environmental matters and revalues its liabilities as necessary. Total environmental liabilities were $7.8 million and $6.6 million as of December 31, 2025 and 2024, respectively.
The Company accounts for conditional asset retirement and environmental obligations in accordance with the applicable accounting guidance. The accounting guidance defines “conditional asset retirement obligation” as a legal obligation to perform an asset retirement activity in which the timing and/or method of settlement are conditional on a future event that may or may not be within the control of the Company. Accordingly, an entity is required to recognize a liability for the fair value of a conditional asset retirement obligation if the fair value of the liability can be reasonably estimated. Asset retirement obligations were not material as of December 31, 2025 and 2024.
88
HUBBELL INCORPORATED - Form 10-K
NOTE 16 Capital Stock
Activity in the Company’s common shares outstanding is set forth below for the three years ended December 31, 2025 (in thousands):
Common Stock
OUTSTANDING AT DECEMBER 31, 2022
53,689
Exercise of stock appreciation rights
77
Director compensation arrangements, net
4
Restricted/performance shares activity, net of forfeitures
127
Acquisition/surrender of shares
(167)
OUTSTANDING AT DECEMBER 31, 2023
53,730
Exercise of stock appreciation rights
72
Director compensation arrangements, net
4
Restricted/performance shares activity, net of forfeitures
105
Acquisition/surrender of shares
(151)
OUTSTANDING AT DECEMBER 31, 2024
53,760
Exercise of stock appreciation rights
36
Director compensation arrangements, net
4
Restricted/performance shares activity, net of forfeitures
103
Acquisition/surrender of shares
(649)
OUTSTANDING AT DECEMBER 31, 2025
53,254
For accounting purposes, the Company treats repurchased shares as constructively retired when acquired and accordingly charges the purchase price against Common Stock par value, Additional paid-in capital and Retained earnings to the extent required. Shares may be repurchased through the Company’s stock repurchase program, acquired by the Company from employees or surrendered to the Company by employees in settlement of their minimum tax liability on vesting of restricted shares and performance shares under the Hubbell Incorporated Incentive Award Plan (the “Award Plan”).
Shares of the Company’s common stock were reserved at December 31, 2025 as follows (in thousands):
Common Stock
Future grant of stock-based compensation
1,017
Shares reserved under other equity compensation plans
113
TOTAL
1,130
HUBBELL INCORPORATED- Form 10-K
89
NOTE 17 Stock-Based Compensation
As of December 31, 2025, the Company had various stock-based awards outstanding which were issued to executives and other key employees. The Company recognizes the grant-date fair value of all stock-based awards to employees over their respective requisite service periods (generally equal to an award’s vesting period), net of estimated forfeitures. A stock-based award is considered vested for expense attribution purposes when the employee’s retention of the award is no longer contingent on providing subsequent service. For those awards that vest immediately upon retirement eligibility, the Company recognizes compensation cost immediately for retirement-eligible individuals or over the period from the grant date to the date retirement eligibility is achieved, if less than the stated vesting period.
The Company’s long-term incentive program for awarding stock-based compensation includes a combination of restricted stock, stock appreciation rights (“SARs”), and performance shares of the Company’s common stock pursuant to the Award Plan. Under the Award Plan, the Company may authorize up to 10.3 million shares of common stock to settle awards of restricted stock, performance shares, or SARs. The Company issues new shares to settle stock-based awards. In 2025, the Company’s grant of stock-based awards included restricted stock, SARs and performance shares.
Stock-based compensation expense recognized by the Company was $33.0 million in 2025, $30.6 million in 2024 and $26.5 million in 2023. The total income tax benefit recognized was $3.8 million in 2025, $4.2 million in 2024, and $4.0 million in 2023. The net tax windfall recorded as a result of exercise or vesting (depending on the type of award) was $6.0 million, $7.5 million, and $6.4 million in 2025, 2024 and 2023, respectively. As of December 31, 2025, there was $22.7 million, pretax, of total unrecognized compensation cost related to non-vested share-based compensation arrangements. This cost is expected to be primarily recognized through 2028.
Stock-based compensation expense is recorded in S&A expense as well as Cost of goods sold. Of the total 2025 expense, $31.9 million was recorded to S&A expense and $1.1 million was recorded to Cost of goods sold. In 2024 and 2023, $28.8 million and $24.9 million, respectively, was recorded to S&A expense and $1.8 million and $1.6 million, respectively, was recorded to Cost of goods sold. Stock-based compensation costs capitalized to inventory was $0.6 million in 2025, $0.6 million in 2024 and $0.7 million in 2023.
Each of the compensation arrangements is discussed below.
Restricted Stock
The Company issues various types of restricted stock, of which the restricted stock awards are considered outstanding at the time of grant, as the award holders are entitled to dividends and voting rights. Unvested restricted stock awards are considered participating securities when computing earnings per share. Restricted stock unit award holders are not entitled to dividend equivalents or voting rights until settlement. Restricted stock grants are not transferable and are subject to forfeiture in the event of the recipient’s termination of employment prior to vesting.
Restricted Stock Awards Issued to Employees - Service Condition
Restricted stock awards that vest based upon a service condition are expensed on a straight-line basis over the requisite service period. These awards generally vest either in three equal installments on each of the first three anniversaries of the grant date or on the third year anniversary of the grant date. The fair value of these awards is measured by the average of the high and low trading prices of the Company’s common stock on the most recent trading day immediately preceding the grant date (“measurement date”).
Restricted Stock Awards Issued to Non-employee Directors
In 2025, 2024 and 2023, each non-employee Director received a restricted stock award. These awards are typically made on the date of the annual meeting of shareholders or, as applicable, upon appointment to the Company's Board of Directors, and vest at the following year’s annual meeting of shareholders, or upon certain other events. The award is subject to forfeiture if the Director’s service terminates prior to the date of the next regularly scheduled annual meeting of shareholders. During 2025, 2024 and 2023, the Company issued awards of 4,113 shares, 3,629 shares, and 4,655 shares, respectively, to non-employee Directors.
90
HUBBELL INCORPORATED - Form 10-K
Restricted Stock Awards Issued to Employees and Non-employee Directors
Activity related to both employee and non-employee restricted stock awards for the year ended December 31, 2025 is as follows (in thousands, except per share amounts):
Shares
Weighted Average Grant Date Fair Value/Share
RESTRICTED STOCK AT DECEMBER 31, 2024
151
$
221.92
Shares granted
40
389.14
Shares vested
(53)
217.46
Shares forfeited
(4)
316.54
RESTRICTED STOCK AT DECEMBER 31, 2025
134
$
269.99
The weighted average fair value per share of restricted stock awards granted in 2025, 2024 and 2023 was $389.14, $356.94 and $249.36, respectively. The total fair value of restricted stock awards vested in 2025, 2024 and 2023 was $11.5 million, $10.4 million and $9.7 million, respectively.
Restricted Stock Units Issued to Employees - Service Condition
Restricted stock units that vest based upon a service condition are expensed on a straight-line basis over the requisite service period. These awards generally vest in three equal installments on each of the first three anniversaries of the grant date. The fair value of these awards is measured by the average of the high and low trading prices of the Company’s common stock on the measurement date reduced by the present value of dividends expected to be paid during the requisite service period.
In 2025, the Company granted 1,635 restricted stock units with a weighted average fair value per share of $381.11.
Stock Appreciation Rights
SARs grant the holder the right to receive, once vested, the value in shares of the Company’s common stock equal to the positive difference between the grant price, as determined using the mean of the high and low trading prices of the Company’s common stock on the measurement date, and the fair market value of the Company’s common stock on the date of exercise. This amount is payable in shares of the Company’s common stock. SARs vest and become exercisable in three equal installments during the first three years following the grant date and expire ten years from the grant date.
Activity related to SARs for the year ended December 31, 2025 is as follows (in thousands, except per share amounts):
Number of Rights
Weighted Average Exercise Price
Weighted Average Remaining Contractual Term
Aggregate Intrinsic Value
OUTSTANDING AT DECEMBER 31, 2024
489
$
198.12
Granted
66
393.19
Exercised
(96)
159.16
Forfeited
(5)
306.77
Canceled
—
—
OUTSTANDING AT DECEMBER 31, 2025
454
$
233.77
6.3
$
95,455
EXERCISABLE AT DECEMBER 31, 2025
318
$
184.49
5.3
$
82,540
The aggregated intrinsic value of SARs exercised during 2025, 2024 and 2023 was $25.2 million, $46.2 million and $36.6 million, respectively.
The fair value of each SAR award was measured using the Black-Scholes option pricing model.
The following table summarizes the weighted-average assumptions used in estimating the fair value of the SARs granted during the years 2025, 2024 and 2023:
Grant Date
Expected Dividend Yield
Expected Volatility
Risk Free Interest Rate
Expected Term
Weighted Avg. Grant Date Fair Value of 1 SAR
2025
1.2%
24.2%
4.4%
4.8 years
$100.15
2024
1.5%
25.7%
4.0%
4.8 years
$88.17
2023
1.8%
28.0%
3.7%
4.9 years
$62.79
HUBBELL INCORPORATED- Form 10-K
91
The expected dividend yield was calculated by dividing the Company’s expected annual dividend by the average stock price for the past three months. Expected volatilities are based on historical volatilities of the Company’s stock for a period consistent with the expected term. The expected term of SARs granted was based upon historical exercise behavior of SARs. The risk-free interest rate is based on the U.S. Treasury yield curve in effect at the time of grant for the expected term of the award.
Performance Shares
Performance shares represent the right to receive a share of the Company’s common stock subject to the achievement of certain market or performance conditions established by the Company’s Compensation Committee and measured over a three year period. Partial vesting in these awards may occur after separation from the Company for retirement eligible employees. Shares are not vested until approved by the Company’s Compensation Committee.
Performance Shares - Market Condition
In February 2025, 2024, and 2023, the Company granted performance share awards with an aggregate target payout of 8,542, 8,736 and 11,481 shares, respectively, that will vest subject to a market condition and service condition through the performance period. The market condition associated with the awards is the Company’s total shareholder return (“TSR”) compared to the TSR generated by the companies that comprise the S&P Capital Goods 900 index over a three-year performance period. Performance at target will result in vesting and issuance of the number of performance shares subject to the award, equal to a 100% payout. Performance below or above target can result in issuance in the range of 0%-200% of the number of shares subject to the award. Expense is recognized irrespective of the market condition being achieved.
The fair value of the performance share awards with a market condition for these grants was determined based upon a lattice model. The following table summarizes the related assumptions used to determine the fair values of the performance share awards with a market condition granted during February 2025, 2024 and 2023:
Grant Date
Stock Price on Measurement Date
Dividend Yield
Expected Volatility
Risk Free Interest Rate
Expected Term
Weighted Avg. Grant Date Fair Value
February 2025
$393.16
1.3%
31.0%
4.3%
2.9 years
$421.00
February 2024
$352.55
1.4%
30.6%
4.1%
2.9 years
$483.99
February 2023
$241.17
1.9%
39.4%
4.1%
2.9 years
$279.47
Expected volatilities are based on historical volatilities of the Company’s and members of the peer group’s stock over the expected term of the award. The risk free interest rate is based on the U.S. Treasury yield curve in effect at the time of the grant for the expected term of the award.
Performance Shares - Performance Condition
In February 2025, 2024, and 2023, the Company granted performance share awards with a target payout of 17,377, 17,770 and 23,316 shares, respectively, that will vest subject to an internal Company-based performance condition and service requirement.
Fifty percent of these performance shares subject to the award will vest based on the Company’s compounded annual growth rate of Net sales as compared to that of the companies that comprise the S&P Capital Goods 900 index. Fifty percent of these performance shares subject to the award will vest based on achieved operating profit margin performance as compared to internal targets. Each of these performance conditions is measured over the same three-year performance period. The cumulative result of these performance conditions can result in a number of shares earned in the range of 0%-200% of the target number of shares subject to the award.
The fair value of the award is measured based upon the average of the high and low trading prices of the Company’s common stock on the measurement date, reduced by the present value of dividends expected to be paid during the requisite service period. The Company expenses these awards on a straight-line basis over the requisite service period and including an assessment of the performance achieved to date. The weighted average fair value per share was $380.99, $341.19 and $230.64 for the awards granted in 2025, 2024, and 2023, respectively.
Grant Date
Fair Value
Performance Period
Payout Range
February 2025
$380.99
Jan 2025 - Dec 2027
0-200%
February 2024
$341.19
Jan 2024 - Dec 2026
0-200%
February 2023
$230.64
Jan 2023 - Dec 2025
0-200%
92
HUBBELL INCORPORATED - Form 10-K
NOTE 18 Earnings Per Share
The Company computes earnings per share using the two-class method, which is an earnings allocation formula that determines earnings per share for common stock and participating securities. Restricted stock granted by the Company is considered a participating security since it contains a non-forfeitable right to dividends.
The following table sets forth the computation of earnings per share for the three years ended December 31 (in millions, except per share amounts):
2025
2024
2023
Numerator:
Net income attributable to Hubbell Incorporated
$
887.1
$
779.0
$
751.4
Less: Earnings allocated to participating securities
(1.5)
(1.5)
(1.8)
Net income available to common shareholders
$
885.6
$
777.5
$
749.6
Denominator:
Average number of common shares outstanding
53.2
53.7
53.6
Potential dilutive common shares
0.3
0.3
0.4
Average number of diluted shares outstanding
53.5
54.0
54.0
Earnings per share:
Basic earnings per share
$
16.63
$
14.49
$
13.98
Diluted earnings per share
$
16.54
$
14.39
$
13.89
The Company did not have any material anti-dilutive securities in 2025, 2024 or 2023.
HUBBELL INCORPORATED- Form 10-K
93
NOTE 19 Accumulated Other Comprehensive Loss
A summary of the changes in Accumulated other comprehensive loss (net of tax) for the three years ended December 31, 2025 is provided below (in millions):
(Debit) credit
Cash Flow Hedge (Loss) Gain
Unrealized Gain (Loss) on Available-for-Sale Securities
Pension and Post Retirement Benefit Plan Adjustment
Cumulative Translation Adjustment
Total
BALANCE AT DECEMBER 31, 2022
$
0.6
$
(0.8)
$
(188.6)
$
(156.4)
$
(345.2)
Other comprehensive income (loss) before reclassifications
(0.3)
0.6
2.5
22.9
25.7
Amounts reclassified from accumulated other comprehensive loss
(0.6)
—
7.7
—
7.1
Current period other comprehensive income (loss)
(0.9)
0.6
10.2
22.9
32.8
BALANCE AT DECEMBER 31, 2023
$
(0.3)
$
(0.2)
$
(178.4)
$
(133.5)
$
(312.4)
Other comprehensive income (loss) before reclassifications
1.8
(0.1)
(22.5)
(60.3)
(81.1)
Amounts reclassified from accumulated other comprehensive loss
(0.5)
—
7.5
—
7.0
Current period other comprehensive income (loss)
1.3
(0.1)
(15.0)
(60.3)
(74.1)
BALANCE AT DECEMBER 31, 2024
$
1.0
$
(0.3)
$
(193.4)
$
(193.8)
$
(386.5)
Other comprehensive income (loss) before reclassifications
(0.9)
0.7
15.0
48.7
63.5
Amounts reclassified from accumulated other comprehensive loss
(0.4)
—
8.6
—
8.2
Current period other comprehensive income (loss)
(1.3)
0.7
23.6
48.7
71.7
BALANCE AT DECEMBER 31, 2025
$
(0.3)
$
0.4
$
(169.8)
$
(145.1)
$
(314.8)
A summary of the gain (loss) reclassifications out of Accumulated other comprehensive loss for the two years ended December 31 is provided below (in millions):
Details about Accumulated Other Comprehensive Loss Components
2025
2024
Location of Gain (Loss) Reclassified into Income
Cash flow hedges gain (loss):
Forward exchange contracts
$
0.7
$
0.6
Cost of goods sold
0.7
0.6
Total before tax
(0.3)
(0.1)
Tax (expense)
$
0.4
$
0.5
Gain net of tax
Amortization of defined benefit pension and post retirement benefit items:
Prior-service credits
$
(0.4)
(a)
$
(0.4)
(a)
Actuarial gains/(losses)
(10.7)
(a)
(9.5)
(a)
(11.1)
(9.9)
Total before tax
2.5
2.4
Tax benefit
$
(8.6)
$
(7.5)
(Loss) net of tax
Gains (losses) reclassified into earnings
$
(8.2)
$
(7.0)
(Loss) net of tax
(a)These accumulated other comprehensive loss components are included in the computation of net periodic pension cost (see Note 11 — Retirement Benefits for additional details).
94
HUBBELL INCORPORATED - Form 10-K
NOTE 20 Industry Segments and Geographic Area Information
Nature of Operations
The Company is a global manufacturer of quality electrical products and utility solutions for a broad range of customer and end-market applications. Products are either sourced complete, manufactured or assembled by subsidiaries in the United States, Canada, Puerto Rico, China, Mexico, the UK, Brazil, Australia, Spain, Ireland and the Republic of the Philippines. The Company also participates in joint ventures in Hong Kong and the Republic of the Philippines and maintains offices in Singapore, Italy, China, India, Mexico, South Korea, Chile and countries in the Middle East. Each of the above references to manufacturing locations, joint venture participation, and office locations relate to the three year period ending December 31, 2025.
The Company’s reporting segments consist of the Utility Solutions segment and the Electrical Solutions segment, as described below. This segment structure reflects the financial information and reports used by the Company’s management, specifically its chief operating decision maker (CODM), to make decisions regarding the Company’s business, including resource allocations and performance assessments, in compliance with ASC 280, Segment Reporting. The Company’s CODM is the Chairman of the Board, President and Chief Executive Officer.
The Company’s method for measuring profitability on a reportable segment basis and used by the CODM to assess performance and allocate resources is operating income. This measure is used to monitor performance compared to prior period, forecasted results, and the annual plan.
In the second quarter of 2025, the Company elected to change its method of accounting for certain inventories in the U.S. from LIFO to FIFO. The Company retrospectively applied this change in accounting principle to all prior periods including the segment information presented below. Refer to Note 1 for further information.
The Utility Solutions segment consists of businesses that enable the grid to conduct, communicate and control energy across utility applications. The Utility Solutions segment provides critical components that allow the grid to reliably transmit and distribute energy, as well as the communications and controls technologies to make the grid smarter and more flexible. This includes utility transmission & distribution (T&D) components such as arresters, insulators, connectors, anchors, bushings, enclosures, cutouts and switches. The Utility Solutions segment also offers solutions that serve The Edge of the utility infrastructure, including smart meters, communications systems, and protection and control devices. Hubbell Utility Solutions supports the electrical distribution, electrical transmission, water, gas distribution, telecommunications, and solar and wind markets
Hubbell Electrical Solutions consisting of businesses that are essential to managing power across a wide range of industries and applications. Hubbell Electrical Solutions provides the critical components that allow operators of buildings, factories, and other industrial infrastructure to connect, protect, wire and manage power reliability and efficiency. The Electrical Solutions segment comprises businesses that sell stock and custom products, including standard and special application wiring device products, rough-in electrical products, connector and grounding products, as well as other electrical equipment.
Products of the Electrical Solutions segment have applications in the light industrial, non-residential, wireless communications, transportation, data center, and heavy industrial markets. Electrical Solutions segment products are typically used in and around industrial, commercial and institutional facilities by electrical contractors, maintenance personnel, electricians, utilities, and telecommunications companies. In addition, certain of our businesses design and manufacture industrial controls and communication systems used in the non-residential and industrial markets. Many of these products are designed such that they can also be used in harsh and hazardous locations where a potential for fire and explosion exists due to the presence of flammable gasses and vapors. Harsh and hazardous products are primarily used in the oil and gas (onshore and offshore) and mining industries. We also offer a variety of wiring devices and electrical products that have residential and utility applications.
These products are sold under various brands and/or trademarks and are primarily sold through electrical and industrial distributors, home centers, retail and hardware outlets, and residential product oriented internet sites. Special application products are primarily sold through wholesale distributors to contractors, industrial customers and original equipment manufacturers.
Financial Information
Financial information by industry segment, product class and geographic area for each of the three years ended December 31, 2025, 2024 and 2023 is summarized below (in millions). When reading the data, the following items should be noted:
•Segment Net sales comprise sales to unaffiliated customers — inter-segment and inter-area sales are not significant and are eliminated in consolidation.
•Segment operating income consists of Net sales, less operating expenses, including total corporate expenses, which are generally allocated to each segment on the basis of the segment’s percentage of consolidated Net sales. Interest expense
HUBBELL INCORPORATED- Form 10-K
95
and investment income and other expense, net have not been allocated to segments as these items are centrally managed by the Company.
•General corporate assets not allocated to segments are principally cash, prepaid pensions, investments and deferred taxes. These assets have not been allocated as they are centrally managed by the Company.
INDUSTRY SEGMENT DATA
2025
2024
2023
Net Sales:
Utility Solutions
$
3,672.3
$
3,600.7
$
3,261.7
Electrical Solutions
2,172.3
2,027.8
2,111.2
TOTAL NET SALES
$
5,844.6
$
5,628.5
$
5,372.9
Cost of Goods Sold:
Utility Solutions
$
2,396.3
$
2,418.4
$
2,129.8
Electrical Solutions
1,384.2
1,304.5
1,366.1
Total Cost of Goods Sold
$
3,780.5
$
3,722.9
$
3,495.9
Gross Profit:
Utility Solutions
$
1,276.0
$
1,182.3
$
1,131.9
Electrical Solutions
788.1
723.3
745.1
Total Gross Profit
$
2,064.1
$
1,905.6
$
1,877.0
Selling and Administrative Expenses:
Utility Solutions
$
486.1
$
450.5
$
433.5
Electrical Solutions
369.2
362.0
416.1
Total Selling and Administrative Expenses
$
855.3
$
812.5
$
849.6
Operating Income:
Utility Solutions
$
789.9
$
731.8
$
698.4
Electrical Solutions
418.9
361.3
329.0
Total Operating Income
$
1,208.8
$
1,093.1
$
1,027.4
Loss on disposition of business (Note 3)
(0.4)
(5.3)
—
Interest expense, net
(64.1)
(73.8)
(36.7)
Other expense, net
(25.2)
(7.2)
(18.5)
INCOME BEFORE INCOME TAXES
$
1,119.1
$
1,006.8
$
972.2
Operating Income as a % of Net Sales
Utility Solutions
21.5
%
20.3
%
21.4
%
Electrical Solutions
19.3
%
17.8
%
15.6
%
Total Operating Income as % of Net Sales
20.7
%
19.4
%
19.1
%
2025
2024
2023
Assets:
Utility Solutions
$
5,603.8
$
4,569.1
$
4,690.1
Electrical Solutions
2,238.8
1,943.4
2,001.1
General Corporate
386.2
335.2
389.9
TOTAL ASSETS
$
8,228.8
$
6,847.7
$
7,081.1
Capital Expenditures:
Utility Solutions
$
81.3
$
103.6
$
99.5
Electrical Solutions
73.8
76.8
66.2
TOTAL CAPITAL EXPENDITURES
$
155.1
$
180.4
$
165.7
Depreciation and Amortization:
Utility Solutions
$
151.8
$
164.5
$
103.4
Electrical Solutions
54.3
47.6
46.3
TOTAL DEPRECIATION AND AMORTIZATION
$
206.1
$
212.1
$
149.7
96
HUBBELL INCORPORATED - Form 10-K
GEOGRAPHIC AREA DATA
2025
2024
2023
Net Sales:
United States
$
5,411.3
$
5,159.3
$
4,922.4
International
433.3
469.2
450.5
TOTAL NET SALES
$
5,844.6
$
5,628.5
$
5,372.9
Operating Income:
United States
$
1,123.6
$
1,008.6
$
925.9
International
85.2
84.5
101.5
TOTAL OPERATING INCOME
$
1,208.8
$
1,093.1
$
1,027.4
Long-lived Assets:
United States
$
5,122.9
$
4,128.9
$
4,250.7
International
486.1
457.3
488.8
TOTAL LONG-LIVED ASSETS
$
5,609.0
$
4,586.2
$
4,739.5
On a geographic basis, the Company defines “international” as operations based outside of the United States and its possessions. As a percentage of total Net sales, shipments from foreign operations directly to third parties were 7% in 2025, 8% in 2024 and 8% in 2023, with Canadian, UK, and Brazilian operations representing approximately 33%, 24%, and 19% respectively, of 2025 total international Net sales.
Long-lived assets, excluding deferred tax assets, of international subsidiaries were 9% of the consolidated total in 2025, 10% in 2024 and 10% in 2023, with UK, Brazil, and Spain operations representing approximately 21%, 18%, and 14%, respectively, of the international total in 2025. Export sales from United States operations were $326.7 million in 2025, $396.0 million in 2024 and $345.6 million in 2023.
NOTE 21 Guarantees
The Company records a liability equal to the fair value of guarantees in the Consolidated Balance Sheet in accordance with the accounting guidance for guarantees. When it is probable that a liability has been incurred and the amount can be reasonably estimated, the Company accrues for costs associated with guarantees. The most likely costs to be incurred are accrued based on an evaluation of currently available facts and, where no amount within a range of estimates is more likely, the minimum is accrued.
As of December 31, 2025, the fair value and maximum potential payment related to the Company’s guarantees were not material.
The Company offers product warranties which cover defects on most of its products. These warranties primarily apply to products that are properly installed, maintained and used for their intended purposes. The Company accrues estimated warranty costs at the time of sale. Estimated warranty expenses, recorded in cost of goods sold, are based upon historical information such as past experience, product failure rates, or the estimated number of units to be repaired or replaced. Adjustments are made to the product warranty accrual as claims are incurred, additional information becomes known or as historical experience indicates.
Changes in the accrual for product warranties for the two years ended December 31 are set forth below (in millions):
BALANCE AT DECEMBER 31, 2023
$
39.2
Provision
12.8
Expenditures/other
(10.3)
BALANCE AT DECEMBER 31, 2024
$
41.7
Provision
10.4
Expenditures/other
(18.1)
BALANCE AT DECEMBER 31, 2025(a)
$
34.0
(a) Refer to Note 9 – Other Accrued Liabilities and Note 10 – Other Non-Current Liabilities for a breakout of short-term and long-term warranties.
HUBBELL INCORPORATED- Form 10-K
97
NOTE 22 Restructuring Costs
During 2025, we incurred costs for restructuring actions initiated in 2025 as well as costs relating to restructuring actions initiated in the prior year. Our restructuring actions are associated with cost reduction efforts that include the consolidation of manufacturing and distribution facilities, as well as, workforce reductions and the sale or exit of business units we determine to be non-strategic. Restructuring costs are primarily severance and employee benefits, asset impairments, as well as facility closure, contract termination and certain pension costs that are directly related to restructuring actions. These costs are predominantly settled in cash from our operating activities and are generally settled within one year, with the exception of asset impairments, which are non-cash.
Pre-tax restructuring costs incurred in each of our segments and the location of the costs in the Consolidated Statement of Income for the years ended December 31, 2025, 2024 and 2023 are as follows (in millions):
Twelve Months Ended December 31, 2025
Twelve Months Ended December 31, 2024
Twelve Months Ended December 31, 2023
Utility Solutions
Electrical Solutions
Total
Utility Solutions
Electrical Solutions
Total
Utility Solutions
Electrical Solutions
Total
Restructuring costs
Cost of goods sold
$
5.6
$
4.3
$
9.9
$
3.2
$
6.1
$
9.3
$
2.7
$
1.7
$
4.4
S&A expense
0.5
1.6
2.1
1.3
2.2
3.5
0.2
0.8
1.0
Total restructuring costs
$
6.1
$
5.9
$
12.0
$
4.5
$
8.3
$
12.8
$
2.9
$
2.5
$
5.4
The following table summarizes the accrued liabilities for our restructuring actions (in millions):
Beginning Accrued Restructuring Balance 1/1/25
Pre-tax Restructuring Costs
Utilization and Foreign Exchange
Ending Accrued Restructuring Balance 12/31/25
2025 Restructuring Actions
Severance
$
—
$
4.6
$
(4.0)
$
0.6
Asset write-downs
—
1.6
(1.6)
—
Facility closure and other costs
—
2.9
(2.9)
—
Total 2025 Restructuring Actions
$
—
$
9.1
$
(8.5)
$
0.6
2024 and Prior Restructuring Actions
Severance
$
4.5
$
0.5
$
(1.4)
$
3.6
Asset write-downs
—
—
—
—
Facility closure and other costs
0.1
2.4
(2.0)
0.5
Total 2024 and Prior Restructuring Actions
$
4.6
$
2.9
$
(3.4)
$
4.1
Total Restructuring Actions
$
4.6
$
12.0
$
(11.9)
$
4.7
The actual and expected pre-tax costs for our restructuring actions are as follows (in millions):
Expected Costs
Costs incurred in 2023
Costs incurred in 2024
Costs incurred in 2025
Remaining costs at 12/31/25
2025 Restructuring Actions
Utility Solutions
$
7.7
$
—
$
—
$
6.0
$
1.7
Electrical Solutions
3.3
—
—
3.1
0.2
Total 2025 Restructuring Actions
$
11.0
$
—
$
—
$
9.1
$
1.9
2024 Restructuring Actions
Utility Solutions
$
4.2
$
—
$
4.1
$
0.1
$
—
Electrical Solutions
11.7
—
6.8
2.8
2.1
Total 2024 Restructuring Actions
$
15.9
$
—
$
10.9
$
2.9
$
2.1
2023 and Prior Restructuring Actions
Utility Solutions
$
3.3
$
2.9
$
0.4
$
—
$
—
Electrical Solutions
4.0
2.5
1.5
—
—
Total 2023 and Prior Restructuring Actions
$
7.3
$
5.4
$
1.9
$
—
$
—
Total Restructuring Actions
$
34.2
$
5.4
$
12.8
$
12.0
$
4.0
98
HUBBELL INCORPORATED - Form 10-K
NOTE 23 Leases
Our operating leases primarily consist of office space, certain manufacturing facilities, and vehicles. Our finance leases are not material. The term of our operating leases is generally 10 years or less, in some cases, with options to extend the term for up to 5 years, or options to terminate after one year without penalty. In general, our vehicle lease payments contain a monthly base rent payment. Certain other lease agreements contain variable payments related to a consumer price index or similar metric. Any change in payment amounts as a result of a change in a rate or index are considered variable lease payments and recognized as profit or loss when incurred.
Rent expense for operating leases in the Consolidated Statements of Income for the years ended December 31, 2025, December 31, 2024, and December 31, 2023 were $45.3 million, $41.9 million, and $37.7 million, respectively. Cash paid for operating leases for the years ended December 31, 2025, December 31, 2024, and December 31, 2023 was $44.6 million, $41.6 million, and $34.8 million, respectively, and reported as cash outflows from operating activities in the Consolidated Statements of Cash Flows. Right-of-use (“ROU”) assets obtained in exchange for lease obligations for the year ended December 31, 2025 and December 31, 2024 were $48.4 million and $37.5 million, respectively. Included in 2025 was $5.3 million related to acquisitions in 2025.
Amounts recognized for operating leases in the Consolidated Balance Sheets are as follows (in millions):
December 31, 2025
December 31, 2024
Operating lease right-of-use assets
$
155.5
$
146.2
TOTAL ASSETS
$
155.5
$
146.2
Other accrued liabilities
$
40.7
$
34.2
Other non-current liabilities
121.2
117.3
TOTAL LIABILITIES
$
161.9
$
151.5
The weighted average remaining lease term as of December 31, 2025 and December 31, 2024 for operating leases was 4.8 and 4.7 years, respectively. The weighted average discount rate used to measure the ROU asset and lease liability for operating leases was 4.3% as of December 31, 2025 and 3.8% as of December 31, 2024.
Future maturities of our operating lease liabilities as of December 31, 2025 are as follows (in millions):
2026
2027
2028
2029
2030
Thereafter
Total Payments
Imputed Interest
Total
Operating Leases
$46.6
41.1
33.9
22.8
12.7
21.2
178.3
(16.4)
$161.9
HUBBELL INCORPORATED- Form 10-K
99
NOTE 24 Quarterly Financial Data (Unaudited)
The table below sets forth summarized quarterly consolidated financial data for the years ended December 31, 2025 and 2024. The quarterly consolidated financial data for the year ended December 31, 2024 has been retrospectively adjusted to reflect the change in accounting principle discussed in Note 1 (in millions, except per share amounts):
First Quarter
Second Quarter
Third Quarter
Fourth Quarter
2025
Net sales
$
1,365.2
$
1,484.3
$
1,502.4
$
1,492.7
Cost of goods sold
$
922.6
$
932.2
$
958.1
$
967.6
Gross profit
$
442.6
$
552.1
$
544.3
$
525.1
Selling & administrative expenses
$
212.2
$
215.8
$
213.7
$
213.6
Net income
$
164.5
$
245.5
$
256.7
$
225.2
Net income attributable to Hubbell Incorporated
$
163.2
$
244.2
$
255.5
$
224.2
Basic earnings per share
$
3.04
$
4.58
$
4.80
$
4.21
Diluted earnings per share
$
3.03
$
4.56
$
4.77
$
4.19
First Quarter
Second Quarter
Third Quarter
Fourth Quarter
2024
Net sales
$
1,399.1
$
1,452.5
$
1,442.6
$
1,334.3
Cost of goods sold
$
965.5
$
938.7
$
936.6
$
882.1
Gross profit
$
433.6
$
513.8
$
506.0
$
452.2
Selling & administrative expenses
$
219.2
$
207.5
$
193.3
$
192.5
Net income
$
138.4
$
219.1
$
227.8
$
199.4
Net income attributable to Hubbell incorporated
$
137.1
$
217.5
$
226.2
$
198.2
Basic earnings per share
$
2.55
$
4.04
$
4.21
$
3.69
Diluted earnings per share
$
2.53
$
4.01
$
4.18
$
3.66
ITEM 9 Changes in and Disagreements with Accountants on Accounting and Financial Disclosure
Not applicable.
HUBBELL INCORPORATED- Form 10-K
100
ITEM 9A Controls and Procedures
The Company maintains disclosure controls and procedures that are designed to ensure that information required to be disclosed in Exchange Act reports is recorded, processed, summarized and reported within the time periods specified in the SEC’s rules and forms, and that such information is accumulated and communicated to management, including the Chief Executive Officer and Chief Financial Officer, as appropriate, to allow timely decisions regarding required disclosure. Management necessarily applied its judgment in assessing the costs and benefits of such controls and procedures which, by their nature, can provide only reasonable assurance that the controls and procedures will meet their objectives.
During the year ended December 31, 2025, the Company acquired DMC Power and Nicor, for an aggregate purchase price of approximately $885 million. Because the Company has not yet fully incorporated the internal controls and procedures of the acquired entities into the Company's internal control over financial reporting, management excluded these businesses from its assessment of the effectiveness of internal control over financial reporting as of December 31, 2025. These entities accounted for approximately 4% of the Company's total assets excluding intangibles and goodwill as of December 31, 2025 and approximately 1% of the Company's net sales for the year then ended December 31, 2025.
The Company carried out an evaluation, under the supervision and with the participation of management, including the Chief Executive Officer and Chief Financial Officer, of the effectiveness of the design and operation of the Company’s disclosure controls and procedures as defined in Exchange Act Rules 13a-15(e) and 15d-15(e), as of the end of the period covered by this report on Form 10-K. Based upon that evaluation, each of the Chief Executive Officer and Chief Financial Officer concluded that the Company’s disclosure controls and procedures are effective at a reasonable assurance level. Management’s annual report on internal control over financial reporting and the independent registered public accounting firm’s audit report on the effectiveness of our internal control over financial reporting as of December 31, 2025 are included in Item 8 of this Annual Report on Form 10-K, and are incorporated herein by reference.
There has been no change in the Company’s internal control over financial reporting that occurred during the quarter ended December 31, 2025 that has materially affected, or is reasonably likely to materially affect, the Company’s internal control over financial reporting.
ITEM 9B Other Information
During the three months ended December 31, 2025, no Director or officer of the Company adopted or terminated a “Rule 10b5-1 trading arrangement” or “non-Rule 10b5-1 trading arrangement,” as each term is defined in Item 408(a) of Regulation S-K.
ITEM 9C Disclosure Regarding Foreign Jurisdictions that Prevent Inspections
Not applicable.
HUBBELL INCORPORATED- Form 10-K
101
PART III
ITEM 10 Directors, Executive Officers and Corporate Governance
Certain of the information required by this item regarding executive officers is included under the subheading “Information about our Executive Officers” at the end of Part I of this Form 10-K and the remaining required information is incorporated by reference from our definitive proxy statement to be filed in connection with the Company’s 2026 annual meeting of shareholders.
ITEM 11 Executive Compensation
The information required by this item is incorporated by reference from our definitive proxy statement to be filed in connection with the Company’s 2026 annual meeting of shareholders.
ITEM 12 Security Ownership of Certain Beneficial Owners and Management and Related Stockholder Matters
Equity Compensation Plan Information
The following table provides information as of December 31, 2025 with respect to the Company’s common stock that may be issued under the Company’s equity compensation plans (in thousands, except per share amounts):
A
B
C
Plan Category
Number of Securities to be Issued upon Exercise of Outstanding Options, Warrants and Rights
Weighted Average Exercise Price of Outstanding Options, Warrants and Rights
Number of Securities Remaining Available for Future Issuance Under Equity Compensation Plans (Excluding Securities Reflected in Column A)
Equity Compensation Plans Approved by Shareholders(a)
615
(c)(d)
$
233.77
(e)
1,017
(c)
Equity Compensation Plans Not Approved by Shareholders(b)
49
(c)(f)
—
113
(c)
TOTAL
664
$
233.77
1,130
(a)The Hubbell Incorporated Incentive Award Plan.
(b)The Company’s Deferred Compensation Plan for Directors as amended and restated. The plan provides Directors the opportunity to defer the payment of earned compensation that is later payable in the form of common stock. For a more detailed description of the material features of the plan, the information is incorporated by reference to the subheading “Deferred Compensation Plan” of the definitive proxy statement for the Company’s 2026 annual meeting of shareholders.
(c)Hubbell common stock.
(d)Includes approximately 100,000 performance share awards assuming a maximum payout target. The maximum payout target may not be achieved for all of these awards.
(e)Weighted average exercise price excludes performance share awards included in column A.
(f)Represents amount of shares currently deferred under this plan. These shares are not included in the total weighted average exercise price included in column B.
The remaining information required by this item is incorporated by reference to the subheading “Stock Ownership Information” of the definitive proxy statement for the Company’s 2026 annual meeting of shareholders.
HUBBELL INCORPORATED- Form 10-K
102
ITEM 13 Certain Relationships and Related Transactions and Director Independence
The information required by this item is incorporated by reference from our definitive proxy statement to be filed in connection with the Company’s 2026 annual meeting of shareholders.
ITEM 14 Principal Accountant Fees and Services
The information required by this item is incorporated by reference from our definitive proxy statement to be filed in connection with the Company’s 2026 annual meeting of shareholders.
HUBBELL INCORPORATED- Form 10-K
103
PART IV
ITEM 15 Exhibits and Financial Statement Schedule
1. Financial Statements and Schedule
Financial statements and schedule listed in the Index to Financial Statements and Schedule are filed as part of this Annual Report on Form 10-K.
The following materials from Hubbell Incorporated’s Annual Report on Form 10-K for the year ended December 31, 2025 formatted in Inline Extensible Business Reporting Language (iXBRL): (i) the Consolidated Statements of Income, (ii) the Consolidated Statements of Comprehensive Income, (iii) the Consolidated Balance Sheets, (iv) the Consolidated Statements of Cash Flows, (v) the Consolidated Statements of Changes in Equity, and (vi) Notes to the Consolidated Financial Statements.
*
104
The cover page of this Annual Report on Form 10-K for the year end December 31, 2025, formatted in Inline XBRL (included within the Exhibit 101 attachments)
*
†
A management contract or compensatory plan or arrangement required to be filed as an exhibit pursuant to Item 15(a)(3) of Form 10-K.
††
Schedules and attachments have been omitted pursuant to Item 601(a)(5) of Regulation S-K. The Company hereby undertakes to furnish supplemental copies of any of the omitted schedules and attachments upon request by the U.S. Securities and Exchange Commission; provided, that Hubbell may request confidential treatment pursuant to Rule 24b-2 of the Securities Exchange Act of 1934, as amended, for any schedules so furnished.
*
Filed herewith.
**
Furnished herewith.
ITEM 16 FORM 10-K SUMMARY
None.
HUBBELL INCORPORATED- Form 10-K
107
Signatures
Pursuant to the requirements of Section 13 or 15(d) of the Securities Exchange Act of 1934, the registrant has duly caused this report to be signed on its behalf by the undersigned, thereunto duly authorized.
HUBBELL INCORPORATED
By
/s/ JONATHAN M. DEL NERO
By
/s/ JOSEPH A. CAPOZZOLI
Jonathan M. Del Nero
Joseph A. Capozzoli
Vice President, Controller
Senior Vice President,
Chief Financial Officer
Date:
February 12, 2026
Pursuant to the requirements of the Securities Exchange Act of 1934, this report has been signed below by the following persons on behalf of the registrant and in the capacities and on the dates indicated.(1)
Title
Date
By
/s/ G. W. BAKKER
G. W. Bakker
Chairman of the Board, President and Chief Executive Officer