Interpublic Group July 22, 2025 SECOND QUARTER 2025 EARNINGS CONFERENCE CALL
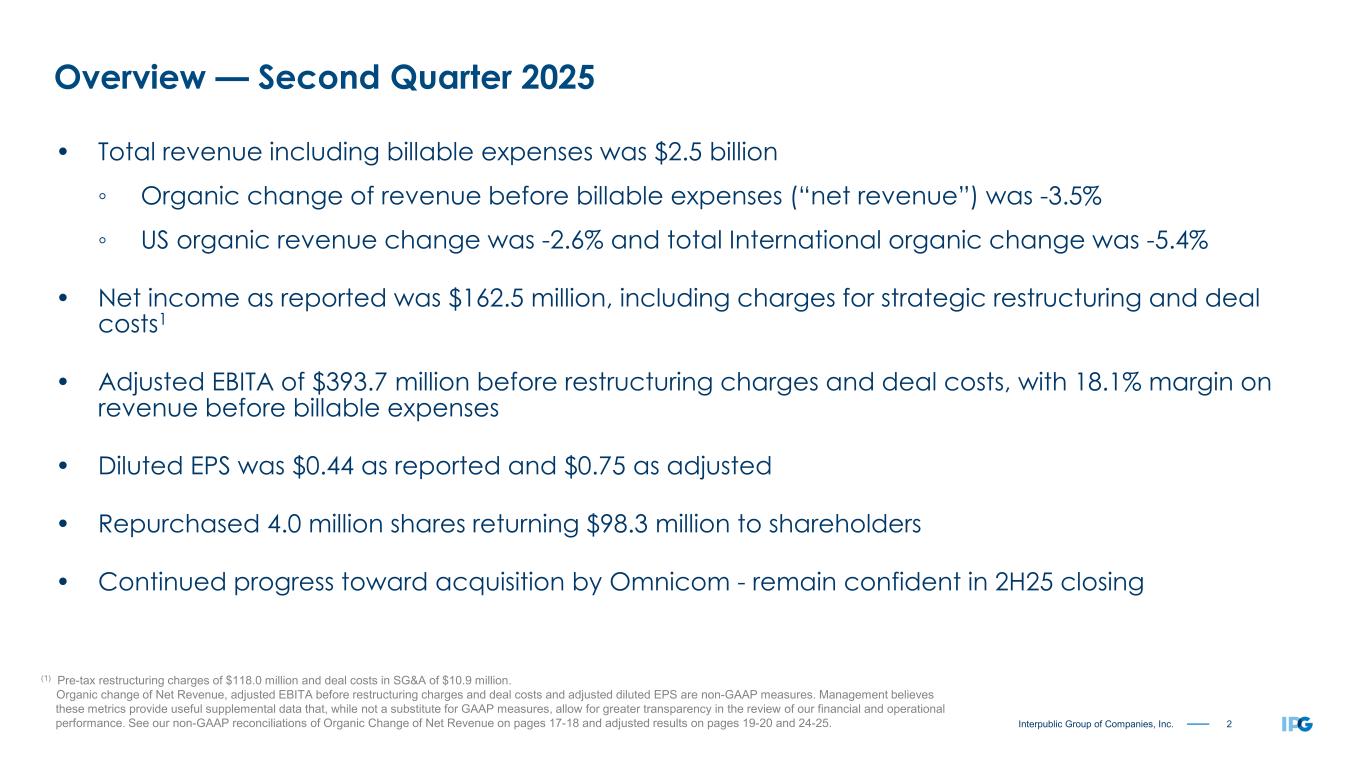
2Interpublic Group of Companies, Inc. (1) Pre-tax restructuring charges of $118.0 million and deal costs in SG&A of $10.9 million. Organic change of Net Revenue, adjusted EBITA before restructuring charges and deal costs and adjusted diluted EPS are non-GAAP measures. Management believes these metrics provide useful supplemental data that, while not a substitute for GAAP measures, allow for greater transparency in the review of our financial and operational performance. See our non-GAAP reconciliations of Organic Change of Net Revenue on pages 17-18 and adjusted results on pages 19-20 and 24-25. • Total revenue including billable expenses was $2.5 billion ◦ Organic change of revenue before billable expenses (“net revenue”) was -3.5% ◦ US organic revenue change was -2.6% and total International organic change was -5.4% • Net income as reported was $162.5 million, including charges for strategic restructuring and deal costs1 • Adjusted EBITA of $393.7 million before restructuring charges and deal costs, with 18.1% margin on revenue before billable expenses • Diluted EPS was $0.44 as reported and $0.75 as adjusted • Repurchased 4.0 million shares returning $98.3 million to shareholders • Continued progress toward acquisition by Omnicom - remain confident in 2H25 closing Overview — Second Quarter 2025
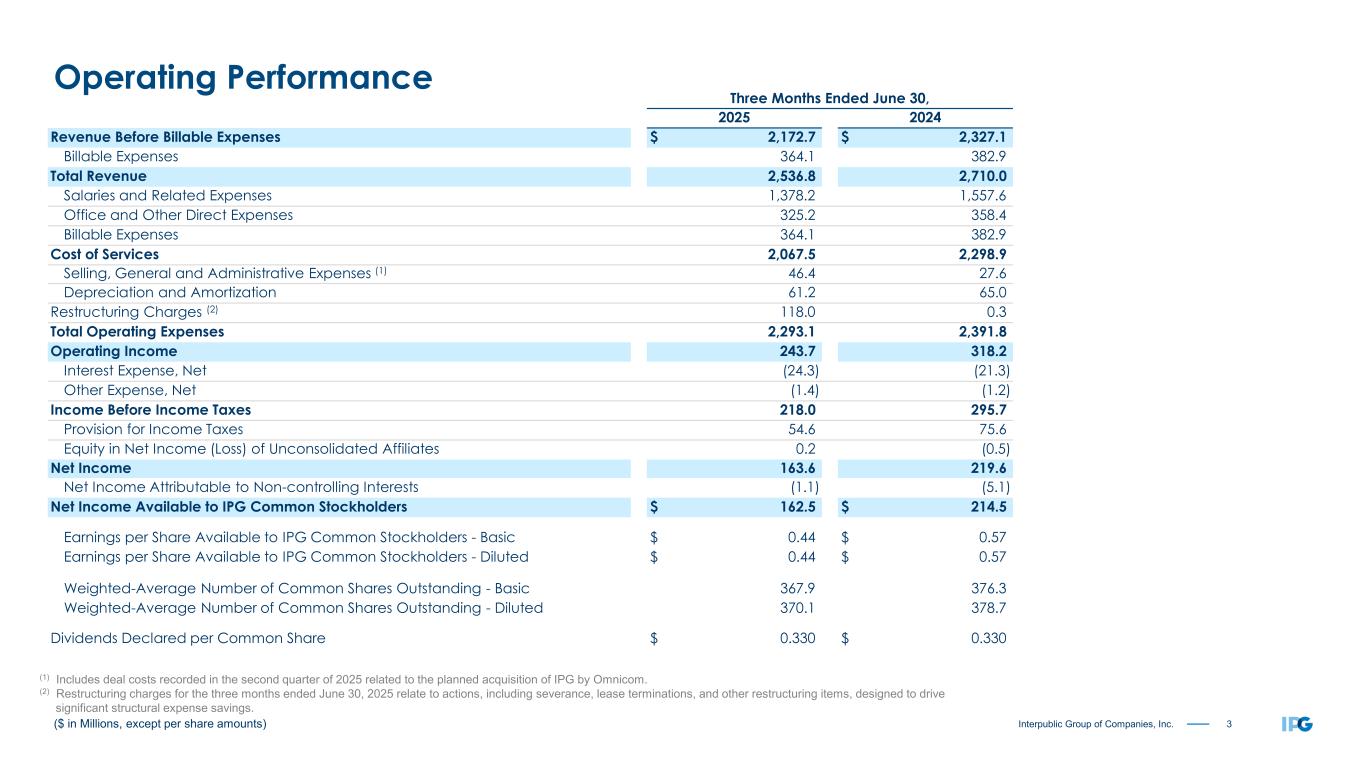
3Interpublic Group of Companies, Inc. Three Months Ended June 30, 2025 2024 Revenue Before Billable Expenses $ 2,172.7 $ 2,327.1 Billable Expenses 364.1 382.9 Total Revenue 2,536.8 2,710.0 Salaries and Related Expenses 1,378.2 1,557.6 Office and Other Direct Expenses 325.2 358.4 Billable Expenses 364.1 382.9 Cost of Services 2,067.5 2,298.9 Selling, General and Administrative Expenses (1) 46.4 27.6 Depreciation and Amortization 61.2 65.0 Restructuring Charges (2) 118.0 0.3 Total Operating Expenses 2,293.1 2,391.8 Operating Income 243.7 318.2 Interest Expense, Net (24.3) (21.3) Other Expense, Net (1.4) (1.2) Income Before Income Taxes 218.0 295.7 Provision for Income Taxes 54.6 75.6 Equity in Net Income (Loss) of Unconsolidated Affiliates 0.2 (0.5) Net Income 163.6 219.6 Net Income Attributable to Non-controlling Interests (1.1) (5.1) Net Income Available to IPG Common Stockholders $ 162.5 $ 214.5 Earnings per Share Available to IPG Common Stockholders - Basic $ 0.44 $ 0.57 Earnings per Share Available to IPG Common Stockholders - Diluted $ 0.44 $ 0.57 Weighted-Average Number of Common Shares Outstanding - Basic 367.9 376.3 Weighted-Average Number of Common Shares Outstanding - Diluted 370.1 378.7 Dividends Declared per Common Share $ 0.330 $ 0.330 ($ in Millions, except per share amounts) Operating Performance (1) Includes deal costs recorded in the second quarter of 2025 related to the planned acquisition of IPG by Omnicom. (2) Restructuring charges for the three months ended June 30, 2025 relate to actions, including severance, lease terminations, and other restructuring items, designed to drive significant structural expense savings.
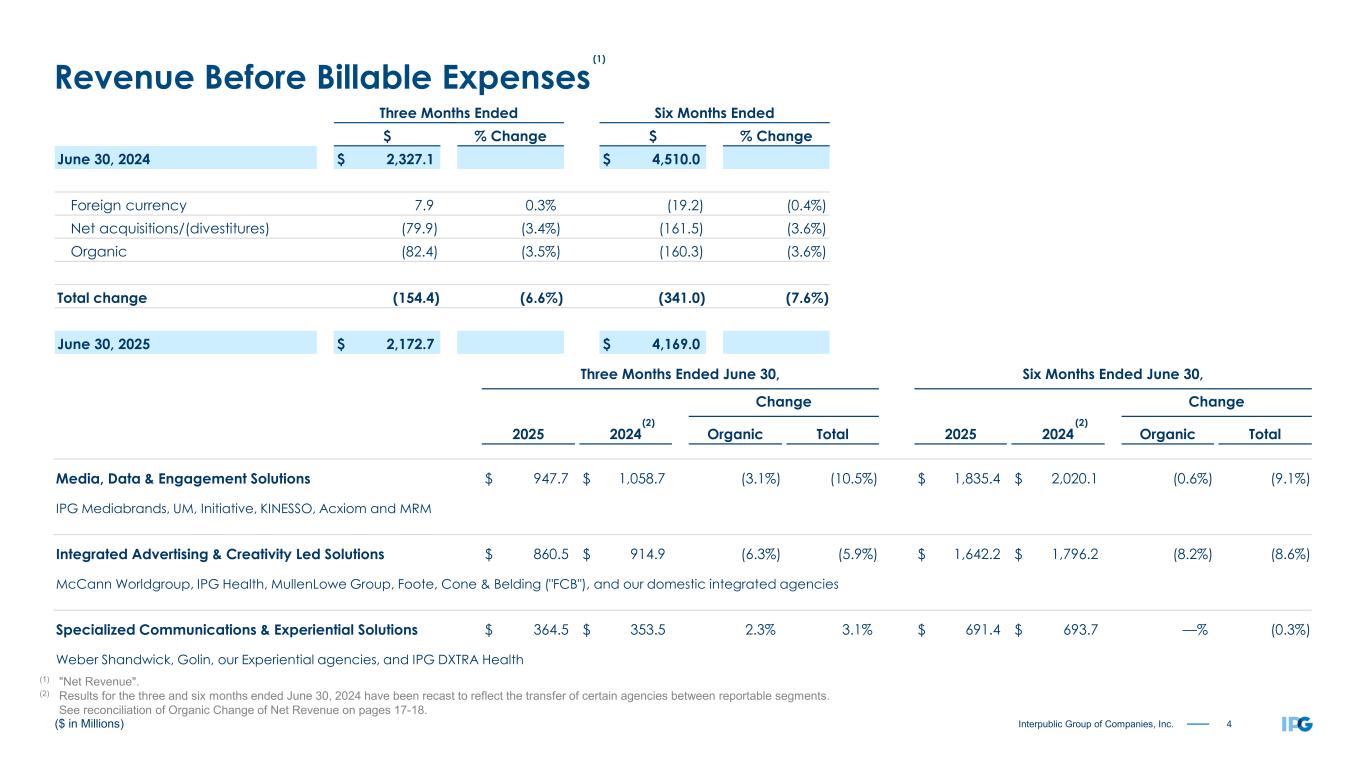
4Interpublic Group of Companies, Inc. Revenue Before Billable Expenses Three Months Ended June 30, Six Months Ended June 30, Change Change 2025 2024 Organic Total 2025 2024 Organic Total Media, Data & Engagement Solutions $ 947.7 $ 1,058.7 (3.1%) (10.5%) $ 1,835.4 $ 2,020.1 (0.6%) (9.1%) IPG Mediabrands, UM, Initiative, KINESSO, Acxiom and MRM Integrated Advertising & Creativity Led Solutions $ 860.5 $ 914.9 (6.3%) (5.9%) $ 1,642.2 $ 1,796.2 (8.2%) (8.6%) McCann Worldgroup, IPG Health, MullenLowe Group, Foote, Cone & Belding ("FCB"), and our domestic integrated agencies Specialized Communications & Experiential Solutions $ 364.5 $ 353.5 2.3% 3.1% $ 691.4 $ 693.7 —% (0.3%) Weber Shandwick, Golin, our Experiential agencies, and IPG DXTRA Health (1) "Net Revenue". (2) Results for the three and six months ended June 30, 2024 have been recast to reflect the transfer of certain agencies between reportable segments. See reconciliation of Organic Change of Net Revenue on pages 17-18. ($ in Millions) Three Months Ended Six Months Ended $ % Change $ % Change June 30, 2024 $ 2,327.1 $ 4,510.0 Foreign currency 7.9 0.3% (19.2) (0.4%) Net acquisitions/(divestitures) (79.9) (3.4%) (161.5) (3.6%) Organic (82.4) (3.5%) (160.3) (3.6%) Total change (154.4) (6.6%) (341.0) (7.6%) June 30, 2025 $ 2,172.7 $ 4,169.0 (1) (2) (2)
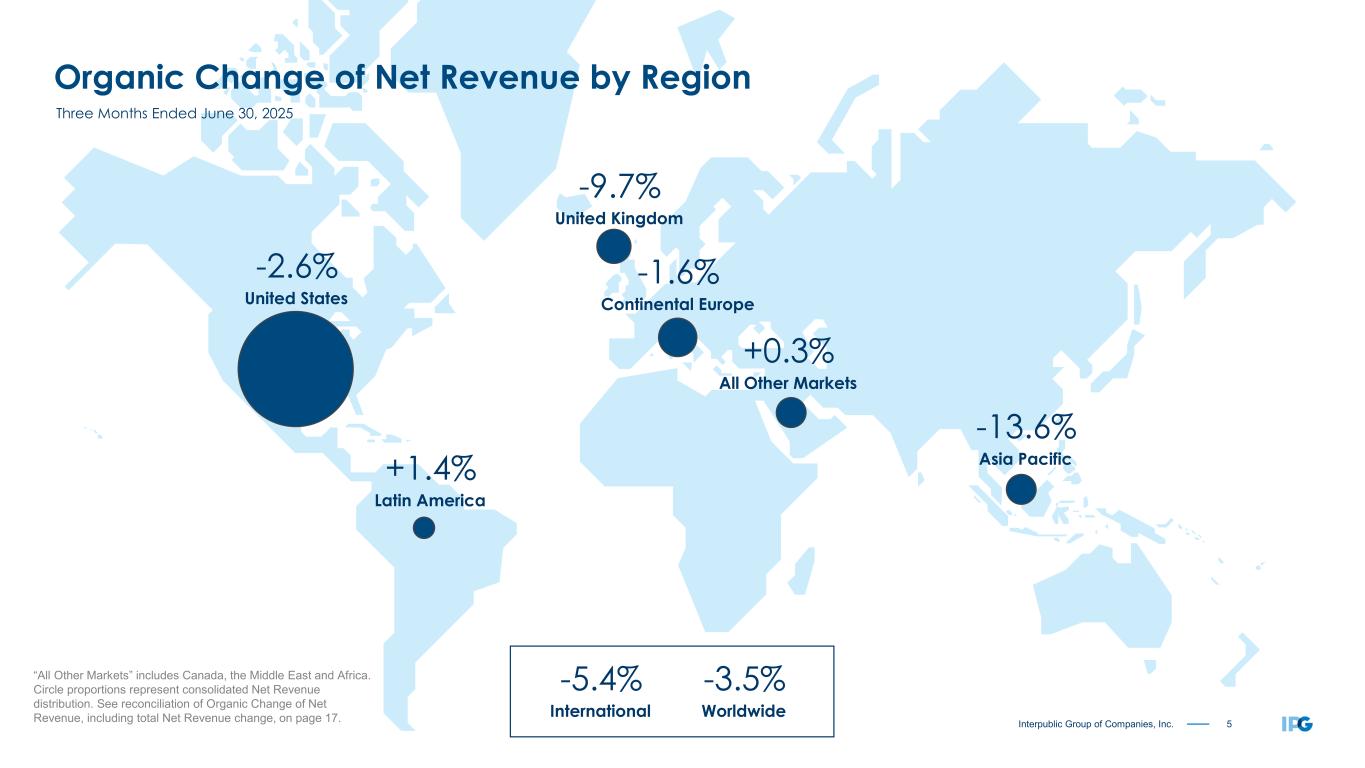
5Interpublic Group of Companies, Inc. Organic Change of Net Revenue by Region Three Months Ended June 30, 2025 -2.6% United States -9.7% United Kingdom -1.6% Continental Europe +1.4% Latin America -13.6% Asia Pacific -5.4% International -3.5% Worldwide +0.3% All Other Markets “All Other Markets” includes Canada, the Middle East and Africa. Circle proportions represent consolidated Net Revenue distribution. See reconciliation of Organic Change of Net Revenue, including total Net Revenue change, on page 17.
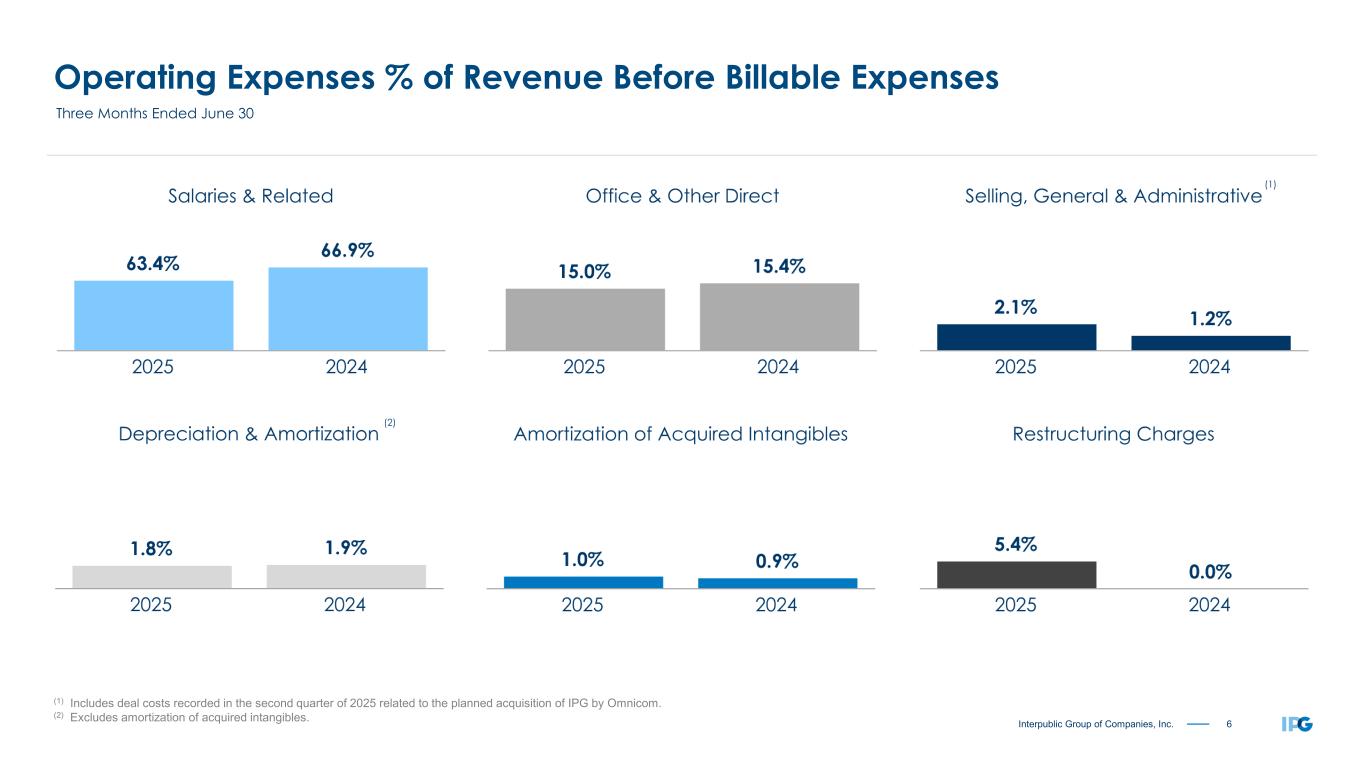
6Interpublic Group of Companies, Inc. Operating Expenses % of Revenue Before Billable Expenses (1) Includes deal costs recorded in the second quarter of 2025 related to the planned acquisition of IPG by Omnicom. (2) Excludes amortization of acquired intangibles. (2) Three Months Ended June 30 (1)
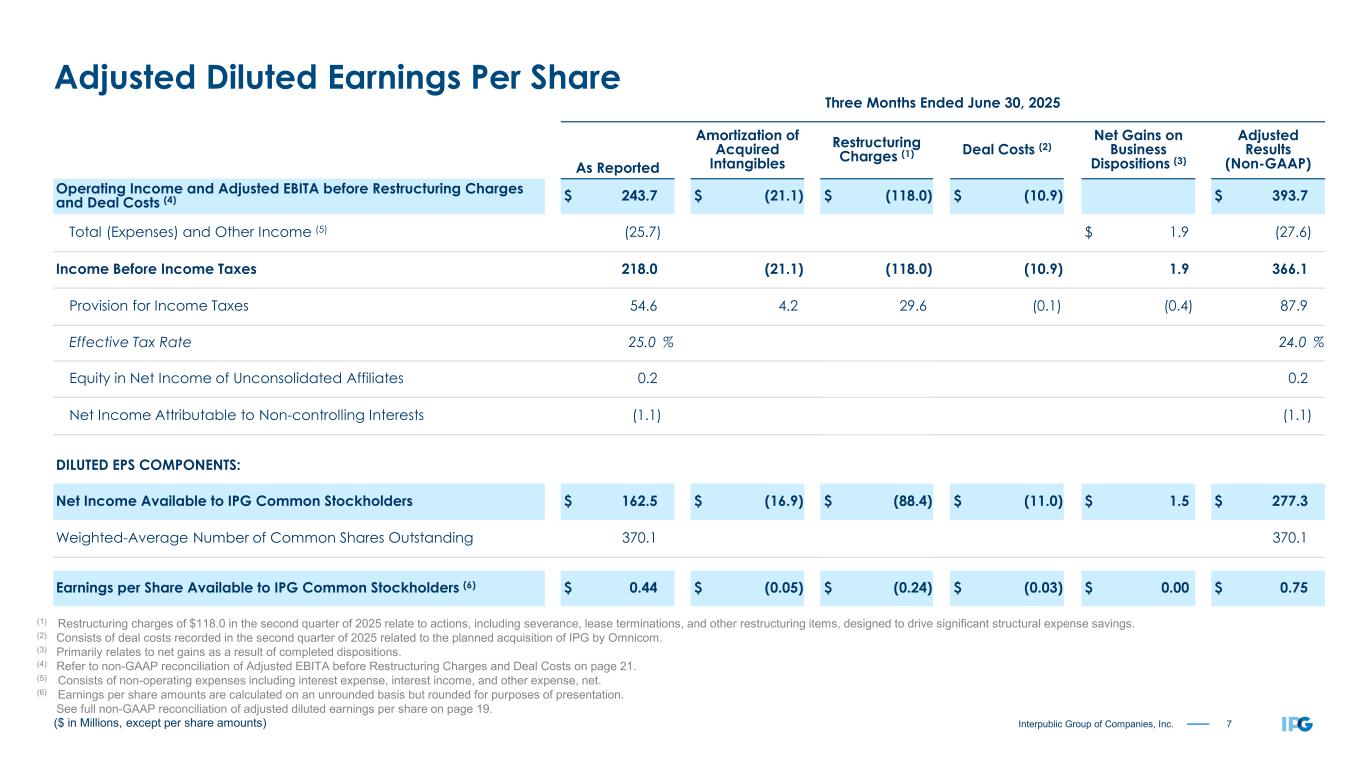
7Interpublic Group of Companies, Inc. Three Months Ended June 30, 2025 As Reported Amortization of Acquired Intangibles Restructuring Charges (1) Deal Costs (2) Net Gains on Business Dispositions (3) Adjusted Results (Non-GAAP) Operating Income and Adjusted EBITA before Restructuring Charges and Deal Costs (4) $ 243.7 $ (21.1) $ (118.0) $ (10.9) $ 393.7 Total (Expenses) and Other Income (5) (25.7) $ 1.9 (27.6) Income Before Income Taxes 218.0 (21.1) (118.0) (10.9) 1.9 366.1 Provision for Income Taxes 54.6 4.2 29.6 (0.1) (0.4) 87.9 Effective Tax Rate 25.0 % 24.0 % Equity in Net Income of Unconsolidated Affiliates 0.2 0.2 Net Income Attributable to Non-controlling Interests (1.1) (1.1) DILUTED EPS COMPONENTS: Net Income Available to IPG Common Stockholders $ 162.5 $ (16.9) $ (88.4) $ (11.0) $ 1.5 $ 277.3 Weighted-Average Number of Common Shares Outstanding 370.1 370.1 Earnings per Share Available to IPG Common Stockholders (6) $ 0.44 $ (0.05) $ (0.24) $ (0.03) $ 0.00 $ 0.75 ($ in Millions, except per share amounts) (1) Restructuring charges of $118.0 in the second quarter of 2025 relate to actions, including severance, lease terminations, and other restructuring items, designed to drive significant structural expense savings. (2) Consists of deal costs recorded in the second quarter of 2025 related to the planned acquisition of IPG by Omnicom. (3) Primarily relates to net gains as a result of completed dispositions. (4) Refer to non-GAAP reconciliation of Adjusted EBITA before Restructuring Charges and Deal Costs on page 21. (5) Consists of non-operating expenses including interest expense, interest income, and other expense, net. (6) Earnings per share amounts are calculated on an unrounded basis but rounded for purposes of presentation. See full non-GAAP reconciliation of adjusted diluted earnings per share on page 19. Adjusted Diluted Earnings Per Share
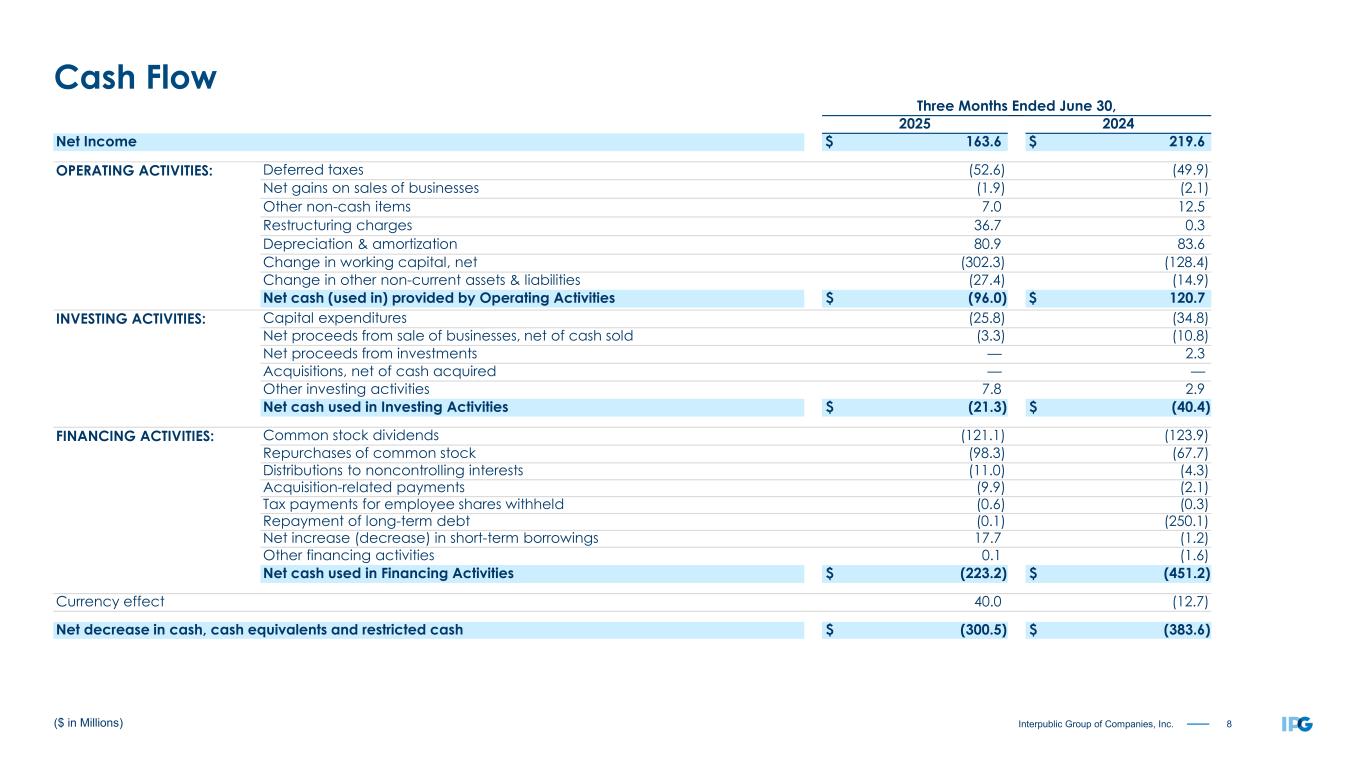
8Interpublic Group of Companies, Inc. Three Months Ended June 30, 2025 2024 Net Income $ 163.6 $ 219.6 OPERATING ACTIVITIES: Deferred taxes (52.6) (49.9) Net gains on sales of businesses (1.9) (2.1) Other non-cash items 7.0 12.5 Restructuring charges 36.7 0.3 Depreciation & amortization 80.9 83.6 Change in working capital, net (302.3) (128.4) Change in other non-current assets & liabilities (27.4) (14.9) Net cash (used in) provided by Operating Activities $ (96.0) $ 120.7 INVESTING ACTIVITIES: Capital expenditures (25.8) (34.8) Net proceeds from sale of businesses, net of cash sold (3.3) (10.8) Net proceeds from investments — 2.3 Acquisitions, net of cash acquired — — Other investing activities 7.8 2.9 Net cash used in Investing Activities $ (21.3) $ (40.4) FINANCING ACTIVITIES: Common stock dividends (121.1) (123.9) Repurchases of common stock (98.3) (67.7) Distributions to noncontrolling interests (11.0) (4.3) Acquisition-related payments (9.9) (2.1) Tax payments for employee shares withheld (0.6) (0.3) Repayment of long-term debt (0.1) (250.1) Net increase (decrease) in short-term borrowings 17.7 (1.2) Other financing activities 0.1 (1.6) Net cash used in Financing Activities $ (223.2) $ (451.2) Currency effect 40.0 (12.7) Net decrease in cash, cash equivalents and restricted cash $ (300.5) $ (383.6) ($ in Millions) Cash Flow
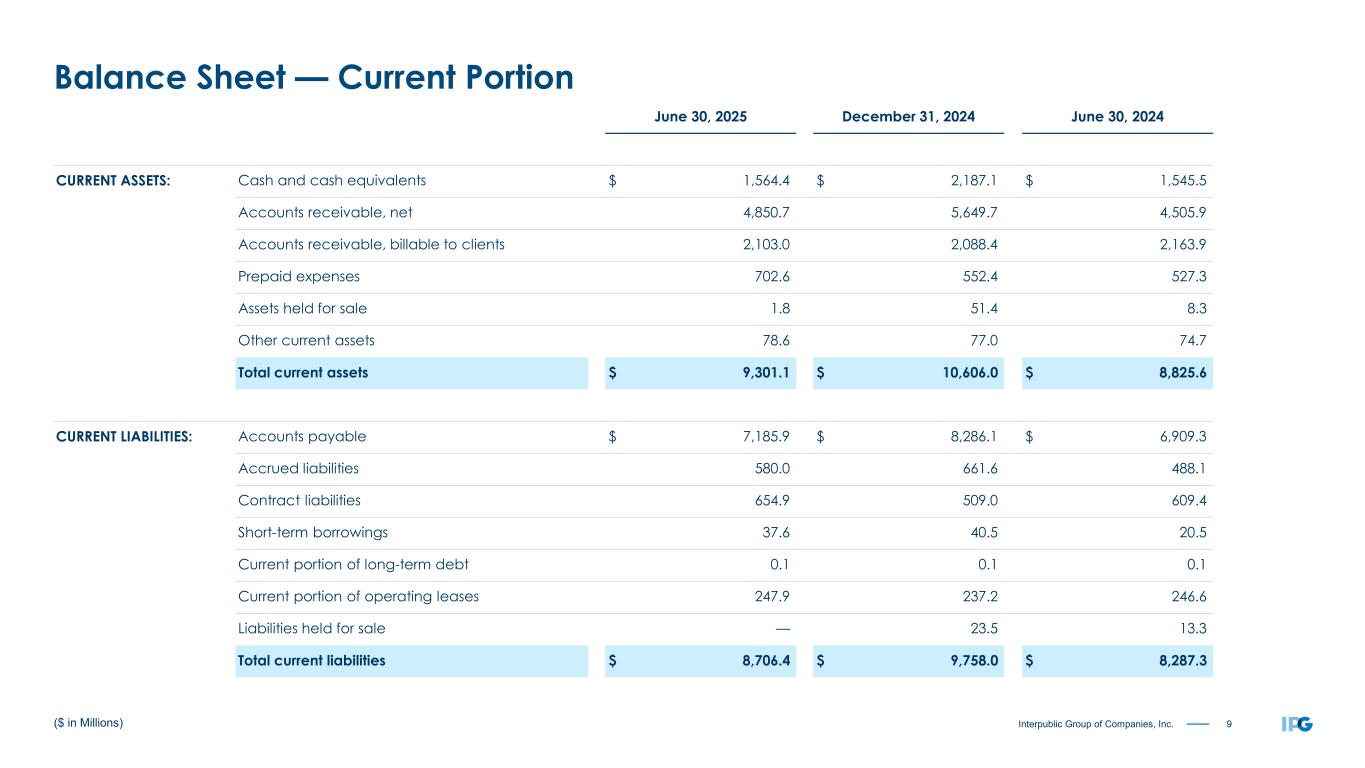
9Interpublic Group of Companies, Inc. June 30, 2025 December 31, 2024 June 30, 2024 CURRENT ASSETS: Cash and cash equivalents $ 1,564.4 $ 2,187.1 $ 1,545.5 Accounts receivable, net 4,850.7 5,649.7 4,505.9 Accounts receivable, billable to clients 2,103.0 2,088.4 2,163.9 Prepaid expenses 702.6 552.4 527.3 Assets held for sale 1.8 51.4 8.3 Other current assets 78.6 77.0 74.7 Total current assets $ 9,301.1 $ 10,606.0 $ 8,825.6 CURRENT LIABILITIES: Accounts payable $ 7,185.9 $ 8,286.1 $ 6,909.3 Accrued liabilities 580.0 661.6 488.1 Contract liabilities 654.9 509.0 609.4 Short-term borrowings 37.6 40.5 20.5 Current portion of long-term debt 0.1 0.1 0.1 Current portion of operating leases 247.9 237.2 246.6 Liabilities held for sale — 23.5 13.3 Total current liabilities $ 8,706.4 $ 9,758.0 $ 8,287.3 ($ in Millions) Balance Sheet — Current Portion
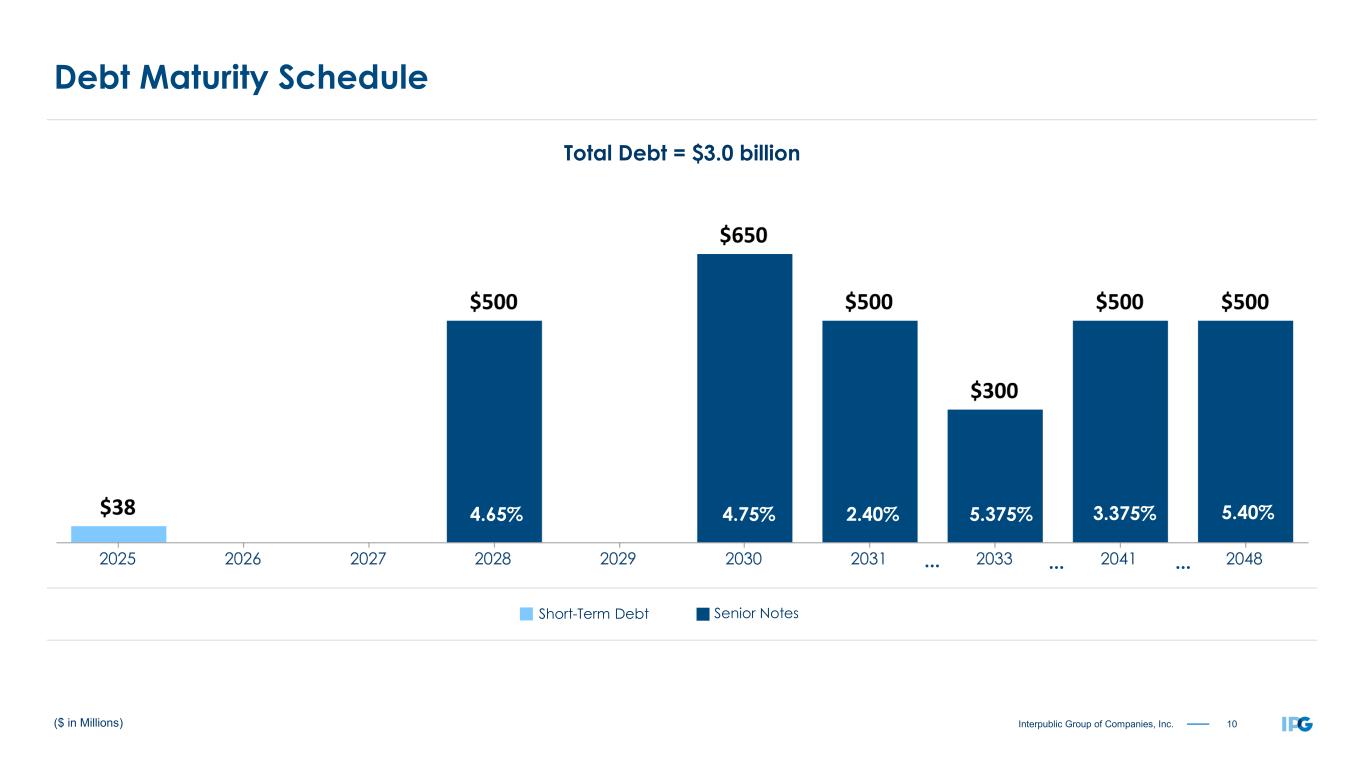
10Interpublic Group of Companies, Inc. Senior Notes 4.65% 5.40%2.40% Total Debt = $3.0 billion ($ in Millions) 4.75% 3.375% ... ... Short-Term Debt ... 5.375% Debt Maturity Schedule
11Interpublic Group of Companies, Inc. Appendix
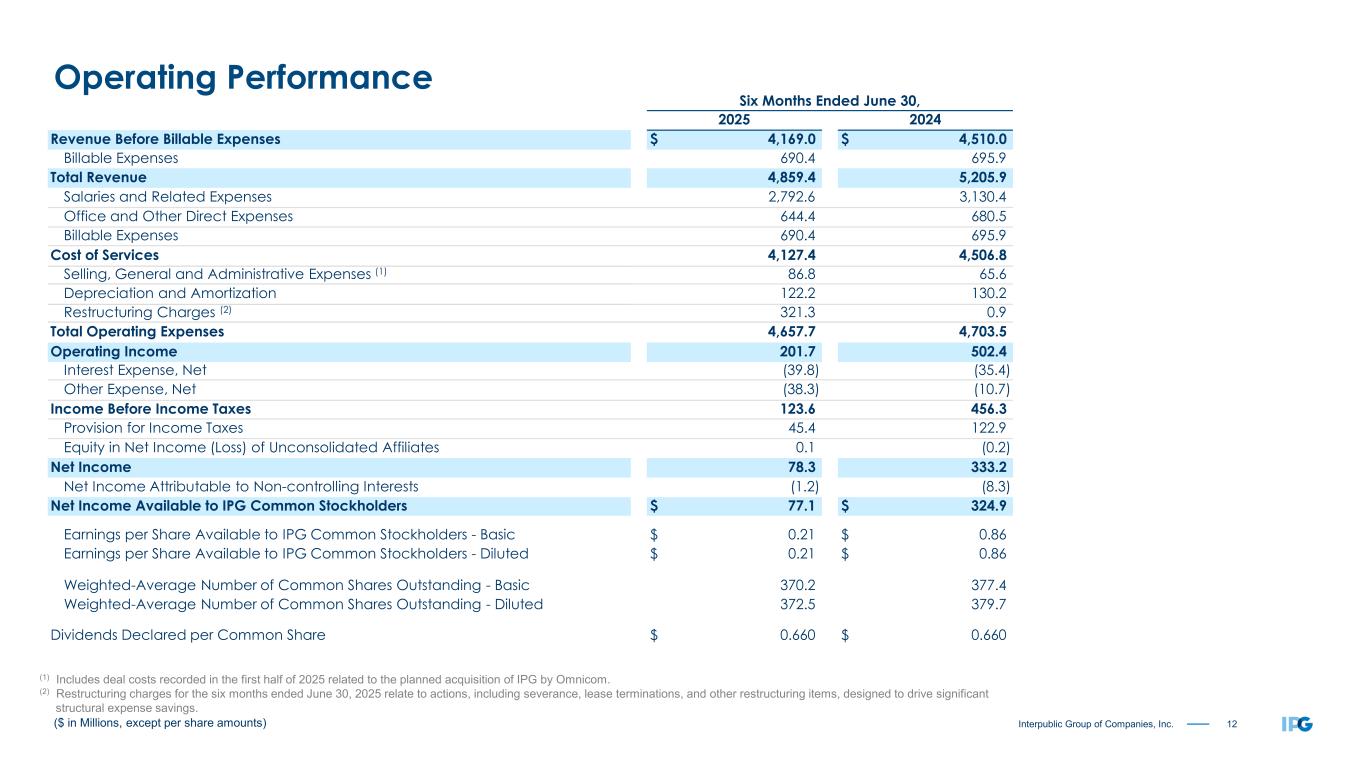
12Interpublic Group of Companies, Inc. Six Months Ended June 30, 2025 2024 Revenue Before Billable Expenses $ 4,169.0 $ 4,510.0 Billable Expenses 690.4 695.9 Total Revenue 4,859.4 5,205.9 Salaries and Related Expenses 2,792.6 3,130.4 Office and Other Direct Expenses 644.4 680.5 Billable Expenses 690.4 695.9 Cost of Services 4,127.4 4,506.8 Selling, General and Administrative Expenses (1) 86.8 65.6 Depreciation and Amortization 122.2 130.2 Restructuring Charges (2) 321.3 0.9 Total Operating Expenses 4,657.7 4,703.5 Operating Income 201.7 502.4 Interest Expense, Net (39.8) (35.4) Other Expense, Net (38.3) (10.7) Income Before Income Taxes 123.6 456.3 Provision for Income Taxes 45.4 122.9 Equity in Net Income (Loss) of Unconsolidated Affiliates 0.1 (0.2) Net Income 78.3 333.2 Net Income Attributable to Non-controlling Interests (1.2) (8.3) Net Income Available to IPG Common Stockholders $ 77.1 $ 324.9 Earnings per Share Available to IPG Common Stockholders - Basic $ 0.21 $ 0.86 Earnings per Share Available to IPG Common Stockholders - Diluted $ 0.21 $ 0.86 Weighted-Average Number of Common Shares Outstanding - Basic 370.2 377.4 Weighted-Average Number of Common Shares Outstanding - Diluted 372.5 379.7 Dividends Declared per Common Share $ 0.660 $ 0.660 ($ in Millions, except per share amounts) Operating Performance (1) Includes deal costs recorded in the first half of 2025 related to the planned acquisition of IPG by Omnicom. (2) Restructuring charges for the six months ended June 30, 2025 relate to actions, including severance, lease terminations, and other restructuring items, designed to drive significant structural expense savings.
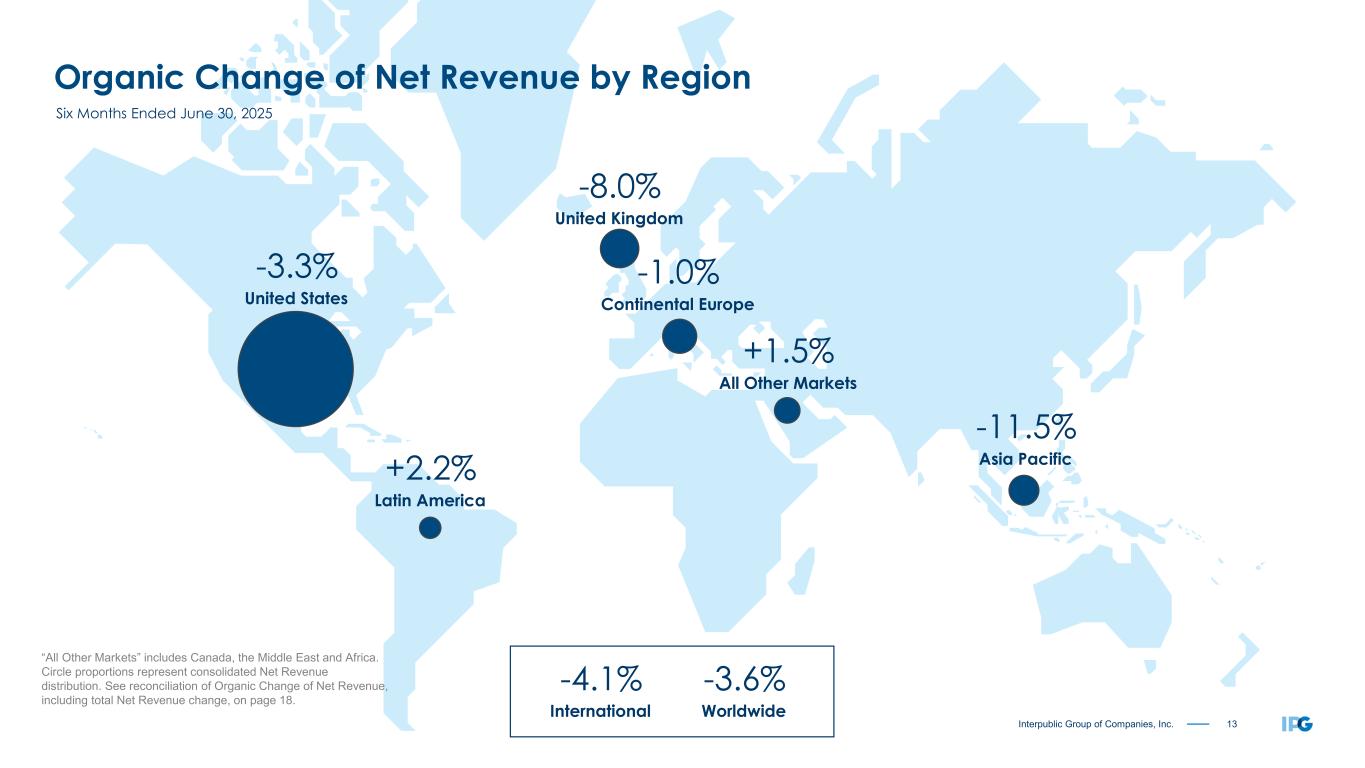
13Interpublic Group of Companies, Inc. Organic Change of Net Revenue by Region “All Other Markets” includes Canada, the Middle East and Africa. Circle proportions represent consolidated Net Revenue distribution. See reconciliation of Organic Change of Net Revenue, including total Net Revenue change, on page 18. Six Months Ended June 30, 2025 -3.3% United States -8.0% United Kingdom -1.0% Continental Europe +2.2% Latin America -11.5% Asia Pacific -4.1% International -3.6% Worldwide +1.5% All Other Markets
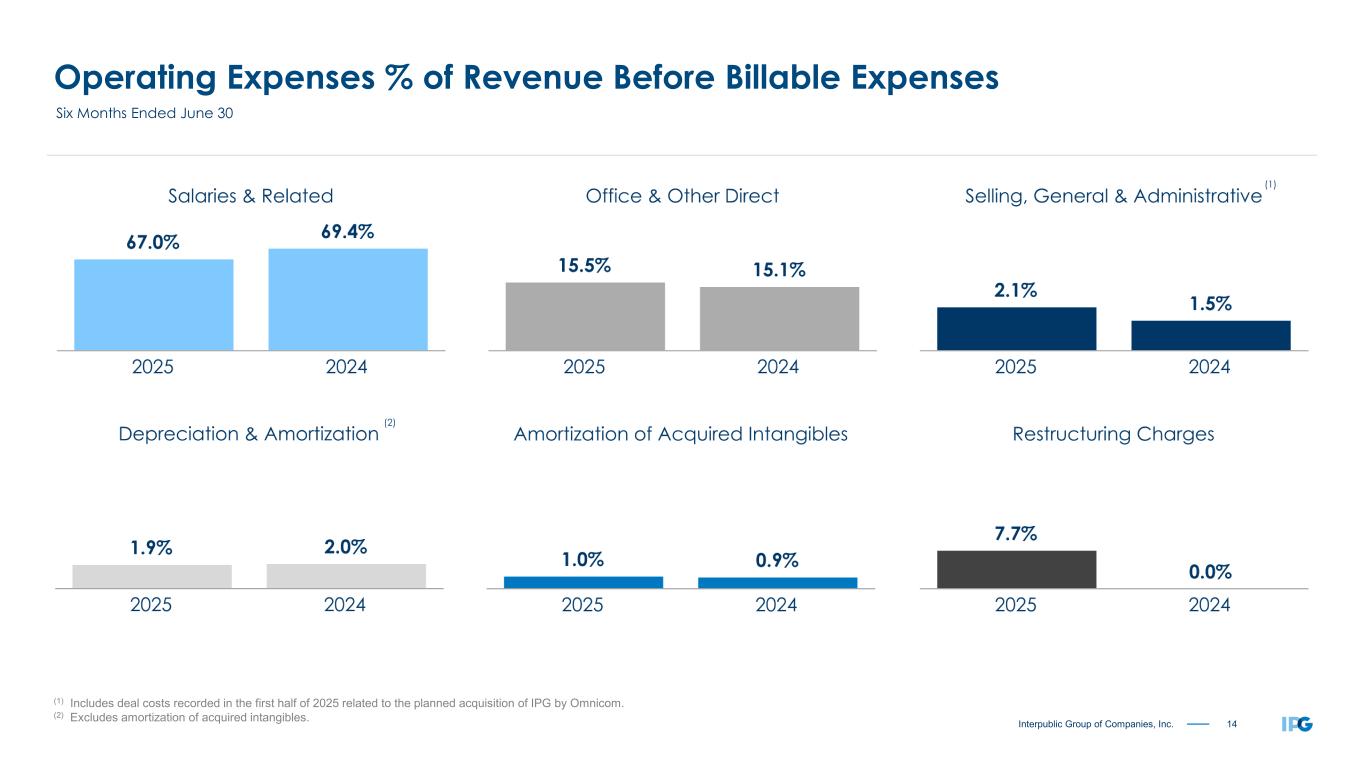
14Interpublic Group of Companies, Inc. Operating Expenses % of Revenue Before Billable Expenses Six Months Ended June 30 (2) (1) Includes deal costs recorded in the first half of 2025 related to the planned acquisition of IPG by Omnicom. (2) Excludes amortization of acquired intangibles. (1)
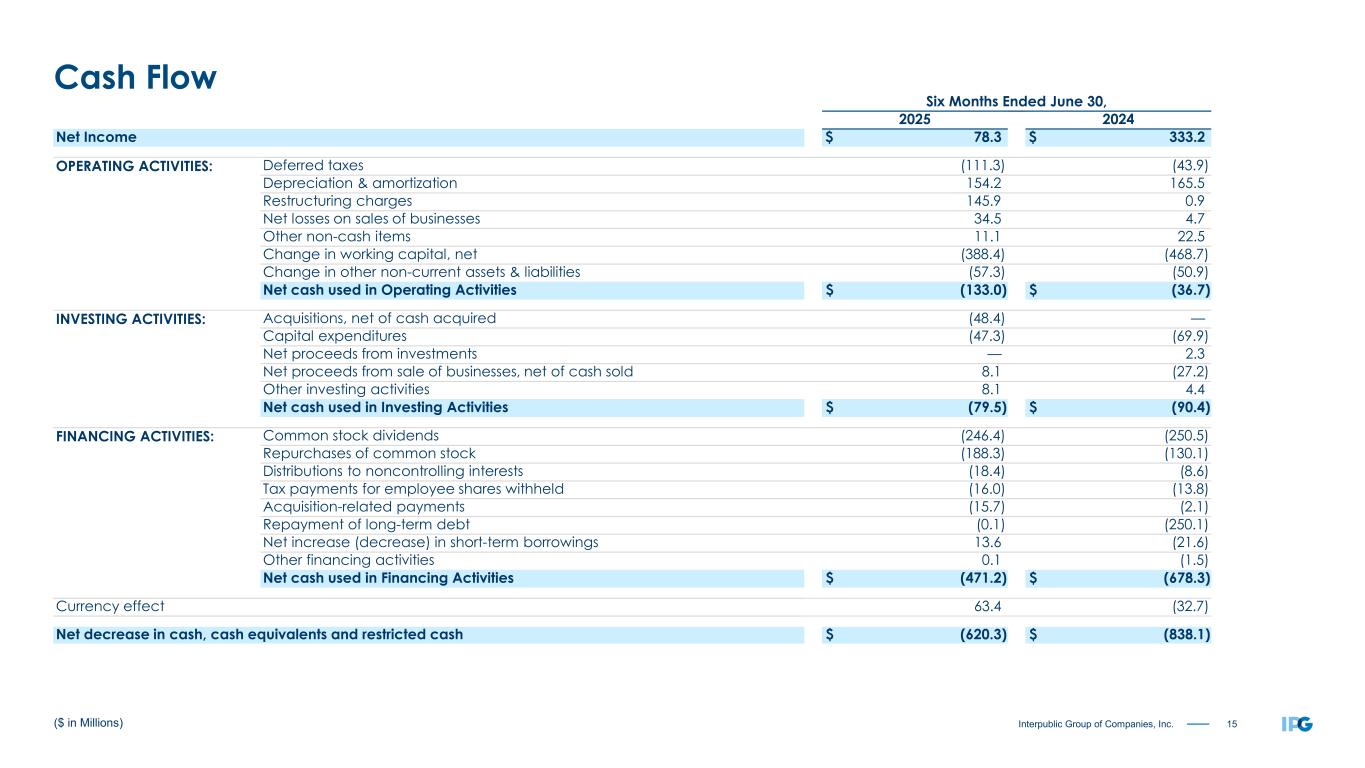
15Interpublic Group of Companies, Inc. Six Months Ended June 30, 2025 2024 Net Income $ 78.3 $ 333.2 OPERATING ACTIVITIES: Deferred taxes (111.3) (43.9) Depreciation & amortization 154.2 165.5 Restructuring charges 145.9 0.9 Net losses on sales of businesses 34.5 4.7 Other non-cash items 11.1 22.5 Change in working capital, net (388.4) (468.7) Change in other non-current assets & liabilities (57.3) (50.9) Net cash used in Operating Activities $ (133.0) $ (36.7) INVESTING ACTIVITIES: Acquisitions, net of cash acquired (48.4) — Capital expenditures (47.3) (69.9) Net proceeds from investments — 2.3 Net proceeds from sale of businesses, net of cash sold 8.1 (27.2) Other investing activities 8.1 4.4 Net cash used in Investing Activities $ (79.5) $ (90.4) FINANCING ACTIVITIES: Common stock dividends (246.4) (250.5) Repurchases of common stock (188.3) (130.1) Distributions to noncontrolling interests (18.4) (8.6) Tax payments for employee shares withheld (16.0) (13.8) Acquisition-related payments (15.7) (2.1) Repayment of long-term debt (0.1) (250.1) Net increase (decrease) in short-term borrowings 13.6 (21.6) Other financing activities 0.1 (1.5) Net cash used in Financing Activities $ (471.2) $ (678.3) Currency effect 63.4 (32.7) Net decrease in cash, cash equivalents and restricted cash $ (620.3) $ (838.1) ($ in Millions) Cash Flow
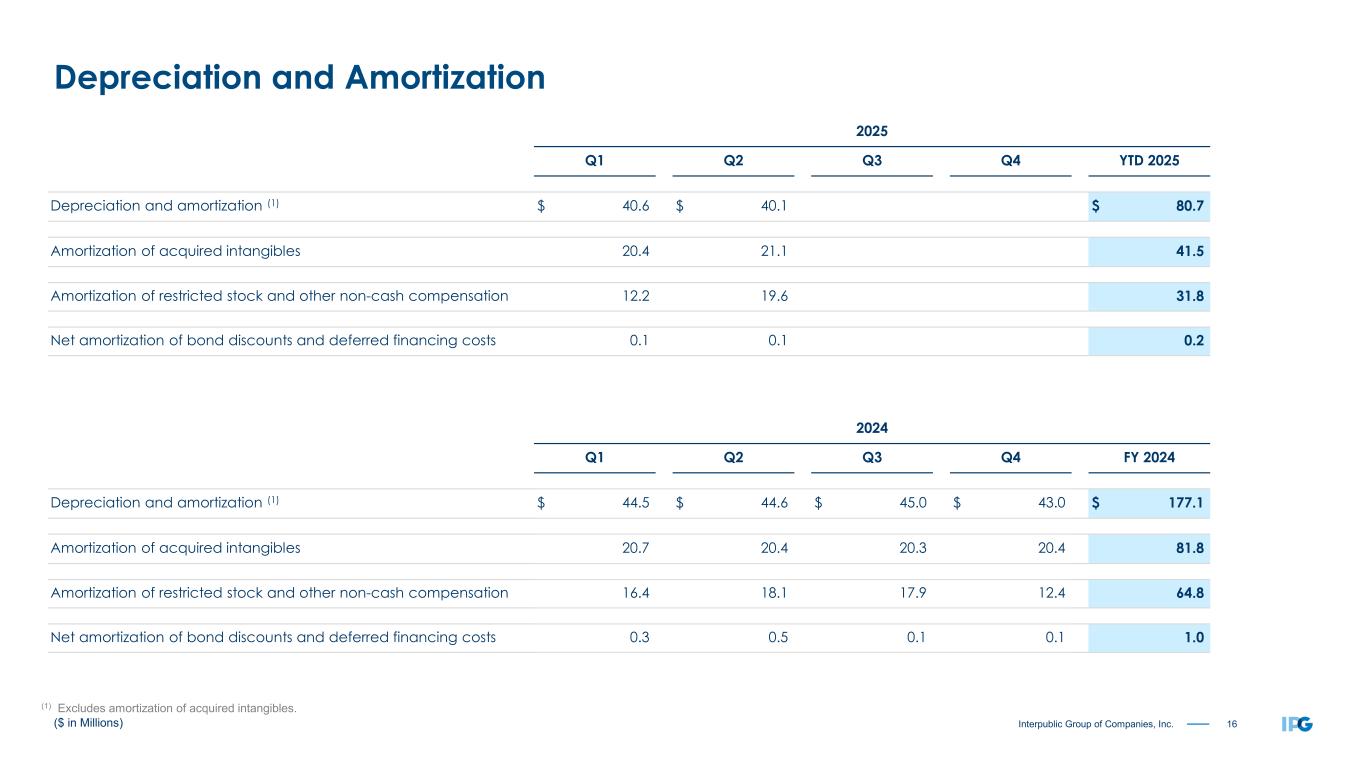
16Interpublic Group of Companies, Inc. 2025 Q1 Q2 Q3 Q4 YTD 2025 Depreciation and amortization (1) $ 40.6 $ 40.1 $ 80.7 Amortization of acquired intangibles 20.4 21.1 41.5 Amortization of restricted stock and other non-cash compensation 12.2 19.6 31.8 Net amortization of bond discounts and deferred financing costs 0.1 0.1 0.2 2024 Q1 Q2 Q3 Q4 FY 2024 Depreciation and amortization (1) $ 44.5 $ 44.6 $ 45.0 $ 43.0 $ 177.1 Amortization of acquired intangibles 20.7 20.4 20.3 20.4 81.8 Amortization of restricted stock and other non-cash compensation 16.4 18.1 17.9 12.4 64.8 Net amortization of bond discounts and deferred financing costs 0.3 0.5 0.1 0.1 1.0 ($ in Millions) (1) Excludes amortization of acquired intangibles. Depreciation and Amortization
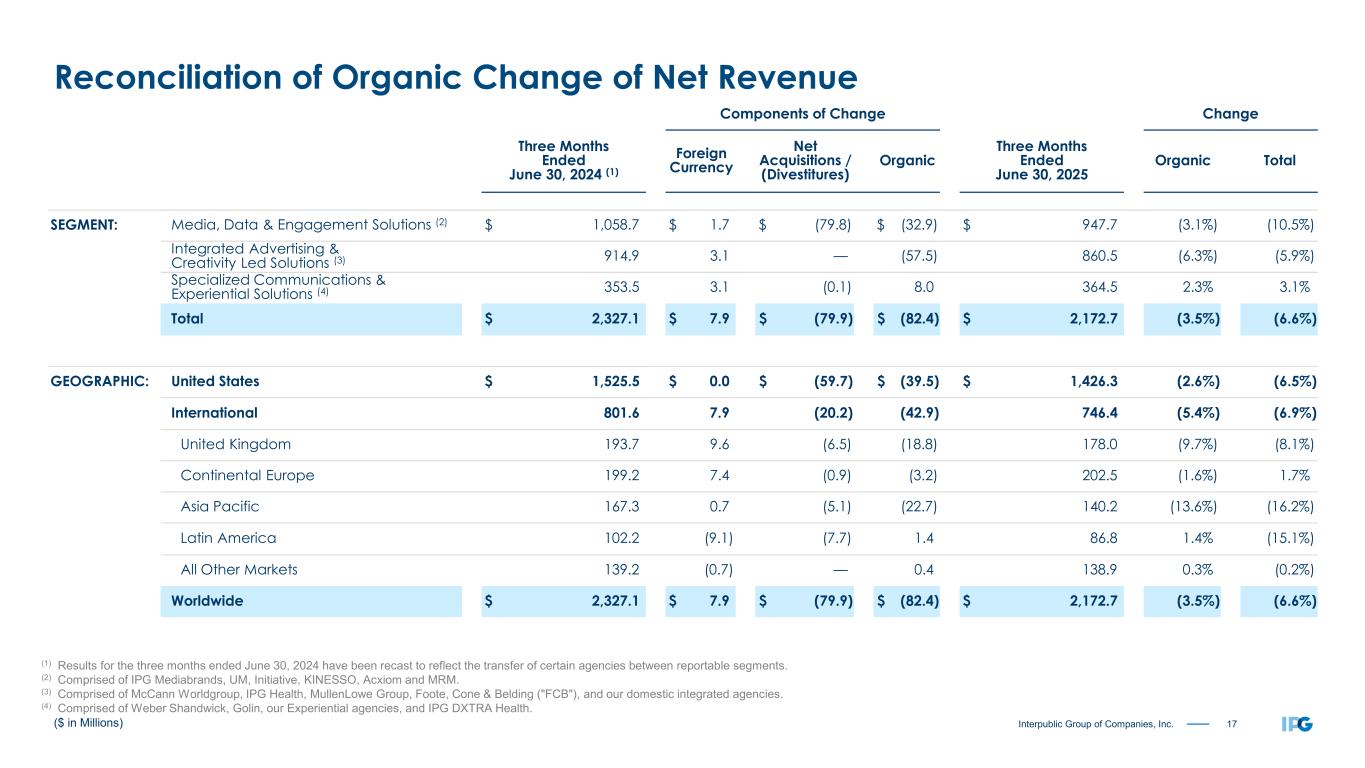
17Interpublic Group of Companies, Inc. Components of Change Change Three Months Ended June 30, 2024 (1) Foreign Currency Net Acquisitions / (Divestitures) Organic Three Months Ended June 30, 2025 Organic Total SEGMENT: Media, Data & Engagement Solutions (2) $ 1,058.7 $ 1.7 $ (79.8) $ (32.9) $ 947.7 (3.1%) (10.5%) Integrated Advertising & Creativity Led Solutions (3) 914.9 3.1 — (57.5) 860.5 (6.3%) (5.9%) Specialized Communications & Experiential Solutions (4) 353.5 3.1 (0.1) 8.0 364.5 2.3% 3.1% Total $ 2,327.1 $ 7.9 $ (79.9) $ (82.4) $ 2,172.7 (3.5%) (6.6%) GEOGRAPHIC: United States $ 1,525.5 $ 0.0 $ (59.7) $ (39.5) $ 1,426.3 (2.6%) (6.5%) International 801.6 7.9 (20.2) (42.9) 746.4 (5.4%) (6.9%) United Kingdom 193.7 9.6 (6.5) (18.8) 178.0 (9.7%) (8.1%) Continental Europe 199.2 7.4 (0.9) (3.2) 202.5 (1.6%) 1.7% Asia Pacific 167.3 0.7 (5.1) (22.7) 140.2 (13.6%) (16.2%) Latin America 102.2 (9.1) (7.7) 1.4 86.8 1.4% (15.1%) All Other Markets 139.2 (0.7) — 0.4 138.9 0.3% (0.2%) Worldwide $ 2,327.1 $ 7.9 $ (79.9) $ (82.4) $ 2,172.7 (3.5%) (6.6%) ($ in Millions) Reconciliation of Organic Change of Net Revenue (1) Results for the three months ended June 30, 2024 have been recast to reflect the transfer of certain agencies between reportable segments. (2) Comprised of IPG Mediabrands, UM, Initiative, KINESSO, Acxiom and MRM. (3) Comprised of McCann Worldgroup, IPG Health, MullenLowe Group, Foote, Cone & Belding ("FCB"), and our domestic integrated agencies. (4) Comprised of Weber Shandwick, Golin, our Experiential agencies, and IPG DXTRA Health.
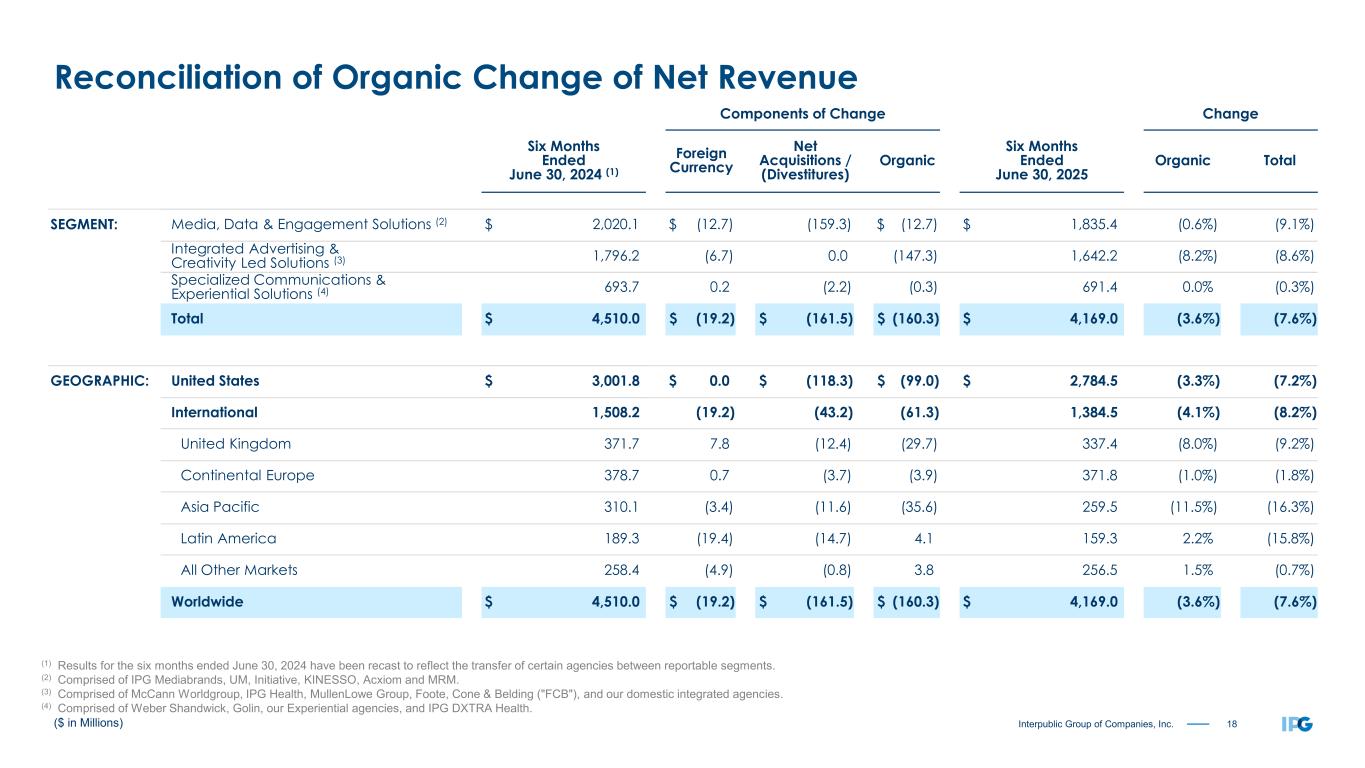
18Interpublic Group of Companies, Inc. ($ in Millions) Components of Change Change Six Months Ended June 30, 2024 (1) Foreign Currency Net Acquisitions / (Divestitures) Organic Six Months Ended June 30, 2025 Organic Total SEGMENT: Media, Data & Engagement Solutions (2) $ 2,020.1 $ (12.7) (159.3) $ (12.7) $ 1,835.4 (0.6%) (9.1%) Integrated Advertising & Creativity Led Solutions (3) 1,796.2 (6.7) 0.0 (147.3) 1,642.2 (8.2%) (8.6%) Specialized Communications & Experiential Solutions (4) 693.7 0.2 (2.2) (0.3) 691.4 0.0% (0.3%) Total $ 4,510.0 $ (19.2) $ (161.5) $ (160.3) $ 4,169.0 (3.6%) (7.6%) GEOGRAPHIC: United States $ 3,001.8 $ 0.0 $ (118.3) $ (99.0) $ 2,784.5 (3.3%) (7.2%) International 1,508.2 (19.2) (43.2) (61.3) 1,384.5 (4.1%) (8.2%) United Kingdom 371.7 7.8 (12.4) (29.7) 337.4 (8.0%) (9.2%) Continental Europe 378.7 0.7 (3.7) (3.9) 371.8 (1.0%) (1.8%) Asia Pacific 310.1 (3.4) (11.6) (35.6) 259.5 (11.5%) (16.3%) Latin America 189.3 (19.4) (14.7) 4.1 159.3 2.2% (15.8%) All Other Markets 258.4 (4.9) (0.8) 3.8 256.5 1.5% (0.7%) Worldwide $ 4,510.0 $ (19.2) $ (161.5) $ (160.3) $ 4,169.0 (3.6%) (7.6%) Reconciliation of Organic Change of Net Revenue (1) Results for the six months ended June 30, 2024 have been recast to reflect the transfer of certain agencies between reportable segments. (2) Comprised of IPG Mediabrands, UM, Initiative, KINESSO, Acxiom and MRM. (3) Comprised of McCann Worldgroup, IPG Health, MullenLowe Group, Foote, Cone & Belding ("FCB"), and our domestic integrated agencies. (4) Comprised of Weber Shandwick, Golin, our Experiential agencies, and IPG DXTRA Health.
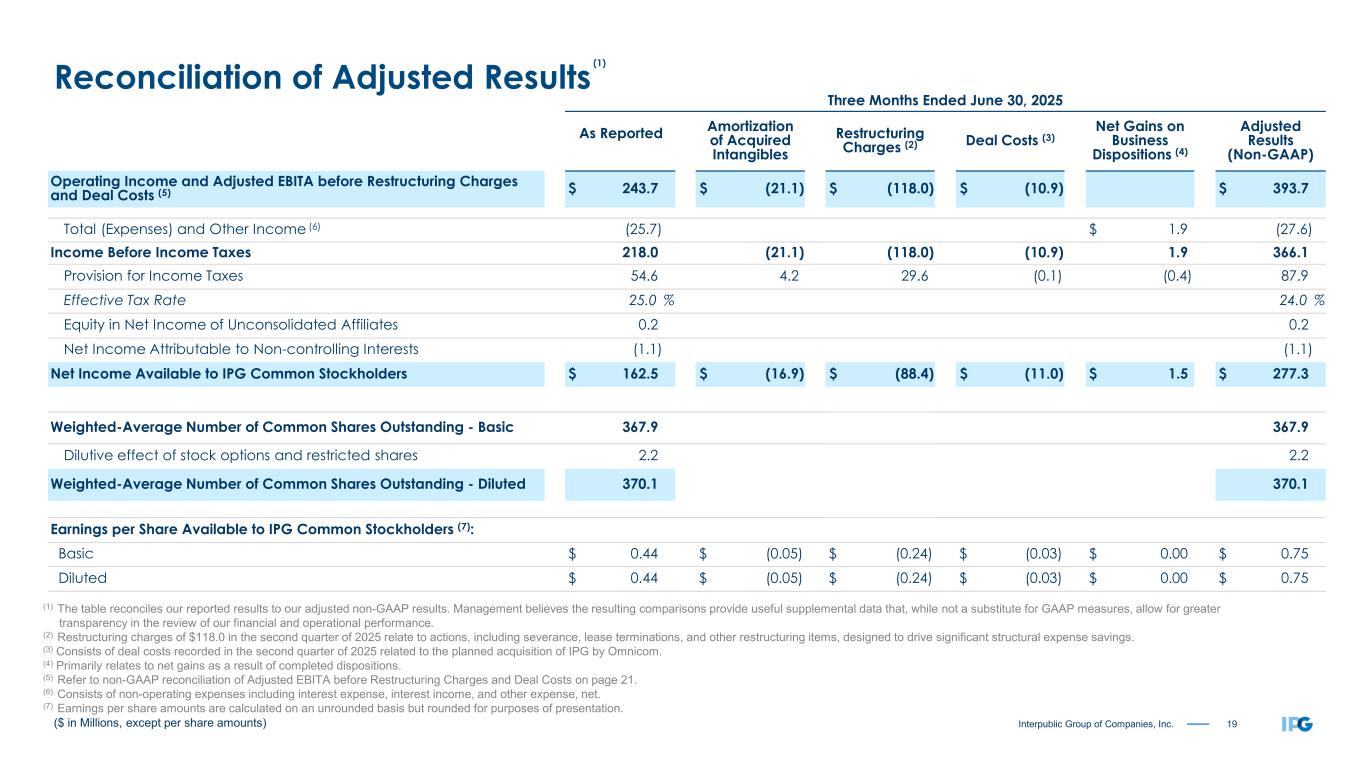
19Interpublic Group of Companies, Inc. Three Months Ended June 30, 2025 As Reported Amortization of Acquired Intangibles Restructuring Charges (2) Deal Costs (3) Net Gains on Business Dispositions (4) Adjusted Results (Non-GAAP) Operating Income and Adjusted EBITA before Restructuring Charges and Deal Costs (5) $ 243.7 $ (21.1) $ (118.0) $ (10.9) $ 393.7 Total (Expenses) and Other Income (6) (25.7) $ 1.9 (27.6) Income Before Income Taxes 218.0 (21.1) (118.0) (10.9) 1.9 366.1 Provision for Income Taxes 54.6 4.2 29.6 (0.1) (0.4) 87.9 Effective Tax Rate 25.0 % 24.0 % Equity in Net Income of Unconsolidated Affiliates 0.2 0.2 Net Income Attributable to Non-controlling Interests (1.1) (1.1) Net Income Available to IPG Common Stockholders $ 162.5 $ (16.9) $ (88.4) $ (11.0) $ 1.5 $ 277.3 Weighted-Average Number of Common Shares Outstanding - Basic 367.9 367.9 Dilutive effect of stock options and restricted shares 2.2 2.2 Weighted-Average Number of Common Shares Outstanding - Diluted 370.1 370.1 Earnings per Share Available to IPG Common Stockholders (7): Basic $ 0.44 $ (0.05) $ (0.24) $ (0.03) $ 0.00 $ 0.75 Diluted $ 0.44 $ (0.05) $ (0.24) $ (0.03) $ 0.00 $ 0.75 ($ in Millions, except per share amounts) (1) The table reconciles our reported results to our adjusted non-GAAP results. Management believes the resulting comparisons provide useful supplemental data that, while not a substitute for GAAP measures, allow for greater transparency in the review of our financial and operational performance. (2) Restructuring charges of $118.0 in the second quarter of 2025 relate to actions, including severance, lease terminations, and other restructuring items, designed to drive significant structural expense savings. (3) Consists of deal costs recorded in the second quarter of 2025 related to the planned acquisition of IPG by Omnicom. (4) Primarily relates to net gains as a result of completed dispositions. (5) Refer to non-GAAP reconciliation of Adjusted EBITA before Restructuring Charges and Deal Costs on page 21. (6) Consists of non-operating expenses including interest expense, interest income, and other expense, net. (7) Earnings per share amounts are calculated on an unrounded basis but rounded for purposes of presentation. Reconciliation of Adjusted Results(1)
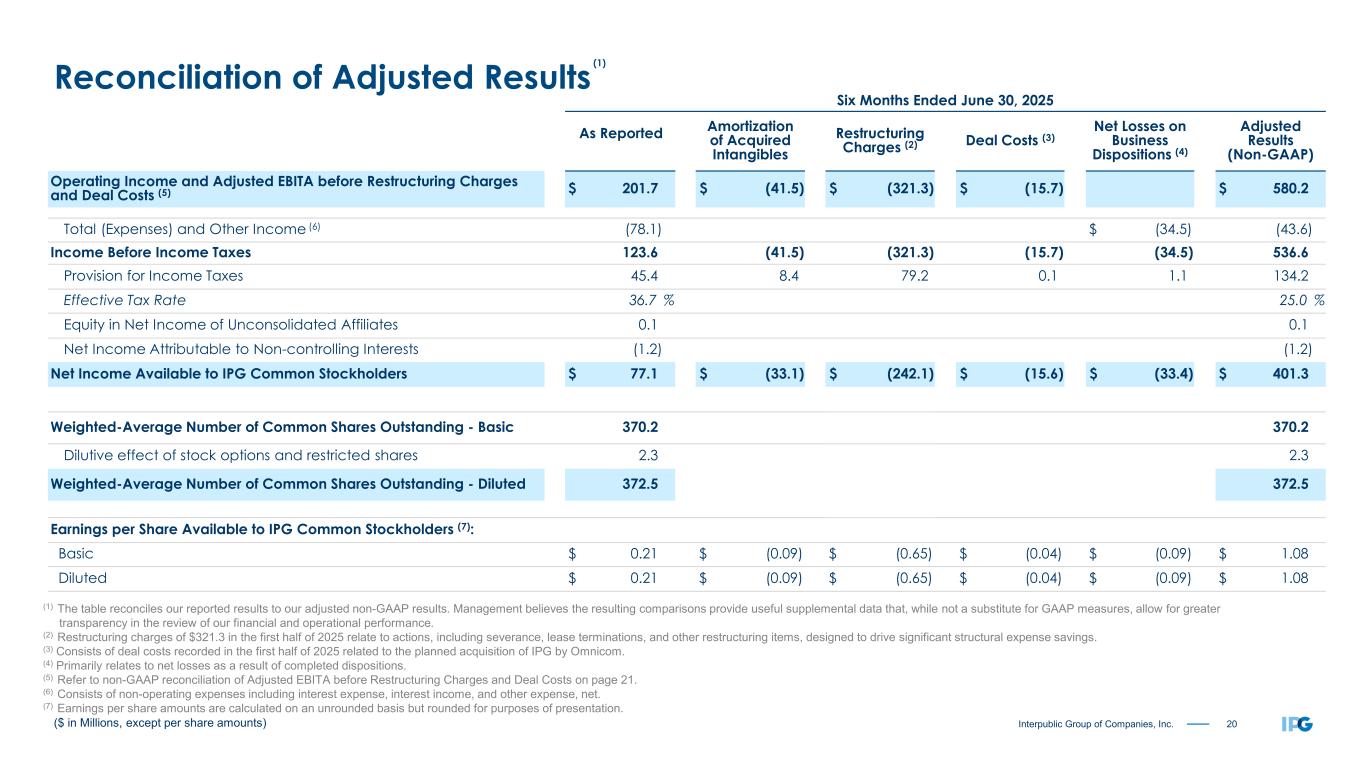
20Interpublic Group of Companies, Inc. Reconciliation of Adjusted Results(1) Six Months Ended June 30, 2025 As Reported Amortization of Acquired Intangibles Restructuring Charges (2) Deal Costs (3) Net Losses on Business Dispositions (4) Adjusted Results (Non-GAAP) Operating Income and Adjusted EBITA before Restructuring Charges and Deal Costs (5) $ 201.7 $ (41.5) $ (321.3) $ (15.7) $ 580.2 Total (Expenses) and Other Income (6) (78.1) $ (34.5) (43.6) Income Before Income Taxes 123.6 (41.5) (321.3) (15.7) (34.5) 536.6 Provision for Income Taxes 45.4 8.4 79.2 0.1 1.1 134.2 Effective Tax Rate 36.7 % 25.0 % Equity in Net Income of Unconsolidated Affiliates 0.1 0.1 Net Income Attributable to Non-controlling Interests (1.2) (1.2) Net Income Available to IPG Common Stockholders $ 77.1 $ (33.1) $ (242.1) $ (15.6) $ (33.4) $ 401.3 Weighted-Average Number of Common Shares Outstanding - Basic 370.2 370.2 Dilutive effect of stock options and restricted shares 2.3 2.3 Weighted-Average Number of Common Shares Outstanding - Diluted 372.5 372.5 Earnings per Share Available to IPG Common Stockholders (7): Basic $ 0.21 $ (0.09) $ (0.65) $ (0.04) $ (0.09) $ 1.08 Diluted $ 0.21 $ (0.09) $ (0.65) $ (0.04) $ (0.09) $ 1.08 (1) The table reconciles our reported results to our adjusted non-GAAP results. Management believes the resulting comparisons provide useful supplemental data that, while not a substitute for GAAP measures, allow for greater transparency in the review of our financial and operational performance. (2) Restructuring charges of $321.3 in the first half of 2025 relate to actions, including severance, lease terminations, and other restructuring items, designed to drive significant structural expense savings. (3) Consists of deal costs recorded in the first half of 2025 related to the planned acquisition of IPG by Omnicom. (4) Primarily relates to net losses as a result of completed dispositions. (5) Refer to non-GAAP reconciliation of Adjusted EBITA before Restructuring Charges and Deal Costs on page 21. (6) Consists of non-operating expenses including interest expense, interest income, and other expense, net. (7) Earnings per share amounts are calculated on an unrounded basis but rounded for purposes of presentation. ($ in Millions, except per share amounts)
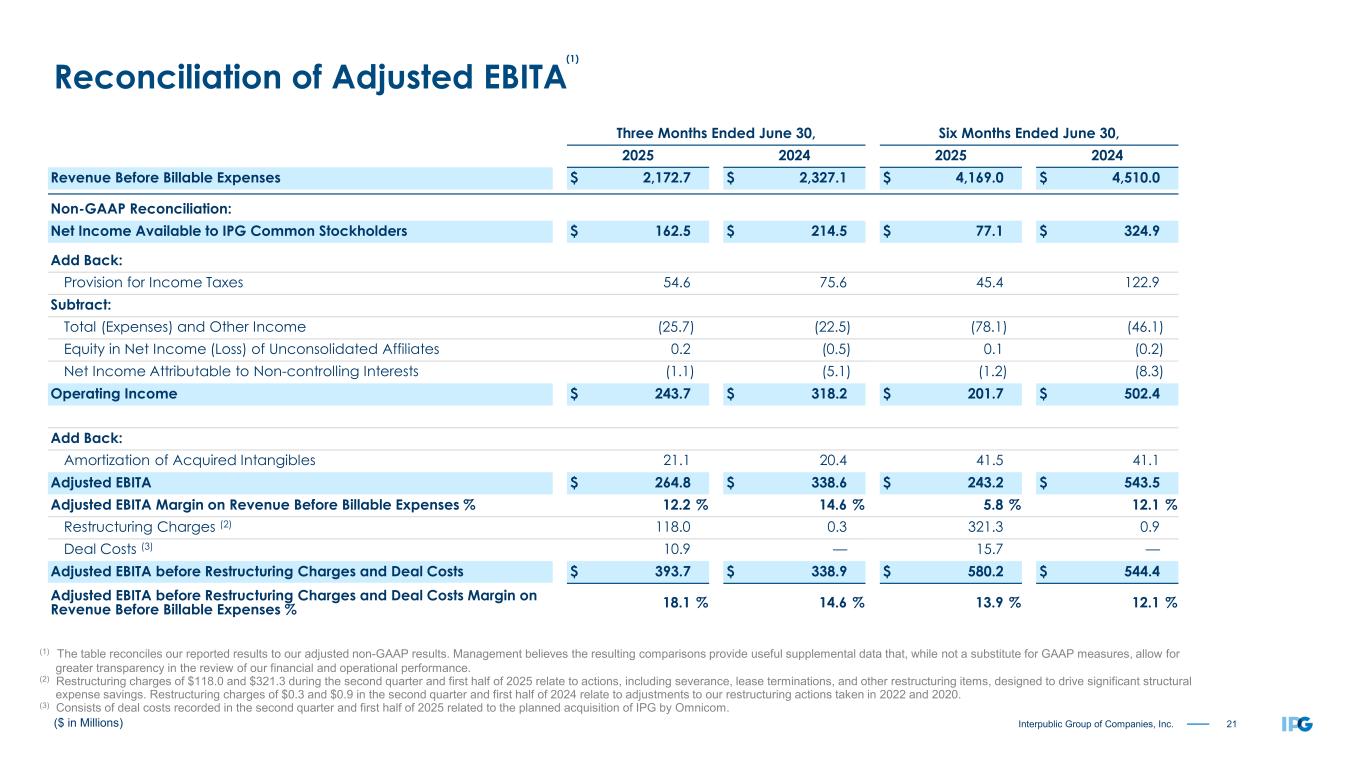
21Interpublic Group of Companies, Inc. Reconciliation of Adjusted EBITA Three Months Ended June 30, Six Months Ended June 30, 2025 2024 2025 2024 Revenue Before Billable Expenses $ 2,172.7 $ 2,327.1 $ 4,169.0 $ 4,510.0 Non-GAAP Reconciliation: Net Income Available to IPG Common Stockholders $ 162.5 $ 214.5 $ 77.1 $ 324.9 Add Back: Provision for Income Taxes 54.6 75.6 45.4 122.9 Subtract: Total (Expenses) and Other Income (25.7) (22.5) (78.1) (46.1) Equity in Net Income (Loss) of Unconsolidated Affiliates 0.2 (0.5) 0.1 (0.2) Net Income Attributable to Non-controlling Interests (1.1) (5.1) (1.2) (8.3) Operating Income $ 243.7 $ 318.2 $ 201.7 $ 502.4 Add Back: Amortization of Acquired Intangibles 21.1 20.4 41.5 41.1 Adjusted EBITA $ 264.8 $ 338.6 $ 243.2 $ 543.5 Adjusted EBITA Margin on Revenue Before Billable Expenses % 12.2 % 14.6 % 5.8 % 12.1 % Restructuring Charges (2) 118.0 0.3 321.3 0.9 Deal Costs (3) 10.9 — 15.7 — Adjusted EBITA before Restructuring Charges and Deal Costs $ 393.7 $ 338.9 $ 580.2 $ 544.4 Adjusted EBITA before Restructuring Charges and Deal Costs Margin on Revenue Before Billable Expenses % 18.1 % 14.6 % 13.9 % 12.1 % (1) ($ in Millions) (1) The table reconciles our reported results to our adjusted non-GAAP results. Management believes the resulting comparisons provide useful supplemental data that, while not a substitute for GAAP measures, allow for greater transparency in the review of our financial and operational performance. (2) Restructuring charges of $118.0 and $321.3 during the second quarter and first half of 2025 relate to actions, including severance, lease terminations, and other restructuring items, designed to drive significant structural expense savings. Restructuring charges of $0.3 and $0.9 in the second quarter and first half of 2024 relate to adjustments to our restructuring actions taken in 2022 and 2020. (3) Consists of deal costs recorded in the second quarter and first half of 2025 related to the planned acquisition of IPG by Omnicom.
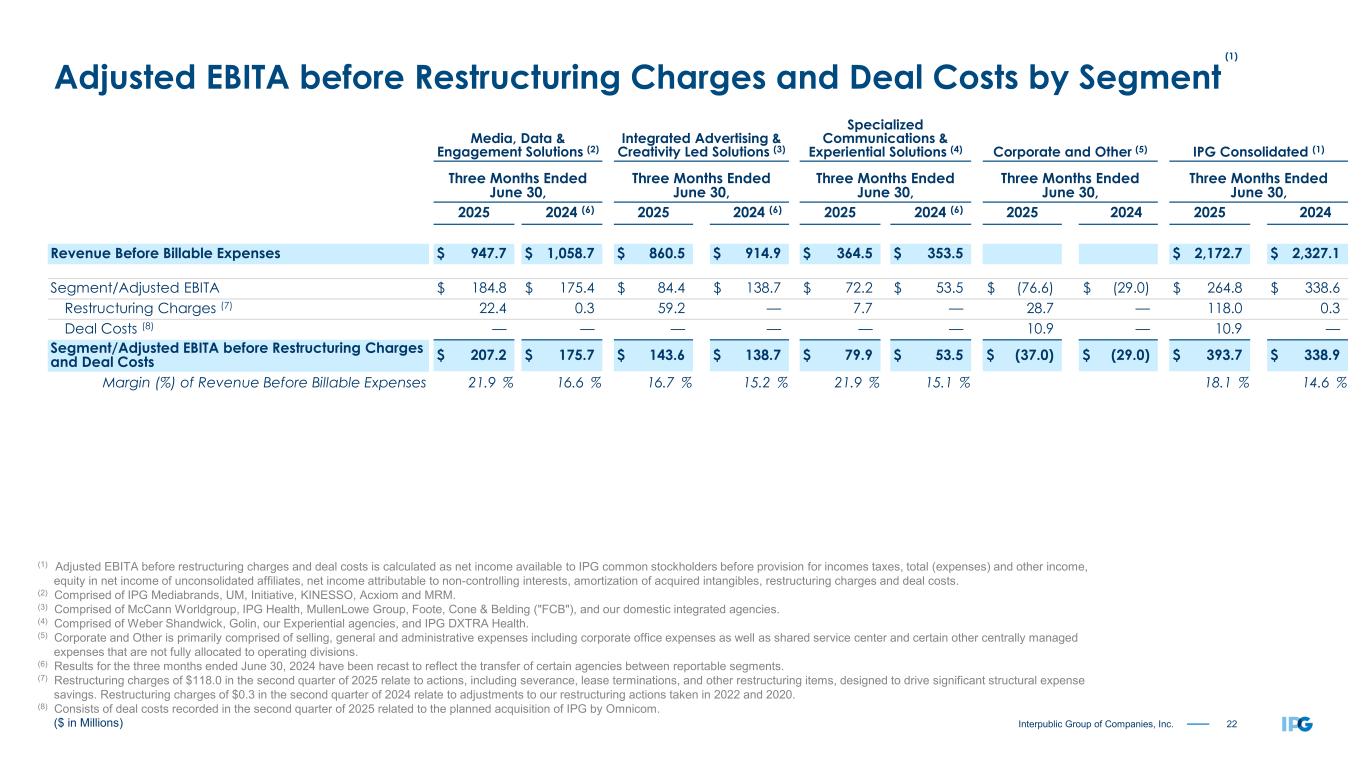
22Interpublic Group of Companies, Inc. Media, Data & Engagement Solutions (2) Integrated Advertising & Creativity Led Solutions (3) Specialized Communications & Experiential Solutions (4) Corporate and Other (5) IPG Consolidated (1) Three Months Ended June 30, Three Months Ended June 30, Three Months Ended June 30, Three Months Ended June 30, Three Months Ended June 30, 2025 2024 (6) 2025 2024 (6) 2025 2024 (6) 2025 2024 2025 2024 Revenue Before Billable Expenses $ 947.7 $ 1,058.7 $ 860.5 $ 914.9 $ 364.5 $ 353.5 $ 2,172.7 $ 2,327.1 Segment/Adjusted EBITA $ 184.8 $ 175.4 $ 84.4 $ 138.7 $ 72.2 $ 53.5 $ (76.6) $ (29.0) $ 264.8 $ 338.6 Restructuring Charges (7) 22.4 0.3 59.2 — 7.7 — 28.7 — 118.0 0.3 Deal Costs (8) — — — — — — 10.9 — 10.9 — Segment/Adjusted EBITA before Restructuring Charges and Deal Costs $ 207.2 $ 175.7 $ 143.6 $ 138.7 $ 79.9 $ 53.5 $ (37.0) $ (29.0) $ 393.7 $ 338.9 Margin (%) of Revenue Before Billable Expenses 21.9 % 16.6 % 16.7 % 15.2 % 21.9 % 15.1 % 18.1 % 14.6 % ($ in Millions) (1) Adjusted EBITA before restructuring charges and deal costs is calculated as net income available to IPG common stockholders before provision for incomes taxes, total (expenses) and other income, equity in net income of unconsolidated affiliates, net income attributable to non-controlling interests, amortization of acquired intangibles, restructuring charges and deal costs. (2) Comprised of IPG Mediabrands, UM, Initiative, KINESSO, Acxiom and MRM. (3) Comprised of McCann Worldgroup, IPG Health, MullenLowe Group, Foote, Cone & Belding ("FCB"), and our domestic integrated agencies. (4) Comprised of Weber Shandwick, Golin, our Experiential agencies, and IPG DXTRA Health. (5) Corporate and Other is primarily comprised of selling, general and administrative expenses including corporate office expenses as well as shared service center and certain other centrally managed expenses that are not fully allocated to operating divisions. (6) Results for the three months ended June 30, 2024 have been recast to reflect the transfer of certain agencies between reportable segments. (7) Restructuring charges of $118.0 in the second quarter of 2025 relate to actions, including severance, lease terminations, and other restructuring items, designed to drive significant structural expense savings. Restructuring charges of $0.3 in the second quarter of 2024 relate to adjustments to our restructuring actions taken in 2022 and 2020. (8) Consists of deal costs recorded in the second quarter of 2025 related to the planned acquisition of IPG by Omnicom. Adjusted EBITA before Restructuring Charges and Deal Costs by Segment (1)
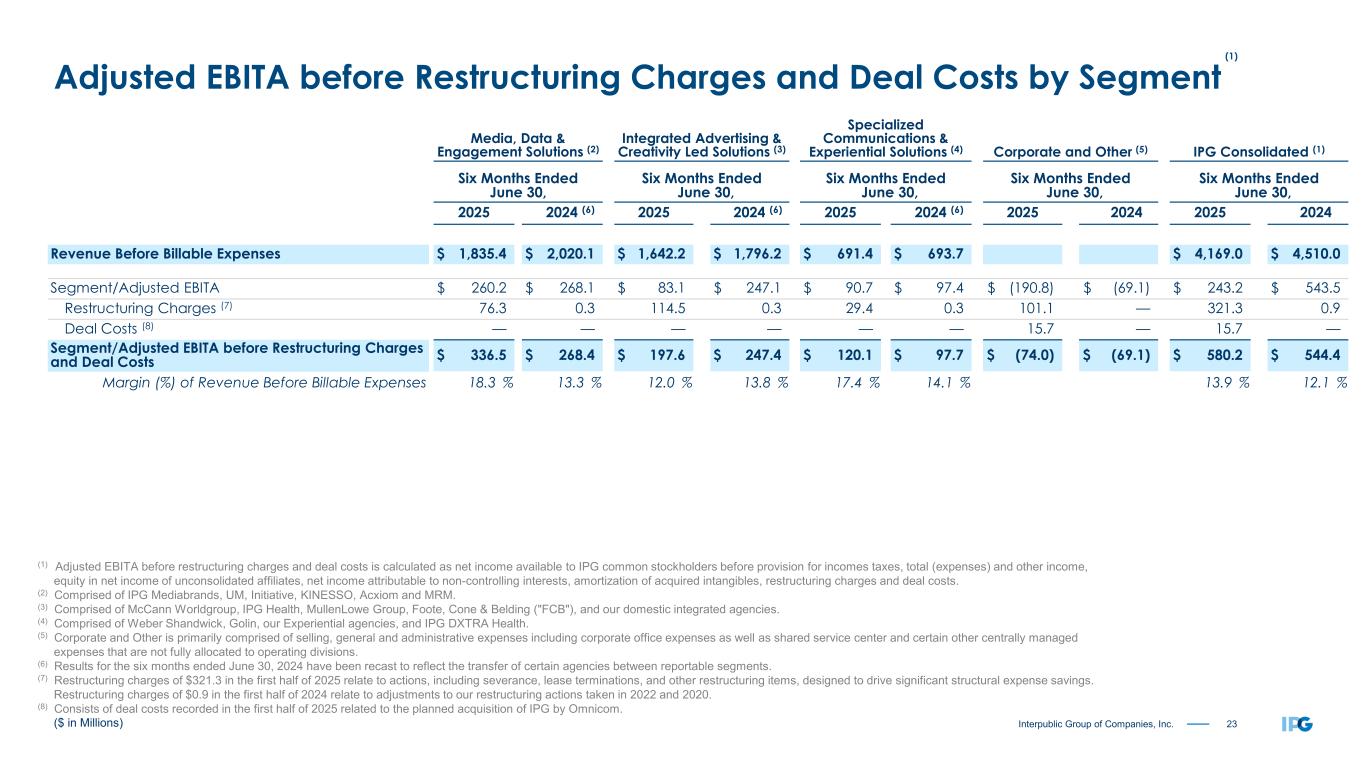
23Interpublic Group of Companies, Inc. Media, Data & Engagement Solutions (2) Integrated Advertising & Creativity Led Solutions (3) Specialized Communications & Experiential Solutions (4) Corporate and Other (5) IPG Consolidated (1) Six Months Ended June 30, Six Months Ended June 30, Six Months Ended June 30, Six Months Ended June 30, Six Months Ended June 30, 2025 2024 (6) 2025 2024 (6) 2025 2024 (6) 2025 2024 2025 2024 Revenue Before Billable Expenses $ 1,835.4 $ 2,020.1 $ 1,642.2 $ 1,796.2 $ 691.4 $ 693.7 $ 4,169.0 $ 4,510.0 Segment/Adjusted EBITA $ 260.2 $ 268.1 $ 83.1 $ 247.1 $ 90.7 $ 97.4 $ (190.8) $ (69.1) $ 243.2 $ 543.5 Restructuring Charges (7) 76.3 0.3 114.5 0.3 29.4 0.3 101.1 — 321.3 0.9 Deal Costs (8) — — — — — — 15.7 — 15.7 — Segment/Adjusted EBITA before Restructuring Charges and Deal Costs $ 336.5 $ 268.4 $ 197.6 $ 247.4 $ 120.1 $ 97.7 $ (74.0) $ (69.1) $ 580.2 $ 544.4 Margin (%) of Revenue Before Billable Expenses 18.3 % 13.3 % 12.0 % 13.8 % 17.4 % 14.1 % 13.9 % 12.1 % ($ in Millions) (1) Adjusted EBITA before restructuring charges and deal costs is calculated as net income available to IPG common stockholders before provision for incomes taxes, total (expenses) and other income, equity in net income of unconsolidated affiliates, net income attributable to non-controlling interests, amortization of acquired intangibles, restructuring charges and deal costs. (2) Comprised of IPG Mediabrands, UM, Initiative, KINESSO, Acxiom and MRM. (3) Comprised of McCann Worldgroup, IPG Health, MullenLowe Group, Foote, Cone & Belding ("FCB"), and our domestic integrated agencies. (4) Comprised of Weber Shandwick, Golin, our Experiential agencies, and IPG DXTRA Health. (5) Corporate and Other is primarily comprised of selling, general and administrative expenses including corporate office expenses as well as shared service center and certain other centrally managed expenses that are not fully allocated to operating divisions. (6) Results for the six months ended June 30, 2024 have been recast to reflect the transfer of certain agencies between reportable segments. (7) Restructuring charges of $321.3 in the first half of 2025 relate to actions, including severance, lease terminations, and other restructuring items, designed to drive significant structural expense savings. Restructuring charges of $0.9 in the first half of 2024 relate to adjustments to our restructuring actions taken in 2022 and 2020. (8) Consists of deal costs recorded in the first half of 2025 related to the planned acquisition of IPG by Omnicom. Adjusted EBITA before Restructuring Charges and Deal Costs by Segment (1)
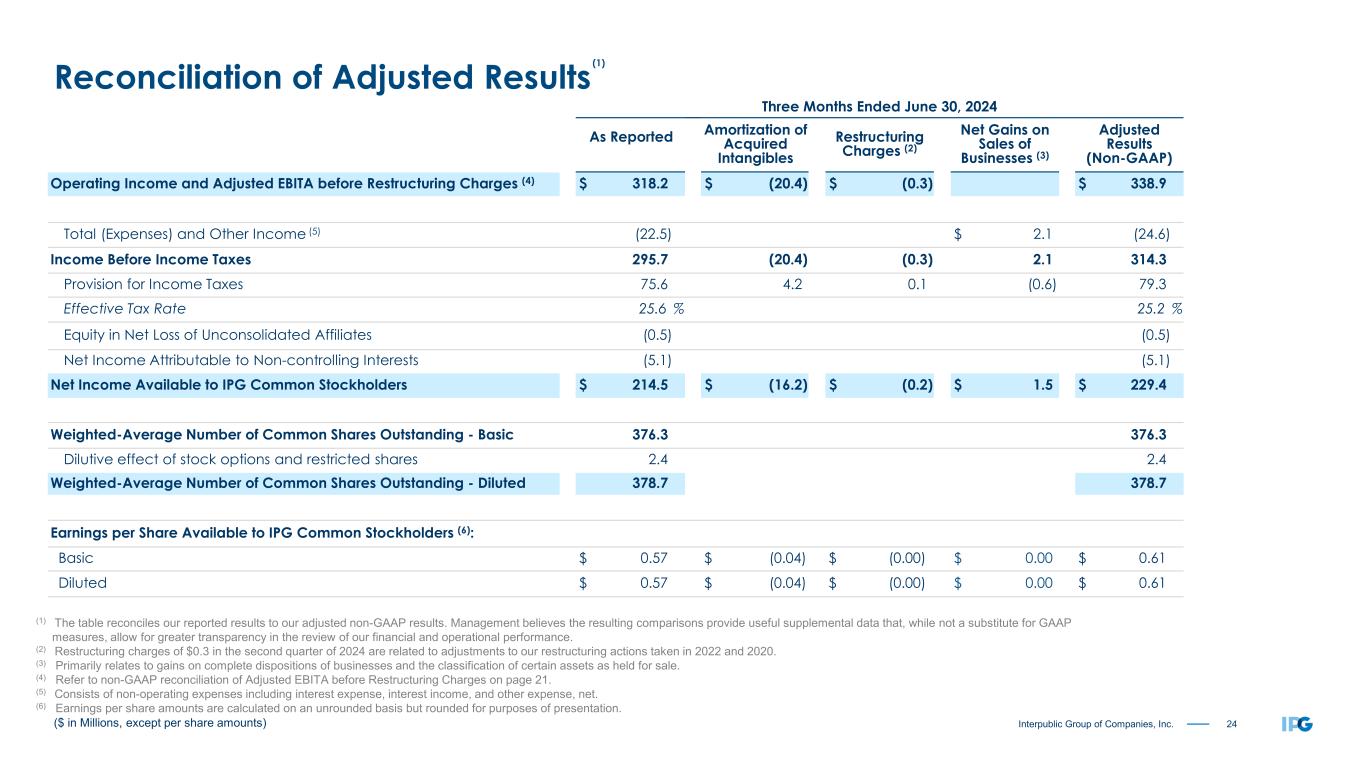
24Interpublic Group of Companies, Inc. Three Months Ended June 30, 2024 As Reported Amortization of Acquired Intangibles Restructuring Charges (2) Net Gains on Sales of Businesses (3) Adjusted Results (Non-GAAP) Operating Income and Adjusted EBITA before Restructuring Charges (4) $ 318.2 $ (20.4) $ (0.3) $ 338.9 Total (Expenses) and Other Income (5) (22.5) $ 2.1 (24.6) Income Before Income Taxes 295.7 (20.4) (0.3) 2.1 314.3 Provision for Income Taxes 75.6 4.2 0.1 (0.6) 79.3 Effective Tax Rate 25.6 % 25.2 % Equity in Net Loss of Unconsolidated Affiliates (0.5) (0.5) Net Income Attributable to Non-controlling Interests (5.1) (5.1) Net Income Available to IPG Common Stockholders $ 214.5 $ (16.2) $ (0.2) $ 1.5 $ 229.4 Weighted-Average Number of Common Shares Outstanding - Basic 376.3 376.3 Dilutive effect of stock options and restricted shares 2.4 2.4 Weighted-Average Number of Common Shares Outstanding - Diluted 378.7 378.7 Earnings per Share Available to IPG Common Stockholders (6): Basic $ 0.57 $ (0.04) $ (0.00) $ 0.00 $ 0.61 Diluted $ 0.57 $ (0.04) $ (0.00) $ 0.00 $ 0.61 ($ in Millions, except per share amounts) (1) The table reconciles our reported results to our adjusted non-GAAP results. Management believes the resulting comparisons provide useful supplemental data that, while not a substitute for GAAP measures, allow for greater transparency in the review of our financial and operational performance. (2) Restructuring charges of $0.3 in the second quarter of 2024 are related to adjustments to our restructuring actions taken in 2022 and 2020. (3) Primarily relates to gains on complete dispositions of businesses and the classification of certain assets as held for sale. (4) Refer to non-GAAP reconciliation of Adjusted EBITA before Restructuring Charges on page 21. (5) Consists of non-operating expenses including interest expense, interest income, and other expense, net. (6) Earnings per share amounts are calculated on an unrounded basis but rounded for purposes of presentation. Reconciliation of Adjusted Results(1)
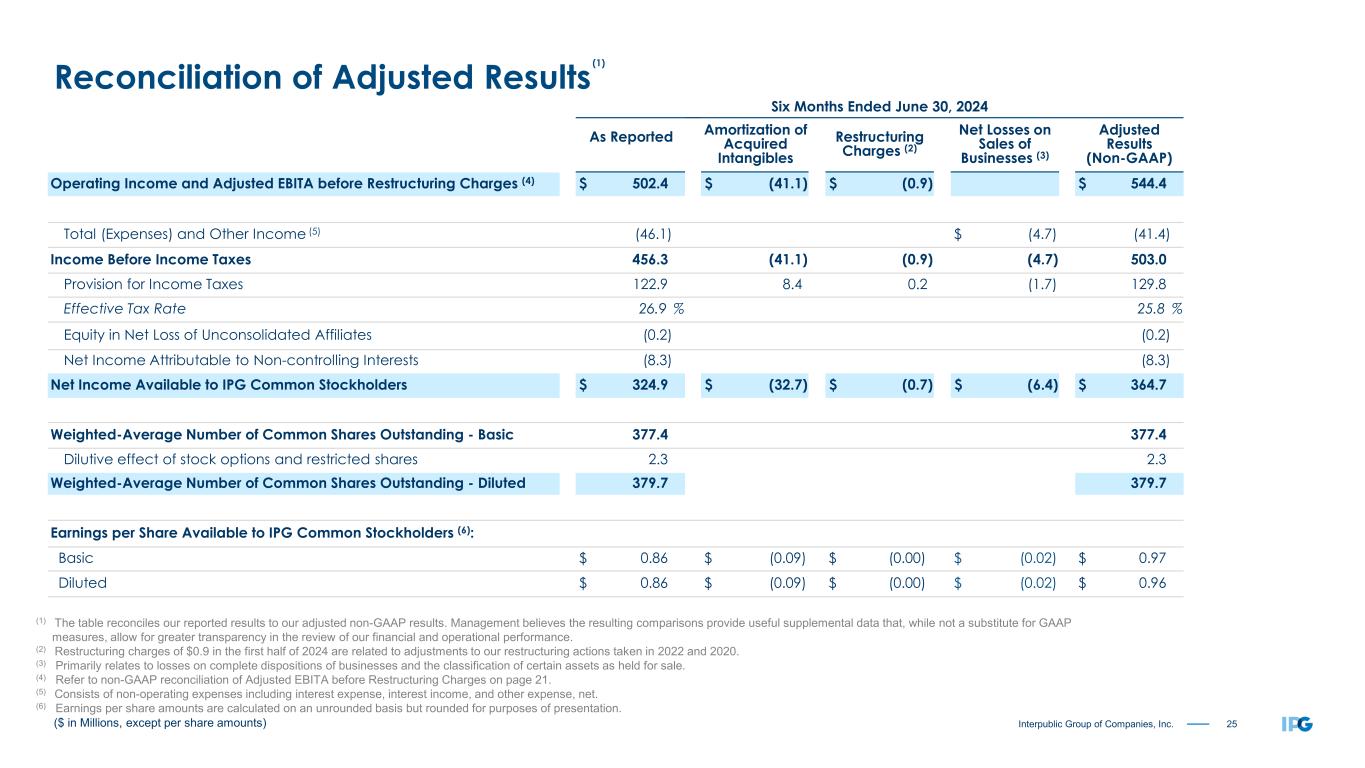
25Interpublic Group of Companies, Inc. Reconciliation of Adjusted Results(1) Six Months Ended June 30, 2024 As Reported Amortization of Acquired Intangibles Restructuring Charges (2) Net Losses on Sales of Businesses (3) Adjusted Results (Non-GAAP) Operating Income and Adjusted EBITA before Restructuring Charges (4) $ 502.4 $ (41.1) $ (0.9) $ 544.4 Total (Expenses) and Other Income (5) (46.1) $ (4.7) (41.4) Income Before Income Taxes 456.3 (41.1) (0.9) (4.7) 503.0 Provision for Income Taxes 122.9 8.4 0.2 (1.7) 129.8 Effective Tax Rate 26.9 % 25.8 % Equity in Net Loss of Unconsolidated Affiliates (0.2) (0.2) Net Income Attributable to Non-controlling Interests (8.3) (8.3) Net Income Available to IPG Common Stockholders $ 324.9 $ (32.7) $ (0.7) $ (6.4) $ 364.7 Weighted-Average Number of Common Shares Outstanding - Basic 377.4 377.4 Dilutive effect of stock options and restricted shares 2.3 2.3 Weighted-Average Number of Common Shares Outstanding - Diluted 379.7 379.7 Earnings per Share Available to IPG Common Stockholders (6): Basic $ 0.86 $ (0.09) $ (0.00) $ (0.02) $ 0.97 Diluted $ 0.86 $ (0.09) $ (0.00) $ (0.02) $ 0.96 ($ in Millions, except per share amounts) (1) The table reconciles our reported results to our adjusted non-GAAP results. Management believes the resulting comparisons provide useful supplemental data that, while not a substitute for GAAP measures, allow for greater transparency in the review of our financial and operational performance. (2) Restructuring charges of $0.9 in the first half of 2024 are related to adjustments to our restructuring actions taken in 2022 and 2020. (3) Primarily relates to losses on complete dispositions of businesses and the classification of certain assets as held for sale. (4) Refer to non-GAAP reconciliation of Adjusted EBITA before Restructuring Charges on page 21. (5) Consists of non-operating expenses including interest expense, interest income, and other expense, net. (6) Earnings per share amounts are calculated on an unrounded basis but rounded for purposes of presentation.
26Interpublic Group of Companies, Inc. Metrics Update
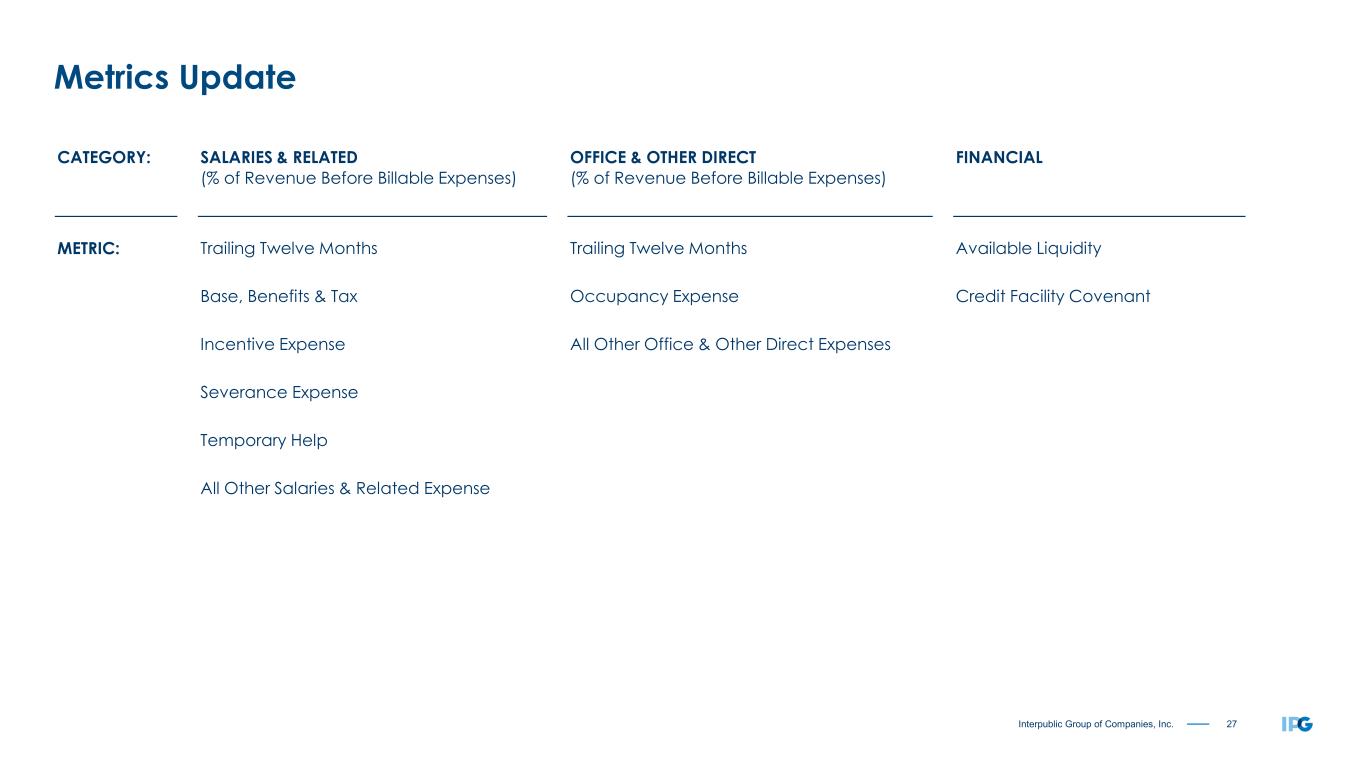
27Interpublic Group of Companies, Inc. Metrics Update CATEGORY: SALARIES & RELATED OFFICE & OTHER DIRECT FINANCIAL (% of Revenue Before Billable Expenses) (% of Revenue Before Billable Expenses) METRIC: Trailing Twelve Months Trailing Twelve Months Available Liquidity Base, Benefits & Tax Occupancy Expense Credit Facility Covenant Incentive Expense All Other Office & Other Direct Expenses Severance Expense Temporary Help All Other Salaries & Related Expense
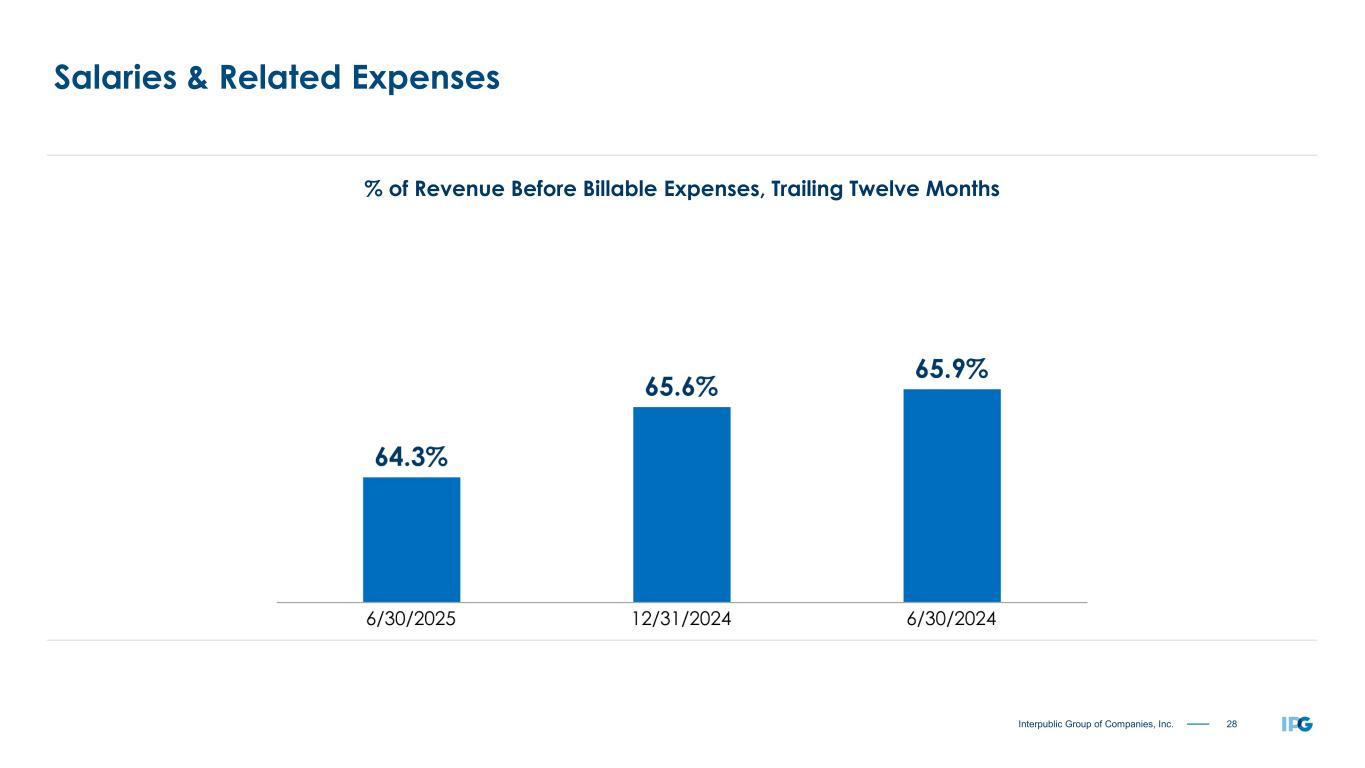
28Interpublic Group of Companies, Inc. Salaries & Related Expenses % of Revenue Before Billable Expenses, Trailing Twelve Months
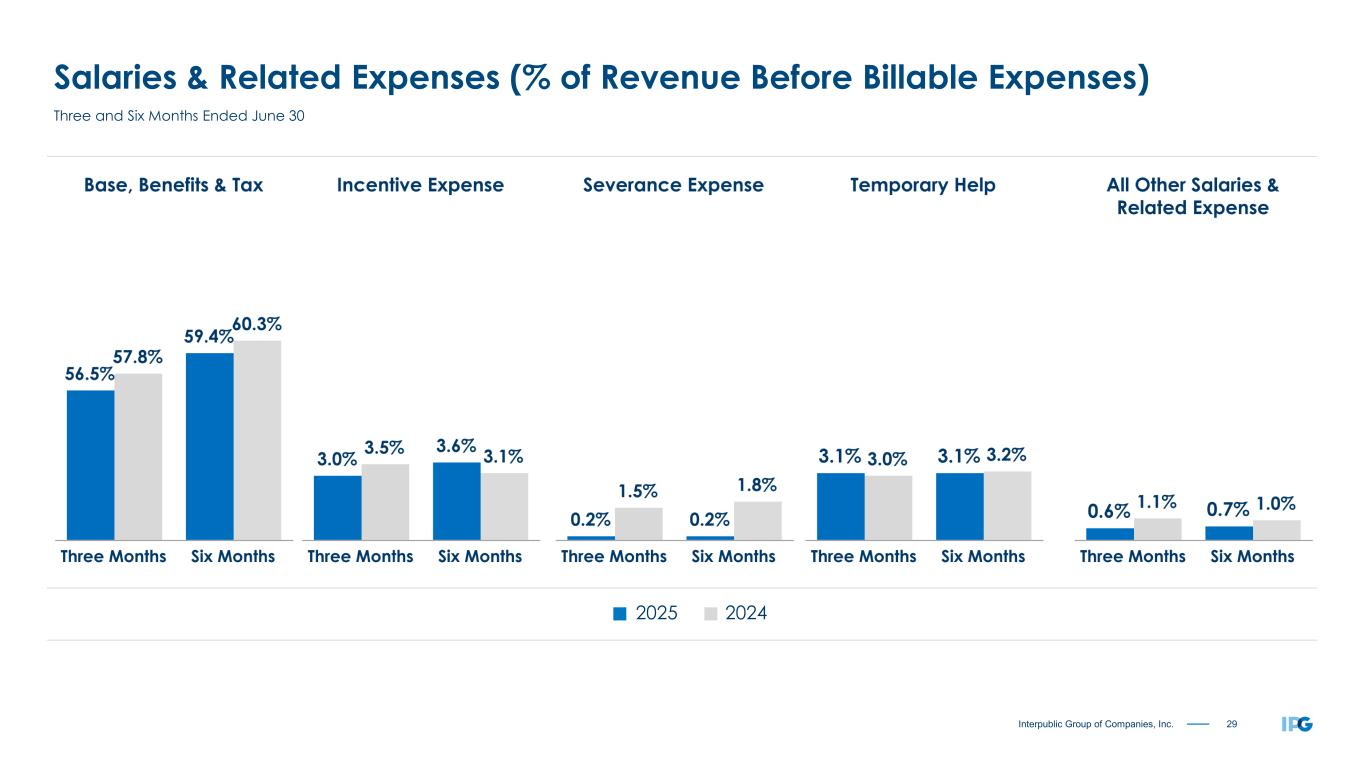
29Interpublic Group of Companies, Inc. Salaries & Related Expenses (% of Revenue Before Billable Expenses) Three and Six Months Ended June 30 2025 2024
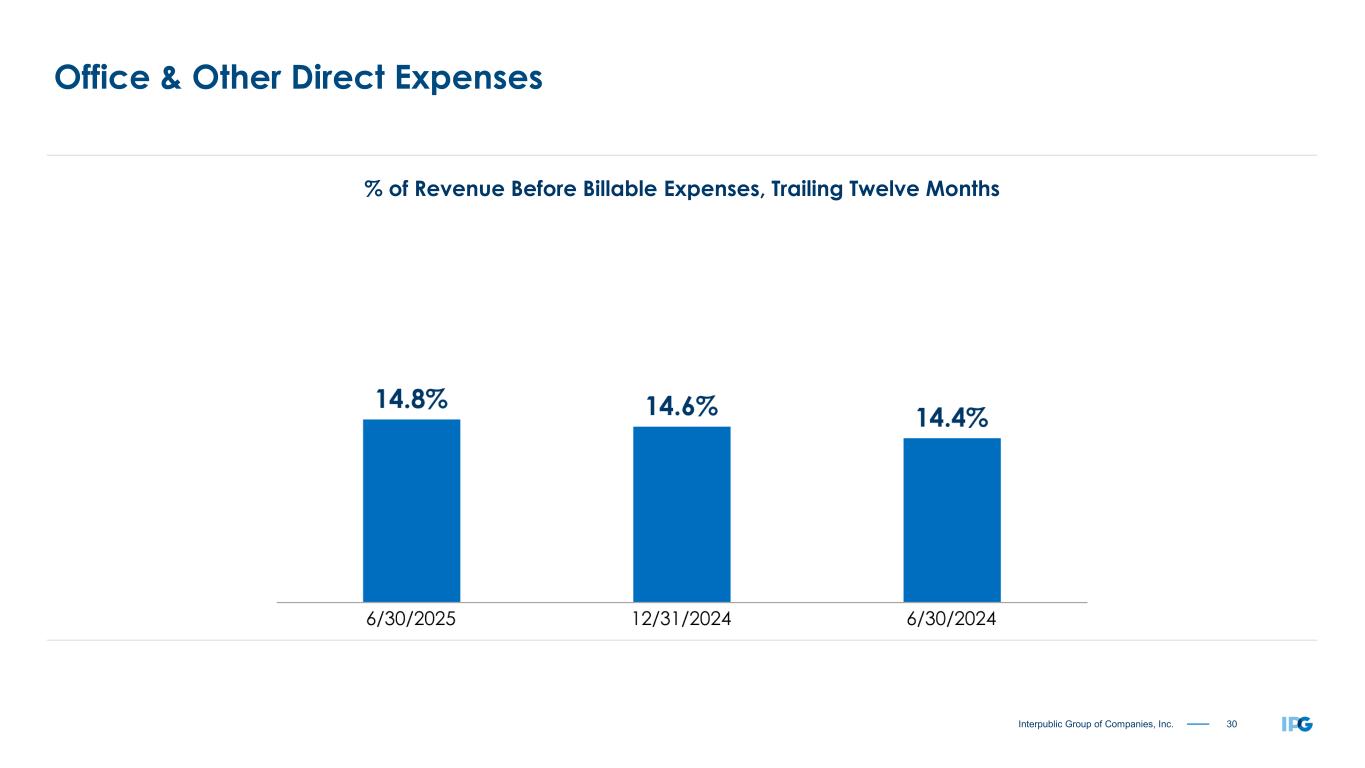
30Interpublic Group of Companies, Inc. Office & Other Direct Expenses % of Revenue Before Billable Expenses, Trailing Twelve Months
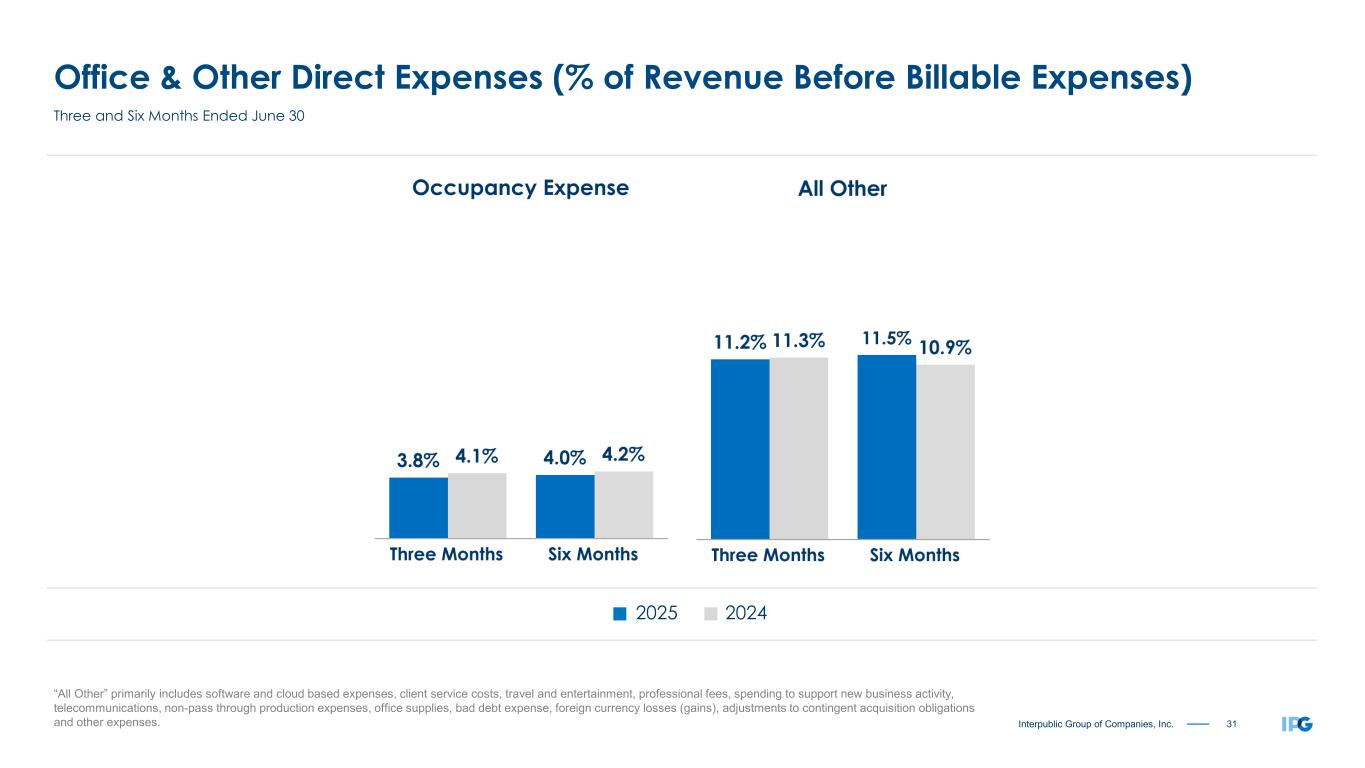
31Interpublic Group of Companies, Inc. Office & Other Direct Expenses (% of Revenue Before Billable Expenses) “All Other” primarily includes software and cloud based expenses, client service costs, travel and entertainment, professional fees, spending to support new business activity, telecommunications, non-pass through production expenses, office supplies, bad debt expense, foreign currency losses (gains), adjustments to contingent acquisition obligations and other expenses. 2025 2024 Three and Six Months Ended June 30
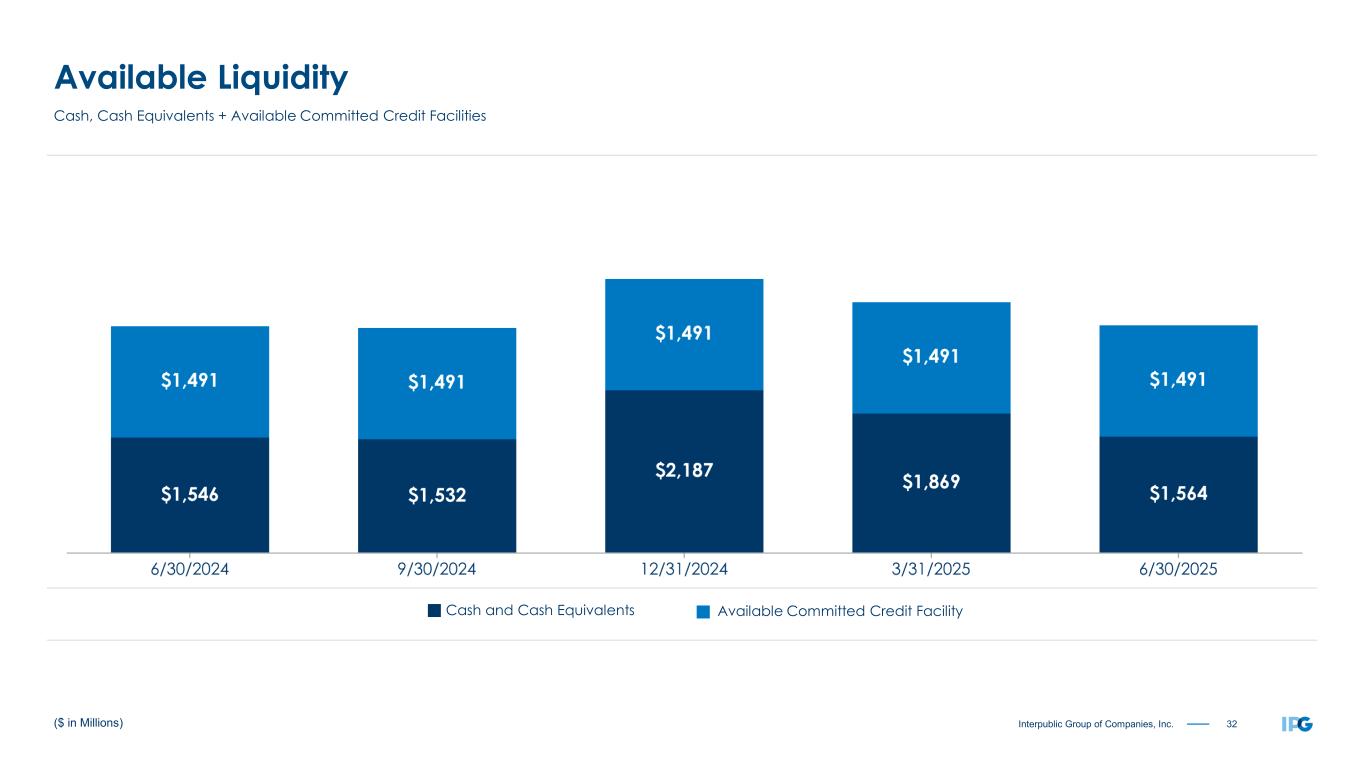
32Interpublic Group of Companies, Inc. ($ in Millions) Available Liquidity Cash, Cash Equivalents + Available Committed Credit Facilities Available Committed Credit FacilityCash and Cash Equivalents
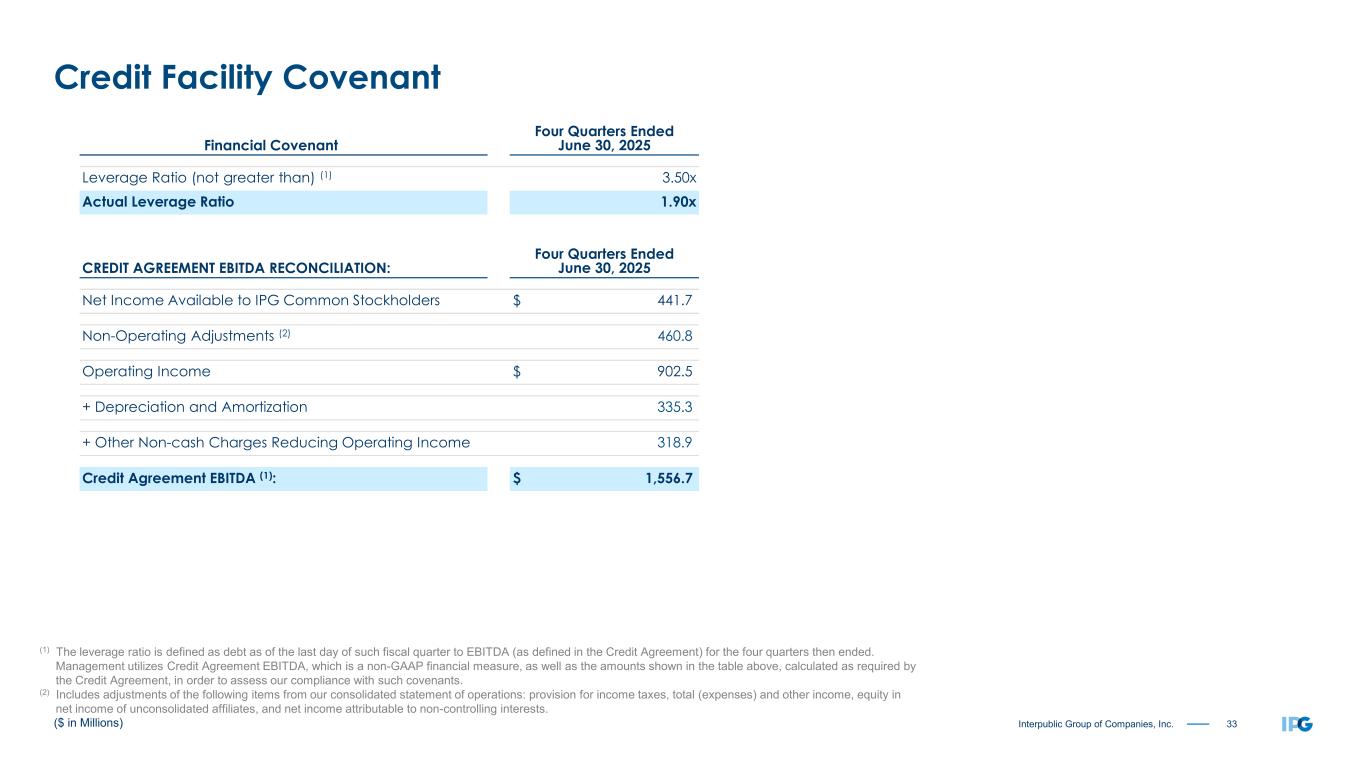
33Interpublic Group of Companies, Inc. Financial Covenant Four Quarters Ended June 30, 2025 Leverage Ratio (not greater than) (1) 3.50x Actual Leverage Ratio 1.90x CREDIT AGREEMENT EBITDA RECONCILIATION: Four Quarters Ended June 30, 2025 Net Income Available to IPG Common Stockholders $ 441.7 Non-Operating Adjustments (2) 460.8 Operating Income $ 902.5 + Depreciation and Amortization 335.3 + Other Non-cash Charges Reducing Operating Income 318.9 Credit Agreement EBITDA (1): $ 1,556.7 ($ in Millions) Credit Facility Covenant (1) The leverage ratio is defined as debt as of the last day of such fiscal quarter to EBITDA (as defined in the Credit Agreement) for the four quarters then ended. Management utilizes Credit Agreement EBITDA, which is a non-GAAP financial measure, as well as the amounts shown in the table above, calculated as required by the Credit Agreement, in order to assess our compliance with such covenants. (2) Includes adjustments of the following items from our consolidated statement of operations: provision for income taxes, total (expenses) and other income, equity in net income of unconsolidated affiliates, and net income attributable to non-controlling interests.
34Interpublic Group of Companies, Inc. Cautionary Statement This investor presentation contains forward-looking statements. Statements in this investor presentation that are not historical facts, including statements regarding guidance, goals, intentions, and expectations as to future plans, trends, events, or future results of operations or financial position, constitute forward-looking statements. Forward-looking statements are based on current expectations and assumptions that are subject to risks and uncertainties, which could cause our actual results and outcomes to differ materially from those reflected in the forward-looking statements, and are subject to change based on a number of factors, including those outlined under Item 1A, Risk Factors, in our most recent Annual Report on Form 10-K, and our other filings with the Securities and Exchange Commission ("SEC"). Forward-looking statements speak only as of the date they are made, and we undertake no obligation to update publicly any of them in light of new information or future events. On December 8, 2024, we entered into an Agreement and Plan of Merger (the “Merger Agreement”) with Omnicom Group Inc. (“Omnicom”), pursuant to which a merger subsidiary of Omnicom will merge with and into IPG, with IPG surviving the merger as a direct wholly owned subsidiary of Omnicom. The forward-looking statements in this report, other than the statements regarding the proposed merger transaction with Omnicom, do not assume the consummation of the proposed transactions unless specifically stated otherwise. Actual results and outcomes could differ materially for a variety of reasons, including, among others: ▪ risks relating to the pending merger transaction with Omnicom, including: the occurrence of any event, change, or other circumstances that could delay or prevent closing of the proposed transactions with Omnicom, or give rise to the termination of the Merger Agreement; unanticipated costs or restrictions resulting from regulatory review of the merger transactions; restrictions on our business activities imposed by the Merger Agreement; costs incurred in connection with the merger and subsequent integration with Omnicom; litigation risks relating to the merger; any failure to integrate successfully the business and operations of Omnicom and IPG in the expected time frame, to realize all of the anticipated benefits of the combination or to effectively manage the combined companies’ expanded operations; and any merger-related loss of clients, service providers, vendors, or other business counterparties; ▪ the effects of a challenging economy on the demand for our advertising and marketing services, on our clients’ financial condition and on our business or financial condition; ▪ our ability to attract new clients and retain existing clients, including as a result of the announced merger transaction with Omnicom; ▪ our ability to retain and attract key employees, including as a result of the announced merger transaction with Omnicom; ▪ unanticipated changes in the competitive environment in the marketing and communications services industry, including risks and challenges from new or developing technologies such as artificial intelligence (AI); ▪ risks associated with the effects of global, national and regional economic and political conditions, including counterparty risks and fluctuations in interest rates, inflation rates and currency exchange rates; ▪ the economic or business impact of military or political conflict in key markets, or any significant market disruptions as a result of factors like public health crises; ▪ developments from changes in the regulatory and legal environment for advertising and marketing services companies around the world, including laws and regulations related to data protection and consumer privacy; ▪ the impact on our business as a result of general or directed cybersecurity events; and ▪ risks associated with assumptions we make in connection with our critical accounting estimates, including changes in assumptions associated with any effects of a challenging economy, and potential adverse effects if we are required to recognize impairment charges or other adverse accounting-related developments. Investors should carefully consider the foregoing factors and the other risks and uncertainties that may affect our business, including those outlined under Item 1A, Risk Factors, in our most recent annual report on Form 10-K, and our quarterly reports on Form 10-Q. Investors are cautioned not to place undue reliance on forward-looking statements, which speak only as of the date they are made. We undertake no obligation to update or revise publicly any of them in light of new information, future events, or otherwise.