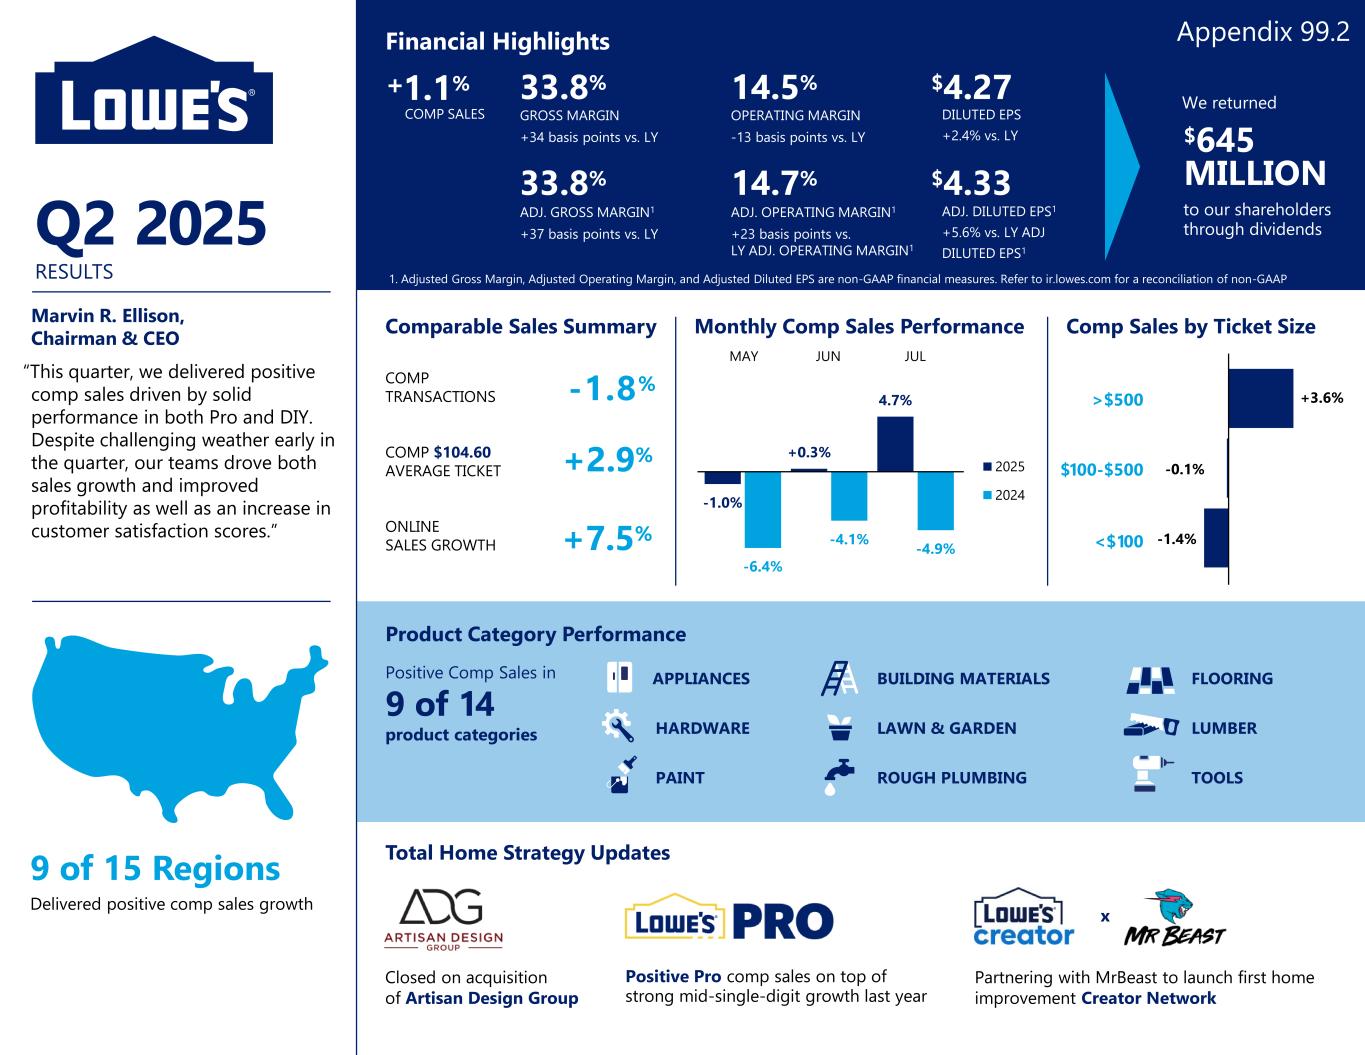
-1.0% +0.3% 4.7% -6.4% -4.1% -4.9% 2025 2024 Marvin R. Ellison, Chairman & CEO “This quarter, we delivered positive comp sales driven by solid performance in both Pro and DIY. Despite challenging weather early in the quarter, our teams drove both sales growth and improved profitability as well as an increase in customer satisfaction scores.” Q2 2025 RESULTS Comparable Sales Summary COMP TRANSACTIONS COMP $104.60 AVERAGE TICKET ONLINE SALES GROWTH -1.8% +2.9% +7.5% -1.4% -0.1% +3.6%>$500 $100-$500 <$100 9 of 15 Regions Delivered positive comp sales growth Product Category Performance Positive Comp Sales in 9 of 14 product categories Monthly Comp Sales Performance Comp Sales by Ticket Size Total Home Strategy Updates MAY We returned $645 MILLION to our shareholders through dividends Financial Highlights 33.8% GROSS MARGIN +34 basis points vs. LY $4.27 DILUTED EPS +2.4% vs. LY 14.5% OPERATING MARGIN -13 basis points vs. LY 33.8% ADJ. GROSS MARGIN1 +37 basis points vs. LY $4.33 ADJ. DILUTED EPS1 +5.6% vs. LY ADJ DILUTED EPS1 14.7% ADJ. OPERATING MARGIN1 +23 basis points vs. LY ADJ. OPERATING MARGIN1 1. Adjusted Gross Margin, Adjusted Operating Margin, and Adjusted Diluted EPS are non-GAAP financial measures. Refer to ir.lowes.com for a reconciliation of non-GAAP measures. Positive Pro comp sales on top of strong mid-single-digit growth last year BUILDING MATERIALS LAWN & GARDEN ROUGH PLUMBING APPLIANCES HARDWARE PAINT FLOORING LUMBER TOOLS Closed on acquisition of Artisan Design Group Partnering with MrBeast to launch first home improvement Creator Network x JUN JUL +1.1% COMP SALES Appendix 99.2

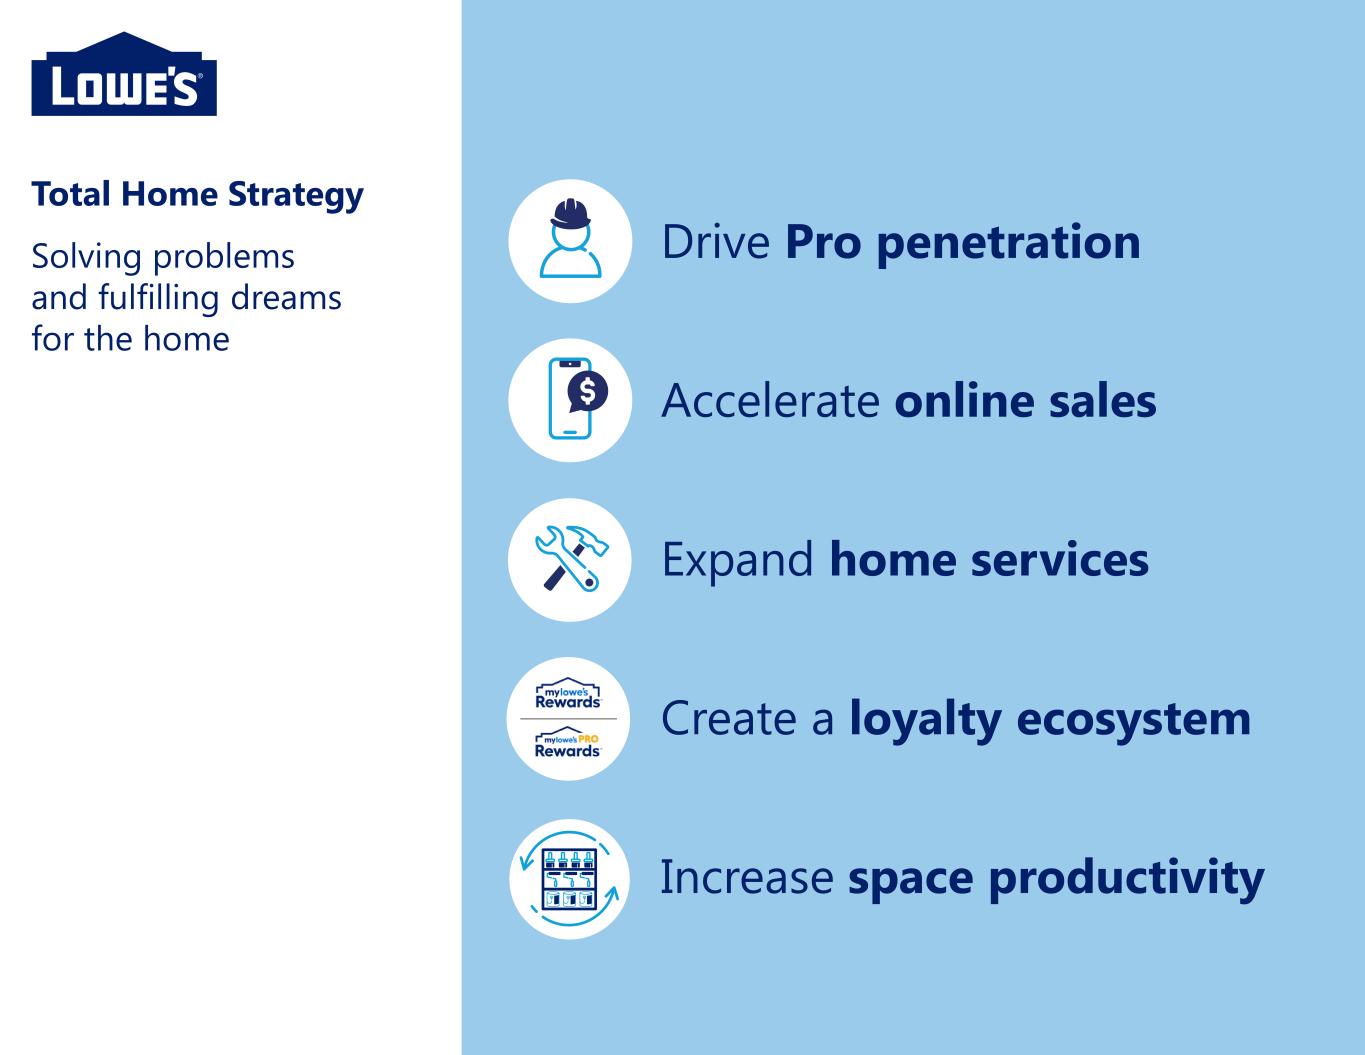
Drive Pro penetration Accelerate online sales Expand home services Create a loyalty ecosystem Increase space productivity Total Home Strategy Solving problems and fulfilling dreams for the home

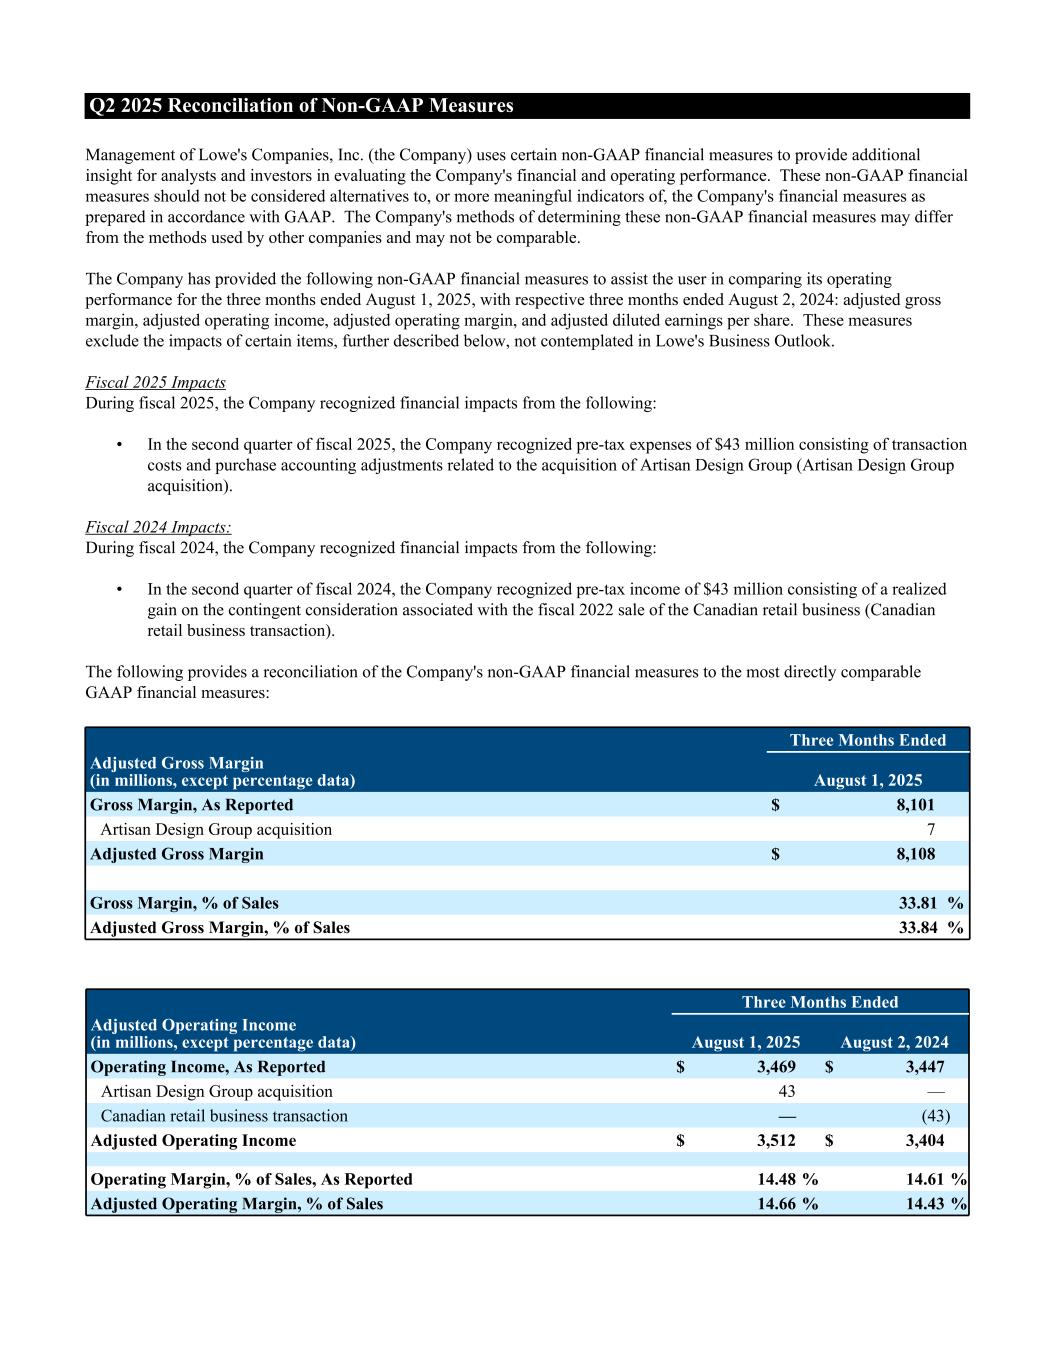
Q2 2025 Reconciliation of Non-GAAP Measures Management of Lowe's Companies, Inc. (the Company) uses certain non-GAAP financial measures to provide additional insight for analysts and investors in evaluating the Company's financial and operating performance. These non-GAAP financial measures should not be considered alternatives to, or more meaningful indicators of, the Company's financial measures as prepared in accordance with GAAP. The Company's methods of determining these non-GAAP financial measures may differ from the methods used by other companies and may not be comparable. The Company has provided the following non-GAAP financial measures to assist the user in comparing its operating performance for the three months ended August 1, 2025, with respective three months ended August 2, 2024: adjusted gross margin, adjusted operating income, adjusted operating margin, and adjusted diluted earnings per share. These measures exclude the impacts of certain items, further described below, not contemplated in Lowe's Business Outlook. Fiscal 2025 Impacts During fiscal 2025, the Company recognized financial impacts from the following: • In the second quarter of fiscal 2025, the Company recognized pre-tax expenses of $43 million consisting of transaction costs and purchase accounting adjustments related to the acquisition of Artisan Design Group (Artisan Design Group acquisition). Fiscal 2024 Impacts: During fiscal 2024, the Company recognized financial impacts from the following: • In the second quarter of fiscal 2024, the Company recognized pre-tax income of $43 million consisting of a realized gain on the contingent consideration associated with the fiscal 2022 sale of the Canadian retail business (Canadian retail business transaction). The following provides a reconciliation of the Company's non-GAAP financial measures to the most directly comparable GAAP financial measures: Three Months Ended Adjusted Gross Margin (in millions, except percentage data) August 1, 2025 Gross Margin, As Reported $ 8,101 Artisan Design Group acquisition 7 Adjusted Gross Margin $ 8,108 Gross Margin, % of Sales 33.81 % Adjusted Gross Margin, % of Sales 33.84 % Three Months Ended Adjusted Operating Income (in millions, except percentage data) August 1, 2025 August 2, 2024 Operating Income, As Reported $ 3,469 $ 3,447 Artisan Design Group acquisition 43 — Canadian retail business transaction — (43) Adjusted Operating Income $ 3,512 $ 3,404 Operating Margin, % of Sales, As Reported 14.48 % 14.61 % Adjusted Operating Margin, % of Sales 14.66 % 14.43 %

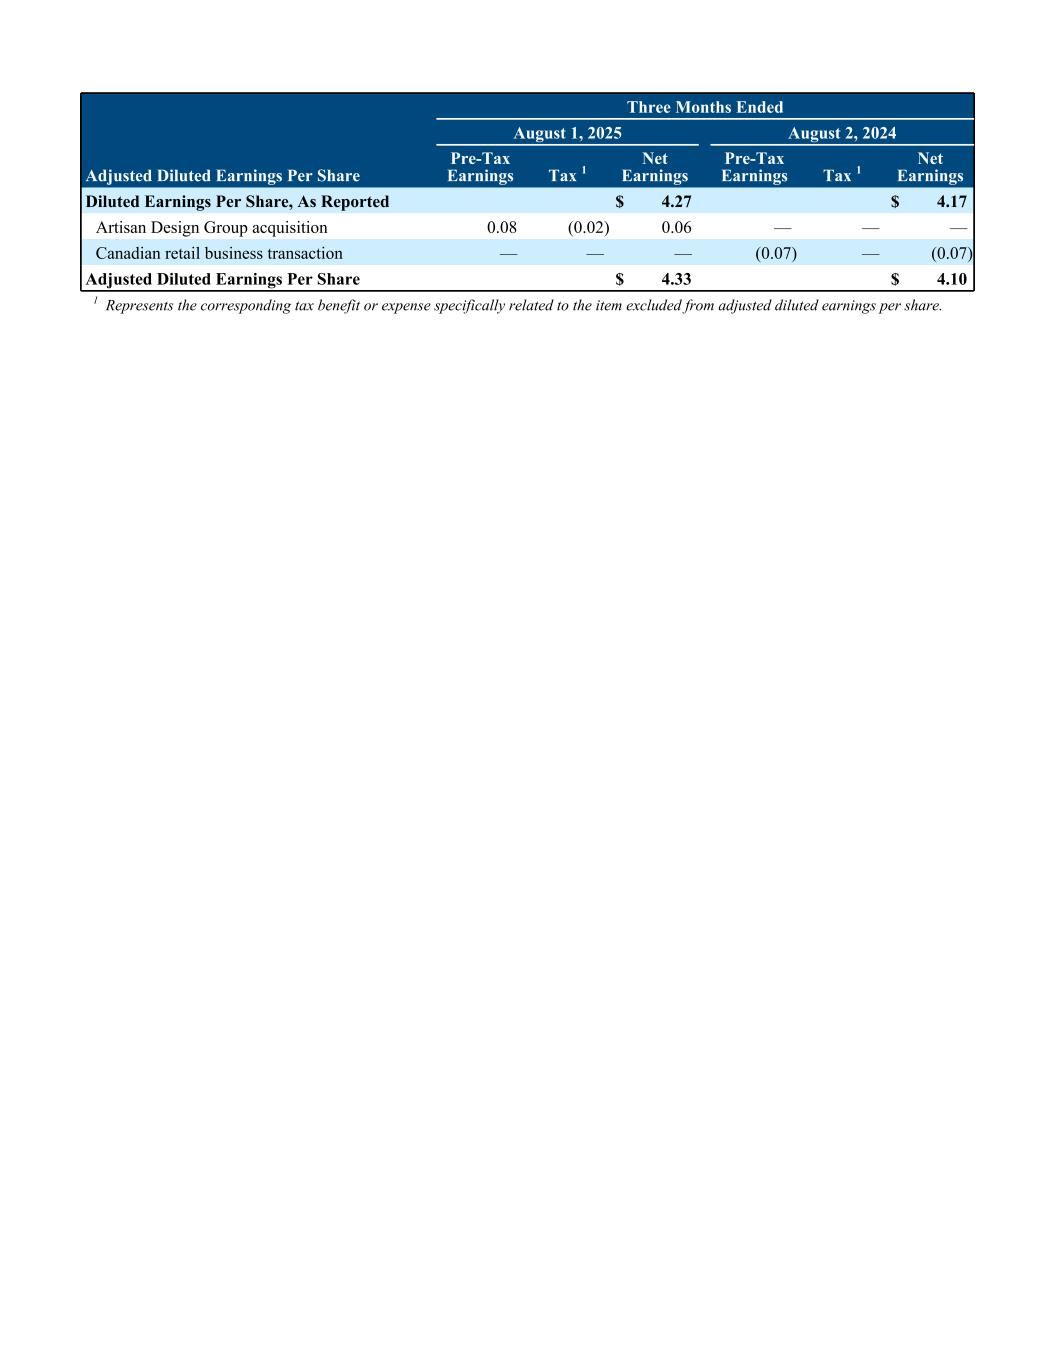
Three Months Ended August 1, 2025 August 2, 2024 Adjusted Diluted Earnings Per Share Pre-Tax Earnings Tax 1 Net Earnings Pre-Tax Earnings Tax 1 Net Earnings Diluted Earnings Per Share, As Reported $ 4.27 $ 4.17 Artisan Design Group acquisition 0.08 (0.02) 0.06 — — — Canadian retail business transaction — — — (0.07) — (0.07) Adjusted Diluted Earnings Per Share $ 4.33 $ 4.10 1 Represents the corresponding tax benefit or expense specifically related to the item excluded from adjusted diluted earnings per share.