
The Manitowoc Company, Inc. Midwest IDEAS Investor Conference August 26, 2026
Forward-Looking Statements Safe Harbor Statement Any statements contained in this presentation that are not historical facts are “forward-looking statements.” These statements are based on the current expectations of the management of the Company, only speak as of the date on which they are made and are subject to uncertainty and changes in circumstances. The Company undertakes no obligation to update or revise forward-looking statements, whether as a result of new information, future events, or otherwise. As a general matter, forward-looking statements are those focused upon anticipated events or trends, expectations and beliefs relating to matters that are not historical in nature. The words “could,” “should,” “feel,” “anticipate,” “aim,” “preliminary,” “expect,” “believe,” “estimate,” “intend,” “intent,” “plan,” “will,” “foresee,” “project,” “forecast,” or the negative thereof or variations thereon, and similar expressions identify forward-looking statements. By their nature, forward-looking statements are not guarantees of future performance or results and involve risks and uncertainties because they relate to events and depend on circumstances that will occur in the future. There are a number of factors that could cause actual results and developments to differ materially from those expressed or implied by such forward-looking statements. For a list of factors that could cause actual results to differ materially from those discussed or implied, please see the Company’s periodic filings with the SEC, particularly those disclosed in “Risk Factors” in the Company’s Annual Reports on Form 10-K. Any “forward-looking statements” in this presentation are intended to qualify for the safe harbor from liability under the Private Securities Litigation Reform Act of 1995. Non-GAAP Measures Adjusted net loss, adjusted diluted net loss per share (“Adjusted DEPS”), EBITDA, adjusted EBITDA, adjusted return on invested capital, and free cash flows are financial measures that are not in accordance with U.S. Generally Accepted Accounting Principles (“GAAP”). For a reconciliation to the comparable GAAP numbers please see “Appendix – GAAP to Non-GAAP Reconciliation.” Manitowoc believes these non-GAAP financial measures provide important supplemental information to both management and investors regarding financial and business trends used in assessing its results of operations. Manitowoc believes excluding specified items provides a more meaningful comparison to the corresponding reporting periods and internal budgets and forecasts, assists investors in performing analysis that is consistent with financial models developed by investors and research analysts, provides management with a more relevant measure of operating performance, and is more useful in assessing management performance.
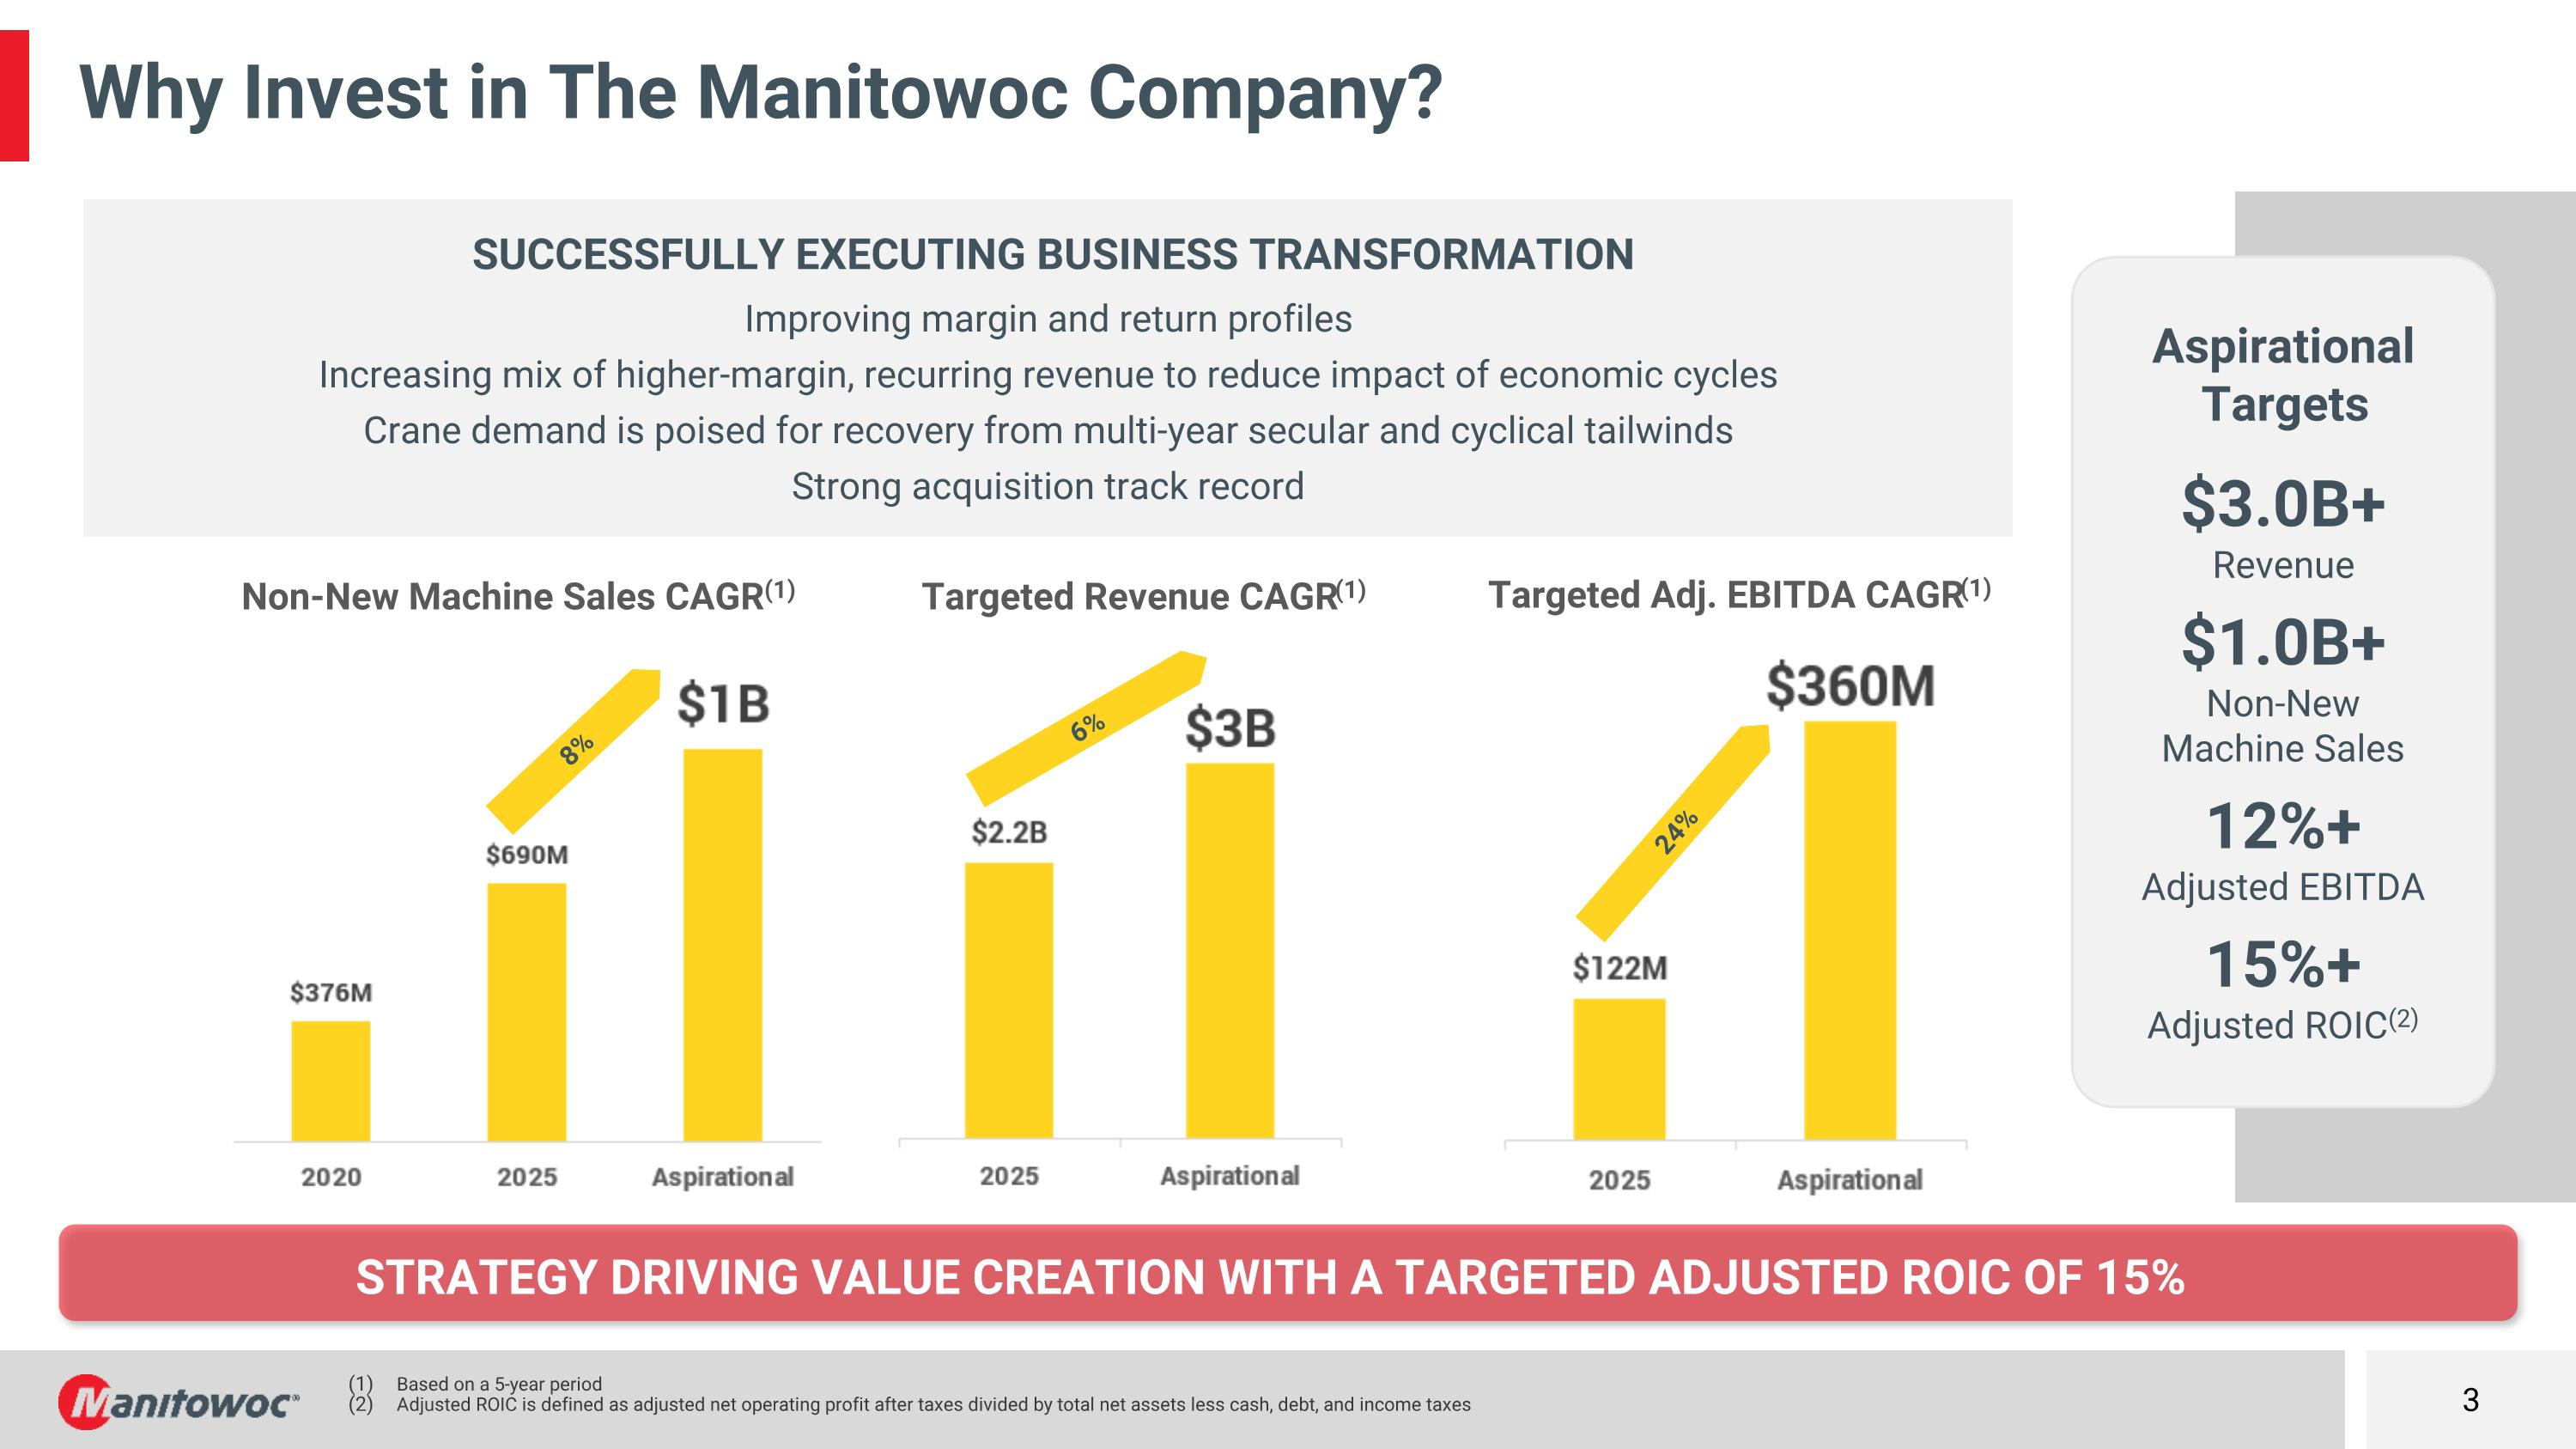
Strategy driving value creation with a targeted adjusted roic of 15% Why Invest in The Manitowoc Company? SUCCESSFULLY EXECUTING BUSINESS TRANSFORMATION Improving margin and return profiles Increasing mix of higher-margin, recurring revenue to reduce impact of economic cycles Crane demand is poised for recovery from multi-year secular and cyclical tailwinds Strong acquisition track record Aspirational Targets $3.0B+ Revenue $1.0B+ Non-New Machine Sales 12%+ Adjusted EBITDA 15%+ Adjusted ROIC(2) Based on a 5-year period Adjusted ROIC is defined as adjusted net operating profit after taxes divided by total net assets less cash, debt, and income taxes Targeted Adj. EBITDA CAGR(1) 24% Targeted Revenue CAGR(1) 6% 8% Non-New Machine Sales CAGR(1)
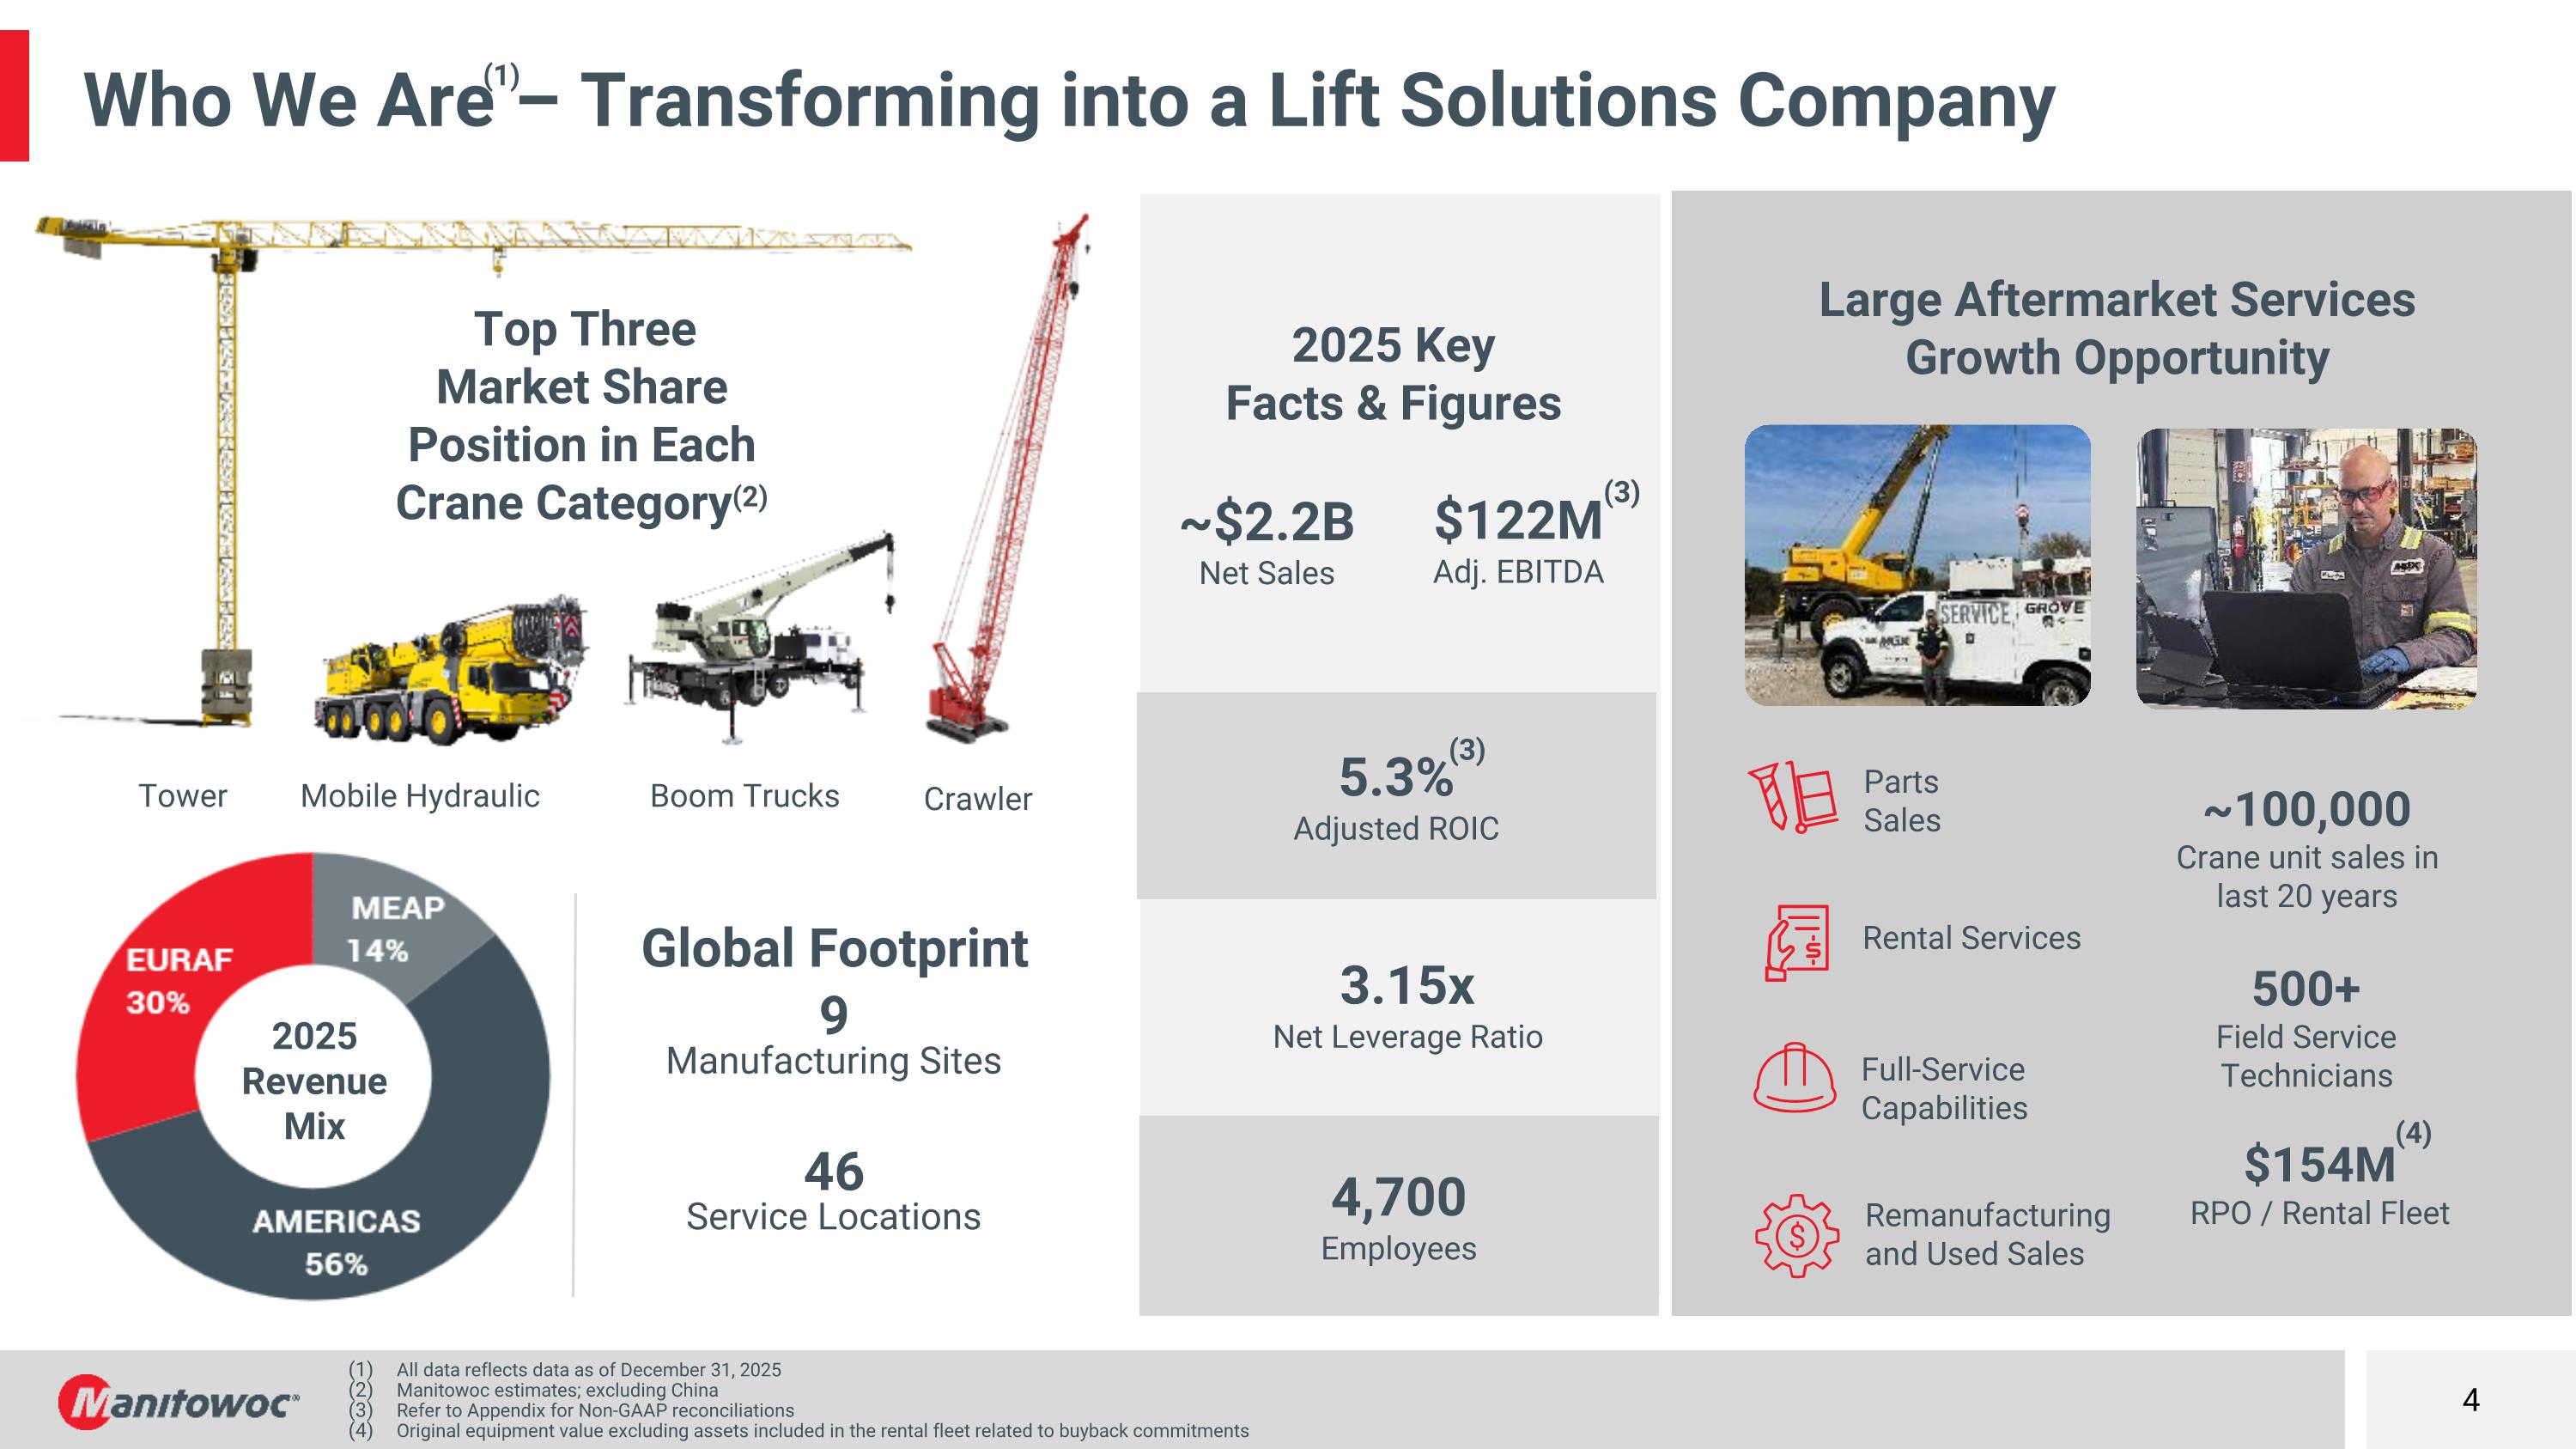
Who We Are – Transforming into a Lift Solutions Company Top Three Market Share Position in Each Crane Category(2) Tower Boom Trucks Crawler Mobile Hydraulic Global Footprint 9 Manufacturing Sites 46 Service Locations 4,700 Employees $154M RPO / Rental Fleet ~$2.2B Net Sales $122M Adj. EBITDA 5.3% Adjusted ROIC 3.15x Net Leverage Ratio 2025 Revenue Mix Large Aftermarket Services Growth Opportunity 2025 Key Facts & Figures Remanufacturing and Used Sales Full-Service Capabilities Rental Services Parts Sales ~100,000 Crane unit sales in last 20 years 500+ Field Service Technicians All data reflects data as of December 31, 2025 Manitowoc estimates; excluding China Refer to Appendix for Non-GAAP reconciliations Original equipment value excluding assets included in the rental fleet related to buyback commitments (1) (3) (3) (4)
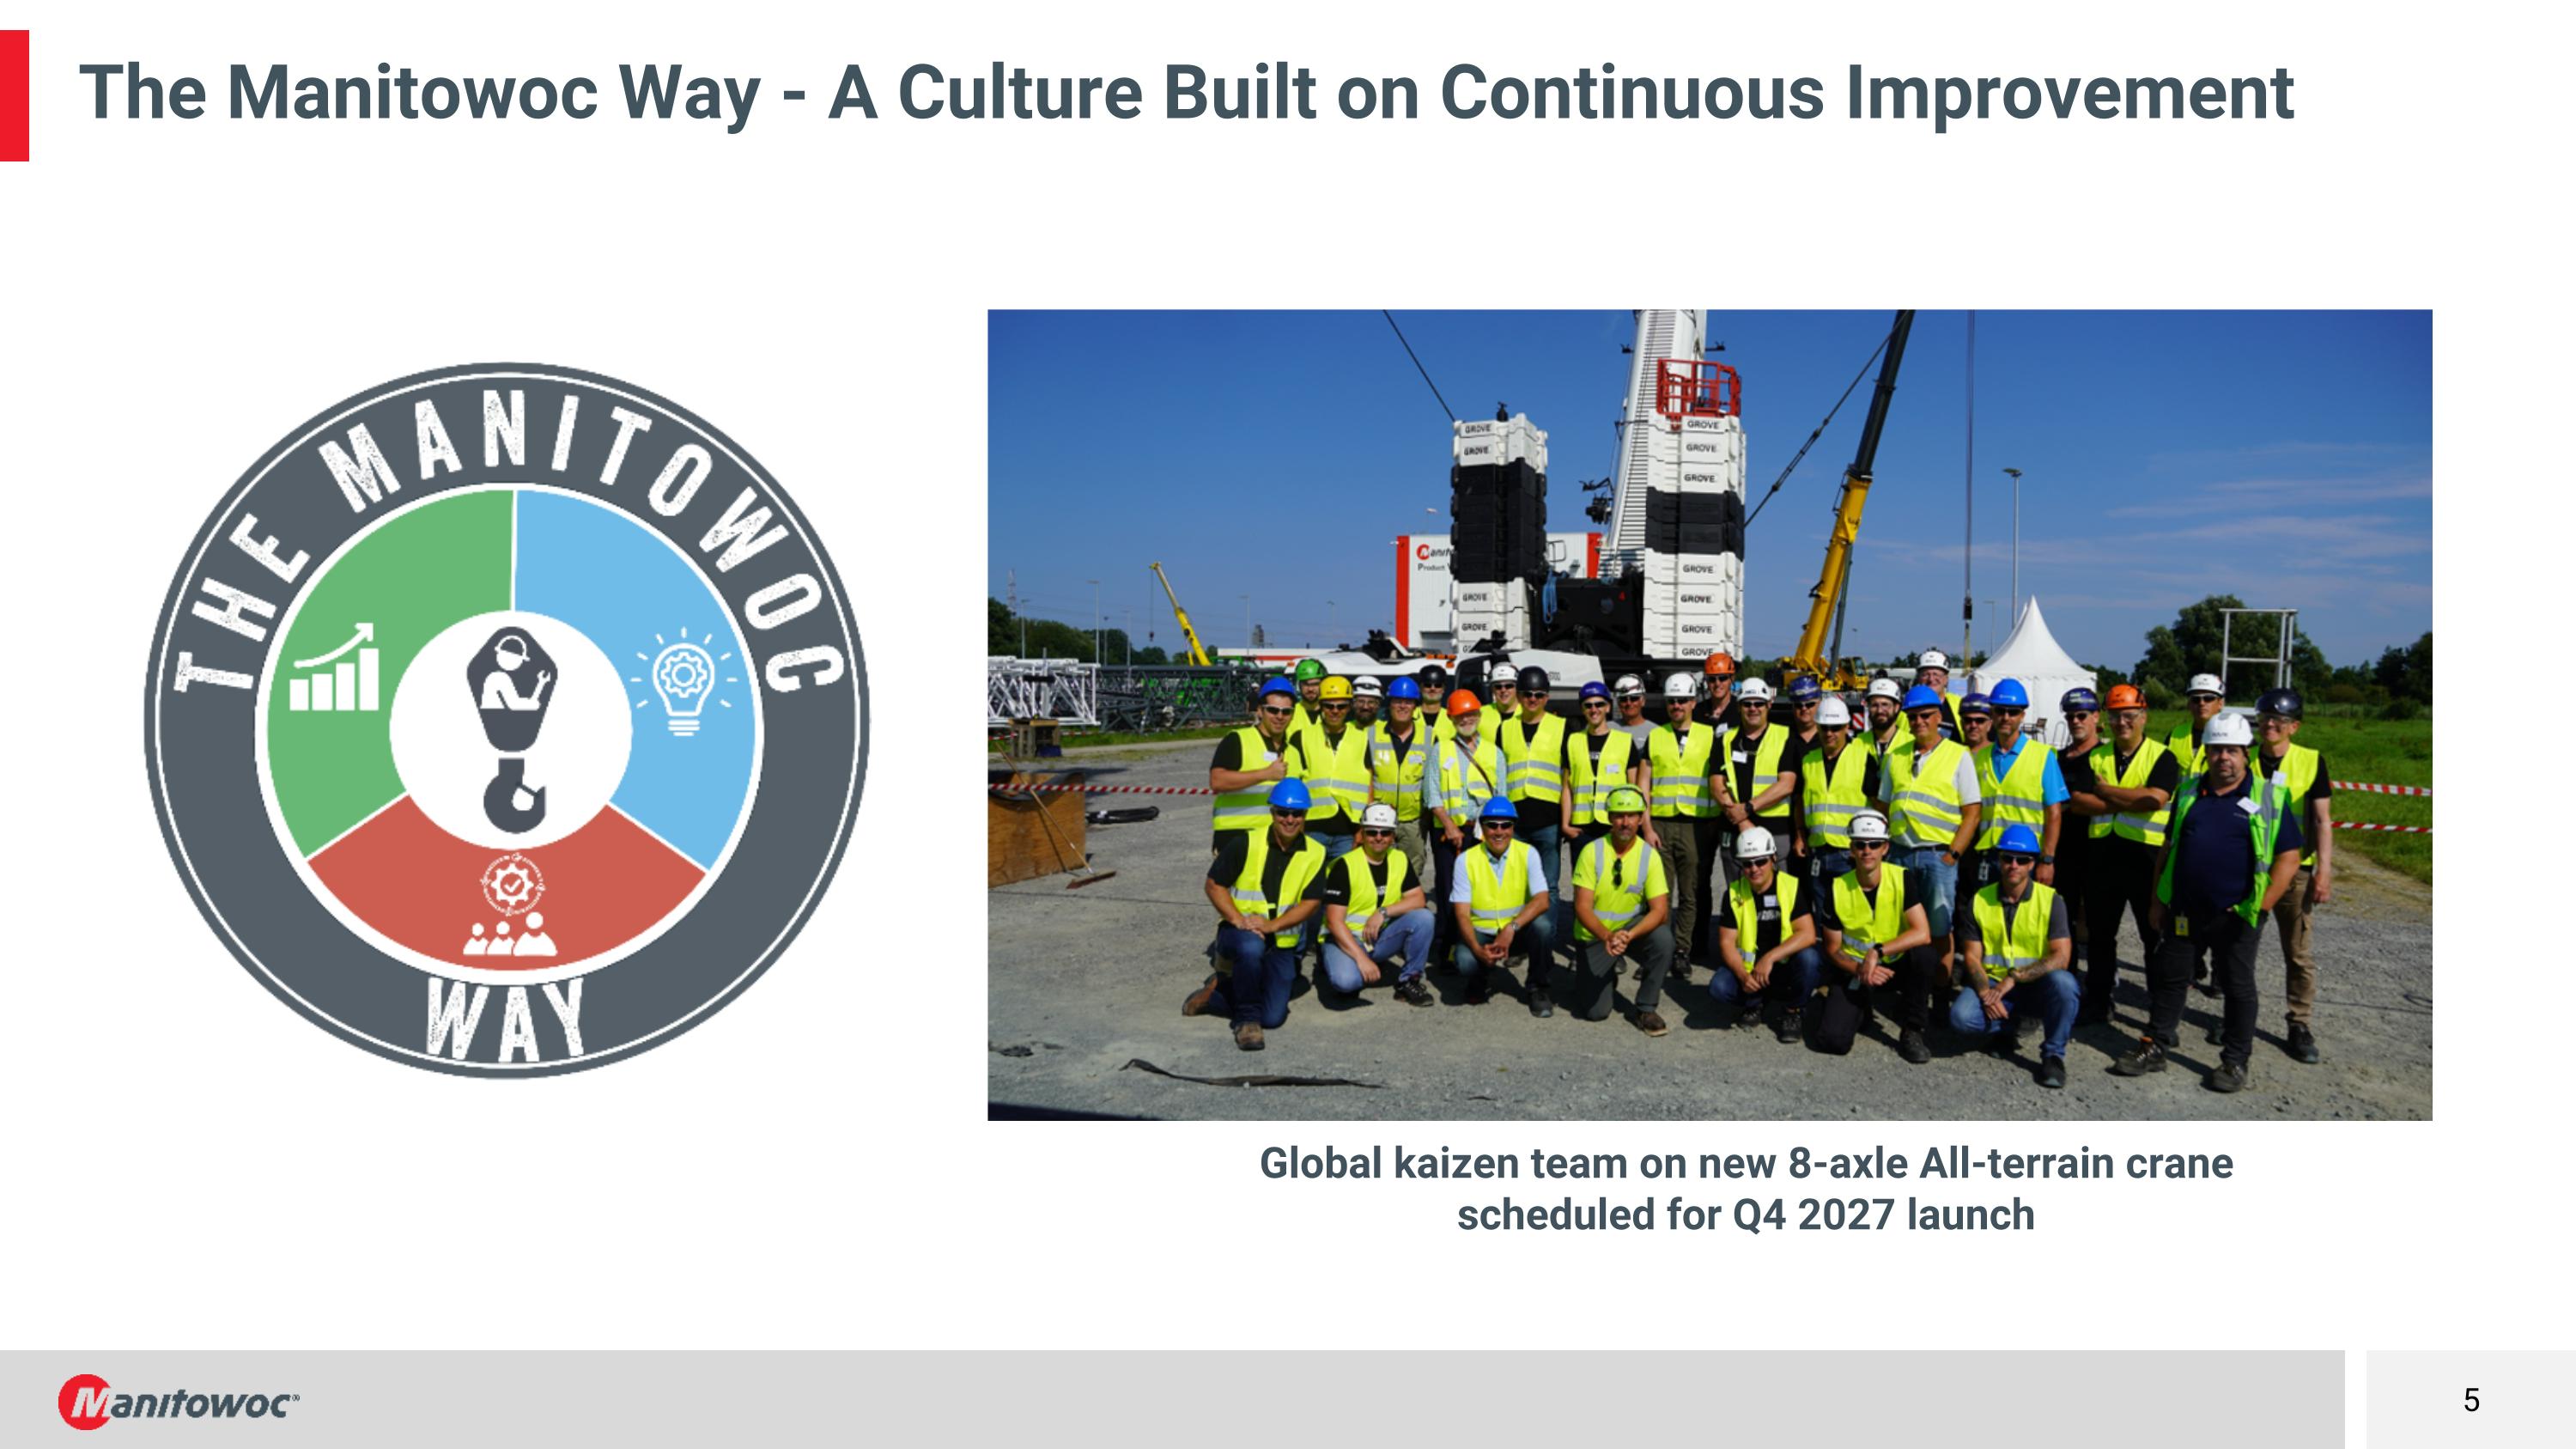
The Manitowoc Way - A Culture Built on Continuous Improvement Global kaizen team on new 8-axle All-terrain crane scheduled for Q4 2027 launch
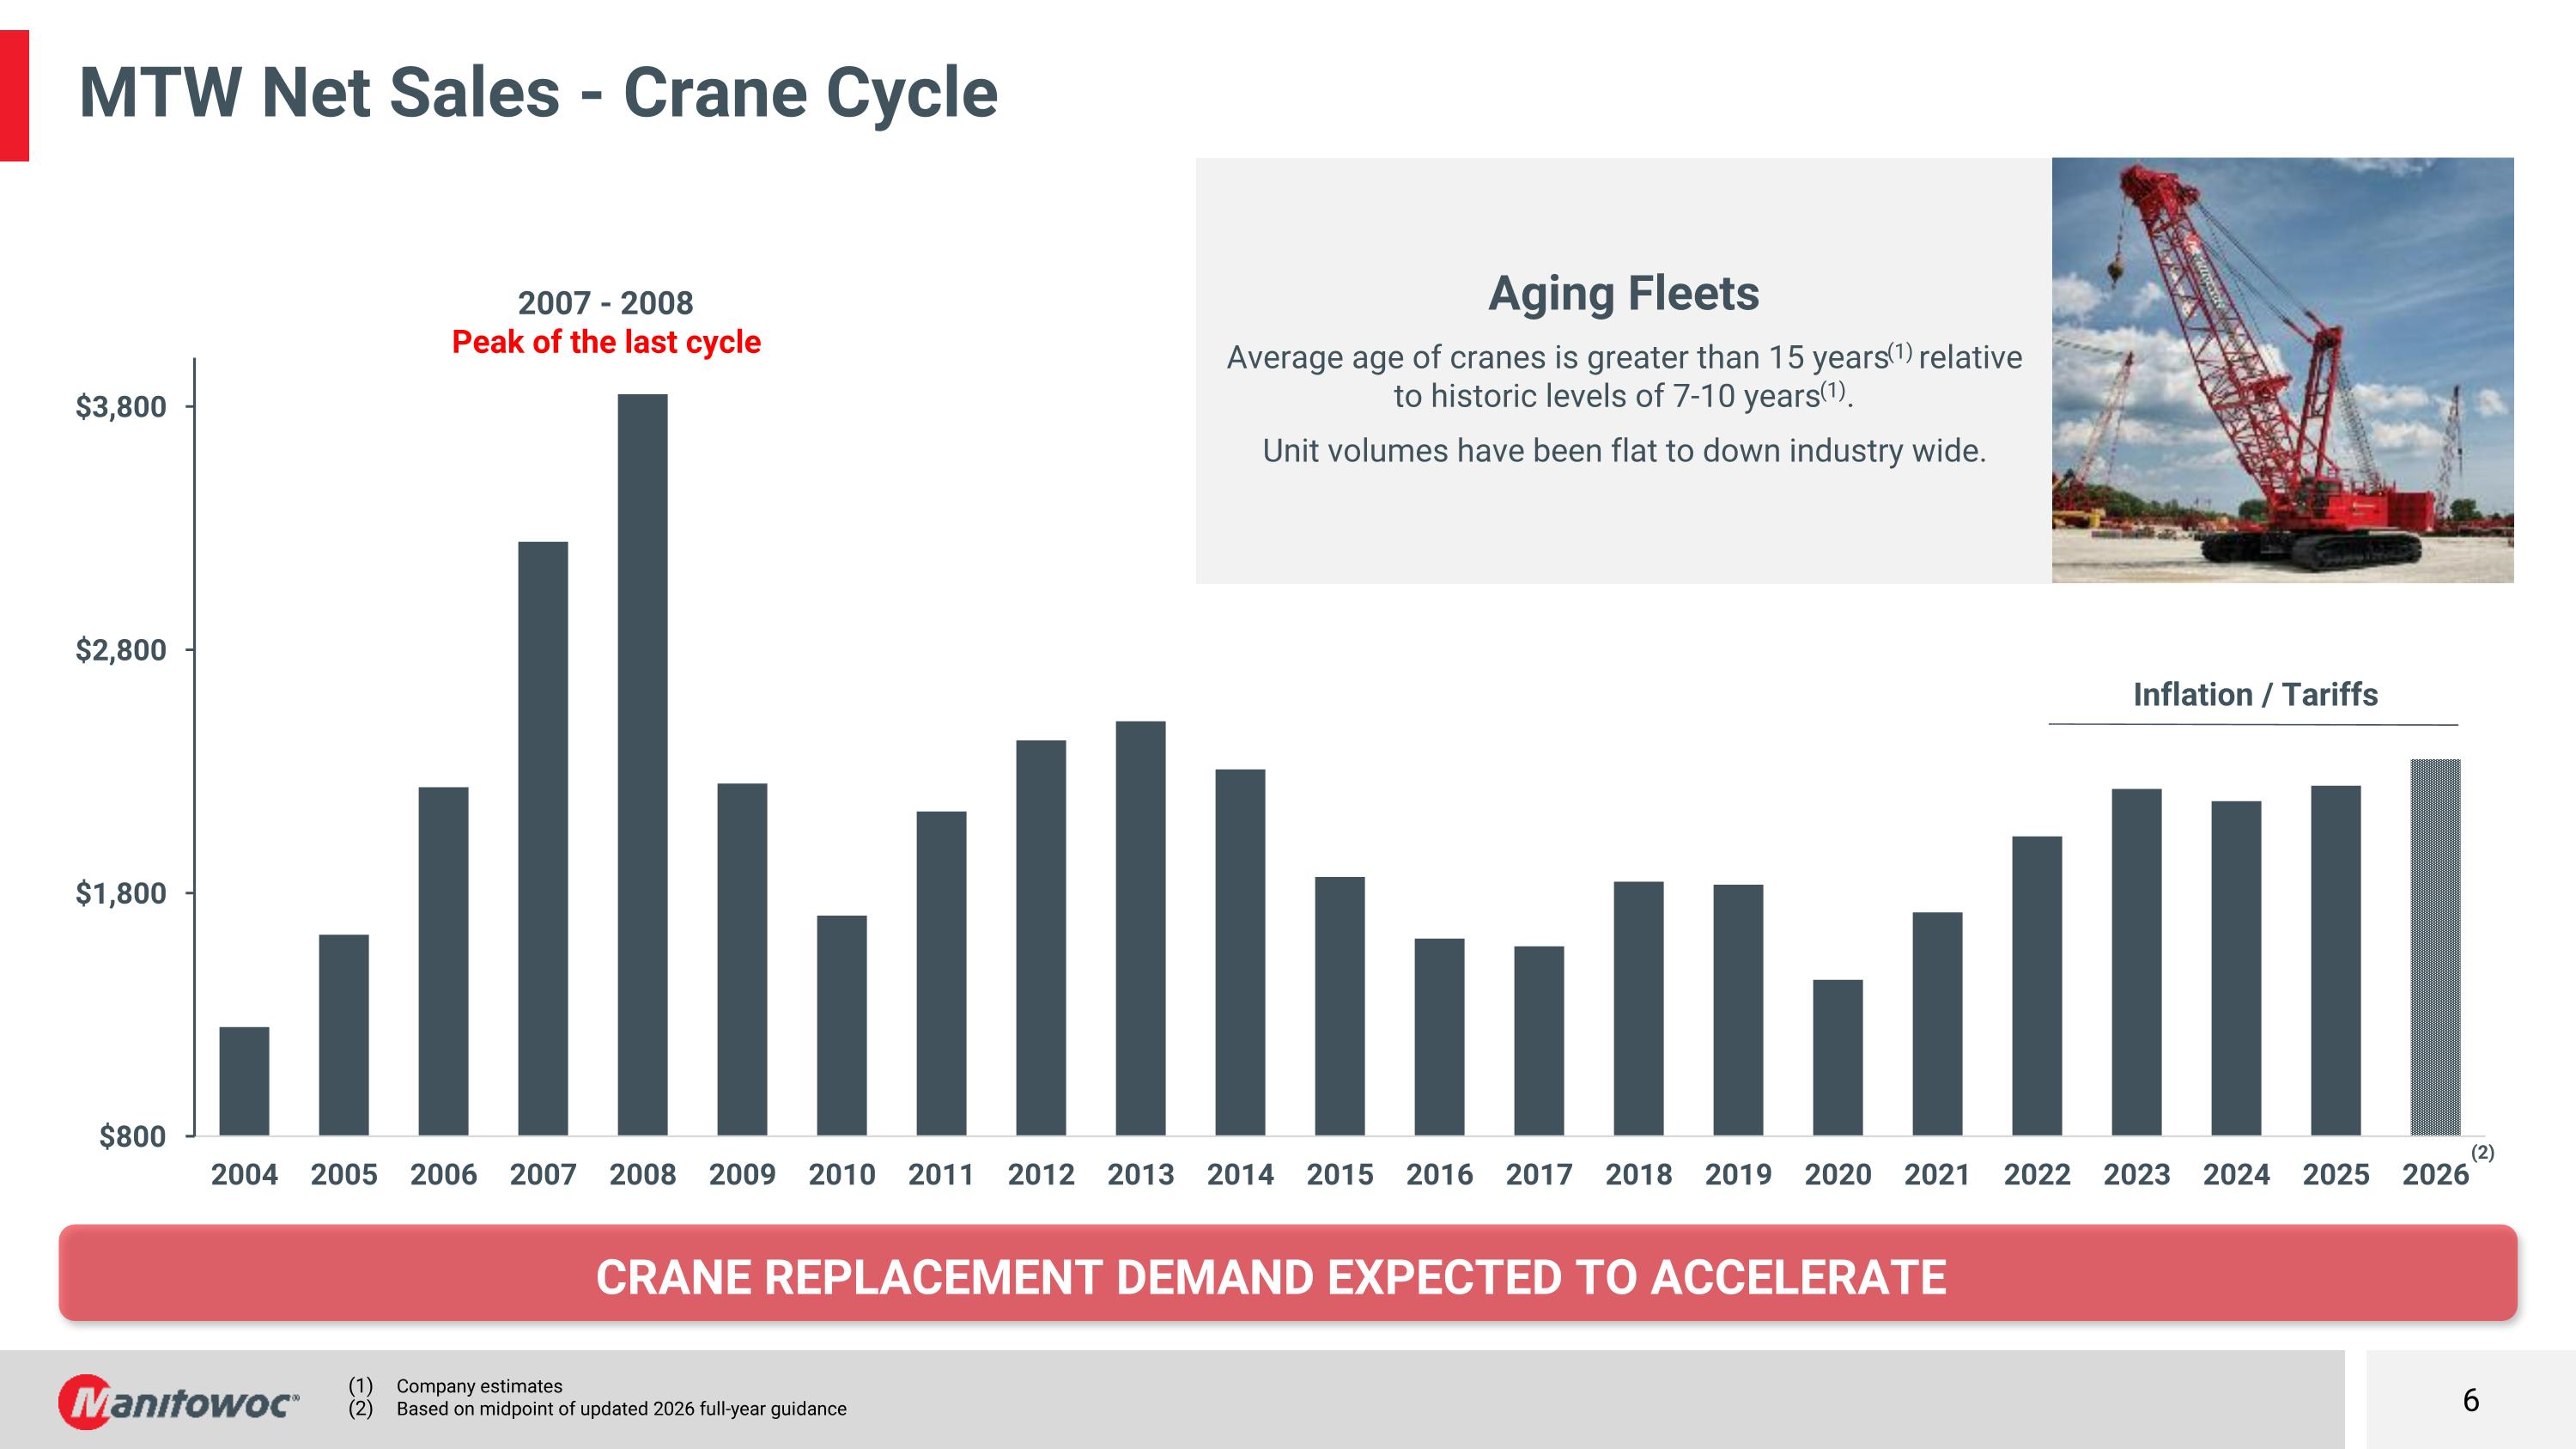
Crane replacement demand expected to accelerate MTW Net Sales - Crane Cycle Company estimates Based on midpoint of updated 2026 full-year guidance 2007 - 2008 Peak of the last cycle Aging Fleets Average age of cranes is greater than 15 years(1) relative to historic levels of 7-10 years(1). Unit volumes have been flat to down industry wide. Inflation / Tariffs (2)
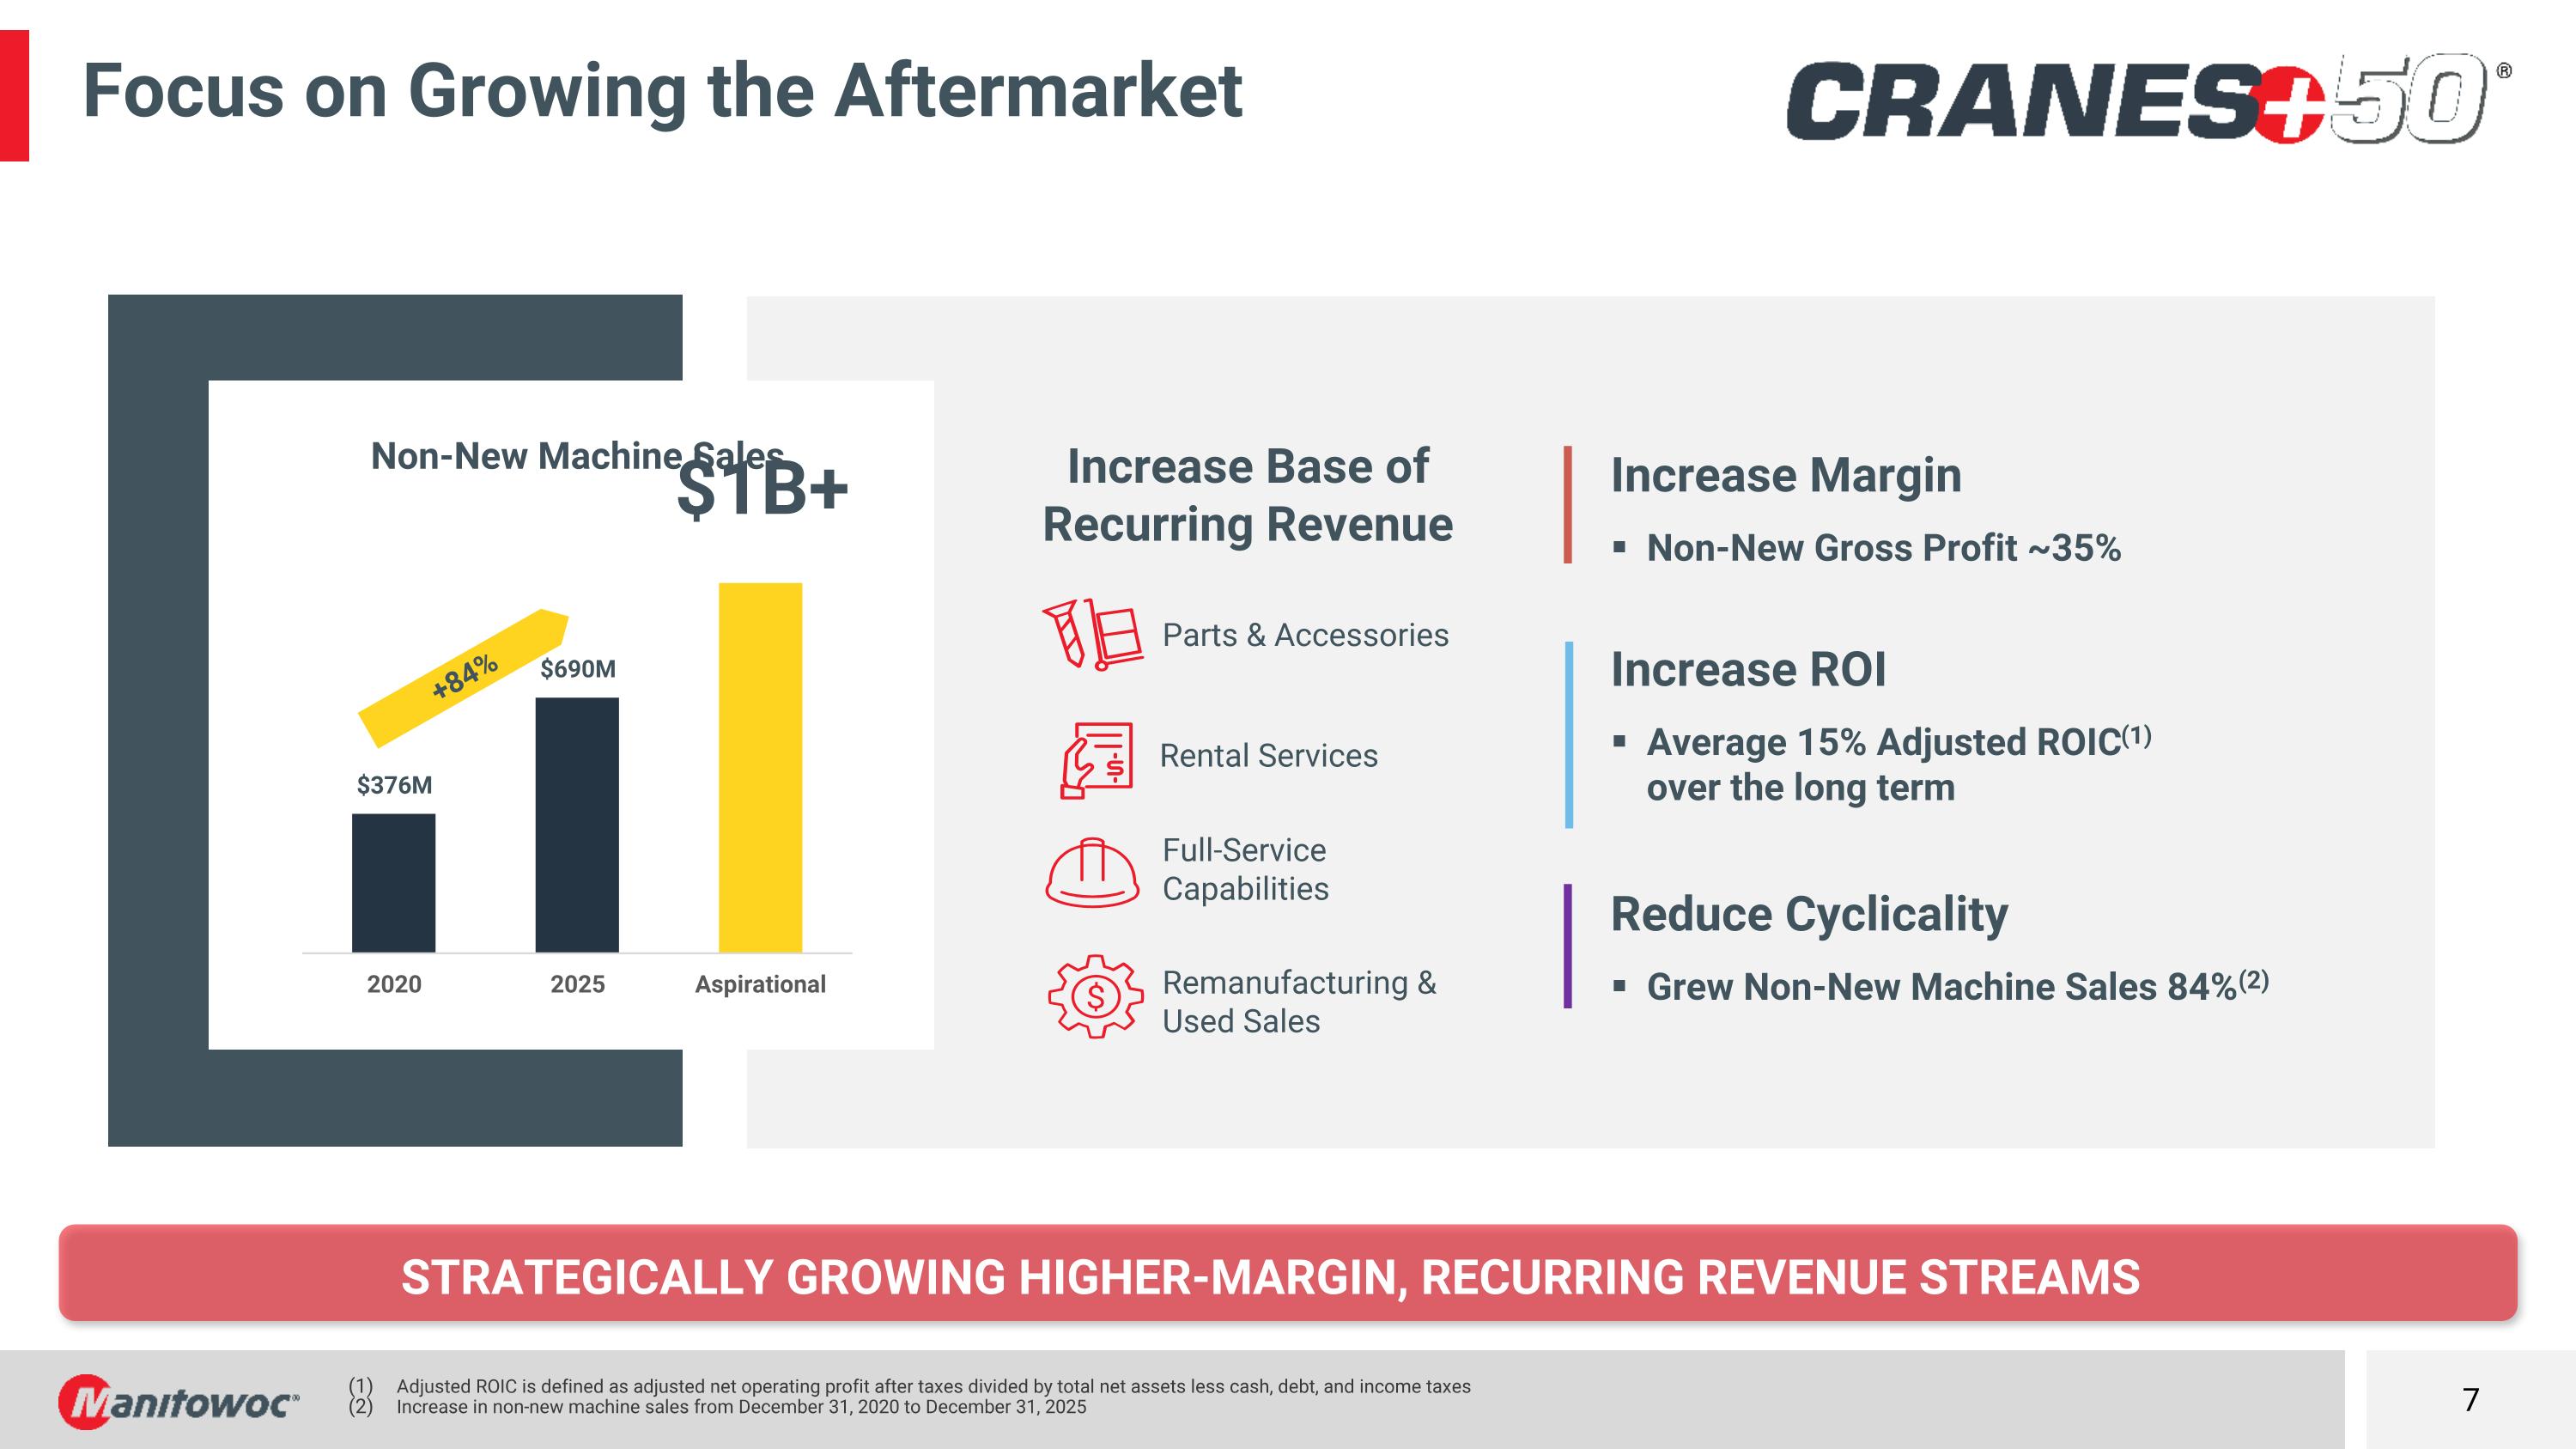
Increase Margin Non-New Gross Profit ~35% Increase ROI Average 15% Adjusted ROIC(1) over the long term Reduce Cyclicality Grew Non-New Machine Sales 84%(2) Remanufacturing & Used Sales Full-Service Capabilities Rental Services Parts & Accessories Increase Base of Recurring Revenue +84% Strategically growing higher-margin, recurring revenue streams Focus on Growing the Aftermarket Adjusted ROIC is defined as adjusted net operating profit after taxes divided by total net assets less cash, debt, and income taxes Increase in non-new machine sales from December 31, 2020 to December 31, 2025
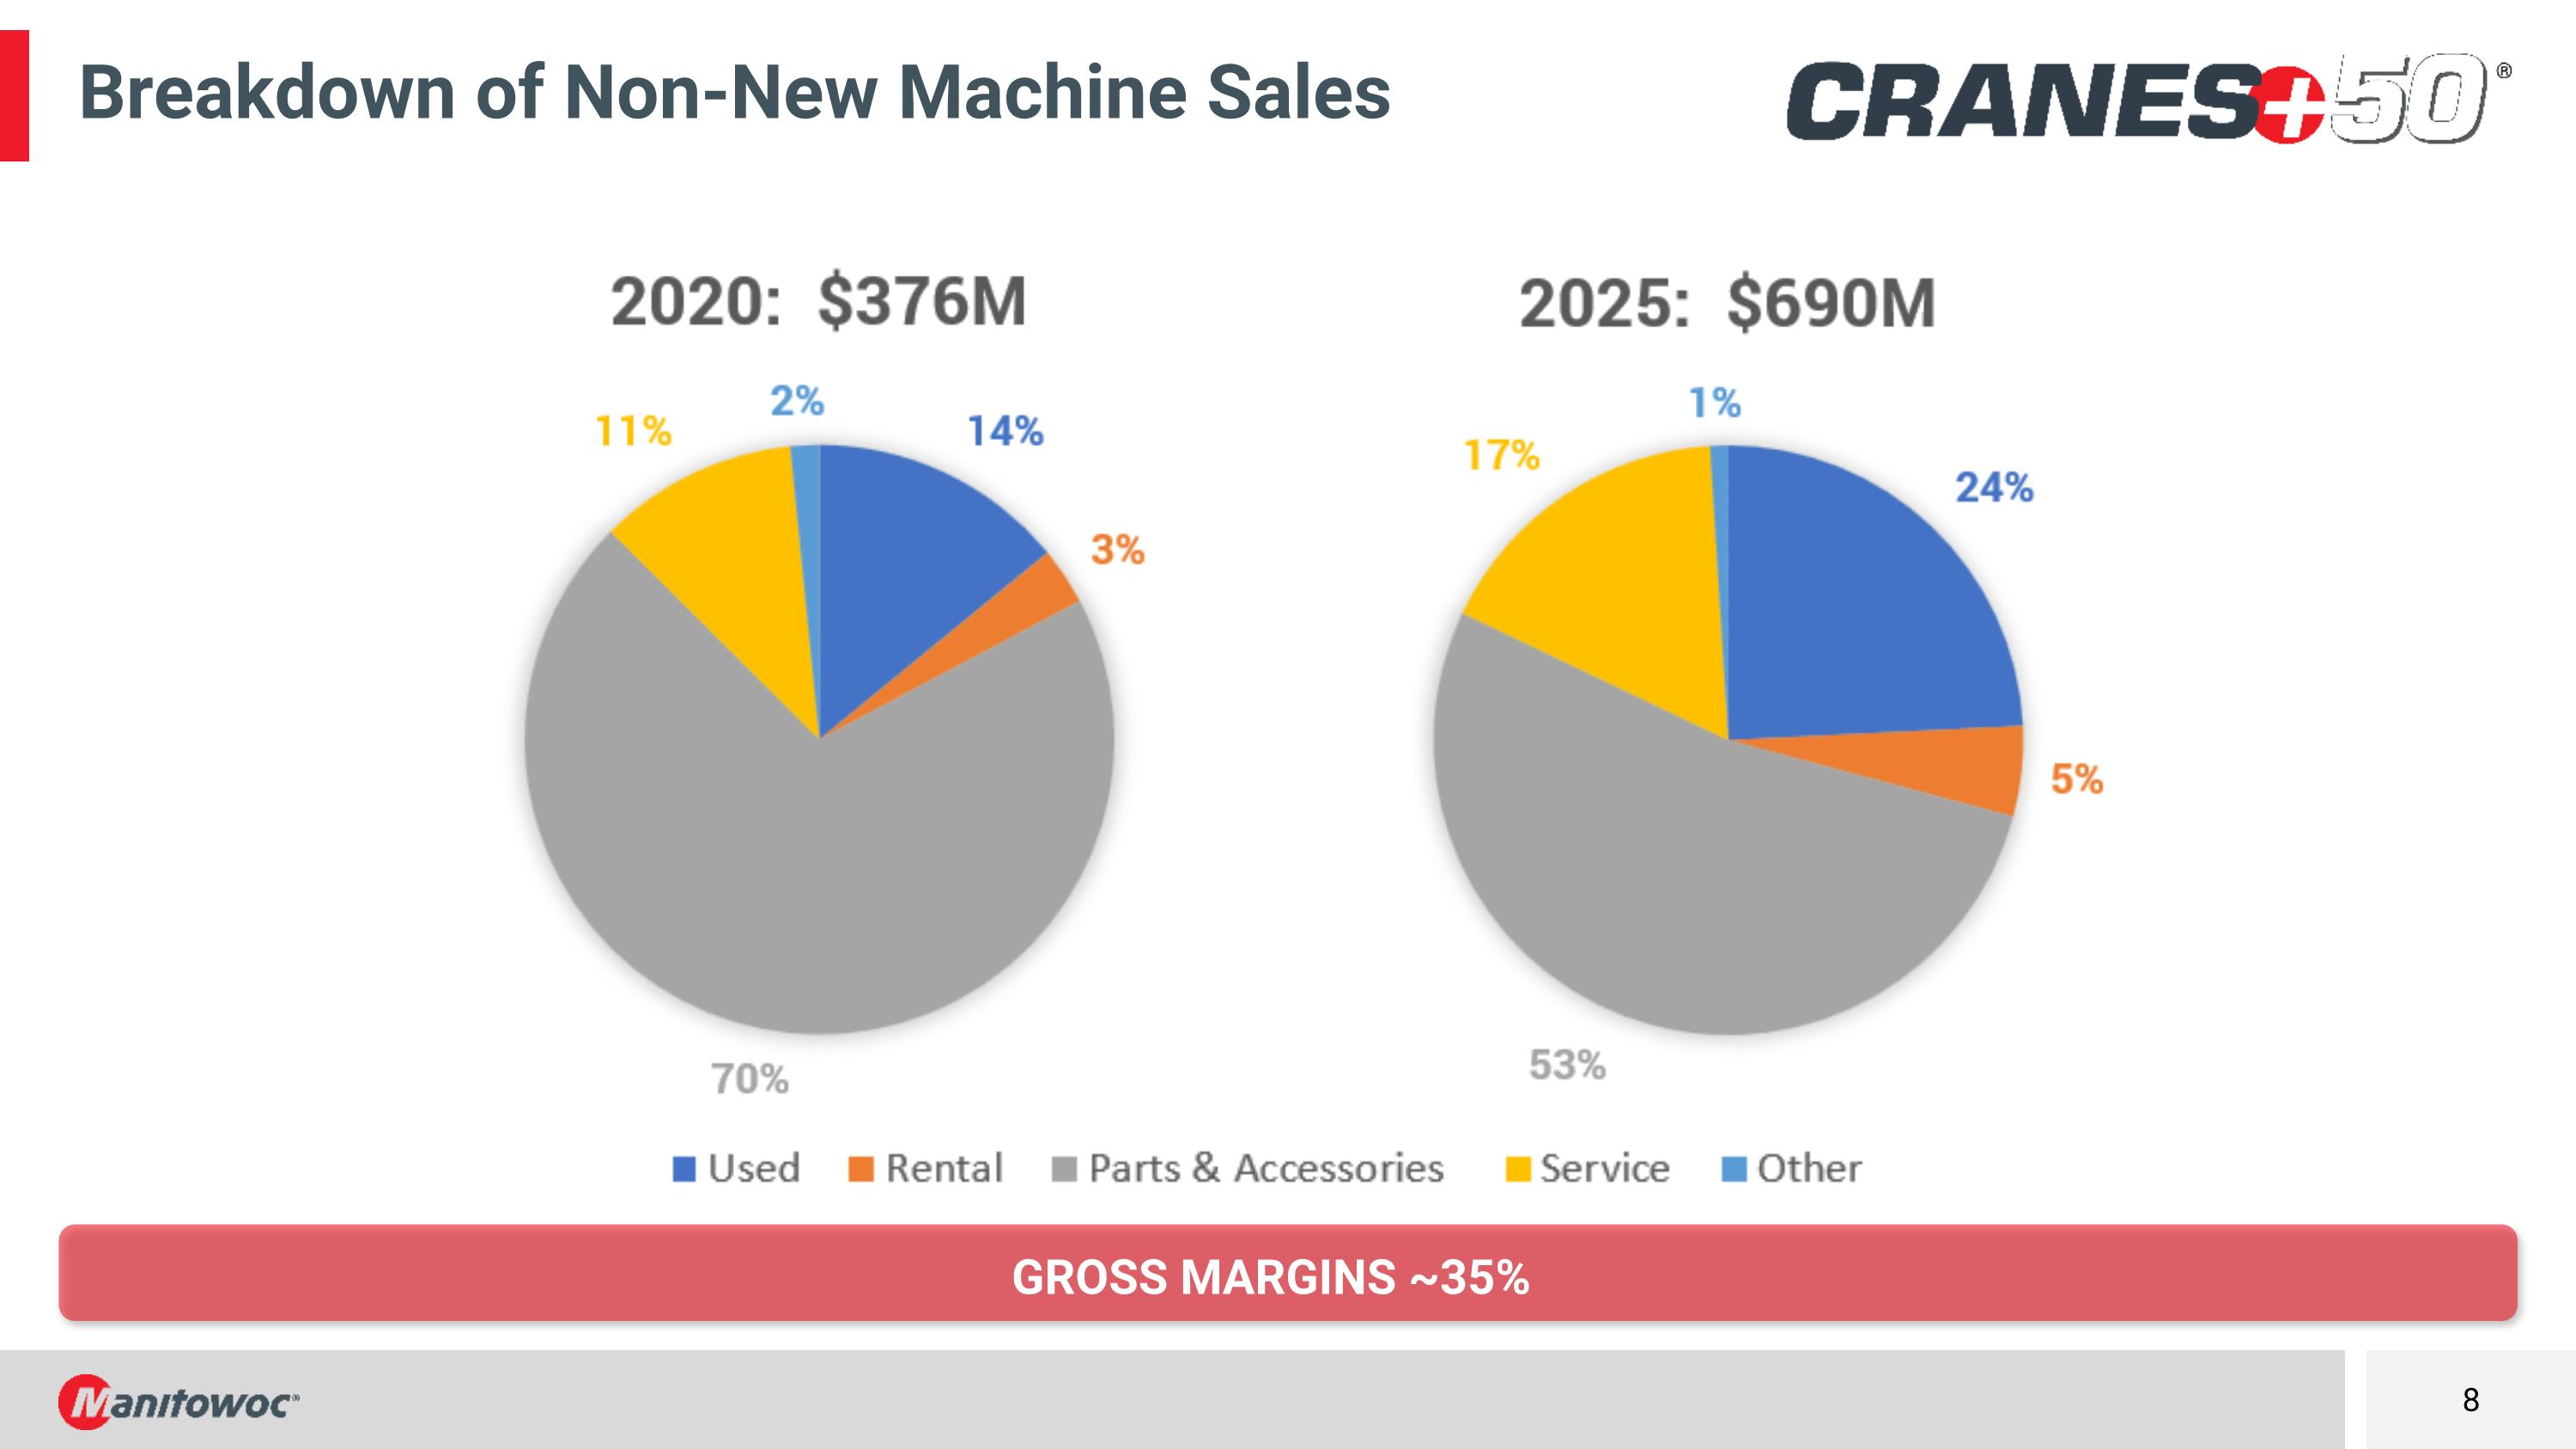
Gross margins ~35% Breakdown of Non-New Machine Sales
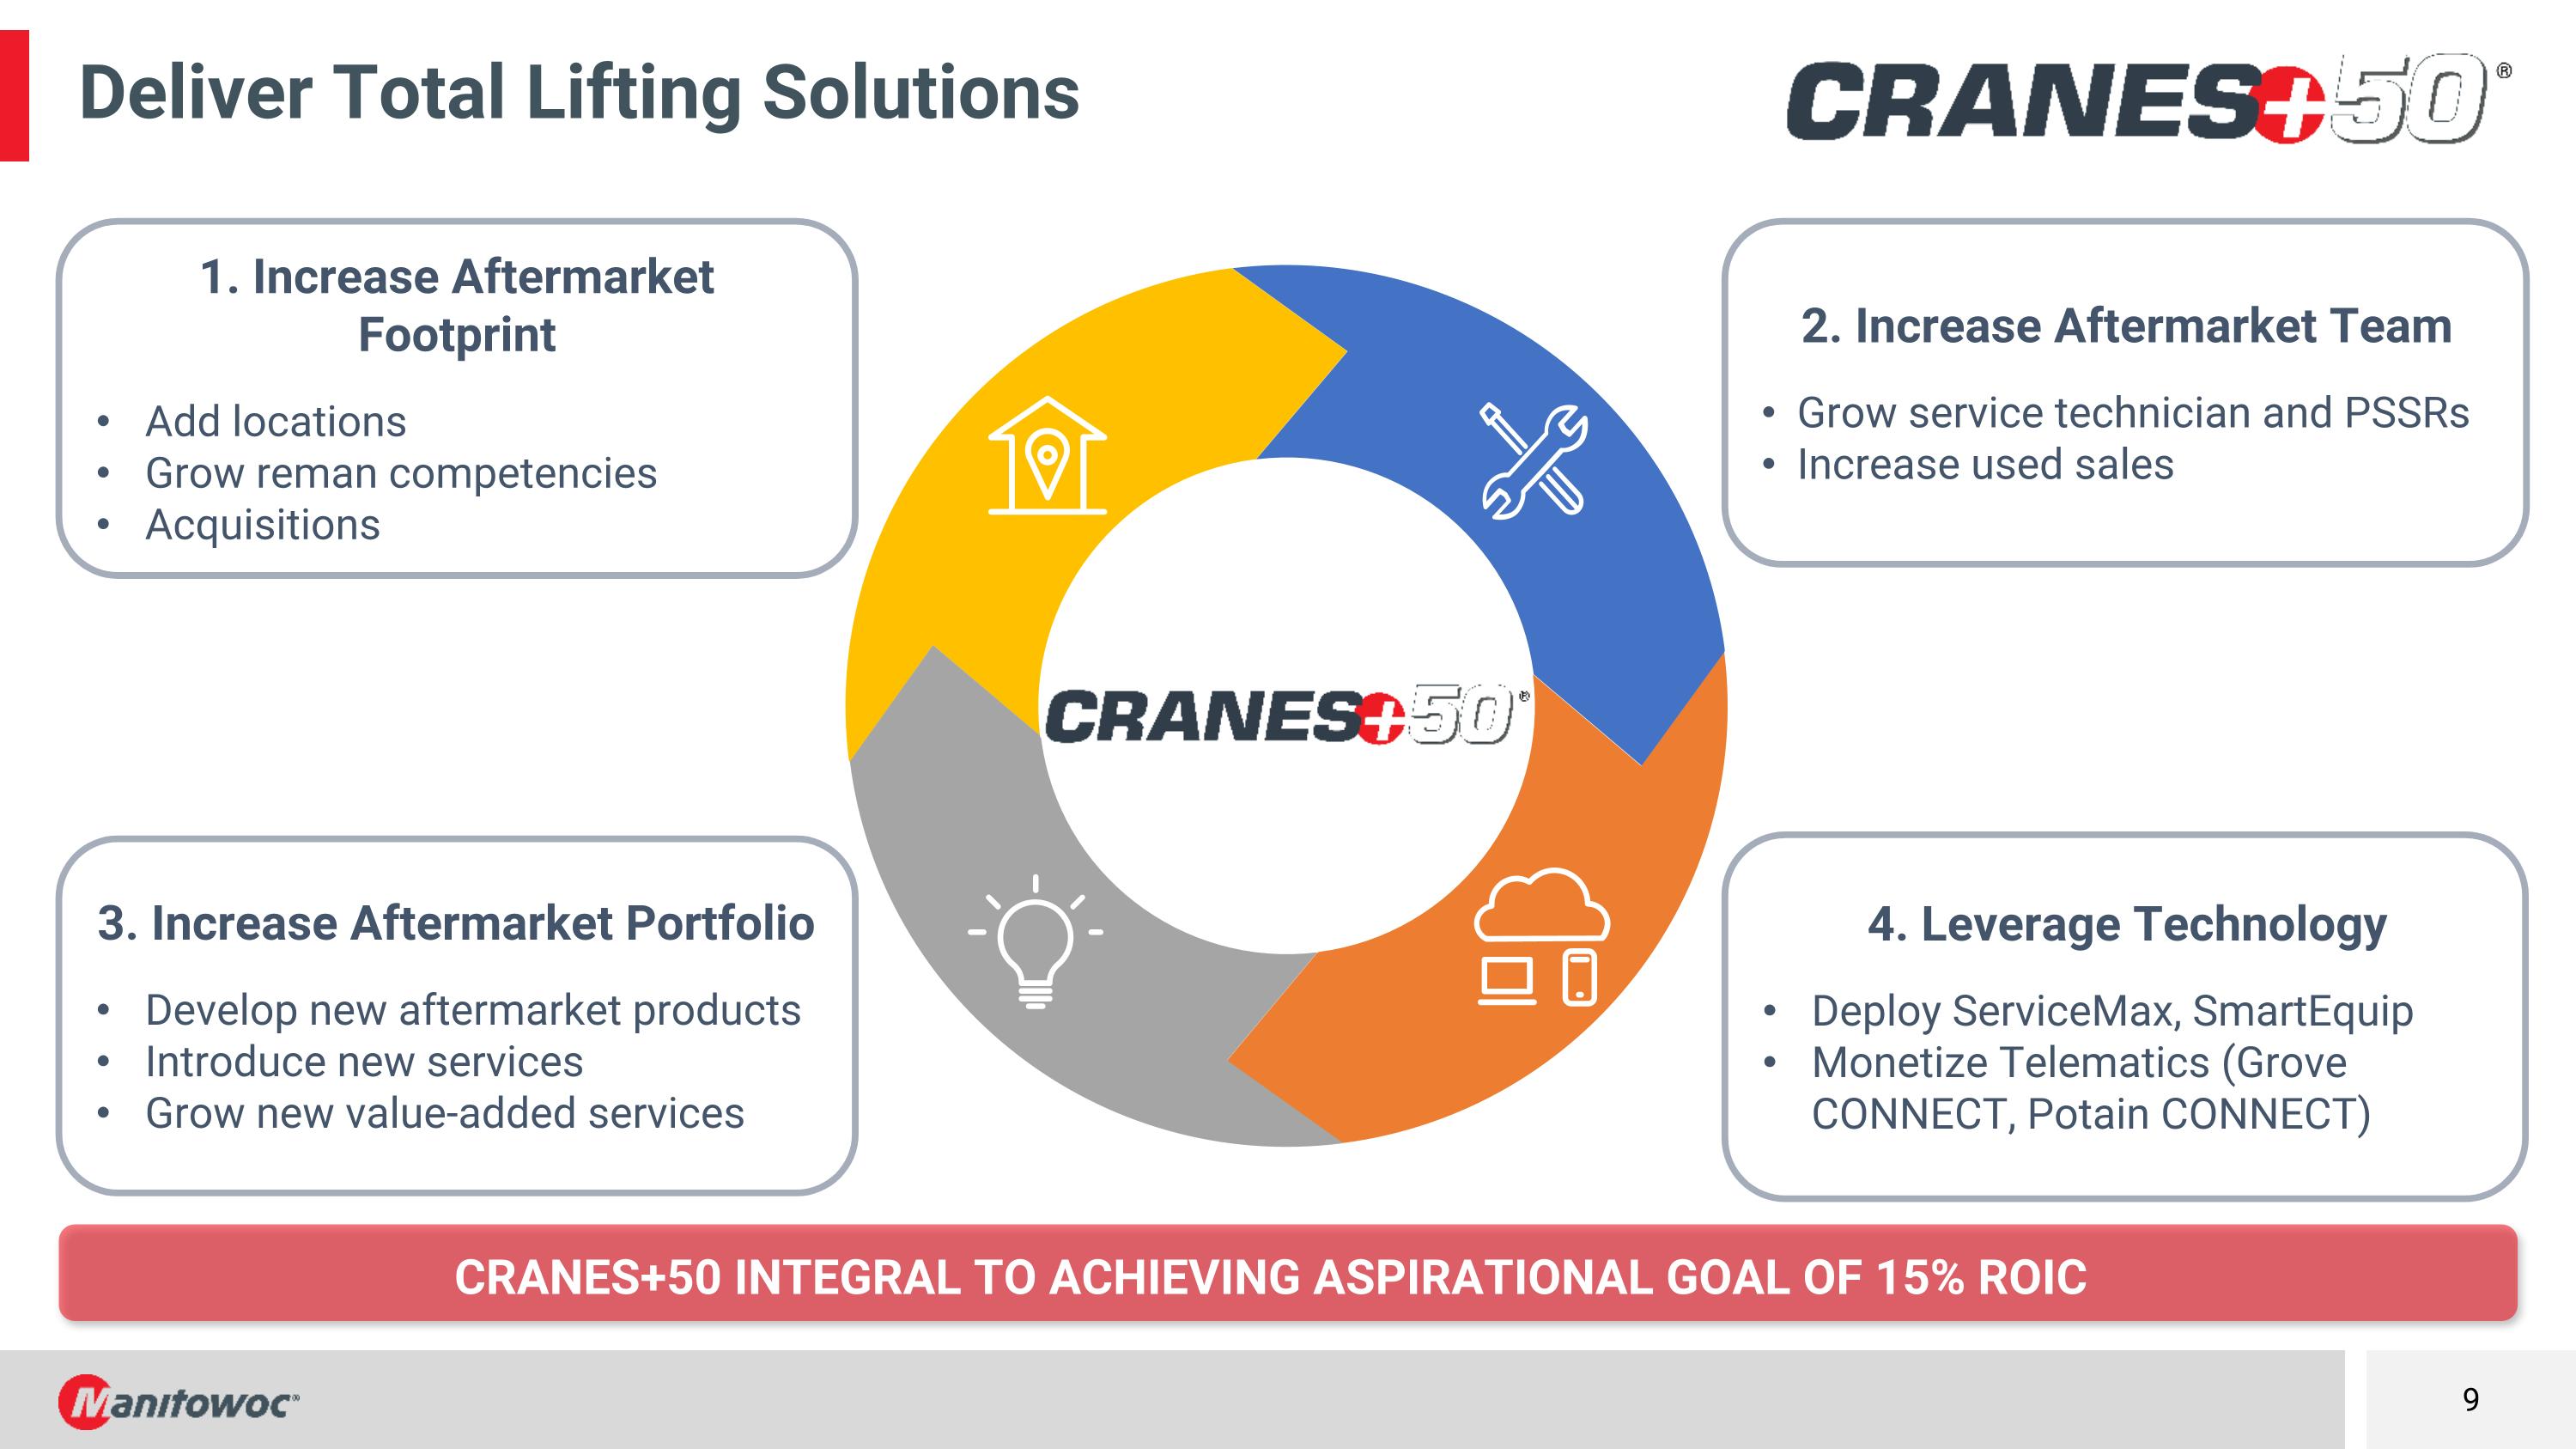
Cranes+50 integral to achieving aspirational goal of 15% roic Deliver Total Lifting Solutions 2. Increase Aftermarket Team Grow service technician and PSSRs Increase used sales 3. Increase Aftermarket Portfolio Develop new aftermarket products Introduce new services Grow new value-added services 4. Leverage Technology Deploy ServiceMax, SmartEquip Monetize Telematics (Grove CONNECT, Potain CONNECT) 1. Increase Aftermarket Footprint Add locations Grow reman competencies Acquisitions
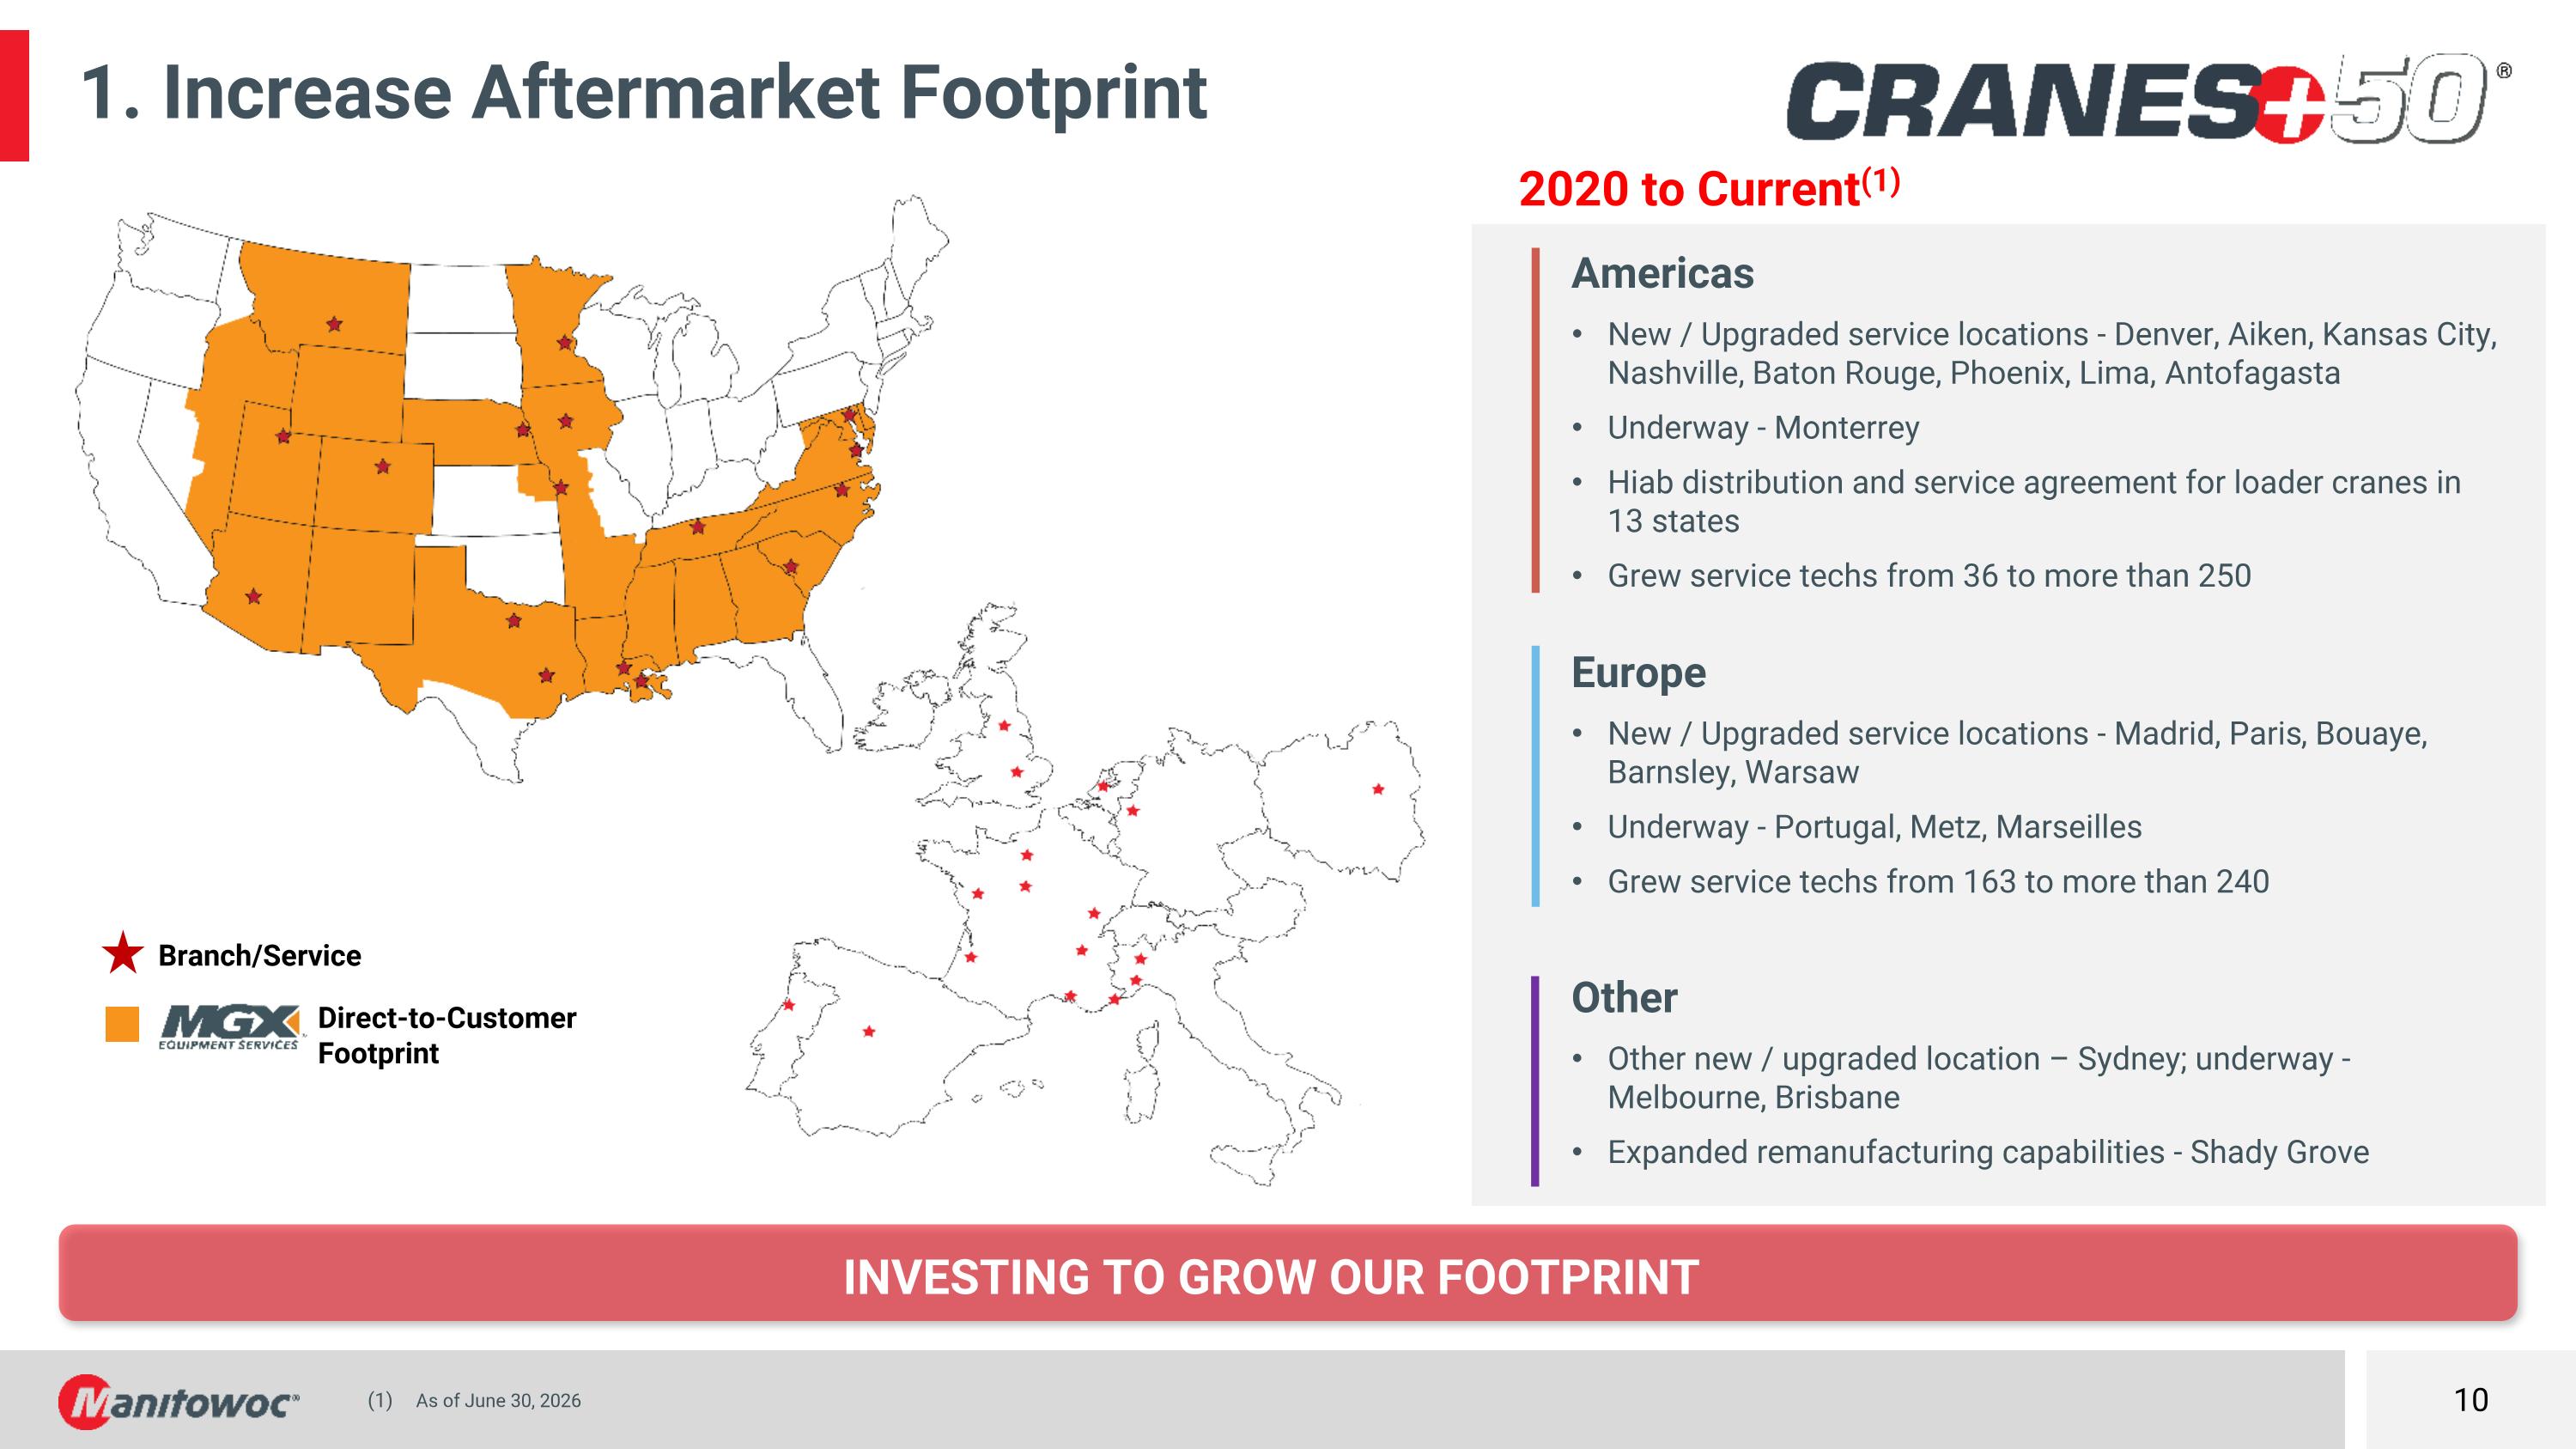
Investing to grow our footprint 1. Increase Aftermarket Footprint Americas New / Upgraded service locations - Denver, Aiken, Kansas City, Nashville, Baton Rouge, Phoenix, Lima, Antofagasta Underway - Monterrey Hiab distribution and service agreement for loader cranes in 13 states Grew service techs from 36 to more than 250 Europe New / Upgraded service locations - Madrid, Paris, Bouaye, Barnsley, Warsaw Underway - Portugal, Metz, Marseilles Grew service techs from 163 to more than 240 Other Other new / upgraded location – Sydney; underway - Melbourne, Brisbane Expanded remanufacturing capabilities - Shady Grove 2020 to Current(1) As of June 30, 2026 Branch/Service Direct-to-Customer Footprint
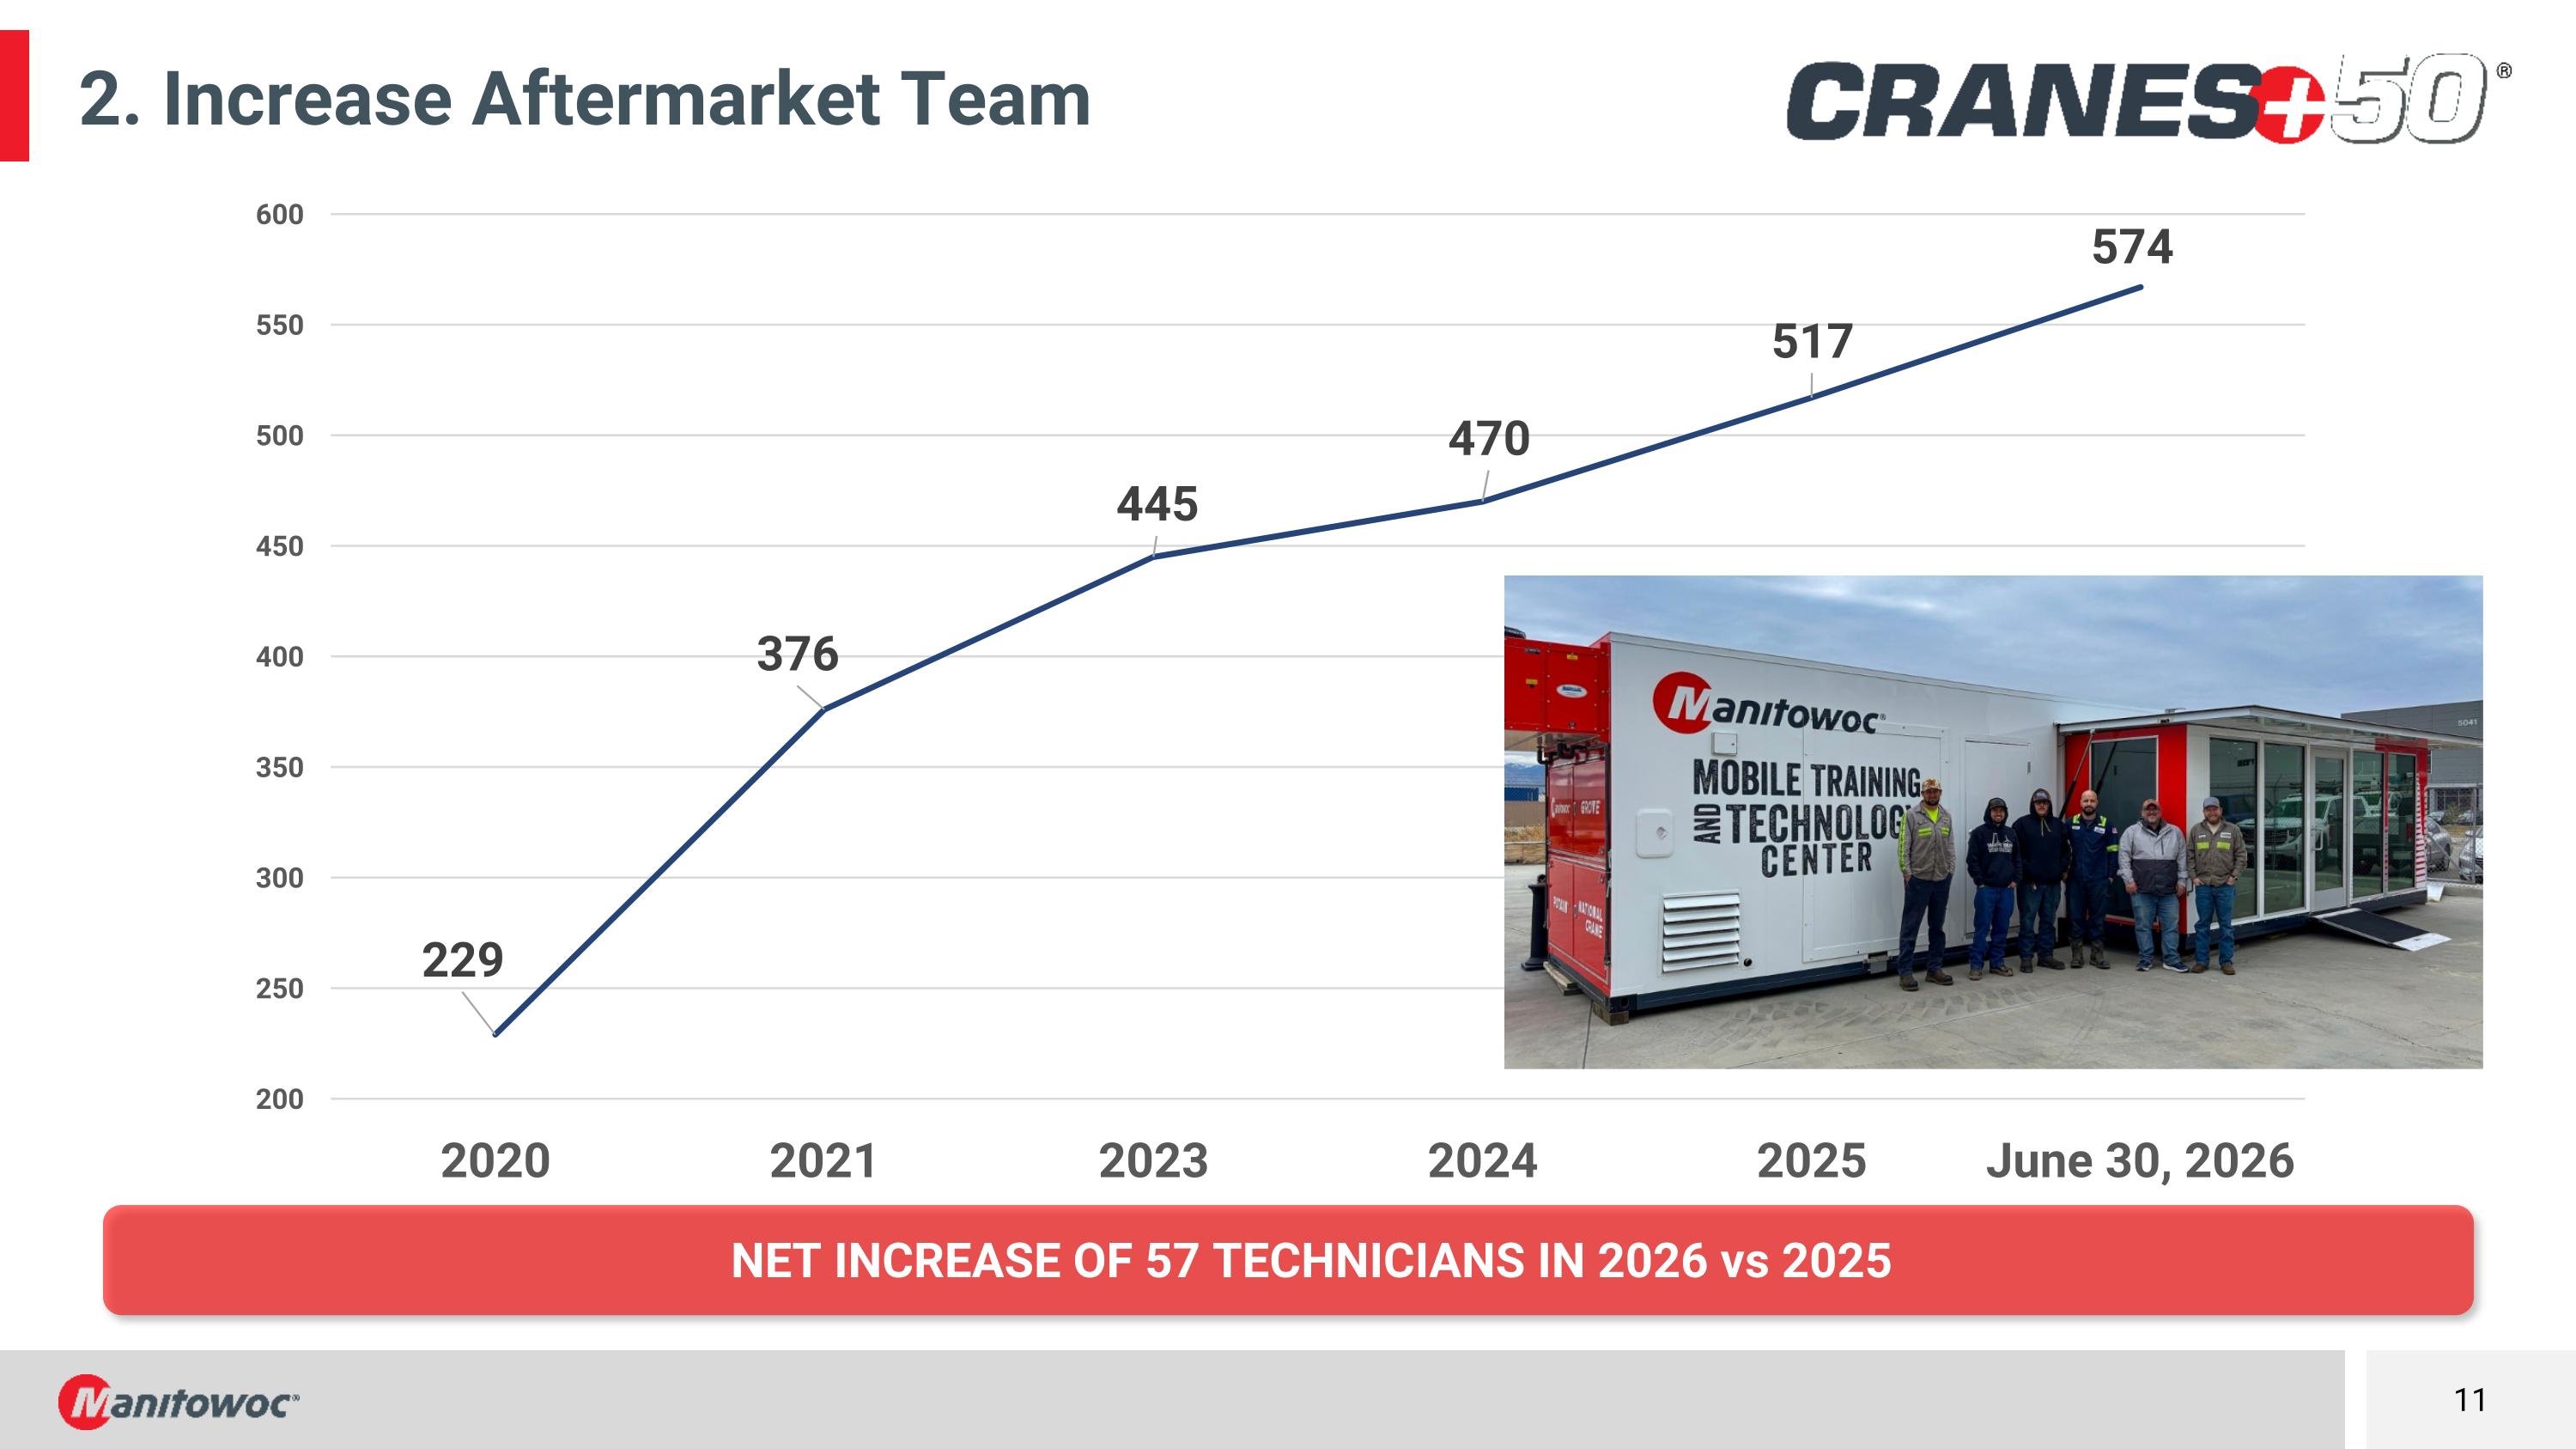
2. Increase Aftermarket Team– Legal NET INCREASE OF 57 TECHNICIANS IN 2026 vs 2025
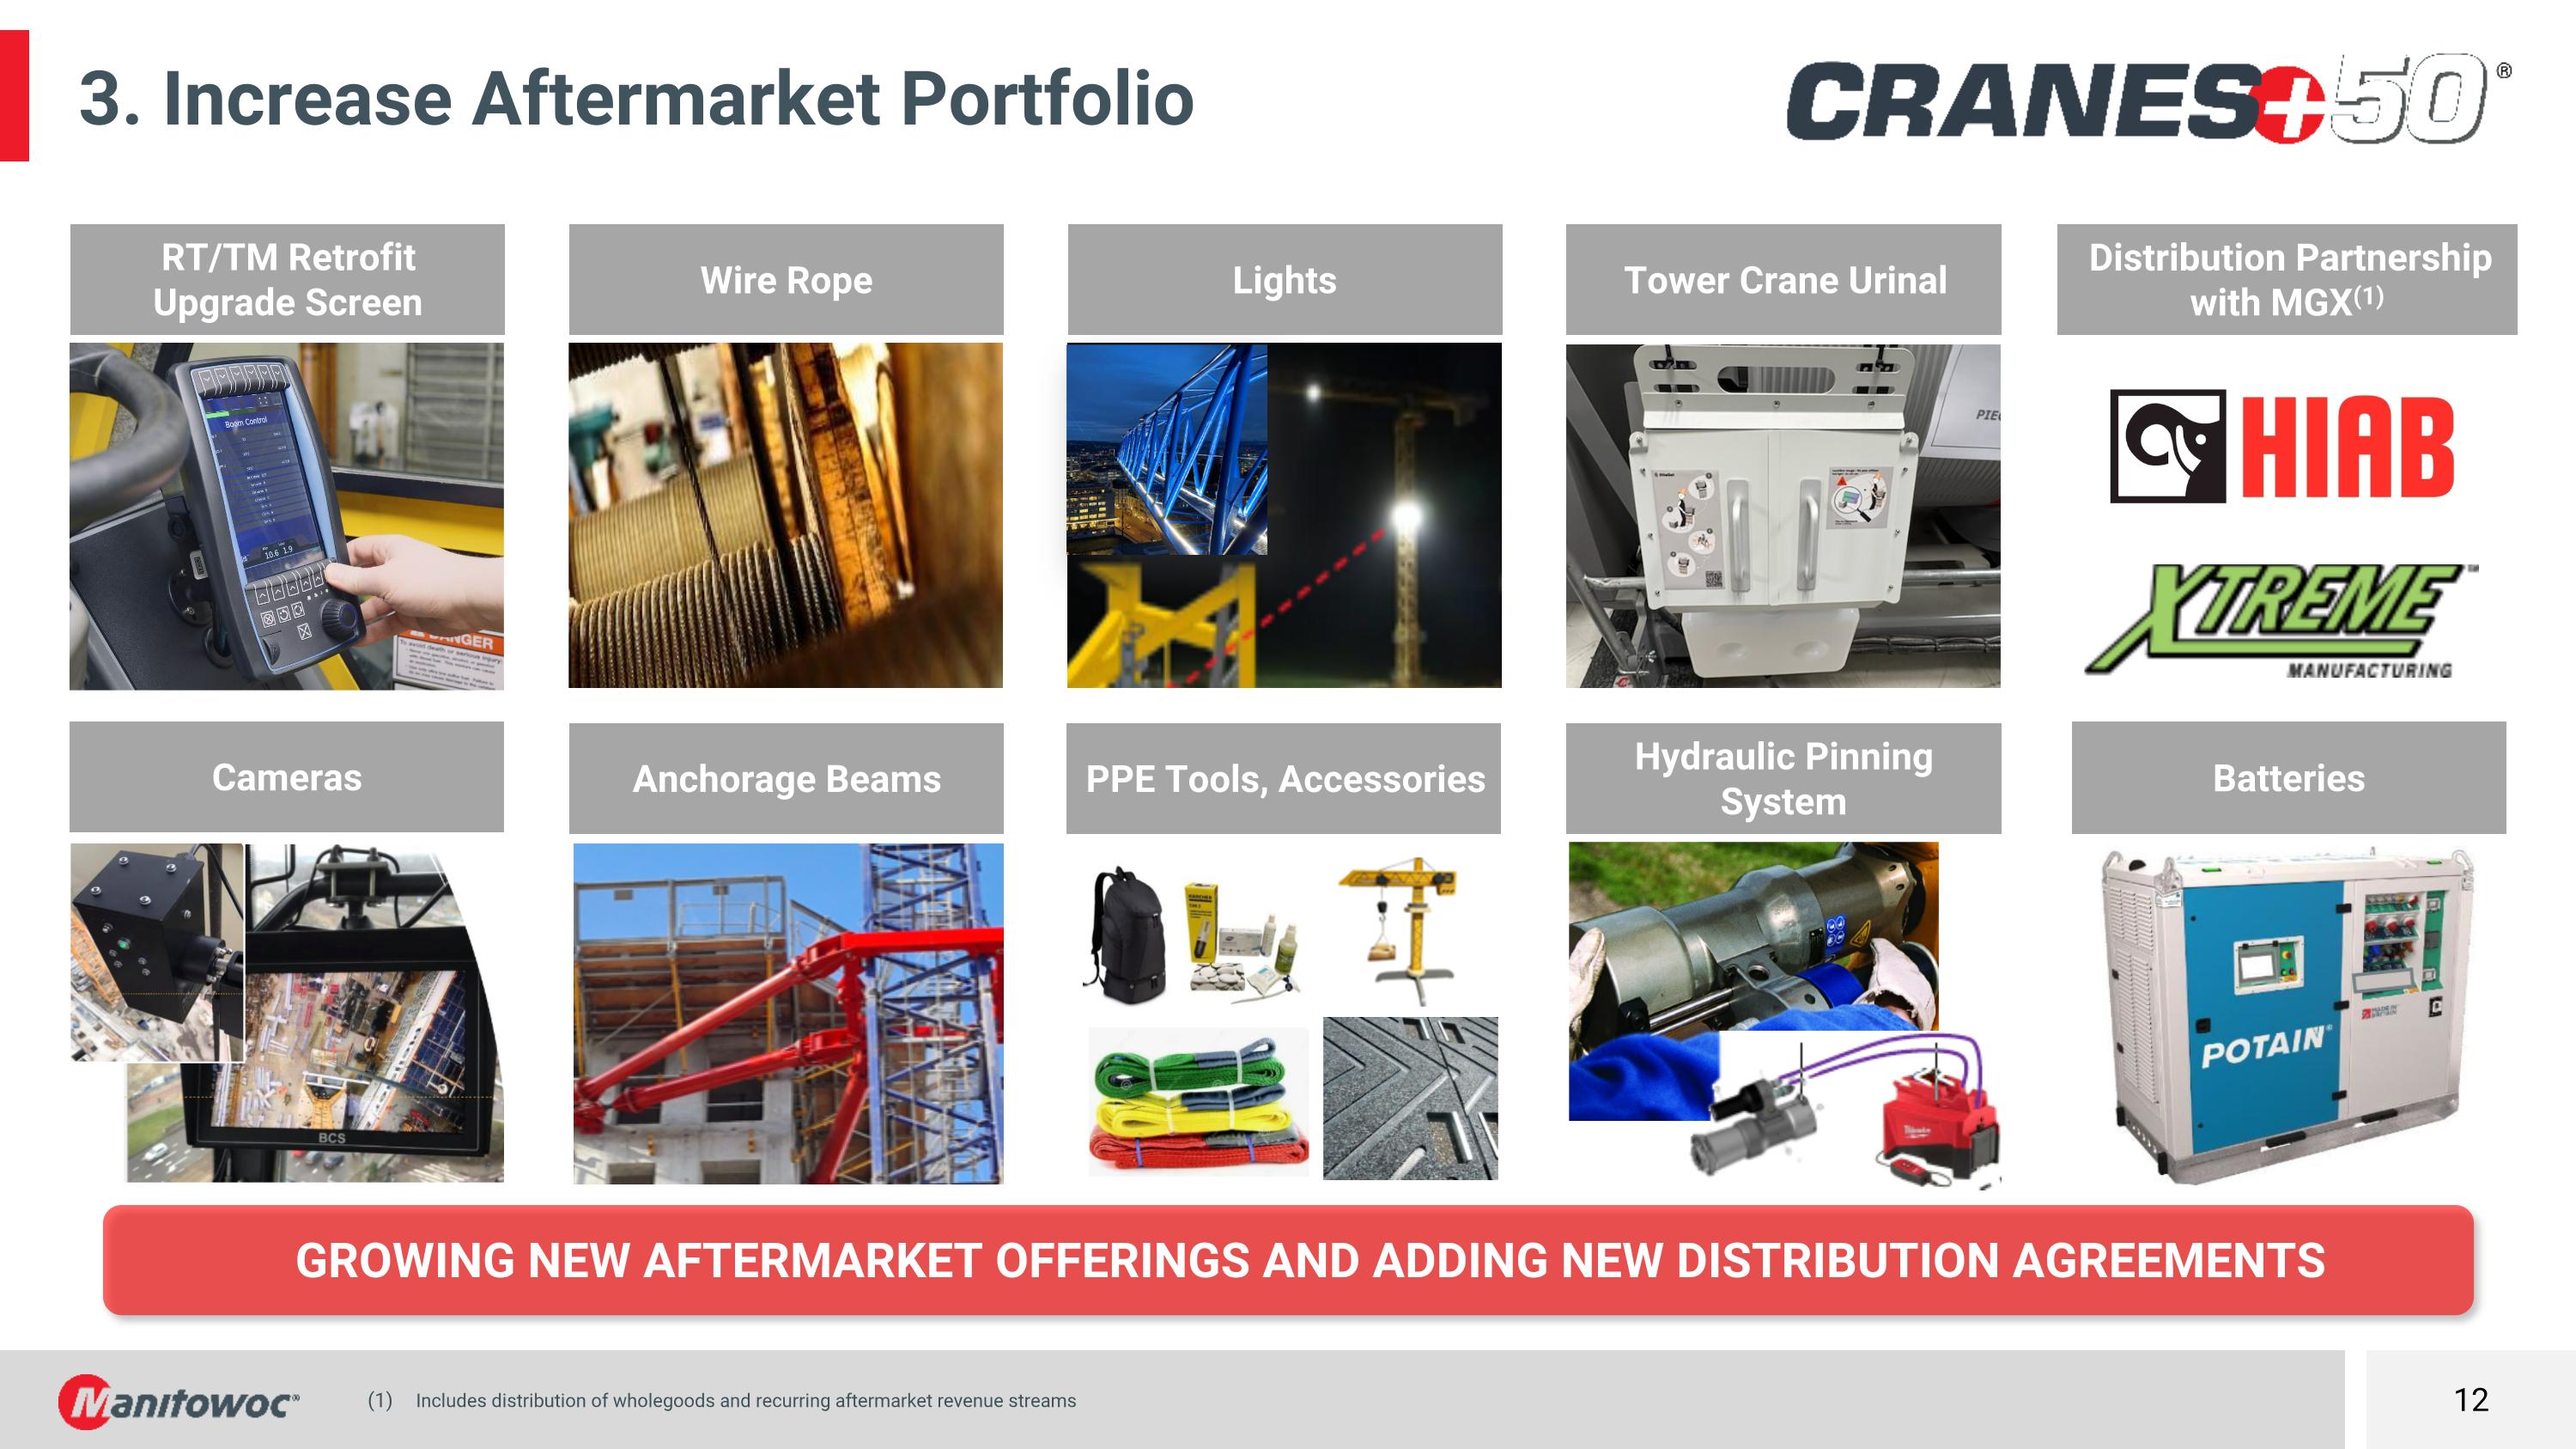
3. Increase Aftermarket PortfolioLegal Growing new aftermarket offerings and adding new distribution agreements RT/TM Retrofit Upgrade Screen Wire Rope Lights Tower Crane Urinal Distribution Partnership with MGX(1) Cameras Anchorage Beams PPE Tools, Accessories Hydraulic Pinning System Includes distribution of wholegoods and recurring aftermarket revenue streams Batteries
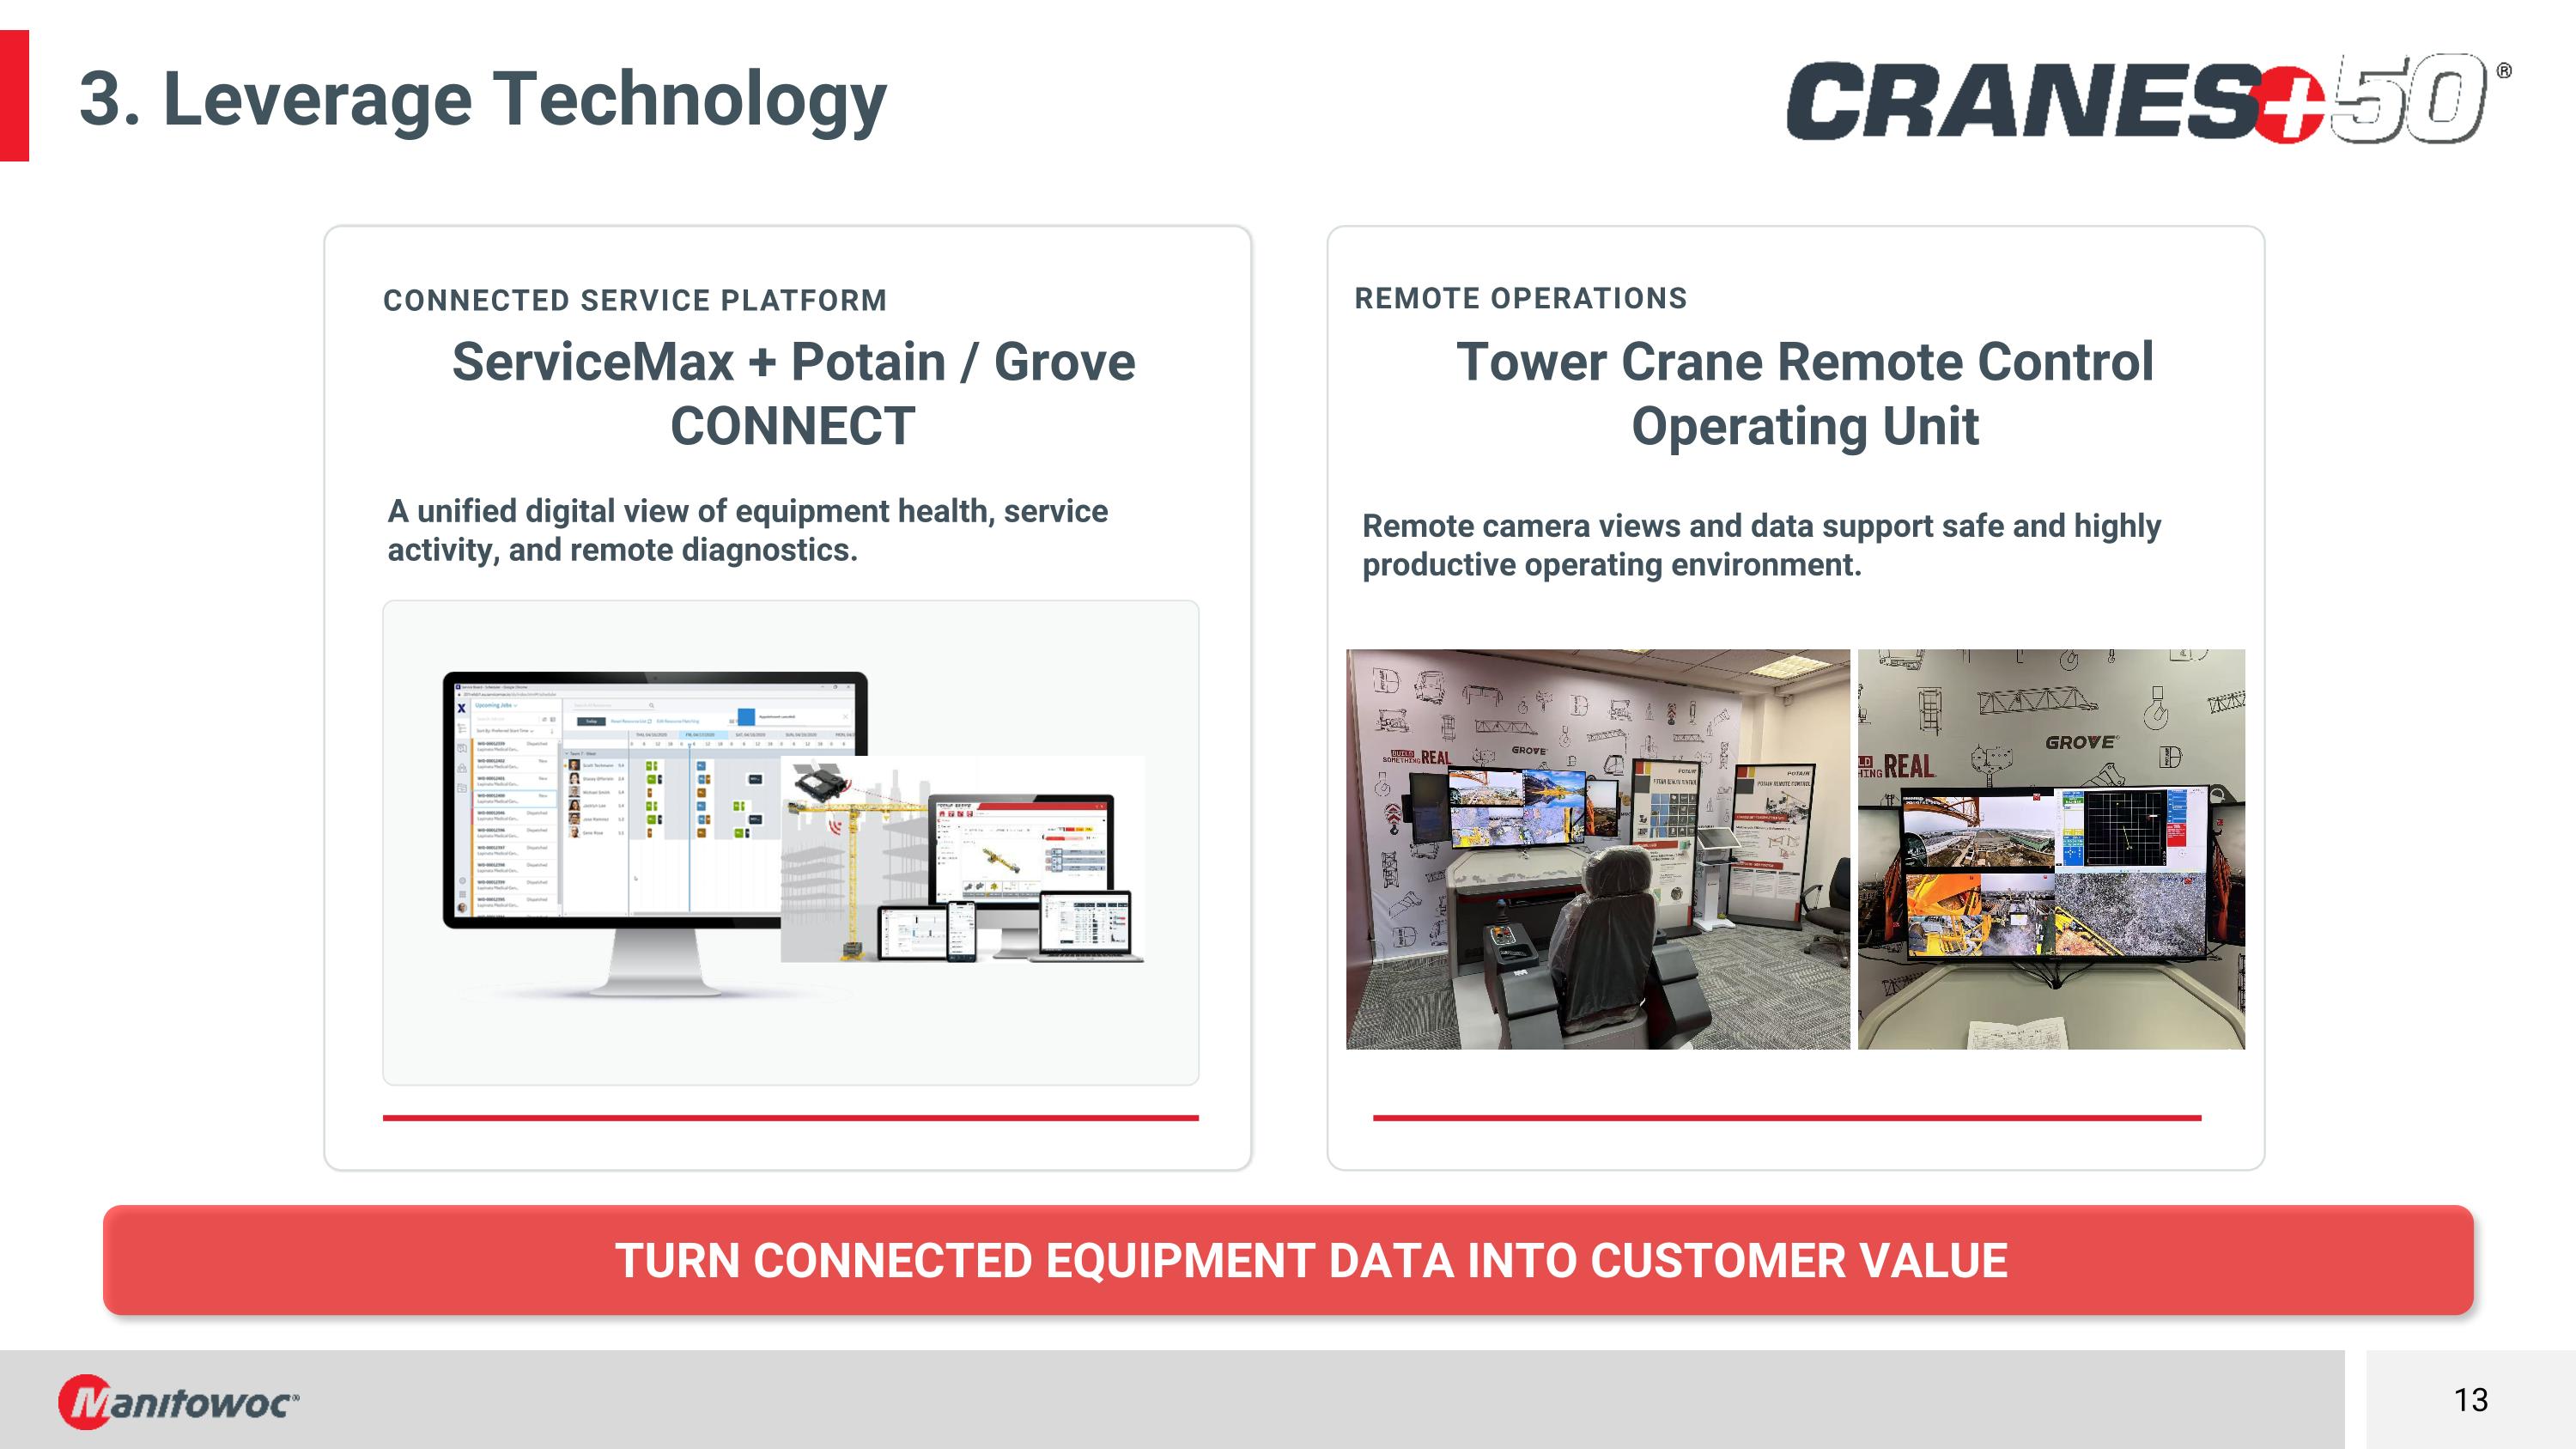
3. Leverage Technology Turn connected equipment data into customer value CONNECTED SERVICE PLATFORM ServiceMax + Potain / Grove CONNECT A unified digital view of equipment health, service activity, and remote diagnostics. REMOTE OPERATIONS Tower Crane Remote Control Operating Unit Remote camera views and data support safe and highly productive operating environment.
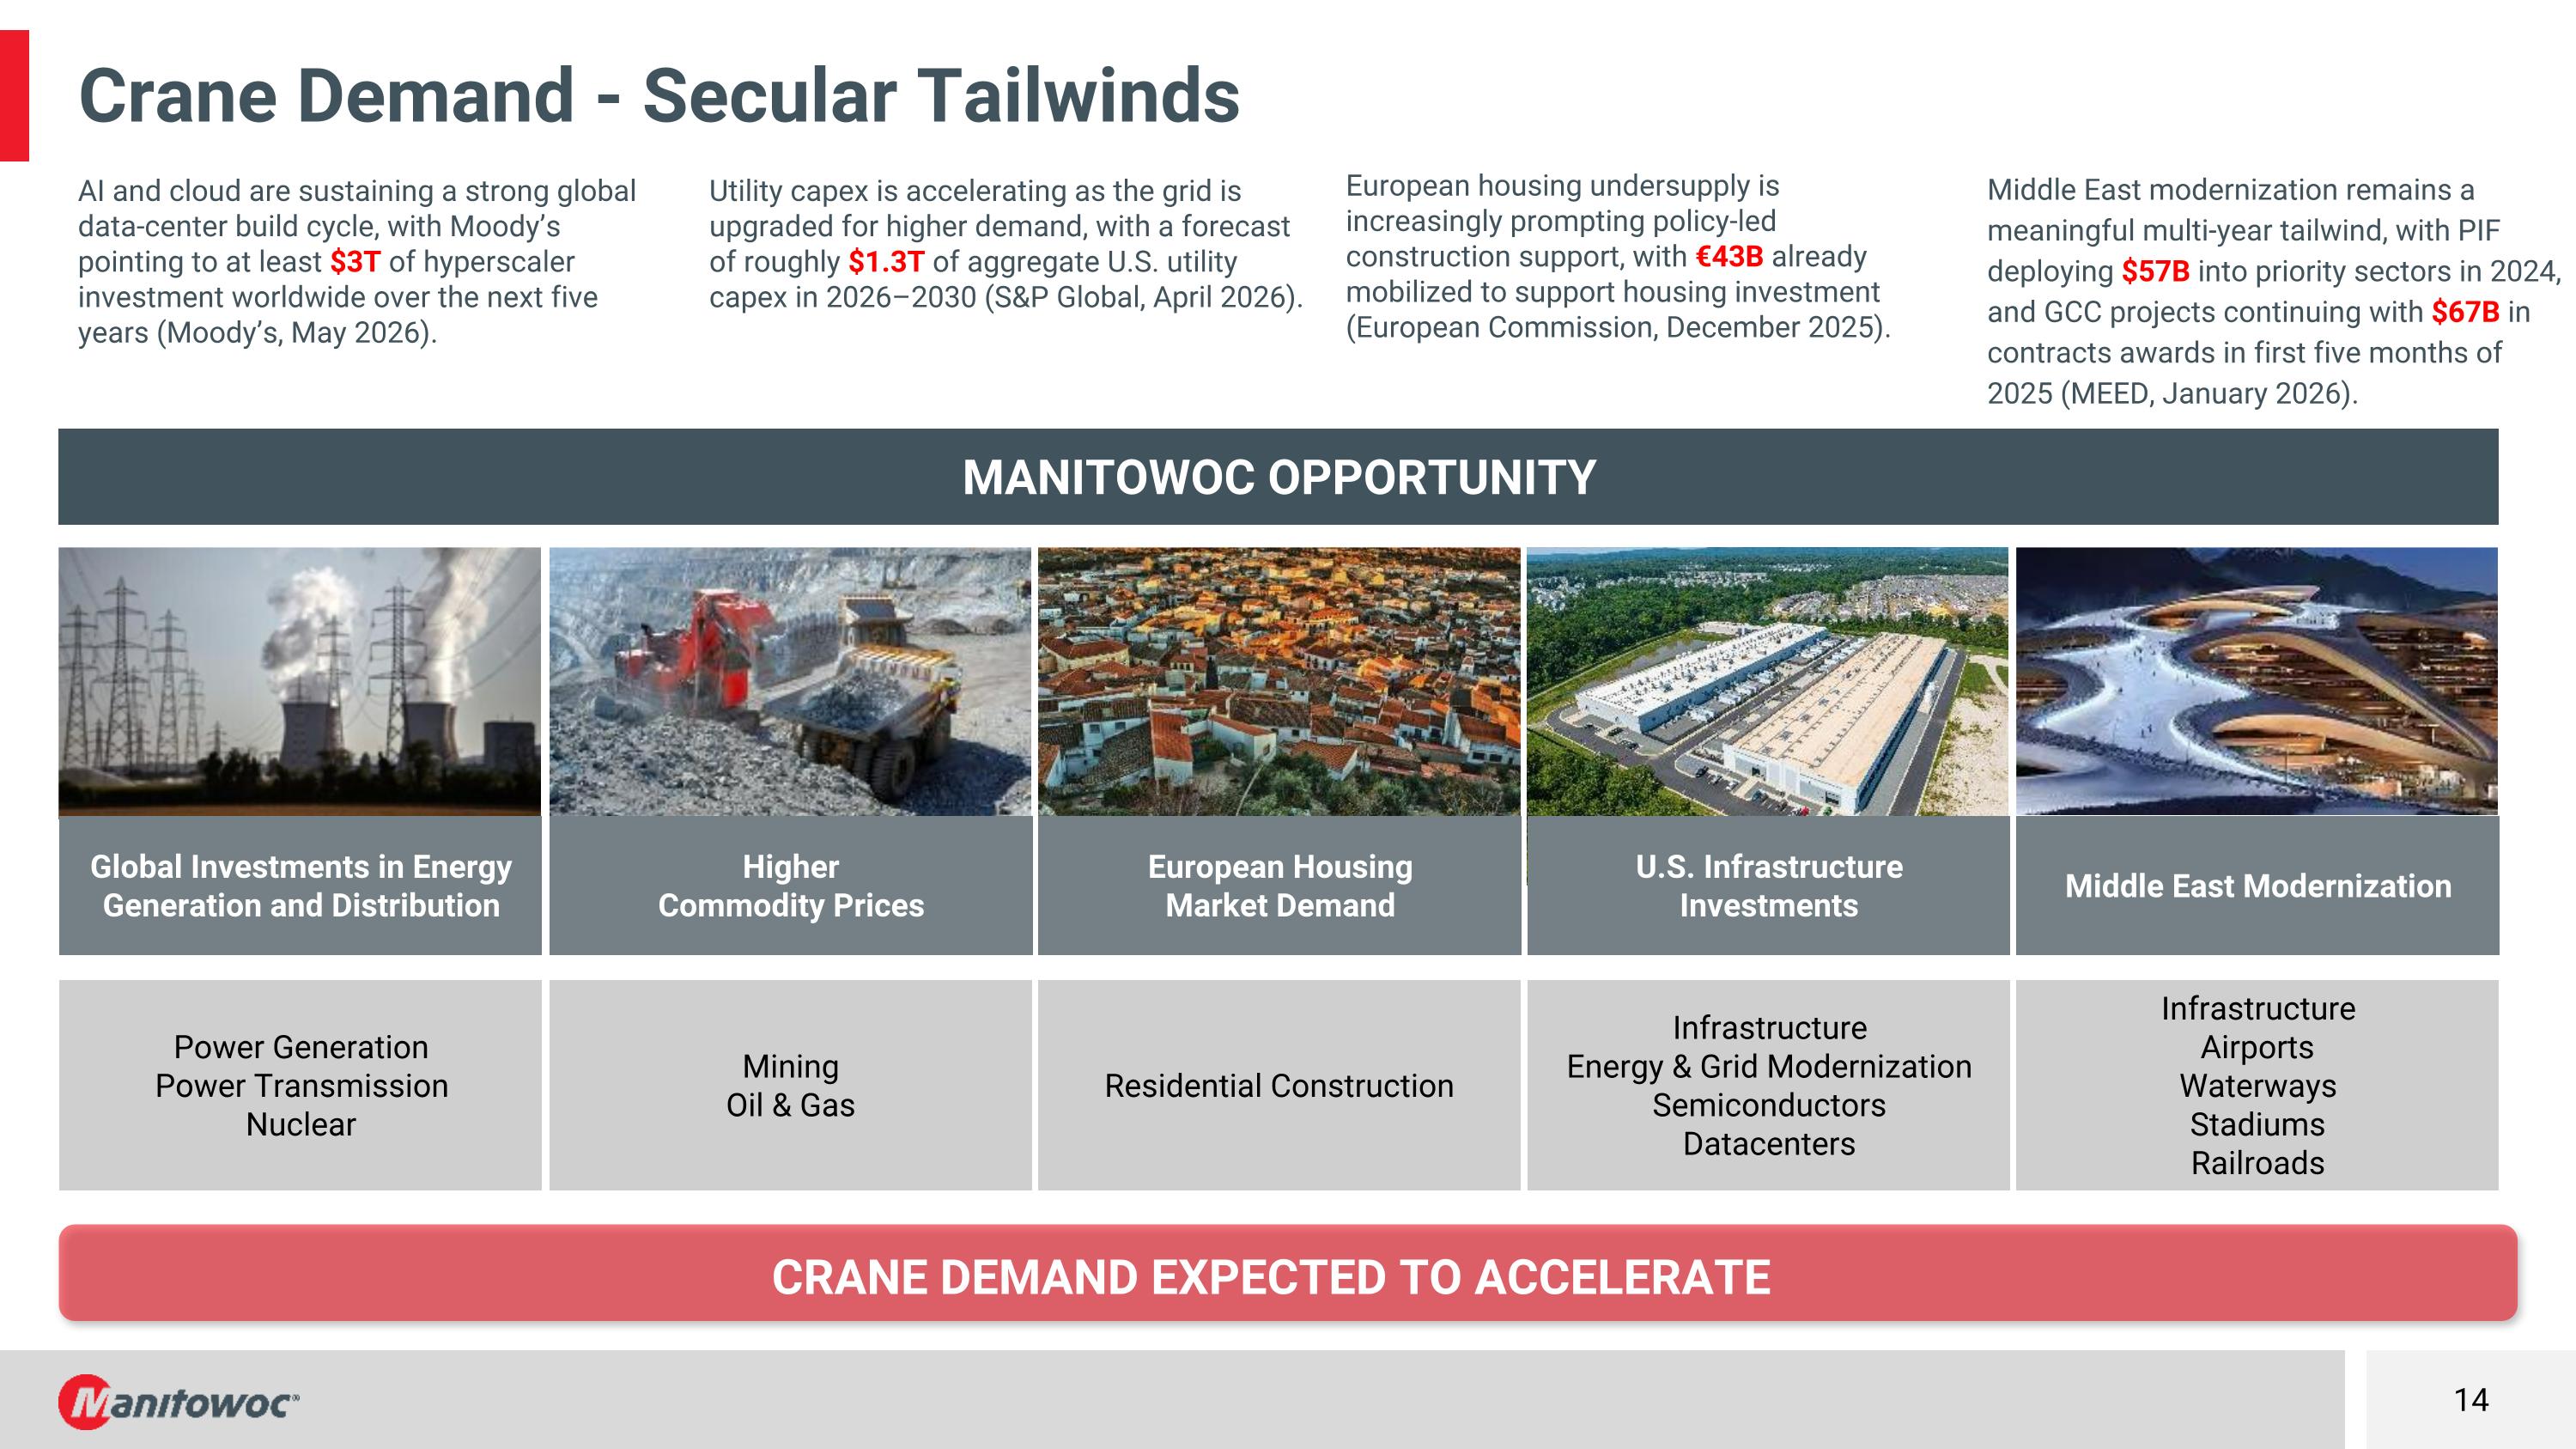
Crane demand expected to accelerate Crane Demand - Secular Tailwinds MANITOWOC OPPORTUNITY Power Generation Power Transmission Nuclear Residential Construction Mining Oil & Gas Infrastructure Energy & Grid Modernization Semiconductors Datacenters AI and cloud are sustaining a strong global data-center build cycle, with Moody’s pointing to at least $3T of hyperscaler investment worldwide over the next five years (Moody’s, May 2026). European housing undersupply is increasingly prompting policy-led construction support, with €43B already mobilized to support housing investment (European Commission, December 2025). Higher Commodity Prices Middle East Modernization Global Investments in Energy Generation and Distribution U.S. Infrastructure Investments European Housing Market Demand Middle East modernization remains a meaningful multi-year tailwind, with PIF deploying $57B into priority sectors in 2024, and GCC projects continuing with $67B in contracts awards in first five months of 2025 (MEED, January 2026). Infrastructure Airports Waterways Stadiums Railroads Utility capex is accelerating as the grid is upgraded for higher demand, with a forecast of roughly $1.3T of aggregate U.S. utility capex in 2026–2030 (S&P Global, April 2026).
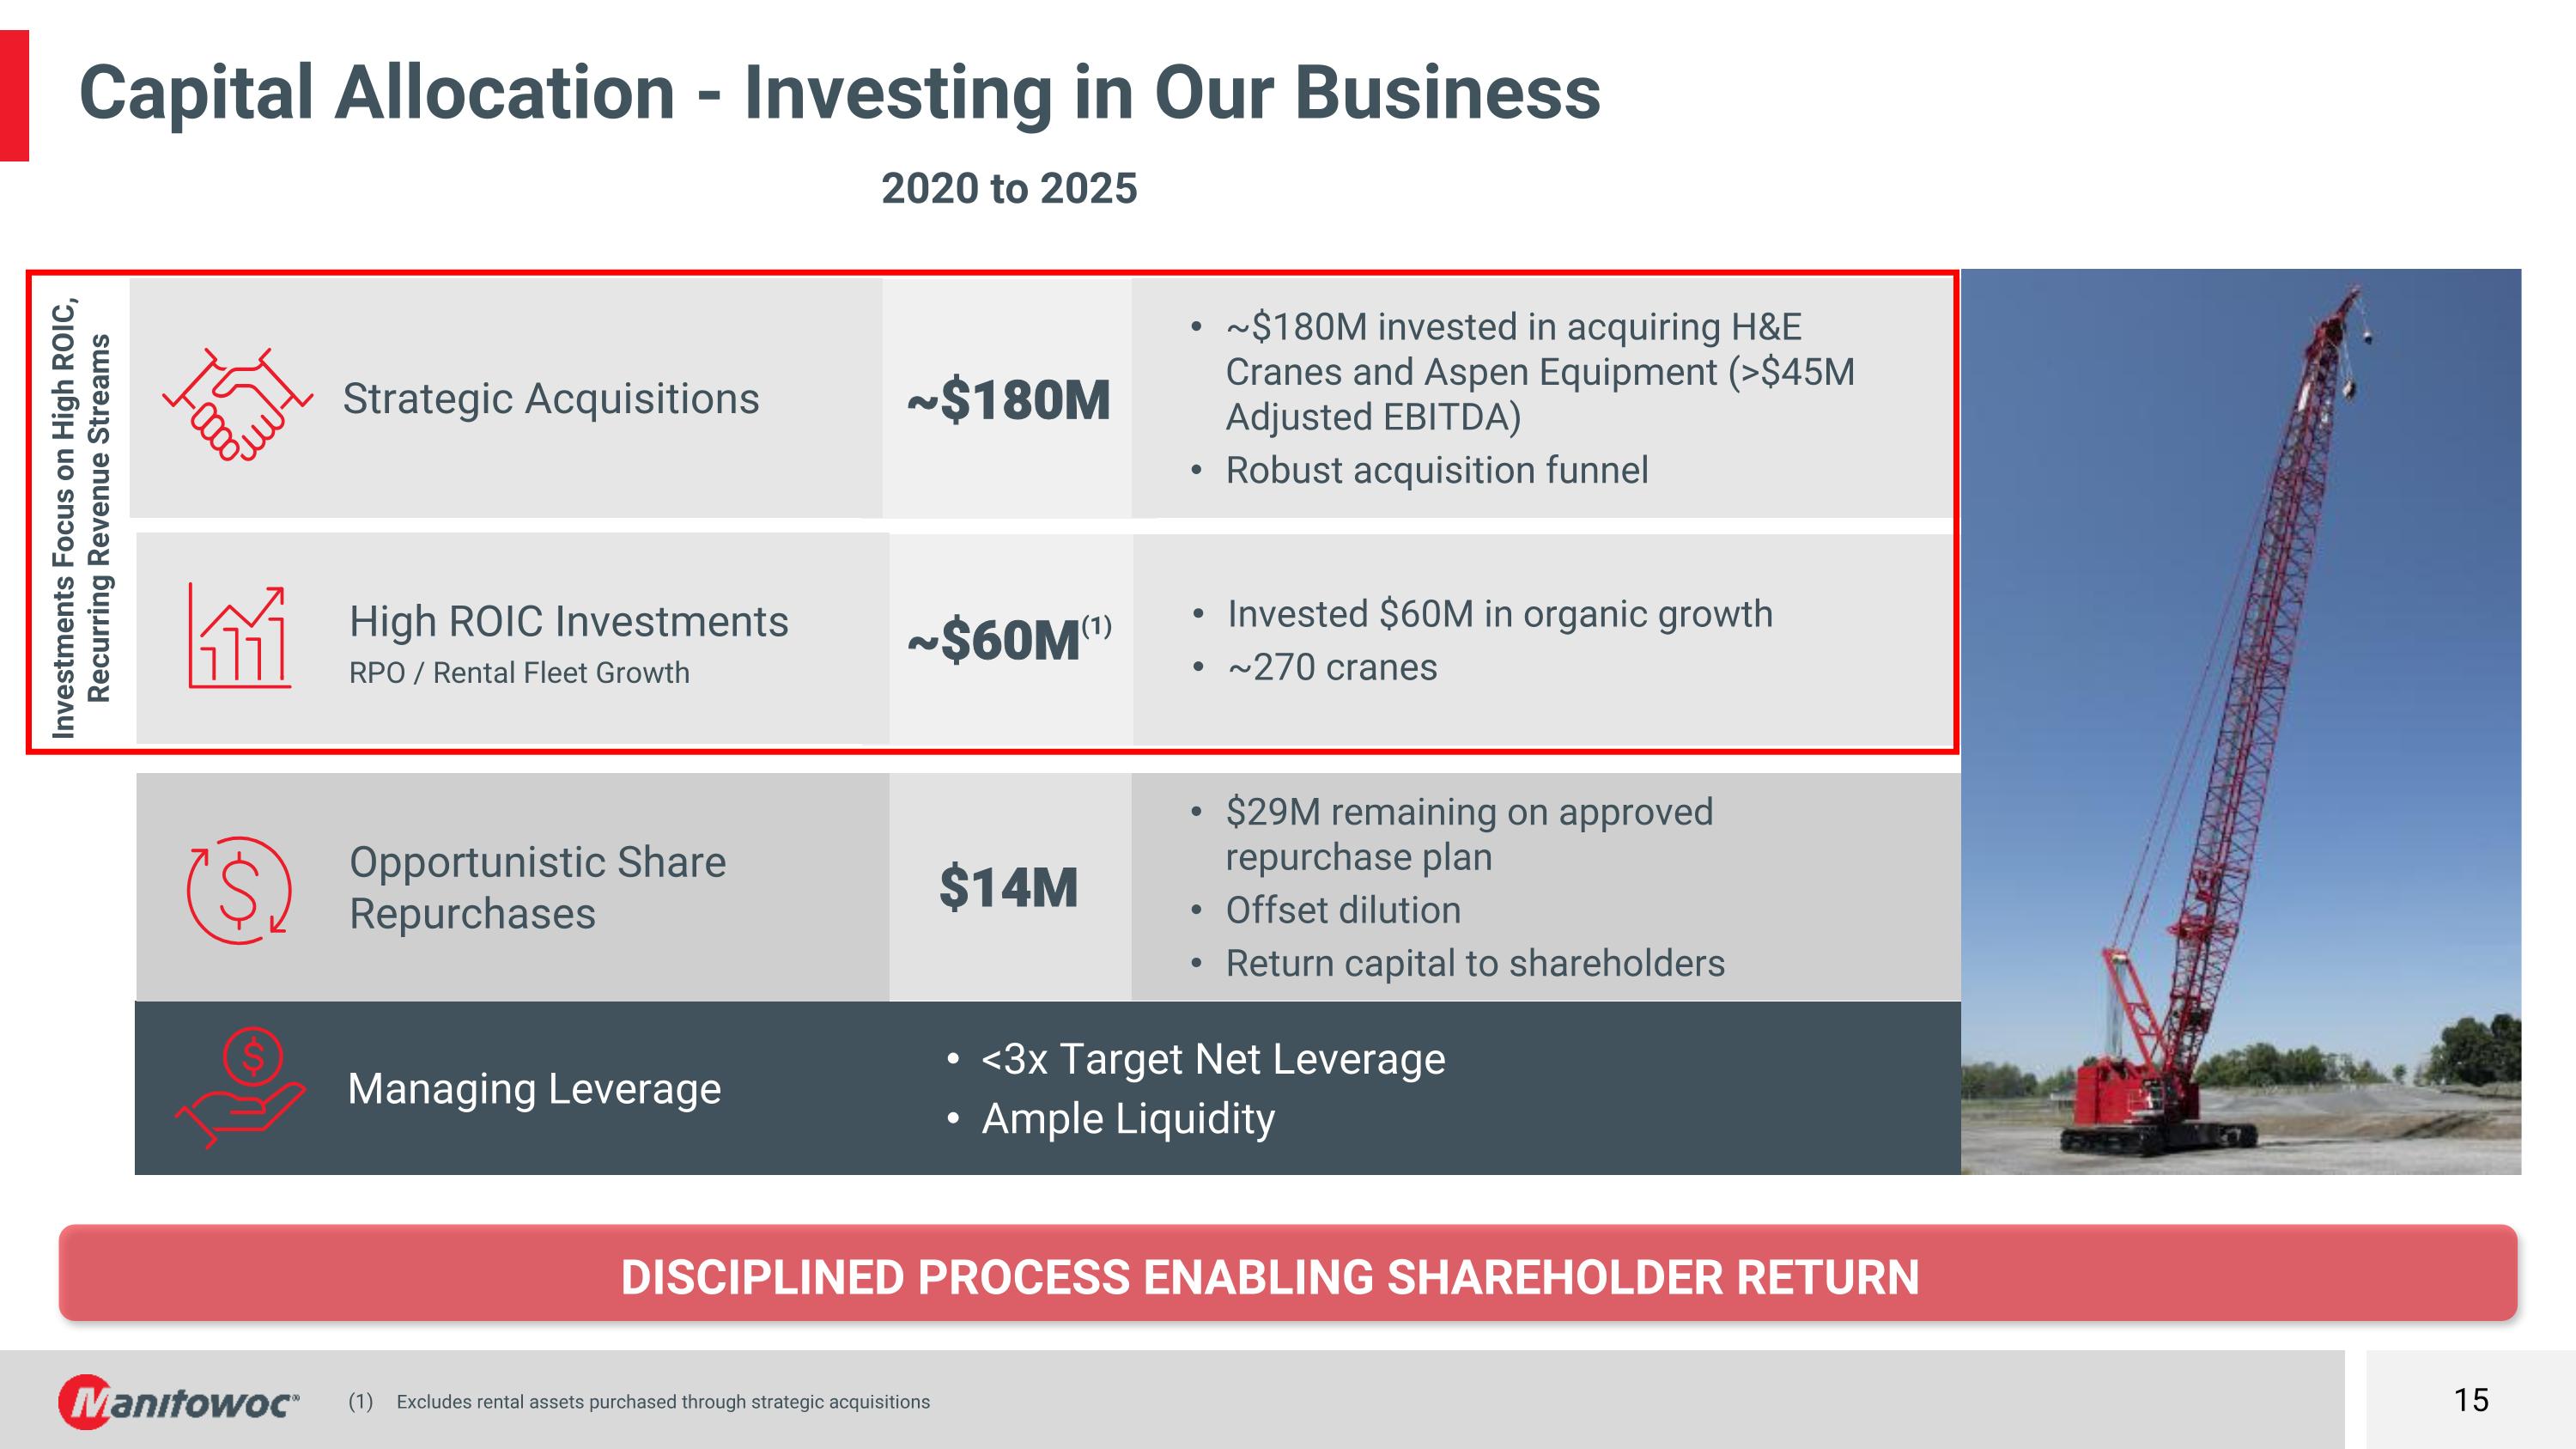
Disciplined process enabling shareholder return Capital Allocation - Investing in Our Business Excludes rental assets purchased through strategic acquisitions Investments Focus on High ROIC, Recurring Revenue Streams <3x Target Net Leverage Ample Liquidity $29M remaining on approved repurchase plan Offset dilution Return capital to shareholders Invested $60M in organic growth ~270 cranes $14M Managing Leverage Opportunistic Share Repurchases High ROIC Investments RPO / Rental Fleet Growth Strategic Acquisitions ~$180M 2020 to 2025 ~$60M(1) ~$180M invested in acquiring H&E Cranes and Aspen Equipment (>$45M Adjusted EBITDA) Robust acquisition funnel
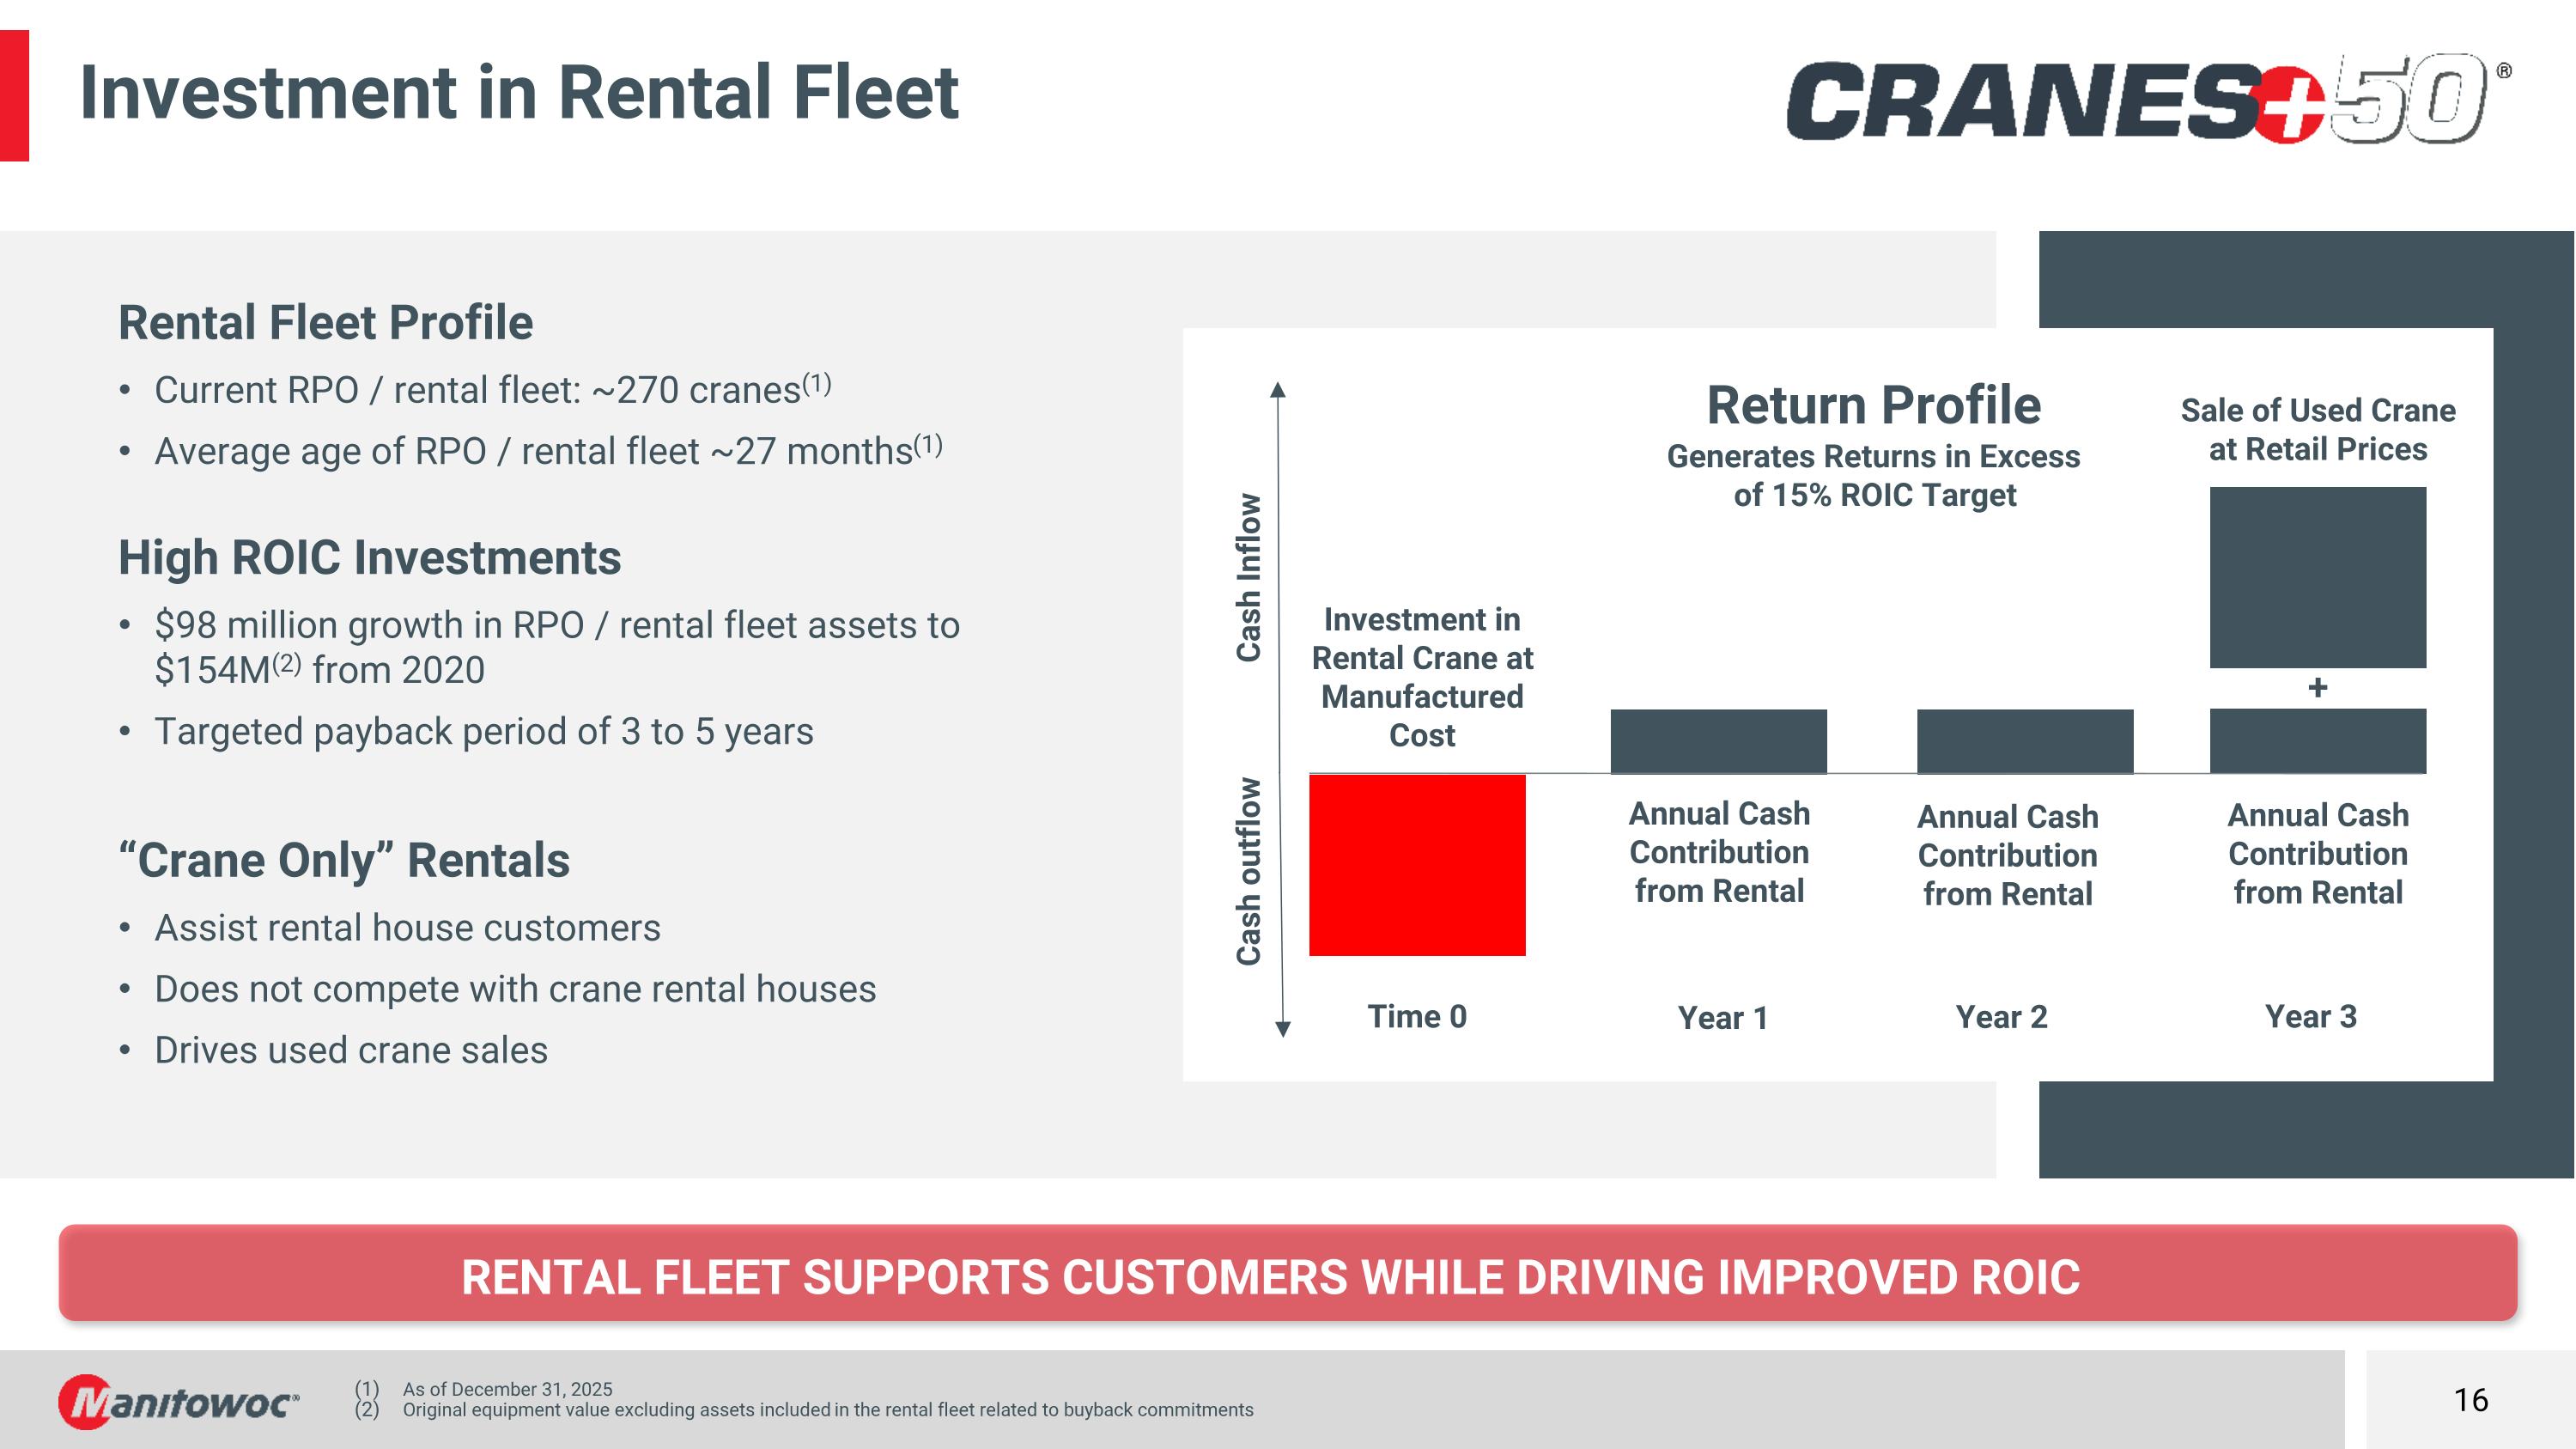
Rental fleet supports customers while driving improved roic Investment in Rental Fleet Sale of Used Crane at Retail Prices Year 3 Annual Cash Contribution from Rental Year 2 Year 1 Time 0 Investment in Rental Crane at Manufactured Cost Annual Cash Contribution from Rental Annual Cash Contribution from Rental + Return Profile Generates Returns in Excess of 15% ROIC Target Cash Inflow Cash outflow As of December 31, 2025 Original equipment value excluding assets included in the rental fleet related to buyback commitments Rental Fleet Profile Current RPO / rental fleet: ~270 cranes(1) Average age of RPO / rental fleet ~27 months(1) High ROIC Investments $98 million growth in RPO / rental fleet assets to $154M(2) from 2020 Targeted payback period of 3 to 5 years “Crane Only” Rentals Assist rental house customers Does not compete with crane rental houses Drives used crane sales
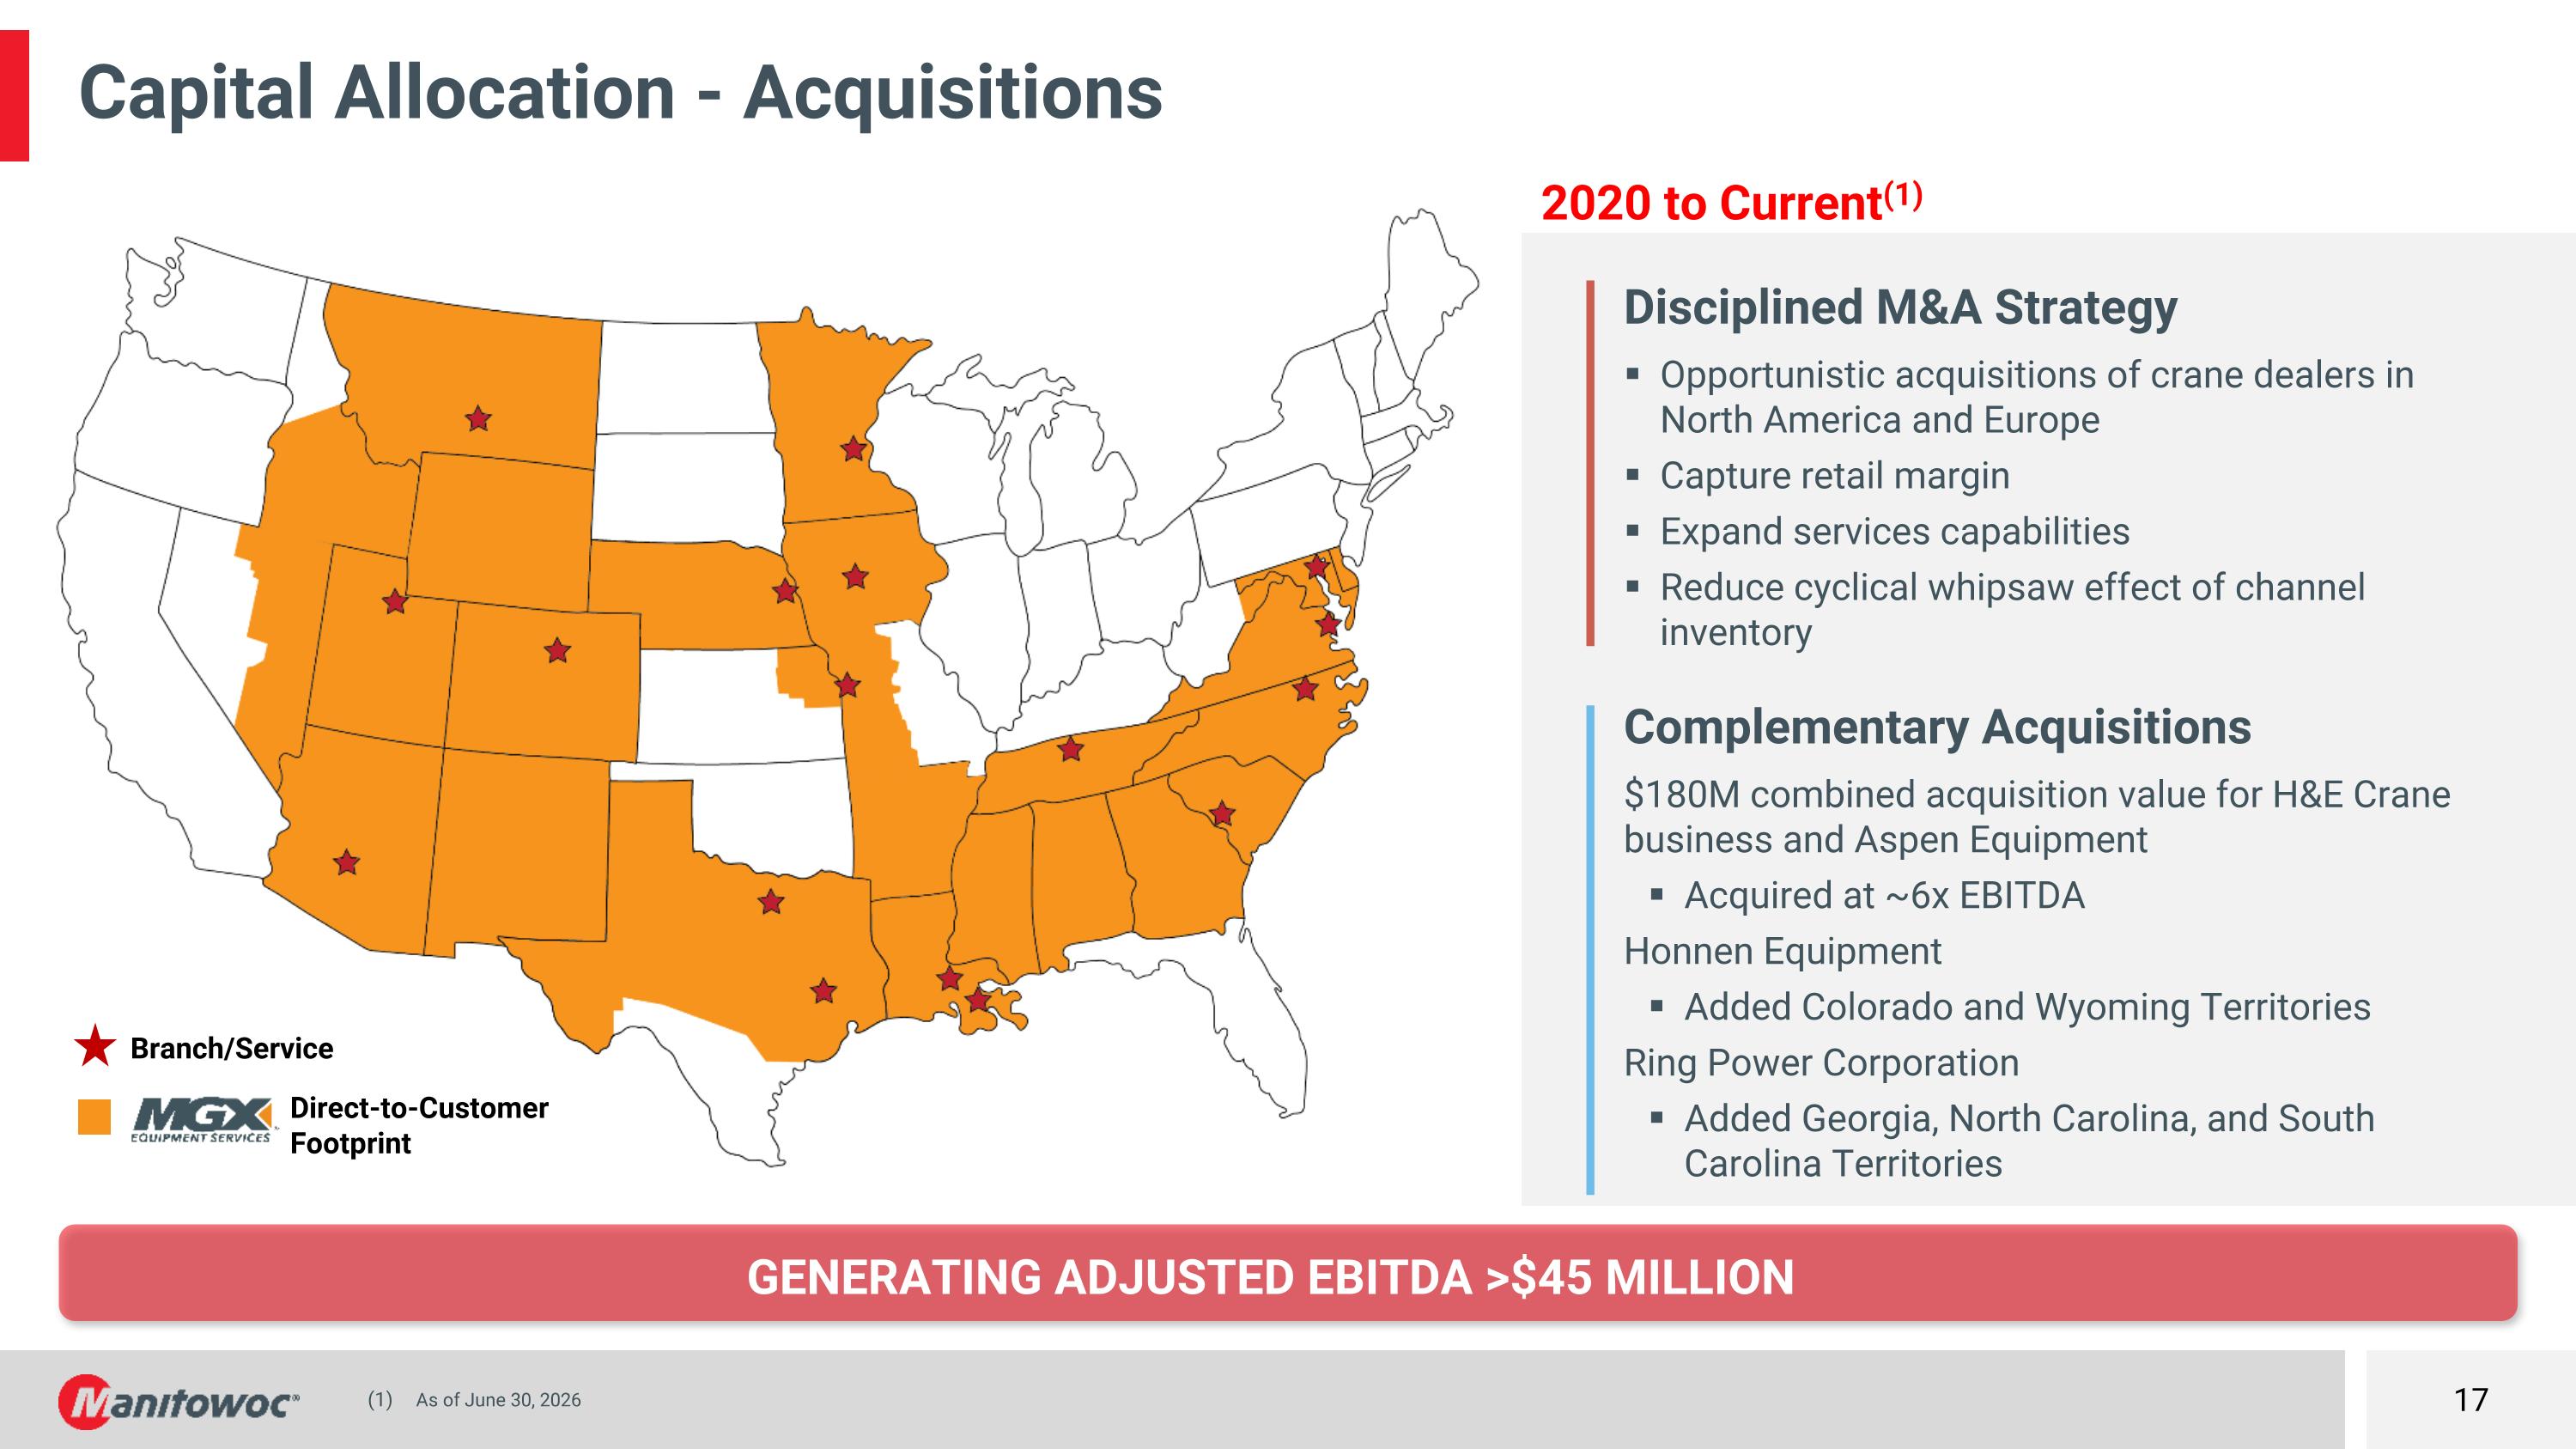
Generating Adjusted ebitda >$45 million Capital Allocation - Acquisitions Disciplined M&A Strategy Opportunistic acquisitions of crane dealers in North America and Europe Capture retail margin Expand services capabilities Reduce cyclical whipsaw effect of channel inventory Complementary Acquisitions $180M combined acquisition value for H&E Crane business and Aspen Equipment Acquired at ~6x EBITDA Honnen Equipment Added Colorado and Wyoming Territories Ring Power Corporation Added Georgia, North Carolina, and South Carolina Territories As of June 30, 2026 2020 to Current(1) Branch/Service Direct-to-Customer Footprint
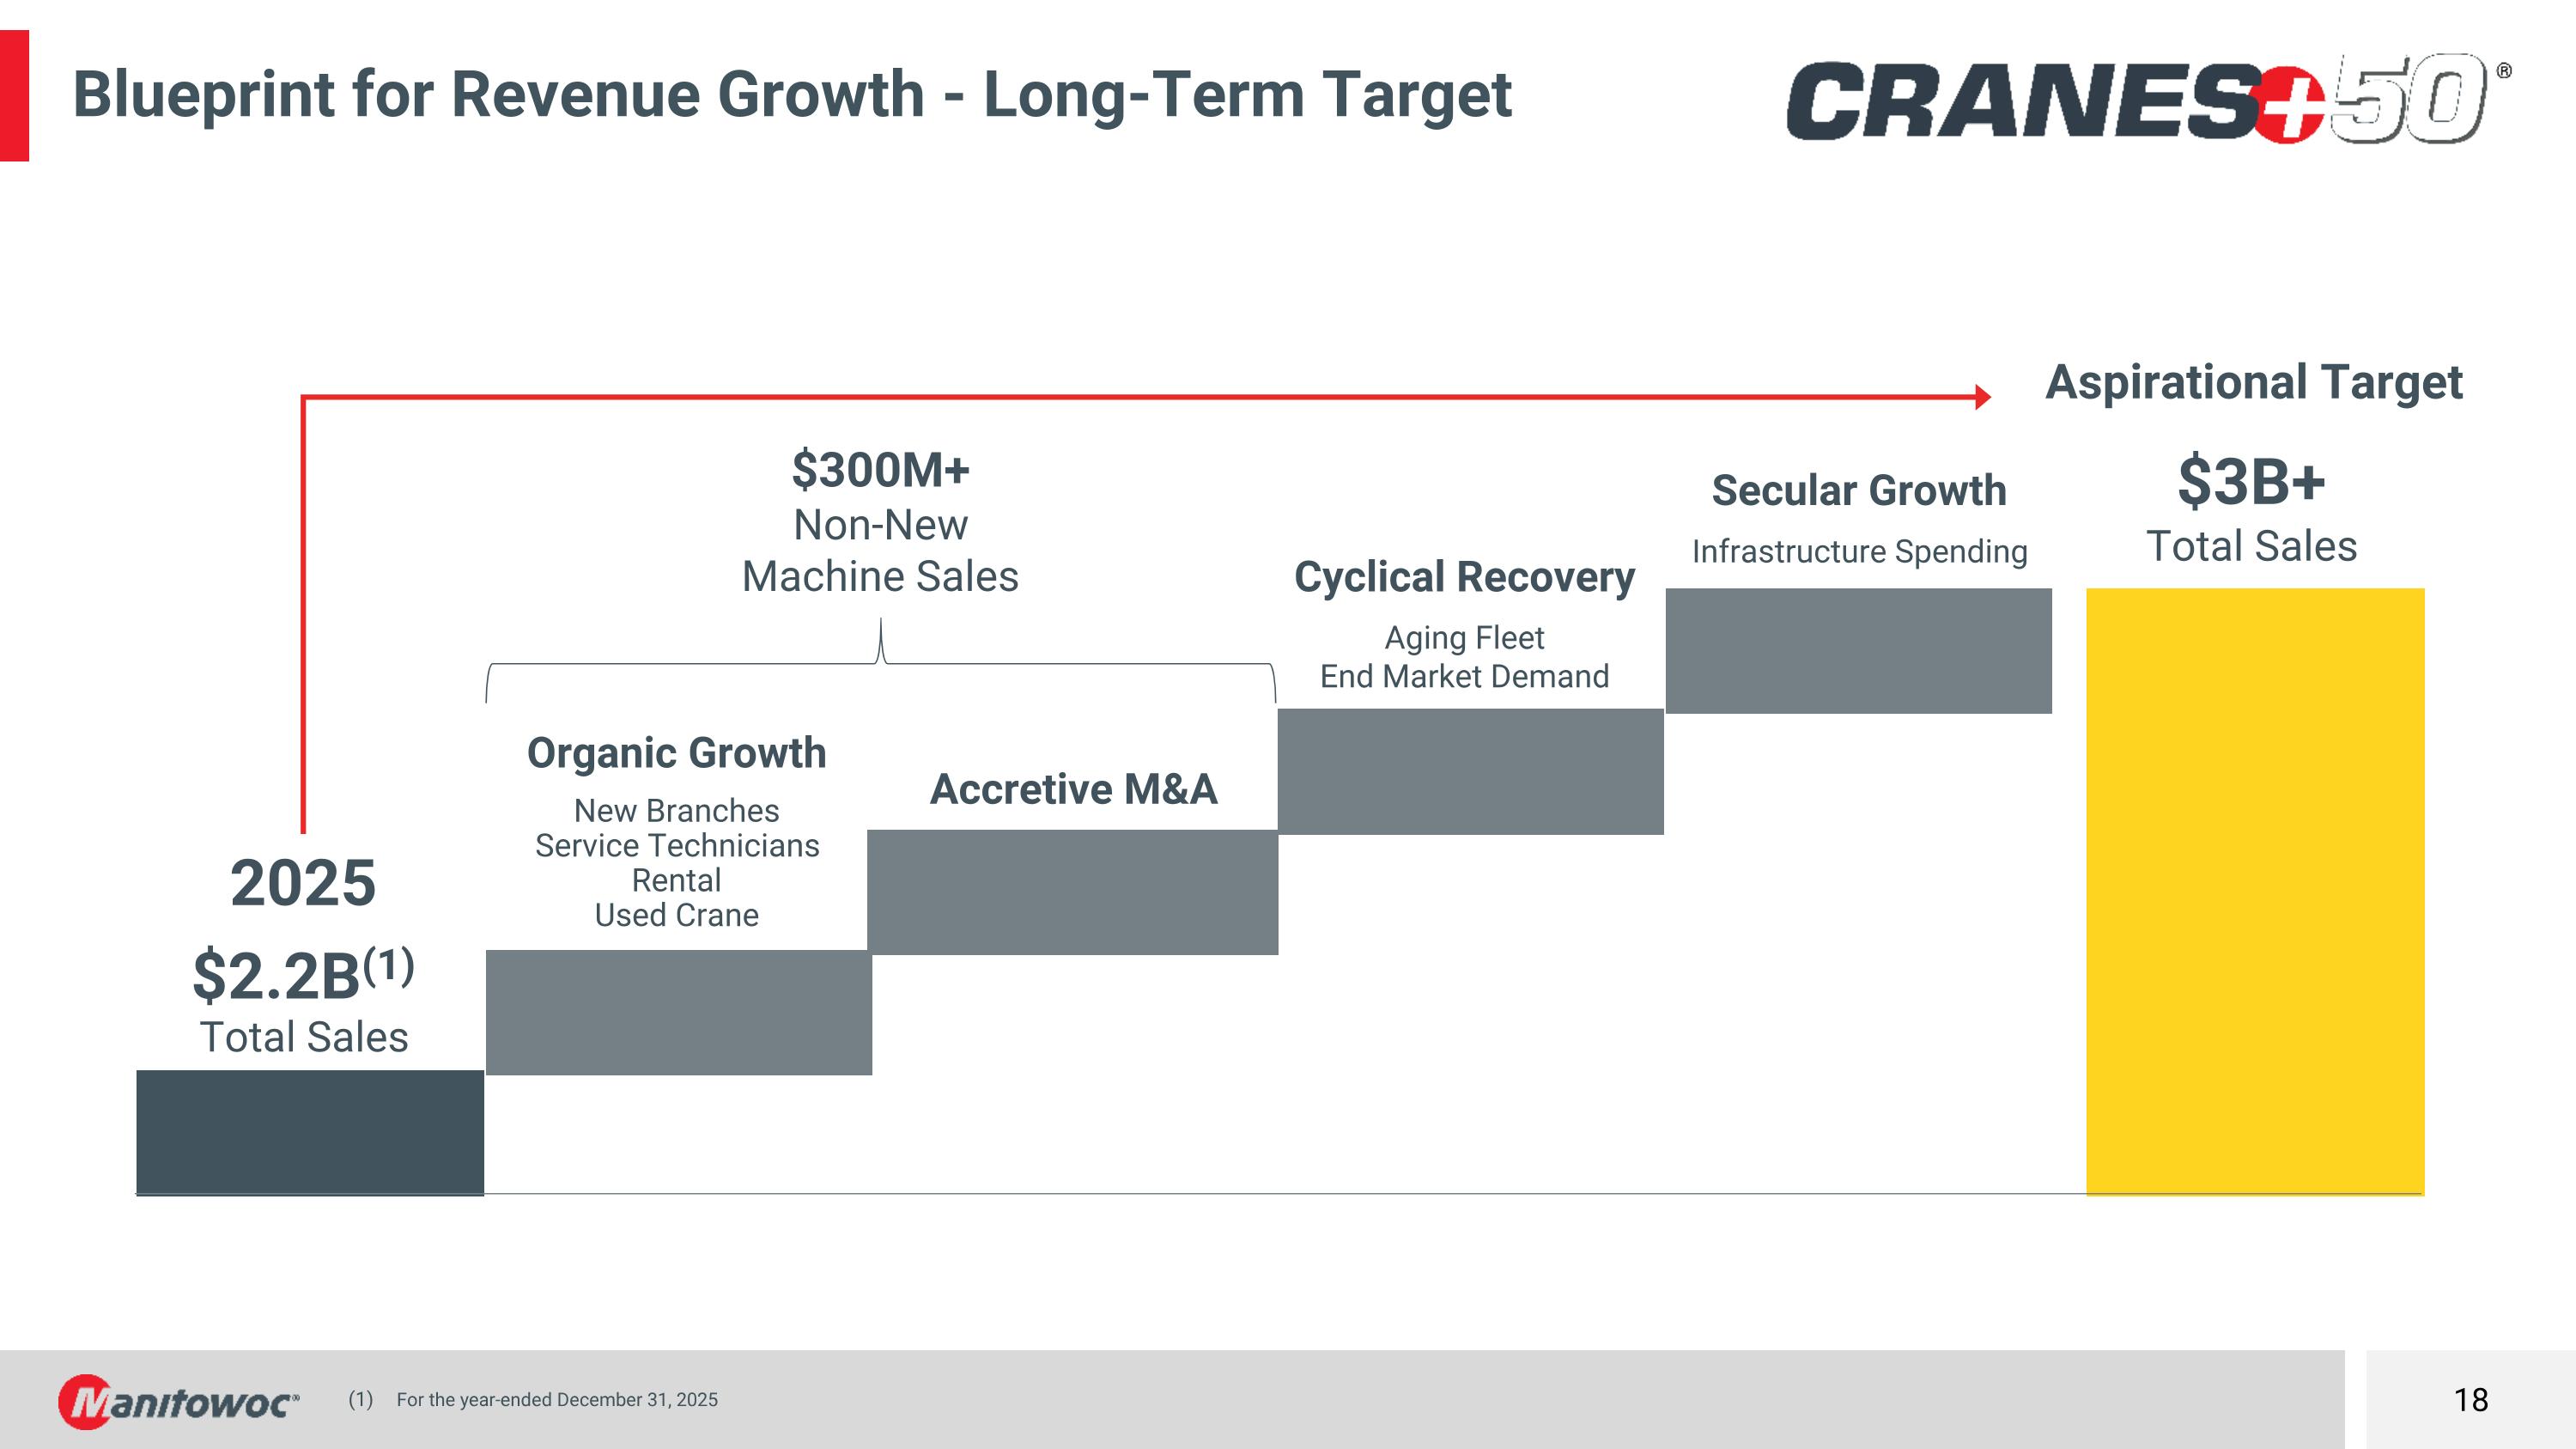
Blueprint for Revenue Growth - Long-Term Target Organic Growth New Branches Service Technicians Rental Used Crane Accretive M&A Secular Growth Infrastructure Spending Aspirational Target $3B+ Total Sales Cyclical Recovery Aging Fleet End Market Demand 2025 $2.2B(1) Total Sales $300M+ Non-New Machine Sales For the year-ended December 31, 2025
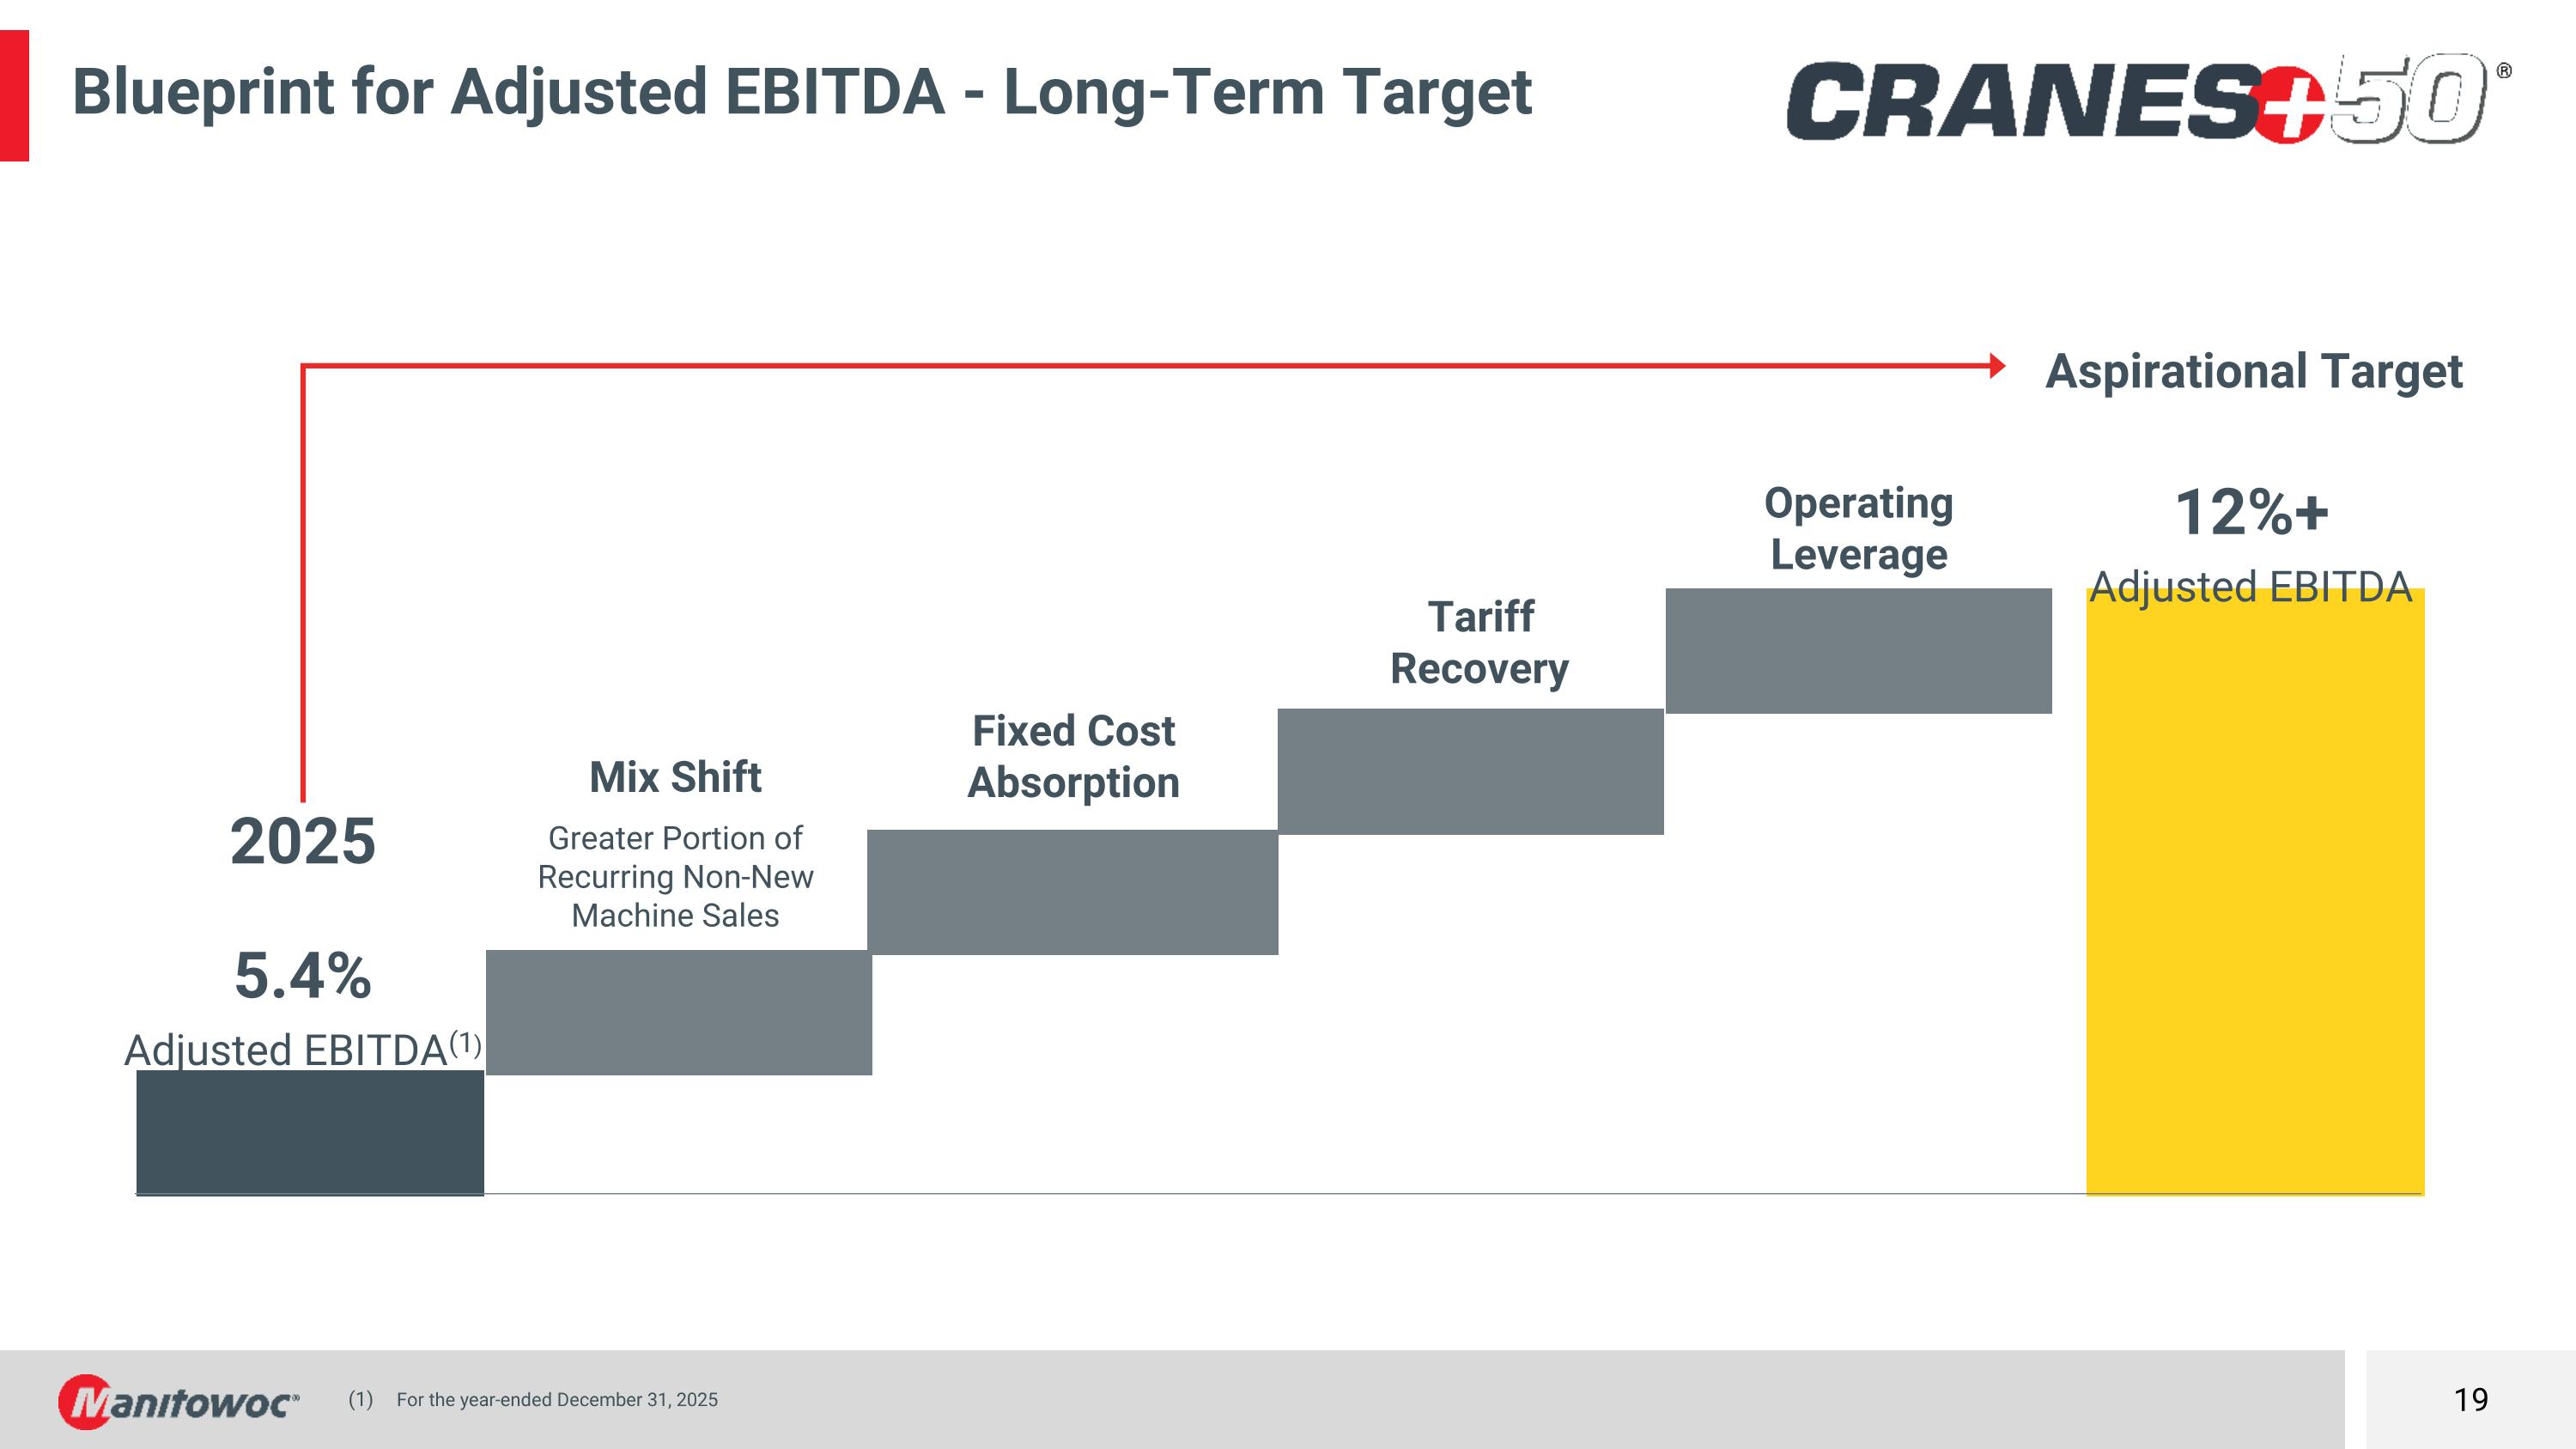
Blueprint for Adjusted EBITDA - Long-Term Target Mix Shift Greater Portion of Recurring Non-New Machine Sales Fixed Cost Absorption Operating Leverage Aspirational Target 12%+ Adjusted EBITDA Tariff Recovery 2025 5.4% Adjusted EBITDA(1) For the year-ended December 31, 2025
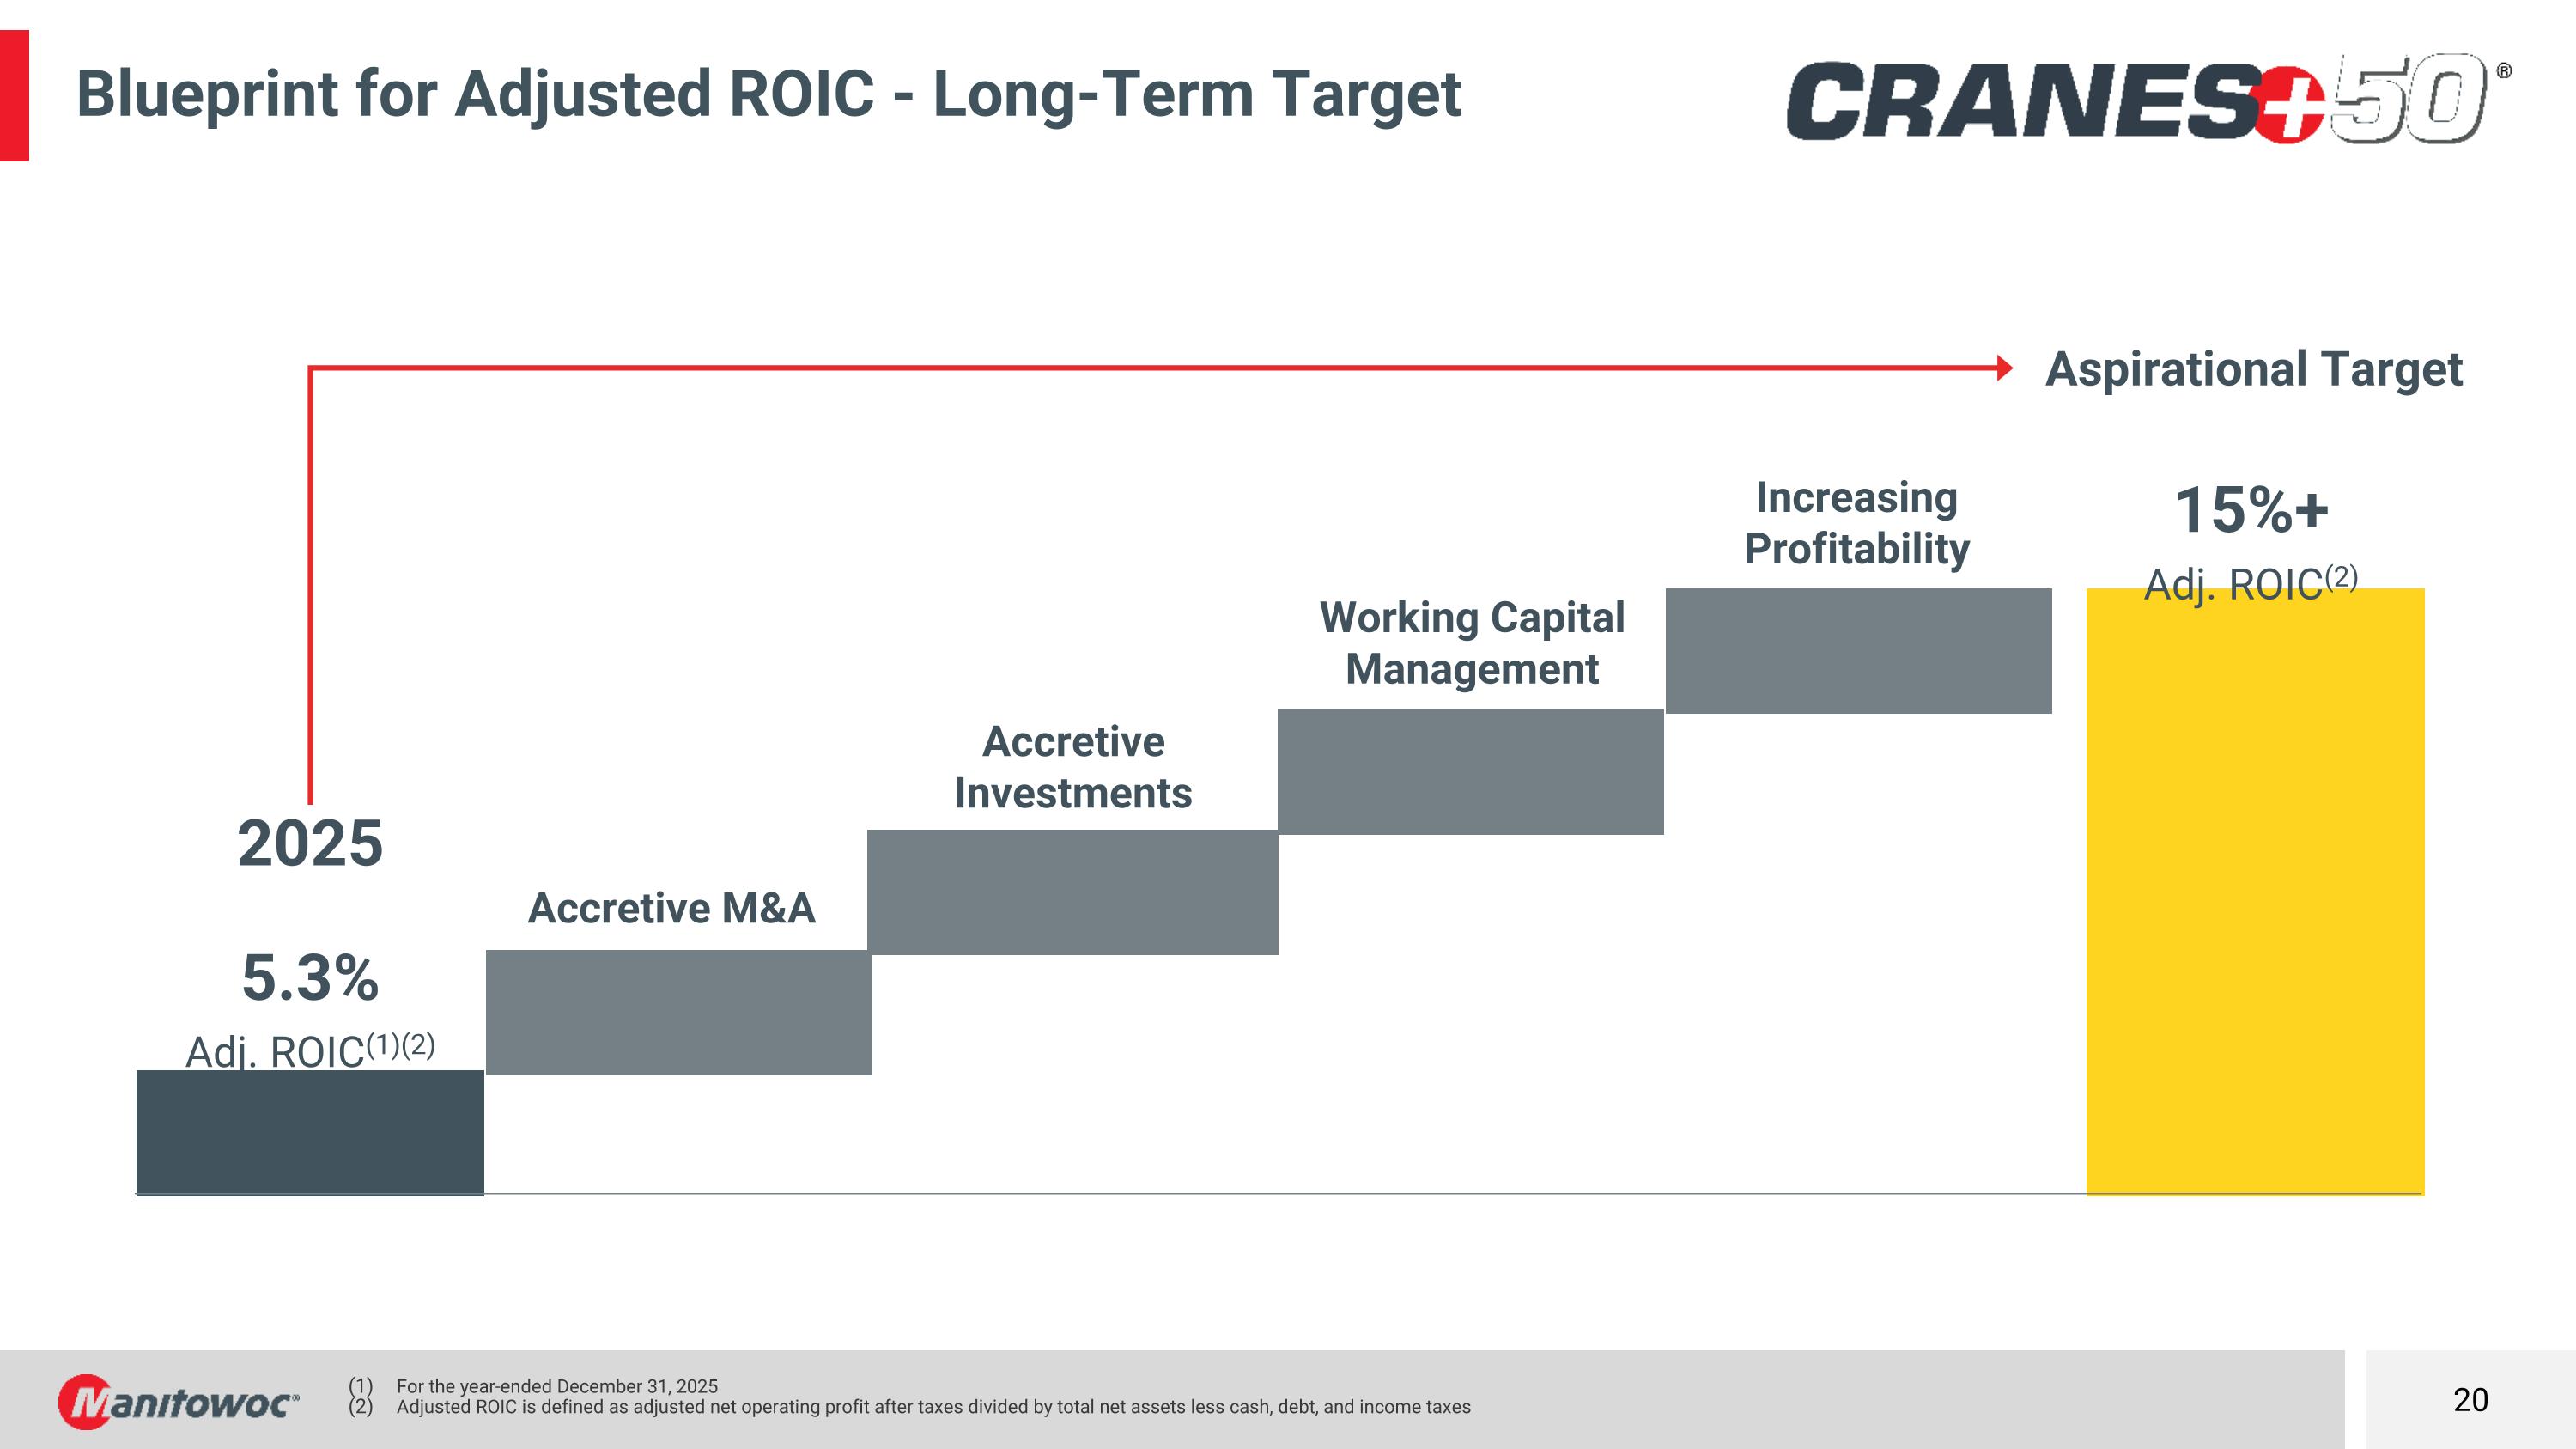
Blueprint for Adjusted ROIC - Long-Term Target Accretive M&A Accretive Investments Increasing Profitability Aspirational Target 15%+ Adj. ROIC(2) Working Capital Management 2025 5.3% Adj. ROIC(1)(2) For the year-ended December 31, 2025 Adjusted ROIC is defined as adjusted net operating profit after taxes divided by total net assets less cash, debt, and income taxes
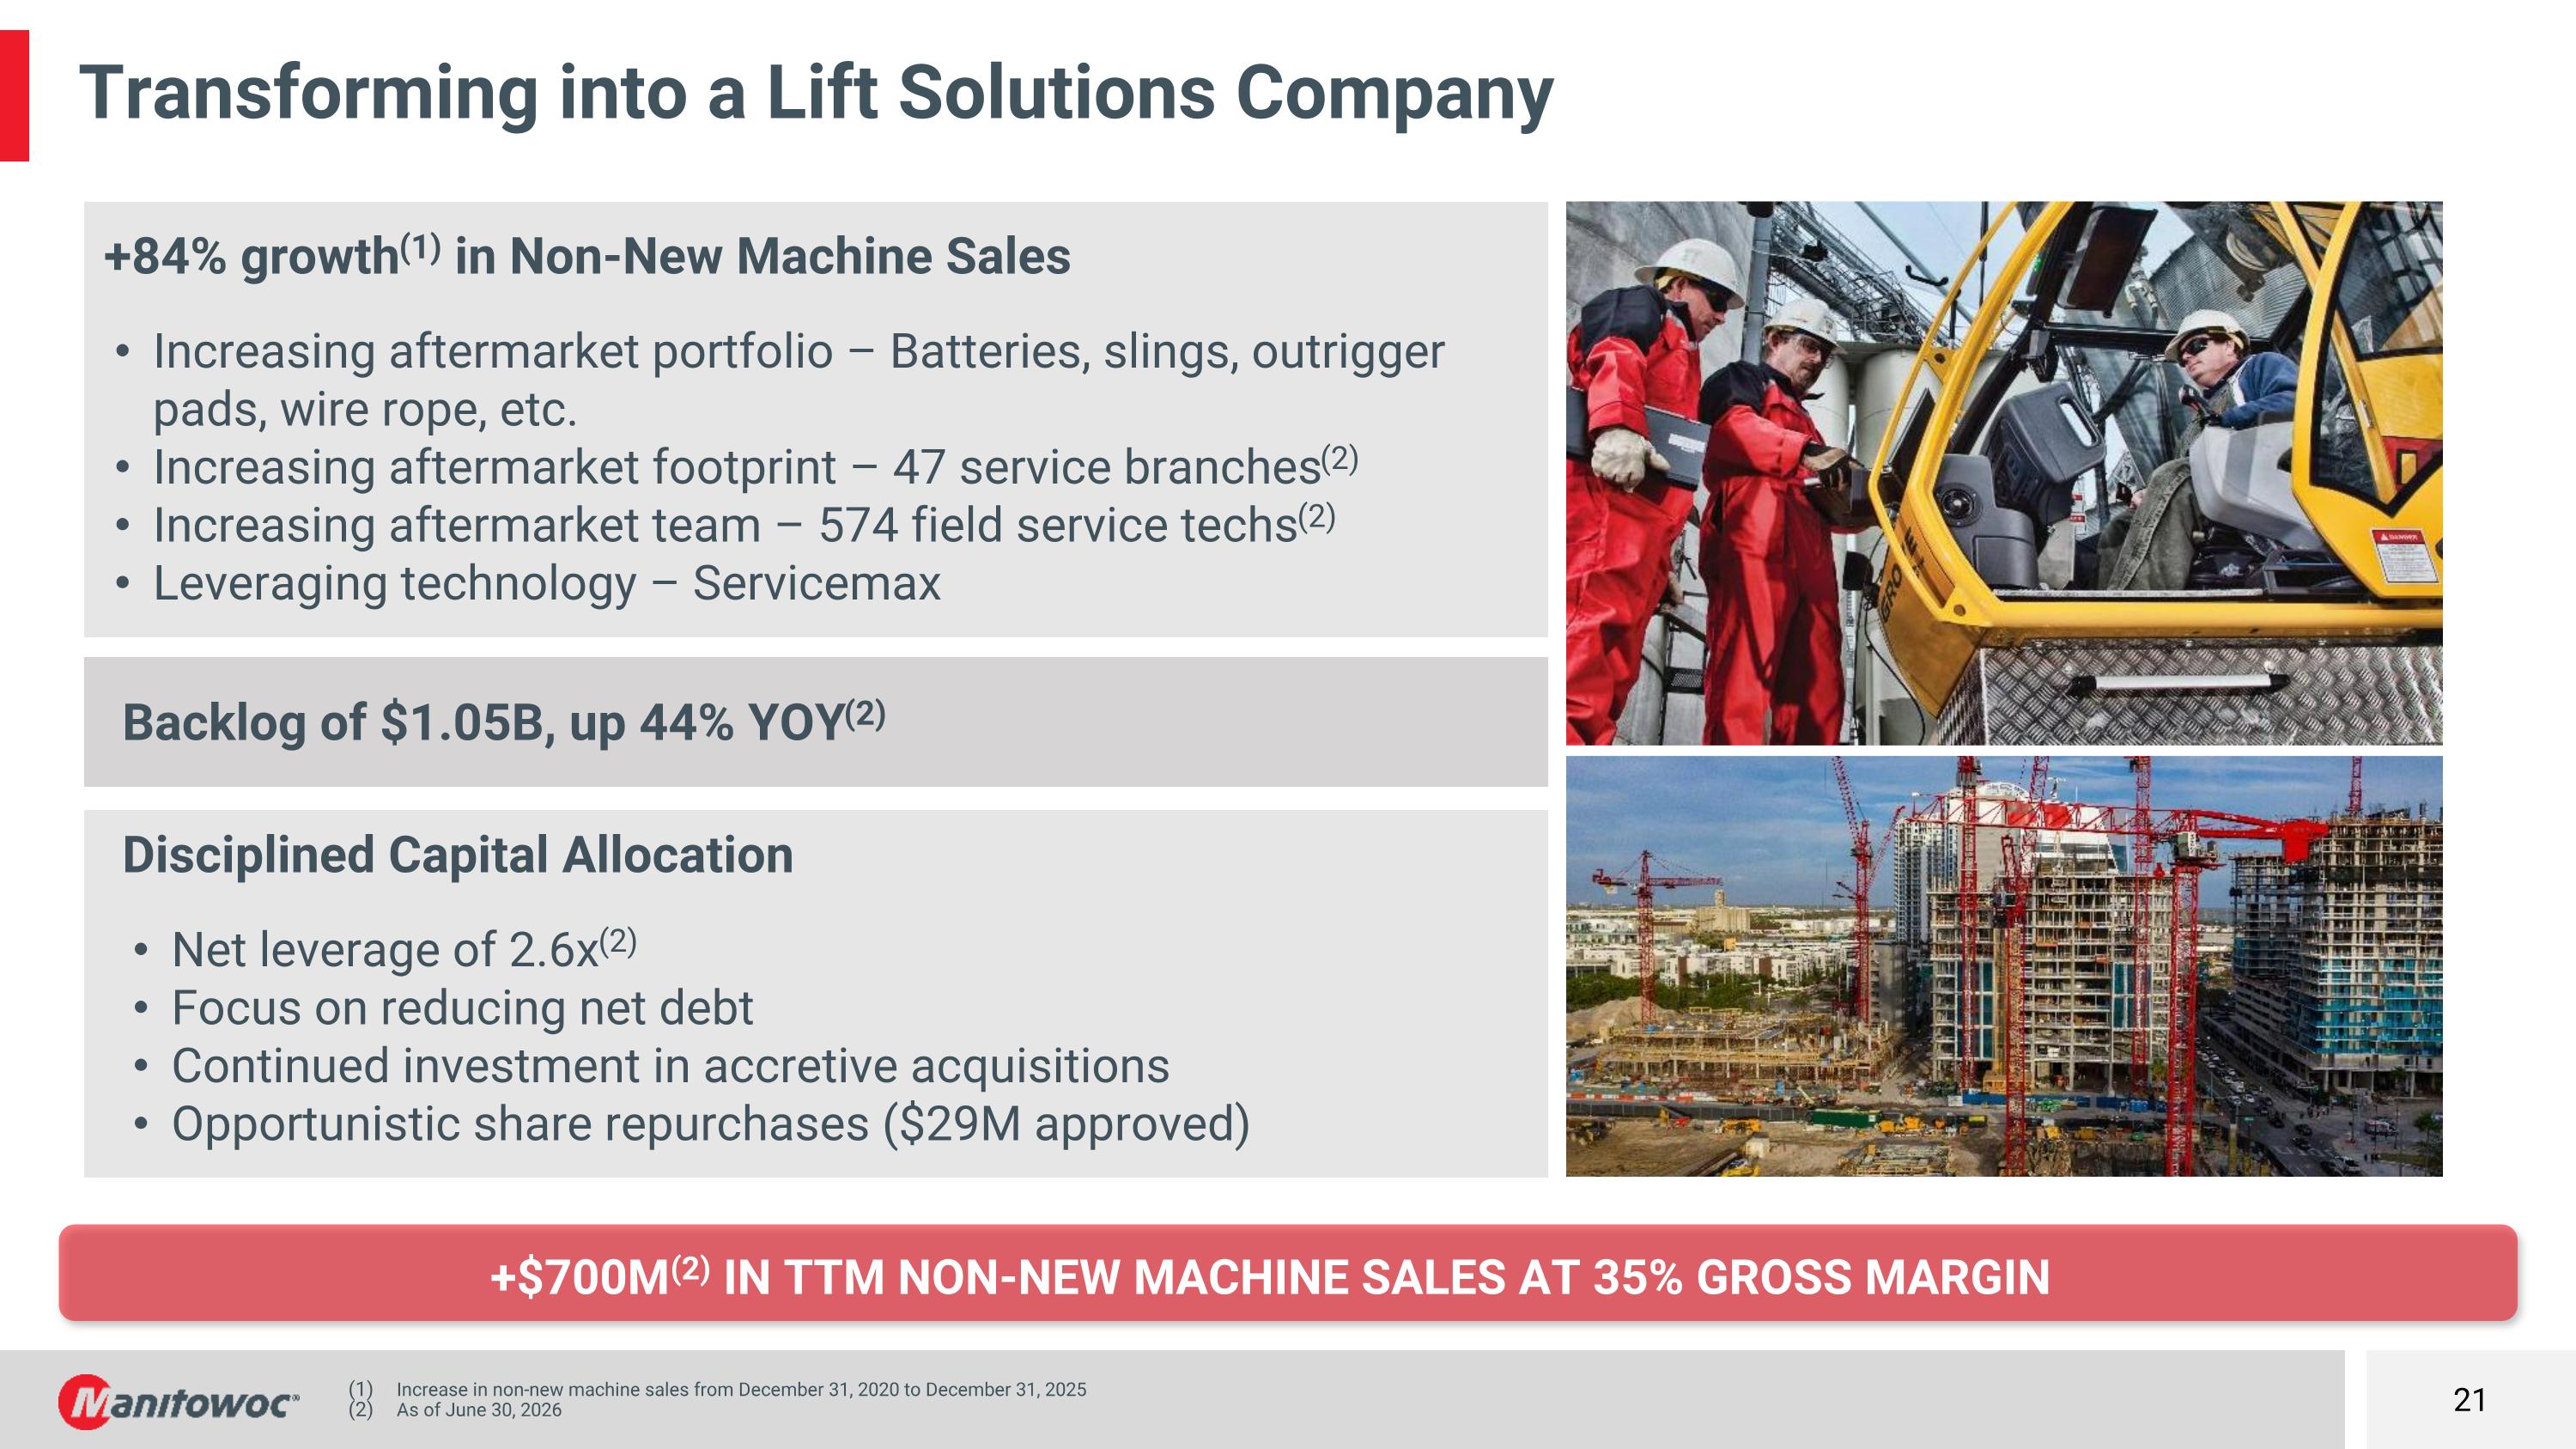
+$700M(2) in TTM non-new machine sales at 35% gross margin Transforming into a Lift Solutions Company Increase in non-new machine sales from December 31, 2020 to December 31, 2025 As of June 30, 2026 +84% growth(1) in Non-New Machine Sales Increasing aftermarket portfolio – Batteries, slings, outrigger pads, wire rope, etc. Increasing aftermarket footprint – 47 service branches(2) Increasing aftermarket team – 574 field service techs(2) Leveraging technology – Servicemax Disciplined Capital Allocation Net leverage of 2.6x(2) Focus on reducing net debt Continued investment in accretive acquisitions Opportunistic share repurchases ($29M approved) Backlog of $1.05B, up 44% YOY(2)
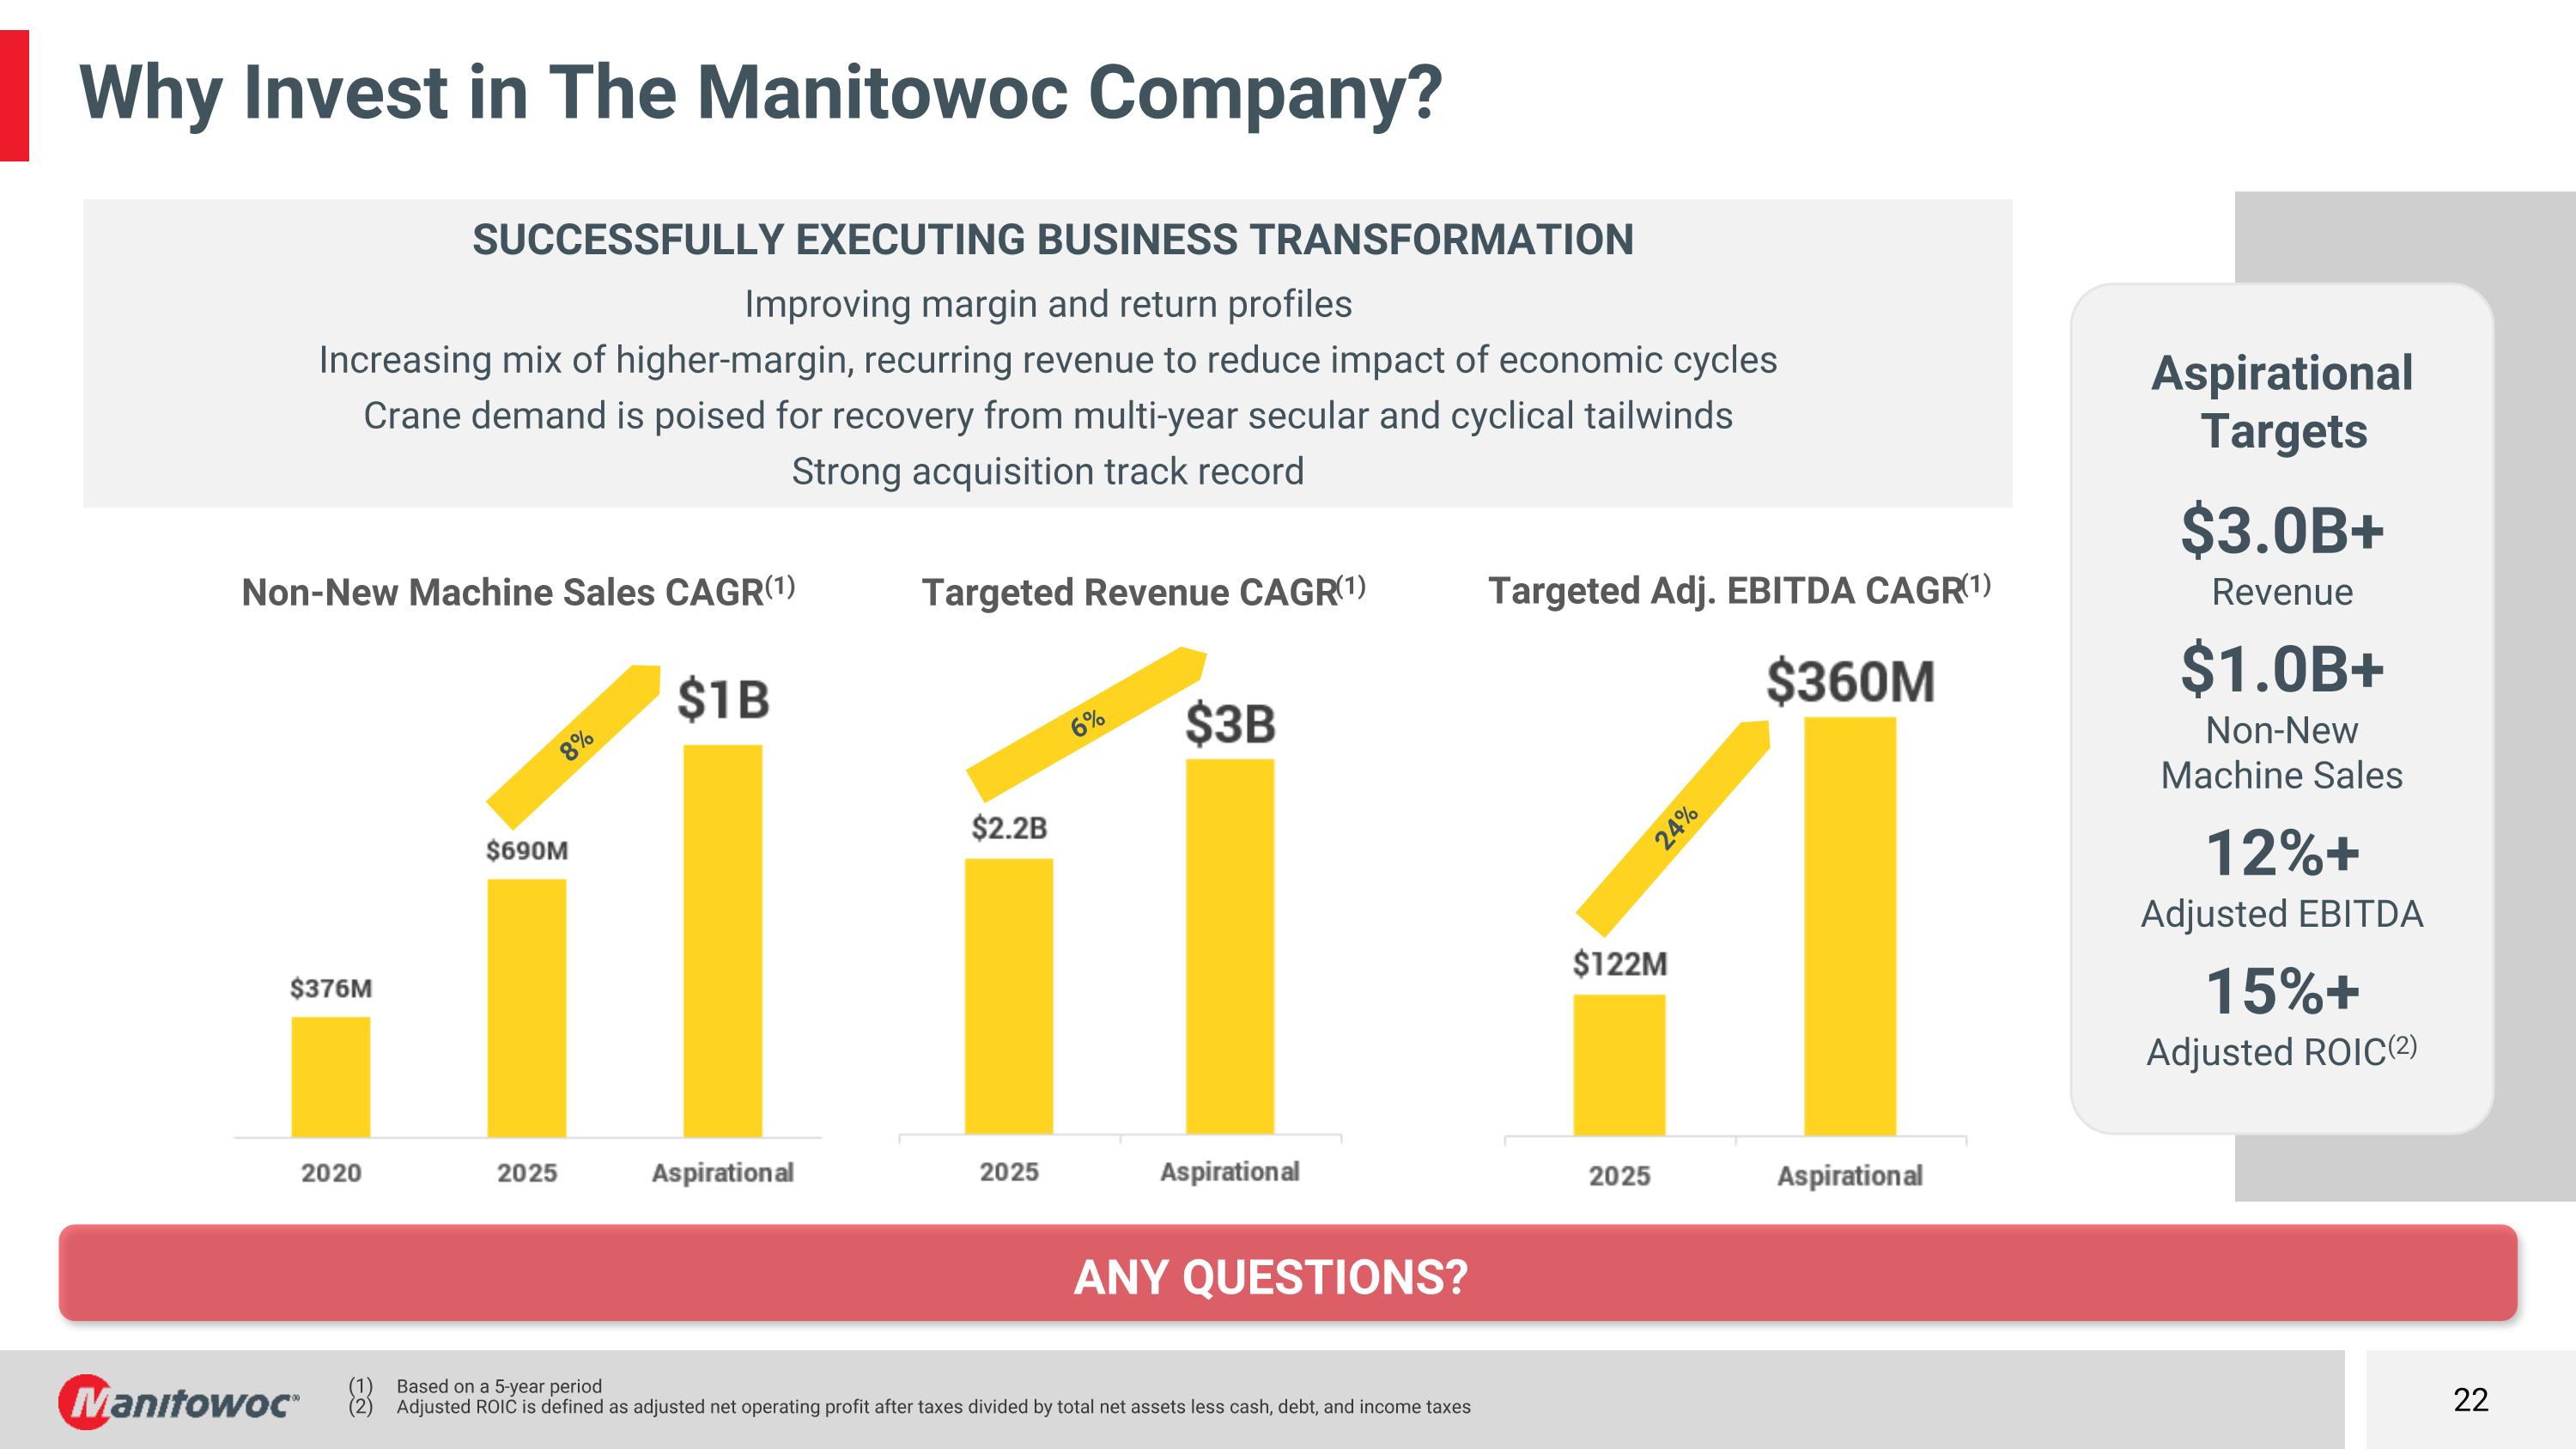
Any Questions? Why Invest in The Manitowoc Company? SUCCESSFULLY EXECUTING BUSINESS TRANSFORMATION Improving margin and return profiles Increasing mix of higher-margin, recurring revenue to reduce impact of economic cycles Crane demand is poised for recovery from multi-year secular and cyclical tailwinds Strong acquisition track record Aspirational Targets $3.0B+ Revenue $1.0B+ Non-New Machine Sales 12%+ Adjusted EBITDA 15%+ Adjusted ROIC(2) Based on a 5-year period Adjusted ROIC is defined as adjusted net operating profit after taxes divided by total net assets less cash, debt, and income taxes Targeted Adj. EBITDA CAGR(1) 24% Targeted Revenue CAGR(1) 6% 8% Non-New Machine Sales CAGR(1)

Appendix
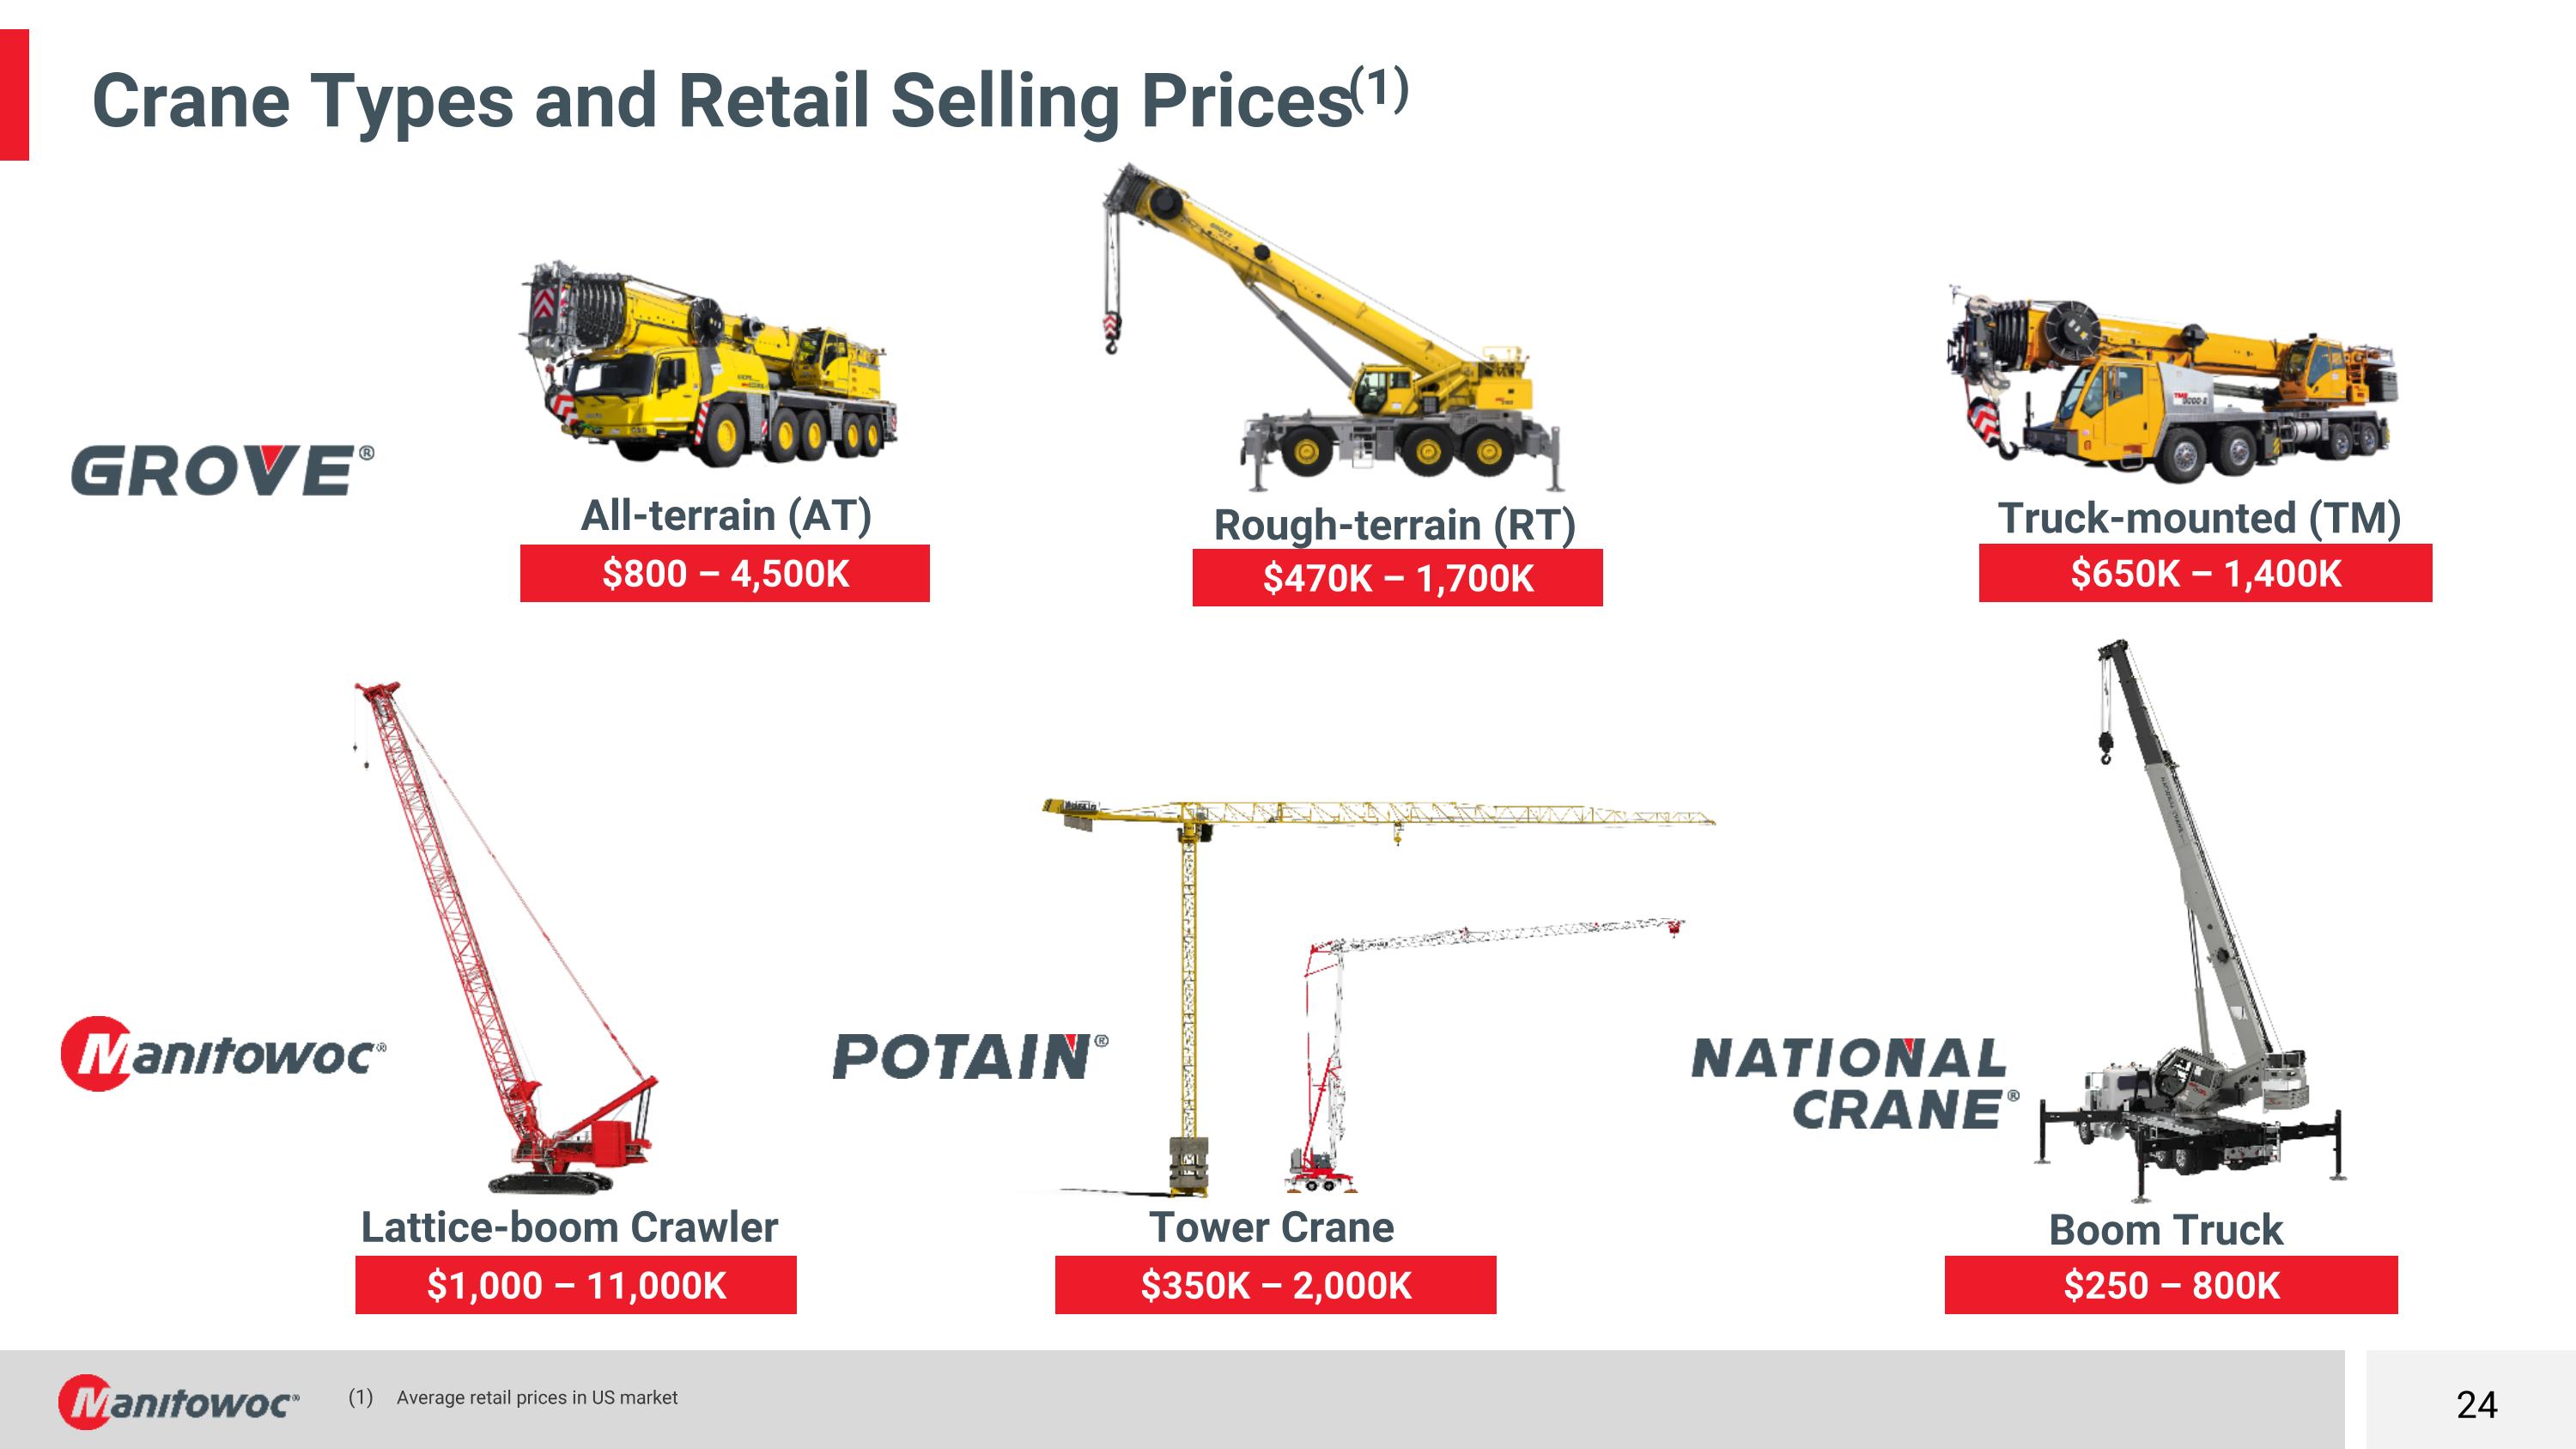
Crane Types and Retail Selling Prices(1) Average retail prices in US market $800 – 4,500K All-terrain (AT) $470K – 1,700K Rough-terrain (RT) $650K – 1,400K Truck-mounted (TM) $1,000 – 11,000K Lattice-boom Crawler $350K – 2,000K Tower Crane $250 – 800K Boom Truck
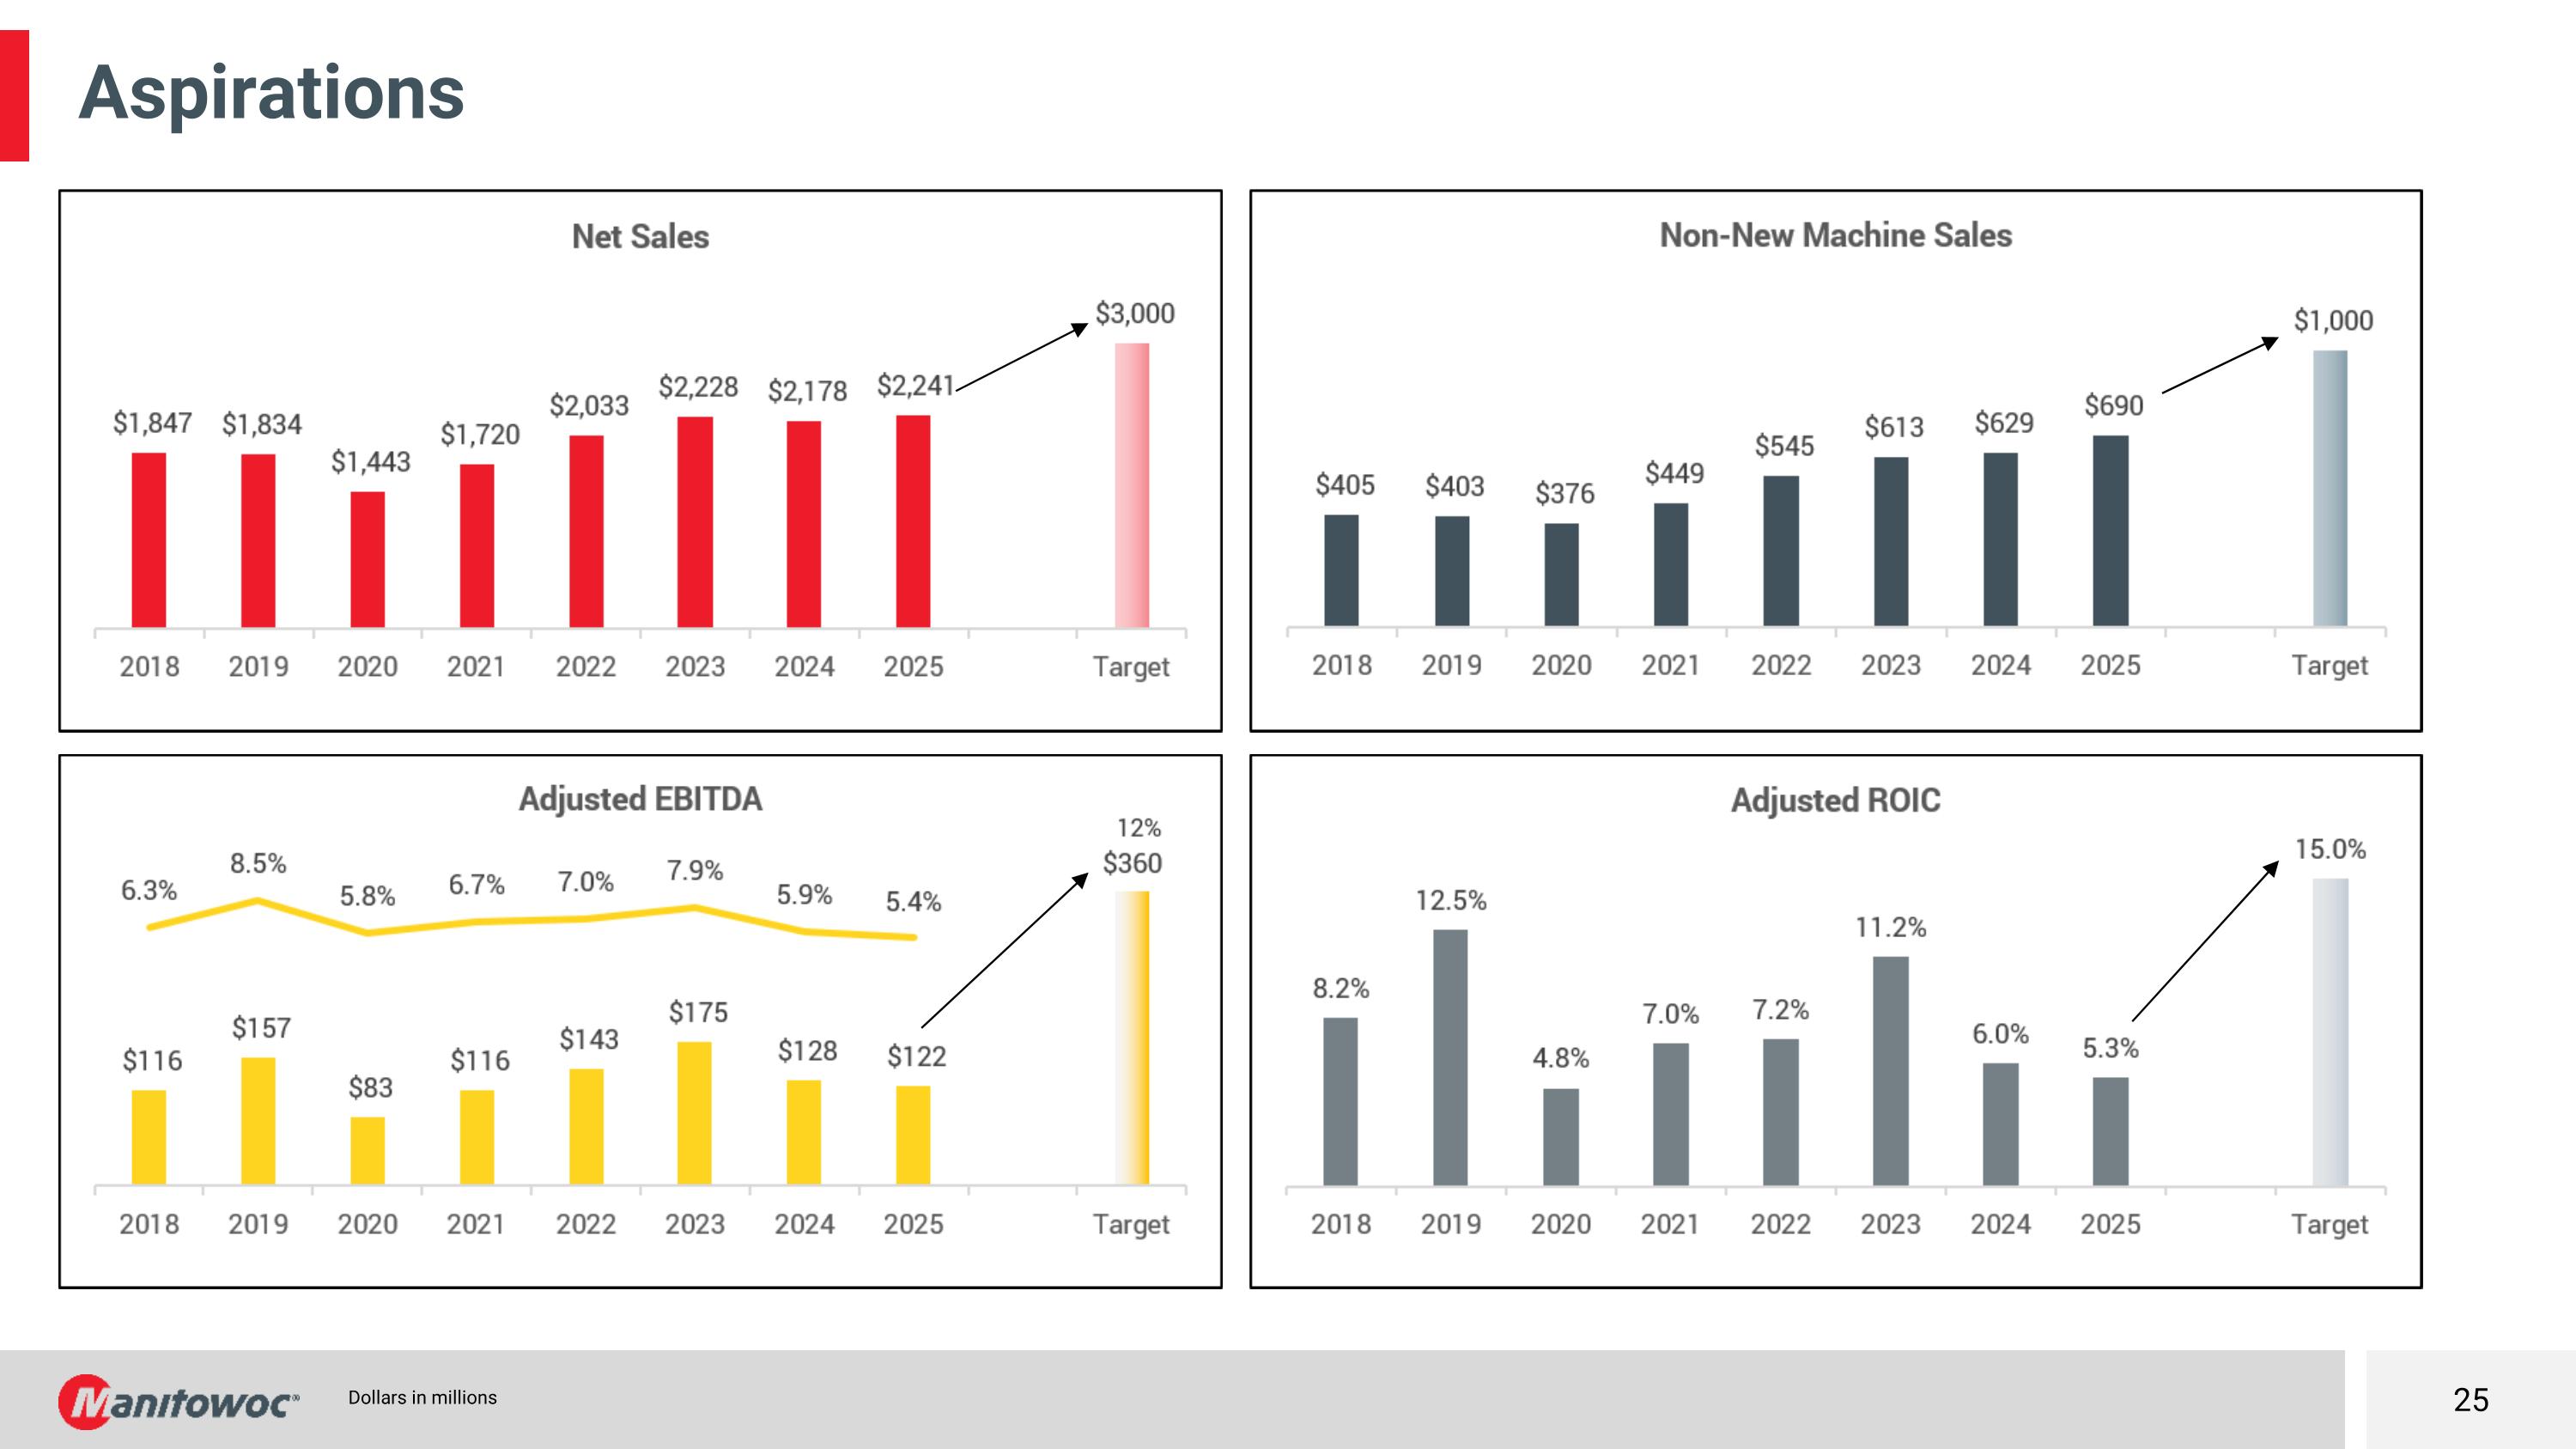
Dollars in millions Aspirations
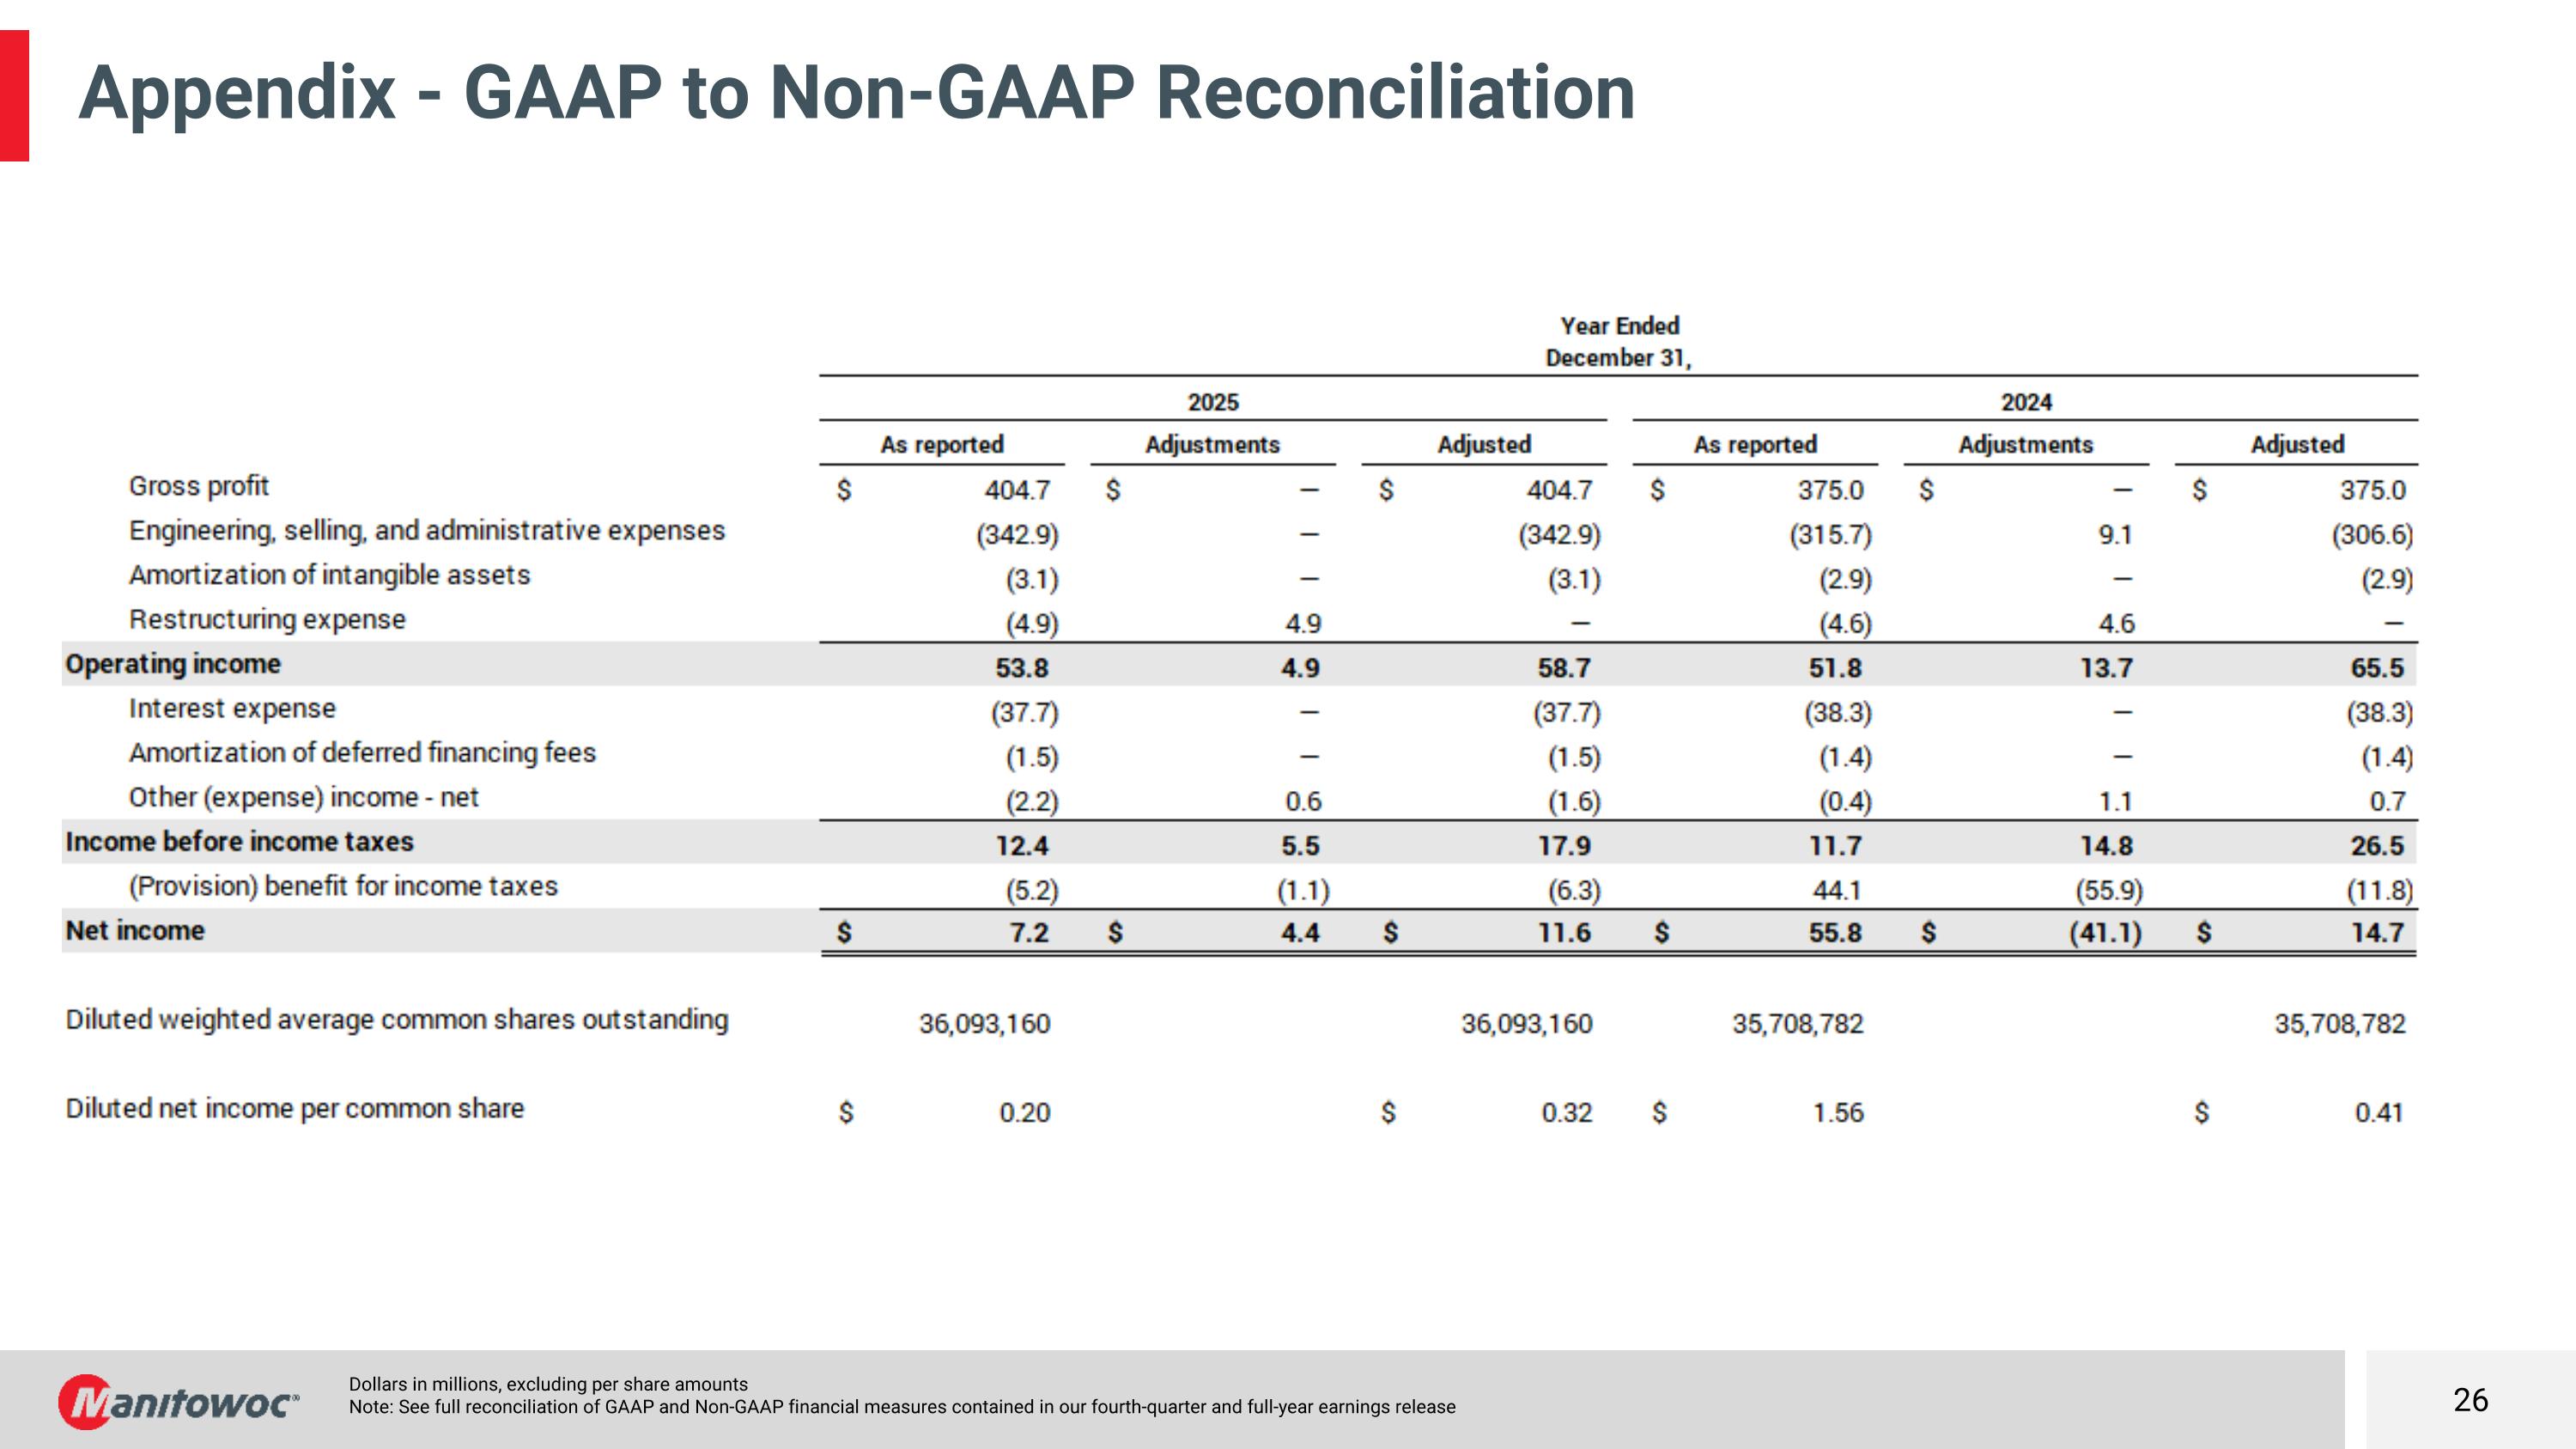
Dollars in millions, excluding per share amounts Note: See full reconciliation of GAAP and Non-GAAP financial measures contained in our fourth-quarter and full-year earnings release Appendix - GAAP to Non-GAAP Reconciliation
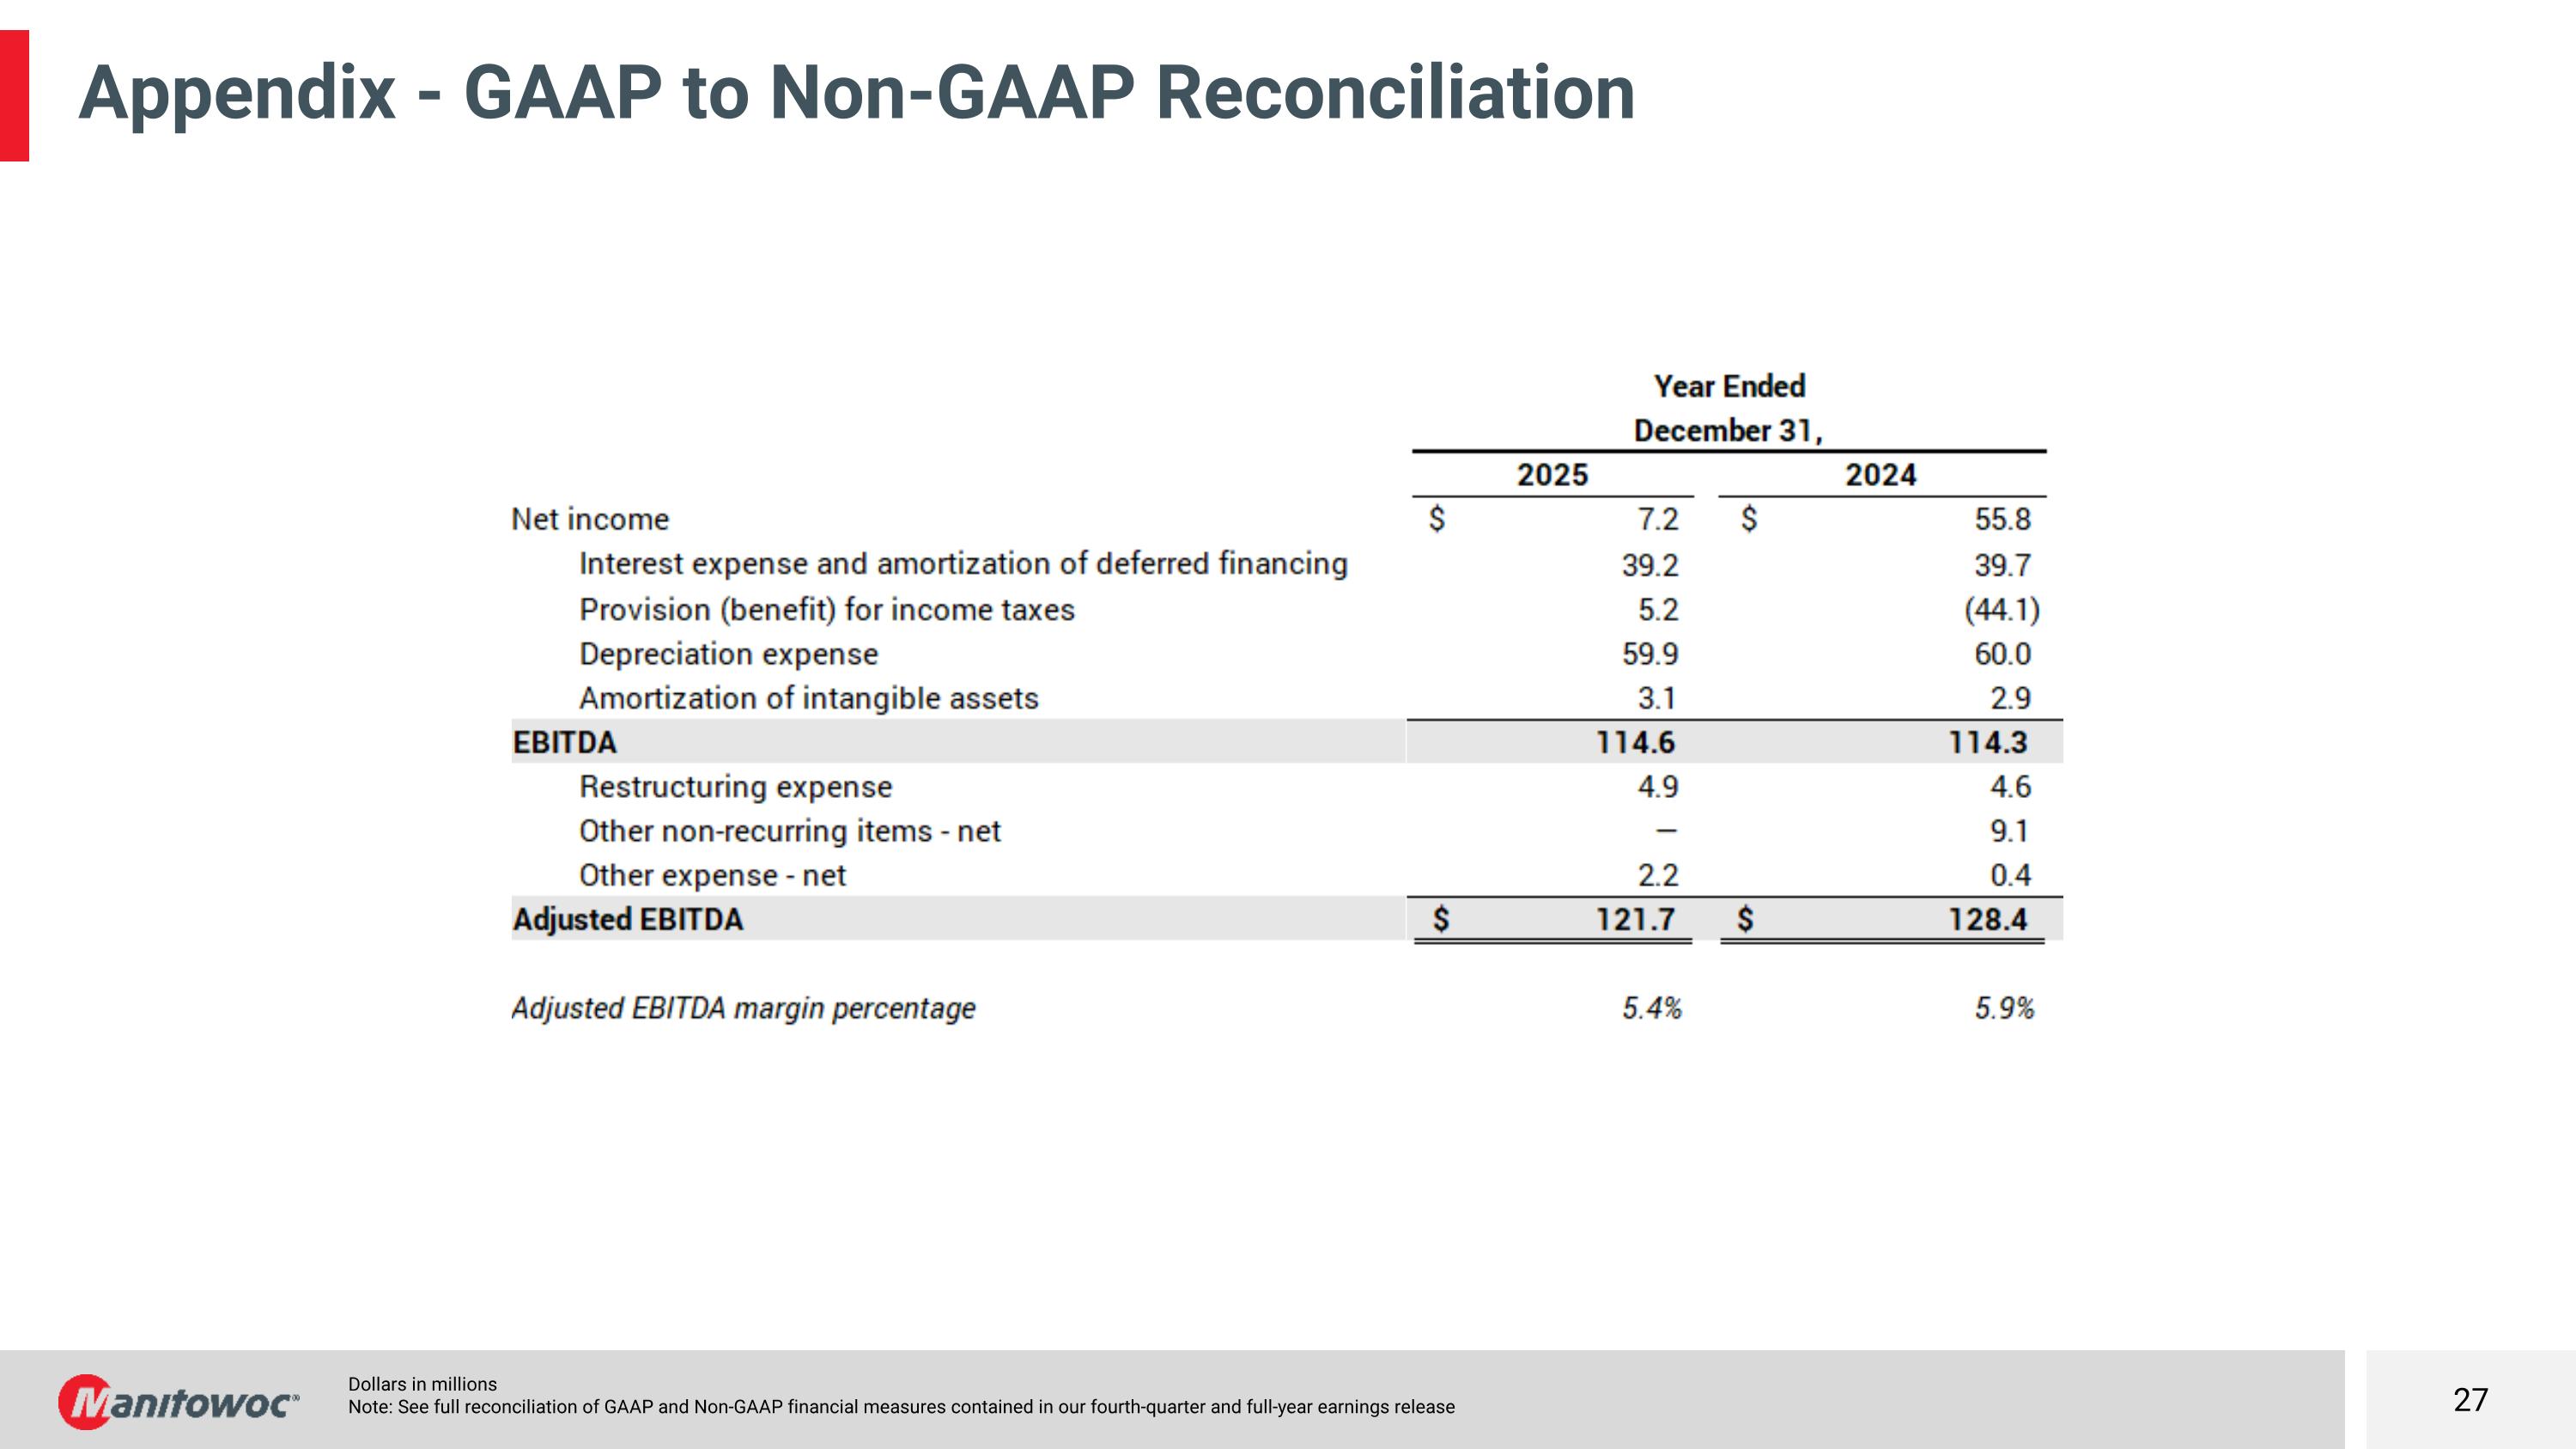
Dollars in millions Note: See full reconciliation of GAAP and Non-GAAP financial measures contained in our fourth-quarter and full-year earnings release Appendix - GAAP to Non-GAAP Reconciliation
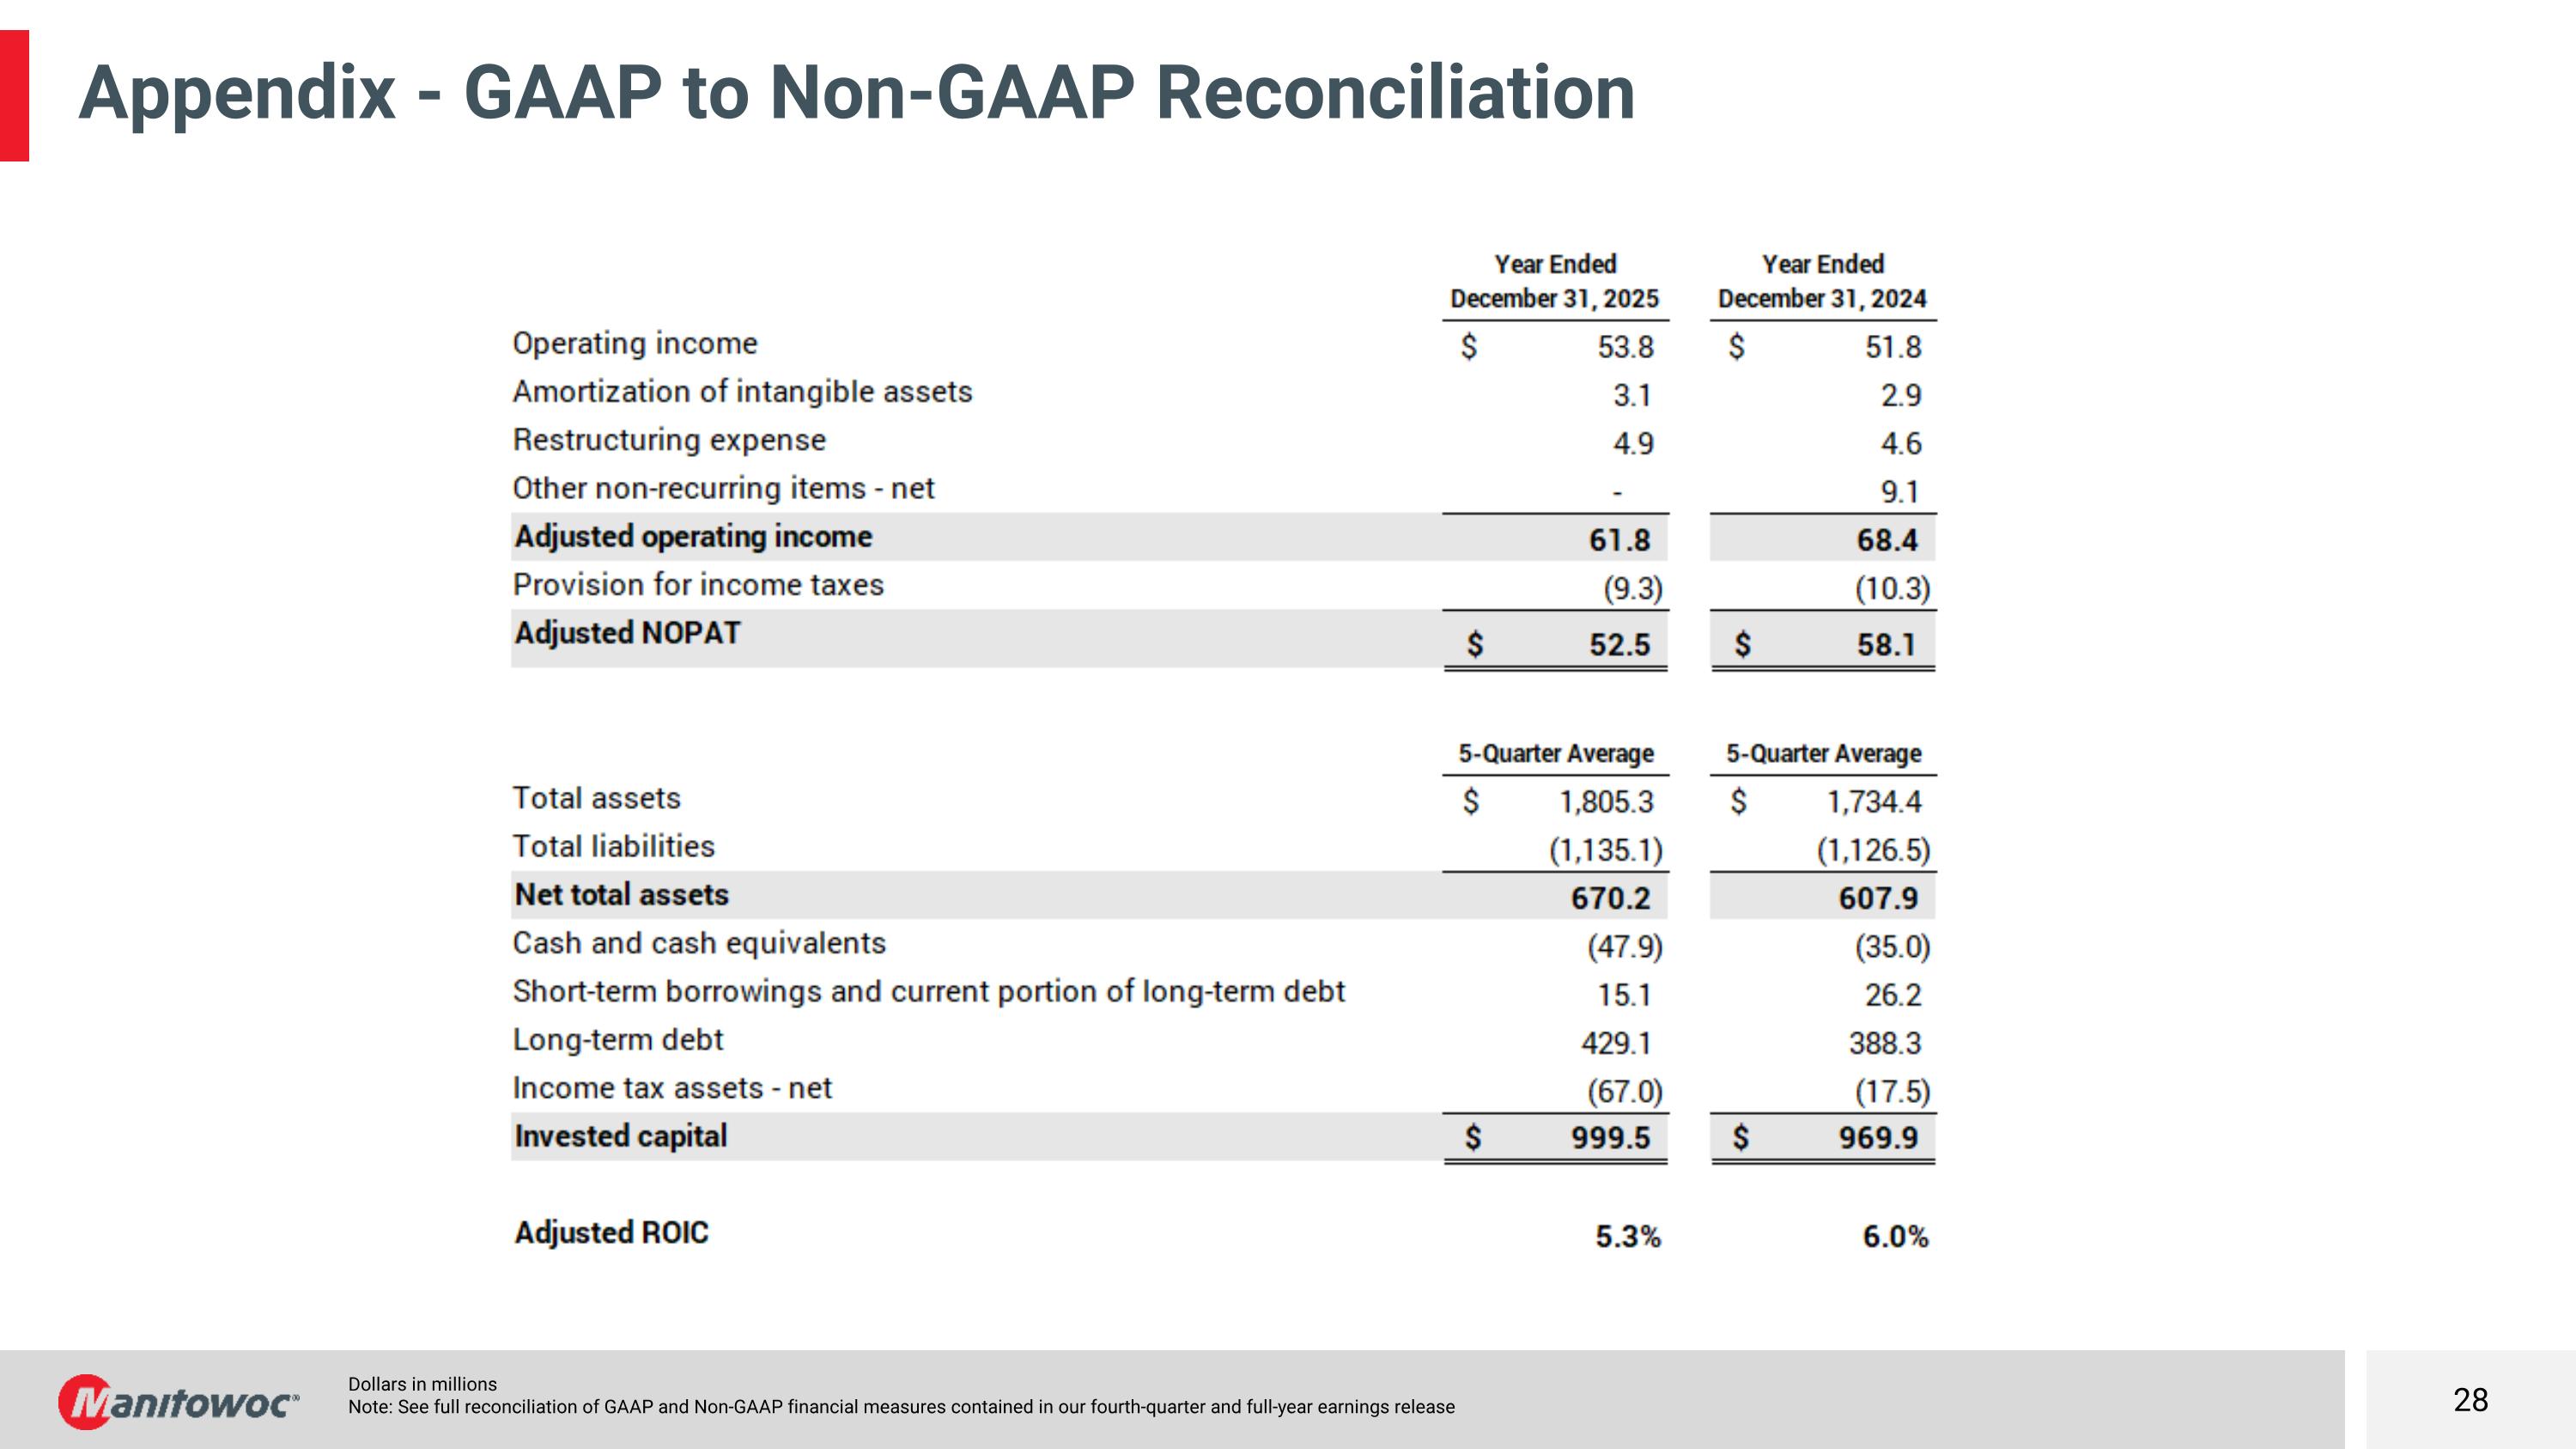
Dollars in millions Note: See full reconciliation of GAAP and Non-GAAP financial measures contained in our fourth-quarter and full-year earnings release Appendix - GAAP to Non-GAAP Reconciliation
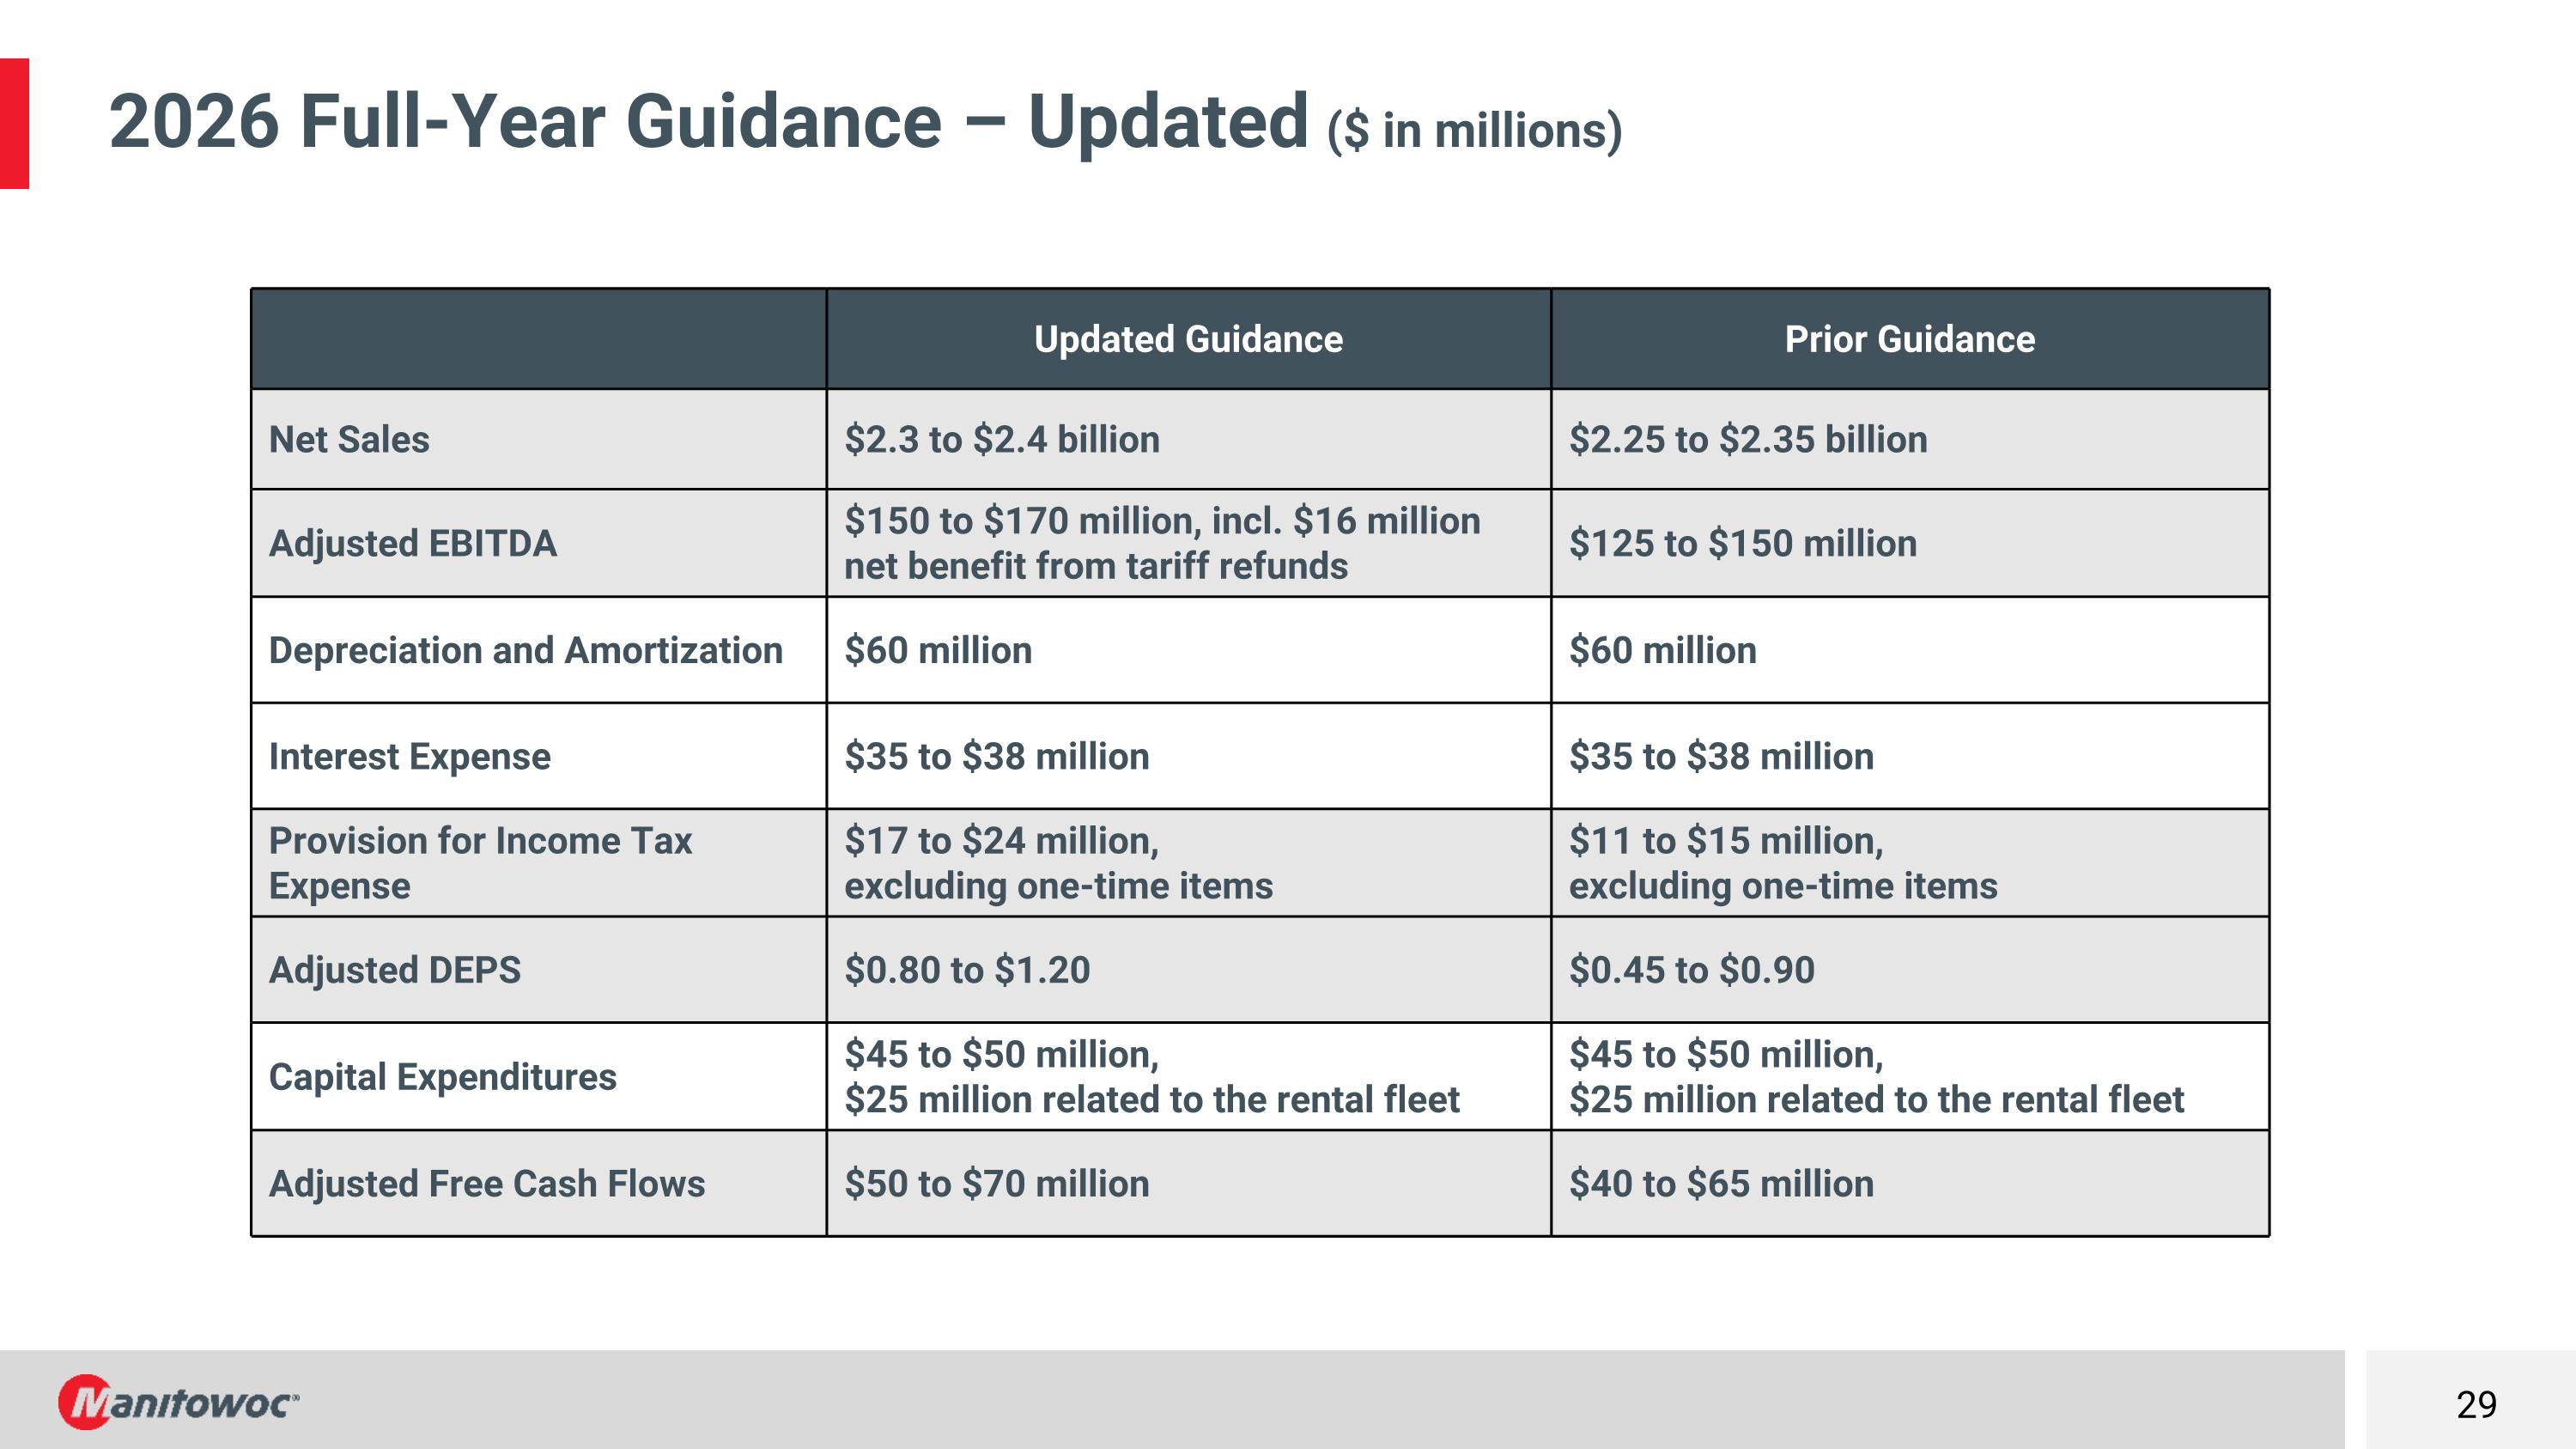
2026 Full-Year Guidance – Updated ($ in millions) Updated Guidance Prior Guidance Net Sales $2.3 to $2.4 billion $2.25 to $2.35 billion Adjusted EBITDA $150 to $170 million, incl. $16 million net benefit from tariff refunds $125 to $150 million Depreciation and Amortization $60 million $60 million Interest Expense $35 to $38 million $35 to $38 million Provision for Income Tax Expense $17 to $24 million, excluding one-time items $11 to $15 million, excluding one-time items Adjusted DEPS $0.80 to $1.20 $0.45 to $0.90 Capital Expenditures $45 to $50 million, $25 million related to the rental fleet $45 to $50 million, $25 million related to the rental fleet Adjusted Free Cash Flows $50 to $70 million $40 to $65 million
Additional information: Ion Warner – SVP Marketing & Investor Relations O +1 414-760-4805 M +1 717-414-1813 ion.warner@manitowoc.com www.manitowoc.com