S&P Global Reports Fourth Quarter and Full-Year 2024 Results
New York, NY, February 11, 2025 – S&P Global (NYSE: SPGI) today reported fourth quarter and full-year 2024 results. This earnings release and supplemental materials are available at http://investor.spglobal.com/Quarterly-Earnings.
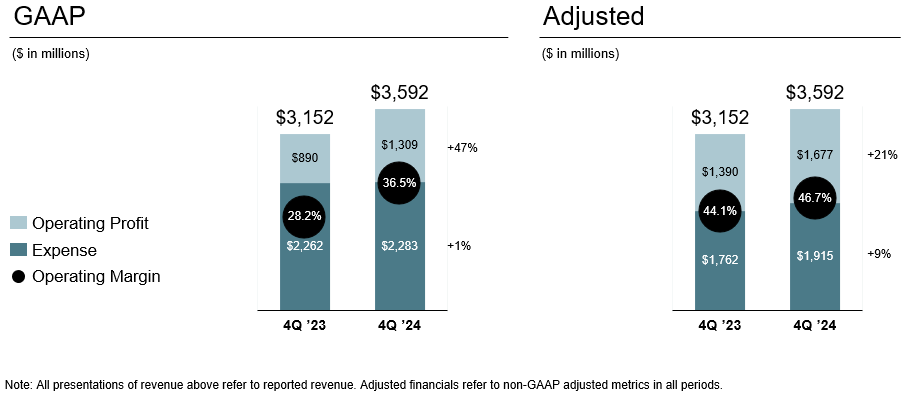
The Company reported fourth quarter 2024 reported revenue of $3.592 billion, an increase of 14% compared to the fourth quarter of 2023. Fourth quarter GAAP net income increased 52% to $880 million and GAAP diluted earnings per share increased 56% to $2.85 driven primarily by strong Ratings growth. Adjusted net income for the fourth quarter increased 18% to $1.163 billion and adjusted diluted earnings per share increased 20% to $3.77.
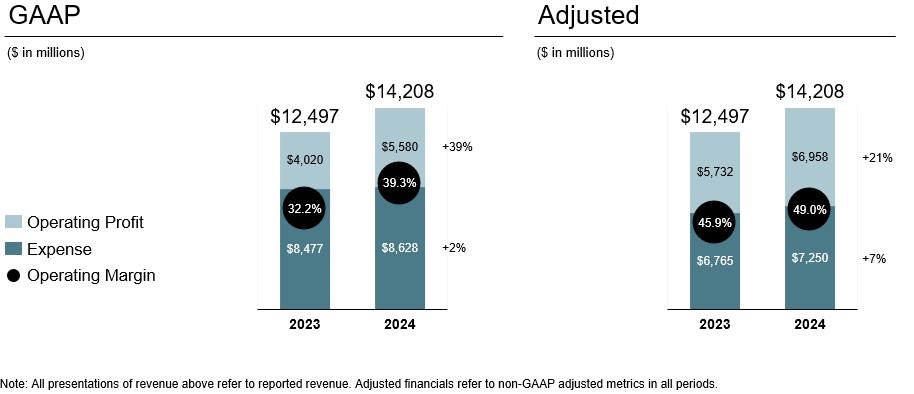
For the full year 2024, reported revenue increased 14% year over year to $14.208 billion. Excluding the impact of Engineering Solutions (divested in 2023), revenue growth would have been 15% year over year. 2024 GAAP net income increased 47% to $3.852 billion and GAAP diluted earnings per share increased 50% to $12.35, driven primarily by revenue and operating profit growth in the Company's Ratings division. 2024 adjusted net income increased 22% to $4.898 billion compared to 2023 adjusted net income, and adjusted diluted earnings per share increased 25% to $15.70 compared to 2023 adjusted diluted earnings per share.
•The Company successfully executed its leadership transition, with Martina Cheung assuming the role of President and CEO on November 1, 2024.
•The Company exceeded the high end of guidance for revenue growth, operating profit margin, and diluted earnings per share — on both a GAAP and adjusted basis.
•Vitality revenue, which is revenue from new or enhanced products, accounted for 11% of 2024 revenue.
•The Company returned more than $4.4 billion to shareholders in 2024, including $1.1 billion in dividends and $3.3 billion in share repurchases.
•2025 guidance calls for revenue growth of 5.0% - 7.0%, GAAP diluted EPS in the range of $14.20 - $14.45, and adjusted diluted EPS in the range of $17.00 - $17.25.
“I am pleased that S&P Global delivered an outstanding year in 2024. We reported revenue growth in all segments, as well as strong operating margin expansion and EPS growth for the company, exceeding our consolidated financial guidance on both a GAAP and adjusted basis.
We demonstrated the strength of our businesses and enter 2025 with strong momentum. As S&P Global’s new CEO, I have had hundreds of conversations with our customers and partners, who have reinforced the need for our benchmarks, data, and insights to guide their decisions in a constantly evolving market.
With this context, we are providing financial guidance highlighting our expectation for continued profitable growth in 2025."
Martina Cheung
President and CEO
Page 1
Fourth Quarter 2024 Revenue
Fourth quarter revenue increased 14%, driven by growth in all divisions. Revenue from subscription products increased 6%.
(1) Total revenue for the fourth quarter 2023 and the fourth quarter 2024 includes the impact of inter-segment eliminations of $47M and $48M, respectively
Fourth Quarter 2024 Operating Profit, Expense, and Operating Margin
The Company’s fourth quarter reported operating profit margin increased approximately 8 percentage points to 36.5%, primarily due to the increase in GAAP revenue. Adjusted operating profit margin increased 260 basis points to 46.7% primarily due to growth in our Ratings division.
Fourth Quarter 2024 Diluted Earnings Per Share
4Q '24
4Q '23
y/y change
GAAP Diluted EPS
$2.85
$1.83
56%
Adjusted Diluted EPS
$3.77
$3.13
20%
Fourth quarter GAAP diluted earnings per share increased 56% to $2.85 primarily due to a 52% increase in net income, and a 2% decrease in diluted shares outstanding. Adjusted diluted earnings per share increased 20% to $3.77 due to an 18% increase in adjusted net income and a 2% decrease in diluted shares outstanding. Currency positively impacted adjusted diluted EPS by $0.05. The largest non-core adjustments to earnings in the fourth quarter of 2024 were for deal-related amortization and restructuring costs.
Page 2
Full-Year 2024 Revenue
Full-year 2024 revenue increased 14%, driven by growth in all five divisions, led by Ratings. Excluding Engineering Solutions, full-year 2024 revenue would have increased 15%.
(1) Revenue in 2023 and 2024 includes the impact of inter-segment eliminations of $177M and $186M, respectively. Revenue in 2023 also includes contributions from Engineering Solutions of $133M.
Full-Year 2024 Operating Profit, Expense, and Operating Margin
The Company’s full-year reported operating margin increased by approximately 7 percentage points to 39.3%, and adjusted operating margin increased 310 basis points to 49.0%. Growth in both GAAP and adjusted operating margin was primarily driven by revenue growth in the Company's Ratings division.
Page 3
Full-Year 2024 Diluted Earnings Per Share
2024
2023
y/y change
GAAP Diluted EPS
$12.35
$8.23
50%
Adjusted Diluted EPS
$15.70
$12.60
25%
Full-year 2024 GAAP diluted earnings per share increased 50% to $12.35, primarily due growth in the Company's Ratings division.
Adjusted diluted earnings per share increased 25% to $15.70 compared to 2023, due to a 22% increase in adjusted net income and a 2% decrease in diluted shares outstanding. Currency positively impacted adjusted diluted EPS by $0.12. The largest non-core adjustments to earnings in 2024 were for deal-related amortization and restructuring costs.
Full-Year 2025 Outlook
GAAP
Adjusted
Revenue growth
5.0% - 7.0%
5.0% - 7.0%
Corporate unallocated expense
$230 - $240 million
$205 - $215 million
Deal-related amortization
~$1.13 billion
~$1.13 billion
Operating profit margin
41.5% - 42.5%
49.0% - 50.0%
Interest expense, net
$295 - $305 million
$320 - $330 million
Tax rate
21.0% - 22.0%
21.5% - 22.5%
Diluted EPS
$14.20 - $14.45
$17.00 - $17.25
Capital expenditures
$190 - $200 million
$190 - $200 million
In addition to the above, the Company expects 2025 cash provided by operating activities, less capital expenditures and distributions to noncontrolling interest holders, of ~$5.9 billion. The Company expects adjusted free cash flow, excluding certain items, of ~$6.0 billion.
Non-GAAP adjusted guidance excludes merger expenses and amortization of intangibles related to acquisitions.
Capital Return: For the full year 2025, the Company maintains its target of returning 85% or more of adjusted free cash flow to shareholders through dividends and share repurchases. The Board of Directors has authorized a quarterly cash dividend of $0.96, marking the 52nd consecutive year of dividend increases for the Company. Additionally, the Board has authorized the repurchase of shares totaling up to $4.3 billion. The Company expects to launch an initial $650 million Accelerated Share Repurchase (ASR) in the coming weeks.
Supplemental Information/Conference Call/Webcast Details: The Company’s senior management will review the fourth quarter and full year 2024 earnings results on a conference call scheduled for today, February 11, at 8:30 a.m. ET. Additional information presented on the conference call, as well as the Company’s Supplemental slide content, may be found on the Company’s Investor Relations Website at http://investor.spglobal.com/Quarterly-Earnings.
The Webcast will be available live and in replay at http://investor.spglobal.com/Quarterly-Earnings. (Please copy and paste URL into Web browser.)
Page 4
Telephone access is available. U.S. participants may call (888) 603-9623; international participants may call +1 (630) 395-0220 (long-distance charges will apply). The passcode is “S&P Global” and the conference leader is Martina Cheung. A recorded telephone replay will be available approximately two hours after the meeting concludes and will remain available until March 11, 2025. U.S. participants may call (866) 361-4944; international participants may call +1 (203) 369-0192 (long-distance charges will apply). No passcode is required.
Comparison of Adjusted Information to U.S. GAAP Information: The Company reports its financial results in accordance with accounting principles generally accepted in the United States ("GAAP"). The Company also refers to and presents certain additional non-GAAP financial measures, within the meaning of Regulation G under the Securities Exchange Act of 1934. These measures are: adjusted net income; adjusted diluted EPS; adjusted operating profit and margin; adjusted expenses; adjusted corporate unallocated expense; adjusted deal-related amortization; adjusted other (income) expense, net; adjusted interest expense, net; adjusted provision for income taxes; adjusted effective tax rate; and cash provided by operating activities, less capital expenditures and distributions to noncontrolling interest holders, free cash flow, and adjusted free cash flow excluding certain items.
The Company has included reconciliations of these non-GAAP financial measures to the most directly comparable financial measures calculated in accordance with GAAP on Exhibits 5, 7, and 8. The Company is not able to provide reconciliations of certain forward-looking non-GAAP financial measures to comparable GAAP measures because certain items required for such reconciliations are outside of the Company's control and/or cannot be reasonably predicted without unreasonable effort.
The Company's non-GAAP measures include adjustments that reflect how management views our businesses. The Company believes these non-GAAP financial measures provide useful supplemental information that, in the case of non-GAAP financial measures other than cash provided by operating activities, less capital expenditures and distributions to noncontrolling interest holders; free cash flow; and adjusted free cash flow excluding certain items, enables investors to better compare the Company's performance across periods, and management also uses these measures internally to assess the operating performance of its business, to assess performance for employee compensation purposes and to decide how to allocate resources. The Company believes that the presentation of cash provided by operating activities, less capital expenditures and distributions to noncontrolling interest holders; free cash flow; and adjusted free cash flow excluding certain items allows investors to evaluate the cash generated from our underlying operations in a manner similar to the method used by management and that such measures are useful in evaluating the cash available to us to prepay debt, make strategic acquisitions and investments, and repurchase stock. However, investors should not consider any of these non-GAAP measures in isolation from, or as a substitute for, the financial information that the Company reports.
Forward-Looking Statements: This press release contains “forward-looking statements,” as defined in the Private Securities Litigation Reform Act of 1995. These statements, which express management’s current views concerning future events, trends, contingencies or results, appear at various places in this press release and use words like “anticipate,” “assume,” “believe,” “continue,” “estimate,” “expect,” “forecast,” “future,” “intend,” “plan,” “potential,” “predict,” “project,” “strategy,” “target” and similar terms, and future or conditional tense verbs like “could,” “may,” “might,” “should,” “will” and “would.” For example, management may use forward-looking statements when addressing topics such as: the outcome of contingencies; future actions by regulators; changes in the Company’s business strategies and methods of generating revenue; the development and performance of the Company’s services and products; the expected impact of acquisitions and dispositions; the Company’s effective tax rates; and the Company’s cost structure, dividend policy, cash flows or liquidity.
Forward-looking statements are subject to inherent risks and uncertainties. Factors that could cause actual results to differ materially from those expressed or implied in forward-looking statements include, among other things:
▪worldwide economic, financial, political, and regulatory conditions (including slower GDP growth or recession, instability in the banking sector and inflation), and factors that contribute to uncertainty and volatility, natural and man-made disasters, civil unrest, public health crises (e.g., pandemics), geopolitical uncertainty (including military conflict), and conditions that may result from legislative, regulatory, trade and policy changes, including from the new U.S. administration;
▪the volatility and health of debt, equity, commodities, energy and automotive markets, including credit quality and spreads, the level of liquidity and future debt issuances, demand for investment products that track indices and assessments and trading volumes of certain exchange-traded derivatives;
▪the demand and market for credit ratings in and across the sectors and geographies where the Company operates;
Page 5
▪the Company’s ability to maintain adequate physical, technical and administrative safeguards to protect the security of confidential information and data, and the potential for a system or network disruption that results in regulatory penalties and remedial costs or improper disclosure of confidential information or data;
▪the outcome of litigation, government and regulatory proceedings, investigations and inquiries;
▪concerns in the marketplace affecting the Company’s credibility or otherwise affecting market perceptions of the integrity or utility of independent credit ratings, benchmarks, indices and other services;
▪the level of merger and acquisition activity in the United States and abroad;
▪the level of the Company’s future cash flows and capital investments;
▪the effect of competitive products (including those incorporating generative artificial intelligence ("AI")) and pricing, including the level of success of new product developments and global expansion;
▪the impact of customer cost-cutting pressures;
▪a decline in the demand for our products and services by our customers and other market participants;
▪our ability to develop new products or technologies, to integrate our products with new technologies (e.g., AI), or to compete with new products or technologies offered by new or existing competitors;
▪our ability to attract, incentivize and retain key employees, especially in a competitive business environment;
▪our ability to successfully navigate key organizational changes, including among our executive leadership;
▪the Company’s exposure to potential criminal sanctions or civil penalties for noncompliance with foreign and U.S. laws and regulations that are applicable in the jurisdictions in which it operates, including sanctions laws relating to countries such as Iran, Russia and Venezuela, anti-corruption laws such as the U.S. Foreign Corrupt Practices Act and the U.K. Bribery Act of 2010, and local laws prohibiting corrupt payments to government officials, as well as import and export restrictions;
▪the continuously evolving regulatory environment in Europe, the United States, and elsewhere around the globe affecting each of our businesses and the products they offer, and our compliance therewith;
▪the Company’s ability to make acquisitions and dispositions and successfully integrate the businesses we acquire;
▪consolidation of the Company’s customers, suppliers or competitors;
▪the introduction of competing products or technologies by other companies;
▪the ability of the Company, and its third-party service providers, to maintain adequate physical and technological infrastructure;
▪the Company’s ability to successfully recover from a disaster or other business continuity problem, such as an earthquake, hurricane, flood, civil unrest, protests, military conflict, terrorist attack, outbreak of pandemic or contagious diseases, security breach, cyber attack, data breach, power loss, telecommunications failure or other natural or man-made event;
▪the impact on the Company’s revenue and net income caused by fluctuations in foreign currency exchange rates; and
▪the impact of changes in applicable tax or accounting requirements on the Company.
The factors noted above are not exhaustive. The Company and its subsidiaries operate in a dynamic business environment in which new risks emerge frequently. Accordingly, the Company cautions readers not to place undue reliance on any forward-looking statements, which speak only as of the dates on which they are made. The Company undertakes no obligation to update or revise any forward-looking statement to reflect events or circumstances arising after the date on which it is made, except as required by applicable law. Further information about the Company’s businesses, including information about factors that could materially affect its results of operations and financial condition, is contained in the Company’s filings with the SEC, including Item 1A, Risk Factors in our most recently filed Annual Report on Form 10-K.
Page 6
About S&P Global
S&P Global (NYSE: SPGI) provides essential intelligence. We enable governments, businesses and individuals with the right data, expertise and connected technology so that they can make decisions with conviction. From helping our customers assess new investments to guiding them through sustainability and energy transition across supply chains, we unlock new opportunities, solve challenges and accelerate progress for the world.
We are widely sought after by many of the world’s leading organizations to provide credit ratings, benchmarks, analytics and workflow solutions in the global capital, commodity and automotive markets. With every one of our offerings, we help the world’s leading organizations plan for tomorrow, today.
Investor Relations: http://investor.spglobal.com
Contact:
Investor Relations:
Mark Grant
Senior Vice President, Investor Relations
Tel: +1 (347) 640-1521
mark.grant@spglobal.com
Media:
Christina Twomey
Chief Communications Officer
Tel: +1 (410) 382-3316
christina.twomey@spglobal.com
Josh Goldstein
Director, Communications
Tel: +1 (202) 383-2041
josh.goldstein@spglobal.com
###
Page 7
Exhibit 1
S&P Global
Condensed Consolidated Statements of Income
Periods ended December 31, 2024 and 2023
(dollars in millions, except per share data)
(unaudited)
Three Months
Twelve Months
2024
2023
% Change
2024
2023
% Change
Revenue
$
3,592
$
3,152
14%
$
14,208
$
12,497
14%
Expenses
2,333
2,264
3%
8,730
8,443
3%
(Gain) loss on dispositions, net
(38)
1
N/M
(59)
70
N/M
Equity in income on unconsolidated subsidiaries
(12)
(3)
N/M
(43)
(36)
20%
Operating profit
1,309
890
47%
5,580
4,020
39%
Other (income) expense, net
(14)
19
N/M
(25)
15
N/M
Interest expense, net
69
76
(9)%
297
334
(11)%
Income before taxes on income
1,254
795
58%
5,308
3,671
45%
Provision for taxes on income
287
151
90%
1,141
778
47%
Net income
967
644
50%
4,167
2,893
44%
Less: net income attributable to noncontrolling interests
(87)
(65)
(33)%
(315)
(267)
(18)%
Net income attributable to S&P Global Inc.
$
880
$
579
52%
$
3,852
$
2,626
47%
Earnings per share attributable to S&P Global Inc. common shareholders:
Net income:
Basic
$
2.85
$
1.84
56%
$
12.36
$
8.25
50%
Diluted
$
2.85
$
1.83
56%
$
12.35
$
8.23
50%
Weighted-average number of common shares outstanding:
Basic
308.5
315.4
311.6
318.4
Diluted
308.9
315.9
311.9
318.9
Actual shares outstanding at year end
307.8
314.1
N/M - Represents a change equal to or in excess of 100% or not meaningful.
Note - % change in the tables throughout the exhibits are calculated off of the actual number, not the rounded number presented.
Exhibit 2
S&P Global
Condensed Consolidated Balance Sheets
December 31, 2024 and 2023
(dollars in millions)
(unaudited)
2024
2023
Assets:
Cash, cash equivalents, and restricted cash
$
1,666
$
1,291
Other current assets
3,793
3,852
Total current assets
5,459
5,143
Property and equipment, net
265
258
Right of use assets
413
379
Goodwill and other intangible assets, net
51,473
52,248
Equity investments in unconsolidated subsidiaries
1,774
1,787
Other non-current assets
837
774
Total assets
$
60,221
$
60,589
Liabilities and Equity:
Short-term debt
$
4
$
47
Unearned revenue
3,694
3,461
Other current liabilities
2,694
2,617
Long-term debt
11,394
11,412
Lease liabilities — non-current
535
541
Deferred tax liability — non-current
3,397
3,690
Pension, other postretirement benefits and other non-current liabilities
995
721
Total liabilities
22,713
22,489
Redeemable noncontrolling interest
4,252
3,800
Total equity
33,256
34,300
Total liabilities and equity
$
60,221
$
60,589
Exhibit 3
S&P Global
Condensed Consolidated Statements of Cash Flows
Years ended December 31, 2024 and 2023
(dollars in millions)
(unaudited)
2024
2023
Operating Activities:
Net income
$
4,167
$
2,893
Adjustments to reconcile net income to cash provided by operating activities:
Depreciation
96
101
Amortization of intangibles
1,077
1,042
Deferred income taxes
(323)
(381)
Stock-based compensation
247
171
(Gain) loss on dispositions, net
(59)
70
Other
249
274
Net changes in other operating assets and liabilities
235
(460)
Cash provided by operating activities
5,689
3,710
Investing Activities:
Capital expenditures
(124)
(143)
Acquisitions, net of cash acquired
(305)
(296)
Proceeds from dispositions
168
1,014
Changes in short-term investments
6
(13)
Cash (used for) provided by investing activities
(255)
562
Financing Activities:
Payments on short-term debt, net
—
(188)
Proceeds from issuance of senior notes, net
—
744
Payments on senior notes
(47)
—
Dividends paid to shareholders
(1,134)
(1,147)
Distributions to noncontrolling interest holders
(287)
(280)
Repurchase of treasury shares
(3,301)
(3,301)
Contingent consideration payments, employee withholding tax on share-based payments, excise tax payments on share repurchases and other
(229)
(108)
Cash used for financing activities
(4,998)
(4,280)
Effect of exchange rate changes on cash
(61)
12
Net change in cash, cash equivalents, and restricted cash
375
4
Cash, cash equivalents, and restricted cash at beginning of year
1,291
1,287
Cash, cash equivalents, and restricted cash at end of year
$
1,666
$
1,291
Exhibit 4
S&P Global
Operating Results by Segment
Periods ended December 31, 2024 and 2023
(dollars in millions)
(unaudited)
Three Months
Twelve Months
Revenue
Revenue
2024
2023
% Change
2024
2023
% Change
Market Intelligence
$
1,186
$
1,127
5%
$
4,645
$
4,376
6%
Ratings
1,062
838
27%
4,370
3,332
31%
Commodity Insights
545
497
10%
2,142
1,946
10%
Mobility
411
377
9%
1,609
1,484
8%
Indices
436
360
21%
1,628
1,403
16%
Engineering Solutions
—
—
N/M
—
133
N/M
Intersegment Elimination
(48)
(47)
(2)%
(186)
(177)
(5)%
Total revenue
$
3,592
$
3,152
14%
$
14,208
$
12,497
14%
Expenses
Expenses
2024
2023
% Change
2024
2023
% Change
Market Intelligence (a)
$
960
$
1,012
(5)%
$
3,770
$
3,662
3%
Ratings (b)
435
396
10%
1,663
1,468
13%
Commodity Insights (c)
343
320
7%
1,297
1,242
4%
Mobility (d)
346
331
4%
1,297
1,224
6%
Indices (e)
149
133
12%
525
478
10%
Engineering Solutions (f)
—
—
N/M
—
114
N/M
Corporate Unallocated expense (g)
110
120
(9)%
305
502
(39)%
Equity in Income on Unconsolidated Subsidiaries (h)
(12)
(3)
N/M
(43)
(36)
(20)%
Intersegment Elimination
(48)
(47)
(2)%
(186)
(177)
(5)%
Total expenses
$
2,283
$
2,262
1%
$
8,628
$
8,477
2%
Operating Profit
Operating Profit
2024
2023
% Change
2024
2023
% Change
Market Intelligence (a)
$
226
$
115
95%
$
875
$
714
22%
Ratings (b)
627
442
42%
2,707
1,864
45%
Commodity Insights (c)
202
177
14%
845
704
20%
Mobility (d)
65
46
41%
312
260
20%
Indices (e)
287
227
26%
1,103
925
19%
Engineering Solutions (f)
—
—
N/M
—
19
N/M
Total reportable segments
1,407
1,007
40%
5,842
4,486
30%
Corporate Unallocated expense (g)
(110)
(120)
9%
(305)
(502)
39%
Equity in Income on Unconsolidated Subsidiaries (h)
12
3
N/M
43
36
20%
Total operating profit
$
1,309
$
890
47%
$
5,580
$
4,020
39%
N/M - Represents a change equal to or in excess of 100% or not meaningful.
Exhibit 4
(a) The three and twelve months ended December 31, 2024 include employee severance charges of $42 million and $77 million, respectively, gain on dispositions of $38 million and $59 million, respectively, IHS Markit merger costs of $7 million and $36 million, respectively, a net acquisition-related benefit of $4 million and $12 million, respectively, and Executive Leadership Team transition costs of $3 million. The three months ended December 31, 2024 include a liability write-off of $1 million. The three and twelve months ended December 31, 2023 include acquisition-related costs of $69 million, employee severance charges of $49 million and $90 million, respectively, and IHS Markit merger costs of $12 million and $49 million, respectively. The twelve months ended December 31, 2023 include a gain on disposition of $46 million, an asset impairment of $5 million and an asset write-off of $1 million. Additionally, amortization of intangibles from acquisitions of $152 million and $140 million is included for the three months ended December 31, 2024 and 2023, respectively, and $591 million and $561 million for the twelve months ended December 31, 2024 and 2023, respectively.
(b) The three and twelve months ended December 31, 2024 include employee severance charges of $3 million and $5 million, respectively. The twelve months ended December 31, 2024 include legal settlement costs of $20 million and a statutorily required bonus accrual adjustment of $6 million. The three and twelve months ended December 31, 2023 include employee severance charges of $2 million and $10 million, respectively, and an asset impairment of $1 million. Additionally, amortization of intangibles from acquisitions of $3 million and $2 million is included for the three months ended December 31, 2024 and 2023, respectively, and $14 million and $8 million for the twelve months ended December 31, 2024 and 2023, respectively.
(c) The three and twelve months ended December 31, 2024 include employee severance charges of $9 million and $13 million, respectively, and IHS merger costs of $1 million and $14 million, respectively. The twelve months ended December 31, 2024 include an asset write-off of $1 million and disposition-related costs of $1 million. The three and twelve months ended December 31, 2023 include IHS Markit merger costs of $6 million and $35 million, respectively, employee severance charges of $4 million and $26 million, respectively, and acquisition-related costs of $2 million. Additionally, amortization of intangibles from acquisitions of $33 million and $32 million is included for the three months ended December 31, 2024 and 2023, respectively, and $130 million and $131 million for the twelve months ended December 31, 2024 and 2023, respectively.
(d) The three and twelve months ended December 31, 2024 include IHS Markit merger costs of $1 million and $4 million, respectively, acquisition-related costs of $1 million and $2 million, respectively, and a liability write-off of $1 million. The twelve months ended December 31, 2024 include employee severance charges of $7 million. The three and twelve months ended December 31, 2023 include employee severance charges of $3 million and $9 million, respectively, IHS Markit merger costs of $1 million and $3 million, respectively, and acquisition-related costs of $1 million and $2 million, respectively. Additionally, amortization of intangibles from acquisitions of $76 million is included for the three months ended December 31, 2024 and 2023, and $303 million and $301 million for the twelve months ended December 31, 2024 and 2023, respectively.
(e) The twelve months ended December 31, 2024 include IHS Markit merger costs of $4 million, a loss on disposition of $1 million and employee severance charges of $1 million. The three and twelve months ended December 31, 2023 include employee severance charges of $2 million and $5 million, respectively, and IHS Markit merger costs of $1 million and $4 million, respectively. The twelve months ended December 31, 2023 include a gain on disposition of $4 million. Additionally, amortization of intangibles from acquisitions of $9 million is included for the three months ended December 31, 2024 and 2023, and $36 million for the twelve months ended December 31, 2024 and 2023.
(f) Amortization of intangibles from acquisitions of $1 million is included for the twelve months ended December 31, 2023.
(g) The three and twelve months ended December 31, 2024 include employee severance charges of $22 million and $24 million, respectively, IHS Markit merger costs of $21 million and $75 million, respectively, disposition-related costs of $6 million and $8 million, respectively, Executive Leadership Team transition costs of $5 million, lease impairments of $3 million and $1 million, respectively, and a net acquisition-related benefit and cost of $1 million and $8 million, respectively. The twelve months ended December 31, 2024 include a gain on disposition of $2 million and an asset write-off of $1 million. The three and twelve months ended December 31, 2023 include IHS Markit merger costs of $43 million and $147 million, respectively, employee severance charges of $23 million and $43 million, respectively, disposition-related costs of $5 million and $24 million, respectively, acquisition-related costs of $1 million and $4 million, respectively, and lease impairments of $1 million and $14 million, respectively. The twelve months ended December 31, 2023 include a loss on disposition of $120 million. Additionally, amortization of intangibles from acquisitions of $1 million is included for the three months ended December 31, 2024 and 2023, and $3 million for the twelve months ended December 31, 2024 and 2023.
(h) The three and twelve months ended December 31, 2023 include an asset impairment of $2 million. Amortization of intangibles from acquisitions of $14 million is included for the three months ended December 31, 2024 and 2023, and $56 million for the twelve months ended December 31, 2024 and 2023.
Exhibit 5
S&P Global
Operating Results - Reported vs. Adjusted
Non-GAAP Financial Information
Three and twelve months ended December 31, 2024 and 2023
(dollars in millions, except per share amounts)
Adjusted Expenses
(unaudited)
Three Months
Twelve Months
2024
2023
% Change
2024
2023
% Change
Market Intelligence
Expenses
$
960
$
1,012
(5)%
$
3,770
$
3,662
3%
Non-GAAP adjustments (a)
(9)
(130)
(46)
(168)
Deal-related amortization
(152)
(140)
(591)
(561)
Adjusted expenses
$
799
$
741
8%
$
3,133
$
2,933
7%
Ratings
Expenses
$
435
$
396
10%
1,663
$
1,468
13%
Non-GAAP adjustments (b)
(4)
(4)
(32)
(11)
Deal-related amortization
(3)
(2)
(14)
(8)
Adjusted expenses
$
428
$
391
10%
$
1,617
$
1,449
12%
Commodity Insights
Expenses
$
343
$
320
7%
1,297
$
1,242
4%
Non-GAAP adjustments (c)
(10)
(11)
(28)
(62)
Deal-related amortization
(33)
(32)
(130)
(131)
Adjusted expenses
$
300
$
277
9%
$
1,139
$
1,049
9%
Mobility
Expenses
$
346
$
331
4%
$
1,297
$
1,224
6%
Non-GAAP adjustments (d)
(2)
(5)
(12)
(15)
Deal-related amortization
(76)
(76)
(303)
(301)
Adjusted expenses
$
268
$
250
7%
$
982
$
908
8%
Indices
Expenses
$
149
$
133
12%
$
525
$
478
10%
Non-GAAP adjustments (e)
—
(2)
(6)
(5)
Deal-related amortization
(9)
(9)
(36)
(36)
Adjusted expenses
$
140
$
122
15%
$
483
$
436
11%
Engineering Solutions
Expenses
$
—
$
—
N/M
$
—
$
114
N/M
Deal-related amortization
—
—
—
(1)
Adjusted expenses
$
—
$
—
N/M
$
—
$
113
N/M
Corporate Unallocated Expense
Corporate Unallocated expense
$
110
$
120
(9)%
$
305
$
502
(39)%
Non-GAAP adjustments (f)
(55)
(72)
(121)
(352)
Deal-related amortization
(1)
(1)
(3)
(3)
Adjusted Corporate Unallocated expenses
$
54
$
47
13%
$
181
$
147
23%
Equity in Income on Unconsolidated Subsidiaries
Equity in income on unconsolidated subsidiaries
$
(12)
$
(3)
N/M
$
(43)
$
(36)
(20)%
Non-GAAP adjustments (g)
—
(2)
—
(2)
Deal-related amortization
(14)
(14)
(56)
(56)
Adjusted equity in income on unconsolidated subsidiaries
$
(26)
$
(18)
(43)%
$
(99)
$
(93)
(6)%
Total SPGI
Expenses
$
2,283
$
2,262
1%
$
8,628
$
8,477
2%
Non-GAAP adjustments (a)(b)(c)(d)(e)(f)(g)
(80)
(226)
(245)
(615)
Deal-related amortization
(288)
(273)
(1,133)
(1,097)
Adjusted expenses
$
1,915
$
1,762
9%
$
7,250
$
6,765
7%
Exhibit 5
Adjusted Operating Profit
(unaudited)
Three Months
Twelve Months
2024
2023
% Change
2024
2023
% Change
Market Intelligence
Operating profit
$
226
$
115
95%
$
875
$
714
22%
Non-GAAP adjustments (a)
9
130
46
168
Deal-related amortization
152
140
591
561
Adjusted operating profit
$
387
$
386
—%
$
1,512
$
1,443
5%
Ratings
Operating profit
$
627
$
442
42%
$
2,707
$
1,864
45%
Non-GAAP adjustments (b)
4
4
32
11
Deal-related amortization
3
2
14
8
Adjusted operating profit
$
634
$
447
42%
$
2,753
$
1,882
46%
Commodity Insights
Operating profit
$
202
$
177
14%
$
845
$
704
20%
Non-GAAP adjustments (c)
10
11
28
62
Deal-related amortization
33
32
130
131
Adjusted operating profit
$
245
$
220
11%
$
1,003
$
897
12%
Mobility
Operating profit
$
65
$
46
41%
$
312
$
260
20%
Non-GAAP adjustments (d)
2
5
12
15
Deal-related amortization
76
76
303
301
Adjusted operating profit
$
143
$
127
12%
$
627
$
576
9%
Indices
Operating profit
$
287
$
227
26%
$
1,103
$
925
19%
Non-GAAP adjustments (e)
—
2
6
5
Deal-related amortization
9
9
36
36
Adjusted operating profit
$
296
$
238
24%
$
1,145
$
967
18%
Engineering Solutions
Operating profit
$
—
$
—
N/M
$
—
$
19
N/M
Deal-related amortization
—
—
—
1
Adjusted operating profit
$
—
$
—
N/M
$
—
$
20
N/M
Total Segments
Operating profit
$
1,407
$
1,007
40%
$
5,842
$
4,486
30%
Non-GAAP adjustments s (a) (b) (c)(d) (e)
25
152
124
261
Deal-related amortization
273
259
1,074
1,039
Adjusted operating profit
$
1,705
$
1,419
20%
$
7,040
$
5,786
22%
Corporate Unallocated Expense
Corporate unallocated expense
$
(110)
$
(120)
9%
$
(305)
$
(502)
39%
Non-GAAP adjustments (f)
55
72
121
352
Deal-related amortization
1
1
3
3
Adjusted corporate unallocated expense
$
(54)
$
(47)
(13)%
$
(181)
$
(147)
(23)%
Exhibit 5
(unaudited)
Three Months
Twelve Months
2024
2023
% Change
2024
2023
% Change
Equity in Income on Unconsolidated Subsidiaries
Equity in income on unconsolidated subsidiaries
$
12
$
3
N/M
$
43
$
36
20%
Non-GAAP adjustments (g)
—
2
—
2
Deal-related amortization
14
14
56
56
Adjusted equity in income on unconsolidated subsidiaries
1 The adjusted effective tax rate is calculated by dividing adjusted provision for income taxes by the adjusted income before taxes, which includes income from unconsolidated subsidiaries. The adjusted effective tax rate excluding income from unconsolidated subsidiaries for the three months ended December 31, 2024 and 2023 was 23.3% and 20.0%, respectively. The adjusted effective tax rate excluding income from unconsolidated subsidiaries for the twelve months ended December 31, 2024 and 2023 was 22.1% and 20.7%, respectively.
Adjusted Net Income attributable to SPGI and Diluted EPS
(unaudited)
2024
2023
% Change
Net Income attributable to SPGI
Diluted EPS
Net Income attributable to SPGI
Diluted EPS
Net Income attributable to SPGI
Diluted EPS
Three Months
Reported
$
880
$
2.85
$
579
$
1.83
52%
56%
Non-GAAP adjustments
61
0.20
202
0.64
Deal-related amortization
222
0.72
208
0.66
Adjusted
$
1,163
$
3.77
$
988
$
3.13
18%
20%
Twelve Months
Reported *
$
3,852
$
12.35
$
2,626
$
8.23
47%
50%
Non-GAAP adjustments
185
0.59
560
1.75
Deal-related amortization
861
2.76
833
2.61
Adjusted
$
4,898
$
15.70
$
4,019
$
12.60
22%
25%
N/M - Represents a change equal to or in excess of 100% or not meaningful
Note - Totals presented may not sum due to rounding.
Note - Operating profit margin for Market Intelligence, Ratings, Commodity Insights, Mobility and Indices was 19%, 59%, 37%, 16% and 66%, respectively, for the three months ended December 31, 2024. Operating profit margin for the Company was 36% for the three months ended December 31, 2024. Operating profit margin for Market Intelligence, Ratings, Commodity Insights, Mobility and Indices was 19%, 62%, 39%, 19% and 68% for the twelve months ended December 31, 2024. Operating profit margin for the Company was 39% for the twelve months ended December 31, 2024. Adjusted operating profit margin for Market Intelligence, Ratings, Commodity Insights, Mobility and Indices was 33%, 60%, 45%, 35% and 68%, respectively, for the three months ended December 31, 2024. Adjusted operating profit margin for the Company was 47% for the three months ended December 31, 2024. Adjusted operating profit margin for Market Intelligence, Ratings, Commodity Insights, Mobility and Indices was 33%, 63%, 47%, 39% and 70% for the twelve months ended December 31, 2024. Adjusted operating profit margin for the Company was 49% for the twelve months ended December 31, 2024. Adjusted operating profit margin is calculated as adjusted operating profit divided by revenue.
(a) The three and twelve months ended December 31, 2024 include employee severance charges of $42 million ($31 million after-tax) and $77 million ($58 million after-tax), respectively, gain on dispositions of $38 million ($27 million after-tax) and $59 million ($39 million after-tax), respectively, IHS Markit merger costs of $7 million ($5 million after-tax) and $36 million ($27 million after-tax), respectively, a net acquisition-related benefit of $4 million ($3 million after-tax) and $12 million ($11 million after-tax), respectively, and Executive Leadership Team transition costs of $3 million ($2 million after-tax). The three months ended December 31, 2024 include a liability write-off of $1 million ($1 million after-tax). The three and twelve months ended December 31, 2023 include acquisition-related costs of $69 million ($69 million after-tax), employee severance charges of $49 million ($37 million after-tax) and $90 million ($67 million after-tax), respectively, and IHS Markit merger costs of $12 million ($10 million after-tax) and $49 million ($37 million after-tax), respectively. The twelve months ended December 31, 2023 include a gain on disposition of $46 million ($34 million after-tax), an asset impairment of $5 million ($4 million after-tax) and an asset write off of $1 million (less than $1 million after-tax).
Exhibit 5
(b) The three and twelve months ended December 31, 2024 include employee severance charges of $3 million ($3 million after- tax) and $5 million ($4 million after-tax), respectively. The twelve months ended December 31, 2024 include legal settlement costs of $20 million ($20 million after-tax) and a statutorily required bonus accrual adjustment of $6 million ($5 million after-tax). The three and twelve months ended December 31, 2023 include employee severance charges of $2 million ($2 million after-tax) and $10 million ($8 million after-tax), respectively, and an asset impairment of $1 million ($1 million after-tax).
(c) The three and twelve months ended December 31, 2024 include employee severance charges of $9 million ($7 million after-tax) and $13 million ($10 million after-tax), respectively, and IHS Markit merger costs of $1 million ($1 million after-tax) and $14 million ($10 million after-tax), respectively. The twelve months ended December 31, 2024 include an asset write-off of $1 million ($1 million after-tax) and disposition-related costs of $1 million ($1 million after-tax). The three and twelve months ended December 31, 2023 include IHS Markit merger costs of $6 million ($5 million after-tax) and $35 million ($26 million after-tax), respectively, employee severance charges of $4 million ($3 million after- tax) and $26 million ($20 million after-tax), respectively, and acquisition-related costs of $2 million ($2 million after-tax).
(d) The three and twelve months ended December 31, 2024 include IHS Markit merger costs of $1 million ($1 million after-tax) and $4 million ($3 million after-tax), respectively, acquisition-related costs of $1 million ($1 million after-tax) and $2 million ($2 million after-tax), respectively, and a liability write-off of $1 million (less than $1 million after-tax). The twelve months ended December 31, 2024 include employee severance charges of $7 million ($5 million after-tax). The three and twelve months ended December 31, 2023 include employee severance charges of $3 million ($2 million after-tax) and $9 million ($7 million after-tax), respectively, IHS Markit merger costs of $1 million ($1 million after-tax) and $3 million ($2 million after-tax), respectively, and acquisition-related costs of $1 million ($1 million after-tax) and $2 million ($2 million after-tax), respectively.
(e) The twelve months ended December 31, 2024 include IHS Markit merger costs of $4 million ($3 million after-tax), a loss on disposition of $1 million ($1 million after-tax) and employee severance charges of $1 million ($1 million after-tax). The three and twelve months ended December 31, 2023 include employee severance charges of $2 million ($1 million after-tax) and $5 million ($4 million after-tax), respectively, and IHS Markit merger costs of $1 million (less than $1 million after-tax) and $4 million ($3 million after-tax), respectively. The twelve months ended December 31, 2023 include a gain on disposition of $4 million ($3 million after-tax).
(f) The three and twelve months ended December 31, 2024 include employee severance charges of $22 million ($17 million after-tax) and $24 million ($19 million after-tax), respectively, IHS Markit merger costs of $21 million ($16 million after-tax) and $75 million ($56 million after-tax), respectively, disposition-related costs of $6 million ($6 million after-tax) and $8 million ($8 million after-tax), respectively, Executive Leadership Team transition costs of $5 million ($5 million after-tax), lease impairments of $3 million ($2 million after- tax) and $1 million ($1 million after-tax), respectively, and a net acquisition-related benefit and cost of $1 million (less than $1 million after-tax) and $8 million ($8 million after-tax), respectively. The twelve months ended December 31, 2024 include a gain on disposition of $2 million ($1 million after-tax) and an asset write-off of $1 million ($1 million after-tax). The three and twelve months ended December 31, 2023 include IHS Markit merger costs of $43 million ($33 million after-tax) and $147 million ($111 million after-tax), respectively, employee severance charges of $23 million ($18 million after-tax) and $43 million ($33 million after-tax), respectively, disposition-related costs of $5 million ($4 million after-tax) and $24 million ($21 million after-tax), respectively, acquisition-related costs of $1 million ($1 million after-tax) and $4 million ($3 million after-tax), respectively, and lease impairments of $1 million ($1 million after-tax) and $14 million ($10 million after-tax), respectively. The twelve months ended December 31, 2023 include a loss on disposition of $120 million ($183 million after-tax).
(g) The three and twelve months ended December 31, 2023 include an asset impairment of $2 million ($2 million after-tax).
(h) The three and twelve months ended December 31, 2024 include a premium amortization benefit of $6 million ($5 million after-tax) and $26 million ($20 million after-tax), respectively. The three and twelve months ended December 31, 2023 include a premium amortization benefit of $7 million ($5 million after-tax) and $27 million ($20 million after-tax), respectively.
(i) The three and twelve months ended December 31, 2024 include a tax expense of $1 million due to annualized effective tax rate differences for GAAP and $6 million associated with IHS Markit prior to acquisition, respectively. The twelve months ended December 31, 2023 include a tax benefit of $16 million associated with a disposition.
Exhibit 6
S&P Global
Revenue Information
Three and twelve months ended December 31, 2024 and 2023
(dollars in millions)
Revenue by Type
(unaudited)
Three Months
Subscription (a)
Non-subscription / Transaction (b)
Non-transaction (c)
2024
2023
% Change
2024
2023
% Change
2024
2023
% Change
Market Intelligence
$
989
$
953
4%
48
50
(4)%
$
—
$
—
N/M
Ratings
—
—
N/M
521
338
54%
541
500
8%
Commodity Insights
486
446
9%
33
28
18%
—
—
N/M
Mobility
333
299
11%
78
78
—%
—
—
N/M
Indices
74
71
5%
—
—
N/M
—
—
N/M
Engineering Solutions
—
—
N/M
—
—
N/M
—
—
N/M
Intersegment elimination
—
—
N/M
—
—
N/M
(48)
(47)
(2)%
Total revenue
$
1,882
$
1,769
6%
$
680
$
494
38%
$
493
$
453
9%
Asset-linked fees (d)
Sales usage-based royalties (e)
Recurring variable (f)
2024
2023
% Change
2024
2023
% Change
2024
2023
% Change
Market Intelligence
$
—
$
—
N/M
$
—
$
—
N/M
$
149
$
124
20%
Ratings
—
—
N/M
—
—
N/M
—
—
N/M
Commodity Insights
—
—
N/M
26
23
16%
—
—
N/M
Mobility
—
—
N/M
—
—
N/M
—
—
N/M
Indices
291
221
31%
71
68
4%
—
—
N/M
Engineering Solutions
—
—
N/M
—
—
N/M
—
—
N/M
Total revenue
$
291
$
221
31%
$
97
$
91
7%
$
149
$
124
20%
Twelve Months
Subscription (a)
Non-subscription / Transaction (b)
Non-transaction (c)
2024
2023
% Change
2024
2023
% Change
2024
2023
% Change
Market Intelligence
$
3,882
$
3,685
5%
$
184
$
187
(2)%
$
—
$
—
N/M
Ratings
—
—
N/M
2,326
1,425
63%
2,044
1,907
7%
Commodity Insights
1,873
1,707
10%
166
158
5%
—
—
N/M
Mobility
1,299
1,169
11%
310
315
(2)%
—
—
N/M
Indices
292
277
6%
—
—
N/M
—
—
N/M
Engineering Solutions
—
125
N/M
—
8
N/M
—
—
N/M
Intersegment elimination
—
—
N/M
—
—
N/M
(186)
(177)
(5)%
Total revenue
$
7,346
$
6,963
5%
$
2,986
$
2,093
43%
$
1,858
$
1,730
7%
Asset-linked fees (d)
Sales usage-based royalties (e)
Recurring variable (f)
2024
2023
% Change
2024
2023
% Change
2024
2023
% Change
Market Intelligence
$
—
$
—
N/M
$
—
$
—
N/M
$
579
$
504
15%
Ratings
—
—
N/M
—
—
N/M
—
—
N/M
Commodity Insights
—
—
N/M
103
81
27%
—
—
N/M
Mobility
—
—
N/M
—
—
N/M
—
—
N/M
Indices
1,046
859
22%
290
267
9%
—
—
N/M
Engineering Solutions
—
—
N/M
—
—
N/M
—
—
N/M
Total revenue
$
1,046
$
859
22%
$
393
$
348
13%
$
579
$
504
15%
Exhibit 6
N/M - Represents a change equal to or in excess of 100% or not meaningful.
(a) Subscription revenue is primarily derived from distribution of data, valuation services, analytics, third party research, and credit ratings-related information through both feed and web-based channels, market data and market insights along with other information products and software term licenses, and Mobility’s core information products.
(b) Non-subscription / transaction revenue is primarily related to ratings of publicly-issued debt and bank loan ratings.
(c) Non-transaction revenue is primarily related to surveillance of a credit rating, annual fees for customer relationship-based pricing programs, fees for entity credit ratings and global research and analytics at Crisil. Non-transaction revenue also includes an intersegment revenue elimination charged to Market Intelligence for the rights to use and distribute content and data developed by Ratings.
(d) Asset-linked fees is primarily related to fees based on assets underlying exchange-traded funds, mutual funds and insurance products.
(e) Sales usage-based royalty revenue is primarily related to trading based fees from exchange-traded derivatives and licensing proprietary market price data and price assessments to commodity exchanges.
(f) Recurring variable revenue represents revenue from contracts for services that specify a fee based on, among other factors, the number of trades processed, assets under management, or the number of positions valued.
Exhibit 7
S&P Global
Non-GAAP Financial Information
Three and twelve months ended December 31, 2024 and 2023