ANNUAL REPORT PURSUANT TO SECTION 13 OR 15(d) OF THE SECURITIES EXCHANGE ACT OF 1934
For the fiscal year ended December 31, 2025
OR
☐
TRANSITION REPORT PURSUANT TO SECTION 13 OR 15(d) OF THE SECURITIES EXCHANGE ACT OF 1934
For the transition period from to
Commission File Number 1-1023
S&P Global Inc.
(Exact name of registrant as specified in its charter)
New York
13-1026995
(State or other jurisdiction of incorporation or organization)
(I.R.S. Employer Identification No.)
55 Water Street
,
New York
,
New York
10041
(Address of principal executive offices)
(Zip Code)
Registrant’s telephone number, including area code: 212-438-1000
Securities registered pursuant to Section 12(b) of the Act
Title of each class
Trading Symbol
Name of exchange on which registered
Common Stock — $1 par value
SPGI
New York Stock Exchange
Securities registered pursuant to Section 12(g) of the Act: None
Indicate by check mark if the Registrant is a well-known seasoned issuer, as defined in Rule 405 of the Securities Act.
Yes☑ No ☐
Indicate by check mark if the Registrant is not required to file reports pursuant to Section 13 or Section 15(d) of the Act.
Yes ☐No☑
Indicate by check mark whether the Registrant (1) has filed all reports required to be filed by Section 13 or 15 (d) of the Securities Exchange Act of 1934 during the preceding 12 months (or for such shorter period that the Registrant was required to file such reports), and (2) has been subject to such filing requirements for the past 90 days.
Yes☑ No ☐
Indicate by check mark whether the Registrant has submitted electronically every Interactive Date File required to be submitted pursuant to Rule 405 of Regulation S-T (§232.405 of this chapter) during the preceding 12 months (or for such shorter period that the Registrant was required to submit such files).
Yes☑ No ☐
Indicate by check mark whether the Registrant is a large accelerated filer, an accelerated filer, a non-accelerated filer, a smaller reporting company or an emerging growth company. See the definitions of “large accelerated filer,” “accelerated filer,” “smaller reporting company,” and “emerging growth company” in Rule 12b-2 of the Exchange Act. (Check one):
☑
Large accelerated filer
☐
Accelerated filer
☐
Non-accelerated filer
☐
Smaller reporting company
☐
Emerging growth company
Table of Contents
If an emerging growth company, indicate by check mark if the registrant has elected not to use the extended transition period for complying with any new or revised accounting standards provided pursuant to Section 13(a) of the Exchange Act. ☐
Indicate by check mark whether the registrant has filed a report on and attestation to its management’s assessment of
the effectiveness of its internal control over financial reporting under Section 404(b) of the Sarbanes-Oxley Act (15 U.S.C.
7262(b)) by the registered public accounting firm that prepared or issued its audit report. ☑
If securities are registered pursuant to Section 12(b) of the Act, indicate by check mark whether the financial statements of the registrant included in the filing reflect the correction of an error to previously issued financial statements. ☐
Indicate by check mark whether any of those error corrections are restatements that required a recovery analysis of incentive-based compensation received by any of the registrant’s executive officers during the relevant recovery period pursuant to §240.10D-1(b). ☐
Indicate by check mark whether the registrant is a shell company (as defined in Rule 12b-2 of the Exchange Act).
Yes ☐ No ☑
The aggregate market value of voting stock held by non-affiliates of the Registrant as of the last business day of the second fiscal quarter ended June 30, 2025, was $161.0 billion, based on the closing price of the common stock as reported on the New York Stock Exchange of $527.29 per common share. For purposes of this calculation, it is assumed that directors, executive officers and beneficial owners of more than 10% of the registrant outstanding stock are affiliates. The number of shares of common stock of the Registrant outstanding as of January 30, 2026 was 298.8 million shares, excluding 7.2 million outstanding common shares held by the Markit Group Holdings Limited Employee Benefit Trust.
Part III incorporates information by reference from the definitive proxy statement for the 2026 annual meeting of shareholders.
This report contains “forward-looking statements,” as defined in the Private Securities Litigation Reform Act of 1995. These statements, which express management’s current views concerning future events, trends, contingencies or results, appear at various places in this report and use words like “anticipate,” “assume,” “believe,” “continue,” “estimate,” “expect,” “forecast,” “future,” “intend,” “plan,” “potential,” “predict,” “project,” “strategy,” “target” and similar terms, and future or conditional tense verbs like “could,” “may,” “might,” “should,” “will” and “would.” For example, management may use forward-looking statements when addressing topics such as: the outcome of contingencies; future actions by regulators; changes in the Company’s business strategies and methods of generating revenue; the development and performance of the Company’s services and products; the expected impact of acquisitions and dispositions; the Company’s effective tax rates; the Company’s cost structure, dividend policy, cash flows or liquidity; and the anticipated separation of Mobility into a standalone public company.
Forward-looking statements are subject to inherent risks and uncertainties. Factors that could cause actual results to differ materially from those expressed or implied in forward-looking statements include, among other things:
•worldwide economic, financial, political, and regulatory conditions (including slower GDP growth or recession, restrictions on trade (e.g., tariffs), instability in the banking sector and inflation), and factors that contribute to uncertainty and volatility (e.g., supply chain risk), geopolitical uncertainty (including military conflict), natural and man-made disasters, civil unrest, public health crises (e.g., pandemics), and conditions that result from legislative, regulatory, trade and policy changes, including from the U.S. administration;
•the volatility and health of debt, equity, commodities, energy and automotive markets, including credit quality and spreads, the composition and mix of credit maturity profiles, the level of liquidity and future debt issuances, equity flows from active to passive, fluctuations in average asset prices in global equities, demand for investment products that track indices and assessments and trading volumes of certain exchange traded derivatives;
•the demand and market for credit ratings in and across the sectors and geographies where the Company operates;
•the Company’s ability to maintain adequate physical, technical and administrative safeguards to protect the security of confidential information and data, and the potential for a system or network disruption that results in regulatory penalties and remedial costs or improper disclosure of confidential information or data;
•the outcome of litigation, government and regulatory proceedings, investigations and inquiries;
•concerns in the marketplace affecting the Company’s credibility or otherwise affecting market perceptions of the integrity or utility of independent credit ratings, benchmarks, indices and other services;
•the level of merger and acquisition activity in the United States and abroad;
•the level of the Company’s future cash flows and capital investments;
•the effect of competitive products (including those incorporating artificial intelligence ("AI")) and pricing, including the level of success of new product developments and global expansion;
•the impact of customer cost-cutting pressures;
•a decline in the demand for our products and services by our customers and other market participants;
•our ability to develop new products or technologies, to integrate our products with new technologies (e.g., AI), or to compete with new products or technologies offered by new or existing competitors;
•the introduction of competing products (including those developed by AI) or technologies by other companies;
•our ability to protect our intellectual property from unauthorized use and infringement, including by others using AI technologies, and to operate our business without violating third-party intellectual property rights, including through our own use of AI in our products and services;
•our ability to attract, incentivize and retain key employees, especially in a competitive business environment;
•our ability to successfully navigate key organizational changes;
•the continuously evolving regulatory environment in Europe, the United States and elsewhere around the globe affecting each of our businesses and the products they offer, and our compliance therewith;
•the Company’s exposure to potential criminal sanctions or civil penalties for noncompliance with foreign and U.S. laws and regulations that are applicable in the jurisdictions in which it operates, including sanctions laws relating to countries such as Iran, Russia and Venezuela, anti-corruption laws such as the U.S. Foreign Corrupt Practices Act and the U.K. Bribery Act of 2010, and local laws prohibiting corrupt payments to government officials, as well as import and export restrictions;
•the Company’s ability to make acquisitions and dispositions and successfully integrate the businesses we acquire;
•consolidation of the Company’s customers, suppliers or competitors;
•the ability of the Company, and its third-party service providers, to maintain adequate physical and technological infrastructure;
•the Company’s ability to successfully recover from a disaster or other business continuity problem, such as an earthquake, hurricane, flood, civil unrest, protests, military conflict, terrorist attack, outbreak of pandemic or contagious diseases, security breach, cyber attack, data breach, power loss, telecommunications failure or other natural or man-made event;
4
Table of Contents
•the impact on the Company’s revenue and net income caused by fluctuations in foreign currency exchange rates;
•the impact of changes in applicable tax or accounting requirements on the Company;
•the separation of Mobility not being consummated within the anticipated time period or at all;
•the ability of the separation of Mobility to qualify for tax-free treatment for U.S. federal income tax purposes;
•any disruption to the Company’s business in connection with the proposed separation of Mobility;
•any loss of synergies from separating the businesses of Mobility and the Company that adversely impact the results of operations of both businesses, or the companies resulting from the separation of Mobility not realizing all of the expected benefits of the separation; and
•following the separation of Mobility, the combined value of the common stock of the two publicly-traded companies not being equal to or greater than the value of the Company’s common stock had the separation not occurred.
The factors noted above are not exhaustive. The Company and its subsidiaries operate in a dynamic business environment in which new risks emerge frequently. Accordingly, the Company cautions readers not to place undue reliance on any forward-looking statements, which speak only as of the dates on which they are made. The Company undertakes no obligation to update or revise any forward-looking statement to reflect events or circumstances arising after the date on which it is made, except as required by applicable law. Further information about the Company’s businesses, including information about factors that could materially affect its results of operations and financial condition, is contained in the Company’s filings with the SEC, including Item 1A, Risk Factors in this Annual Report on Form 10-K.
RISK FACTORS SUMMARY
Our business is subject to risks and uncertainties that, if realized, could materially and adversely affect our business, financial condition and results of operations, which are discussed more fully in Item 1A, Risk Factors in this Annual Report on Form 10-K. These risks include, but are not limited to, the following:
•Our size, scale and role in the global markets increases our exposure to cyber attacks and other cyber-security risks.
•Our inability to innovate and compete with new or enhanced products and services of our competitors could have a material adverse effect on our business, financial condition or results of operations.
•Our inability to successfully develop, adapt, or implement new and improved processes and technology could materially adversely impact our business, financial condition or results of operations.
•Increased availability of free or relatively inexpensive information sources may materially reduce demand for our products and services.
•AI presents new and evolving risks, and our approach to AI may not be successful.
•Our use of open source software could result in litigation or impose unanticipated restrictions on our ability to commercialize our products and services.
•Our inability to adequately obtain, protect and maintain our intellectual property and other proprietary rights could impact our competitive position.
•We have been, and may in the future be, subject to intellectual property disputes, which are costly to defend and could harm our business and operating results.
•We rely heavily on network systems and the Internet and any failures or disruptions may adversely affect our ability to serve our customers.
•Our operations and infrastructure may malfunction or fail.
•Exposure to litigation and government and regulatory proceedings, investigations and inquiries could have a material adverse effect on our business, financial condition or results of operations.
•Changes and increased enforcement in the global privacy, data localization, operational resilience and data protection legislative, regulatory, and commercial environments in which we operate may materially and adversely impact our ability to collect, compile, use, and publish data, require us to disclose information about our security environment.
•Future legislation, regulatory reform or policy changes, especially abrupt changes, could have a material adverse effect on our business, financial condition or results of operations.
•Increasing regulation of our Ratings business in the U.S., Europe and elsewhere can increase our costs of doing business.
•Our Indices and Energy businesses are subject to a global evolving regulatory landscape, which has and may continue to cause increased operating obligations, exposure, compliance risk and costs of doing business.
•Our international business activities must comport with international trade restraints, including economic sanctions regulations administered by the U.S. Treasury Department’s Office of Foreign Assets Control.
•We may become subject to liability or face reputational harm due to our offerings.
•Changes in the volume of securities issued and traded in domestic and/or global capital markets, asset levels and flows into investment products, high interest rates, changes in interest rates and volatility in the financial markets, and volatility in the energy and commodity markets impact our business, financial condition or results of operations.
5
Table of Contents
•Inability to attract, retain or train key qualified personnel or to navigate key management transitions could have a material adverse effect on our business, financial condition or results of operations.
•The planned separation of our Mobility business into an independent, publicly traded company is contingent upon the satisfaction of a number of conditions, may not be completed on the currently contemplated timeline, or at all, and may not achieve the intended benefits.
•Our acquisitions, divestitures and other strategic transactions may not produce anticipated results.
•The markets in which we operate are intensely competitive, and our inability to successfully compete could materially adversely affect our business, financial condition or results of operations.
•A significant increase in operating costs and expenses could have a material adverse effect on our profitability.
•Consolidation of customers, reduced staffing levels of customers or reduced spending by customers could have a material adverse effect on our business, financial condition or results of operations.
•We rely on the products and services of other suppliers, including certain data, software and service suppliers, for many aspects of our business.
•Our inability to successfully recover should we, our third-party service providers or our clients experience a disaster or other business continuity problem could cause material financial loss, loss of human capital, regulatory actions, reputational harm, damaged client relationships or legal liability.
•Our reputation, credibility, and brand are key assets and competitive advantages of our Company and our business, financial condition or results of operations could be materially and adversely affected if we are negatively perceived in the marketplace.
•We are exposed to multiple risks associated with the global nature of our operations, which could have a material adverse effect on our reputation, business, financial condition or results of operations.
•Outsourcing certain aspects of our business could result in material financial loss, increased costs, regulatory actions and penalties, reputational harm, unauthorized access to our systems, system or network disruption, or improper disclosure of confidential information.
•Sustainability and energy expansion matters pose operational, commercial and regulatory risks.
•Our expansion into and investments in new and growing markets may not be successful, which could adversely impact our business, financial condition and results of operations.
•Our indebtedness, or a downgrade to our credit ratings, could adversely affect our business, financial condition, and results of operations.
6
Table of Contents
PART I
Item 1. Business
Overview
S&P Global Inc. (together with its consolidated subsidiaries, “S&P Global,” the “Company,” the “Registrant,” “we,” “us” or “our”) is a global, diversified, and highly differentiated provider of benchmarks, data, analytics and workflow solutions in the global capital, energy and commodity, and automotive markets. The capital markets include asset managers, investment banks, commercial banks, insurance companies, exchanges, trading firms and issuers; the energy and commodity markets include producers, consumers, traders and intermediaries within energy, chemicals, shipping, metals, carbon and agriculture; and the automotive markets include manufacturers, suppliers, dealerships, service shops and customers. We serve our global customers through a broad range of products and services available through both third-party and proprietary distribution channels. We were incorporated in December of 1925 under the laws of the state of New York.
Our Businesses
Our operations consist of five businesses: S&P Global Market Intelligence (“Market Intelligence”), S&P Global Ratings (“Ratings”), S&P Global Energy (“Energy”), S&P Global Mobility (“Mobility”) and S&P Dow Jones Indices (“Indices”). As of May 2, 2023, we completed the sale of S&P Global Engineering Solutions (“Engineering Solutions”), a provider of engineering standards and related technical knowledge, and the results are included through that date. For a discussion on the competitive conditions and regulatory environment associated with our businesses, see “MD&A – Segment Review” contained in Item 7, Management’s Discussion and Analysis of Financial Condition and Results of Operations, in this Annual Report on Form 10-K.
On April 29, 2025, we announced that our Board of Directors decided to pursue a full separation of our Mobility segment, creating a new publicly traded company. The transaction, which would be implemented through the spin-off of shares of the new company to S&P Global shareholders, is expected to be tax-free for U.S. federal income tax purposes for S&P Global shareholders and is expected to be completed mid-2026, subject to the satisfaction of customary legal and regulatory requirements and approvals.
Market Intelligence
Market Intelligence is a global provider of multi-asset-class data and analytics integrated with purpose-built workflow solutions. Market Intelligence’s portfolio of capabilities are designed to help trading and investment professionals, government agencies, corporations and universities track performance, generate alpha, identify investment ideas, understand competitive and industry dynamics, perform valuations and manage credit risk. Key customers served by Market Intelligence include investment managers, investment banks, private equity firms, insurance companies, commercial banks, corporations, professional services firms, government agencies and regulators.
Market Intelligence includes the following business lines:
•Data, Analytics & Insights — a desktop product suite that provides data, analytics and third-party research for global finance and corporate professionals, which includes the Capital IQ platforms (which are inclusive of S&P Capital IQ Pro, Capital IQ, Office and Mobile products) and a broad range of research, reference data, market data, derived analytics and valuation services covering both the public and private capital markets, delivered through flexible feed-based or API delivery mechanisms. This also includes issuer solutions for public companies, a range of products for the maritime & trade market, data and insight into Financial Institutions, the telecoms, technology and media space as well as energy transition and sustainability and supply chain data analytics;
•Enterprise Solutions — software and workflow solutions that help our customers manage and analyze data; identify risk; reduce costs; and meet global regulatory requirements. The portfolio includes industry leading financial technology solutions like Wall Street Office, Enterprise Data Manager, Information Mosaic, and iLevel. Our Global Markets Group offering delivers bookbuilding platforms across multiple assets including municipal bonds, equities and fixed income; and
•Credit & Risk Solutions — commercial arm that sells Ratings’ credit ratings and related data and research, advanced analytics, and financial risk solutions which includes subscription-based offerings, RatingsXpress®, RatingsDirect® and Credit Analytics.
7
Table of Contents
Subscription revenue at Market Intelligence is primarily derived from distribution of data, valuation services, analytics, third party research, and credit ratings-related information through both feed and web-based channels. Subscription revenue also includes software and hosted product offerings which provide maintenance and continuous access to our platforms over the contract term. Recurring variable revenue at Market Intelligence represents revenue from contracts for services that specify a fee based on, among other factors, the number of trades processed, assets under management, or the number of positions valued. Non-subscription revenue at Market Intelligence is primarily related to certain advisory, pricing conferences and events, and analytical services.
Ratings
Ratings is an independent provider of credit ratings, research, and analytics. Credit ratings are forward-looking opinions about an issuer’s relative creditworthiness. They are one of several tools investors can use when making decisions about purchasing bonds and other fixed income investments. Our ratings express our opinion about the ability and willingness of an issuer, such as a corporation or state or city government, to meet its financial obligations in full and on time. Our credit ratings can also relate to the credit quality of an individual debt issue, such as a corporate or municipal bond, and the relative likelihood that the issue may default.
With offices in over 25 countries around the world, Ratings is an important part of the world’s financial infrastructure and has played a leading role for over 150 years in providing investors with information and independent benchmarks for their investment and financial decisions as well as access to the capital markets. The key constituents Ratings serves are investors, corporations, governments, municipalities, commercial and investment banks, insurance companies, asset managers, and other debt issuers.
As the capital markets continue to evolve, Ratings is well-positioned to capitalize on opportunities, driven by continuing regulatory changes, through its global network, well-established position in corporate markets and strong investor reputation.
Ratings disaggregates its revenue between transaction and non-transaction. Transaction revenue primarily includes fees associated with:
•ratings related to new issuance of corporate and government debt instruments, as well as structured finance debt instruments; and
•bank loan ratings.
Non-transaction revenue primarily includes fees for surveillance of a credit rating, annual fees for customer relationship-based pricing programs, fees for entity credit ratings and global research and analytics at Crisil.
Energy
Energy is a leading independent provider of information and benchmark prices for the energy and commodity markets. Energy provides essential price data, analytics, industry insights and software & services, enabling the energy and commodity markets to perform with greater transparency and efficiency. The energy and commodity markets include producers, consumers, traders and intermediaries within energy, chemicals, shipping, metals, carbon and agriculture.
Energy includes the following business lines:
•Energy & Resources Data & Insights — includes data, news, insights, and analytics for petroleum, gas, power & renewables, petrochemicals, metals & steel, agriculture, and other commodities;
•Price Assessments — includes price assessments and benchmarks, and forward curves;
•Upstream Data & Insights — includes exploration & production data and insights, software and analytics; and
•Advisory & Transactional Services — includes consulting services, conferences, events and global trading services.
Energy’s revenue is generated primarily through the following sources:
•Subscription revenue — primarily from subscriptions to our market data and market insights (price assessments, market reports and commentary and analytics) along with other information products and software term licenses;
8
Table of Contents
•Sales usage-based royalties — primarily from licensing our proprietary market price data and price assessments to commodity exchanges; and
Mobility is a leading provider of solutions serving the full automotive value chain including vehicle manufacturers (Original Equipment Manufacturers or OEMs), automotive suppliers, mobility service providers, retailers, consumers, and finance and insurance companies.
Mobility includes the following business lines:
•Dealer — includes analytics to predict future buyers, targeted marketing, and vehicle history data to allow people to shop, buy, service and sell used cars;
•Manufacturing — includes insights, forecasts and advisory services spanning the entire automotive value chain, from product planning to marketing, sales and the aftermarket; and
•Financial — includes reports and data feeds to support lenders and insurance companies.
Mobility’s revenue is generated primarily through the following sources:
•Subscription revenue — Mobility’s core information products provide critical information and insights to all global OEMs, most of the world’s leading suppliers, and the majority of the top North American dealerships. Mobility operates across both the new and used car markets. Mobility provides data and insight on future vehicles sales and production, including detailed forecasts on technology and vehicle components; supplies car makers and dealers with market reporting products, predictive analytics and marketing automation software; and supports dealers with vehicle history reports, used car listings and service retention services. Mobility also sells a range of services to financial institutions, to support their marketing, insurance underwriting and claims management activities; and
•Non-subscription revenue — Transactional sales of data that are non-cyclical in nature – and that are usually tied to underlying business metrics such as OEM marketing spend or safety recall activity – as well as consulting and advisory services.
Indices
Indices is a global index provider maintaining a wide variety of valuation and index benchmarks for investment advisors, wealth managers and institutional investors. Indices’ mission is to provide transparent benchmarks to help with decision making, collaborate with the financial community to create innovative products, and provide investors with tools to monitor world markets.
Indices derives revenue from asset-linked fees when investors direct funds into its proprietary designed or owned indexes, sales-usage based royalties of its indices, as well as data subscription arrangements. Specifically, Indices generates revenue from the following sources:
•Investment vehicles — asset-linked fees such as ETFs and mutual funds, that are based on the S&P Dow Jones Indices’ benchmarks that generate revenue through fees based on assets and underlying funds;
•Exchange traded derivatives — generate sales usage-based royalties based on trading volumes of derivatives contracts listed on various exchanges;
•Index-related licensing fees — fixed or variable annual and per-issue asset-linked fees for over-the-counter derivatives and retail-structured products; and
•Data and customized index subscription fees — fees from supporting index fund management, portfolio analytics and research.
9
Table of Contents
Segment and Geographic Data
The relative contribution of our reportable segments to operating revenue, expenses, operating profit, long-lived assets and geographic area for the three years ended December 31, 2025 are included in Note 12 – Segment and Geographic Information to the consolidated financial statements under Item 8, Consolidated Financial Statements and Supplementary Data, in this Annual Report on Form 10-K.
Human Capital
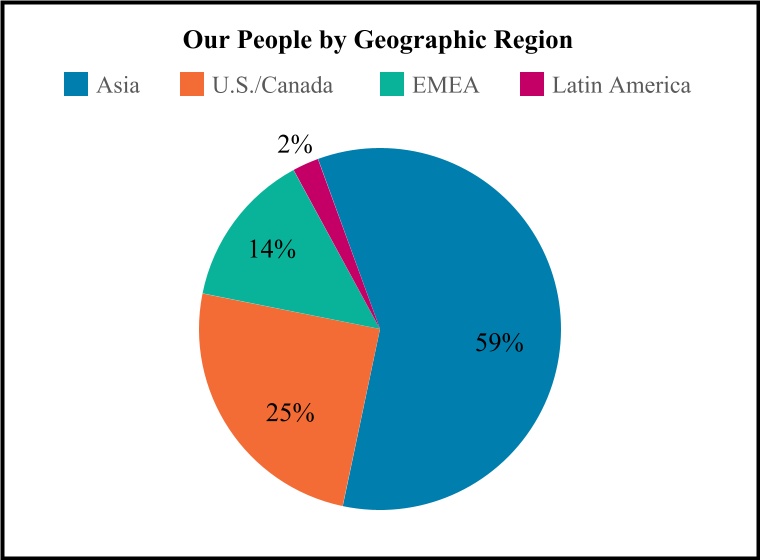
As of December 31, 2025, we had approximately 44,500 permanent employees located worldwide, including around 26,200 in Asia, 11,050 in the U.S. and Canada, 6,200 in Europe, Middle East, and Africa, and 1,050 in Latin America.
The health, safety and well-being of our people working around the globe is a corporate priority, and our facilities worldwide follow internally and externally audited occupational health and safety policies.
Board Oversight & Management Implementation of Human Capital Strategy
Our Board of Directors and Company management view effective human capital management as critical to the Company’s ability to execute its strategy. As a result, the Board of Directors and the Compensation and Leadership Development Committee oversee and regularly engage with our CEO, Chief People Officer, and other members of senior leadership on a broad range of people topics, including talent attraction, development and leadership succession planning; compensation and benefits; workplace culture, health, safety and well-being; and employee engagement and retention.At the management level, our Chief People Officer is responsible for leading the development and execution of the Company’s human capital management strategy, also referred to as our “People” strategy, working together with other senior leaders across the Company.
Competitive Compensation Programs
Offering market competitive and performance-driven compensation is key to our recruitment, talent management and retention strategies. As a result, management regularly assesses employee feedback, competitor research, and market data to ensure our programs remain competitive.Our compensation program consists of a mix of:
•Annual salary where base pay is determined by role, scope, external market rate and internal parity relative to geographic location. Recognizes level of proficiency and skill exhibited as compared to role requirements.
•Annual bonus structured as a cash reward, which serves as our main pay-for-performance vehicle through annual programs. Recognizes achievement against individual, team, and group performance.
•Equity awards for our strategic leaders, granted to retain key talent and incentivize individual achievements and broader organizational goals. Recognizes contributions that positively influence strategic growth, operational alignment, and product innovation.
10
Table of Contents
We also focus on the well-being of our people by offering competitive health and retirement benefits globally, as well as a variety of well-being programs.
Retention and Engagement
In order to attract and retain the high-quality talent needed to execute our long-term strategy, we foster a performance-driven workplace culture that promotes employee engagement, satisfaction and professional development. We invite employee feedback through a variety of channels for open communication and engagement, including small group employee round-table discussions with our business leaders and members of our Board of Directors and employee engagement surveys. We also invest in our employees’ professional development by providing a wide array of global training and learning programs to help employees expand their knowledge, skills and experience, including technology training, career coaching and leadership development programs.
Available Information
S&P Global’s investor relations website provides access to Annual Reports on Form 10-K, Proxy Statements, Quarterly Reports on Form 10-Q, current reports on Form 8-K, earnings releases and amendments to those reports filed or furnished pursuant to Section 13(a) or 15(d) of the Exchange Act. For online access, go to http://investor.spglobal.com. Requests for printed copies, free of charge, can be e-mailed to investor.relations@spglobal.com or mailed to Investor Relations, S&P Global Inc., 55 Water Street, New York, NY 10041-0001. Interested parties can also call Investor Relations toll-free at 866-436-8502 (domestic callers) or 212-438-2192 (international callers). The information on our website is not, and shall not be deemed to be part hereof or incorporated into this or any of our filings with the Securities and Exchange Commission (“SEC”).
In addition, these filing are available to the public on the Commission’s website through their EDGAR filing system at www.sec.gov.
Item 1A. Risk Factors
The following risk factors and other information included in this annual report on Form 10-K should be carefully considered. The risks and uncertainties described below are not the only ones we face. These risks could materially and adversely affect our business, financial condition and results of operations. Additional risks and uncertainties not presently known to us or which we currently believe to be immaterial may also impair our business operations.
We are a global, diversified, and highly differentiated provider of benchmarks, data, analytics and workflow solutions in the global capital, energy and commodity, and automotive markets. The capital markets include asset managers, investment banks, commercial banks, insurance companies, exchanges, trading firms and issuers; the energy and commodity markets include producers, consumers, traders and intermediaries within energy, chemicals, shipping, metals, carbon and agriculture; and the automotive markets include manufacturers, suppliers, dealerships, service shops and customers. Certain risk factors are applicable to certain of our individual segments while other risk factors are applicable Company-wide.
Cybersecurity, Technology and Innovation Risks
Our size, scale and role in the global markets increases our exposure to cyber attacks and other cyber-security risks. Our information systems and networks and those of our third-party service providers are exposed to risks related to cybersecurity and protection of confidential information, including material non-public information, which could have a material adverse effect on our business, financial condition or results of operations.
•Our operations rely on the secure processing, storage and transmission of confidential, sensitive and other types of data and information by our information systems and networks and those of our third-party service providers, including our vendors, data partners and distribution partners. Cyber threats continue to evolve and are increasingly difficult to detect and successfully defend against. As a result, cyber threats have in the past and may in the future defeat the measures that we or our third-party service providers take to anticipate, detect, avoid, or mitigate such threats.
•Our businesses often have access to material non-public information concerning the Company’s customers, including sovereigns, public and private companies, and other third parties around the world, the unauthorized disclosure of which could affect the trading markets for such customers’ securities and could damage such customers’ competitive positions. Some of our own products and services also include material non-public information that could affect trading markets. Unauthorized disclosure of this information as a result of cyber attacks and other unauthorized occurrences on our information systems and networks could cause our customers to lose faith in our ability to protect confidential information and therefore cause customers to cease doing business with us.
•The cyber threats we and our third-party service providers (including our vendors, data partners and distribution partners) face are rapidly evolving and are becoming increasingly sophisticated and include denial of service attacks, ransomware, spyware, misinformation, phishing/smishing/vishing attacks, business compromise attacks,
11
Table of Contents
typosquatting, automated attacks, employee errors, negligence or malfeasance, the use of malicious codes or worms, payment fraud, and other unauthorized occurrences on, or conducted through, our or our third-party service providers’ (including our vendors’, data partners’ and distribution partners’) information systems and networks, originating from a wide variety of sources, including criminals, terrorists, state-sponsored actors, financially motivated actors, internal actors, and external service providers. The cyber risks the Company faces range from cyber attacks common to most industries, to more sophisticated and targeted attacks, including attacks carried out by state-sponsored actors, intended to obtain unauthorized access to certain information or information systems or networks due in part to our prominence in the global marketplace, such as our ratings on debt issued by sovereigns and corporate issuers, our impending methodology changes in our benchmarks businesses, or the composition of our indices. Our third-party service providers, including our vendors, data partners and distribution partners, are also the subject of a variety of cyber attacks, including attacks carried out by state-sponsored actors.
•We and our third-party service providers, including our vendors, data partners and distribution partners, experience cyber attacks, data breaches and other cyber threats of varying degrees on a regular basis. The volume of such attacks, breaches and threats has increased over the years and we expect that volume to continue to increase. Breaches of our or our third-party service providers’ (including our vendors’, data partners’ and distribution partners’) information systems and networks may cause material interruptions or malfunctions in our or such third-party’s websites, applications or data processing, or may compromise the confidentiality and integrity of material information regarding us, our business or our customers. Although we have not experienced a cyber attack or data breach that has had a material adverse effect on us to date, we may experience such an event in the future.
•In the ordinary course of business, we are exposed to vulnerabilities in widely deployed third-party software. While such vulnerabilities have not resulted in a material adverse effect on the Company to date, they require us to devote time and resources to remediation on a regular basis. Notwithstanding our efforts, we may suffer a material adverse effect on our business, financial condition or results of operations resulting from such vulnerabilities in the future.
•Misappropriation, improper modification, destruction, corruption or unavailability of our data and information, including personal data, due to cyber incidents, attacks or other security breaches, or the perception of such an occurrence, could damage our brand and reputation, result in litigation, regulatory actions, sanctions or other statutory penalties, or lead to loss of customer confidence in our security measures and reliability. While such incidents have not had a material impact on the Company to date, future incidents could materially harm our ability to retain customers and gain new ones, result in financial losses that are either not insured against or not fully covered through any insurance maintained by us, and lead to increased expenses related to addressing or mitigating the risks associated with any such incidents. We may be required to expend significant resources to mitigate the impact of any errors, interruptions, delays or cessations of service and we may have insufficient recourse against our third-party service providers, including our vendors, data partners and distribution partners. Additionally, our failure to timely or accurately communicate cyber incidents to relevant parties, including as a result of a failure of our third-party service providers, including our vendors, data partners and distribution partners, to inform us of incidents impacting their information systems or networks in a timely manner could result in regulatory or litigation risk, and reputational harm.
•We devote significant resources to maintain and regularly update our systems and processes that are designed to protect the security of our information systems, software, networks and other technology assets and the confidentiality, integrity and availability of information belonging to the enterprise and our customers and employees, and we expect to continue to expend significant additional resources to bolster these protections. However, such measures cannot provide absolute security and may be circumvented or become obsolete, and additional measures that we take to prevent or mitigate cyber incidents may be expensive or ineffective. Additionally, fragmented security tooling could create visibility gaps and increase the risk of missed threats and slower response.
•We conduct cyber due diligence during the acquisition process; however, following the completion of acquisitions, we from time to time identify weaknesses and vulnerabilities in acquired entities’ information systems and networks, which expose us to unexpected liabilities or make our own information systems or networks more vulnerable to a cyber attack.
•Any of the foregoing could have a material adverse effect on our business, financial condition or results of operations.
Our inability to innovate and compete with new or enhanced products and services of our competitors could have a material adverse effect on our business, financial condition or results of operations.
We operate in highly competitive markets that continuously change to adapt to customer needs. We could experience material threats to our businesses from new or existing competitors due to the rapidly changing environment in which we operate. In order to maintain a competitive position, we invest in innovation, new offerings and enhancements, including new ways to deliver our products and services. These new or enhanced offerings resulting from our investments sometimes do not, and may not in the future, achieve market acceptance, profit or the level of profitability that we expect or have experienced historically. Our inability to innovate and compete with new or enhanced products and services of our competitors could have a material adverse effect on our business, financial condition or results of operations.
Our inability to successfully develop, adapt, or implement new and improved processes and technology could materially adversely impact our business, financial condition or results of operations.
12
Table of Contents
•The rapid change of technology is a key feature of all of the markets in which we operate. To succeed in the future, we will need to deploy improved processes and technology to innovate, design, develop, assemble, test, market, and support new products and enhancements to our existing products in a timely and cost-effective manner.
•Innovation and constant development in support of new products and enhancements to existing products calls for the implementation of new and improved processes and technologies that require related change management efforts. While we employ a certain level of internal and external resources to mitigate the risks associated with implementing process and technology improvements, new processes and technologies that are still in development tend to be subject to more risks than established processes and technologies. Additionally, certain of our new processes require manual data entry or collection before they can be automated, which subjects them to greater risk of human error. We may also face unexpected challenges in execution that may require more management attention than expected, thus diverting management time and energy from other businesses. The foregoing and other unforeseen factors could also result in additional commitments of financial resources and business disruptions.
•We have transitioned an important portion of our technology to a cloud-based infrastructure, which is complex, time consuming, and involves substantial expenditures. Our utilization of cloud services is critical to developing and providing products and services to our customers, scaling our business for future growth, maintaining data and otherwise operating our business; any such implementation involves risks inherent in the conversion to a new system, including loss of information and potential disruption to our normal operations. We may discover material deficiencies in our design or implementation or maintenance of the new cloud-based systems that could adversely affect our business. Disruptions to either the outsourced systems or the communication links between us and the outsourced supplier negatively affect our ability to operate our data systems, and impair our ability to provide services to our customers.
•Enhancing existing products and developing new products often requires effective collaboration across various divisions, functions and business lines of the Company. Ineffective or insufficient collaboration across divisions, functions and business lines decreases our ability to expand geographically, enhance products, innovate, increase sales, promote brand awareness (and can lead to brand confusion) and may result in a material adverse effect on our business, financial condition or results of operations.
Increased availability of free or relatively inexpensive information sources may materially reduce demand for our products and services and could have a material adverse effect on our business, financial condition or results of operations.
In recent years, more public sources of free or relatively inexpensive information have become available, and advances in public cloud computing and open source software are expected to continue. Given the importance of data to our products and services, the continued growth of publicly available free or relatively inexpensive information could materially reduce demand for our products and services. Demand could also be materially reduced as a result of cost-cutting initiatives at certain companies and organizations that choose to use publicly available free or relatively inexpensive information over our products and services. Although we believe our products and services are enhanced by our analysis, tools, delivery mechanisms and applications, if a large number of smaller customers or a critical number of larger customers choose to use public sources of free or relatively inexpensive information as a substitute for our products or services, it could have a material adverse effect on our business, financial condition or results of operations.
Artificial Intelligence ("AI") presents new and evolving risks, and our approach to AI may not be successful, which could materially and adversely affect our business, financial condition or results of operations.
AI is a rapidly evolving technology that is fundamentally changing the way data is gathered, produced, protected, licensed, processed, and consumed. Given the importance of data to our products and services, AI continues to be an increasingly important part of our business and industry. While we have established a Company-wide AI strategy to drive our approach to data protection, licensing and AI integration in our processes, products and services, AI creates a number of evolving risks and opportunities and can exacerbate other risks, including those described herein:
•In order to remain competitive, we have made significant investments in various AI initiatives. There is no guarantee that these investments will lead to the development of products and services that achieve market acceptance, profit or the level of profitability that we expect or have experienced historically. The continued enhancement of AI within our products, services and processes depends in part on our ability to attract and retain talented employees with critical AI and data science experience, which is dependent on a number of factors, including prevailing market conditions and compensation packages offered by companies competing for the same talent. While we offer competitive salary and benefit packages, intense competition for talent with critical AI and data science experience is driving difficulties in attracting and retaining skilled employees. If we are less successful in our recruiting efforts, or if we are unable to attract, retain or train key qualified personnel, our ability to develop and deliver on our investments in our various AI initiatives may be adversely affected.
•The number of approaches to integrating and commercializing AI is currently large, and many of those approaches may fail to gain market acceptance or become obsolete as AI continues to evolve. At this time, we are unable to predict which AI offerings will ultimately be successful. In addition, the development, testing and deployment of AI systems
13
Table of Contents
requires continued investment and may materially increase the cost profile of our offerings due to the nature of the computing cost involved in such systems. Notwithstanding our investments, our products and services may become less marketable or less competitive, or potentially obsolete if either our approach to integrating AI into our products and services fails to gain market acceptance or our approach to protecting our data and intellectual property is ultimately inadequate.
•Our competitors are deploying AI in ways that could materially reduce demand for our products and services (for example, by deploying AI in ways that make collection and processing of information relatively inexpensive or free or by leveraging AI to build products and services that compete with our products and services). The emerging availability of “off-the-shelf” AI models may also increase the ability of new and existing competitors to develop technology and applications which may compete with our products and services.
•Our ability to produce and develop products and services with AI capabilities is dependent upon the products and services of other suppliers, including certain data, software and service suppliers. Our products and services with AI capabilities may rely on third-party AI providers for certain capabilities and infrastructure. If any such providers were to limit, discontinue or materially alter the terms of our access, we may be unable to obtain comparable data from other sources in a timely or cost-effective manner, or at all. To the extent we rely on third-party AI models, the providers may discontinue such models or their model capabilities may become insufficient or obsolete. While such issues have not materially adversely affected us to date, the future occurrence of any such issue could have a material adverse effect on our business, financial condition or results of operations.
•AI presents risks and challenges that could affect its adoption, including social and ethical risks. For example, our products and services with AI capabilities may contain errors or defects that lead to privacy concerns, accuracy issues, unintended biases or discriminatory outputs. Errors or defects may exist during any part of a product’s life cycle and may persist notwithstanding testing and/or other quality assurance practices. Inadequate internal oversight or testing within the Company increases the risk that such errors or defects may not be detected or mitigated. Failing to properly remediate any social or ethical issues that may arise in our offerings may result in material brand or reputational harm, competitive harm, legal liability or loss of public confidence, or a material reduction to the marketability or competitiveness of our products and services. In addition, our failure to continue development and adoption of ethical and transparent policies and procedures related to AI could negatively impact our reputation and customer confidence. Any of these social, ethical or operational issues could materially and adversely affect our business, financial condition or results of operations.
•AI is being utilized by malign actors to launch increasingly sophisticated cyber attacks against us and our third-party service providers (including our vendors, data partners and distribution partners), which, if successful, could have a material adverse effect on our business, financial condition or results of operations. While we believe we have appropriate policies, processes and internal controls to ensure the stability of our information technology, provide security from unauthorized access to our systems and maintain business continuity, our business could be subject to significant disruption and our business, financial condition or results of operations could be materially and adversely affected by unanticipated system failures, data corruption or unauthorized access to our systems.
•The AI landscape is complex and rapidly evolving, and new and enhanced laws and regulations (or inadequate laws or regulations), novel application of existing laws to AI technology, governmental or regulatory scrutiny, litigation and ethical concerns could materially and adversely impact our ability to protect our data and intellectual property, to develop and offer products and services that effectively use AI, to compete with other AI products or services, to improve efficiency of existing products or services through the effective use of AI to remain competitive, or to incorporate AI in our internal operations, or could materially increase our burden and cost of research, development and regulatory compliance.
•We do not yet know whether intellectual property laws and regulations in the jurisdictions in which we operate will enable us to effectively protect our intellectual property rights from unintended use by AI. Third parties could also use our data with AI tools to create their own insights and potentially supplant our products and services. We are also subject to a variety of evolving laws and regulations regarding AI in an increasing number of jurisdictions. Further, global AI legislation, regulatory, enforcement, and policy activity is rapidly and continually evolving and creating a complex regulatory compliance environment. Such measures increase our operating costs and require significant management time and attention and may result in negative publicity and subject us to significant costs that may harm our business, including fines or damages as well as demands or orders that we modify or cease existing business practices. The integration of AI in our products and services may increase the risks of improper processing of personal data, further exacerbating such risks.
•AI technologies used in our products and processes may incorporate or reproduce third-party content in their outputs, which may expose us to risks associated with infringing, misappropriating or otherwise violating others’ intellectual property rights, including the trademarks, copyrights, patents and other intellectual property rights of third parties, including from our competitors or nonpracticing entities which may expose us to protracted and expensive litigation and may materially and adversely affect our business going forward. We may also be unable to protect our data from unintended use or access by third-party AI systems.
•Our approach for managing our clients’ use of our data is influenced by AI. Our approach must effectively balance protecting our data and enabling our clients to leverage our data for their needs. Given the evolving nature of AI, at this time we are unable to predict if our approach will be successful. If our approach is ultimately inadequate, we could materially dilute the value of our data and/or lose significant market share or revenue.
14
Table of Contents
Any of the foregoing factors could materially and adversely affect our business, reputation, financial condition or results of operations.
Our use of open source software could result in litigation or impose unanticipated restrictions on our ability to commercialize our products and services.
We use open source software in our technology, most often as small components within a larger product or service. Open source code is also contained in some third-party software we rely on. The terms of many open source licenses are ambiguous and have not been interpreted by United States (“U.S.”) or other courts. These licenses could be construed in a manner that imposes unanticipated conditions or restrictions on our ability to commercialize our products and services, licenses the software on unfavorable terms or requires us to seek licenses from third parties to offer our products and services, or requires us to re-engineer our products and services or take other remedial actions, any of which could have a material adverse effect on our business, financial condition or results of operations. We could also be subject to suits by parties claiming breach of the terms of licenses, which could be costly for us to defend.
Our inability to adequately obtain, protect and maintain our intellectual property and other proprietary rights could impact our competitive position.
•We consider many of our products and services to be proprietary, and our success depends, in part, on protecting our intellectual property, proprietary information, and technology. We rely on a variety of measures to maintain, protect and enforce our intellectual property portfolio, including trademark and patent protection, trade secret laws, legal misappropriation doctrines, confidentiality procedures and contractual restrictions, all of which provide only limited protection. In particular, such measures may not prevent infringement, violation, misuse or misappropriation of our intellectual property rights or proprietary or confidential information. For example, we routinely face unauthorized use of our indices and price assessments, and our efforts to stop such uses require significant time and expense, and are not always successful.
•We have filed for patents in the U.S. and in certain international jurisdictions, but such protections can be expensive and may not be available in all countries in which we operate or in which we seek to enforce such rights, or may be difficult to enforce in practice. We have filed for trademark registrations and participated in trademark enforcement and trademark oppositions in the U.S. and certain international jurisdictions to protect our brand, good will and reputation. These efforts cannot ensure registrations will be issued, our trademark rights will be enforced, or violations of our trademark rights will be appropriately resolved. We do business in a number of countries included on the Priority Watch List and/or Watch Lists maintained by the Office of the United States Trade Representative which are currently thought to afford less protection to intellectual property rights generally than some other jurisdictions. The lack of strong patent and other intellectual property protection in jurisdictions in which we operate increases our vulnerability regarding unauthorized disclosure or use of our intellectual property and undermines our competitive position. In addition, even in jurisdictions where there are strong protections for intellectual property rights, our ability to enforce our intellectual property rights may be impacted by the number of competitors or other third parties attempting to infringe or misappropriate our intellectual property, and the time and resources required to defend against such unauthorized uses.
•There can be no assurance that any future patent, trademark, or other intellectual property registrations will be issued for our pending or future applications or that any of our current or future patents, trademarks or other intellectual property rights will be valid, enforceable, sufficiently broad in scope, provide adequate protection of our technology or other proprietary rights, or provide us with any competitive advantage. Any additional investment in protecting our intellectual property rights through additional trademark, patent or other intellectual property filings could be time consuming and expensive, both in terms of application and maintenance costs. We make business decisions about whether and where to seek patent, copyright, and trademark protection for a particular technology and when to rely upon trade secret protection, and the approach we select may ultimately prove to be inadequate. Businesses we acquire may also have intellectual property portfolios which increase the complexity of managing our intellectual property portfolio and protecting our competitive position. Failure to obtain, protect and maintain our intellectual property adequately could harm the value of, and revenue generated by, such assets as well as harm our reputation and affect our ability to compete effectively.
•We cannot guarantee that we will be successful in maintaining, protecting, or enforcing the confidentiality of our trade secrets or that our confidentiality and non-disclosure agreements for such trade secrets will provide sufficient protection of our trade secrets, know-how, or other proprietary information in the event of any unauthorized use, misappropriation, or other disclosure. Enforcing a claim that a party illegally disclosed or misappropriated a trade secret or know-how is difficult, fact-intensive, expensive, and time-consuming, and the outcome is unpredictable. In addition, trade secrets and know-how can be difficult to protect and some courts inside and outside the U.S. are less willing or unwilling to protect trade secrets and know-how. Further, these agreements do not prevent our competitors from independently developing product or service offerings that are substantially equivalent or superior to our offerings. If any of our trade secrets were to be lawfully obtained or independently developed by a competitor or other third party, we would have no right to prevent them from using that technology or information to compete with us, and
15
Table of Contents
our competitive position would be materially and adversely harmed. The loss of trade secret protection could make it easier for third parties to compete with our products and services by copying functionality, and pervasive data leakage could render our capabilities redundant over time.
•Our products and services contain intellectual property delivered through a variety of digital and other media. Our ability to achieve anticipated results depends in part on our ability to defend our intellectual property rights against infringement and misappropriation. Our business, financial condition or results of operations could be materially and adversely affected by inadequate or changing legal and technological protections for intellectual property and proprietary rights in jurisdictions and markets in which we operate.
•Our products also contain intellectual property of third-party sources. From time to time, we face claims by third parties that we violated their intellectual property rights, which may result in termination of the relevant source agreement, litigation or reputational damage, or may require us to enter into royalty and licensing agreements on unfavorable terms or to stop selling or redesign affected products.
•Any of the above factors could materially and adversely affect our business, reputation, financial condition or results of operations.
We have been, and may in the future be, subject to intellectual property disputes, which are costly to defend and could harm our business and operating results.
Our success depends, in part, on our ability to operate our business without infringing, misappropriating or otherwise violating third-party intellectual property rights. We have been, and may in the future be, subject to claims and litigation alleging that we or our products or services infringe, misappropriate or otherwise violate others’ intellectual property rights, including the trademarks, copyrights, patents and other intellectual property rights of third parties, including from our competitors or nonpracticing entities. We may also learn of possible infringement, misappropriation or other violation of our trademarks, copyrights, patents and other intellectual property. Patent and other intellectual property litigation may be protracted and expensive, and the results are difficult to predict and may result in significant settlement costs or payment of substantial damages. Furthermore, a successful claimant could secure a judgment that requires us to stop offering some products or services or prevents us from conducting our business as we have historically done or may desire to do in the future. We might also be required to seek a license and pay royalties for the use of such intellectual property, which may not be available on commercially acceptable terms, or at all. Alternatively, we may be required to modify our products and services, which could require significant effort and expense and may ultimately not be successful.
We rely heavily on network systems and the Internet and any failures or disruptions may adversely affect our ability to serve our customers.
•Our products and services are delivered electronically, and our customers rely on our ability to process transactions rapidly and deliver substantial quantities of data on computer-based networks. Our customers also depend on the continued capacity, reliability, resiliency, and security of our electronic delivery systems, our websites and the Internet.
•Our ability to deliver our products and services electronically may be impaired due to infrastructure or network failures, malicious or defective software, human error, natural disasters, service outages at cloud or third-party Internet providers or increased government regulation. Delays in our ability to deliver our products and services electronically may harm our reputation and result in the loss of customers.
Our operations and infrastructure may malfunction or fail, which could have a material adverse effect on our business, financial condition or results of operations.
•Our ability to conduct business may be materially and adversely impacted by a disruption in the infrastructure that supports our businesses and the communities in which we are located, including New York City, the location of our headquarters, and major cities worldwide in which we have offices and operations.
•This may include a disruption involving physical or technological infrastructure used by us or third parties with or through whom we conduct business, whether due to human error, natural disasters, power loss, telecommunication failures, cyber attacks, data breaches, break-ins, sabotage, intentional acts of vandalism, acts of terrorism, political unrest, war or otherwise. Technology failures could also result from inadequate implementation or poor governance. Our efforts to secure and plan for potential disruptions of our major operating systems are not always successful, and future disruptions could have a material adverse effect on our business, financial condition or results of operations.
•We rely on our information technology environment and certain critical databases, systems, applications and services (e.g. Amazon Web Services (“AWS”)) to support key product and service offerings. We believe we have appropriate policies, processes and internal controls to ensure the stability of our information technology, provide security from unauthorized access to our systems and maintain business continuity, but our business could be subject to significant disruption and our business, financial condition or results of operations could be materially and adversely affected by unanticipated system failures, data corruption or unauthorized access to our systems.
•We have at times experienced outages and other disruptions due to internal system or human errors and could in the future be subject to outages or other disruptions due to similar errors. While we have taken steps to address these
16
Table of Contents
errors, we may experience outages or other disruptions in the future, and such outages or disruptions could have a material adverse effect on our business, financial condition or results of operations.
•The physical or technological infrastructure used by us or our third-party service providers can become obsolete or restrictive, unavailable, incompatible with future versions of our products, fail to be comprehensive or accurate, or fail to operate effectively, and our business could be adversely affected if we are unable to timely or effectively replace it.
•We also do not have fully redundant systems for most of our smaller office locations and low-risk systems, and our disaster recovery plan does not include restoration of non-essential services. If a disruption occurs in one of our locations or systems and our personnel in those locations or those who rely on such systems are unable to utilize other systems or communicate with or travel to other locations, such persons’ ability to service and interact with our customers may suffer.
•We cannot predict with certainty all of the adverse effects that could result from our failure, or the failure of a third party, to efficiently address and resolve these delays and interruptions. A disruption to our operations or infrastructure could have a material adverse effect on our business, financial condition or results of operations.
Legal and Regulatory Risks
Exposure to litigation and government and regulatory proceedings, investigations and inquiries could have a material adverse effect on our business, financial condition or results of operations.
•In the normal course of business, both in the U.S. and abroad, we and our subsidiaries are defendants in numerous legal proceedings and are often the subject of government and regulatory proceedings, investigations and inquiries, as discussed under Item 7, Management’s Discussion and Analysis of Financial Condition and Results of Operations, in this Annual Report on Form 10-K and in Note 13 – Commitments and Contingencies to the consolidated financial statements under Item 8, Consolidated Financial Statements and Supplementary Data, in this Annual Report on Form 10-K, and we face the risk that additional proceedings, investigations and inquiries will arise in the future.
•Many of these proceedings, investigations and inquiries regularly relate to the activity of our Ratings, Indices, and Energy businesses. In addition, various government and self-regulatory agencies frequently make inquiries and conduct investigations into our compliance with applicable laws and regulations, including those related to our regulated products and services, antitrust matters, and other matters, such as environmental, social and governance (“ESG”) matters. From time to time, we also face proceedings, investigations or inquiries related to tax matters. Enhancements to our products and services combined with evolving regulation requires us to continuously evaluate our regulatory and compliance obligations, and government and self-regulatory agencies may conduct investigations to determine whether our products and services subject us to additional regulations. Any of these proceedings, investigations or inquiries impose additional expenses on the Company, require the attention of senior management, and could ultimately result in adverse judgments, damages, fines, penalties, activity restrictions, reduced demand for our products and services, or negative impacts on our cash flows, which could have a material adverse effect on our business, financial condition or results of operations.
•In view of the uncertainty inherent in litigation, government and regulatory enforcement matters, and changing political sentiments, we cannot predict the eventual outcome of the matters we are currently facing or the timing of their resolution, or in most cases reasonably estimate what the eventual judgments or impact of activity restrictions may be. The outcome of matters we are currently facing or that we may face in the future could have a material adverse effect on our business, financial condition or results of operations.
•As litigation or the process to resolve pending matters progresses, as the case may be, we continuously review the latest information available and assess our ability to predict the outcome of such matters and the effects, if any, on our consolidated financial condition, cash flows, business and competitive position, which sometimes requires us to record liabilities in the consolidated financial statements.
•Risks relating to legal proceedings may be heightened in foreign jurisdictions that lack the legal protections or liability standards comparable to those that exist in the U.S. In addition, new laws and regulations have been and may continue to be enacted that establish lower liability standards, shift the burden of proof or relax pleading requirements, thereby increasing the risk of successful litigations against the Company in the U.S. and in foreign jurisdictions. These litigation risks are often difficult to assess or quantify and could have a material adverse effect on our business, financial condition or results of operations.
•We may not have adequate insurance or reserves to cover these risks, and the existence and magnitude of these risks often remains unknown for substantial periods of time and could have a material adverse effect on our business, financial condition or results of operations.
Changes and increased enforcement in the global privacy, data localization, operational resilience, and data protection legislative, regulatory, and commercial environments in which we operate may materially and adversely impact our ability to collect, compile, use, and publish data, require us to disclose information about our security environment, and could have a material adverse effect on our business, financial condition or results of operations.
•We, and certain types of information we collect, compile, store, use, process, transfer, publish and sell, are subject to laws and regulations governing the protection of personal and sensitive information in the various jurisdictions in
17
Table of Contents
which we operate. We move data across national borders to conduct our operations, and consequently, are subject to a variety of evolving laws and regulations regarding privacy, data protection, and data security in an increasing number of jurisdictions. Further, global privacy, data localization, data maintenance, data transfer, operational resilience (e.g., the E.U. Digital Operational Resilience Act), data protection legislation, regulatory, enforcement, and policy activity are rapidly and continually evolving and creating a complex regulatory compliance environment. There is also increasing public concern among certain privacy and data protection advocates, government regulators, litigators, and the press regarding, and resulting increasing regulations of, privacy, data, and consumer protection issues. Certain laws and regulations to which we are subject pertain to personally identifiable information (“PII”) relating to individuals. Such laws and regulations constrain the collection, use, processing, storage, and transfer of PII, and impose other obligations with which we must comply. Costs and adaptation of our business practices to comply with evolving laws and regulations governing and restricting the processing and transfer of certain data is, and we expect will continue to be, significant. In addition, such measures, as well as any associated inquiries or investigations or any other government actions, increase our operating costs and require significant management time and attention, and may result in negative publicity and subject us to significant costs that may harm our business, including fines or damages as well as demands or orders that we modify or cease existing business practices. The risks of inadvertent disclosure of personal data can increase with the introduction of new and complex technologies, further exacerbating such risks.
•There has been increased public attention regarding the use and transfer of personal information and regulations intended to strengthen data protection, information security and consumer and personal privacy. The law in these areas continues to develop and the changing nature and interpretation of these laws by courts and enforcement actions, including in jurisdictions such as the U.S. (including in an increasing number of U.S. states), the European Union (the “EU”), the People’s Republic of China and India, could have a significant impact on our processing of employee, commercial, vendor, and customer data, and in turn, our business practices.
•These laws and regulations are wide-ranging in scope and impose numerous requirements on entities that process certain data, including personal data, such as requirements relating to processing sensitive data, obtaining consent of the individuals to whom the personal data relates in certain circumstances, providing information to individuals regarding data processing activities, implementing safeguards to protect the security and confidentiality of personal data, providing notification of data breaches and taking certain measures when engaging third-party processes that will have access to personal data. These laws and regulations are increasing in complexity and number, sometimes change, and can conflict among the various jurisdictions in which we operate. It is possible that we could be prohibited or constrained from collecting or disseminating certain types of data or from providing certain products or services as a result of such laws and regulations. For example, we may not be able, or we may fail, to obtain appropriate third-party consent where consent is required to collect or use certain types of data for certain purposes in our business. Moreover, if our business fails to comply with these laws or regulations, we could be subject to significant litigation and civil or criminal penalties (including monetary damages, regulatory enforcement actions or fines) in one or more jurisdictions, as well as reputational damage that could result in the loss of data, brand equity and business. For example, a failure to comply with the GDPR or U.K. GDPR could result in fines up to the greater of €20 million (or £17.5 million under the U.K. GDPR) or 4% of annual global revenues. Additionally, in the case of a DPPA violation, U.S. courts may award liquidated damages of $2,500 per individual’s personal information. Furthermore, any inquiries or investigations, or any other governmental actions, regarding our data processing practices could require significant management time and attention, and may result in negative publicity and subject us to increased costs, as well as demands or orders that we modify our existing business practices. Enforcement of these laws and regulations may increase as enforcement programs mature and better tooling enhances identification of compliance issues.
•We devote meaningful time and financial resources to compliance with current and future applicable international and U.S. privacy, cybersecurity, data protection and related laws and regulations. We have made, and expect to continue to make, capital investments and other expenditures to enhance cybersecurity preparedness and prevent future cyber incidents and breaches, including costs associated with additional security technologies, personnel, and experts. Any such expenses that we incur in the future, which could be material, will impact our results of operations in the period in which they are incurred, but may not meaningfully limit the success of future attempts to compromise our information or information technology systems.
•Continued privacy and data protection concerns may result in new or amended laws and regulations. Future laws and regulations with respect to the collection, compilation, use, and publication of information could result in limitations on our operations or data processing, leading to increased compliance or litigation expense and/or adverse publicity or loss of revenue, which could have a material adverse effect on our business, financial condition, or results of operations. It is also possible that we could be prohibited from collecting or disseminating certain types of data, which could affect our ability to meet our customers’ needs or require changes in our processes, technologies, and data management.
•We are also from time to time subject to, or face assertions that we are subject to, additional obligations relating to personal and other data by contract or due to assertions that self-regulatory obligations or industry standards apply to our practices. We are also subject to the terms of our privacy policies and privacy-related obligations to third parties, and could face claims or allegations that we are not in compliance with such terms, which could result in costly litigation and could have a material adverse effect on our business, financial condition or results of operations.
18
Table of Contents
Future legislation, regulatory reform or policy changes, especially abrupt changes, could have a material adverse effect on our business, financial condition or results of operations.
Future legislation, regulatory reform or policy changes, such as financial services regulatory reform, energy- or commodity-specific regulation, including oil, regulations related to pricing providers, credit rating data, sustainability or corporate responsibility matters, data privacy, operational resilience and cybersecurity, tax regulations, government-sponsored enterprise reform and increased infrastructure spending and significant changes in trade policy (including sanctions and tariffs), could impact our business. There are currently a number of laws and regulations in jurisdictions in which we operate around the world that have recently been adopted but not yet implemented or have been proposed or are being considered to which we or our clients will or may become subject, but at this time their impact on our business and results of operations remains uncertain. Changes in legislation, regulation or policy increase the likelihood that we will fail to appropriately adapt to changes in our compliance obligations, particularly when such changes happen abruptly, such as following a change in government. Any of the foregoing changes could increase our litigation and regulatory exposure, directly impact our results of operations and cash flows, adversely affect our ability to provide our products and services, or adversely impact the demand for our products and services and could have a material adverse effect on our business, financial condition or results of operations. Such changes may also impact our business by creating increased volatility and uncertainty in the markets in which we operate. At this time, we cannot predict the scope or nature of these changes or assess what the overall effect of such potential changes could be on our results of operations or cash flows.
Increasing regulation of our Ratings business in the U.S., Europe and elsewhere can increase our costs of doing business and therefore could have a material adverse effect on our business, financial condition or results of operations.
•The financial services industry is highly regulated, rapidly evolving and subject to the potential for increasing regulation in the U.S., Europe and elsewhere. The businesses conducted by Ratings are regulated under the laws of various jurisdictions around the world, including the U.S. Credit Rating Agency Reform Act of 2006, the U.S. Dodd-Frank Wall Street Reform and Consumer Protection Act, the U.S. Securities Exchange Act of 1934, the EU’s credit rating agency regulation, and the U.K.’s credit rating agency regulation.
•The U.S. Congress, the International Organization of Securities Commissions ("IOSCO"), the SEC, the European Commission, including through the European Securities Market Authority (“ESMA”) and the U.K. Financial Conduct Authority (“FCA”), as well as regulators in other countries in which Ratings operates, have reviewed the role of rating agencies and their processes and the need for greater oversight or regulations concerning the issuance of credit ratings or the activities of credit rating agencies, and they may conduct such reviews in the future. Other laws, regulations and rules relating to credit rating agencies are from time to time considered by local, national and multinational bodies and are likely to continue to be considered in the future, including, for example, provisions seeking to reduce regulatory and investor reliance on credit ratings or to increase competition among credit rating agencies, provisions regarding remuneration and rotation of credit rating agencies, and liability standards applicable to credit rating agencies. Other laws, regulations and rules are being considered or are likely to be considered in the future that may impact ancillary and other services provided by Ratings in addition to its credit rating products and services. Examples include regulatory oversight regimes for ESG ratings providers which may impose new regulatory requirements regarding some of Ratings’ ancillary and other services, such as the EU regulation on the transparency and integrity of ESG rating activities adopted by the European Parliament and Council in November 2024, or legislation and draft rules published by the FCA in 2025 to supervise ESG ratings providers from June 2028.
•Credit rating laws and regulations, and any other similar future rule-making, could result in reduced demand for credit ratings and/or significant increased costs, which we may be unable to pass through to customers. In addition, there may be uncertainty over the scope, interpretation and administration of such laws and regulations. We may be required to incur significant expenses and/or take actions inconsistent with our business objectives in order to comply with such laws and regulations and to mitigate the risk of fines, penalties or other sanctions. Legal proceedings could become increasingly lengthy and there may be increased uncertainty over and exposure to liability. It is difficult to accurately assess the future impact of legislative and regulatory requirements on our business and our customers’ businesses, and they may affect Ratings’ communications with issuers as part of the rating assignment process, alter the manner in which Ratings’ ratings are developed, affect the manner in which Ratings or its customers or users of credit ratings operate, impact the demand for our ratings or our other products and services and alter the economics of the credit ratings business. Each of these developments could materially increase the costs and legal risk associated with the issuance of our credit ratings or our other products and services and could have a material adverse effect on our operations, profitability and competitiveness, the demand for our credit ratings or our other products and services, and the manner in which our credit ratings are utilized.
•Additional information regarding rating agencies is provided under Item 7, Management’s Discussion and Analysis of Financial Condition and Results of Operations, in this Annual Report on Form 10-K.
Our Indices and Energy businesses are subject to a global evolving regulatory landscape, which has and may continue to cause increased operating obligations, exposure, compliance risk and costs of doing business, and could have a material adverse effect on our business, financial condition or results of operations.
19
Table of Contents
•In addition to the extensive and evolving U.S. laws and regulations, foreign jurisdictions have taken measures to increase regulation of the financial services and energy and commodities industries.
•Energy has aligned its operations with the Principles for Oil Price Reporting Agencies ("PRA Principles") issued by IOSCO and, as recommended by IOSCO in its final report on the PRA Principles, has aligned to the PRA Principles for other commodities for which it publishes benchmarks. Indices has aligned its governance regime, control framework and operations with the Principles for Financial Benchmarks ("Financial Benchmark Principles") issued by IOSCO and engages an independent auditor to perform an annual reasonable assurance review of its adherence to the Financial Benchmark Principles.
•Energy and Indices are subject to financial and commodity benchmark regulation in the EU (the “EU Benchmark Regulation”) and the U.K. (the “U.K. Benchmark Regulation”) as well as increasing benchmark regulation in other jurisdictions. Energy is supervised by the Dutch Authority for the Financial Markets for the EU Benchmark Regulation. Indices has recently transitioned from supervision by the Dutch Authority for the Financial Markets to supervision by ESMA for the EU Benchmark Regulation. Indices is also supervised by the FCA for the U.K. Benchmark Regulation. Indices is also subject to the benchmark regulation in Australia under which it is required to and has obtained a license from and is subject to the supervision of the Australian Securities and Investment Commission regarding its administration of the S&P ASX 200 index.
•Certain products and services provided by the S1 business in Energy are subject to the EU regulation on the transparency and integrity of ESG rating activities adopted by the European Parliament and Council in November 2024, and will also be subject to The Financial Services and Markets Act 2000 (Regulated Activities) (ESG Ratings) Order 2025 and will need to become supervised by the FCA for the ESG ratings it provides from June 2028.
•The EU's package of legislative measures called the Markets in Financial Instruments Directive and Regulation (collectively "MiFID II") have applied in all EU Member States since 2018. MiFID II and the Market Abuse Regulation may impose additional regulatory burdens on the activities of Indices and Energy in the EU over time, but their impact on, and costs to, the Company have not yet been substantive.
•The European Commission has adopted or proposed various options for regulatory intervention to address high energy prices including, among others, price limiting mechanisms on exchange traded gas products, the introduction of circuit breakers and the development of LNG import benchmarks.
•These laws, regulations and principles have impacted our Energy and Indices businesses by increasing their operating obligations, exposure, compliance risk, and costs of doing business. Such impacts may continue or get worse as the regulatory landscape continues to evolve, which could have a material adverse effect on our business, financial condition or results of operations.
Our international business activities must comport with international trade restraints, including economic sanctions regulations administered by the U.S. Treasury Department’s Office of Foreign Assets Control, which could affect our ability to market and/or sell our products and services into certain countries where we do business. Failure to comply with these laws and regulations can result in significant fines and penalties and related material adverse effects on our reputation, business, financial condition and results of operations.
•As a global company, we are subject to international trade restraints, including economic and financial sanction laws and embargoes. These laws include prohibitions or restrictions on the sale or supply of certain products and services to embargoed or sanctioned countries, regions, governments, persons and entities.
•Embargoes and sanctions laws are changing rapidly for certain geographies, including with respect to Iran, Russia, and Venezuela. These embargoes and sanctions laws have affected, and may in the future affect, our ability to continue to market and/or sell our products and services into these geographies and in turn adversely impact our revenue from such geographies. For example, in response to the ongoing military conflict between Russia and Ukraine, governments in the U.S., the EU, the U.K., Canada and others imposed financial and economic sanctions on certain industry segments and various parties in Russia and Belarus.
•Additional international trade restraints may be promulgated at any time and may require changes to our operations and increase our risk of noncompliance.
•Failure to comply with these laws and regulations can result in significant fines and penalties and related material adverse effects on our reputation, business, financial condition and results of operations. The Company has previously settled and paid fines in connection with such matters.
We may become subject to liability or face reputational harm due to our offerings.
•Some of our products and services support the investment processes and other activities of our clients, which, in the aggregate, manage or own trillions of dollars of assets. The use of our products or services as part of such activities, including the investment process, from time to time exposes us to claims for significant dollar amounts by our clients or the parties whose assets are managed by our clients. Such claims have not materially adversely affected us to date, but future claims may have a material adverse effect on our business, financial condition or results of operations.
•We have a heightened risk of litigation and reputational harm due to our role in the global markets.
•The products we develop or license, and the proprietary methodologies, models and processes on which these products rely, from time to time contain undetected errors or defects, despite testing and/or other quality assurance practices.
20
Table of Contents
Moreover, many of our products use new and evolving technologies that may contain their own undetected errors or defects. Errors or defects may exist during any part of a product’s life cycle and may persist notwithstanding testing and/or other quality assurance practices. Inadequate internal oversight or testing within the Company increases the risk that such errors or defects may not be detected or mitigated. Deploying products containing such errors or defects may damage our reputation, and the costs associated with remediating such errors or defects may have an impact on our profitability.
•Any claim relating to our products or services, even one in which the outcome is ultimately favorable to us, involves a significant commitment of our management, personnel, financial and other resources and could have a negative impact on our reputation. In addition, such claims and lawsuits could have a material adverse effect on our business, financial condition or results of operations.
Business and Operational Risks
Changes in the volume of securities issued and traded in domestic and/or global capital markets, asset levels and flows into investment products, high interest rates, changes in interest rates and volatility in the financial markets, and volatility in the energy and commodity markets impact our business, financial condition or results of operations.
•Our business is impacted by general economic conditions and volatility in the U.S. and world energy and commodity markets and financial markets.
•Economic conditions and volatility across the globe are generally affected by negative or uncertain economic and political conditions. In addition, natural and man-made disasters, public health crises (e.g., pandemics), and military action or conflict, such as the ongoing military conflicts between Russia and Ukraine and in the Middle East and the U.S. intervention in Venezuela, introduce volatility and uncertainty into the global capital and energy and commodity markets and negatively impact general economic conditions. Volatile, negative or uncertain economic and political conditions in our significant markets typically undermine business confidence in our significant markets or in other markets, which are increasingly interdependent. Because we operate globally and have significant businesses in many markets, increased volatility or an economic slowdown in any of those markets typically adversely affects our results of operations. For example, military conflicts typically result in adverse and uncertain economic conditions such as negatively impacting global demand for goods and services; causing supply chain disruptions (e.g., tensions across the Taiwan Straight that could lead to semiconductor supply disruption); increasing costs for transportation, energy and other raw materials; and causing an increase in cybersecurity incidents. Such conditions typically result in increased volatility and disruption to the global economy and the markets in which we operate, thereby adversely impacting our results of operations.
•Since a significant component of our credit-rating and issuance based revenue is transaction-based, and is essentially dependent on the number and dollar volume of rated debt securities issued in the capital markets, unfavorable financial or economic conditions that either reduce investor demand for rated debt securities or reduce issuers’ willingness or ability to issue rated debt securities reduce the number and dollar volume of debt issuances for which Ratings provides credit ratings.
•Unfavorable financial or economic conditions that either reduce investor demand for debt or equity securities or reduce issuers’ willingness or ability to issue such securities negatively impact the revenue of certain business lines within Market Intelligence that are linked to debt and equity issuances.
•Our Indices business is impacted by market volatility, asset levels or notional values of investment products based on our indices, and trading volumes of certain exchange traded derivatives. Uncertain economic conditions, political unrest and a variety of other factors may lead to market volatility and volatile capital markets, as well as changing investment styles, which, among other factors, may influence an investor’s decision to invest in and maintain an investment in an index-linked investment product.
•High or increasing interest rates or credit spreads, volatility in financial markets or the interest rate environment, significant political or economic events, defaults of significant issuers and other market and economic factors may negatively impact the general level of debt issuance, the debt issuance plans of certain categories of borrowers, the level of derivatives trading and/or the types of credit-sensitive products being offered, which impact our Ratings segment and portions of our Market Intelligence, Energy and Indices segments, and in the future could have a material adverse effect on our business, financial condition or results of operations.
•Our Energy business is impacted by volatility in the energy and commodity markets. Such volatility in our key markets could cause reduced demand for our products, impacting our revenues and margins. Changes in commodity price references, whether price assessments, benchmarks or the related trading activity in physical commodities and commodities derivatives, could have a material adverse effect on our business, financial condition or results of operations.
•High or increasing interest rates, volatility in financial markets or the interest rate environment, significant political or economic events, and other market and economic factors may impact the supply and demand for new and used vehicles, which impacts our Mobility business.
•Disruptions in the automotive supply chain impact production in the automotive industry and typically impact our Mobility business.
21
Table of Contents
•Any weakness in the macroeconomic environment, including due to recession, inflation, high or increasing interest rates and other factors, could constrain customer budgets across the markets we serve, potentially leading to a reduction in their employee headcount and a decrease in demand for our subscription-based products.
•The foregoing factors generally affect our performance and could have a material adverse effect on our business, financial condition or results of operations.
Inability to attract, retain or train key qualified personnel or to navigate key management transitions could have a material adverse effect on our business, financial condition or results of operations.
The development, maintenance, sale and support of our products and services are dependent upon the knowledge, experience and ability of our highly skilled, educated and trained key personnel. Accordingly, our business is dependent on successfully attracting, retaining and training talented employees and navigating key management transitions in a highly competitive business environment. Our ability to attract and retain talented employees is dependent on a number of factors, including prevailing market conditions and compensation packages offered by companies competing for the same talent. While we offer competitive salary and benefit packages, intense competition for talent within our markets is driving difficulties in attracting and retaining skilled employees. Key management transitions involve inherent risk, and such transition periods can be disruptive and may result in a loss of personnel with deep institutional or technical knowledge. If we are less successful in our recruiting efforts, or if we are unable to attract, retain or train key qualified personnel or to navigate key management transitions, our ability to develop and deliver successful products and services or achieve strategic goals may be adversely affected, which could have a material adverse effect on our business, financial condition or results of operations.
The planned separation of our Mobility business into an independent, publicly traded company is contingent upon the satisfaction of a number of conditions, may not be completed on the currently contemplated timeline, or at all, and may not achieve the intended benefits.
On April 29, 2025, we announced our intent to pursue a separation of our Mobility business through a spin-off to our shareholders. The proposed separation is subject to various conditions, is complex in nature, and may be affected by unanticipated developments. The separation is intended to qualify as a tax-free transaction for U.S. federal income tax purposes. There can be no assurance regarding the ultimate timing of the separation or that such separation will be completed. Unanticipated developments could delay, prevent or otherwise adversely affect the separation, including but not limited to disruptions in general or financial market conditions or potential problems or delays in satisfying required conditions. Such developments could cause the separation to occur on terms or conditions that are less favorable than anticipated. In addition, we may not be able to achieve the full strategic and financial benefits that we anticipate to result from the separation, or such benefits may be delayed or not occur at all. The anticipated benefits of the separation are based on a number of assumptions, some of which may prove incorrect. We also expect to incur significant expenses in connection with the separation, certain of which will be incurred even if the separation is not completed. Executing the separation will continue to require significant resources, time and attention from our senior management and employees, which could divert attention and resources away from other projects and the day-to-day operation of our business. We may experience negative reactions from financial markets if we do not complete the separation in a reasonable time period. Following the proposed separation, the combined value of the shares of the two publicly-traded companies may not be equal to or greater than what the value of our shares would have been had the separation not occurred. The above factors could have a material adverse effect on our business, financial condition, results of operations or the price of our shares.
Our acquisitions, divestitures and other strategic transactions may not produce anticipated results, which could have a material adverse effect on our business, financial condition or results of operations.
•We have made and expect to continue to make acquisitions, divestitures and other strategic transactions to strengthen our business and grow our Company. Such transactions present significant challenges and risks, as the market for acquisitions, divestitures and other strategic transactions is highly competitive, especially in light of industry consolidation, which affects our ability to complete such transactions.
•If we are unsuccessful in completing such transactions or if such opportunities for expansion do not arise, our business, financial condition or results of operations could be materially adversely affected.
•If such transactions are completed, the anticipated growth and other strategic objectives of such transactions may not be fully realized or may take longer to realize than expected, and a variety of factors may adversely affect any anticipated benefits from such transactions. Our acquisitions, divestitures and other strategic transactions face difficulties, including, but not limited to, the following:
◦the process of integration being more expensive or requiring more resources than anticipated;
◦an acquisition changing the composition of our markets and product mix, and difficulty gaining the skills necessary for such markets or products;
◦delays or difficulties consolidating corporate and administrative infrastructures and eliminating duplicative operations, including issues in integrating financial reporting, information technology infrastructure, data and content management systems and product platforms, communications and other systems;
22
Table of Contents
◦delays or difficulties harmonizing corporate cultures, operating practices, management philosophies, employee development and compensation programs, internal controls, compliance programs and other policies, procedures and processes;
◦assuming unintended liabilities;
◦unexpected regulatory and operating difficulties and expenditures, including regulatory challenges that impact our ability to conduct due diligence;
◦failure to maintain employee morale or retain key personnel of the current or acquired business;
◦failure to retain existing business and operational relationships;
◦continuing operational or financial obligations that arise under transition services agreements requiring significant management and operational resources that limit our ability to fully implement cost reduction and efficiency initiatives or other aspects of our transition plans, or divert the management’s focus from other business operations;
◦difficulty coordinating geographically separate organizations, including consolidating offices;
◦the impact of divestitures on our revenue growth being larger than projected due to greater dis-synergies or adverse effects on our overall product offerings than expected;
◦divestitures requiring continued financial involvement in the divested business through continuing equity ownership, guarantees, indemnities, other financial or operational obligations, or transition services obligations;
◦incurring impairment charges or other losses related to divestitures; and
◦diversion of management’s focus from other business operations.
•The failure of acquisitions, divestitures and other strategic transactions to perform as expected could have a material adverse effect on our business, financial condition or results of operations.
The markets in which we operate are intensely competitive, and our inability to successfully compete could materially adversely affect our business, financial condition or results of operations.
•The markets for credit ratings, financial research, market data and solutions, index-based products, automotive data, energy and commodities analytics and price assessments, and related news and information about these markets are intensely competitive. Our businesses compete domestically and internationally on the basis of a number of factors, including the quality of their offerings, client service, reputation, price, geographic scope, range of products and technological innovation.
•While our businesses face competition from traditional content and analytics providers (including exchanges), we also face competition from non-traditional providers, many of whom are our clients, such as asset managers, investment banks, private equity and technology-led companies that are adding content and analytics capabilities to their core businesses.
•The competitive landscape also experiences consolidation in the form of mergers and acquisitions, joint ventures or strategic partnerships, which results in competitors that are better capitalized or that are able to gain a competitive advantage through synergies.
•In some of the countries in which our businesses operate, governments have, and may in the future, provide financial or other support to locally-based competitors (particularly credit rating agencies) and have, and may from time to time in the future, establish official credit rating agencies, credit ratings criteria, benchmarks or benchmark providers, or procedures for evaluating local issuers.
•Changes in the markets in which we compete from time to time drive us to lower the fees we charge for our products and services in order to remain competitive. Moreover, certain of our fees are based on the performance of our customers, and such fees are negatively impacted when our customers’ performance is down, including due to changes in their markets.
•If we are not able to successfully compete with our competitors, we may be required to significantly reduce the costs for our products or services, or we may lose significant market share, revenue or customers, which could materially adversely affect our business, financial condition or results of operations.
A significant increase in operating costs and expenses could have a material adverse effect on our profitability.
•Our major expenditures include employee compensation and capital investments.
•We offer competitive salary and benefit packages to attract and retain the quality employees required to grow and expand our businesses. Compensation and benefits costs are influenced by general economic factors, including but not limited to changes in the cost of health insurance, retirement benefits, inflation, trends specific to the skill sets required for our workforce, and the amount of competition for qualified employees within our markets.
•We make significant investments in information technology data centers and other technology initiatives and such investments may not result in increased revenues.
•We rely on data provided by third-party data suppliers for a variety of our products and we rely significantly on AWS to provide, develop and maintain our cloud infrastructure. We are facing increasing costs from our third-party service providers due to a number of reasons, including inflationary pressures and costs associated with the increasing complexity of the data we require.
23
Table of Contents
•Although we believe we are prudent in our investment strategies and execution of our implementation plans, the ultimate recoverability or effectiveness of these investments is not yet known.
•A significant increase in any of the operating costs and expenses mentioned above could have a material adverse effect on our profitability.
Consolidation of customers, reduced staffing levels of customers or reduced spending by customers could have a material adverse effect on our business, financial condition or results of operations.
•Our businesses have a customer base which is largely comprised of members from the corporate, financial services, energy and commodities, and automotive industries. The consolidation of customers resulting from mergers and acquisitions across these industries can result in reductions in the number of firms and workforce which can impact the size of our customer base.
•Our customers that strive to reduce their operating costs may seek to reduce their spending on our products and services. If a large number of smaller customers or a critical number of larger customers reduce their spending with us, our business, financial condition or results of operations could be materially and adversely affected.
•Alternatively, customers may use other strategies to reduce their overall spending on financial, energy and commodity market and automotive products and services by consolidating their spending with fewer vendors, including by selecting other vendors with lower-cost offerings, or by self-sourcing their need for financial, energy and commodity market and automotive products and services. If a significant portion of our customer base elects to consolidate their spending on financial, energy and commodity market and automotive products and services with other vendors and not us or self-source their product and service needs, or if we lose a large portion of our business to lower priced competitors, our business, financial condition or results of operations could be materially and adversely affected.
We rely on the products and services of other suppliers, including certain data, software and service suppliers, for many aspects of our business. From time to time, we lose key outside suppliers of data, products, and services or the data, products, or services of these suppliers have errors or are delayed, resulting in a disruption or inability to provide our clients with the information, products or services they desire.
•Our ability to produce our products and services and develop new products and services is dependent upon the products and services of other suppliers, including certain data, software and service suppliers. We obtain data from many third-party data sources. Our business relies on our ability to obtain data for our own internal operational purposes and for the benefit of customers using our products and services. Certain of our third-party data sources supply us with critical datasets that support our products and services for which suitable alternative sources may not be readily available. If any such providers were to limit, discontinue or materially alter the terms of our access, we may be unable to obtain comparable data from other sources in a timely or cost-effective manner, or at all, which could have a material adverse effect on our business, financial condition or results of operations.
•Some of our products and services and their related value are dependent upon updates from our third-party data suppliers and most of our information and data products and services are dependent upon continuing access to historical and current data.
•We could experience interruptions in our data access for a number of reasons, including difficulties in renewing our agreements with third-party data providers, changes to the software used by third-party data providers, efforts by industry participants to restrict access to data, increased fees we may be charged by third-party data providers and legal or regulatory changes. Our competitive position could be negatively affected if any of our key data providers terminates its relationship with us or if data flow from any key data provider is interrupted. If these third-party data providers experience difficulty meeting our requirements or standards, have adverse audit results, violate the terms of our agreements or applicable law, fail to obtain or maintain applicable licenses, cease operations temporarily or permanently, face financial distress or other business disruptions, increase their fees, or if the relationships we have established with such third-party data providers deteriorate, expire or otherwise terminate, whether as a result of macroeconomic conditions or otherwise, we could suffer increased costs and we may be unable to provide similar services or operate certain aspects of our business until we are able to find an equivalent provider or develop replacement technology or operations, which could damage our financial condition and reputation. Furthermore, if we are unsuccessful in identifying or finding high-quality third-party data providers, if we fail to negotiate cost-effective relationships with them, or if we ineffectively manage these relationships, it could have a material adverse effect on our business, financial condition or results of operations.
•Many of our suppliers are also our competitors, and from time to time they negotiate to change the terms of the data and products that they supply to us in order to gain an advantage in the marketplace, which could materially harm our business.
•We utilize certain information and data provided by third-party sources in a variety of ways, including information gathered by market participants and large volumes of data from certain stock exchanges around the world.
•From time to time, the data from our suppliers has errors, is delayed, has design defects, is unavailable on acceptable terms or is not available at all. While such issues have not materially adversely affected us to date, the future occurrence of any such issue could have a material adverse effect on our business, financial condition or results of operations.
24
Table of Contents
•The consolidation of our suppliers has reduced the number of firms we partner with, which has impacted the size of our supplier base for certain products and services and resulted in an increase in fees charged by certain of our supplier partners.
•Some of our agreements with data suppliers allow them to cancel on short notice. Termination of significant data agreements or exclusion from, or restricted use of, or litigation in connection with, significant third-party data assets could result in a substantial decrease of the available information for us to use (and offer our clients) and could have a material adverse effect on our business, financial condition or results of operations.
Our inability to successfully recover should we, our third-party service providers or our clients experience a disaster or other business continuity problem could cause material financial loss, loss of human capital, regulatory actions, reputational harm, damaged client relationships or legal liability.
•Should we or our third-party service providers experience a local or regional disaster or other business continuity problem, such as an earthquake, hurricane, flood, civil unrest, protests, military conflict, terrorist attack, public health crisis (e.g., pandemic), security breach, cyber attack, data breach, power loss, telecommunications failure or other natural or man-made disaster, our ability to continue to operate will depend, in part, on the availability of our or our third-party service provider’s personnel, our or our third-party service provider’s office facilities and the proper functioning of our or our third-party service provider’s computer, telecommunication and other related systems and operations. In the event of any such disaster or other business continuity problem, we could experience operational challenges with regard to particular areas of our operations, such as key executive officers or personnel, or we could be exposed to the operational challenges of our third-party service providers, over which we have no control, which could have a material adverse effect on our business, financial condition or results of operations.
•The steps governments take to prevent or contain a disaster or other business continuity problem (such as travel restrictions, shelter in place orders, business shutdowns, or quarantines) may negatively impact our operations, or the operations of our third-party service providers or clients, or may limit our ability to interact with clients and effectively maintain and grow our operations, including through securing new subscriptions and renewals.
•The negative impact of a disaster or other business continuity problem on our clients could result in our products and services facing pricing pressure or delayed renewals, and challenges to new sales, which would in turn reduce revenue, ultimately impacting our results of operations.
•We regularly assess and take steps to improve our existing business continuity plans and key management succession. However, a disaster on a significant scale or affecting certain of our key operating areas within or across regions, or our inability to successfully recover should we, our third-party service providers or our clients experience a disaster or other business continuity problem, could materially interrupt our business operations and result in material financial loss, loss of human capital, regulatory actions, reputational harm, damaged client relationships or legal liability.
Our reputation, credibility, and brand are key assets and competitive advantages of our Company and our business, financial condition or results of operations could be materially and adversely affected if we are negatively perceived in the marketplace.
•Our reputation, credibility, and the strength of our brand are key competitive strengths.
•Given our role in the financial, energy and commodity, and automotive markets, our ability to attract and retain customers is uniquely affected by external perceptions of our reputation, credibility, and brand.
•We provide credit ratings, pricing and valuation services, benchmark products, indices, and ESG scores and data, many of which depend on contributions or inputs from third parties or market participants. Our customers and other market participants expect us to be able to demonstrate that our products and services are produced independently and are not readily subject to manipulation. We believe our products and services are designed with appropriate methodologies, processes, and procedures to maintain independence and integrity; however, we may not be able to prevent third parties or market participants from working together or colluding to try to manipulate their inputs and thus the resulting outputs of our products and services. From time to time, we are involved in third-party investigations or litigation related to the markets and stakeholders our products and services serve. Any failures, negative publicity, investigations, or lawsuits that implicate the independence and integrity of our credit ratings, pricing and valuation services, benchmarks, indices, and ESG scores and data could result in a loss of confidence in the administration of these products and services and could harm our reputation and our business.
•Negative perceptions or publicity could damage our reputation with customers, prospects, regulators, and the public generally, which in turn could negatively impact, among other things, our ability to attract and retain customers, employees and suppliers, as well as suitable candidates for acquisitions or other combinations. For example, we have faced and could in the future face negative perceptions or publicity with respect to our sustainability and corporate responsibility policies and practices or our sustainability products, methodologies, or scores, including as a result of a revision, suspension or withdrawal of, or a failure to meet, our publicly disclosed sustainability and corporate responsibility targets, goals or practices, or as a result of misalignment with evolving, and in certain instances conflicting, market standards, expectations of regulators and other stakeholders, and regulations and codes of conduct. In addition, sustainability and corporate responsibility state, federal and international laws, regulations, standards and regulatory expectations are evolving, varied and at times conflicting, and our failure or perceived failure to comply
25
Table of Contents
with such laws, regulations, standards or expectations could result in adverse reactions by certain stakeholders, including governmental authorities, regulators, shareholders and customers, including the commencement of private litigation or government and regulatory proceedings, investigations, inquiries and litigation.
•Our divisions are all actively engaged in analyzing and providing views on economic conditions, including assessing the impact of events that create volatility and economic uncertainty, such as the ongoing military conflicts between Russia and Ukraine and in the Middle East, tensions across the Taiwan Strait and U.S. intervention in Venezuela. Notwithstanding the care we take in carrying out our work, the views and assumptions we express, the conclusions we draw, the actions we take (including, but not limited to, rating actions, revising the composition of our indices, etc.), and the work our divisions produce are likely to be heavily scrutinized with the benefit of hindsight. We have faced significant regulatory and media scrutiny following prior periods of volatility and economic uncertainty. Such scrutiny has in the past and may in the future impact our reputation, brand and credibility and result in private litigation or government and regulatory proceedings, investigations, inquiries and litigation.
•Given our businesses are often privy to material non-public information concerning our customers, our data could be improperly used, including for insider trading by our employees and third-party vendors with access to key systems. We have experienced insider trading incidents involving employees in the past, and it is not always possible to deter misconduct by employees or third-party vendors. We take precautions to detect and prevent such activity, including training on insider trading policies for our employees, contractual obligations for our third-party vendors, and policies that require access restrictions for material non-public information, but such precautions are not guaranteed to deter misconduct. Any breach of our clients’ confidences as a result of employee or third-party vendor misconduct could harm our reputation.
•Damage to our reputation, credibility, and brand could have a material adverse effect on our business, financial condition or results of operations.
We are exposed to multiple risks associated with the global nature of our operations, which could have a material adverse effect on our reputation, business, financial condition or results of operations.
•The geographic breadth of our activities subjects us to significant legal, economic, operational, market, compliance and reputational risks. These include, among others, risks relating to:
◦economic and political conditions around the world,
◦inflation,
◦high interest rates or fluctuation in interest rates, currency exchange rates or energy and commodity markets,
◦limitations that foreign governments may impose on the conversion of currency or the payment of dividends or other remittances to us from our non-U.S. subsidiaries,
◦differing accounting principles and standards,
◦increases in taxes or changes in U.S. or foreign tax laws,
◦potential costs and difficulties in complying with a wide variety of foreign laws and regulations (including tax systems) administered by foreign government agencies, some of which may conflict with U.S. or other sources of law,
◦changes in applicable laws and regulatory requirements, including data localization and operational resilience requirements,
◦restrictive actions of governmental authorities in the jurisdictions in which we operate affecting trade, cross-border data transfer and foreign investment, especially during periods of heightened tension between governmental authorities in such jurisdictions, including protective measures such as export restrictions and customs duties and tariffs, government intervention favoring local competitors, data localization efforts, and restrictions on the level of foreign ownership,
◦nationalization, expropriation, price controls, withdrawal of licenses to operate, and unilateral termination of contracts by government entities,
◦competition with local rating agencies that have greater familiarity, longer operating histories and/or support from local governments or other institutions, and
◦civil unrest, protests, terrorism, unstable governments, geopolitical uncertainties and legal systems, and other factors.
Adverse developments in any of these areas could have a material adverse effect on our business, financial condition or results of operations.
•Additionally, we are subject to complex U.S., European and other local laws and regulations that are applicable to our operations abroad, including trade sanctions laws, anti-corruption and anti-bribery laws such as the U.S. Foreign Corrupt Practices Act and the U.K. Bribery Act of 2010, anti-money laundering laws, and other financial crimes laws. Our internal controls, policies and procedures and employee training and compliance programs related to these topics are not always effective in preventing employees, contractors or agents from violating or circumventing such internal policies and violating applicable laws and regulations. Violations of such laws could result in a material adverse effect on our reputation, business, financial condition or results of operations.
•Compliance with international and U.S. laws and regulations that apply to our international operations increases the cost of doing business in foreign jurisdictions. Violations of such laws and regulations may result in fines and
26
Table of Contents
penalties, criminal sanctions, administrative remedies, or restrictions on business conduct that have a material adverse effect on our reputation, business, financial condition or results of operations.
Outsourcing certain aspects of our business could result in material financial loss, increased costs, regulatory actions and penalties, reputational harm, unauthorized access to our systems, system or network disruption, or improper disclosure of confidential information.
•We have outsourced certain functions to third-party service providers to leverage leading specialized capabilities and achieve cost efficiencies, and such functions may be further outsourced. From time to time, our third-party service providers do not perform to our standards, produce reliable results, perform in a timely manner, or perform at all. We also face the risk that our third-party service providers may fail to comply with legal requirements or maintain the confidentiality of our proprietary information. Failure of these third parties to meet their contractual, regulatory, confidentiality, or other obligations to us could result in material financial loss, higher costs, regulatory actions and reputational harm.
•Outsourcing these functions also involves the risk that the third-party service providers may not maintain adequate physical, technical and administrative safeguards to protect the security of our confidential information and data. Failure of these third parties to maintain these safeguards from time to time results in unauthorized access to our systems or a system or network disruption that has at times in the past led to, and could in the future lead to, improper disclosure of confidential information or data, regulatory penalties or remedial costs. While such incidents have not had a material impact on the Company to date, future incidents could have a material adverse effect on our business, financial condition or results of operations.
•AWS provides a distributed computing infrastructure platform for business operations, or what is commonly referred to as a “cloud” computing service. Currently, we run a significant amount of our computing on AWS. Given this, any disruption of or interference with our use of AWS would impact our operations and our business would be adversely impacted.
•We rely on the business infrastructure and systems of third parties with whom we do business and to whom we outsource the maintenance and development of operational and technological functionality, including our AWS “cloud” computing services. Our service providers from time to time experience system breakdowns or failures, outages, downtime, cyber attacks, adverse changes to financial condition, bankruptcy or other adverse conditions. While such incidents have not had a material impact on the Company to date, future incidents could have a material adverse effect on our business, financial condition or results of operations. Thus, our plans to increase the amount of our infrastructure that we outsource to “the cloud” or to other third parties may increase our risk exposure.
Sustainability and energy expansion matters pose operational, commercial and regulatory risks.
The physical commodity and commodity derivative markets may be impacted by decisions by market participants and policy makers to address sustainability and energy expansion matters. Consumer and institutional preferences around sustainability and energy expansion matters continue to change, and the possible failure of our products or services to facilitate the needs of customers facing these issues could adversely impact our business and revenues. Changing preferences, including as a result of shifting market or political sentiment, could also have an adverse impact on the operations or financial condition of our customers, which could result in reduced revenues from those customers. We are also subject to risks relating to state, federal and international sustainability regulations, legislation and regulatory expectations, which are evolving, varied and at times conflicting, and which could impact us and our customers and result in increased regulatory, compliance or operational costs. We are also subject to reputational risks relating to the perception of whether or not we are taking policy positions with regard to energy consumption and sources or other sustainability or energy expansion matters. These risks associated with sustainability and energy expansion matters are continuing to evolve rapidly, and we expect that such risks may continue to increase over time.
Our expansion into and investments in new and growing markets may not be successful, which could adversely impact our business, financial condition and results of operations.
We believe there remains significant opportunity to expand our business into major geographic and product markets (including private markets, energy expansion, supply chain intelligence, wealth, decentralized finance, and emerging markets), and we are in the process of such expansion efforts. Expansion into these markets requires significant levels of investment and attention from management. These markets may not develop as anticipated or we may not have success in these markets, in which case we may be unable to recover our investment spent to expand our business into these markets or may forgo opportunities in more lucrative markets, which could adversely impact our business, financial condition and results of operations.
Our indebtedness, or a downgrade to our credit ratings, could adversely affect our business, financial condition, and results of operations.
•We may incur substantial additional indebtedness (including secured indebtedness) for many reasons, including to fund acquisitions, which could have significant consequences on our future operations, including: making it more
27
Table of Contents
difficult for us to satisfy our indebtedness obligations and our other ongoing business obligations, which may result in defaults; events of default if we fail to comply with the financial and other covenants contained in the agreements governing our debt instruments, which could result in all of our debt becoming immediately due and payable or require us to negotiate an amendment to financial or other covenants that could cause us to incur additional fees and expenses; limiting our flexibility in planning for, or reacting to, and increasing our vulnerability to, changes in our business, the industries in which we operate, and the overall economy; placing us at a competitive disadvantage compared to any of our competitors that have less debt or are less leveraged; and increasing our vulnerability to the impact of adverse economic and industry conditions.
•Our ability to meet our payment and other obligations under our debt instruments depends on our ability to generate significant cash flow in the future. This, to some extent, is subject to general economic, financial, competitive, legislative, and regulatory factors as well as other factors that are beyond our control. We cannot be certain that our business will generate cash flow from operations, or that future borrowings will be available to us under our existing or any future credit facilities or otherwise, in an amount sufficient to enable us to meet our indebtedness obligations and to fund other liquidity needs.
28
Table of Contents
Item 1B. Unresolved Staff Comments
None.
Item 1C. Cybersecurity
Risk Management and strategy.
Integrated Risk Management
Management is responsible for the day-to-day management of the Company’s risk exposures in a manner consistent with the strategic direction and objectives established by the Board. As a critical component of the Company’s risk management process, management has adopted an integrated risk management framework to continuously identify, assess, measure, manage, monitor and report current and emerging non-financial risks. As part of this framework, the Company has an Enterprise Risk Management (“ERM”) Committee which is chaired by the Company’s Chief Risk Officer. Our Chief Information Security Officer (“CISO”) is also a member of the ERM Committee.The ERM Committee oversees the Company’s risk management framework, including the implementation of the framework components across the Company and promotes a strong Company-wide culture of risk management, compliance and control.
Engagement of Third-party Support
We engage third-party services to conduct evaluations of our security controls, whether through penetration testing, independent audits or consulting on best practices to address new challenges. These evaluations include testing both the design and operational effectiveness of security controls. We also share and receive threat intelligence with our defense industrial base peers, government agencies, information sharing and analysis centers and cybersecurity associations.
Third-party Risk Management
Our risk management program also assesses third-party risks, and we perform third-party risk management to identify and mitigate risks from third parties such as vendors, suppliers, and other business partners associated with our use of third-party service providers. Cybersecurity risks are evaluated when determining the selection and oversight of applicable third-party service providers.
Impact of Risks from Cybersecurity Threats
We are regularly subject to cybersecurity attacks. None of the risks from cybersecurity threats we’ve faced to date have materially affected, and we do not believe are reasonably likely to materially affect the Company, our business strategy, results of operations or financial condition. For further information about risks we face from cybersecurity threats, see the risk factor entitled "Our size, scale and role in the global markets increases our risk for cyber attacks and other cyber-security risks. Our information systems and networks and those of our third-party service providers are exposed to risks related to cybersecurity and protection of confidential information, including material non-public information, which could have a material adverse effect on our business, financial condition or results of operations" in Item 1A, Risk Factors in this Annual Report on Form 10-K.
Governance.
Board Oversight of Cybersecurity Threats
The board of directors of the Company (the “Board”) has oversight responsibility for the Company’s risk management framework, including technology and cybersecurity risks facing the Company.
Our Board and Audit Committee gave significant consideration over the past several years to the appropriate Board and Committee oversight structure for risks associated with technology and cybersecurity. The full Board receives briefings from management on enterprise-wide technology, cybersecurity risk management and the overall technology and cybersecurity environment by management. Specifically, the full Board receives biannual reports from the Chief Digital Solutions Officer and the CISO.
29
Table of Contents
The Board coordinates with the Audit Committee to ensure active Board- and Committee-level oversight of the Company’s technology and cyber risk profile, enterprise technology and cyber strategies, and information security initiatives. In addition, the Board has delegated primary responsibility for oversight of the Company’s key risks, including cybersecurity, to the Audit Committee. The Audit Committee reviews technology and cybersecurity risks, as well as the Company’s risk mitigation processes and internal control procedures to protect sensitive business information. The Audit Committee also receives regular updates from the Chief Digital Solutions Officer and the CISO on the Company’s technology and cybersecurity programs. In addition, the Finance Committee oversees management’s strategy with regard to technology and associated risks, including cybersecurity risks, when considering major capital expenditures and acquisitions. The Board also receives regular updates from the Audit Committee on its in-depth Committee-level review.
Role of Management
In addition to the risk management activities undertaken by the ERM Committee, our corporate information security organization, led by our CISO, is responsible for our overall information security strategy, policy, security engineering, operations and cyber threat detection and response.The current CISO has more than 32 years of technology industry leadership, cybersecurity expertise and engineering and operations experience. The corporate information security organization manages and continually enhances the Company’s enterprise security structure with the goal of preventing cybersecurity incidents to the extent feasible, while simultaneously increasing our system resilience to minimize the business impact should an incident occur.Central to this organization is our cyber incident response team, which is responsible for the Company’s protection, detection and response capabilities.In the event of a cybersecurity incident, the Company is equipped with an incident response plan that includes: (i) detection and analysis, (ii) containment and eradication, and (iii) remediation and (iv) preparation for future incidents. Incident responses are led by our Information Security team and supported by Legal, Compliance and other functions as appropriate. The CISO and the Chief Digital Solutions Officer provide regular updates to the Board and the Audit Committee concerning the Company’s technology and cybersecurity programs, associated risks and the Company’s efforts to help mitigate those risks.
Item 2. Properties
Our corporate headquarters are located in leased premises located at 55 Water Street, New York, NY 10041. We lease office facilities at 154 locations; 35 are in the U.S. In addition, we own real property at 6 locations, of which 2 are in the U.S. Our properties consist primarily of office space used by each of our segments. We believe that all of our facilities are well maintained and are suitable and adequate for our current needs.
Item 3. Legal Proceedings
For information on our legal proceedings, see Note 13 – Commitments and Contingencies under Item 8, Consolidated Financial Statements and Supplementary Data, in this Annual Report on Form 10-K.
For the disclosure of environmental proceedings with a governmental entity as a party pursuant to Item 103(c)(3)(iii) of Regulation S-K, we have elected to disclose matters where we reasonably believe such proceeding would result in monetary sanctions, exclusive of interest and costs, of $1.0 million or more.
Item 4. Mine Safety Disclosures
Not applicable.
30
Table of Contents
Information about our Executive Officers
The following individuals are the executive officers of the Company:
Name
Age
Position
Martina L. Cheung
50
President and Chief Executive Officer
Eric W. Aboaf
61
Executive Vice President, Chief Financial Officer
Christopher F. Craig
52
Senior Vice President, Chief Accounting Officer
Market Intelligence
Saugata Saha
50
President, S&P Global Market Intelligence & Chief Enterprise Data Officer, S&P Global
Mr. Aboaf has served as Executive Vice President, Chief Financial Officer since February 2025. Mr. Aboaf joined S&P Global from State Street Corporation, where he joined as Executive Vice President in December 2016, and served as Executive Vice President and Chief Financial Officer since February 2017 and as Vice Chairman since May 2022.
Ms. Cheung, prior to becoming President and Chief Executive Officer in November 2024, was President, S&P Global Ratings since February 2022, was President, S&P Global Market Intelligence since January 2019, was Head of Risk Services for S&P Global Market Intelligence since September 2015, was Chief Strategy Officer for S&P Global since March 2014, and was Vice President of Operations for S&P Global Ratings since joining the Company in 2010.
Ms. Clay has served as Chief Executive Officer of S&P Dow Jones Indices since November 2025. Ms. Clay joined S&P Global from Cboe Global Markets, Inc., where she served as Executive Vice President, Global Head of Derivatives since October 2023, and prior to that as Executive Vice President, Global Head of Cboe Data Vantage since March 2021.
Mr. Craig has served as Senior Vice President, Chief Accounting Officer since September 2018 and has also led Enterprise Business Services since June 2025. Mr. Craig also served as Interim Chief Financial Officer from February 2024 to February 2025.
Mr. Eager, prior to becoming President, S&P Global Mobility in August 2025, was Chief Executive Officer of CARFAX since December 2021, and prior to that was Vice President of CARFAX’s Dealer Business for 17 years.
Mr. Ernsberger, prior to becoming President of S&P Global Energy in November 2025, was co-President of S&P Global Energy since November 2024, was Head of Market Reporting and Trading Solutions for S&P Global Energy since March 2022, and was Global Head of Pricing & Market Insight for S&P Global Energy (then known as S&P Global Platts) since January 2020.
Mr. Ganesan, prior to becoming Executive Vice President, Chief People Officer in November 2024, was Senior Vice President, People for S&P Global since he joined the Company in October 2021. Prior to joining the Company, Mr. Ganesan was Global Head of Diversity and Inclusion and Head of US Talent at TD Bank Group since November 2018.
Mr. Kemps, prior to becoming Executive Vice President, Chief Legal Officer in October 2021, served as Executive Vice President, General Counsel since August 2016.
31
Table of Contents
Mr. Le Pallec, prior to becoming President of S&P Global Ratings in November 2024, was Executive Managing Director, Head of Global Ratings Services for S&P Global Ratings since April 2017.
Ms. Moore, prior to becoming Executive Vice President, Chief Client Officer in November 2024, was Executive Vice President, Global Head of Strategy, M&A and Partnerships since February 2022, and prior to that was Executive Vice President, Global Head of Corporate Development & Strategic Alliances at IHS Markit since January 2018.
Mr. Saha, prior to becoming President of S&P Global Market Intelligence and Chief Enterprise Data Officer of S&P Global, was President of S&P Global Energy (then known as S&P Global Platts) since January 2021.
Ms. Twomey, prior to becoming Senior Vice President, Chief Communications Officer in November 2024, was Global Head of Communications for S&P Global since January 2024, and was Vice President, Head of Communications for S&P Global Ratings and S&P Global Sustainable1 since March 2020.
32
Table of Contents
PART II
Item 5. Market for the Registrant’s Common Equity, Related Stockholder Matters and Issuer Purchases of Equity Securities
Common Stock
S&P Global Inc.’s common stock is traded on the New York Exchange (“NYSE”) under the ticker symbol (“SPGI”). The approximate number of record holders of our common stock as of January 30, 2026 was 2,585.
The performance graph below compares our cumulative total shareholder return during the previous five years with a performance indicator of the overall market (i.e., S&P 500), and our peer group. The peer group consists of the following companies: Moody’s Corporation, CME Group Inc., MSCI Inc., FactSet Research Systems Inc., Verisk Analytics, Inc. and Intercontinental Exchange, Inc. Returns assume $100 invested on December 31, 2020 and total return includes reinvestment of dividends through December 31, 2025.
Dividends
We expect to continue our policy of paying regular cash dividends, although there is no assurance as to future dividend payments because they depend on future earnings, capital requirements and our financial condition. Regular quarterly dividends per share of our common stock for 2025 and 2024 were as follows:
2025
2024
$0.96 per quarter in 2025
$
3.84
$0.91 per quarter in 2024
$
3.64
On January 14, 2026, the Board of Directors approved a quarterly common stock dividend of $0.97 per share.
33
Table of Contents
Transfer Agent and Registrar for Common Stock
Computershare is the transfer agent for S&P Global. Computershare maintains the records for the Company's registered shareholders and can assist with a variety of shareholder related services.
Shareholder correspondence should be mailed to:
Computershare
P.O. Box 43006
Providence, RI 02940-3006
Overnight correspondence should be mailed to:
Computershare
150 Royall St., Suite 101
Canton, MA 02021
Visit the Investor Center™ website to view and manage shareholder account information online: www.computershare.com/investor
For shareholder assistance:
In the U.S. and Canada:
888-201-5538
Outside the U.S. and Canada:
201-680-6578
TDD for the hearing impaired:
800-490-1493
TDD outside the U.S. and Canada:
781-575-4592
E-mail address:
web.queries@computershare.com
Shareholder online inquiries
https://www-us.computershare.com/investor/Contact
Repurchase of Equity Securities
On November 13, 2025, the Board of Directors approved a share repurchase program authorizing the purchase of 30 million shares (the “2025 Repurchase Program”), which was approximately 10% of the total shares of our outstanding common stock at the time. During the fourth quarter of 2025, we did not repurchase any shares under the 2025 Repurchase Program and, as of December 31, 2025, 30 million shares remained under the 2025 Repurchase Program. On June 22, 2022, the Board of Directors approved a share repurchase program authorizing the purchase of 30 million shares (the “2022 Repurchase Program”), which was approximately 9% of the total shares of our outstanding common stock at that time. During the fourth quarter of 2025, we received 4.6 million shares under the 2022 Repurchase Program, which included 0.6 million shares received from the conclusion of our accelerated share repurchase ("ASR") agreement that we entered into on August 12, 2025. As of December 31, 2025, 2.7 million shares remained under the 2022 Repurchase Program. Further discussion relating to our ASR agreements can be found in Note 9 - Equity to the Consolidated Financial Statements and Supplementary Data, in the Annual Report on Form 10-K.
Repurchased shares may be used for general corporate purposes, including the issuance of shares for stock compensation plans and to offset the dilutive effect of the exercise of employee stock options. Our 2025 Repurchase Program and 2022 Repurchase Program have no expiration date and purchases under these programs may be made from time to time on the open market and in private transactions, depending on market conditions.
The following table provides information on our purchases of our outstanding common stock during the fourth quarter of 2025 pursuant to our 2022 Repurchase Program (column c). In addition to these purchases, the number of shares in column (a) include shares of common stock that are tendered to us to satisfy our employees’ tax withholding obligations in connection with the vesting of awards of restricted shares (we repurchase such shares based on their fair market value on the vesting date).
There were no other share repurchases during the quarter outside the repurchases noted below.
34
Table of Contents
Period
(a) Total Number of Shares Purchased
(b) Average Price Paid per Share
(c) Total Number of Shares Purchased as Part of Publicly Announced Programs
(d) Maximum Number of Shares that may yet be Purchased Under the Programs
Oct. 1 - Oct. 31, 2025 1
621,000
$
513.68
618,259
6.8
million
Nov. 1 - Nov. 30, 2025
4,763
497.02
—
6.8
million
Dec. 1 - Dec. 31, 2025 2
4,074,473
521.73
4,024,226
2.7
million
Total — Quarter
4,700,236
$
514.16
4,642,485
2.7
million
1 Includes 0.6 million shares received from the conclusion of our ASR agreement that we entered into on August 12, 2025.
2 Includes 4.0 million shares received from the initiation of our ASR agreement that we entered into on December 4, 2025. Average price paid per share information does not include this accelerated share repurchase transaction.
Equity Compensation Plan
For information on securities authorized under our equity compensation plans, see Item 12, Security Ownership of Certain Beneficial Owners and Management and Related Stockholder Matters.
Item 6. [Reserved]
35
Table of Contents
Item 7. Management’s Discussion and Analysis of Financial Condition and Results of Operations
The following Management’s Discussion and Analysis (“MD&A”) provides a narrative of the results of operations and financial condition of S&P Global Inc. (together with its consolidated subsidiaries, “S&P Global,” the “Company,” “we,” “us” or “our”) for the years ended December 31, 2025 and 2024, respectively. The MD&A provides information on factors that we believe are important in understanding our results of operations and comparability and certain other factors that may affect our future results. The MD&A should be read in conjunction with the consolidated financial statements and accompanying notes included in this Annual Report on Form 10-K for the year ended December 31, 2025, which have been prepared in accordance with accounting principles generally accepted in the U.S. (“U.S. GAAP”).
The MD&A includes the following sections:
•Overview
•Results of Operations
•Liquidity and Capital Resources
•Reconciliation of Non-GAAP Financial Information
•Critical Accounting Estimates
•Recently Issued or Adopted Accounting Standards
Certain of the statements below are forward-looking statements within the meaning of the Private Securities Litigation Reform Act of 1995. In addition, any projections of future results of operations and cash flows are subject to substantial uncertainty. See Forward-Looking Statements on page 4 of this report.
OVERVIEW
We are a global, diversified, and highly differentiated provider of benchmarks, data, analytics and workflow solutions in the global capital, energy and commodity, and automotive markets. The capital markets include asset managers, investment banks, commercial banks, insurance companies, exchanges, trading firms and issuers; the energy and commodity markets include producers, consumers, traders and intermediaries within energy, chemicals, shipping, metals, carbon and agriculture; and the automotive markets include manufacturers, suppliers, dealerships, service shops and customers.
Our operations consist of five businesses: S&P Global Market Intelligence (“Market Intelligence”), S&P Global Ratings (“Ratings”), S&P Global Energy (“Energy”), S&P Global Mobility (“Mobility”) and S&P Dow Jones Indices (“Indices”).
•Market Intelligence is a global provider of multi-asset-class data and analytics integrated with purpose-built workflow solutions.
•Ratings is an independent provider of credit ratings, research and analytics.
•Energy is a leading independent provider of information and benchmark prices for the energy and commodity markets.
•Mobility is a leading provider of solutions serving the full automotive value chain including vehicle manufacturers (Original Equipment Manufacturers or OEMs), automotive suppliers, mobility service providers, retailers, consumers, and finance and insurance companies.
•Indices is a global index provider maintaining a wide variety of valuation and index benchmarks for investment advisors, wealth managers and institutional investors.
On April 29, 2025, we announced that our Board of Directors decided to pursue a full separation of our Mobility segment, creating a new publicly traded company. The transaction, which would be implemented through the spin-off of shares of the new company to S&P Global shareholders, is expected to be tax-free for U.S. federal income tax purposes for S&P Global shareholders and is expected to be completed mid-2026, subject to the satisfaction of customary legal and regulatory requirements and approvals.
As of May 2, 2023, we completed the sale of S&P Global Engineering Solutions (“Engineering Solutions”), a provider of engineering standards and related technical knowledge, and the results are included through that date. See Note 2 — Acquisitions and Divestitures to the consolidated financial statements under Item 8, Consolidated Financial Statements and Supplementary Data, in this Annual Report on Form 10-K for further discussion.
36
Table of Contents
Shareholder Return
During the three years ended December 31, 2025, we have returned approximately $15.1 billion to our shareholders through a combination of share repurchases and our quarterly dividends: we completed share repurchases of approximately $11.6 billion and distributed regular quarterly dividends totaling approximately $3.5 billion. Also, on January 14, 2026, the Board of Directors approved a quarterly common stock dividend of $0.97 per share.
Key Results
(in millions)
Year ended December 31,
% Change 1
2025
2024
2023
’25 vs ’24
’24 vs ’23
Revenue
$
15,336
$
14,208
$
12,497
8%
14%
Operating profit2
$
6,478
$
5,580
$
4,020
16%
39%
% Operating margin
42
%
39
%
32
%
Diluted earnings per share from net income
$
14.66
$
12.35
$
8.23
19%
50%
1 % changes in the tables throughout the MD&A are calculated off of the actual number, not the rounded number presented.
2 Operating profit for the year ended December 31, 2025includes gain on dispositions of $273 million, employee severance charges of $157 million, disposition-related costs of $92 million, acquisition-related costs of $48 million, legal costs of $48 million, Executive Leadership Team transition costs, net of $42 million, lease impairments of $21 million, a statutorily required labor law accrual adjustment of $9 million, legal settlement recovery of $3 million and an asset write-off of $1 million. Operating profit for the year ended December 31, 2024includes employee severance charges of $127 million, IHS Markit merger costs of $133 million, gain on dispositions of $59 million, legal costs of $20 million, disposition-related costs of $9 million, Executive Leadership Team transition costs of $8 million, a statutorily required bonus accrual adjustment of $7 million, lease impairments of $2 million and a net acquisition-related benefit of $1 million. Operating profit for the year ended December 31, 2023 includes IHS Markit merger costs of $236 million, employee severance charges of $184 million, acquisition-related costs of $77 million, loss on dispositions of $70 million, disposition-related costs of $24 million, lease impairments of $14 million, asset impairments of $9 million and an asset write-off of $1 million. Operating profit also includes amortization of intangibles from acquisitions of $1.1 billion for the years ended December 31, 2025, 2024 and 2023.
2025
Revenue increased 8% driven by increases at all of our reportable segments. The increase at Ratings was driven by growth in both non-transaction and transaction revenue. Non-transaction revenue increased primarily due to an increase in surveillance revenue and an increase in revenue at our Crisil subsidiary. Transaction revenue increased due to higher corporate bond ratings revenue, partially offset by lower bank loan ratings revenue. An increase in structured finance revenue driven by increased collateralized loan obligations (“CLOs”) issuance also contributed to transaction revenue growth. The increase at Market Intelligence was primarily due to subscription revenue growth in Data, Analytics & Insights which was favorably impacted by the acquisition of Visible Alpha in May of 2024 and With Intelligence in November of 2025, growth for work flow solutions in Enterprise Solutions and growth in RatingsXpress® and RatingsDirect®, partially offset by the unfavorable impact of the sale of Fincentric in August of 2024. The increase at Indices was primarily due to higher asset-linked fees revenue, higher exchange-traded derivative revenue and higher data subscription revenue. The increase at Energy was primarily due to continued demand for market data and market insights products driven by expanded product offerings to our existing customers under enterprise use contracts, an increase in sales usage-based royalties revenue and an increase in conference revenue driven by increased attendance at CERAWeek in 2025. The increase at Mobility was primarily due to growth within the Dealer and Financial businesses driven by continued new business growth within the Dealer business, strong underwriting volumes and market share growth within the Financial business and the favorable impact of improved contract terms. Foreign exchange rates had a favorable impact of less than 1 percentage point.
Operating profit increased 16%. Excluding the impact of a higher gain on dispositions in 2025 of 8 percentage points, higher IHS Markit merger costs in 2024 of 5 percentage points and higher amortization of intangibles from acquisitions in 2024 of 1 percentage point, partially offset by higher disposition-related costs in 2025 of 3 percentage points, acquisition-related costs in 2025 compared to a net acquisition-related benefit in 2024 of 2 percentage points, higher employee severance charges in 2025 of 1 percentage point, and higher lease impairments in 2025 of 1 percentage point, higher Executive Leadership Team costs in 2025 of 1 percentage point and higher legal costs in 2025 of 1 percentage point, operating profit increased 11%. The increase was primarily due to revenue growth and decreased incentives, partially offset by higher compensation costs driven by annual merit increases and additional headcount, and investments in strategic initiatives. Foreign exchange rates had a favorable impact of less than 1 percentage point.
37
Table of Contents
2024
Revenue increased 14% driven by increases at all of our reportable segments, partially offset by a decrease at Engineering Solutions due to its sale on May 2, 2023. The increase at Ratings was driven by growth in both transaction and non-transaction revenue. Transaction revenue increased primarily due to growth in corporate bond ratings revenue and bank loan ratings revenue driven by increased issuance volumes due to higher refinancing activity. Non-transaction revenue increased due to an increase in surveillance revenue and an increase in new entity credit ratings revenue. The increase at Market Intelligence was primarily due to subscription revenue growth in Data, Analytics & Insights, growth for work flow solutions at Enterprise Solutions and growth in RatingsXpress®, RatingsDirect® and Credit Analytics. Revenue growth at Energy was primarily due to continued demand for market data and market insights products. The increase at Indices was primarily due to higher asset-linked fees revenue, higher over-the-counter derivatives revenue, higher exchange-traded derivative revenue and higher data subscription revenue. The increase at Mobility was primarily due to new business growth within the Dealer business and strong underwriting volumes within the Financial business. Revenue at Market Intelligence was favorably impacted by the acquisition of Visible Alpha in May of 2024 and unfavorably impacted by the divestitures of Fincentric and the PrimeOne business in August of 2024 and November of 2024, respectively. Revenue at Energy was favorably impacted by the acquisition of World Hydrogen Leaders in May of 2024. Revenue at Mobility was favorably impacted by the acquisition of Market Scan in February of 2023. Foreign exchange rates had a favorable impact of less than 1 percentage point.
Operating profit increased 39%. Excluding the impact of a gain on dispositions in 2024 compared to a loss on dispositions, net in 2023 of 7 percentage points, higher IHS Markit merger costs in 2023 of 5 percentage points, a net acquisition-related benefit in 2024 compared to acquisition-related costs in 2023 of 4 percentage points, higher employee severance charges in 2023 of 3 percentage points, higher disposition-related costs in 2023 of 1 percentage point and higher lease impairments in 2023 of 1 percentage point, partially offset by higher amortization of intangibles from acquisitions in 2024 of 2 percentage points and legal costs in 2024 of 1 percentage point, operating profit increased 21%. The increase was primarily due to revenue growth, partially offset by increased incentives as a result of financial performance, higher compensation costs driven by annual merit increases and investments in strategic initiatives, and higher technology costs. Foreign exchange rates had a favorable impact of 1 percentage point.
Our Strategy
We are a global, diversified, and highly differentiated provider of benchmarks, data, analytics and workflow solutions in the global capital, energy and commodity, and automotive markets. Our mission is Advancing Essential Intelligence.
Our industry-leading benchmarks, differentiated data, and solutions provide a unique value proposition that provide customers with the ability to make more confident decisions and stay a step ahead. Our strategy focuses on three key objectives: to Advance market leadership, Expand high-growth adjacencies, and Amplify enterprise capabilities and integration of AI. In 2026, we are focused on delivering on these key strategic priorities.
Advance Market Leadership
•Delivering market-leading value proposition through best-in-class products, including world-class benchmarks and highly differentiated data, that are transforming the user experience, accelerating innovation, and optimizing go-to-market to enhance client retention and growth; and
•Expanding trusted, enduring client relationships through differentiated products and best-in-class client experiences that meet clients’ evolving needs.
Expand High-Growth Adjacencies
•Accelerating in high-growth adjacencies such as private markets, energy expansion, supply chain intelligence, wealth, and decentralized finance, alongside leading-edge AI and technology, such as blockchain and quantum computing.
38
Table of Contents
Amplify Enterprise Capabilities and AI
•Enabling growth, innovation, and operating leverage through our integrated operating model that removes siloes across enterprise data, enterprise technology, and client coverage teams.
•Driving cutting-edge innovation, in line with client expectations, by integrating and scaling new technology and AI into our products and our operations, and leveraging strategic collaborations and new potential commercial models;
•Enhancing our data estate by continuing to add differentiated data sets at scale, thereby enabling new revenue, efficiency, and time-to-market;
•Leveraging technology, process and skills innovation to empower our people, enhance productivity, and deliver enterprise impact via a people-forward culture, skills focus, people + AI process redesign, and aligned incentives; and
•Continually improving our ongoing commitment to risk management.
We believe that delivering on our key strategic priorities will create shareholder value through long-term profitable growth and we expect to continue to deliver targeted capital return to shareholders.
There can be no assurance that we will achieve success in implementing any one or more of these strategies as a variety of factors could unfavorably impact operating results, including prolonged difficulties in the global credit markets and a change in the regulatory environment affecting our businesses. See Item 1A, Risk Factors in this Annual Report on Form 10-K.
Further projections and discussion on our 2026 outlook for our segments can be found within “ – Results of Operations”.
RESULTS OF OPERATIONS
Consolidated Review
(in millions)
Year ended December 31,
% Change
2025
2024
2023
’25 vs ’24
’24 vs ’23
Revenue
$
15,336
$
14,208
$
12,497
8%
14%
Expenses:
Operating-related expenses
4,563
4,361
4,141
5%
5%
Selling and general expenses
3,417
3,196
3,159
7%
1%
Depreciation and amortization
1,179
1,173
1,143
1%
3%
Total expenses
9,159
8,730
8,443
5%
3%
(Gain) loss on dispositions, net
(273)
(59)
70
N/M
N/M
Equity in Income on Unconsolidated Subsidiaries
(28)
(43)
(36)
(35)%
20%
Operating profit
6,478
5,580
4,020
16%
39%
Other (income) expense, net
(36)
(25)
15
(45)%
N/M
Interest expense, net
287
297
334
(3)%
(11)%
Provision for taxes on income
1,407
1,141
778
23%
47%
Net income
4,820
4,167
2,893
16%
44%
Less: net income attributable to noncontrolling interests
(349)
(315)
(267)
(11)%
(18)%
Net income attributable to S&P Global Inc.
$
4,471
$
3,852
$
2,626
16%
47%
N/M- Represents a change equal to or in excess of 100% or not meaningful
39
Table of Contents
Revenue
(in millions)
Year ended December 31,
% Change
2025
2024
2023
’25 vs ’24
’24 vs ’23
Revenue
$
15,336
$
14,208
$
12,497
8%
14%
Subscription revenue
7,865
7,346
6,963
7%
5%
Non-subscription / transaction revenue
3,144
2,986
2,093
5%
43%
Non-transaction revenue
2,054
1,858
1,730
11%
7%
Asset-linked fees
1,206
1,046
859
15%
22%
Sales usage-based royalties
444
393
348
13%
13%
Recurring variable
623
579
504
8%
15%
% of total revenue:
Subscription revenue
51
%
52
%
55
%
Non-subscription / transaction revenue
21
%
21
%
17
%
Non-transaction revenue
13
%
13
%
14
%
Asset-linked fees
8
%
7
%
7
%
Sales usage-based royalties
3
%
3
%
3
%
Recurring variable
4
%
4
%
4
%
U.S. revenue
$
9,322
$
8,640
$
7,542
8%
15%
International revenue:
European region
3,531
3,256
2,822
8%
15%
Asia
1,640
1,491
1,375
10%
8%
Rest of the world
843
821
758
3%
8%
Total international revenue
$
6,014
$
5,568
$
4,955
8%
12%
% of total revenue:
U.S. revenue
61
%
61
%
60
%
International revenue
39
%
39
%
40
%
40
Table of Contents
2025
Revenue increased 8% as compared to 2024. Subscription revenue increased in 2025 primarily due to growth in Data, Analytics & Insights, growth for work flow solutions in Enterprise Solutions and growth in RatingsXpress®, RatingsDirect®, partially offset by the unfavorable impact of the sale of Fincentric in August of 2024 at Market Intelligence; continued demand for Energy market data and market insights products; new business growth within the Dealer business, strong underwriting volumes and market share growth within the Financial business, and the favorable impact of improved contract terms at Mobility; and higher data subscription revenue at Indices. Non-subscription / transaction revenue increased driven by growth in corporate bond ratings revenue and structured finance revenue at Ratings. Non-transaction revenue increased primarily due to an increase in surveillance revenue and an increase in revenue at our Crisil subsidiary at Ratings. Asset linked fees increased at Indices primarily due to higher levels of assets under management for ETFs and mutual funds. The increase in sales-usage based royalties was driven by higher exchange-traded derivative revenue at Indices and the licensing of our proprietary market data to commodity exchanges at Energy. Recurring variable revenue at Market Intelligence increased due to increased volumes. See “Segment Review” below for further information.
The favorable impact of foreign exchange rates increased revenue by less than 1 percentage point. This impact refers to constant currency comparisons estimated by recalculating current year results of foreign operations using the average exchange rate from the prior year.
2024
Revenue increased 14% as compared to 2023. Subscription revenue increased in 2024 primarily due to growth in Data, Analytics & Insights, growth for work flow solutions at Enterprise Solutions and growth in RatingsXpress®, RatingsDirect® and Credit Analytics, continued demand for Energy market data and market insights products and new business growth within the Dealer business and strong underwriting volumes within the Financial business at Mobility, partially offset by a decrease at Engineering Solutions due to its sale on May 2, 2023. Non-subscription / transaction revenue increased primarily due to growth in corporate bond ratings revenue and bank loan ratings revenue driven by increased issuance volumes due to higher refinancing activity. Non-transaction revenue increased due to an increase in surveillance revenue and an increase in new entity credit ratings revenue. Asset linked fees increased at Indices primarily due to higher levels of assets under management for ETFs and mutual funds and higher over-the-counter derivatives revenue. The increase in sales-usage based royalties was driven by higher exchange-traded derivative revenue at Indices and the licensing of our proprietary market data to commodity exchanges at Energy. Recurring variable revenue at Market Intelligence increased due to increased volumes. Revenue at Market Intelligence was favorably impacted by the acquisition of Visible Alpha in May of 2024 and unfavorably impacted by the divestitures of Fincentric and the PrimeOne business in August of 2024 and November of 2024, respectively. Revenue at Energy was favorably impacted by the acquisition of World Hydrogen Leaders in May of 2024. Revenue at Mobility was favorably impacted by the acquisition of Market Scan in February of 2023. See “Segment Review” below for further information.
The favorable impact of foreign exchange rates increased revenue by less than 1 percentage point. This impact refers to constant currency comparisons estimated by recalculating current year results of foreign operations using the average exchange rate from the prior year.
41
Table of Contents
Total Expenses
The following tables provide an analysis by segment of our operating-related expenses and selling and general expenses for the years ended December 31, 2025 and 2024:
(in millions)
2025
2024
% Change
Operating- related expenses
Selling and general expenses
Operating- related expenses
Selling and general expenses
Operating- related expenses
Selling and general expenses
Market Intelligence 1
$
2,082
$
1,215
$
2,016
$
1,186
3%
2%
Ratings 2
1,072
607
1,033
593
4%
2%
Energy 3
735
483
701
459
5%
5%
Mobility 4
530
519
487
493
9%
5%
Indices 5
271
265
245
237
10%
12%
Intersegment eliminations 6
(200)
—
(186)
—
8%
N/M
Total segments
4,490
3,089
4,296
2,968
5%
4%
Corporate Unallocated expense 7
73
328
65
228
12%
44%
$
4,563
$
3,417
$
4,361
$
3,196
5%
7%
N/M - Represents a change equal to or in excess of 100% or not meaningful
1 In 2025, selling and general expenses include employee severance charges of $56 million, acquisition-related costs of $21 million, disposition-related costs of $10 million, Executive Leadership Team transition costs of $5 million and a statutorily required labor law accrual adjustment of $3 million. In 2024, selling and general expenses include employee severance charges of $77 million, IHS Markit merger costs of $36 million, a net acquisition-related benefit of $12 million and Executive Leadership Team transition costs of $3 million.
2 In 2025, selling and general expenses include legal costs of $42 million and employee severance charges of $17 million. In 2024, selling and general expenses include legal costs of $20 million, a statutorily required bonus accrual adjustment of $6 million and employee severance charges of $5 million.
3 In 2025, selling and general expenses include employee severance charges of $19 million and a statutorily required labor law accrual adjustment of $1 million. In 2024, selling and general expenses include IHS Markit merger costs of $14 million, employee severance charges of $13 million, asset write-offs of $1 million and disposition-related costs of $1 million.
4 In 2025, selling and general expenses include employee severance charges of $15 million, disposition-related costs of $7 million, Executive Leadership Team transition benefit of $4 million and a legal settlement recovery of $3 million. In 2024, selling and general expenses include employee severance charges of $7 million, IHS Markit merger costs of $4 million, acquisition-related costs of $2 million and a liability write-off of $1 million.
5 In 2025, selling and general expenses include employee severance charges of $4 million and acquisition-related costs of $1 million. In 2024, selling and general expenses include IHS Markit merger costs of $4 million and employee severance charges of $1 million.
6 Intersegment eliminations primarily relate to a royalty charged to Market Intelligence for the rights to use and distribute content and data developed by Ratings.
7 In 2025, selling and general expenses include disposition-related costs of $74 million, acquisition-related costs of $25 million, employee severance charges of $47 million, Executive Leadership Team transition costs of $41 million, lease impairments of $21 million, legal costs of $6 million, a statutorily required labor law accrual adjustment of $5 million and an asset write-off of $1 million. In 2024, selling and general expenses include IHS Markit merger costs of $75 million, employee severance charges of $24 million, acquisition-related costs of $8 million, disposition-related costs of $8 million, Executive Leadership Team transition costs of $5 million, lease impairments of $1 million and an asset write-off of $1 million.
Operating-Related Expenses
Operating-related expenses increased 5% as compared to 2024, primarily driven by higher compensation costs and higher technology costs, partially offset by a decrease in incentives and outside services expenses.
Intersegment eliminations primarily relate to a royalty charged to Market Intelligence for the rights to use and distribute content and data developed by Ratings.
42
Table of Contents
Selling and General Expenses
Selling and general expenses increased 7%. Excluding the impact of higher IHS Markit merger costs in 2024 of 4 percentage points, partially offset by higher disposition-related costs in 2025 of 2 percentage points, higher acquisition-related costs in 2025 of 1 percentage point, higher employee severance charges in 2025 of 1 percentage point, higher Executive leadership team transition costs in 2025 of 1 percentage point, higher lease impairment charges in 2025 of 1 percentage point and higher legal costs in 2025 of 1 percentage point, selling and general expenses increased 4%. The increase was primarily driven by higher compensation costs, partially offset by a decreased incentive costs.
Depreciation and Amortization
Depreciation and amortization was $1,179 million in 2025 compared to $1,173 million in 2024, primarily due to an increase in depreciation due to new asset purchases and higher intangible asset amortization driven by the acquisitions of Visible Alpha in May of 2024 and With Intelligence in November of 2025, partially offset by assets being fully amortized at Market Intelligence.
The following tables provide an analysis by segment of our operating-related expenses and selling and general expenses for the years ended December 31, 2024 and 2023:
(in millions)
2024
2023
% Change
Operating- related expenses
Selling and general expenses
Operating- related expenses
Selling and general expenses
Operating- related expenses
Selling and general expenses
Market Intelligence 1
$
2,016
$
1,186
$
1,946
$
1,165
4%
2%
Ratings 2
1,033
593
963
468
7%
27%
Energy 3
701
459
644
461
9%
—%
Mobility 4
487
493
408
502
19%
(2)%
Indices 5
245
237
221
219
11%
8%
Engineering Solutions
—
—
85
27
N/M
N/M
Intersegment eliminations 6
(186)
—
(177)
—
5%
N/M
Total segments
4,296
2,968
4,090
2,842
5%
4%
Corporate Unallocated expense 8
65
228
51
317
27%
(28)%
$
4,361
$
3,196
$
4,141
$
3,159
5%
1%
N/M - Represents a change equal to or in excess of 100% or not meaningful
1 In 2024, selling and general expenses include employee severance charges of $77 million, IHS Markit merger costs of $36 million, a net acquisition-related benefit of $12 million and Executive Leadership Team transition costs of $3 million. In 2023, selling and general expenses include employee severance charges of $90 million, acquisition-related costs of $69 million, IHS Markit merger costs of $49 million, an asset impairment of $5 million and an asset write-off of $1 million.
2 In 2024, selling and general expenses include legal costs of $20 million, a statutorily required bonus accrual adjustment of $6 million and employee severance charges of $5 million. In 2023, selling and general expenses include employee severance charges of $10 million and an asset impairment of $1 million.
3 In 2024, selling and general expenses include IHS Markit merger costs of $14 million, employee severance charges of $13 million, asset write-offs of $1 million and disposition-related costs of $1 million. In 2023, selling and general expenses include IHS Markit merger costs of $35 million, employee severance charges of $26 million and acquisition-related costs of $2 million.
4 In 2024, selling and general expenses include employee severance charges of $7 million, IHS Markit merger costs of $4 million, acquisition-related costs of $2 million and a liability write-off of $1 million. In 2023, selling and general expenses include employee severance charges of $9 million, IHS Markit merger costs of $3 million and acquisition-related costs of $2 million.
5 In 2024, selling and general expenses include IHS Markit merger costs of $4 million and employee severance charges of $1 million. In 2023, selling and general expenses include employee severance charges of $5 million and IHS Markit merger costs of $4 million.
6 Intersegment eliminations primarily relate to a royalty charged to Market Intelligence for the rights to use and distribute content and data developed by Ratings.
7 In 2024, selling and general expenses include IHS Markit merger costs of $75 million, employee severance charges of $24 million, acquisition-related costs of $8 million, disposition-related costs of $8 million, Executive Leadership Team transition costs of $5 million, lease impairments of $1 million and an asset write-off of $1 million. In 2023, selling and general expenses include IHS Markit merger costs of $147 million, employee severance charges of $43 million, disposition-related costs of $24 million, lease impairments of $14 million and acquisition-related costs of $4 million.
43
Table of Contents
Operating-Related Expenses
Operating-related expenses increased 5% as compared to 2023, primarily driven by higher compensation costs, increased incentives and higher technology costs, partially offset by a decrease at Engineering Solutions due to its sale on May 2, 2023.
Intersegment eliminations primarily relate to a royalty charged to Market Intelligence for the rights to use and distribute content and data developed by Ratings.
Selling and General Expenses
Selling and general expenses increased 1% as compared to 2023. Excluding the impact of higher IHS Markit merger costs in 2023 of 4 percentage points, higher acquisition-related costs in 2023 of 3 percentage points, higher employee severance charges in 2023 of 3 percentage points and higher disposition-related costs in 2023 of 1 percentage point, partially offset by legal costs in 2024 of 1 percentage point, selling and general expenses increased 11%. The increase was primarily driven by increased incentives and higher compensation costs, partially offset by a decrease at Engineering Solutions due to its sale on May 2, 2023.
Depreciation and Amortization
Depreciation and amortization was $1,173 million in 2024 compared to $1,143 million in 2023, primarily due to higher intangible asset amortization driven by the acquisition of Visible Alpha in May of 2024.
(Gain) Loss on Dispositions, net
During the year ended December 31, 2025, we recorded a pre-tax gain of $273 million related to the following dispositions, which was included in (Gain) loss on dispositions, net in the consolidated statement of income:
•In October of 2025, we recorded a pre-tax gain of $270 million ($187 million after-tax) in (Gain) loss on dispositions, net in the consolidated statements of income related to the sale of the OSTTRA, including the impact of accumulated other comprehensive income related to our investment.
•In May of 2025, we recorded a pre-tax gain of $3 million ($2 million after-tax) in (Gain) loss on dispositions, net in the consolidated statements of income related to the sale of the Fincentric in August of 2024 in our Market Intelligence segment.
During the year ended December 31, 2024, we completed the following dispositions that resulted in a pre-tax gain of $59 million, which was included in (Gain) loss on dispositions, net in the consolidated statement of income:
•In November of 2024, we recorded a pre-tax gain of $38 million ($27 million after-tax) in (Gain) loss on dispositions, net in the consolidated statements of income related to the sale of the PrimeOne business in our Market Intelligence segment.
•In August of 2024, we recorded a pre-tax gain of $21 million ($12 million after-tax) in (Gain) loss on dispositions, net in the consolidated statements of income related to the sale of Fincentric in our Market Intelligence segment.
During the year ended December 31, 2023, we completed the following disposition and received the following contingent payment that resulted in a pre-tax loss of $70 million, which was included in (Gain) loss on dispositions, net in the consolidated statement of income:
•During the year ended December 31, 2023, we recorded a pre-tax loss of $120 million in (Gain) loss on disposition, net and disposition-related costs of $16 million in selling and general expenses in the consolidated statements of income ($182 million after-tax, net of a release of a deferred tax liability of $157 million) related to the sale of Engineering Solutions.
•In the first quarter of 2023, we received a contingent payment following the sale of Leveraged Commentary and Data (“LCD”) along with a related family of leveraged loan indices in June of 2022. The contingent payment was payable six months following the closing upon the achievement of certain conditions related to the transition of LCD customer relationships. During the year ended December 31, 2023, the contingent payment resulted in a pre-tax gain of $46 million ($34 million after-tax) related to the sale of LCD in our Market Intelligence segment and $4 million ($3 million after-tax) related to the sale of a family of leveraged loan indices in our Indices segment.
44
Table of Contents
Operating Profit
We consider operating profit to be an important measure for evaluating our operating performance and we evaluate operating profit for each of the reportable business segments in which we operate.
We internally manage our operations by reference to operating profit with economic resources allocated primarily based on each segment's contribution to operating profit. Segment operating profit is defined as operating profit before Corporate Unallocated expense and Equity in Income on Unconsolidated Subsidiaries.
The table below reconciles segment operating profit to total operating profit:
(in millions)
Year ended December 31,
% Change
2025
2024
2023
’25 vs ’24
’24 vs ’23
Market Intelligence 1
$
991
$
875
$
714
13%
22%
Ratings 2
3,013
2,707
1,864
11%
45%
Energy 3
943
845
704
12%
20%
Mobility 4
378
312
260
21%
20%
Indices 5
1,271
1,103
925
15%
19%
Engineering Solutions 6
—
—
19
N/M
N/M
Total segment operating profit
6,596
5,842
4,486
13%
30%
Corporate Unallocated expense 7
(146)
(305)
(502)
52%
39%
Equity in Income on Unconsolidated Subsidiaries 8
28
43
36
(35)%
20%
Total operating profit
$
6,478
$
5,580
$
4,020
16%
39%
N/M - Represents a change equal to or in excess of 100% or not meaningful
1 2025 includes employee severance charges of $56 million, acquisition-related costs of $21 million, disposition-related costs of $10 million, Executive Leadership Team transition costs of $5 million, a statutorily required labor law accrual adjustment of $3 million and a gain on disposition of $3 million. 2024 includes employee severance charges of $77 million, gain on dispositions of $59 million, IHS Markit merger costs of $36 million, a net acquisition-related benefit of $12 million and Executive Leadership Team transition costs of $3 million. 2023 includes employee severance charges of $90 million, acquisition-related costs of $69 million, IHS Markit merger costs of $49 million, a gain on disposition of $46 million, an asset impairment of $5 million and an asset write-off of $1 million. 2025, 2024 and 2023 include amortization of intangibles from acquisitions of $588 million, $591 million and $561 million, respectively.
2 2025 includes legal costs of $42 million and employee severance charges of $17 million. 2024 includes legal costs of $20 million, a statutorily required bonus accrual adjustment of $6 million and employee severance charges of $5 million. 2023 includes employee severance charges of $10 million and an asset impairment of $1 million. 2025, 2024 and 2023, include amortization of intangibles from acquisitions of $6 million, $14 million and $8 million, respectively.
3 2025 includes employee severance charges of $19 million and a statutorily required labor law accrual adjustment of $1 million. 2024 includes IHS Markit merger costs of $14 million, employee severance charges of $13 million, asset write-offs of $1 million and disposition-related costs of $1 million. 2023 includes IHS Markit merger costs of $35 million, employee severance charges of $26 million and acquisition-related costs of $2 million. 2025, 2024 and 2023 include amortization of intangibles from acquisitions of $130 million, $130 million and $131 million, respectively.
4 2025 includes employee severance charges of $15 million, disposition-related costs of $7 million, Executive Leadership Team transition benefit of $4 million and a legal settlement recovery of $3 million. 2024 includes employee severance charges of $7 million, IHS Markit merger costs of $4 million, acquisition-related costs of $2 million and a liability write-off of $1 million. 2023 includes employee severance charges of $9 million, IHS Markit merger costs of $3 million and acquisition-related costs of $2 million. 2025, 2024 and 2023 include amortization of intangibles from acquisitions of $303 million, $303 million and $301 million, respectively.
5 2025 includes employee severance charges of $4 million and acquisition-related costs of $1 million. 2024 includes IHS Markit merger costs of $4 million, a loss on disposition of $1 million and employee severance charges of $1 million. 2023 includes employee severance charges of $5 million, a gain on disposition of $4 million and IHS Markit merger costs of $4 million. 2025, 2024 and 2023 include amortization of intangibles from acquisitions of $37 million, $36 million and $36 million, respectively.
6 2023 includes amortization of intangibles from acquisitions of $1 million.
7 2025 includes a gain on disposition of $270 million, disposition-related costs of $74 million, acquisition-related costs of $25 million, employee severance charges of $47 million, Executive Leadership Team transition costs of $41 million, lease impairments of $21 million, legal costs of $6 million, a statutorily required labor law accrual adjustment of $5 million and an asset write-off of $1 million. 2024 includes IHS Markit merger costs of $75 million, employee severance charges of $24 million, acquisition-related costs of $8 million, disposition-related costs of $8 million, Executive Leadership Team transition costs of $5 million, gain on disposition of $2 million, lease impairments of $1 million and an asset write-off of $1 million. 2023 includes IHS Markit merger costs of $147 million, a loss on disposition of $120 million, employee severance charges of $43 million, disposition-related costs of $24 million, lease
45
Table of Contents
impairments of $14 million and acquisition-related costs of $4 million. 2025, 2024 and 2023 include amortization of intangibles from acquisitions of $4 million, $3 million and $3 million, respectively.
8 2023 includes an asset impairment of $2 million. 2025, 2024 and 2023 includes amortization of intangibles from acquisitions of $41 million, $56 million and $56 million, respectively.
2025
Segment Operating Profit — Segment operating profit increased 13% as compared to 2024. Excluding the impact of a higher gain on dispositions in 2024 of 1 percentage point and higher acquisition-related costs in 2025 of 1 percentage point, partially offset by IHS Markit merger costs in 2024 of 1 percentage point, segment operating profit increased 12%. The increase was primarily due to revenue growth and decreased incentive costs, partially offset by higher compensation costs driven by annual merit increases and additional headcount, and investments in strategic initiatives. See “Segment Review” below for further information.
Corporate Unallocated Expense — Corporate Unallocated expense includes costs for corporate functions, select initiatives, unoccupied office space and Kensho, included in selling and general expenses. Corporate Unallocated expense decreased 52% compared to 2024. Excluding the impact of higher disposition-related costs in 2025 of 17 percentage points, higher acquisition-related costs in 2025 of 5 percentage points, Executive Leadership Team transition costs in 2025 of 10 percentage points, lease impairments in 2025 of 5 percentage points, employee severance changes in 2025 of 6 percentage points, legal costs in 2025 of 2 percentage points and a statutorily required labor law accrual adjustment in 2025 of 1 percentage points, partially offset by IHS merger costs in 2024 of 20 percentage points and a higher gain on dispositions in 2025 of 72 percentage points, Corporate Unallocated expense increased 6% primarily due to higher compensation costs in 2025.
Equity in Income on Unconsolidated Subsidiaries —The Company held an investment in a 50/50 joint venture arrangement with shared control with CME Group that combined each company’s post-trade services into a joint venture, OSTTRA. The joint venture provided trade processing and risk mitigation operations and incorporated CME Group’s optimization businesses (Traiana, TriOptima, and Reset) and the Company’s MarkitSERV business. The combination was intended to increase operating efficiencies of both businesses to more effectively service clients with enhanced platforms and services for OTC markets across interest rate, FX, equity, and credit asset classes. Equity in Income on Unconsolidated Subsidiaries includes the OSTTRA joint venture acquired in connection with the merger with IHS Markit. Equity in Income on Unconsolidated Subsidiaries was $28 million for the year ended December 31, 2025 and $43 million for the year ended December 31, 2024.
On October 10, 2025, the Company and CME Group completed the sale of OSTTRA to Kohlberg Kravis Roberts & Co. (“KKR”), a leading global investment firm. The terms of the deal for OSTTRA equaled total enterprise value at $3.1 billion, subject to customary purchase price adjustments, which will be divided evenly between the Company and CME Group pursuant to the 50/50 joint venture. We received proceeds from the sale of $1.5 billion in cash ($1.4 billion after-tax), subject to purchase price adjustments. During the year ended December 31, 2025, we recorded a pre-tax gain of $270 million ($187 million after-tax) for the Company, including the impact of accumulated other comprehensive income related to our investment.
Foreign exchange rates had a favorable impact on operating profit of less than 1 percentage point. This impact refers to currency comparisons and the remeasurement of monetary assets and liabilities. Currency impacts are estimated by re-calculating current year results of foreign operations using the average exchange rate from the prior year. Remeasurement impacts are based on the variance between current-year and prior-year foreign exchange rate fluctuations on assets and liabilities denominated in currencies other than the individual business’s functional currency.
2024
Segment Operating Profit — Segment operating profit increased 30% as compared to 2023. Excluding the impact of a net acquisition-related benefit in 2024 compared to acquisition-related costs in 2023 of 7 percentage points, higher employee severance costs in 2023 of 3 percentage points, higher IHS Markit merger costs in 2023 of 3 percentage points, a higher gain on dispositions in 2024 of 1 percentage point, partially offset by higher amortization of intangibles from acquisitions in 2024 of 3 percentage points, legal costs in 2024 of 2 percentage points and a statutorily required bonus accrual adjustment in 2024 of 1 percentage point, segment operating profit increased 22%. The increase was primarily due to revenue growth, partially offset by increased incentives as a result of financial performance, higher compensation costs driven by annual merit increases and higher technology costs. See “Segment Review” below for further information.
Corporate Unallocated Expense— Corporate Unallocated expense includes costs for corporate functions, select initiatives, unoccupied office space and Kensho, included in selling and general expenses. Corporate Unallocated expense decreased 39% compared to 2023. Excluding the impact of a loss on disposition in 2023 of 8 percentage points, higher IHS Markit merger
46
Table of Contents
costs in 2023 of 5 percentage points, higher employee severance costs in 2023 of 1 percentage point, higher lease impairments in 2023 of 1 percentage point and higher disposition-related costs in 2023 of 1 percentage point, Corporate Unallocated expense increased 23% primarily due to higher incentives and compensation costs.
Equity in Income on Unconsolidated Subsidiaries— The Company held an investment in a 50/50 joint venture arrangement with shared control with CME Group that combined each of the company’s post-trade services into a new joint venture, OSTTRA. The joint venture provides trade processing and risk mitigation operations and incorporates CME Group’s optimization businesses (Traiana, TriOptima, and Reset) and the Company’s MarkitSERV business. The combination was intended to increase operating efficiencies of both the company’s business to more effectively service clients with enhanced platforms and services for OTC markets across interest rate, FX, equity, and credit asset classes. Equity in Income on Unconsolidated Subsidiaries includes the OSTTRA joint venture acquired in connection with the merger with IHS Markit. Equity in Income on Unconsolidated Subsidiaries was $43 million for the year ended December 31, 2024 and $36 million for the year ended December 31, 2023.
Foreign exchange rates had a favorable impact on operating profit of 1 percentage point. This impact refers to currency comparisons and the remeasurement of monetary assets and liabilities. Currency impacts are estimated by re-calculating current year results of foreign operations using the average exchange rate from the prior year. Remeasurement impacts are based on the variance between current-year and prior-year foreign exchange rate fluctuations on assets and liabilities denominated in currencies other than the individual businesses functional currency.
Other (Income) Expense, net
Other (income) expense, net primarily includes the net periodic benefit cost for our retirement and post retirement plans. Other income, net for 2025 was $36 million, other income, net in 2024 was $25 million and other expense, net for 2023 was $15 million. During 2023, lump sum withdrawals exceeded the combined total anticipated annual service and interest cost of our U.S. retirement plan, triggering the recognition of a non-cash pre-tax settlement charge of $23 million. Excluding amortization of intangibles from acquisitions in 2024 $6 million, and a pre-tax settlement charge in 2023, other (income) expense, net was $36 million, $31 million, $9 million for 2025, 2024, 2023, respectively. The increase in other income, net in 2025 compared to 2024 was primarily due to gains on our mark-to-market investments in 2025. The increase in other (income) expense, net in 2024 compared to 2023 was primarily due to an increase in net periodic benefit cost in 2024 and gains on our mark-to-market investments in 2024 compared to losses in 2023.
Interest Expense, net
Interest expense, net decreased $10 million to $287 million in 2025 compared to 2024 primarily due to higher interest income from invested cash. Interest expense, net decreased $37 million in 2024 compared to 2023 primarily due to a benefit from our net investment hedge program, reduced expense related to commercial paper borrowings in 2024 and higher interest income from invested cash. See Note 5 - Debt to the consolidated financial statements under Item 8, Consolidated Financial Statements and Supplementary Data, in this Annual Report on Form 10-K for further discussion.
Provision for Income Taxes
Our effective tax rate was 22.6%, 21.5% and 21.2% for 2025, 2024 and 2023, respectively. Fluctuation in tax rates by year is primarily due to tax charge on divestitures and change in mix of income by jurisdiction.
The Organization for Economic Co-operation and Development (“OECD”) introduced an international tax framework under Pillar Two that provides for a global minimum tax of 15%, which is implemented through local legislation in participating jurisdictions. The effects of Pillar Two taxes enacted in jurisdictions in which we operate have been reflected in our results and did not have a material impact on our consolidated financial statements.
On January 5, 2026, the OECD issued administrative guidance outlining a framework under which U.S.-parented groups may be excluded from the application of the OECD’s global minimum tax rules. Each member jurisdiction will need to adopt this guidance into local law, and the timing and manner of adoption may vary. We are continuing to monitor developments related to this guidance and will evaluate the impact on our financial statements as additional information becomes available.
Segment Review
Market Intelligence
47
Table of Contents
Market Intelligence is a global provider of multi-asset-class data and analytics integrated with purpose-built workflow solutions. Market Intelligence’s portfolio of capabilities are designed to help trading and investment professionals, government agencies, corporations and universities track performance, generate alpha, identify investment ideas, understand competitive and industry dynamics, perform valuations and manage credit risk.
On January 12, 2026, we completed the sale of the Enterprise Data Management and thinkFolio businesses within our Market Intelligence segment to Symphony Technology Group (“STG”), a private equity firm focused on building and scaling market-leading software, data and analytics companies. The transaction is not expected to have a material impact to our consolidated financials statements.
On November 25, 2025, we completed the acquisition of With Intelligence from Motive Partners for $1.8 billion. The acquisition is part of our Market Intelligence segment. Combining With Intelligence's proprietary data, benchmarks and workflow solutions with S&P Global’s trusted expertise and brand in private markets intelligence and analytics, the company creates one of the most comprehensive data offerings for alternatives and private markets participants. The acquisition of With Intelligence is not material to our consolidated financial statements.
On November 10, 2025, we completed the acquisition of the Automatic Identification System (AIS) data services business of ORBCOMM Inc. The AIS business is a leading provider of satellite data services used to track and monitor vessels, enhancing maritime visibility and delivering critical insights that support business intelligence and decision-making for government and commercial clients worldwide. This acquisition is part of our Market Intelligence segment. The acquisition of AIS is not material to our consolidated financial statements.
On June 6, 2025, we completed the acquisition of TeraHelix, a privately held financial technology firm. TeraHelix helps solve complex, enterprise-scale data challenges by providing frameworks that structure data models for smooth interoperability across platforms, systems and storage architectures. This acquisition is part of our Market Intelligence segment and strengthens our customer-centric approach to data, technology, and AI by meaningfully enhancing the ability to link datasets across classes and platforms. The acquisition of TeraHelix is not material to our consolidated financial statements.
On December 31, 2024, we completed the acquisition of ProntoNLP, a leading provider of generative artificial intelligence tooling, allowing users to derive differentiated insights from unstructured and structured data. The acquisition is part of our Market Intelligence segment and its intellectual property is expected to power broader enterprise-wide applications. ProntoNLP’s proprietary models and LLM-based signal tools will bolster S&P Global’s textual data analytics capabilities. The acquisition of ProntoNLP is not material to our consolidated financial statements.
On November 1, 2024, we completed the sale of the PrimeOne business, our outsourced technology platform servicing the global prime finance business. During the year ended December 31, 2024, we recorded a pre-tax gain of $38 million ($27 million after-tax) in (Gain) loss on dispositions, net in the consolidated statement of income related to the sale of PrimeOne in our Market Intelligence segment.
On August 15, 2024, we completed the sale of Fincentric, formerly known as Markit Digital. This sale followed our announced intent to explore strategic opportunities for Fincentric in February of 2024. Fincentric was S&P Global’s premier digital solutions provider focused on developing mobile applications and websites for retail brokerages and other financial institutions. Fincentric specializes in designing cutting-edge financial data visualizations, interfaces and investor experiences. Fincentric was acquired by S&P Global through the merger with IHS Markit and was part of our Market Intelligence segment. During the year ended December 31, 2025, we recorded a pre-tax gain of $3 million ($2 million after-tax) in (Gain) loss on dispositions, net in the consolidated statement of income related to the sale of Fincentic in August of 2024. During the year ended December 31, 2024, we recorded a pre-tax gain of $21 million ($12 million after-tax) in (Gain) loss on dispositions, net in the consolidated statement of income related to the sale of Fincentric in our Market Intelligence segment.
On May 1, 2024, we completed the acquisition of Visible Alpha, the financial technology provider of deep industry and segment consensus data creating a premium offering of fundamental investment research capabilities on Market Intelligence’s Capital IQ Pro platform. The acquisition is part of our Market Intelligence segment and further enhances the depth and breadth of the overall Visible Alpha and S&P Capital IQ Pro offering. The acquisition of Visible Alpha is not material to our consolidated financial statements.
In January of 2023, we completed the acquisition of ChartIQ, a premier charting provider for the financial services industry. ChartIQ is a professional grade charting solution that allows users to visualize data with a fully interactive web-based library that works seamlessly across web, mobile and desktop. It provides advanced capabilities including trade visualization, options analytics, technical analysis and more. Additionally, ChartIQ allows clients to visualize vendor-supplied data combined with their own proprietary content, alternative datasets or analytics. The acquisition further enhances our S&P Capital IQ Pro
48
Table of Contents
platform and other workflow solutions to provide the industry with leading visualization capabilities. The acquisition of ChartIQ is not material to our consolidated financial statements.
In January of 2023, we completed the acquisition of TruSight Solutions LLC (“TruSight”) a provider of third-party vendor risk assessments. The acquisition was integrated into our Market Intelligence segment and further expanded the breadth and depth of S&P Global’s third party vendor risk management solutions by offering high-quality validated assessment data to clients designed to reduce further the vendor due diligence burden on service providers to the financial services industry. The acquisition of TruSight is not material to our consolidated financial statements.
In the first quarter of 2023, we received a contingent payment following the sale of Leveraged Commentary and Data (“LCD”) that resulted in a pre-tax gain of $46 million ($34 million after-tax) which was included in (Gain) loss on dispositions, net in the consolidated statements of income.
See Note 2 - Acquisitions and Divestitures to the consolidated financial statements under Item 8, Consolidated Financial Statements and Supplementary Data, in this Annual Report on Form 10-K for further discussion.
Market Intelligence includes the following business lines:
•Data, Analytics & Insights — a desktop product suite that provides data, analytics and third-party research for global finance and corporate professionals, which includes the Capital IQ platforms (which are inclusive of S&P Capital IQ Pro, Capital IQ, Office and Mobile products) and a broad range of research, reference data, market data, derived analytics and valuation services covering both the public and private capital markets, delivered through flexible feed-based or API delivery mechanisms. This also includes issuer solutions for public companies, a range of products for the maritime & trade market, data and insight into Financial Institutions, the telecoms, technology and media space as well as energy transition and sustainability and supply chain data analytics;
•Enterprise Solutions — software and workflow solutions that help our customers manage and analyze data; identify risk; reduce costs; and meet global regulatory requirements. The portfolio includes industry leading financial technology solutions like Wall Street Office, Enterprise Data Manager, Information Mosaic, and iLevel. Our Global Markets Group offering delivers bookbuilding platforms across multiple assets including municipal bonds, equities and fixed income; and
•Credit & Risk Solutions — commercial arm that sells Ratings’ credit ratings and related data and research, advanced analytics, and financial risk solutions which includes subscription-based offerings, RatingsXpress®, RatingsDirect® and Credit Analytics.
Subscription revenue at Market Intelligence is primarily derived from distribution of data, valuation services, analytics, third party research, and credit ratings-related information through both feed and web-based channels. Subscription revenue also includes software and hosted product offerings which provide maintenance and continuous access to our platforms over the contract term. Recurring variable revenue at Market Intelligence represents revenue from contracts for services that specify a fee based on, among other factors, the number of trades processed, assets under management, or the number of positions valued. Non-subscription revenue at Market Intelligence is primarily related to certain advisory, pricing conferences and events, and analytical services.
49
Table of Contents
The following table provides revenue and segment operating profit information for the years ended December 31:
(in millions)
Year ended December 31,
% Change
2025
2024
2023
’25 vs ’24
’24 vs ’23
Revenue
$
4,916
$
4,645
$
4,376
6
%
6
%
Subscription revenue
$
4,107
$
3,882
$
3,685
6
%
5
%
Recurring variable revenue
$
623
$
579
$
504
8
%
15
%
Non-subscription revenue
$
186
$
184
$
187
2
%
(2)
%
% of total revenue:
Subscription revenue
83
%
84
%
84
%
Recurring variable revenue
13
%
12
%
12
%
Non-subscription revenue
4
%
4
%
4
%
U.S. revenue
$
2,924
$
2,766
$
2,600
6
%
6
%
International revenue
$
1,992
$
1,879
$
1,776
6
%
6
%
% of total revenue:
U.S. revenue
59
%
60
%
59
%
International revenue
41
%
40
%
41
%
Operating profit 1
$
991
$
875
$
714
13
%
22
%
% Operating margin
20
%
19
%
16
%
12025 includes employee severance charges of $56 million, acquisition-related costs of $21 million, disposition-related costs of $10 million, Executive Leadership Team transition costs of $5 million, a statutorily required labor law accrual adjustment of $3 million and a gain on disposition of $3 million. 2024 includes employee severance charges of $77 million, gain on dispositions of $59 million, IHS Markit merger costs of $36 million, a net acquisition-related benefit of $12 million and Executive Leadership Team transition costs of $3 million. 2023 includes employee severance charges of $90 million, acquisition-related costs of $69 million, IHS Markit merger costs of $49 million, a gain on disposition of $46 million, an asset impairment of $5 million and an asset write-off of $1 million. 2025, 2024 and 2023 include amortization of intangibles from acquisitions of $588 million, $591 million and $561 million, respectively.
2025
Revenue increased 6% primarily due to subscription revenue growth in Data, Analytics & Insights which was favorably impacted by the acquisitions of Visible Alpha in May of 2024 and With Intelligence in November of 2025, growth for work flow solutions in Enterprise Solutions, and growth in RatingsXpress® and RatingsDirect®, partially offset by the unfavorable impact of the sale of Fincentric in August of 2024. An increase in recurring variable revenue due to increased volumes also contributed to revenue growth. Foreign exchange rates had a favorable impact of less than 1 percentage point.
Operating profit increased 13%. Excluding the impact of a gain on dispositions in 2024 of 3 percentage points, a net acquisition-related cost in 2025 compared to acquisition-related benefit in 2024 of 2 percentage points, partially offset by IHS merger costs in 2024 of 2 percentage points, higher employee severance charges in 2024 of 1 percentage point, operating profit increased 11% primarily due to revenue growth, lower outside services expenses and decreased incentives, partially offset by higher compensation costs driven by annual merit increases and additional headcount and expenses associated with the acquisition of Visible Alpha. Foreign exchange rates had a favorable impact of 2 percentage points.
2024
Revenue increased 6% primarily due to subscription revenue growth in Data, Analytics & Insights, growth for work flow solutions at Enterprise Solutions and growth in RatingsXpress®, RatingsDirect® and Credit Analytics, partially offset by increased cancellations during the year ended December 31, 2024. Revenue growth was favorably impacted by the acquisition of Visible Alpha in May of 2024 and unfavorably impacted by the divestitures of Fincentric and the PrimeOne business in August of 2024 and November of 2024, respectively. An increase in recurring variable revenue due to increased volumes also contributed to revenue growth. Foreign exchange rates had a favorable impact of less than 1 percentage point.
50
Table of Contents
Operating profit increased 22%. Excluding the impact of a net acquisition-related benefit in 2024 compared to acquisition-related costs in 2023 of 16 percentage points, a higher gain on dispositions in 2024 of 2 percentage points, higher employee severance charges in 2023 of 2 percentage points, higher IHS Markit merger costs in 2023 of 2 percentage points and an asset impairment in 2023 of 1 percentage point, partially offset by higher amortization of intangibles from acquisitions in 2024 of 6 percentage points, operating profit increased 5% primarily due to revenue growth, partially offset by higher compensation costs driven by annual merit increases, increased incentives, increased technology costs and expenses associated with the acquisition of Visible Alpha. Foreign exchange rates had a favorable impact of 3 percentage points.
Industry Highlights and Outlook
Key strategic initiatives for Market Intelligence in 2026 include developing new products and enhancements leveraging technology investments and geographic expansion.
Legal and Regulatory Environment
The market for data, analytical capabilities, research services and software services is intensely competitive, ranging from established firms to fast evolving market disruptors. Market Intelligence competes domestically and internationally based on a number of factors, including the quality and range of its data, analytical capabilities, research services, software services, client service, reputation, price, geographic scope, and technological innovation.
Market Intelligence is subject to global regulation, particularly in the European Union, the U.K., the U.S. and increasingly so in other jurisdictions. Several laws and regulations in the European Union, the U.K. and the U.S. have been adopted but not yet implemented, or have been proposed or are being considered, to which Market Intelligence, or its clients, will or may become subject, including laws and regulations related to pricing providers, sustainability, credit rating data, data privacy and cyber security and technology and organizational resilience. For example, the EU passed the Digital Operational Resilience Act in December 2022 (“DORA”), which became effective in early 2025. DORA imposes operational resilience and cyber security standards and obligations, including technical and organizational standards and responsibilities which require technology and/or organizational investment, upon (i) many Market Intelligence financial market clients, who aim to pass such obligations onto vendors like Market Intelligence, and (ii) information and communications technology providers designated by the EU as “Critical Third Party Providers,” which in certain instances includes Market Intelligence. The U.K. Financial Conduct Authority has published a consultation on establishing a UK Operational Resilience Framework, which if adopted may impact our Market Intelligence financial market clients who may look to pass such obligations onto vendors like Market Intelligence. In addition, from time to time, government and self-regulatory agencies in jurisdictions where we operate conduct market studies on our markets, which may result in the imposition of remedies that impact our business.
Increasing use of AI across our Market Intelligence business subjects Market Intelligence to evolving and potentially complex legal requirements. For example, the European Union Artificial Intelligence Act ("EU AI Act"), adopted in 2024, establishes a legal framework for the development and use of AI in the EU. The EU AI Act classifies AI systems by risk and imposes strict requirements on high-risk applications. We continue to evaluate the potential implications for our products and services and practice to ensure compliance with the EU AI Act, including transparency and data governance obligations in respect of any AI we utilize. The EU AI Act may result in additional compliance obligations particularly as relates to our operations that leverage AI technologies.
At this time, the exact impact on Market Intelligence of any such recently adopted or proposed laws or regulations, or market studies, remains uncertain, but they could increase the regulatory exposure of Market Intelligence and are anticipated to increase the costs and legal risks relating to certain of Market Intelligence’s activities. Furthermore such laws and regulations may adversely affect the ability of Market Intelligence to provide its products and services, or result in changes in the demand for its products and services. If Market Intelligence fails to comply with any such laws or regulations, it could be subject to significant litigation, civil or criminal penalties, monetary damages, regulatory enforcement actions or fines. Regulatory developments may also present commercial opportunities to Market Intelligence to develop further or different services to enable better compliance by its clients.
For a further discussion of competitive and other risks inherent in our Market Intelligence business, see Item 1A, Risk Factors, in this Annual Report on Form 10-K. For a further discussion of the legal and regulatory environment in our Market Intelligence business, see Note 13 – Commitments and Contingencies to the consolidated financial statements under Item 8, Consolidated Financial Statements and Supplementary Data, in this Annual Report on Form 10-K.
51
Table of Contents
Ratings
Ratings is an independent provider of credit ratings, research, and analytics. Credit ratings are forward-looking opinions about an issuer’s relative creditworthiness. They are one of several tools investors can use when making decisions about purchasing bonds and other fixed income investments. Our ratings express our opinion about the ability and willingness of an issuer, such as a corporation or state or city government, to meet its financial obligations in full and on time. Our credit ratings can also relate to the credit quality of an individual debt issue, such as a corporate or municipal bond, and the relative likelihood that the issue may default.
On November 7, 2025, Crisil, included within our Ratings segment, completed the acquisition of McKinsey PriceMetrix Co., a leading provider of performance benchmarking and data-driven insights for the wealth management industry. This acquisition expands Crisil’s benchmarking offerings across the Wealth Management value chain. The acquisition of McKinsey PriceMetrix Co. is not material to our consolidated financial statements.
Ratings disaggregates its revenue between transaction and non-transaction. Transaction revenue primarily includes fees associated with:
•ratings related to new issuance of corporate and government debt instruments, as well as structured finance debt instruments; and
•bank loan ratings.
Non-transaction revenue primarily includes fees for surveillance of a credit rating, annual fees for customer relationship-based pricing programs, fees for entity credit ratings and global research and analytics at Crisil. Non-transaction revenue also includes an intersegment royalty charged to Market Intelligence for the rights to use and distribute content and data developed by Ratings. Royalty revenue for 2025, 2024 and 2023 was $172 million, $162 million and $154 million, respectively.
The following table provides revenue and segment operating profit information for the years ended December 31:
(in millions)
Year ended December 31,
% Change
2025
2024
2023
’25 vs ’24
’24 vs ’23
Revenue
$
4,724
$
4,370
$
3,332
8
%
31
%
Transaction revenue
$
2,470
$
2,326
$
1,425
6
%
63
%
Non-transaction revenue
$
2,254
$
2,044
$
1,907
10
%
7
%
% of total revenue:
Transaction revenue
52
%
53
%
43
%
Non-transaction revenue
48
%
47
%
57
%
U.S. revenue
$
2,711
$
2,500
$
1,824
8
%
37
%
International revenue
$
2,013
$
1,870
$
1,508
8
%
24
%
% of total revenue:
U.S. revenue
57
%
57
%
55
%
International revenue
43
%
43
%
45
%
Operating profit 1
$
3,013
$
2,707
$
1,864
11
%
45
%
% Operating margin
64
%
62
%
56
%
12025 includes legal costs of $42 million and employee severance charges of $17 million. 2024 includes legal costs of $20 million, a statutorily required bonus accrual adjustment of $6 million and employee severance charges of $5 million. 2023 includes employee severance charges of $10 million and an asset impairment of $1 million. 2025, 2024 and 2023 include amortization of intangibles from acquisitions of $6 million, $14 million and $8 million, respectively.
52
Table of Contents
2025
Revenue increased 8%, with a favorable impact from foreign exchange rates of 1 percentage point. Transaction revenue increased primarily due to higher corporate bond ratings revenue, partially offset by lower bank loan ratings revenue. An increase in structured finance revenue driven by increased collateralized loan obligations (“CLOs”) issuance also contributed to transaction revenue growth. Non-transaction revenue increased primarily due to an increase in surveillance revenue and an increase in revenue at our Crisil subsidiary. Transaction and non-transaction revenue also benefited from improved contract terms across product categories.
Operating profit increased 11%. Excluding the impact of higher legal costs in 2025 of 1 percentage point, operating profit increased 12%primarily due to revenue growth and decreased incentive costs, partially offset by higher compensation costs driven by annual merit increases and additional headcount, and an increase in strategic investments. Foreign exchange rates had a favorable impact of less than 1 percentage point.
2024
Revenue increased 31%, with a favorable impact from foreign exchange rates of less than 1 percentage point. Transaction revenue increased primarily due to growth in corporate bond ratings revenue and bank loan ratings revenue driven by increased issuance volumes due to higher refinancing activity. An increase in structured finance revenue driven by increased CLO issuance also contributed to transaction revenue growth. Non-transaction revenue increased primarily due to an increase in surveillance revenue and an increase in new entity credit ratings revenue. Transaction and non-transaction revenue also benefited from improved contract terms across product categories.
Operating profit increased 45%. Excluding the impact of legal costs in 2024 of 1 percentage point, operating profit increased 46% due to revenue growth, partially offset by increased incentives as a result of financial performance and higher compensation costs driven by annual merit increases and additional headcount. Foreign exchange rates had a favorable impact of 1 percentage point.
Billed Issuance Volumes
We monitor billed issuance volumes regularly within Ratings. Billed issuance excludes items that do not impact transaction revenue, such as issuance from frequent issuer programs, unrated debt, and most international public finance to more effectively correlate issuance activity to movements in transaction revenue.
The following table provides billed issuance levels based on Ratings’ internal data feeds for the years ended December 31:
(in billions)
Year ended December 31,
% Change
2025
2024
2023
’25 vs ’24
’24 vs ’23
Investment-grade billed issuance *
$
1,662
$
1,497
$
1,102
11%
36%
High-yield billed issuance *
$
586
$
501
$
258
17%
94%
Other billed issuance **
$
2,078
$
1,914
$
1,179
9%
62%
Total billed issuance
$
4,327
$
3,911
$
2,539
11%
54%
Note - Totals presented may not sum due to rounding.
* Includes Corporates, Financial Services and Infrastructure.
** Includes Bank Loans, Structured Finance and Government.
2025
Billed issuance was up in 2025 due to increases in high yield, investment grade and structured finance. Tightening borrowing spreads drove refinancing in high yield, while AI-related issuance drove billed issuance increases in investment grade. Structured finance billed issuance increases were driven primarily by new CLO issuance.
2024
Billed issuance was up in 2024 as continued favorable market conditions drove issuers to capitalize on tightening borrowing spreads. Refinancing continued to drive high-yield, while M&A and other non-refinancing activity also drove billed issuance increases in investment grade and bank loans. Structured finance billed issuance increases were driven primarily by new CLO issuance.
53
Table of Contents
Industry Highlights and Outlook
Revenue increased in 2025 driven by growth in both non-transaction and transaction revenue. Transaction revenue increased primarily due to higher corporate bond ratings revenue, partially offset by lower bank loan ratings revenue. An increase in structured finance revenue driven by increased CLO issuance also contributed to transaction revenue growth. Non-transaction revenue increased primarily due to an increase in surveillance revenue and an increase in revenue at our Crisil subsidiary.
A few of the key strategic initiatives for Ratings in 2026 include private market opportunities, which contributed to revenue growth in 2025, and geographic expansion.
Legal and Regulatory Environment
General
Ratings and many of the securities that it rates are subject to extensive regulation in both the U.S. and in other countries, and therefore existing and proposed laws and regulations can impact the Company’s operations and the markets in which it operates. Additional laws and regulations have been adopted but not yet implemented or have been proposed or are being considered. In addition, in certain countries, governments may provide financial or other support to locally-based rating agencies. For example, governments may from time to time establish official rating agencies or credit ratings criteria or procedures for evaluating local issuers. We have reviewed the new laws, regulations and rules which have been adopted and we have implemented, or are planning to implement, changes as required. We do not believe that such new laws, regulations or rules will have a material adverse effect on our financial condition or results of operations. Other laws, regulations and rules relating to credit rating agencies are from time to time considered by local, national, foreign and multinational bodies and are likely to continue to be considered in the future, including, for example, provisions seeking to reduce regulatory and investor reliance on credit ratings or to increase competition among credit rating agencies, provisions regarding remuneration and rotation of credit rating agencies, and liability standards applicable to credit rating agencies. Similarly, other laws, regulations and rules are being adopted or considered or are likely to be considered in the future that may impact ancillary and other services provided by Ratings in addition to its credit rating products and services, for example regulatory oversight regimes for ESG ratings providers such as the EU regulation on the transparency and integrity of ESG rating activities that was adopted by the European Parliament and Council in November 2024 (the "EU ESG Ratings Regulation"), or legislation and draft rules published by the U.K. FCA in 2025 to supervise ESG ratings providers from June 2028 (the “UK ESG Ratings Regulatory Framework”). The impact on us of the adoption of any such laws, regulations or rules remains uncertain, but could increase the costs and legal risks relating to Ratings’ activities, or adversely affect our ability to compete and/or our remuneration, or result in changes in the demand for our products and services.
Increasing use of AI across our Ratings business subjects Ratings to evolving and potentially complex legal requirements, which may result in additional compliance obligations for our Ratings business operations that leverage AI technologies.
In the normal course of business both in the U.S. and abroad, Ratings (or the legal entities comprising Ratings) are defendants in numerous legal proceedings and are often the subject of government and regulatory proceedings, investigations and inquiries. Many of these proceedings, investigations and inquiries relate to the ratings activity of Ratings and are or have been brought by purchasers of rated securities. In addition, various government and self-regulatory agencies frequently make inquiries and conduct investigations into Ratings’ compliance with applicable laws and regulations. Any of these proceedings, investigations or inquiries could ultimately result in adverse judgments, damages, fines, penalties, activity restrictions or negative impacts on our cash flow, which could adversely impact our consolidated financial condition, cash flows, business or competitive position.
U.S.
The businesses conducted by our Ratings segment are, in certain cases, regulated under the Credit Rating Agency Reform Act of 2006 (the “Reform Act”), the Dodd-Frank Wall Street Reform and Consumer Protection Act (the “Dodd Frank Act”), the Securities Exchange Act of 1934 (the “Exchange Act”) and/or the laws of the states or other jurisdictions in which our Ratings segment conducts business. The financial services industry is subject to the potential for increased regulation in the U.S.
S&P Global Ratings is a credit rating agency that is registered with the SEC as a Nationally Recognized Statistical Rating Organization (“NRSRO”). The SEC first began informally designating NRSROs in 1975 for use of their credit ratings in the determination of capital charges for registered brokers and dealers under the SEC’s Net Capital Rule. The Reform Act created a new SEC registration system for rating agencies that choose to register as NRSROs. Under the Reform Act, the SEC is given authority and oversight of NRSROs and can censure NRSROs, revoke their registration or limit or suspend their registration in certain cases. The rules implemented by the SEC pursuant to the Reform Act, the Dodd Frank Act and the Exchange Act address, among other things, prevention or misuse of material non-public information, conflicts of interest, documentation and assessment of internal controls, and improving transparency of ratings performance and methodologies. The public portions of the current version of S&P Global Ratings’ Form NRSRO are available on S&P Global Ratings’ website.
54
Table of Contents
European Union
In the European Union ("EU"), the credit rating industry is registered and supervised through a pan-European regulatory framework which is a compilation of three sets of legislative actions. In 2009, the European Parliament passed a regulation (“CRA1”) that established an oversight regime for the credit rating industry in the EU, which became effective in 2010. CRA1 requires the registration, formal regulation and periodic inspection of credit rating agencies operating in the EU. Ratings was granted registration in October of 2011. In January of 2011, the EU established the European Securities and Markets Authority (“ESMA”), which, among other things, has direct supervisory responsibility for the registered credit rating industry throughout the EU.
Additional rules augmenting the supervisory framework for credit rating agencies went into effect in 2013. Commonly referred to as CRA3, these rules, among other things:
•impose various additional procedural requirements with respect to ratings of sovereign issuers;
•require member states to adopt laws imposing liability on credit rating agencies for an intentional or grossly negligent failure to abide by the applicable regulations;
•impose mandatory rotation requirements on credit rating agencies hired by issuers of securities for ratings of resecuritizations, which may limit the number of years a credit rating agency can issue ratings for such securities of a particular issuer;
•impose restrictions on credit rating agencies or their shareholders if certain ownership thresholds are crossed; and
•impose additional procedural and substantive requirements on the pricing of services.
Since January 2025, Ratings has been subject in the EU to new operational resilience and cyber security standards under the Digital Operational Resilience Act, including technical and organizational standards and responsibilities which may require technology and/or organizational investment.
The EU ESG Ratings Regulation will start applying mid-2026 and could impose new regulatory requirements regarding some of Ratings' ancillary and other services.
The financial services industry is subject to the potential for increased regulation in the EU.
United Kingdom
Following its exit from the European Union, the United Kingdom (“U.K.”) established a credit rating agencies oversight regime with rules that closely mirror those in place in the EU. Ratings was granted registration with the U.K. Financial Conduct Authority (“FCA”) on January 1, 2021. It is possible that the rules applicable to credit rating agencies in the U.K. will diverge from those in the EU in the future as a result of changes to one or the other legislative regime or differing approaches by the FCA and ESMA.
The UK ESG Ratings Regulatory Framework is expected to apply in full from June 2028 and could impose new regulatory requirements regarding some of Ratings' ancillary and other services.
Other Jurisdictions
Outside of the U.S., the EU and the U.K., regulators and government officials have also been implementing formal oversight of credit rating agencies. Ratings is subject to regulations in most of the foreign jurisdictions in which it operates and continues to work closely with regulators globally to promote the global consistency of regulatory requirements. Regulators in additional countries may introduce new regulations in the future.
For a further discussion of competitive and other risks inherent in our Ratings business, see Item 1A, Risk Factors, in this Annual Report on Form 10-K. For a further discussion of the legal and regulatory environment in our Ratings business, see Note 13 – Commitments and Contingencies to the consolidated financial statements under Item 8, Consolidated Financial Statements and Supplementary Data, in this Annual Report on Form 10-K.
55
Table of Contents
Energy
Energy is a leading independent provider of information and benchmark prices for the energy and commodity markets. Energy provides essential price data, analytics, industry insights and software & services, enabling the energy and commodity markets to perform with greater transparency and efficiency.
On May 14, 2024, we completed the acquisition of World Hydrogen Leaders, a globally-recognized portfolio of hydrogen-related conferences and events, digital training and market intelligence. The acquisition is part of our Energy segment and complements Energy's global conference business and provides customers with full coverage of the hydrogen and derivative value chain alongside Energy Transition and Sustainability solutions, including hydrogen price assessments, emission factors and market research. The acquisition of World Hydrogen Leaders is not material to our consolidated financial statements.
Energy includes the following business lines:
•Energy & Resources Data & Insights — includes data, news, insights, and analytics for petroleum, gas, power & renewables, petrochemicals, metals & steel, agriculture, and other commodities;
•Price Assessments — includes price assessments and benchmarks, and forward curves;
•Upstream Data & Insights — includes exploration & production data and insights, software and analytics; and
•Advisory & Transactional Services — includes consulting services, conferences, events and global trading services.
Energy’s revenue is generated primarily through the following sources:
•Subscription revenue — primarily from subscriptions to our market data and market insights (price assessments, market reports and commentary and analytics) along with other information products and software term licenses;
•Sales usage-based royalties — primarily from licensing our proprietary market price data and price assessments to commodity exchanges; and
The following table provides revenue and segment operating profit information for the years ended December 31:
(in millions)
Year ended December 31,
% Change
2025
2024
2023
’25 vs ’24
’24 vs ’23
Revenue
$
2,299
$
2,142
$
1,946
7
%
10
%
Subscription revenue
$
2,016
$
1,873
$
1,707
8
%
10
%
Sales usage-based royalties
$
120
$
103
$
81
17
%
27
%
Non-subscription revenue
$
163
$
166
$
158
(2)
%
5
%
% of total revenue:
Subscription revenue
88
%
87
%
88
%
Sales usage-based royalties
5
%
5
%
4
%
Non-subscription revenue
7
%
8
%
8
%
U.S. revenue
$
885
$
835
$
773
6
%
8
%
International revenue
$
1,414
$
1,307
$
1,173
8
%
11
%
% of total revenue:
U.S. revenue
39
%
39
%
40
%
International revenue
61
%
61
%
60
%
Operating profit 1
$
943
$
845
$
704
12
%
20
%
% Operating margin
41
%
39
%
36
%
12025 includes employee severance charges of $19 million and a statutorily required labor law accrual adjustment of $1 million. 2024 includes IHS Markit merger costs of $14 million, employee severance charges of $13 million, asset write-offs of $1 million and disposition-related costs of $1 million. 2023 includes IHS Markit merger costs of $35 million, employee severance charges of $26 million and acquisition-related costs of $2 million. 2025 and 2024 include amortization of intangibles from acquisitions of $130 million. 2023 includes amortization of intangibles from acquisitions $131 million.
2025
Revenue increased 7% primarily due to continued demand for market data and market insights products driven by expanded product offerings to our existing customers under enterprise use contracts and an increase in conference revenue driven by increased attendance at CERAWeek in 2025. An increase in sales usage-based royalties from the licensing of our proprietary market data to commodity exchanges due to increased trading volumes for Platts based contracts across all commodity sectors also contributed to revenue growth. All four business lines contributed to revenue growth in 2025 with the Energy & Resources Data & Insights, Price Assessments and Advisory & Transactional Services businesses being the most significant drivers, followed by the Upstream Data & Insights business that increased less than 1%. Foreign exchange rates had an unfavorable impact of less than 1 percentage point.
Operating profit increased 12%. Excluding the impact of IHS Markit merger costs in 2024 of 5 percentage points, partially offset by higher employee severance charges in 2025 of 2 percentage points, operating profit increased 9%. The increase was primarily due to revenue growth and decreased incentives, partially offset by higher compensation costs driven by annual merit increases and additional headcount, investment in strategic initiatives and expenses associated with the acquisition of World Hydrogen Leaders. Foreign exchange rates had an unfavorable impact of less than 1 percentage point.
2024
Revenue increased 10% primarily due to continued demand for market data and market insights products driven by expanded product offerings to our existing customers under enterprise use contracts. An increase in sales usage-based royalties from the licensing of our proprietary market data to commodity exchanges due to increased trading volumes for Platts based contracts across all commodity sectors and higher consulting revenue also contributed to revenue growth. Revenue was favorably impacted by the acquisition of World Hydrogen Leaders in May of 2024. All four business lines contributed to revenue growth in 2024 with the Price Assessments, Energy & Resources Data & Insights and Advisory & Transactional Services businesses being the most significant drivers, followed by the Upstream Data & Insights business. Foreign exchange rates had an unfavorable impact of less than 1 percentage point.
57
Table of Contents
Operating profit increased 20%. Excluding the impact of higher IHS Markit merger costs in 2023 of 5 percentage points and higher employee severance charges in 2023 of 3 percentage points, operating profit increased 12%. The increase was primarily due to revenue growth partially offset by higher compensation costs driven by annual merit increases, higher incentives, investment in strategic initiatives and expenses associated with the acquisition of World Hydrogen Leaders. Foreign exchange rates had a favorable impact of less than 1 percentage point.
Industry Highlights and Outlook
In 2025, sustained demand for market data and market insights products, an increase in sales usage-based royalties from the licensing of our proprietary market data and price assessments to commodity exchanges mainly due to increased trading volumes, and higher conference revenue contributed to revenue growth.
Key strategic initiatives for Energy in 2026 include developing new products and enhancements leveraging technology investments and geographic expansion.
Legal and Regulatory Environment
Energy's price assessment business is subject to increasing regulatory scrutiny. Energy is subject to commodity benchmark regulation in the EU (the “EU Benchmark Regulation”) and the U.K. (the "U.K. Benchmark Regulation"), as well as increasing regulation in other jurisdictions. Energy has obtained authorization and is now supervised by the Dutch Authority for the Financial Markets in the Netherlands under the EU Benchmark Regulation, and it will likely need to take similar steps in other jurisdictions including the United Kingdom when the transitional period under the EU Benchmark Regulation (and its equivalent under the U.K. Benchmark Regulation) ends, as well as in jurisdictions outside of Europe implementing similar legislation. The U.S. Federal Energy Regulatory Commission does not directly supervise Energy, but it does impose standards on Energy, and it also has supervisory authority over Energy's clients and third-party data providers in the U.S. natural gas and power markets.
The EU's package of legislative measures called the Markets in Financial Instruments Directive and Regulation (collectively "MiFID II") have applied in all EU Member States since 2018. MiFID II includes provisions that, among other things: (i) impose new conditions and requirements on the licensing of benchmarks and provide for non-discriminatory access to exchanges and clearing houses; (ii) modify the categorization and treatment of certain classes of derivatives; (iii) expand the categories of trading venue that are subject to regulation; (iv) require the unbundling of investment research and direct how asset managers pay for research either out of a research payment account or from a firm’s profits; and (v) provide for the mandatory trading of certain derivatives on exchanges (complementing the mandatory derivative clearing requirements in the E.U. Market Infrastructure Regulation of 2011). MiFID II and the Market Abuse Regulation may impose additional regulatory burdens on Energy activities in the EU over time, but their impact on, and costs to, the Company have not yet been substantive.
In October of 2012, IOSCO issued its Principles for Oil Price Reporting Agencies ("PRA Principles"), which are intended to enhance the reliability of oil price assessments referenced in derivative contracts subject to regulation by IOSCO members. Energy has aligned its operations with the PRA Principles and, as recommended by IOSCO in its final report on the PRA Principles, has aligned to the PRA Principles for other commodities for which it publishes benchmarks.
Increasing use of AI across our Energy business subjects Energy to evolving and potentially complex legal requirements, which may result in additional compliance obligations for our Energy business operations that leverage AI technologies.
From time to time, government and self-regulatory agencies in jurisdictions where we operate conduct market studies on our markets, which may result in the imposition of remedies that impact our business.
Other laws, regulations and rules are being adopted, amended or considered or are likely to be considered in the future that may impact Energy, for example regulatory oversight regimes for ESG ratings providers such as the EU regulation on the transparency and integrity of ESG rating activities that was adopted by the European Parliament and Council in November 2024 (the "EU ESG Ratings Regulation"). The EU ESG Ratings Regulation will start applying mid-2026 and could impose new regulatory requirements regarding some of Energy’s ancillary and other services. Energy will also be subject to The Financial Services and Markets Act 2000 (Regulated Activities) (ESG Ratings) Order 2025 and will need to become supervised by the U.K. Financial Conduct Authority for the ESG ratings it provides from June 2028. The impact on us of the adoption of any such laws, regulations or rules remains uncertain, but could increase the costs and legal risks relating to Energy’s activities, or adversely affect our ability to compete and/or our remuneration, or result in changes in the demand for our products and services.
58
Table of Contents
For a further discussion of competitive and other risks inherent in our Energy business, see Item 1A, Risk Factors, in this Annual Report on Form 10-K. For a further discussion of the legal and regulatory environment in our Energy business, see Note 13 – Commitments and Contingencies to the consolidated financial statements under Item 8, Consolidated Financial Statements and Supplementary Data, in this Annual Report on Form 10-K.
Mobility
Mobility is a leading provider of solutions serving the full automotive value chain including vehicle manufacturers (Original Equipment Manufacturers or OEMs), automotive suppliers, mobility service providers, retailers, consumers, and finance and insurance companies.
In February of 2023, we completed the acquisition of Market Scan Information Systems Inc. (“Market Scan”), a leading provider of automotive pricing and incentive intelligence, including Automotive Payments as a ServiceTM and its powerful payment calculation engine. The addition of Market Scan to Mobility enabled the integration of detailed transaction intelligence in areas that are complementary to existing services for dealers, OEMs, lenders, and other market participants. The acquisition of Market Scan is not material to our consolidated financial statements.
Mobility includes the following business lines:
•Dealer — includes analytics to predict future buyers, targeted marketing, and vehicle history data to allow people to shop, buy, service and sell used cars;
•Manufacturing — includes insights, forecasts and advisory services spanning the entire automotive value chain, from product planning to marketing, sales and the aftermarket; and
•Financial — includes reports and data feeds to support lenders and insurance companies.
Mobility’s revenue is generated primarily through the following sources:
•Subscription revenue — Mobility’s core information products provide critical information and insights to all global OEMs, most of the world’s leading suppliers, and the majority of the top North American dealerships. Mobility operates across both the new and used car markets. Mobility provides data and insight on future vehicles sales and production, including detailed forecasts on technology and vehicle components; supplies car makers and dealers with market reporting products, predictive analytics and marketing automation software; and supports dealers with vehicle history reports, used car listings and service retention services. Mobility also sells a range of services to financial institutions, to support their marketing, insurance underwriting and claims management activities; and
•Non-subscription revenue — Transactional sales of data that are non-cyclical in nature – and that are usually tied to underlying business metrics such as OEM marketing spend or safety recall activity – as well as consulting and advisory services.
59
Table of Contents
The following table provides revenue and segment operating profit information for the years ended December 31:
(in millions)
Year ended December 31,
% Change
2025
2024
2023
’25 vs ’24
’24 vs ’23
Revenue
$
1,747
$
1,609
$
1,484
9
%
8
%
Subscription revenue
$
1,422
$
1,299
$
1,169
10
%
11
%
Non-subscription revenue
$
325
$
310
$
315
5
%
(2)
%
% of total revenue:
Subscription revenue
81
%
81
%
79
%
Non-subscription revenue
19
%
19
%
21
%
U.S. revenue
$
1,451
$
1,325
$
1,223
9
%
8
%
International revenue
$
296
$
284
$
261
4
%
9
%
% of total revenue:
U.S. revenue
83
%
82
%
82
%
International revenue
17
%
18
%
18
%
Operating profit 1
$
378
$
312
$
260
21
%
20
%
% Operating margin
22
%
19
%
18
%
1 2025 includes employee severance charges of $15 million, disposition-related costs of $7 million, Executive Leadership Team transition benefit of $4 million and a legal settlement recovery of $3 million. 2024 includes employee severance charges of $7 million, IHS Markit merger costs of $4 million, acquisition-related costs of $2 million and a liability write-off of $1 million. 2023 includes employee severance charges of $9 million, IHS Markit merger costs of $3 million and acquisition-related costs of $2 million. 2025 and 2024 include amortization of intangibles from acquisitions of $303 million. 2023 includes amortization of intangibles from acquisitions of $301 million.
2025
Revenue increased 9% primarily due to growth within the Dealer and Financial businesses driven by continued new business growth within the Dealer business, strong underwriting volumes and market share growth within the Financial business. Additionally, the Dealer and Financial businesses were favorably impacted by improved contract terms. Non-subscription revenue growth was unfavorably impacted by the tightening of the Manufacturing businesses’ discretionary budgets due to market conditions around tariffs and uncertainty around EV adoption; together with lower recall activity. Foreign exchange rates had an unfavorable impact of less than 1 percentage point.
Operating profit increased 21%. Excluding the impact of an Executive Leadership Team transition benefit in 2025 of 12 percentage points, a legal settlement recovery in 2025 of 8 percentage points, IHS Markit merger costs in 2024 of 10 percentage points and higher acquisition related costs in 2024 of 5 percentage points, partially offset by higher employee severance costs in 2025 of 22 percentage points, higher disposition-related costs in 2025 of 20 percentage points, an asset write-off in 2024 of 2 percentage points and higher amortization of intangibles from acquisitions in 2025 of 1 percentage point operating profit increased 11%. The increase was primarily driven by revenue growth, partially offset by higher compensation costs driven by annual merit increases and additional headcount, an increase in advertising and promotion costs and an increase in strategic investments. Foreign exchange rates had a favorable impact of 1 percentage point.
2024
Revenue increased 8% primarily due to growth within the Dealer and Financial businesses driven by continued new business growth within the Dealer business and strong underwriting volumes within the Financial business. These increases were partially offset by a decrease in non-subscription revenue in the Manufacturing business due to lower recall activity and marketing services. Revenue at Mobility was favorably impacted by the acquisition of Market Scan in February of 2023. Foreign exchange rates had an unfavorable impact of 1 percentage point.
Operating profit increased 20%. Excluding the impact of higher employee severance charges in 2023 of 19 percentage points, a liability write-off in 2024 of 4 percentage points and higher acquisition-related costs in 2023 of 4 percentage points, partially
60
Table of Contents
offset by higher amortization of intangibles in 2024 of 8 percentage points and higher IHS Markit merger costs in 2024 of 8 percentage points, operating profit increased 9% driven by revenue growth, partially offset by higher compensation costs driven by annual merit increases, higher incentives, an increase in strategic investments and expenses associated with the acquisition of Market Scan. Foreign exchange rates had an unfavorable impact of 1 percentage point.
Industry Highlights and Outlook
All three business lines contributed to revenue growth in 2025 with the Dealer and Financial businesses being the most significant drivers, followed by the Manufacturing business. Non-subscription revenue growth was unfavorably impacted by the tightening of the Manufacturing businesses’ discretionary budgets due to market conditions around tariffs and uncertainty around EV adoption; together with lower recall activity.
On April 29, 2025, we announced that our Board of Directors decided to pursue a full separation of our Mobility segment, creating a new publicly traded company. The transaction, which would be implemented through the spin-off of shares of the new company to S&P Global shareholders, is expected to be tax-free for U.S. federal income tax purposes for S&P Global shareholders and is expected to be completed mid-2026, subject to the satisfaction of customary legal and regulatory requirements and approvals.
Legal and Regulatory Environment
Certain types of information that our Mobility business collects, compiles, stores, uses, transfers, publishes and/or sells is subject to laws and regulations in various jurisdictions in which it operates. There is an increasing public concern regarding, and resulting increasing regulations of, privacy, data, and consumer protection issues. Certain laws and regulations to which our Mobility business is subject pertain to personally identifiable information relating to individuals. Such laws and regulations constrain the collection, use, processing, storage, and transfer of personally identifiable information, and impose other obligations with which we must comply. To conduct our operations, in certain instances, our Mobility business also moves data across national borders and consequently can be subject to a variety of evolving and developing laws and regulations regarding privacy, data protection, and data security in an increasing number of jurisdictions. Many jurisdictions have passed laws in this area, such as the U.S. Driver's Privacy Protection Act ("DPPA"), the Gramm–Leach–Bliley Act, the European Union General Data Protection Regulation (the “GDPR”), the U.K. GDPR, a version of the GDPR as implemented into the laws of the U.K., Quebec Law 25 and proposed Federal Bill C-27 in Canada, the Cybersecurity Law of the People’s Republic of China adopted in 2017, the California Consumer Privacy Act, as modified by the California Privacy Rights and Enforcement Act and numerous other similar comprehensive data privacy and security laws in other U.S. states, as well as numerous other jurisdictions considering imposing similar laws and regulations. These laws and regulations are increasing in complexity and number, change frequently, and increasingly conflict among the various jurisdictions in which our Mobility business operates, which has resulted in greater compliance risk and cost for us. It is possible that our Mobility business could be prohibited or constrained from collecting or disseminating certain types of data or from providing certain products or solutions as a result of such laws and regulations. If our Mobility business fails to comply with these laws or regulations, we could be subject to significant litigation and civil or criminal penalties (including monetary damages, regulatory enforcement actions or fines in one or more jurisdictions), as well as reputational damage that could result in the loss of data, brand equity or business. For example, a failure to comply with the GDPR or U.K. GDPR could result in fines up to the greater of €20 million (or £17.5 million under the U.K. GDPR) or 4% of annual global revenues. Additionally, in the case of a DPPA violation, U.S. courts may award liquidated damages of $2,500 per affected individual. Additional risks are presented by the evolving landscape related to sanctions and export control laws. The landscape related to these laws is evolving rapidly and presents compliance challenges to all businesses covered by these laws.
Our Mobility business is also subject to other regulations geared at consumer protection, such as the California Combating Auto Retail Scams Act, which will become effective on October 1, 2026, and could impact our Mobility business’s products and solutions. In addition, increasing use of AI across our Mobility business subjects Mobility to evolving and potentially complex legal requirements. For example, the EU AI Act, adopted in 2024, establishes a legal framework for the development and use of AI in the EU, and may result in additional compliance obligations for our Mobility business operations that leverage AI technologies.
For a further discussion of competitive and other risks inherent in our Mobility business, see Item 1A, Risk Factors, in this Annual Report on Form 10-K. For a further discussion of the legal and regulatory environment in our Mobility business, see Note 13 – Commitments and Contingencies to the consolidated financial statements under Item 8, Consolidated Financial Statements and Supplementary Data, in this Annual Report on Form 10-K.
61
Table of Contents
Indices
Indices is a global index provider maintaining a wide variety of valuation and index benchmarks for investment advisors, wealth managers and institutional investors. Indices’ mission is to provide transparent benchmarks to help with decision making, collaborate with the financial community to create innovative products, and provide investors with tools to monitor world markets.
On October 1, 2025, we completed the acquisition of ARC Research, a subsidiary of ARC Group, the leading independent provider of investment performance data, benchmarking capabilities and insights in the private wealth market. The acquisition is part of our Indices segment and expands our capabilities to deliver innovative, high-quality benchmarks and data solutions tailored to the evolving needs of wealth managers, private banks, and financial advisers. The acquisition of ARC Research is not material to our consolidated financial statements.
Indices derives revenue from asset-linked fees when investors direct funds into its proprietary designed or owned indexes, sales usage-based royalties of its indices, as well as data subscription arrangements. Specifically, Indices generates revenue from the following sources:
•Investment vehicles — asset-linked fees such as ETFs and mutual funds, that are based on the S&P Dow Jones Indices’ benchmarks that generate revenue through fees based on assets and underlying funds;
•Exchange traded derivatives — generate sales usage-based royalties based on trading volumes of derivatives contracts listed on various exchanges;
•Index-related licensing fees — fixed or variable annual and per-issue asset-linked fees for over-the-counter derivatives and retail-structured products; and
•Data and customized index subscription fees — fees from supporting index fund management, portfolio analytics and research.
The following table provides revenue and segment operating profit information for the years ended December 31:
(in millions)
Year ended December 31,
% Change
2025
2024
2023
’25 vs ’24
’24 vs ’23
Revenue
$
1,850
$
1,628
$
1,403
14%
16%
Asset-linked fees
$
1,206
$
1,046
$
859
15%
22%
Subscription revenue
$
320
$
292
$
277
10%
6%
Sales usage-based royalties
$
324
$
290
$
267
12%
9%
% of total revenue:
Asset-linked fees
65
%
64
%
61
%
Subscription revenue
17
%
18
%
20
%
Sales usage-based royalties
18
%
18
%
19
%
U.S. revenue
$
1,482
$
1,322
$
1,147
12%
15%
International revenue
$
368
$
306
$
256
20%
20%
% of total revenue:
U.S. revenue
80
%
81
%
82
%
International revenue
20
%
19
%
18
%
Operating profit1
$
1,271
$
1,103
$
925
15%
19%
Less: net income attributable to noncontrolling interests
$
322
$
284
$
241
13%
18%
Net operating profit
$
949
$
819
$
684
16%
20%
% Operating margin
69
%
68
%
66
%
% Net operating margin
51
%
50
%
49
%
12025 includes employee severance charges of $4 million and acquisition-related costs of $1 million. 2024 includes IHS Markit merger costs of $4 million, a loss on disposition of $1 million and employee severance charges of $1 million. 2023 includes employee severance charges of $5 million, a gain on disposition of $4 million and IHS Markit merger costs of $4 million. 2025 includes amortization of intangibles from acquisitions of $37 million. 2024 and 2023 include amortization of intangibles from acquisitions of $36 million.
62
Table of Contents
2025
Revenue at Indices increased 14% primarily due to an increase in asset linked fees revenue driven by higher levels of assets under management (“AUM”) for ETFs and mutual funds, higher exchange-traded derivative revenue and higher data subscription revenue. Ending AUM for ETFs increased 25% to $5.480 trillion compared to 2024 and average levels of AUM for ETFs increased 24% to $4.772 trillion compared to 2024. Foreign exchange rates had a favorable impact of 1 percentage point.
Operating profit increased 15%. Excluding the impact of IHS Markit merger costs in 2024 of 6 percentage points and a loss on disposition in 2024 of 2 percentage points, partially offset by higher employee severance charges in 2025 of 5 percentage points, acquisition related costs in 2025 of 2 percentage points and higher amortization of intangibles from acquisitions in 2025 of 1 percentage point, operating profit increased 15% due to revenue growth and decreased incentive costs, partially offset by higher compensation costs driven by annual merit increases, and an increase in strategic investments. Foreign exchange rates had an unfavorable impact of 1 percentage point.
2024
Revenue at Indices increased 16% primarily due to an increase in asset linked fees revenue driven by higher levels of AUM for ETFs and mutual funds, higher over-the-counter derivatives revenue, higher exchange-traded derivative revenue driven by continued strength in trading volume and higher data subscription revenue. Average levels of AUM for ETFs increased 33% to $3.836 trillion and ending AUM for ETFs increased 33% to $4.389 trillion compared to 2023. Foreign exchange rates had an unfavorable impact of less than 1 percentage point.
Operating profit increased 19%. Excluding the impact of a loss on disposition in 2024 compared to a gain on disposition in 2023 of 4 percentage points, partially offset by higher employee severance charges in 2023 of 3 percentage points, operating profit increased 18% due to revenue growth partially offset by higher compensation costs driven by annual merit increases, higher incentives and an increase in strategic investments. Foreign exchange rates had an unfavorable impact of 1 percentage point.
Industry Highlights and Outlook
Revenue increased in 2025 primarily due to an increase in asset linked fees revenue driven by higher levels of AUM for ETFs and mutual funds, higher exchange-traded derivative revenue and higher data subscription revenue. Indices continues to be a leading index provider for the ETF market space.
Key strategic initiatives for Indices in 2026, including Private Markets and Wealth, continue to be areas of focus for Indices and contributed to revenue growth in 2025.
Legal and Regulatory Environment
The financial benchmarks industry is subject to specific benchmark regulation in the European Union (the "EU Benchmark Regulation"), the United Kingdom (the "U.K. Benchmark Regulation"), and Australia (the "Australia Benchmark Regulation"). Various other jurisdictions, including the United States, India, Canada and South Africa, are also considering the regulation of financial benchmarks through new or existing regimes.
Although they vary in scope, the requirements of the EU Benchmark Regulation, the U.K. Benchmark Regulation and the Australian Benchmark Regulation are similar. Indices currently maintains a benchmark administrator in both the Netherlands (supervised by the European Securities and Markets Authority (ESMA)) for its benchmark activities in the European Union and in the United Kingdom (authorized by the Financial Conduct Authority) for itsbenchmark activities in the United Kingdom. The Australian Benchmark Regulation requires a license from the Australian Securities and Investment Commission (“ASIC”), which Indices has obtained. These benchmark regulations have and may continue to cause increased operating obligations, exposure, compliance risk, and costs of doing business for Indices.
In July of 2013, IOSCO issued its Principles for Financial Benchmarks (the “Financial Benchmark Principles”), intended to promote the reliability of financial benchmarks. The Financial Benchmark Principles address governance, benchmark quality and accountability mechanisms, including with regard to the indices published by Indices. Indices has taken steps to align its governance regime, control framework and operations with the Financial Benchmark Principles and engages an independent auditor to perform an annual reasonable assurance review of its adherence to the Financial Benchmark Principles.
63
Table of Contents
Increasing use of AI across our Indices business subjects Indices to evolving and potentially complex legal requirements, which may result in additional compliance obligations for our Indices business operations that leverage AI technologies.
From time to time, government and self-regulatory agencies in jurisdictions where we operate conduct market studies on our markets, which may result in the imposition of remedies that impact our business.
For a further discussion of competitive and other risks inherent in our Indices business, see Item 1A, Risk Factors, in this Annual Report on Form 10-K. For a further discussion of the legal and regulatory environment in our Indices business, see Note 13 – Commitments and Contingencies to the consolidated financial statements under Item 8, Consolidated Financial Statements and Supplementary Data, in this Annual Report on Form 10-K.
Engineering Solutions
As of May 2, 2023, we completed the sale of Engineering Solutions, a provider of engineering standards and related technical knowledge, and the results are included through that date. See Note 2 - Acquisitions and Divestitures to the consolidated financial statements under Item 8, Consolidated Financial Statements and Supplementary Data, in this Annual Report on Form 10-K for information on the sale of Engineering Solutions.
The following table provides revenue and segment operating profit information for the years ended December 31:
(in millions)
Year ended December 31,
% Change
2025
2024
2023
’24 vs ’23
’23 vs ’22
Revenue
$
—
$
—
$
133
N/M
N/M
Subscription revenue
$
—
$
—
$
125
N/M
N/M
Non-subscription revenue
$
—
$
—
$
8
N/M
N/M
% of total revenue:
Subscription revenue
—
%
—
%
94
%
Non-subscription revenue
—
%
—
%
6
%
U.S. revenue
$
72
N/M
N/M
International revenue
$
61
N/M
N/M
% of total revenue:
U.S. revenue
—
%
—
%
54
%
International revenue
—
%
—
%
46
%
Operating profit 1
$
—
$
—
$
19
N/M
N/M
% Operating margin
—
%
—
%
14
%
N/M – Represents a change equal to or in excess of 100% or not meaningful
12023 includes amortization of intangibles from acquisitions of $1 million.
LIQUIDITY AND CAPITAL RESOURCES
We continue to maintain a strong financial position. Our primary source of funds for operations is cash from our businesses and our core businesses have been strong cash generators. In 2026, cash on hand, cash flows from operations and availability under our existing credit facility are expected to be sufficient to meet any additional operating and recurring cash needs in the short term and into the foreseeable future. We use our cash for a variety of needs, including but not limited to: ongoing investments in our businesses, strategic acquisitions, share repurchases, dividends, repayment of debt, capital expenditures and investment in our infrastructure.
64
Table of Contents
Cash Flow Overview
Cash, cash equivalents, and restricted cash were $1.7 billion as of December 31, 2025 and 2024.
(in millions)
Year ended December 31,
2025
2024
2023
Net cash provided by (used for):
Operating activities
$
5,651
$
5,689
$
3,710
Investing activities
(704)
(255)
562
Financing activities
(4,930)
(4,998)
(4,280)
In 2025, free cash flow decreased to $5.1 billion compared to $5.3 billion in 2024 primarily due to an increase in cash used for capital expenditures and distributions to noncontrolling interest holders and a decrease in cash provided by operating activities as discussed below. Free cash flow is a non-GAAP financial measure and reflects our cash flow provided by operating activities less capital expenditures and distributions to noncontrolling interest holders. Capital expenditures include purchases of property and equipment and additions to technology projects. See “Reconciliation of Non-GAAP Financial Information” below for a reconciliation of cash flow provided by operating activities, the most directly comparable U.S. GAAP financial measure, to free cash flow.
Operating activities
Cash provided by operating activities decreased $38 million in 2025 compared to 2024. This is primarily attributable to lower cash collections in 2025, higher compensation payments in 2025 and proceeds received from the termination of interest rate swaps in 2024, partially offset by higher operating results in 2025.
Cash provided by operating activities increased to $5.7 billion in 2024 as compared to $3.7 billion in 2023. The increase is mainly due to higher operating results in 2024, proceeds received from the termination of interest rate swaps in 2024 and higher tax payments in 2023.
The Organization for Economic Co-operation and Development (“OECD”) introduced an international tax framework under Pillar Two that provides for a global minimum tax of 15%, which is implemented through local legislation in participating jurisdictions. The effects of Pillar Two taxes enacted in jurisdictions in which we operate have been reflected in our results and did not have a material impact on our consolidated financial statements.
On January 5, 2026, the OECD issued administrative guidance outlining a framework under which U.S.-parented groups may be excluded from the application of the OECD’s global minimum tax rules. Each member jurisdiction will need to adopt this guidance into local law, and the timing and manner of adoption may vary. We are continuing to monitor developments related to this guidance and will evaluate the impact on our financial statements as additional information becomes available.
Investing activities
Our cash outflows from investing activities are primarily for acquisitions and capital expenditures, while cash inflows are primarily proceeds from dispositions.
Cash used for investing activities increased to $0.7 billion in 2025 as compared to $0.3 billion in 2024, primarily due to higher cash used in 2025 for the acquisition of With Intelligence, partially offset by higher cash proceeds received in 2025 related to the disposition of OSTTRA.
Cash used for investing activities was $0.3 billion in 2024 compared to cash provided by investing activities of $0.6 billion in 2023, primarily due to higher cash proceeds received in 2023 related to the disposition of Engineering Solutions.
Refer to Note 2 – Acquisitions and Divestitures to the Consolidated Financial Statements and Supplementary Data, in the Annual Report on Form 10-K for further information.
Financing activities
Our cash outflows from financing activities consist primarily of share repurchases, dividends to shareholders and repayments of short-term and long-term debt, while cash inflows are primarily attributable to the borrowing of short-term and long-term debt.
65
Table of Contents
Cash used for financing activities decreased to $4.9 billion in 2025 from $5.0 billion in 2024. The decrease is primarily attributable to proceeds received from the $600 million and $400 million issuance of senior notes and commercial paper in 2025, partially offset by higher cash used for share repurchases in 2025.
Cash used for financing activities increased to $5.0 billion in 2024 from $4.3 billion in 2023. The increase is primarily attributable to proceeds received from the $750 million issuance of senior note in 2023.
During the year ended December 31, 2025, we received a total of 9.3 million shares, including 0.3 million shares received in February of 2025 related to our October 28, 2024 ASR agreement, resulting in $5.0 billion of cash used to purchase shares. During the year ended December 31, 2024 we received a total of 6.7 million shares, including 0.2 million shares received in February of 2024 related to our November 13, 2023 ASR agreement, resulting in $3.3 billion of cash used to purchase shares. During the year ended December 31, 2023, we received a total of 8.6 million shares, including 0.4 million shares received in February of 2023 related to our December 2, 2022 ASR agreement, resulting in $3.3 billion of cash used to purchase shares. See Note 9 — Equity to the Consolidated Financial Statements and Supplementary Data, in the Annual Report on Form 10-K for information related to our ASR agreements.
On November 13, 2025, the Board of Directors approved a share repurchase program authorizing the purchase of 30 million shares (the “2025 Repurchase Program”), which was approximately 10% of the total shares of our outstanding common stock at the time. On June 22, 2022, the Board of Directors approved a share repurchase program authorizing the purchase of 30 million shares (the “2022 Repurchase Program”), which was approximately 9% of the total shares of our outstanding common stock at that time. As of December 31, 2025, 30 million shares remained under the 2025 Repurchase Program and 2.7 million shares remained available under the 2022 Repurchase Program.
Additional Financing
We have the ability to borrow a total of $2.0 billion through our commercial paper program, which is supported by our $2.0 billion five-year credit agreement (our “credit facility”) that will terminate on December 17, 2029. As of December 31, 2025, we had $715 million of outstanding commercial paper. As of December 31, 2024, we had no outstanding commercial paper.
Commitment fees for the unutilized commitments under the credit facility and applicable margins for borrowings thereunder are linked to the Company achieving three environmental sustainability performance indicators related to emissions, tested annually. We currently pay a commitment fee of 8 basis points. There will be no sustainability pricing adjustment to our commitment fees or our margins under the credit facility for the approximately year-long period beginning April 7, 2025 as a result of our emissions performance for the year ended December 31, 2024. The credit facility contains customary affirmative and negative covenants and customary events of default. The occurrence of an event of default could result in an acceleration of the obligations under the credit facility.
The only financial covenant in our credit facility is a requirement that our indebtedness to cash flow ratio, as defined in our credit facility, is not greater than 4 to 1, and this ratio has never been exceeded.
Dividends
On January 14, 2026, the Board of Directors approved a quarterly common stock dividend of $0.97 per share.
Supplemental Guarantor Financial Information
The senior notes described below were issued by S&P Global Inc. and are fully and unconditionally guaranteed by Standard & Poor's Financial Services LLC, a 100% owned subsidiary of the Company.
•On December 1, 2025, S&P Global Inc. issued $600 million of 4.25% Senior notes due 2031 and $400 million of 4.80% Senior notes due 2035.
•On August 22, 2024, S&P Global Inc. issued $746 million of 5.25% Senior Notes due 2033 that have been registered with the SEC and guaranteed by Standard & Poor’s Financial Services LLC in exchange for unregistered senior notes of like principal amounts and terms that were originally issued on September 12, 2023.
•On March 1, 2023, S&P Global Inc. issued new senior notes that have been registered with the SEC and guaranteed by Standard & Poor’s Financial Services LLC in exchange for the following series of unregistered senior notes of like principal amount and terms:
•$700 million of 4.75% Senior Notes due 2028 that were originally issued on March 2, 2022;
66
Table of Contents
•$921 million of 4.25% Senior Notes due 2029 that were originally issued on March 2, 2022;
•$1,237 million of 2.45% Senior Notes due 2027 that were originally issued on March 18, 2022;
•$1,227 million of 2.70% Sustainability-Linked Senior Notes due 2029 that were originally issued on March 18, 2022;
•$1,492 million of 2.90% Senior Notes due 2032 that were originally issued on March 18, 2022;
•$974 million of 3.70% Senior Notes due 2052 that were originally issued on March 18, 2022; and
•$500 million of 3.90% Senior Notes due 2062 that were originally issued on March 18, 2022.
•On August 13, 2020, we issued $600 million of 1.25% senior notes due in 2030 and $700 million of 2.3% senior notes due in 2060.
•On November 26, 2019, we issued $500 million of 2.5% senior notes due in 2029 and $600 million of 3.25% senior notes due in 2049.
•On May 17, 2018, we issued $500 million of 4.5% senior notes due in 2048.
•On September 22, 2016, we issued $500 million of 2.95% senior notes due in 2027.
•On November 2, 2007 we issued $400 million of 6.55% Senior Notes due 2037.
The notes above are unsecured and unsubordinated and rank equally and ratably with all of our existing and future unsecured and unsubordinated debt. The guarantees are the subsidiary guarantor’s unsecured and unsubordinated debt and rank equally and ratably with all of the subsidiary guarantor’s existing and future unsecured and unsubordinated debt.
The guarantees of the subsidiary guarantor may be released and discharged upon (i) a sale or other disposition (including by way of consolidation or merger) of the subsidiary guarantor or the sale or disposition of all or substantially all the assets of the subsidiary guarantor (in each case other than to the Company or a person who, prior to such sale or other disposition, is an affiliate of the Company); (ii) upon defeasance or discharge of any applicable series of the notes, as described above; or (iii) at such time as the subsidiary guarantor ceases to guarantee indebtedness for borrowed money, other than a discharge through payment thereon, under any Credit Facility of the Company, other than any such Credit Facility of the Company the guarantee of which by the subsidiary guarantor will be released concurrently with the release of the subsidiary guarantor’s guarantees of the notes. Other subsidiaries of the Company do not guarantee the registered debt securities of either S&P Global Inc. or Standard & Poor's Financial Services LLC (the “Obligor Group”) which are referred to as the “Non-Obligor Group”.
The following tables set forth the summarized financial information of the Obligor Group on a combined basis. This summarized financial information excludes the Non-Obligor Group. Intercompany balances and transactions between members of the Obligor Group have been eliminated. This information is not intended to present the financial position or results of operations of the Obligor Group in accordance with U.S. GAAP.
Summarized results of operations for the year ended December 31 is as follows:
(in millions)
2025
Revenue
$
4,461
Operating Profit
3,133
Net Income
1,797
Net income attributable to S&P Global Inc.
1,797
Summarized balance sheet information as of December 31 is as follows:
(in millions)
2025
2024
Current assets (excluding intercompany from Non-Obligor Group)
$
757
$
1,400
Noncurrent assets
898
782
Current liabilities (excluding intercompany to Non-Obligor Group)
1,192
339
Noncurrent liabilities
12,435
11,541
Intercompany payables to Non-Obligor Group
18,077
16,100
Contractual Obligations
We typically have various contractual obligations, which are recorded as liabilities in our consolidated balance sheets, while other items, such as certain purchase commitments and other executory contracts, are not recognized, but are disclosed herein. For example, we are contractually committed to contracts for information-technology outsourcing, certain enterprise-wide information-technology software licensing and maintenance.
67
Table of Contents
We believe that the amount of cash and cash equivalents on hand, cash flows expected from operations and availability under our credit facility will be adequate for us to execute our business strategy and meet anticipated requirements for lease obligations, capital expenditures, working capital and debt service for 2026.
The following table summarizes our significant contractual obligations and commercial commitments as of December 31, 2025, over the next several years. Additional details regarding these obligations are provided in the notes to our consolidated financial statements, as referenced in the footnotes to the table:
(in millions)
Less than 1 Year
1-3 Years
3-5 Years
More than 5 Years
Total
Debt: 1
Principal payments
$
718
$
2,529
$
3,326
$
6,515
$
13,088
Interest payments
424
751
549
2,843
4,567
Operating leases 2
145
239
148
175
707
Purchase obligations and other 3
334
712
122
13
1,181
Total contractual cash obligations
$
1,621
$
4,231
$
4,145
$
9,546
$
19,543
1Our debt obligations are described in Note 5 – Debt to our consolidated financial statement.
2See Note 13 – Commitments and Contingencies to our consolidated financial statements for further discussion on our operating lease obligations.
3Other consists primarily of commitments for unconditional purchase obligations in contracts for information-technology outsourcing and certain enterprise-wide information-technology software licensing and maintenance.
As of December 31, 2025, we had $322 million of liabilities for unrecognized tax benefits. We have excluded the liabilities for unrecognized tax benefits from our contractual obligations table because, until formal resolutions are reached, reasonable estimates of the timing of cash settlements with the respective taxing authorities are not practicable.
As of December 31, 2025, we have recorded $4.9 billion for our redeemable noncontrolling interest in our S&P Dow Jones Indices LLC partnership discussed in Note 9 – Equity to our consolidated financial statements. Specifically, this amount relates to the put option under the terms of the operating agreement of S&P Dow Jones Indices LLC, whereby, after December 31, 2017, CME Group and CME Group Index Services LLC (“CGIS”) has the right at any time to sell, and we are obligated to buy, at least 20% of their share in S&P Dow Jones Indices LLC. We have excluded this amount from our contractual obligations table because we are uncertain as to the timing and the ultimate amount of the potential payment we may be required to make.
We make contributions to our pension and postretirement plans in order to satisfy minimum funding requirements as well as additional contributions that we consider appropriate to improve the funded status of our plans. During 2025, we contributed $10 million to our retirement plans. Expected employer contributions in 2026 are $11 million and $2 million for our retirement and postretirement plans, respectively. In 2026, we may elect to make additional non-required contributions depending on investment performance and the pension plan status. See Note 7 – Employee Benefits to our consolidated financial statements for further discussion.
68
Table of Contents
RECONCILIATION OF NON-GAAP FINANCIAL INFORMATION
Free cash flow is a non-GAAP financial measure and reflects our cash flow provided by operating activities less capital expenditures and distributions to noncontrolling interest holders. Capital expenditures include purchases of property and equipment and additions to technology projects. Our cash flow provided by operating activities is the most directly comparable U.S. GAAP financial measure to free cash flow.
We believe the presentation of free cash flow allows our investors to evaluate the cash generated from our underlying operations in a manner similar to the method used by management. We use free cash flow to conduct and evaluate our business because we believe it typically presents a more conservative measure of cash flows since capital expenditures and distributions to noncontrolling interest holders are considered a necessary component of ongoing operations. Free cash flow is useful for management and investors because it allows management and investors to evaluate the cash available to us to prepay debt, make strategic acquisitions and investments and repurchase stock.
The presentation of free cash flow is not intended to be considered in isolation or as a substitute for the financial information prepared and presented in accordance with U.S. GAAP. Free cash flow, as we calculate it, may not be comparable to similarly titled measures employed by other companies. The following table presents a reconciliation of our cash flow provided by operating activities to free cash flow:
(in millions)
Year ended December 31,
% Change
2025
2024
2023
’25 vs ’24
’24 vs ’23
Cash provided by operating activities
$
5,651
$
5,689
$
3,710
(1)%
53%
Capital expenditures
(195)
(124)
(143)
Distributions to noncontrolling interest holders
(321)
(287)
(280)
Free cash flow
$
5,135
$
5,278
$
3,287
(3)%
61%
(in millions)
2025
2024
2023
’25 vs ’24
’24 vs ’23
Cash (used for) provided by investing activities
(704)
(255)
562
N/M
N/M
Cash used for financing activities
(4,930)
(4,998)
(4,280)
(1)%
17%
N/M – Represents a change equal to or in excess of 100% or not meaningful
CRITICAL ACCOUNTING ESTIMATES
Our discussion and analysis of our financial condition and results of operations is based upon our consolidated financial statements, which have been prepared in accordance with U.S. GAAP. The preparation of these financial statements requires us to make estimates and judgments that affect the reported amounts of assets, liabilities, revenues and expenses and related disclosure of contingent assets and liabilities.
On an ongoing basis, we evaluate our estimates and assumptions, including those related to revenue recognition, business combinations, allowance for doubtful accounts, valuation of long-lived assets, goodwill and other intangible assets, pension plans, incentive compensation and stock-based compensation, income taxes, contingencies and redeemable noncontrolling interests. We base our estimates on historical experience, current developments and on various other assumptions that we believe to be reasonable under these circumstances, the results of which form the basis for making judgments about carrying values of assets and liabilities that cannot readily be determined from other sources. There can be no assurance that actual results will not differ from those estimates.
Management considers an accounting estimate to be critical if it required assumptions to be made that were uncertain at the time the estimate was made and changes in the estimate or different estimates could have a material effect on our results of operations. Management has discussed the development and selection of our critical accounting estimates with the Audit Committee of our Board of Directors. The Audit Committee has reviewed our disclosure relating to them in this MD&A.
We believe the following critical accounting policies require us to make significant judgments and estimates in the preparation of our consolidated financial statements:
69
Table of Contents
Revenue recognition
Under ASC 606, revenue is recognized when a customer obtains control of promised goods or services in an amount that reflects the consideration the entity expects to receive in exchange for those goods or services. See Note 1 - Accounting Policies to our consolidated financial statements for further information.
Business combinations
We apply the purchase method of accounting to our business combinations. All of the assets acquired, liabilities assumed, and contingent consideration are allocated based on their estimated fair values. Fair value determinations involve significant estimates and assumptions about several highly subjective variables, including future cash flows, discount rates, and expected business performance. There are also different valuation models and inputs for each component, the selection of which requires considerable judgment. Our estimates and assumptions may be based, in part, on the availability of listed market prices or other transparent market data. These determinations will affect the amount of amortization expense recognized in future periods. We base our fair value estimates on assumptions we believe are reasonable, but recognize that the assumptions are inherently uncertain. Depending on the size of the purchase price of a particular acquisition, the mix of intangible assets acquired, and expected business performance, the purchase price allocation could be materially impacted by applying a different set of assumptions and estimates.
Allowance for doubtful accounts
The allowance for doubtful accounts reserve methodology is based on historical analysis, a review of outstanding balances and current conditions, and by incorporating data points that provide indicators of future economic conditions including forecasted industry default rates and industry index benchmarks. In determining these reserves, we consider, amongst other factors, the financial condition and risk profile of our customers, areas of specific or concentrated risk as well as applicable industry trends or market indicators. The impact on operating profit for a one percentage point change in the allowance for doubtful accounts is approximately $38 million.
We incorporate the forecasted impact of future economic conditions into our allowance for doubtful accounts measurement process. In times of economic turmoil, our estimates and judgments with respect to the collectability of our receivables are subject to greater uncertainty than in more stable periods. Based on our current outlook these assumptions are not expected to significantly change in 2026.
Accounting for the impairment of long-lived assets (including other intangible assets)
We evaluate long-lived assets for impairment whenever events or changes in circumstances indicate that the carrying amount of an asset may not be recoverable. Upon such an occurrence, recoverability of assets to be held and used is measured by comparing the carrying amount of an asset to current forecasts of undiscounted future net cash flows expected to be generated by the asset. If the carrying amount of the asset exceeds its estimated future cash flows, an impairment charge is recognized equal to the amount by which the carrying amount of the asset exceeds the fair value of the asset. For long-lived assets held for sale, assets are written down to fair value, less cost to sell. Fair value is determined based on market evidence, discounted cash flows, appraised values or management’s estimates, depending upon the nature of the assets.
Goodwill and indefinite-lived intangible assets
Goodwill represents the excess of purchase price and related costs over the value assigned to the net tangible and identifiable intangible assets of businesses acquired. As of December 31, 2025 and 2024, the carrying value of goodwill and other indefinite-lived intangible assets was $37.3 billion and $35.8 billion, respectively. Goodwill and other intangible assets with indefinite lives are not amortized, but instead are tested for impairment annually during the fourth quarter each year or more frequently if events or changes in circumstances indicate that the asset might be impaired.
Goodwill
As part of our annual impairment test of our five reporting units, we initially perform a qualitative analysis evaluating whether any events and circumstances occurred that provide evidence that it is more likely than not that the fair value of any of our reporting units is less than its carrying amount. Reporting units are generally an operating segment or one level below an operating segment. Our qualitative assessment included, but was not limited to, consideration of macroeconomic conditions, industry and market conditions, cost factors, cash flows, changes in key Company personnel and our share price. If, based on our evaluation of the events and circumstances that occurred during the year we do not believe that it is more likely than not that the fair value of any of our reporting units is less than its carrying amount, no quantitative impairment test is performed. Conversely, if the results of our qualitative assessment determine that it is more likely than not that the fair value of any of our reporting units is less than its respective carrying amount, we perform a quantitative impairment test. If the fair value of the reporting unit is less than the carrying value, the difference is recognized as an impairment charge. For 2025, based on our qualitative assessments, we determined that it is more likely than not that our reporting units’ fair values were greater than their respective carrying amounts.
70
Table of Contents
Indefinite-Lived Intangible Assets
We evaluate the recoverability of indefinite-lived intangible assets by first performing a qualitative analysis evaluating whether any events and circumstances occurred that provide evidence that it is more likely than not that the indefinite-lived asset is impaired. If, based on our evaluation of the events and circumstances that occurred during the year we do not believe that it is more likely than not that the indefinite-lived asset is impaired, no quantitative impairment test is performed. Conversely, if the results of our qualitative assessment determine that it is more likely than not that the indefinite-lived asset is impaired, a quantitative impairment test is performed. If necessary, an impairment analysis is performed using the income approach to estimate the fair value of the indefinite-lived intangible asset. If the intangible asset carrying value exceeds its fair value, an impairment charge is recognized in an amount equal to that excess. Significant judgments inherent in these analyses include estimating the amount and timing of future cash flows and the selection of appropriate discount rates, royalty rates and long-term growth rate assumptions. Changes in these estimates and assumptions could materially affect the determination of fair value for this indefinite-lived intangible asset and could result in an impairment charge, which could be material to our financial position and results of operations.
We performed our impairment assessment of goodwill and indefinite-lived intangible assets and concluded that no impairment existed for the years ended December 31, 2025, 2024 and 2023.
Retirement plans and postretirement healthcare and other benefits
Our employee pension and other postretirement benefit costs and obligations are dependent on assumptions concerning the outcome of future events and circumstances, including compensation increases, long-term return on pension plan assets, discount rates and other factors. In determining such assumptions, we consult with outside actuaries and other advisors where deemed appropriate. In accordance with relevant accounting standards, if actual results differ from our assumptions, such differences are deferred and amortized over the estimated remaining lifetime of the plan participants. While we believe that the assumptions used in these calculations are reasonable, differences in actual experience or changes in assumptions could affect the expense and liabilities related to our pension and other postretirement benefits.
The following is a discussion of some significant assumptions that we make in determining costs and obligations for pension and other postretirement benefits:
•Discount rate assumptions are based on current yields on high-grade corporate long-term bonds.
•The expected return on assets assumption is calculated based on the plan’s asset allocation strategy and projected market returns over the long-term.
Our discount rate and return on asset assumptions used to determine the net periodic pension and postretirement benefit cost on our U.S. retirement plans are as follows:
Retirement Plans
Postretirement Plans
January 1
2026
2025
2024
2026
2025
2024
Discount rate
5.45
%
5.74
%
5.27
%
5.16
%
5.57
%
5.18
%
Return on assets
6.30
%
6.25
%
6.00
%
As of December 31, 2025, the Company had $1.1 billion in pension benefit obligation for our U.S. retirement plans. A 0.25 percentage point increase or decrease in the discount rate would result in an estimated decrease or increase to the accumulated benefit obligation of approximately $25 million. An increase or decrease of 1 percentage point in the expected rate of return on plan assets would result in a decrease or increase of approximately $12 million to 2026 pension expense.
Stock-based compensation
Stock-based compensation expense is measured at the grant date based on the fair value of the award and is recognized over the requisite service period, which typically is the vesting period. Stock-based compensation is classified as both operating-related expense and selling and general expense in our consolidated statements of income.
71
Table of Contents
Income taxes
Deferred tax assets and liabilities are recognized for the future tax consequences attributable to differences between financial statement carrying amounts of existing assets and liabilities and their respective tax bases. Deferred tax assets and liabilities are measured using enacted tax rates expected to be applied to taxable income in the years in which those temporary differences are expected to be recovered or settled. We recognize liabilities for uncertain tax positions taken or expected to be taken in income tax returns. Accrued interest and penalties related to unrecognized tax benefits are recognized in interest expense and operating expense, respectively.
Judgment is required in determining our provision for income taxes, deferred tax assets and liabilities and unrecognized tax benefits. In determining the need for a valuation allowance, the historical and projected financial performance of the operation that is recording a net deferred tax asset is considered along with any other pertinent information.
We file income tax returns in the U.S. federal jurisdiction and various state and foreign jurisdictions, and we are routinely under audit by many different tax authorities. We believe that our accrual for tax liabilities is adequate for all open audit years based on an assessment of many factors including past experience and interpretations of tax law. This assessment relies on estimates and assumptions and may involve a series of complex judgments about future events. It is possible that tax examinations will be settled prior to December 31, 2026. If any of these tax audit settlements do occur within that period, we would make any necessary adjustments to the accrual for unrecognized tax benefits.
A portion of the undistributed earnings of our foreign subsidiaries is indefinitely reinvested in our foreign operations. Accordingly, we have not recorded deferred income taxes related to those earnings. Quantification of the deferred tax liability, if any, associated with indefinitely reinvested earnings is not practicable.
Contingencies
We are subject to a number of lawsuits and claims that arise in the ordinary course of business. We recognize a liability for such contingencies when both (a) information available prior to issuance of the financial statements indicates that it is probable that a liability had been incurred at the date of the financial statements and (b) the amount of loss can reasonably be estimated. We continually assess the likelihood of any adverse judgments or outcomes to our contingencies, as well as potential amounts or ranges of probable losses, and recognize a liability, if any, for these contingencies based on an analysis of each matter with the assistance of outside legal counsel and, if applicable, other experts. Because many of these matters are resolved over long periods of time, our estimate of liabilities may change due to new developments, changes in assumptions or changes in our strategy related to the matter. When we accrue for loss contingencies and the reasonable estimate of the loss is within a range, we record its best estimate within the range. We disclose an estimated possible loss or a range of loss when it is at least reasonably possible that a loss may have been incurred.
Redeemable Noncontrolling Interest
The fair value component of the redeemable noncontrolling interest in the Indices business is based on a combination of an income and market valuation approach. Our income and market valuation approaches may incorporate Level 3 fair value measures for instances when observable inputs are not available. The more significant judgmental assumptions used to estimate the value of the S&P Dow Jones Indices LLC joint venture include an estimated discount rate, a range of assumptions that form the basis of the expected future net cash flows (e.g., the revenue growth rates and operating margins), and a company specific beta. The significant judgmental assumptions used that incorporate market data, including the relative weighting of market observable information and the comparability of that information in our valuation models, are forward-looking and could be affected by future economic and market conditions.
As of December 31, 2025, the Company had $4.9 billion in redeemable noncontrolling interest in the Indices business on the Consolidated Balance Sheet. The ultimate amount paid for the redeemable noncontrolling interest in Indices business could be significantly different because the redemption amount depends on the future results of operations of the business.
As of December 31, 2025, the weighted average cost of capital used in the Company's income analysis to estimate the fair value of the redeemable noncontrolling interest was 10.8%. A 0.25 percentage point increase or decrease in the weighted average cost of capital would decrease or increase the redemption value by approximately $135 million or $108 million, respectively. As of December 31, 2025, the terminal growth rate used in the Company's income analysis to estimate the fair value of the redeemable noncontrolling interest was 2.2%. A 0.25 percentage point increase or decrease in the terminal growth rate would increase or decrease the redemption value by approximately $54 million or $27 million, respectively.
72
Table of Contents
RECENTLY ISSUED OR ADOPTEDACCOUNTING STANDARDS
See Note 1 – Accounting Policies to our consolidated financial statements for a detailed description of recently issued or adopted accounting standards. We do not expect these recently issued or adopted accounting standards to have a material impact on our results of operations, financial condition, or liquidity in future periods.
Item 7A. Quantitative and Qualitative Disclosures about Market Risk
Our exposure to market risk includes changes in foreign exchange rates and interest rates. We have operations in foreign countries where the functional currency is primarily the local currency. For international operations that are determined to be extensions of the parent company, the U.S. dollar is the functional currency. We typically have naturally hedged positions in most countries from a local currency perspective with offsetting assets and liabilities. As of December 31, 2025 and December 31, 2024, we have entered into foreign exchange forward contracts in order to mitigate the change in fair value of specific assets and liabilities in the consolidated balance sheet. These forward contracts are not designated as hedges and do not qualify for hedge accounting. As of December 31, 2025 and December 31, 2024, we have entered into foreign exchange forward contracts to hedge the effect of adverse fluctuations in foreign exchange rates. As of December 31, 2025 and December 31, 2024, we held cross-currency swap contracts to hedge a portion of our net investment in foreign subsidiaries against volatility in foreign exchange rates. We have not entered into any derivative financial instruments for speculative purposes. See Note 6 – Derivative Instruments to the Consolidated Financial Statements and Supplementary Data, in the Annual Report on Form 10-K for further discussion.
73
Table of Contents
Item 8. Consolidated Financial Statements and Supplementary Data
Report of Independent Registered Public Accounting Firm
To the Shareholders and the Board of Directors of S&P Global Inc.
Opinion on the Financial Statements
We have audited the accompanying consolidated balance sheets of S&P Global Inc. (the Company) as of December 31, 2025 and 2024, the related consolidated statements of income, comprehensive income, equity and cash flows for each of the three years in the period ended December 31, 2025, and the related notes and financial statement schedule listed in the Index at Item 15(a)(2) (collectively referred to as the “consolidated financial statements”). In our opinion, the consolidated financial statements present fairly, in all material respects, the financial position of the Company at December 31, 2025 and 2024, and the results of its operations and its cash flows for each of the three years in the period ended December 31, 2025, in conformity with U.S. generally accepted accounting principles.
We also have audited, in accordance with the standards of the Public Company Accounting Oversight Board (United States) (PCAOB), the Company's internal control over financial reporting as of December 31, 2025, based on criteria established in Internal Control—Integrated Framework issued by the Committee of Sponsoring Organizations of the Treadway Commission (2013 framework), and our report dated February 10, 2026 expressed an unqualified opinion thereon.
Basis for Opinion
These financial statements are the responsibility of the Company's management. Our responsibility is to express an opinion on the Company’s financial statements based on our audits. We are a public accounting firm registered with the PCAOB and are required to be independent with respect to the Company in accordance with the U.S. federal securities laws and the applicable rules and regulations of the Securities and Exchange Commission and the PCAOB.
We conducted our audits in accordance with the standards of the PCAOB. Those standards require that we plan and perform the audit to obtain reasonable assurance about whether the financial statements are free of material misstatement, whether due to error or fraud. Our audits included performing procedures to assess the risks of material misstatement of the financial statements, whether due to error or fraud, and performing procedures that respond to those risks. Such procedures included examining, on a test basis, evidence regarding the amounts and disclosures in the financial statements. Our audits also included evaluating the accounting principles used and significant estimates made by management, as well as evaluating the overall presentation of the financial statements. We believe that our audits provide a reasonable basis for our opinion.
Critical Audit Matter
The critical audit matter communicated below is a matter arising from the current period audit of the financial statements that was communicated or required to be communicated to the audit committee and that: (1) relates to accounts or disclosures that are material to the financial statements and (2) involved our especially challenging, subjective or complex judgments. The communication of the critical audit matter does not alter in any way our opinion on the consolidated financial statements, taken as a whole, and we are not, by communicating the critical audit matter below, providing a separate opinion on the critical audit matter or on the accounts or disclosures to which it relates.
75
Table of Contents
Valuation of redeemable noncontrolling interest in S&P Dow Jones Indices LLC
Description of the Matter
As described in Notes 1 and 9 to the financial statements, the Company has an agreement with the minority partners of its S&P Dow Jones Indices LLC joint venture that contains redemption features outside of the control of the Company. This arrangement is reported as a redeemable noncontrolling interest at fair value of $4,914 million at December 31, 2025. The Company adjusts the redeemable noncontrolling interest each reporting period to its estimated redemption value, but never less than its initial fair value, using both income and market valuation approaches.
Auditing the Company's valuation of its redeemable noncontrolling interest was complex due to the estimation uncertainty in determining the fair value. The estimation uncertainty was primarily due to the sensitivity of the fair value to underlying assumptions about the future performance of the business. The more significant judgmental assumptions used to estimate the value of the S&P Dow Jones Indices LLC joint venture include an estimated discount rate, a range of assumptions that form the basis of the expected future net cash flows (e.g., revenue growth rates and operating margins), a company specific beta and earnings and transaction multiples for comparable companies and similar acquisitions, respectively. These significant judgmental assumptions that incorporate market data are forward-looking and could be affected by future economic and market conditions.
How We Addressed the Matter in Our Audit
We obtained an understanding, evaluated the design, and tested the operating effectiveness of the Company’s controls over the accounting for its redeemable noncontrolling interest, including controls over management's judgments and evaluation of the underlying assumptions with regard to the valuation models applied and the estimation process supporting the determination of the fair value of S&P Dow Jones Indices LLC joint venture.
To test the valuation of redeemable noncontrolling interest, we evaluated the Company's selection of the valuation methodology and the methods and significant assumptions used by inspecting available market data and performing sensitivity analyses. For example, when evaluating the assumptions related to the revenue growth rate and operating profit margins, we compared the assumptions to the past performance of S&P Dow Jones Indices LLC joint venture in addition to current observable industry, market and economic trends. We involved valuation specialists to assist in our evaluation of the methodology and significant assumptions used by the Company, including the discount rate, company specific beta and earnings for comparable companies and transaction multiples for similar acquisitions. We also tested the completeness and accuracy of the underlying data supporting the significant assumptions and estimates.
/s/ ERNST & YOUNG LLP
We have served as the Company’s auditor since 1969.
New York, New York
February 10, 2026
76
Table of Contents
Report of Independent Registered Public Accounting Firm
To the Shareholders and the Board of Directors of S&P Global Inc.
Opinion on Internal Control Over Financial Reporting
We have audited S&P Global Inc.’s internal control over financial reporting as of December 31, 2025, based on criteria established in Internal Control—Integrated Framework issued by the Committee of Sponsoring Organizations of the Treadway Commission (2013 framework), (the COSO criteria). In our opinion, S&P Global Inc. (the Company) maintained, in all material respects, effective internal control over financial reporting as of December 31, 2025, based on the COSO criteria.
We also have audited, in accordance with the standards of the Public Company Accounting Oversight Board (United States) (PCAOB), the consolidated balance sheets of the Company as of December 31, 2025 and 2024, the related consolidated statements of income, comprehensive income, equity and cash flows for each of the three years in the period ended December 31, 2025, and the related notes and financial statement schedule listed in the Index at Item 15(a)(2) and our report dated February 10, 2026 expressed an unqualified opinion thereon.
Basis for Opinion
The Company’s management is responsible for maintaining effective internal control over financial reporting and for its assessment of the effectiveness of internal control over financial reporting included in the accompanying Management’s Annual Report on Internal Control Over Financial Reporting. Our responsibility is to express an opinion on the Company’s internal control over financial reporting based on our audit. We are a public accounting firm registered with the PCAOB and are required to be independent with respect to the Company in accordance with the U.S. federal securities laws and the applicable rules and regulations of the Securities and Exchange Commission and the PCAOB.
We conducted our audit in accordance with the standards of the PCAOB. Those standards require that we plan and perform the audit to obtain reasonable assurance about whether effective internal control over financial reporting was maintained in all material respects.
Our audit included obtaining an understanding of internal control over financial reporting, assessing the risk that a material weakness exists, testing and evaluating the design and operating effectiveness of internal control based on the assessed risk, and performing such other procedures as we considered necessary in the circumstances. We believe that our audit provides a reasonable basis for our opinion.
Definition and Limitations of Internal Control Over Financial Reporting
A company’s internal control over financial reporting is a process designed to provide reasonable assurance regarding the reliability of financial reporting and the preparation of financial statements for external purposes in accordance with generally accepted accounting principles. A company’s internal control over financial reporting includes those policies and procedures that (1) pertain to the maintenance of records that, in reasonable detail, accurately and fairly reflect the transactions and dispositions of the assets of the company; (2) provide reasonable assurance that transactions are recorded as necessary to permit preparation of financial statements in accordance with generally accepted accounting principles, and that receipts and expenditures of the company are being made only in accordance with authorizations of management and directors of the company; and (3) provide reasonable assurance regarding prevention or timely detection of unauthorized acquisition, use, or disposition of the company’s assets that could have a material effect on the financial statements.
Because of its inherent limitations, internal control over financial reporting may not prevent or detect misstatements. Also, projections of any evaluation of effectiveness to future periods are subject to the risk that controls may become inadequate because of changes in conditions, or that the degree of compliance with the policies or procedures may deteriorate.
/s/ ERNST & YOUNG LLP
New York, New York
February 10, 2026
77
Table of Contents
Consolidated Statements of Income
(in millions, except per share data)
Year Ended December 31,
2025
2024
2023
Revenue
$
15,336
$
14,208
$
12,497
Expenses:
Operating-related expenses
4,563
4,361
4,141
Selling and general expenses
3,417
3,196
3,159
Depreciation
110
96
101
Amortization of intangibles
1,069
1,077
1,042
Total expenses
9,159
8,730
8,443
(Gain) loss on dispositions, net
(273)
(59)
70
Equity in income on unconsolidated subsidiaries
(28)
(43)
(36)
Operating profit
6,478
5,580
4,020
Other (income) expense, net
(36)
(25)
15
Interest expense, net
287
297
334
Income before taxes on income
6,227
5,308
3,671
Provision for taxes on income
1,407
1,141
778
Net income
4,820
4,167
2,893
Less: net income attributable to noncontrolling interests
(349)
(315)
(267)
Net income attributable to S&P Global Inc.
$
4,471
$
3,852
$
2,626
Earnings per share attributable to S&P Global Inc. common shareholders:
Net income:
Basic
$
14.67
$
12.36
$
8.25
Diluted
$
14.66
$
12.35
$
8.23
Weighted-average number of common shares outstanding:
Basic
304.8
311.6
318.4
Diluted
305.1
311.9
318.9
Actual shares outstanding at year end
298.8
307.8
314.1
See accompanying notes to the consolidated financial statements.
78
Table of Contents
Consolidated Statements of Comprehensive Income
(in millions)
Year Ended December 31,
2025
2024
2023
Net income
$
4,820
$
4,167
$
2,893
Other comprehensive income:
Foreign currency translation adjustments
119
(104)
70
Income tax effect
87
(18)
25
206
(122)
95
Pension and other postretirement benefit plans
(17)
(12)
(18)
Income tax effect
3
2
5
(14)
(10)
(13)
Unrealized (loss) gain on cash flow hedges
(8)
15
54
Income tax effect
2
(3)
(13)
(6)
12
41
Comprehensive income
5,006
4,047
3,016
Less: comprehensive income attributable to nonredeemable noncontrolling interests
(32)
(30)
(26)
Less: comprehensive income attributable to redeemable noncontrolling interests
(317)
(285)
(241)
Comprehensive income attributable to S&P Global Inc.
$
4,657
$
3,732
$
2,749
See accompanying notes to the consolidated financial statements.
79
Table of Contents
Consolidated Balance Sheets
(in millions)
December 31,
2025
2024
ASSETS
Current assets:
Cash and cash equivalents
$
1,745
$
1,666
Restricted cash
—
—
Short-term investments
56
20
Accounts receivable, net of allowance for doubtful accounts: 2025- $50 ; 2024 - $44
3,441
2,867
Prepaid and other current assets
858
906
Assets held for sale
196
—
Total current assets
6,296
5,459
Property and equipment:
Buildings and leasehold improvements
444
433
Equipment and furniture
695
655
Total property and equipment
1,139
1,088
Less: accumulated depreciation
(861)
(823)
Property and equipment, net
278
265
Right of use assets
413
413
Goodwill
36,475
34,917
Other intangible assets, net
16,271
16,556
Equity investments in unconsolidated subsidiaries
603
1,774
Asset for pension benefits
254
246
Other non-current assets
610
591
Total assets
$
61,200
$
60,221
LIABILITIES AND EQUITY
Current liabilities:
Accounts payable
$
610
$
553
Accrued compensation and contributions to retirement plans
988
1,073
Short-term debt
718
4
Income taxes currently payable
180
199
Unearned revenue
4,088
3,694
Other current liabilities
1,010
869
Liabilities held for sale
43
—
Total current liabilities
7,637
6,392
Long-term debt
12,370
11,394
Lease liabilities – non-current
494
535
Pension and other postretirement benefits
178
180
Deferred tax liability – non-current
3,262
3,397
Other non-current liabilities
1,107
815
Total liabilities
25,048
22,713
Redeemable noncontrolling interests
4,917
4,252
Commitments and contingencies (Note 13)
Equity:
Common stock, $1 par value: authorized - 600 million shares; issued: 415 million shares in 2025 and 2024
415
415
Additional paid-in capital
44,117
44,321
Retained income
23,666
20,977
Accumulated other comprehensive loss
(697)
(883)
Less: common stock in treasury - at cost: 2025 - 109 million shares; 2024 - 100 million shares
(36,374)
(31,671)
Total equity – controlling interests
31,127
33,159
Total equity – noncontrolling interests
108
97
Total equity
31,235
33,256
Total liabilities and equity
$
61,200
$
60,221
See accompanying notes to the consolidated financial statements.
80
Table of Contents
Consolidated Statements of Cash Flows
(in millions)
Year Ended December 31,
2025
2024
2023
Operating Activities:
Net income
$
4,820
$
4,167
$
2,893
Adjustments to reconcile net income to cash provided by operating activities:
Depreciation
110
96
101
Amortization of intangibles
1,069
1,077
1,042
Provision for losses on accounts receivable
39
43
28
Deferred income taxes
(242)
(323)
(381)
Stock-based compensation
236
247
171
(Gain) loss on dispositions, net
(273)
(59)
70
Restructuring, lease impairment charges and other
324
206
246
Changes in operating assets and liabilities, net of effect of acquisitions and dispositions:
Accounts receivable
(600)
(79)
(291)
Prepaid and other current assets
32
(79)
(310)
Accounts payable and accrued expenses
(55)
245
328
Unearned revenue
327
222
352
Other current liabilities
(81)
(418)
(277)
Net change in prepaid/accrued income taxes
100
192
(175)
Net change in other assets and liabilities
(155)
152
(87)
Cash provided by operating activities
5,651
5,689
3,710
Investing Activities:
Capital expenditures
(195)
(124)
(143)
Acquisitions, net of cash acquired
(2,023)
(305)
(296)
Proceeds from dispositions
1,549
168
1,014
Changes in short-term investments
(35)
6
(13)
Cash (used for) provided by investing activities
(704)
(255)
562
Financing Activities:
Additions to / (payments on) short-term debt, net
715
—
(188)
Proceeds from issuance of senior notes, net
993
—
744
Payments on senior notes
(4)
(47)
—
Dividends paid to shareholders
(1,170)
(1,134)
(1,147)
Distributions to noncontrolling interest holders
(321)
(287)
(280)
Repurchase of treasury shares
(5,001)
(3,301)
(3,301)
Contingent consideration payments
(10)
(107)
(9)
Employee withholding tax on share-based payments, excise tax payments on share repurchases, contingent consideration payments and other
(132)
(122)
(99)
Cash used for financing activities
(4,930)
(4,998)
(4,280)
Effect of exchange rate changes on cash
62
(61)
12
Net change in cash, cash equivalents, and restricted cash
79
375
4
Cash, cash equivalents, and restricted cash at beginning of year
1,666
1,291
1,287
Cash, cash equivalents, and restricted cash at end of year
$
1,745
$
1,666
$
1,291
Cash paid during the year for:
Interest
$
390
$
391
$
369
Income taxes
$
1,502
$
1,159
$
1,279
See accompanying notes to the consolidated financial statements.
81
Table of Contents
Consolidated Statements of Equity
(in millions)
Common Stock $1 par
Additional Paid-in Capital
Retained Income
Accumulated Other Comprehensive Loss
Less: Treasury Stock
Total SPGI Equity
Noncontrolling Interests
Total Equity
Balance as of December 31, 2022
$
415
$
44,422
$
17,784
$
(886)
$
25,347
$
36,388
$
89
$
36,477
Comprehensive income 1
2,626
123
2,749
26
2,775
Dividends (Dividend declared per common share — $3.60 per share)
(1,147)
(1,147)
(15)
(1,162)
Share repurchases
(70)
3,231
(3,301)
(3,301)
Employee stock plans
(119)
(167)
48
48
Change in redemption value of redeemable noncontrolling interests
(539)
(539)
(539)
Adjustment to noncontrolling interests
(2)
(2)
(2)
Other
4
4
4
Balance as of December 31, 2023
$
415
$
44,231
$
18,728
$
(763)
$
28,411
$
34,200
$
100
$
34,300
Comprehensive income1
3,852
(120)
3,732
30
3,762
Dividends (Dividend declared per common share — $3.64 per share)
(1,134)
(1,134)
(18)
(1,152)
Share repurchases
3,331
(3,331)
(3,331)
Employee stock plans
90
(71)
161
161
Change in redemption value of redeemable noncontrolling interests
(470)
(470)
(470)
Other
1
1
(15)
(14)
Balance as of December 31, 2024
$
415
$
44,321
$
20,977
$
(883)
$
31,671
$
33,159
$
97
$
33,256
Comprehensive income 1
4,471
186
4,657
32
4,689
Dividends (Dividend declared per common share — $3.84 per share)
(1,170)
(1,170)
(18)
(1,188)
Share repurchases
(305)
4,743
(5,048)
(5,048)
Employee stock plans
101
(40)
141
141
Change in redemption value of redeemable noncontrolling interests
(614)
(614)
(614)
Other
2
2
(3)
(1)
Balance as of December 31, 2025
$
415
$
44,117
$
23,666
$
(697)
$
36,374
$
31,127
$
108
$
31,235
1Excludes $317 million, $285 million and $241 million in 2025, 2024 and 2023, respectively, attributable to redeemable noncontrolling interests.
See accompanying notes to the consolidated financial statements.
82
Table of Contents
Notes to the Consolidated Financial Statements
1. Accounting Policies
Nature of operations
S&P Global Inc. (together with its consolidated subsidiaries, the “Company,” the “Registrant,” “we,” “us” or “our”) is a global, diversified, and highly differentiated provider of benchmarks, data, analytics and workflow solutions in the global capital, energy and commodity, and automotive markets. The capital markets include asset managers, investment banks, commercial banks, insurance companies, exchanges, trading firms and issuers; the energy and commodity markets include producers, consumers, traders and intermediaries within energy, chemicals, shipping, metals, carbon and agriculture; and the automotive markets include manufacturers, suppliers, dealerships, service shops and consumers.
Our operations consist of fivereportable segments: S&P Global Market Intelligence (“Market Intelligence”), S&P Global Ratings (“Ratings”), S&P Global Energy (“Energy”), S&P Global Mobility (“Mobility”) and S&P Dow Jones Indices (“Indices”).
•Market Intelligence is a global provider of multi-asset-class data and analytics integrated with purpose-built workflow solutions.
•Ratings is an independent provider of credit ratings, research, and analytics.
•Energy is a leading independent provider of information and benchmark prices for the energy and commodity markets.
•Mobility is a leading provider of solutions serving the full automotive value chain including vehicle manufacturers (Original Equipment Manufacturers or OEMs), automotive suppliers, mobility service providers, retailers, consumers, and finance and insurance companies.
•Indices is a global index provider that maintains a wide variety of valuation and index benchmarks for investment advisors, wealth managers and institutional investors.
On April 29, 2025, we announced that our Board of Directors decided to pursue a full separation of our Mobility segment, creating a new publicly traded company. The transaction, which would be implemented through the spin-off of shares of the new company to S&P Global shareholders, is expected to be tax-free for U.S. federal income tax purposes for S&P Global shareholders and is expected to be completed mid-2026, subject to the satisfaction of customary legal and regulatory requirements and approvals.
As of May 2, 2023, we completed the sale of S&P Global Engineering Solutions (“Engineering Solutions”), a provider of engineering standards and related technical knowledge, and the results are included through that date.
See Note 2 — Acquisitions and Divestitures for further discussion.
Revenue Recognition
Under Accounting Standards Codification (“ASC”) 606, revenue is recognized when a customer obtains control of promised goods or services in an amount that reflects the consideration the entity expects to receive in exchange for those goods or services.
Subscription revenue
Subscription revenue at Market Intelligence is primarily derived from distribution of data, valuation services, analytics, third party research, and credit ratings-related information through both feed and web-based channels. Subscription revenue at Market Intelligence also includes software and hosted product offerings which provide maintenance and continuous access to our platforms over the contract term. Subscription revenue at Energy is primarily from subscriptions to our market data and market insights (price assessments, market reports and commentary and analytics) along with other information products and software term licenses. Subscription revenue at Mobility is primarily derived from products that provide data and insight on future vehicles sales and production, including detailed forecasts on technology and vehicle components; supply car makers and dealers with market reporting products, predictive analytics and marketing automation software; and support dealers with vehicle history reports, used car listings and service retention solutions. Subscription revenue at Mobility also include a range of services to financial institutions, to support their marketing, insurance underwriting and claims management activities. Subscription revenue at Indices is derived from the contracts for underlying data of our indexes to support our customers’ management of index funds, portfolio analytics, and research. Subscription revenue at Engineering Solutions was primarily from subscriptions to our Product Design offerings providing standards, codes and specifications; applied technical reference; engineering journals, reports, best practices, and other vetted technical reference; and patents and patent applications.
83
Table of Contents
For subscription products and services, we generally provide continuous access to dynamic data sets and analytics for a defined period, with revenue recognized ratably as our performance obligation to provide access to our data and analytics is progressively fulfilled over the stated term of the contract.
Non-transaction revenue
Non-transaction revenue at Ratings primarily includes fees for surveillance of a credit rating, annual fees for customer relationship-based pricing programs, fees for entity credit ratings and global research and analytics at Crisil. Non-transaction revenue also includes an intersegment revenue elimination of $200 million, $186 million and $177 million for the years ended December 31, 2025, 2024 and 2023, respectively, mainly consisting of the royalty charged to Market Intelligence for the rights to use and distribute content and data developed by Ratings.
For non-transaction revenue related to Rating’s surveillance services, we continuously monitor factors that impact the creditworthiness of an issuer over the contractual term with revenue recognized to the extent that our performance obligation is progressively fulfilled over the term contract. Because surveillance services are continuously provided throughout the term of the contract, our measure of progress towards fulfillment of our obligation to monitor a rating is a time-based output measure with revenue recognized ratably over the term of the contract.
Non-subscription / Transaction revenue
Transaction revenue at our Ratings segment primarily includes fees associated with:
•ratings related to new issuance of corporate and government debt instruments; as well as structured finance instruments; and
•bank loan ratings.
Transaction revenue is recognized at the point in time when our performance obligation is satisfied by issuing a rating on our customer’s instruments and when we have a right to payment and the customer can benefit from the significant risks and rewards of ownership.
Non-subscription revenue at Market Intelligence is primarily related to certain advisory, pricing conferences and events, and analytical services. Non-subscription revenue at Mobility includes transactional sales of data that are non-cyclical in nature — and that are usually tied to underlying business metrics such as vehicle manufacturers marketing spend or safety recall activity — as well as consulting and advisory services. Non-subscription revenue at Energy is primarily related to conference sponsorship, consulting engagements, events, and perpetual software licenses. Non-subscription revenue at Engineering Solutions was primarily from retail transaction and consulting services.
Asset-linked fees
Asset-linked fees at Indices are primarily related to royalties payments based on the value of assets under management in our customers exchange-traded funds and mutual funds.
For asset-linked products and services, we provide licenses conveying continuous access to our index and benchmark-related intellectual property during a specified contract term. Revenue is recognized when the extent that our customers have used our licensed intellectual property can be quantified. Recognition of revenue for our asset-linked fee arrangements is subject to the “recognition constraint” for usage-based royalty payments because we cannot reasonably predict the value of the assets that will be invested in index funds structured using our intellectual property until it is either publicly available or when we are notified by our customers. Revenue derived from an asset-linked fee arrangement is measured and recognized when the certainty of the extent of its utilization of our index products by our customers is known.
Sales usage-based royalties
Sales usage-based royalty revenue at our Indices segment is primarily related to trading based fees from exchange-traded derivatives. Sales and usage-based royalty revenue at our Energy segment is primarily related to licensing of its proprietary market price data and price assessments to commodity exchanges.
For sales usage-based royalty products and services, we provide licenses conveying the right to continuous access to our intellectual property over the contract term, with revenue recognized when the extent of our license’s utilization can be quantified, or more specifically, when trading volumes are known and publicly available to us or when we are notified by our customers. Recognition of revenue of fees tied to trading volumes is subject to the recognition constraint for a usage-based
84
Table of Contents
royalty promised by our customers in exchange for the license of our intellectual property, with revenue recognized when trading volumes are known.
Recurring variable revenue
Recurring variable revenue at Market Intelligence represents revenue from contracts for services that specify a fee based on, among other factors, the number of trades processed, assets under management, or the number of positions valued.
Arrangements with Multiple Performance Obligations
Our contracts with customers may include multiple performance obligations. Revenue relating to agreements that provide for more than one performance obligation is recognized based upon the relative fair value to the customer of each service component as each component is earned. The fair value of the service components are determined using an analysis that considers cash consideration that would be received for instances when the service components are sold separately. If the fair value to the customer for each service is not objectively determinable, we make our best estimate of the services’ stand-alone selling price and record revenue as it is earned over the service period.
Receivables
We record a receivable when a customer is billed or when revenue is recognized prior to billing a customer. For multi-year agreements, we generally invoice customers annually at the beginning of each annual period.
Contract Assets
Contract assets include unbilled amounts from when the Company transfers service to a customer before a customer pays consideration or before payment is due. As of December 31, 2025 and 2024, contract assets were $89 million and $69 million, respectively, and are included in accounts receivable in our consolidated balance sheets.
Unearned Revenue
We record unearned revenue when cash payments are received in advance of our performance. The increase in the unearned revenue balance for the year ended December 31, 2025 is primarily driven by cash payments received in advance of satisfying our performance obligations, offset by $3.8 billion of revenues recognized that were included in the unearned revenue balance at the beginning of the period.
Remaining Performance Obligations
Remaining performance obligations represent the transaction price of contracts for work that has not yet been performed. As of December 31, 2025, the aggregate amount of the transaction price allocated to remaining performance obligations was $5.9 billion. We expect to recognize revenue on approximately half and three-quarters of the remaining performance obligations over the next 12 and 24 months, respectively, with the remainder recognized thereafter.
We do not disclose the value of unfulfilled performance obligations for (i) contracts with an original expected length of one year or less and (ii) contracts where revenue is a usage-based royalty promised in exchange for a license of intellectual property.
Costs to Obtain a Contract
We recognize an asset for the incremental costs of obtaining a contract with a customer if we expect the benefit of those costs to be longer than one year. We have determined that the costs associated with certain sales commission programs are incremental to the costs to obtain contracts with customers and therefore meet the criteria to be capitalized. Total capitalized costs to obtain a contract were $349 million and $291 million as of December 31, 2025 and December 31, 2024, respectively, and are included in prepaid and other current assets and other non-current assets on our consolidated balance sheets. The capitalized asset will be amortized over a period consistent with the transfer to the customer of the goods or services to which the asset relates, calculated based on the customer term and the average life of the products and services underlying the contracts which has been determined to be approximately 2 to 5 years. The expense is recorded within selling and general expenses in the consolidated statements of income.
We expense sales commissions when incurred if the amortization period would have been one year or less. These costs are recorded within selling and general expenses.
Equity in Income on Unconsolidated Subsidiaries
On October 10, 2025, the Company and CME Group completed the sale of OSTTRA. See Note 2 — Acquisitions and Divestitures for further discussion.
The Company held an investment in a 50/50 joint venture arrangement with shared control with CME Group that combined each company’s post-trade services into a joint venture, OSTTRA. The joint venture provided trade processing and risk
85
Table of Contents
mitigation operations and incorporated CME Group’s optimization businesses (Traiana, TriOptima, and Reset) and the Company’s MarkitSERV business. The combination was intended to increase operating efficiencies of both the company’s business to more effectively service clients with enhanced platforms and services for OTC markets across interest rate, FX, equity, and credit asset classes. Our share of earnings or losses are recognized in Equity in income on unconsolidated subsidiaries in our consolidated statements of income.
Other (Income) Expense, net
The components of other (income) expense, net for the years ended December 31 are as follows:
(in millions)
2025
2024
2023
Other components of net periodic benefit cost
$
(22)
$
(24)
$
—
Net (gain) loss from investments
(14)
(1)
15
Other (income) expense, net
$
(36)
$
(25)
$
15
Assets and Liabilities Held for Sale and Discontinued Operations
Assets and Liabilities Held for Sale
We classify a disposal group to be sold as held for sale in the period in which all of the following criteria are met: management, having the authority to approve the action, commits to a plan to sell the disposal group; the disposal group is available for immediate sale in its present condition subject only to terms that are usual and customary for sales of such disposal group; an active program to locate a buyer and other actions required to complete the plan to sell the disposal group have been initiated; the sale of the disposal group is probable, and transfer of the disposal group is expected to qualify for recognition as a completed sale within one year, except if events or circumstances beyond our control extend the period of time required to sell the disposal group beyond one year; the disposal group is being actively marketed for sale at a price that is reasonable in relation to its current fair value; and actions required to complete the plan indicate that it is unlikely that significant changes to the plan will be made or that the plan will be withdrawn.
A disposal group that is classified as held for sale is initially measured at the lower of its carrying value or fair value less any costs to sell. Any loss resulting from this measurement is recognized in the period in which the held for sale criteria are met. Conversely, gains are not recognized on the sale of a disposal group until the date of sale.
The fair value of a disposal group less any costs to sell is assessed each reporting period it remains classified as held for sale and any subsequent changes are reported as an adjustment to the carrying value of the disposal group, as long as the new carrying value does not exceed the carrying value of the disposal group at the time it was initially classified as held for sale. Upon determining that a disposal group meets the criteria to be classified as held for sale, the Company reports the assets and liabilities of the disposal group as held for sale in the current period in our consolidated balance sheets.
Discontinued Operations
In determining whether a disposal of a component of an entity or a group of components of an entity is required to be presented as a discontinued operation, we make a determination whether the disposal represents a strategic shift that had, or will have, a major effect on our operations and financial results. A component of an entity comprises operations and cash flows that can be clearly distinguished both operationally and for financial reporting purposes. If we conclude that the disposal represents a strategic shift, then the results of operations of the group of assets being disposed of (as well as any gain or loss on the disposal transaction) are aggregated for separate presentation apart from our continuing operating results in the consolidated financial statements.
Principles of consolidation
The consolidated financial statements include the accounts of all subsidiaries and our share of earnings or losses of joint ventures and affiliated companies under the equity method of accounting. All significant intercompany accounts and transactions have been eliminated. The Company applies the guidelines set forth in Topic 810 of the ASC in assessing its interests in variable interest entities to decide whether to consolidate an entity. The Company has reviewed the potential variable interest entities and determined that there are no consolidation requirements under Topic 810 of the ASC.
Use of estimates
The preparation of financial statements in conformity with generally accepted accounting principles in the United States of America requires management to make estimates and assumptions that affect the amounts reported in the financial statements and accompanying notes. Actual results could differ from those estimates.
86
Table of Contents
Cash and cash equivalents
Cash and cash equivalents include ordinary bank deposits and highly liquid investments with original maturities of three months or less that consist primarily of money market funds with unrestricted daily liquidity and fixed term time deposits. Such investments and bank deposits are stated at cost, which approximates market value, and were $1.7 billion as of December 31, 2025 and 2024. These investments are not subject to significant market risk.
Restricted cash
Cash that is subject to legal restrictions or is unavailable for general operating purposes is classified as restricted cash. We had no restricted cash included in our consolidated balance sheets as of December 31, 2025 and 2024.
Short-term investments
Short-term investments are securities with original maturities greater than 90 days that are available for use in our operations in the next twelve months. The short-term investments, primarily consisting of certificates of deposit and mutual funds, are recorded at cost, which approximates fair value, which is estimated based on the net asset value of these investments. Interest and dividends are recorded in income when earned.
Accounts receivable
Credit is extended to customers based upon an evaluation of the customer’s financial condition. Accounts receivable, which include billings consistent with terms of contractual arrangements, are recorded at net realizable value.
Allowance for doubtful accounts
The allowance for doubtful accounts reserve methodology is based on historical analysis, a review of outstanding balances and current conditions, and by incorporating data points that provide indicators of future economic conditions including forecasted industry default rates and industry index benchmarks. In determining these reserves, we consider, amongst other factors, the financial condition and risk profile of our customers, areas of specific or concentrated risk as well as applicable industry trends or market indicators.
Capitalized technology costs
We capitalize certain software development and website implementation costs. Capitalized costs only include incremental, direct costs of materials and services incurred to develop the software after the preliminary project stage is completed, funding has been committed and it is probable that the project will be completed and used to perform the function intended. Incremental costs are expenditures that are out-of-pocket to us and are not part of an allocation or existing expense base. Software development and website implementation costs are expensed as incurred during the preliminary project stage. Capitalized costs are amortized from the year the software is ready for its intended use over its estimated useful life, three to seven years, using the straight-line method. Periodically, we evaluate the amortization methods, remaining lives and recoverability of such costs. Capitalized software development and website implementation costs are included in other non-current assets and are presented net of accumulated amortization. Gross capitalized technology costs were $419 million and $338 million as of December 31, 2025 and 2024, respectively. Accumulated amortization of capitalized technology costs was $237 million and $204 million as of December 31, 2025 and 2024, respectively.
Fair Value
Certain assets and liabilities are required to be recorded at fair value and classified within a fair value hierarchy based on inputs used when measuring fair value. We have foreign exchange forward contracts, cross currency and interest rate swaps that are adjusted to fair value on a recurring basis.
Other financial instruments, including cash and cash equivalents and short-term investments, are recorded at cost, which approximates fair value because of the short-term maturity and highly liquid nature of these instruments. The fair value of our long-term debt borrowings were $11.3 billion and $10.0 billion as of December 31, 2025 and 2024, respectively, and was estimated based on quoted market prices.
Accounting for the impairment of long-lived assets (including other intangible assets)
We evaluate long-lived assets for impairment whenever events or changes in circumstances indicate that the carrying amount of an asset may not be recoverable. Upon such an occurrence, recoverability of assets to be held and used is measured by comparing the carrying amount of an asset to current forecasts of undiscounted future net cash flows expected to be generated by the asset. If the carrying amount of the asset exceeds its estimated future cash flows, an impairment charge is recognized equal to the amount by which the carrying amount of the asset exceeds the fair value of the asset. For long-lived assets held for sale, assets are written down to fair value, less cost to sell. Fair value is determined based on market evidence, discounted cash flows, appraised values or management’s estimates, depending upon the nature of the assets.
87
Table of Contents
Leases
We determine whether an arrangement meets the criteria for an operating lease or a finance lease at the inception of the arrangement. We have operating leases for office space and equipment. Our leases have remaining lease terms of 1 year to 15 years, some of which include options to extend the leases for up to 12 years, and some of which include options to terminate the leases early. We consider these options in determining the lease term used to establish our right-of use (“ROU”) assets and associated lease liabilities. We sublease certain real estate leases to third parties which mainly consist of operating leases for space within our offices.
Leases with an initial term of 12 months or less are not recorded on the balance sheet; we recognize lease expenses for these leases on a straight line-basis over the lease term in operating-related expenses and selling and general expenses.
Operating lease ROU assets and operating lease liabilities are recognized based on the present value of future minimum lease payments over the lease term at commencement date. Our future minimum based payments used to determine our lease liabilities include minimum based rent payments and escalations. As most of our leases do not provide an implicit rate, we use our estimated incremental borrowing rate based on the information available at commencement date in determining the present value of lease payments.
Goodwill and other indefinite-lived intangible assets
Goodwill represents the excess of purchase price and related costs over the value assigned to the net tangible and identifiable intangible assets of businesses acquired. Goodwill and other intangible assets with indefinite lives are not amortized, but instead are tested for impairment annually during the fourth quarter each year, or more frequently if events or changes in circumstances indicate that the asset might be impaired. We have five reporting units with goodwill that are evaluated for impairment.
We initially perform a qualitative analysis evaluating whether any events and circumstances occurred or exist that provide evidence that it is more likely than not that the fair value of any of our reporting units is less than its carrying amount. If, based on our evaluation we do not believe that it is more likely than not that the fair value of any of our reporting units is less than its carrying amount, no quantitative impairment test is performed. Conversely, if the results of our qualitative assessment determine that it is more likely than not that the fair value of any of our reporting units is less than their respective carrying amounts we perform a quantitative impairment test.
When conducting our impairment test to evaluate the recoverability of goodwill at the reporting unit level, the estimated fair value of the reporting unit is compared to its carrying value including goodwill. Fair value of the reporting units are estimated using the income approach, which incorporates the use of the discounted free cash flow (“DCF”) analyses and are corroborated using the market approach, which incorporates the use of revenue and earnings multiples based on market data. The DCF analyses are based on the current operating budgets and estimated long-term growth projections for each reporting unit. Future cash flows are discounted based on a market comparable weighted average cost of capital rate for each reporting unit, adjusted for market and other risks where appropriate. In addition, we analyze any difference between the sum of the fair values of the reporting units and our total market capitalization for reasonableness, taking into account certain factors including control premiums. If the fair value of the reporting unit is less than the carrying value, the difference is recognized as an impairment charge.
We evaluate the recoverability of indefinite-lived intangible assets by first performing a qualitative analysis evaluating whether any events and circumstances occurred that provide evidence that it is more likely than not that the indefinite-lived asset is impaired. If, based on our evaluation of the events and circumstances that occurred during the year we do not believe that it is more likely than not that the indefinite-lived asset is impaired, no quantitative impairment test is performed. Conversely, if the results of our qualitative assessment determine that it is more likely than not that the indefinite-lived asset is impaired, a quantitative impairment test is performed. If necessary, an impairment analysis is performed using the income approach to estimate the fair value of the indefinite-lived intangible asset. If the intangible asset carrying value exceeds its fair value, an impairment charge is recognized in an amount equal to that excess.
Significant judgments inherent in these analyses include estimating the amount and timing of future cash flows and the selection of appropriate discount rates, royalty rates and long-term growth rate assumptions. Changes in these estimates and assumptions could materially affect the determination of fair value for each reporting unit and indefinite-lived intangible asset and could result in an impairment charge, which could be material to our financial position and results of operations.
We performed our impairment assessment of goodwill and indefinite-lived intangible assets and concluded that no impairment existed for the years ended December 31, 2025, 2024 and 2023.
88
Table of Contents
Equity Investments in Unconsolidated Subsidiaries
Equity investments for which we exercise significant influence, but do not have control over the investee, are accounted for using the equity method of accounting. Unrealized gains and losses are included in other (income) expense, net. Equity investments for which we do not have the ability to exercise significant influence are primarily accounted for under the measurement alternative. Under the measurement alternative, the carrying value is measured at cost, less any impairment, plus or minus changes resulting from observable price changes in orderly transactions for identical or similar investments of the same issuer. Adjustments are determined primarily based on a market approach as of the transaction date and are recorded in other (income) expense, net. Our equity investments are included in Equity investments in unconsolidated subsidiaries in our consolidated balance sheets. Our share of earnings or losses are recognized in other (income) expense, net in our consolidated statements of income. We periodically evaluate all our equity investments for impairment.
The OSTTRA joint venture was accounted for using the equity method of accounting, and our share of earnings or losses are recognized in Equity in income on unconsolidated subsidiaries in our consolidated statements of income.
Foreign currency translation
We have operations in many foreign countries. For most international operations, the local currency is the functional currency. For international operations that are determined to be extensions of the parent company, the United States (“U.S.”) dollar is the functional currency. For local currency operations, assets and liabilities are translated into U.S. dollars using end of period exchange rates, and revenue and expenses are translated into U.S. dollars using weighted-average exchange rates. Foreign currency translation adjustments are accumulated in a separate component of equity.
Depreciation
The costs of property and equipment are depreciated using the straight-line method based upon the following estimated useful lives: buildings and improvements from 15 to 40 years and equipment and furniture from 2 to 10 years. The costs of leasehold improvements are amortized over the lesser of the useful lives or the terms of the respective leases.
Advertising expense
The cost of advertising is expensed as incurred. We incurred $252 million, $229 million and $209 million in advertising costs for the years ended December 31, 2025, 2024 and 2023, respectively.
Stock-based compensation
Stock-based compensation expense is measured at the grant date based on the fair value of the award and is recognized over the requisite service period, which typically is the vesting period. Stock-based compensation is classified as both operating-related expense and selling and general expense in the consolidated statements of income.
Income taxes
Deferred tax assets and liabilities are recognized for the future tax consequences attributable to differences between financial statement carrying amounts of existing assets and liabilities and their respective tax bases. Deferred tax assets and liabilities are measured using enacted tax rates expected to be applied to taxable income in the years in which those temporary differences are expected to be recovered or settled. We recognize liabilities for uncertain tax positions taken or expected to be taken in income tax returns. Accrued interest and penalties related to unrecognized tax benefits are recognized in interest expense and operating expense, respectively.
Judgment is required in determining our provision for income taxes, deferred tax assets and liabilities and unrecognized tax benefits. In determining the need for a valuation allowance, the historical and projected financial performance of the operation that is recording a net deferred tax asset is considered along with any other pertinent information.
We file income tax returns in the U.S. federal jurisdiction and various state and foreign jurisdictions, and we are routinely under audit by many different tax authorities. We believe that our accrual for tax liabilities is adequate for all open audit years based on an assessment of many factors including past experience and interpretations of tax law. This assessment relies on estimates and assumptions and may involve a series of complex judgments about future events. It is possible that tax examinations will be settled prior to December 31, 2026. If any of these tax audit settlements do occur within that period we would make any necessary adjustments to the accrual for unrecognized tax benefits.
A portion of the undistributed earnings of our foreign subsidiaries is indefinitely reinvested in our foreign operations. Accordingly, we have not recorded deferred income taxes related to those earnings. Quantification of the deferred tax liability, if any, associated with indefinitely reinvested earnings is not practicable.
89
Table of Contents
Redeemable Noncontrolling Interest
The agreement with the minority partners of our S&P Dow Jones Indices LLC joint venture contains redemption features whereby interests held by our minority partners are redeemable either (i) at the option of the holder or (ii) upon the occurrence of an event that is not solely within our control. Since redemption of the noncontrolling interest is outside of our control, this interest is presented on our consolidated balance sheets under the caption “Redeemable noncontrolling interest.” If the interest were to be redeemed, we would generally be required to purchase the interest at fair value on the date of redemption. We adjust the redeemable noncontrolling interest each reporting period to its estimated redemption value, but never less than its initial fair value, using both income and market valuation approaches. Our income and market valuation approaches incorporate Level 3 measures for instances when observable inputs are not available. The more significant judgmental assumptions used to estimate the value of the S&P Dow Jones Indices LLC joint venture include an estimated discount rate, a range of assumptions that form the basis of the expected future net cash flows (e.g., the revenue growth rates and operating margins), and a company specific beta. The significant judgmental assumptions used that incorporate market data, including the relative weighting of market observable information and the comparability of that information in our valuation models, are forward-looking and could be affected by future economic and market conditions. Any adjustments to the redemption value will impact retained income. See Note 9 – Equity for further detail.
Contingencies
We accrue for loss contingencies when both (a) information available prior to issuance of the consolidated financial statements indicates that it is probable that a liability had been incurred at the date of the financial statements and (b) the amount of loss can reasonably be estimated. We continually assess the likelihood of any adverse judgments or outcomes to our contingencies, as well as potential amounts or ranges of probable losses, and recognize a liability, if any, for these contingencies based on an analysis of each matter with the assistance of outside legal counsel and, if applicable, other experts. Because many of these matters are resolved over long periods of time, our estimate of liabilities may change due to new developments, changes in assumptions or changes in our strategy related to the matter. When we accrue for loss contingencies and the reasonable estimate of the loss is within a range, we record our best estimate within the range. We disclose an estimated possible loss or a range of loss when it is at least reasonably possible that a loss may be incurred.
Recently Issued or Adopted Accounting Standards
In November of 2025, the Financial Accounting Standards Board (“FASB”) issued accounting guidance to more closely align hedge accounting with the economics of an entity's risk management activities. This guidance is effective for annual reporting periods beginning after December 15, 2026, and interim reporting periods within those annual reporting periods, and early adoption is permitted. We do not expect this guidance to have a significant impact on our consolidated financial statements.
In September of 2025, the FASB issued accounting guidance that clarifies the guidance on which contracts are subject to derivative accounting and guidance on accounting for share based payments on contracts with customers. This guidance is effective for annual reporting periods beginning after December 15, 2026, and interim reporting periods within those annual reporting periods, and early adoption is permitted. We do not expect this guidance to have a significant impact on our consolidated financial statements.
In September of 2025, the FASB issued accounting guidance which removes references to prescriptive software development stages and includes an updated framework for capitalizing internal software costs. This guidance is effective for annual reporting periods beginning after December 15, 2027, and interim reporting periods within those annual reporting periods, and early adoption is permitted. We do not expect this guidance to have a significant impact on our consolidated financial statements.
In July of 2025, the FASB issued accounting guidance that provides an optional practical expedient for estimating future credit losses based on current conditions as of the balance sheet date and assuming those conditions do not change over the remaining life of the accounts receivable. This guidance is effective for annual reporting periods beginning after December 15, 2025, and interim reporting periods within those annual reporting periods, and early adoption is permitted. We do not expect this guidance to have a significant impact on our consolidated financial statements.
90
Table of Contents
In May of 2025, the FASB issued accounting guidance to improve the requirements for identifying the accounting acquirer in ASC 805, Business Combinations. The amendments in this update revise current guidance for determining the accounting acquirer for a transaction effected primarily by exchanging equity interests in which the legal acquiree is a VIE that meets the definition of a business. This guidance is effective for annual reporting periods beginning after December 15, 2026, and interim reporting periods within those annual reporting periods, and early adoption is permitted as of the beginning of an interim or annual reporting period. This guidance is required to be applied prospectively to any acquisition transaction that occurs after the initial application date. We do not expect this guidance to have a significant impact on our consolidated financial statements.
In November of 2024, the FASB issued accounting guidance which requires that an entity disclose, in the notes to financial statements, additional information about specific expense categories. The amendments in this update are effective for annual reporting periods beginning after December 15, 2026, and interim reporting periods beginning after December 15, 2027. We are currently evaluating the impact of this guidance on the Company’s disclosures.
In December of 2023, the FASB issued Accounting Standards Update No. 2023-09, Improvements to Income Tax Disclosures (“ASU 2023-09”). ASU 2023-09 amends ASC 740, Income Taxes to expand income tax disclosures and requires that the Company disclose (i) the income tax rate reconciliation using both percentages and reporting currency amounts; (ii) specific categories within the income tax rate reconciliation; (iii) additional information for reconciling items that meet a quantitative threshold; (iv) the composition of state and local income taxes by jurisdiction; and (v) the amount of income taxes paid disaggregated by jurisdiction. The Company adopted ASU 2023-09 for the year ended December 31, 2025 on a prospective basis. See Note 4 – Taxes on Income for additional information.
Reclassification
Certain prior year amounts have been reclassified for comparability purposes.
2. Acquisitions and Divestitures
Acquisitions
2025
Acquisitions completed during the year ended December 31, 2025 included:
•On November 25, 2025, we completed the acquisition of With Intelligence from Motive Partners for $1.8 billion. The acquisition is part of our Market Intelligence segment. Combining With Intelligence's proprietary data, benchmarks and workflow solutions with S&P Global’s trusted expertise and brand in private markets intelligence and analytics, the company creates one of the most comprehensive data offerings for alternatives and private markets participants. The acquisition of With Intelligence is not material to our consolidated financial statements.
•On November 10, 2025, we completed the acquisition of the Automatic Identification System (AIS) data services business of ORBCOMM Inc. The AIS business is a leading provider of satellite data services used to track and monitor vessels, enhancing maritime visibility and delivering critical insights that support business intelligence and decision-making for government and commercial clients worldwide. This acquisition is part of our Market Intelligence segment. The acquisition of AIS is not material to our consolidated financial statements.
•On November 7, 2025, Crisil, included within our Ratings segment, completed the acquisition of McKinsey PriceMetrix Co., a leading provider of performance benchmarking and data-driven insights for the wealth management industry. This acquisition expands Crisil’s benchmarking offerings across the Wealth Management value chain. The acquisition of McKinsey PriceMetrix Co. is not material to our consolidated financial statements.
•On October 1, 2025, we completed the acquisition of ARC Research, a subsidiary of ARC Group, the leading independent provider of investment performance data, benchmarking capabilities and insights in the private wealth market. The acquisition is part of our Indices segment and expands our capabilities to deliver innovative, high-quality benchmarks and data solutions tailored to the evolving needs of wealth managers, private banks, and financial advisers. The acquisition of ARC Research is not material to our consolidated financial statements.
•On June 6, 2025, we completed the acquisition of TeraHelix, a privately held financial technology firm. TeraHelix helps solve complex, enterprise-scale data challenges by providing frameworks that structure data models for smooth interoperability across platforms, systems and storage architectures. This acquisition is part of our Market Intelligence segment and strengthens our customer-centric approach to data, technology, and AI by meaningfully enhancing the
91
Table of Contents
ability to link datasets across classes and platforms. The acquisition of TeraHelix is not material to our consolidated financial statements.
None of our acquisitions completed during 2025 were material individually or in the aggregate, including the pro forma impact on earnings. For acquisitions during 2025 that were accounted for using the purchase method, the excess of the purchase price over the fair value of the net assets acquired is allocated to goodwill and other intangibles. The goodwill recognized on our acquisitions is largely attributable to anticipated operational synergies and growth opportunities as a result of the acquisition. The intangible assets, excluding goodwill and indefinite-lived intangibles, are being amortized over their anticipated useful lives of 5 to 20 years.
2024
Acquisitions completed during the year ended December 31, 2024 included:
•On December 31, 2024 we completed the acquisition of ProntoNLP, a leading provider of generative artificial intelligence tooling, allowing users to derive differentiated insights from unstructured and structured data. The acquisition is part of our Market Intelligence segment and its intellectual property is expected to power broader enterprise-wide applications. ProntoNLP’s proprietary models and LLM-based signal tools will bolster S&P Global’s textual data analytics capabilities. The acquisition of ProntoNLP is not material to our consolidated financial statements.
•On May 1, 2024, we completed the acquisition of Visible Alpha, the financial technology provider of deep industry and segment consensus data creating a premium offering of fundamental investment research capabilities on Market Intelligence’s Capital IQ Pro platform. The acquisition is part of our Market Intelligence segment and further enhances the depth and breadth of the overall Visible Alpha and S&P Capital IQ Pro offering. The acquisition of Visible Alpha is not material to our consolidated financial statements.
•On May 14, 2024, we completed the acquisition of World Hydrogen Leaders, a globally-recognized portfolio of hydrogen-related conferences and events, digital training and market intelligence. The acquisition is part of our Energy segment and complements Energy's global conference business and provides customers with full coverage of the hydrogen and derivative value chain alongside Energy Transition and Sustainability solutions, including hydrogen price assessments, emission factors and market research. The acquisition of World Hydrogen Leaders is not material to our consolidated financial statements.
None of our acquisitions completed during 2024 were material individually or in the aggregate, including the pro forma impact on earnings. For acquisitions during 2024 that were accounted for using the purchase method, the excess of the purchase price over the fair value of the net assets acquired is allocated to goodwill and other intangibles. The goodwill recognized on our acquisitions is largely attributable to anticipated operational synergies and growth opportunities as a result of the acquisition. The intangible assets, excluding goodwill and indefinite-lived intangibles, are being amortized over their anticipated useful lives of 7 years.
2023
Acquisitions completed during the year ended December 31, 2023 included:
•On February 16, 2023, we completed the acquisition of Market Scan Information Systems, Inc. (“Market Scan”), a leading provider of automotive pricing and incentive intelligence, including Automotive Payments as a ServiceTM and its powerful payment calculation engine. The addition of Market Scan to Mobility enabled the integration of detailed transaction intelligence in areas that are complementary to existing services for dealers, OEMs, lenders, and other market participants. The acquisition of Market Scan is not material to our consolidated financial statements.
•On January 3, 2023, we completed the acquisition of ChartIQ, a premier charting provider for the financial services industry. ChartIQ is a professional grade charting solution that allows users to visualize data with a fully interactive web-based library that works seamlessly across web, mobile and desktop. It provides advanced capabilities including trade visualization, options analytics, technical analysis and more. Additionally, ChartIQ allows clients to visualize vendor-supplied data combined with their own proprietary content, alternative datasets or analytics. The acquisition is part of our Market Intelligence segment and further enhances our S&P Capital IQ Pro platform and other workflow solutions to provide the industry with leading visualization capabilities. The acquisition of ChartIQ is not material to our consolidated financial statements.
92
Table of Contents
•On January 4, 2023, we completed the acquisition of TruSight Solutions LLC (“TruSight”) a provider of third-party vendor risk assessments. The acquisition was integrated into our Market Intelligence segment and further expanded the breadth and depth of S&P Global’s third party vendor risk management solutions by offering high-quality validated assessment data to clients designed to reduce further the vendor due diligence burden on service providers to the financial services industry. The acquisition of TruSight is not material to our consolidated financial statements.
None of our acquisitions completed during 2023 were material individually or in the aggregate, including the pro forma impact on earnings. For acquisitions during 2023 that were accounted for using the purchase method, the excess of the purchase price over the fair value of the net assets acquired is allocated to goodwill and other intangibles. The goodwill recognized on our acquisitions is largely attributable to anticipated operational synergies and growth opportunities as a result of the acquisition. The intangible assets, excluding goodwill and indefinite-lived intangibles, are being amortized over their anticipated useful lives of 5 to 7 years.
Non-cash investing activities
Liabilities assumed in conjunction with our acquisitions are as follows:
(in millions)
Year ended December 31,
2025
2024
2023
Fair value of assets acquired
$
2,321
$
549
399
Cash paid, net
(2,023)
(305)
(296)
Liabilities assumed
$
298
$
244
$
103
Divestitures
On January 12, 2026, we completed the sale of the Enterprise Data Management and thinkFolio businesses within our Market Intelligence segment to Symphony Technology Group (“STG”), a private equity firm focused on building and scaling market-leading software, data and analytics companies. The transaction is not expected to have a material impact to our consolidated financials statements.
2025
During the year ended December 31, 2025, we recorded a pre-tax gain of $273 million related to the following dispositions:
•On October 10, 2025, the Company and CME Group completed the sale of OSTTRA to Kohlberg Kravis Roberts & Co. (“KKR”), a leading global investment firm. The terms of the deal for OSTTRA equaled total enterprise value at $3.1 billion, subject to customary purchase price adjustments, which will be divided evenly between the Company and CME Group pursuant to the 50/50 joint venture. We received proceeds from the sale of $1.5 billion in cash ($1.4 billion after-tax), subject to purchase price adjustments. During the year ended December 31, 2025, we recorded a pre-tax gain of $270 million ($187 million after-tax) for the Company, including the impact of accumulated other comprehensive income related to our investment.
•In May of 2025, we recorded a pre-tax gain of $3 million ($2 million after-tax) in (Gain) loss on dispositions, net in the consolidated statements of income related to the sale of the Fincentric in August of 2024 in our Market Intelligence segment.
2024
During the year ended December 31, 2024 we completed the following dispositions that resulted in a pre-tax gain of $59 million which was included in (Gain) loss on dispositions, net in the consolidated statement of income:
•On November 1, 2024, we completed the sale of the PrimeOne business, our outsourced technology platform servicing the global prime finance business. The PrimeOne business was part of our Market Intelligence segment. During the year ended December 31, 2024, we recorded a pre-tax gain of $38 million ($27 million after-tax) in (Gain) loss on dispositions, net in the consolidated statement of income related to the sale of the PrimeOne business in our Market Intelligence segment.
93
Table of Contents
•On August 15, 2024, we completed the sale of Fincentric, formerly known as Markit Digital. This sale followed our announced intent to explore strategic opportunities for Fincentric in February of 2024. Fincentric was S&P Global’s premier digital solutions provider focused on developing mobile applications and websites for retail brokerages and other financial institutions. Fincentric specializes in designing cutting-edge financial data visualizations, interfaces and investor experiences. Fincentric was acquired by S&P Global through the merger with IHS Markit and was part of our Market Intelligence segment. During the year ended December 31, 2024, we recorded a pre-tax gain of $21 million ($12 million after-tax) in (Gain) loss on dispositions, net in the consolidated statement of income related to the sale of Fincentric in our Market Intelligence segment.
2023
During the year ended December 31, 2023, we completed the following disposition and received the following contingent payment that resulted in a pre-tax loss of $70 million, which was included in (Gain) loss on dispositions, net in the consolidated statement of income:
•On May 2, 2023, we completed the sale of Engineering Solutions to Allium Buyer LLC, a Delaware limited liability company controlled by funds affiliated with Kohlberg Kravis Roberts & Co. L.P. (“KKR”). We received the full proceeds from the sale of $975 million in cash, subject to purchase price adjustments, which resulted in approximately $750 million in after-tax proceeds. During the year ended December 31, 2023, we recorded a pre-tax loss of $120 million in (Gain) loss on dispositions, net and disposition-related costs of $16 million in selling and general expenses in the consolidated statement of income ($182 million after-tax, net of a release of a deferred tax liability of $157 million) related to the sale of Engineering Solutions. The transaction followed our announced intent in November of 2022 to divest the business. Engineering Solutions became part of the Company following our merger with IHS Markit.
•In the first quarter of 2023, we received a contingent payment following the sale of Leveraged Commentary and Data (“LCD”) along with a related family of leveraged loan indices in June of 2022. The contingent payment was payable six months following the closing upon the achievement of certain conditions related to the transition of LCD customer relationships. During the year ended December 31, 2023, the contingent payment resulted in a pre-tax gain of $46 million ($34 million after-tax) related to the sale of LCD in our Market Intelligence segment and $4 million ($3 million after-tax) in (Gain) loss on dispositions, net related to the sale of a family of leveraged loan indices in our Indices segment.
Assets and Liabilities Held for Sale
The components of assets and liabilities held for sale in the consolidated balance sheet consist of the following:
(in millions)
December 31,
December 31,
2025 1
2024
Accounts receivable, net
$
34
$
—
Property and equipment, net
8
—
Goodwill
141
—
Other non-current assets
13
—
Assets held for sale
$
196
$
—
Accounts payable
$
9
$
—
Unearned revenue
34
—
Liabilities held for sale
$
43
$
—
1 Assets and liabilities held for sale as of December 31, 2025 relate to the divestitures of the Enterprise Data Management and thinkFolio businesses within our Market Intelligence segment. Additionally, assets held for sale include fixed assets related to our intent to sell our facility in Centennial, Colorado.
94
Table of Contents
The operating profit of our businesses that were held for sale or disposed of for the years ending December 31, 2025, 2024 and 2023 is as follows:
(in millions)
Year ended December 31,
2025
2024
2023
Operating profit 1
$
64
$
71
$
101
1 The operating profit presented includes the revenue and recurring direct expenses associated with businesses held for sale or disposed of. The year ended December 21, 2025 excludes a pre-tax gain related to the sale of OSTTRA of $270 million. The year ended December 31, 2024 excludes a pre-tax gain related to the sale of the PrimeOne business of $38 million and a pre-tax gain related to the sale of Fincentric of $21 million. The year ended December 31, 2023 excludes a pre-tax loss related to the sale of Engineering Solutions of $120 million.
3. Goodwill and Other Intangible Assets
Goodwill
Goodwill represents the excess of purchase price and related costs over the value assigned to the net tangible and identifiable intangible assets of businesses acquired.
The change in the carrying amount of goodwill by segment is shown below:
(in millions)
Market Intelligence
Ratings
Energy
Mobility
Indices
Corporate
Total
Balance as of December 31, 2023
$
18,183
$
274
$
5,538
$
8,863
$
1,417
$
575
$
34,850
Acquisitions
229
—
16
—
—
—
245
Dispositions
(80)
—
—
—
—
—
(80)
Other 1
(26)
(15)
(4)
(5)
(48)
—
(98)
Balance as of December 31, 2024
18,306
259
5,550
8,858
1,369
575
34,917
Acquisitions
1,487
24
—
—
36
5
1,552
Reclassifications 2
(141)
(115)
—
—
—
115
(141)
Other 1
10
(4)
13
—
100
28
147
Balance as of December 31, 2025
$
19,662
$
164
$
5,563
$
8,858
$
1,505
$
723
$
36,475
1Primarily relates to the impact of foreign exchange and valuation adjustments for prior period acquisitions.
2Relates to Enterprise Data Management, which is classified as assets held for sale in our consolidated balance sheet as of December 31, 2025.
Goodwill additions and dispositions in the table above relate to transactions discussed in Note 2 - Acquisitions and Divestitures.
Other Intangible Assets
Other intangible assets include both indefinite-lived assets not subject to amortization and definite-lived assets subject to amortization. We have indefinite-lived assets with a carrying value of $846 million as of December 31, 2025 and 2024.
•2025 and 2024 both include $380 million and $90 million for Dow Jones Indices intellectual property and the Dow Jones tradename, respectively, that we recorded as part of the transaction to form S&P Dow Jones Indices LLC in 2012.
•2025 and 2024 both include $185 million within our Market Intelligence segment for the SNL tradename.
•2025 and 2024 both include $132 million within our Indices segment for the balance of the IP rights in a family of indices derived from the S&P 500, solidifying Indices IP in and to the S&P 500 index family.
•2025 and 2024 both include $59 million within our Indices segment for the Goldman Sachs Commodity Index intellectual property and the Broad Market Indices intellectual property.
95
Table of Contents
The following table summarizes our definite-lived intangible assets:
(in millions)
Cost
Databases and software
Content
Customer relationships
Tradenames
Other intangibles
Total
Balance as of December 31, 2023
$
3,942
$
139
$
13,490
$
1,528
$
325
$
19,424
Acquisitions
—
—
—
—
268
268
Reclassifications
(15)
—
—
—
—
(15)
Other 1
—
—
(25)
(7)
(7)
(39)
Balance as of December 31, 2024
3,927
139
13,465
1,521
586
19,638
Acquisitions
349
—
301
—
78
728
Reclassifications
11
—
—
—
(11)
—
Other 1
1
—
51
13
9
74
Balance as of December 31, 2025
$
4,288
$
139
$
13,817
$
1,534
$
662
$
20,440
Accumulated amortization
Balance as of December 31, 2023
$
1,116
$
139
$
1,198
$
256
$
163
$
2,872
Current year amortization
350
—
542
111
74
1,077
Reclassifications
(13)
—
—
—
—
(13)
Other 1
—
—
(3)
(1)
(4)
(8)
Balance as of December 31, 2024
1,453
139
1,737
366
233
3,928
Current year amortization
341
—
542
111
75
1,069
Reclassifications
2
—
—
—
(2)
—
Other 1
1
—
8
3
6
18
Balance as of December 31, 2025
$
1,797
$
139
$
2,287
$
480
$
312
$
5,015
Net definite-lived intangibles:
December 31, 2024
$
2,474
$
—
$
11,728
$
1,155
$
353
$
15,710
December 31, 2025
$
2,491
$
—
$
11,530
$
1,054
$
350
$
15,425
1Primarily relates to the impact of foreign exchange and valuation adjustments for prior period acquisitions.
Definite-lived intangible assets are being amortized on a straight-line basis over periods of up to 25 years. The weighted-average life of the intangible assets as of December 31, 2025 is approximately 21 years.
Amortization expense was $1,069 million, $1,077 million and $1,042 million for the years ended December 31, 2025, 2024 and 2023, respectively. Expected amortization expense for intangible assets over the next five years for the years ended December 31, assuming no further acquisitions or dispositions, is as follows:
(in millions)
2026
2027
2028
2029
2030
Amortization expense
$
1,110
$
1,094
$
1,076
$
1,050
$
1,024
4. Taxes on Income
Income before taxes on income resulting from domestic and foreign operations is as follows:
(in millions)
Year Ended December 31,
2025
2024
2023
Domestic operations
$
3,356
$
3,436
$
1,899
Foreign operations
2,871
1,872
1,772
Total income before taxes
$
6,227
$
5,308
$
3,671
96
Table of Contents
The provision for taxes on income consists of the following:
(in millions)
Year Ended December 31,
2025
2024
2023
Federal:
Current
$
909
$
740
$
559
Deferred
(110)
(131)
(177)
Total federal
799
609
382
Foreign:
Current
448
472
370
Deferred
(52)
(161)
(150)
Total foreign
396
311
220
State and local:
Current
292
252
216
Deferred
(80)
(31)
(40)
Total state and local
212
221
176
Total provision for taxes
$
1,407
$
1,141
$
778
The Company has elected to prospectively adopt the guidance in ASU No. 2023-09. Refer to Note 1 – Accounting Policies for additional information.
97
Table of Contents
A reconciliation of the U.S. federal statutory income tax amount and rate to our effective income tax amount and rate for financial reporting purposes for the year ended December 31, 2025 is as follows:
(in millions)
Year Ended December 31,
2025
Amount
Percent
U.S. Federal Statutory Income Tax Rate
$
1,308
21.0
%
State & local income taxes, net of federal income tax 1
129
2.1
Foreign tax effects
United Kingdom
(66)
(1.1)
Malta
Statutory tax rate differential
113
1.8
Nontaxable income
(269)
(4.3)
Other foreign jurisdictions
48
0.8
Effects of cross-border tax laws
Subpart F income
190
3.0
Foreign derived intangible income
(68)
(1.1)
Other
86
1.3
Tax credits
(24)
(0.4)
Changes in valuation allowances
5
0.1
Nontaxable or nondeductible items
23
0.4
Changes in unrecognized tax benefits
(7)
(0.1)
Other adjustments
S&P Dow Jones Indices LLC joint venture
(65)
(1.0)
Other
4
0.1
Effective income tax rate
$
1,407
22.6
%
1 State and local taxes in New York, California and Virginia make up the majority of the tax effect in this category.
We have elected to recognize the tax on Global Intangible Low Taxed Income (“GILTI”) as a period expense in the year the tax is incurred.
A reconciliation of the U.S. federal statutory income tax rate to our effective income tax rate for financial reporting purposes for the year ended December 31, 2024 and 2023, in accordance with the guidance prior to the adoption of ASU 2023-09, is as follows:
(in millions)
Year Ended December 31,
2024
2023
U.S. federal statutory income tax rate
21.0
%
21.0
%
State and local income taxes
3.5
3.5
Foreign operations
(4.7)
(5.1)
Stock-based compensation
(0.3)
(0.4)
S&P Dow Jones Indices LLC joint venture
(1.1)
(1.5)
Tax credits and incentives
(0.8)
(2.5)
Divestitures
0.1
1.8
Other, net
3.8
4.4
Effective income tax rate
21.5
%
21.2
%
We made net income tax payments totaling $1,502 million in 2025, $1,159 million in 2024, and $1,279 million in 2023.
98
Table of Contents
Net income tax payments for the year ended December 31, 2025 consisted of the following:
(in millions)
Year ended December 31,
2025
Federal
$
722
State
187
Foreign
United Kingdom
170
Germany
105
Other
318
Total
$
1,502
Significant components of the Company’s deferred tax assets and liabilities consisted of the following:
(in millions)
December 31,
2025
2024
Deferred tax assets:
Accrued expenses
$
128
$
114
Losses and other carryforwards
636
695
Research & Development Expenditures
420
350
Other
434
423
Total deferred tax assets
1,618
1,582
Deferred tax liabilities:
Goodwill and intangible assets
(4,321)
(4,348)
Other
(186)
(245)
Total deferred tax liabilities
(4,507)
(4,593)
Net deferred income tax asset before valuation allowance
(2,889)
(3,011)
Valuation allowance
(302)
(313)
Net deferred income tax liability
$
(3,191)
$
(3,324)
Reported as:
Non-current deferred tax assets
$
71
$
73
Non-current deferred tax liabilities
(3,262)
(3,397)
Net deferred income tax liability
$
(3,191)
$
(3,324)
We record valuation allowances against deferred income tax assets when we determine that it is more likely than not that such deferred income tax assets will not be realized based upon all the available evidence. The valuation allowance is primarily related to operating losses and other carryforwards.
A portion of the undistributed earnings of our foreign subsidiaries is indefinitely reinvested in our foreign operations. Accordingly, we have not recorded deferred income taxes related to those earnings. Quantification of the deferred tax liability, if any, associated with indefinitely reinvested earnings is not practicable.
As of December 31, 2025, we had net operating loss and carryforwards of $1,309 million, of which a significant portion has an unlimited carryover period under current law.
99
Table of Contents
A reconciliation of the beginning and ending amount of unrecognized tax benefits is as follows:
(in millions)
Year ended December 31,
2025
2024
2023
Balance at beginning of year
$
325
$
230
$
223
Additions based on tax positions related to the current year
41
76
21
Additions for tax positions of prior years
24
48
10
Reduction for tax positions of prior years
(13)
—
—
Reduction for settlements
—
(11)
(11)
Expiration of applicable statutes of limitations
(55)
(18)
(13)
Balance at end of year
$
322
$
325
$
230
The aggregated amount of federal, state and local, and foreign unrecognized tax benefits as of December 31, 2025, 2024 and 2023 was $322 million, $325 million and $230 million, respectively, exclusive of interest and penalties. During the year ended December 31, 2025, the change in unrecognized tax benefits resulted in a net increase of tax expense of $3 million.
We recognize accrued interest and penalties related to unrecognized tax benefits in interest expense and operating-related expense, respectively. During the years ended December 31, 2025, 2024, and 2023, the Company recognized approximately $14 million, $15 million, and $12 million in interest and penalties. In addition to the unrecognized tax benefits, we had accrued interest and penalties associated with unrecognized tax benefits of $79 million, $65 million and $50 million as of December 31, 2025, 2024 and 2023, respectively.
The U.S. federal income tax audits for 2018 through 2024 are in process. During 2025, we completed state and foreign tax audits and, with few exceptions, we are no longer subject to federal, state, or foreign income tax examinations by tax authorities for the years before 2016. The impact to tax expense in 2025, 2024 and 2023 was not material.
We file income tax returns in the U.S. federal jurisdiction and various state and foreign jurisdictions, and we are routinely under audit by many different tax authorities. We believe that our accrual for tax liabilities is adequate for all open audit years based on an assessment of many factors including past experience and interpretations of tax law. This assessment relies on estimates and assumptions and may involve a series of complex judgments about future events. It is possible that tax examinations will be settled prior to December 31, 2026. If any of these tax audit settlements do occur within that period, we would make any necessary adjustments to the accrual for unrecognized tax benefits.
The Organization for Economic Co-operation and Development (“OECD”) introduced an international tax framework under Pillar Two which includes a global minimum tax of 15%, which is implemented through local legislation in participating jurisdictions. The effects of Pillar Two taxes enacted in jurisdictions in which we operate have been reflected in our results and did not have a material impact on our consolidated financial statements.
On January 5, 2026, the OECD issued administrative guidance outlining a framework under which U.S.-parented groups may be excluded from the application of the OECD’s global minimum tax rules. Each member jurisdiction will need to adopt this guidance into local law, and the timing and manner of adoption may vary. We are continuing to monitor developments related to this guidance and will evaluate the impact on our financial statements as additional information becomes available.
100
Table of Contents
5. Debt
A summary of short-term and long-term debt outstanding is as follows:
(in millions)
December 31,
2025
2024
4.75% Senior Notes, due 2025 1
—
4
4.0% Senior Notes, due 2026 2
3
3
2.95% Senior Notes, due 2027 3
499
498
2.45% Senior Notes, due 2027 4
1,246
1,243
4.75% Senior Notes, due 2028 5
784
797
4.25% Senior Notes, due 2029 6
991
1,004
2.5% Senior Notes, due 2029 7
498
497
2.70% Sustainability-Linked Senior Notes, due 2029 8
1,241
1,238
1.25% Senior Notes, due 2030 9
596
595
4.25% Senior Notes, due 2031 10
595
—
2.90% Senior Notes, due 2032 11
1,480
1,477
5.25% Senior Notes due 2033 12
744
744
4.80% Senior Notes, due 2035 13
396
—
6.55% Senior Notes, due 2037 14
291
291
4.5% Senior Notes, due 2048 15
273
273
3.25% Senior Notes, due 2049 16
591
590
3.70% Senior Notes, due 2052 17
976
975
2.3% Senior Notes, due 2060 18
683
683
3.9% Senior Notes, due 2062 19
486
486
Commercial paper
715
—
Total debt
13,088
11,398
Less: short-term debt including current maturities
718
4
Long-term debt
$
12,370
$
11,394
1We made a $4 million repayment of our 4.75% senior notes in the first quarter of 2025.
2Interest payments are due semiannually on March 1 and September 1.
3Interest payments are due semiannually on January 22 and July 22, and as of December 31, 2025, the unamortized debt discount and issuance costs total $1 million.
4Interest payments are due semiannually on March 1 and September 1, and as of December 31, 2025, the unamortized debt discount and issuance costs total $4 million.
5Interest payments are due semiannually on February 1 and August 1.
6Interest payments are due semiannually on May 1 and November 1.
7Interest payments are due semiannually on June 1 and December 1, and as of December 31, 2025, the unamortized debt discount and issuance costs total $2 million.
8Interest payments are due semiannually on March 1 and September 1, and as of December 31, 2025, the unamortized debt discount and issuance costs total $9 million. From and including March 1, 2026, the interest rate payable on Sustainability-Linked Senior Notes due 2029 shall be increased by 25 basis points (0.25%) per annum, in accordance with the terms of the governing indenture.
9Interest payments are due semiannually on February 15 and August 15, and as of December 31, 2025, the unamortized debt discount and issuance costs total $4 million.
10Interest payments are due semiannually on January 15 and July 15, beginning on July 15, 2026, and as of December 31, 2025, the unamortized debt discount and issuance costs total $5 million.
11Interest payments are due semiannually on March 1 and September 1, and as of December 31, 2025, the unamortized debt discount and issuance costs total $20 million.
101
Table of Contents
12Interest payments are due semiannually on March 15 and September 15, and as of December 31, 2025, the unamortized debt discount and issuance costs total $6 million.
13Interest payments are due semiannually on June 4 and December 4, beginning on June 4, 2026, and as of December 31, 2025, the unamortized debt discount and issuance costs total $4 million.
14Interest payments are due semiannually on May 15 and November 15, and as of December 31, 2025, the unamortized debt discount and issuance costs total $2 million.
15Interest payments are due semiannually on May 15 and November 15, and as of December 31, 2025, the unamortized debt discount and issuance costs total $10 million.
16Interest payments are due semiannually on June 1 and December 1, and as of December 31, 2025, the unamortized debt discount and issuance costs total $9 million.
17Interest payments are due semiannually on March 1 and September 1, and as of December 31, 2025, the unamortized debt discount and issuance costs total $24 million.
18Interest payments are due semiannually on February 15 and August 15, and as of December 31, 2025, the unamortized debt discount and issuance costs total $17 million.
19Interest payments are due semiannually on March 1 and September 1, and as of December 31, 2025, the unamortized debt discount and issuance costs total $14 million.
Annual long-term debt maturities are scheduled as follows based on book values as of December 31, 2025: $3 million due in 2026, $1.7 billion due in 2027, $784 million due in 2028; $2.7 billion due in 2029; $596 million due in 2030; and $6.5 billion due thereafter.
The fair value of our total debt borrowings was $11.3 billion and $10.0 billion as of December 31, 2025 and December 31, 2024, respectively, and was estimated based on quoted market prices.
On December 4, 2025, we issued $600 million of 4.25% senior notes due in 2031 and $400 million of 4.80% senior notes due in 2035. The notes are fully and unconditionally guaranteed by our wholly-owned subsidiary, Standard & Poor's Financial Services LLC.
We have the ability to borrow a total of $2.0 billion through our commercial paper program, which is supported by our $2.0 billion five-year credit agreement (our “credit facility”) that will terminate on December 17, 2029. As of December 31, 2025, we had $715 million of outstanding commercial paper. As of December 31, 2024, we had no outstanding commercial paper.
Commitment fees for the unutilized commitments under the credit facility and applicable margins for borrowings thereunder are linked to the Company achieving three environmental sustainability performance indicators related to emissions, tested annually. We currently pay a commitment fee of 8 basis points. There will be no sustainability pricing adjustment to our commitment fees or our margins under the credit facility for the approximately year-long period beginning April 7, 2025 as a result of our emissions performance for the year ended December 31, 2024. The credit facility contains customary affirmative and negative covenants and customary events of default. The occurrence of an event of default could result in an acceleration of the obligations under the credit facility.
The only financial covenant in our credit facility is a requirement that our indebtedness to cash flow ratio, as defined in our credit facility, is not greater than 4 to 1, and this ratio has never been exceeded.
6. Derivative Instruments
Our exposure to market risk includes changes in foreign exchange rates and interest rates. We have operations in foreign countries where the functional currency is primarily the local currency. For international operations that are determined to be extensions of the parent company, the U.S. dollar is the functional currency. We typically have naturally hedged positions in most countries from a local currency perspective with offsetting assets and liabilities. As of December 31, 2025 and December 31, 2024, we have entered into foreign exchange forward contracts to mitigate or hedge the effect of adverse fluctuations in foreign exchange rates. As of December 31, 2025 and December 31, 2024, we held cross currency swap contracts to hedge a portion of our net investment in foreign subsidiaries against volatility in foreign exchange rates. These contracts are recorded at fair value that is based on foreign currency exchange rates and interest rates in active markets; therefore, we classify these derivative contracts within Level 2 of the fair value hierarchy. We do not enter into any derivative financial instruments for speculative purposes.
102
Table of Contents
Undesignated Derivative Instruments
During the twelve months ended December 31, 2025, 2024 and 2023, we entered into foreign exchange forward contracts in order to mitigate the change in fair value of specific assets and liabilities in the consolidated balance sheets. These forward contracts do not qualify for hedge accounting. As of December 31, 2025 and 2024, the aggregate notional value of these outstanding forward contracts was $1.5 billion and $2.3 billion, respectively. The changes in fair value of these forward contracts are recorded in prepaid and other assets or other current liabilities in the consolidated balance sheets with their corresponding change in fair value recognized in selling and general expenses in the consolidated statements of income. The amount recorded in prepaid and other current assets was $8 million as of December 31, 2025. The amount recorded in other current liabilities was $6 million and $42 million as of December 31, 2025 and 2024, respectively. The amount recorded in selling and general expense for the twelve months ended December 31, 2025, 2024 and 2023 related to these contracts was a net gain of $158 million, a net loss of $60 million and net gain of $81 million, respectively.
Net Investment Hedges
As of December 31, 2025 and 2024, we held cross currency swaps to hedge a portion of our net investment in one of our European subsidiaries against volatility in the Euro/U.S. dollar exchange rate. These swaps are designated and qualify as a hedge of a net investment in a foreign subsidiary and are scheduled to mature in 2029, 2030, 2032 and 2033. The notional value of our outstanding cross currency swaps designated as a net investment hedge was $3.5 billion as of December 31, 2025 and 2024. The changes in the fair value of these swaps are recognized in foreign currency translation adjustments, a component of other comprehensive income (loss), and reported in accumulated other comprehensive loss in our consolidated balance sheet. The gain or loss will be subsequently reclassified into net earnings when the hedged net investment is either sold, liquidated or substantially liquidated. We have elected to assess the effectiveness of our net investment hedges based on changes in spot exchange rates. Accordingly, amounts related to the cross currency swaps recognized directly in net income represent net periodic interest settlements and accruals, which are recognized in interest expense, net. We recognized net interest income of $46 million, $41 million and $25 million during the twelve months ended December 31, 2025, 2024 and 2023, respectively.
Cash Flow Hedges
Foreign Exchange Forward Contracts
During the twelve months ended December 31, 2025, 2024 and 2023, we entered into a series of foreign exchange forward contracts to hedge a portion of the Indian rupee, British pound, and Euro exposures through the fourth quarter of 2027, 2026 and 2025, respectively. These contracts are intended to offset the impact of movement of exchange rates on future revenue and operating costs and are scheduled to mature within twenty-four months. The changes in the fair value of these contracts are initially reported in accumulated other comprehensive loss in our consolidated balance sheet and are subsequently reclassified into revenue and selling and general expenses in the same period that the hedged transaction affects earnings.
As of December 31, 2025, we estimate that $5 million of pre-tax loss related to foreign exchange forward contracts designated as cash flow hedges recorded in other comprehensive income is expected to be reclassified into earnings within the next twelve months.
As of December 31, 2025 and 2024, the aggregate notional value of our outstanding foreign exchange forward contracts designated as cash flow hedges was $574 million and $539 million, respectively.
103
Table of Contents
Interest Rate Swaps
In the first quarter of 2024, we terminated our interest rate swap contracts with an aggregate notional value of $813 million and received net proceeds of $155 million upon termination. These contracts were designated as cash flow hedges and were scheduled to mature beginning in the first quarter of 2027. We performed a final effectiveness test upon the termination of each swap, and the effective portion of the gain of $155 million was recorded in accumulated other comprehensive loss in our consolidated balance sheet. The gain will be recognized into interest expense, net over the term which related interest payments will be made when we enter into anticipated future debt refinancing.
The following table provides information on the location and fair value amounts of our cash flow hedges and net investment hedges as of December 31, 2025 and December 31, 2024:
(in millions)
December 31,
December 31,
Balance Sheet Location
2025
2024
Derivatives designated as cash flow hedges:
Prepaid and other current assets
Foreign exchange forward contracts
$
5
$
4
Other current liabilities
Foreign exchange forward contracts
$
11
$
5
Derivatives designated as net investment hedges:
Other non-current assets
Cross currency swaps
$
—
$
58
Other non-current liabilities
Cross currency swaps
$
294
$
2
The following table provides information on the location and amounts of pre-tax gains (losses) on our cash flow hedges and net investment hedges for the years ended December 31:
(in millions)
Gain (Loss) recognized in Accumulated Other Comprehensive Loss (effective portion)
Location of Gain (Loss) reclassified from Accumulated Other Comprehensive Loss into Income (effective portion)
Gain (Loss) reclassified from Accumulated Other Comprehensive Loss into Income (effective portion)
2025
2024
2023
2025
2024
2023
Cash flow hedges - designated as hedging instruments
Foreign exchange forward contracts
$
(8)
$
(6)
$
6
Revenue, Selling and general expenses
$
3
$
8
$
7
Interest rate swap contracts
$
(1)
$
21
$
48
Interest expense, net
$
1
$
1
$
(3)
Net investment hedges- designated as hedging instruments
Cross currency swaps
$
(354)
$
71
$
(102)
Interest expense, net
$
(4)
$
(4)
$
(4)
104
Table of Contents
The activity related to the change in unrealized gains (losses) in accumulated other comprehensive loss was as follows for the years ended December 31:
(in millions)
Year ended December 31,
2025
2024
2023
Cash Flow Hedges
Foreign exchange forward contracts
Net unrealized gains on cash flow hedges, net of taxes, beginning of period
$
1
$
5
$
—
Change in fair value, net of tax
(3)
4
12
Reclassification into earnings, net of tax
(3)
(8)
(7)
Net unrealized (losses) gains on cash flow hedges, net of taxes, end of period
$
(5)
$
1
$
5
Interest rate swap contracts
Net unrealized gains (losses) on cash flow hedges, net of taxes, beginning of period
$
99
$
84
$
48
Change in fair value, net of tax
—
16
32
Reclassification into earnings, net of tax
(1)
(1)
4
Net unrealized gains on cash flow hedges, net of taxes, end of period
$
98
$
99
$
84
Net Investment Hedges
Net unrealized gains (losses) on net investment hedges, net of taxes, beginning of period
$
33
$
(21)
$
56
Change in fair value, net of tax
(271)
50
(81)
Reclassification into earnings, net of tax
4
4
4
Net unrealized (losses) gains on net investment hedges, net of taxes, end of period
$
(234)
$
33
$
(21)
7. Employee Benefits
We maintain a number of active defined contribution retirement plans for our employees. The majority of our defined benefit plans are frozen. As a result, no new employees will be permitted to enter these plans and no additional benefits for current participants in the frozen plans will be accrued.
We also have supplemental benefit plans that provide senior management with supplemental retirement, disability and death benefits. Certain supplemental retirement benefits are based on final monthly earnings. In addition, we sponsor a voluntary 401(k) plan under which make a non-elective contribution and may match employee contributions up to certain levels of compensation as well as profit-sharing plans under which we contribute a percentage of eligible employees’ compensation to the employees’ accounts.
We also provide certain medical, dental and life insurance benefits for active employees and eligible dependents. The medical and dental plans and supplemental life insurance plan are contributory, while the basic life insurance plan is noncontributory. We currently do not prefund any of these plans.
We recognize the funded status of our retirement and postretirement plans in the consolidated balance sheets, with a corresponding adjustment to accumulated other comprehensive loss, net of taxes. The amounts in accumulated other comprehensive loss represent net unrecognized actuarial losses and unrecognized prior service costs. These amounts will be subsequently recognized as net periodic pension cost pursuant to our accounting policy for amortizing such amounts.
Net periodic benefit cost for our retirement and postretirement plans other than the service cost component are included in other (income) expense, net in our consolidated statements of income.
105
Table of Contents
Benefit Obligation
A summary of the benefit obligation and the fair value of plan assets, as well as the funded status for the retirement and postretirement plans as of December 31, 2025 and 2024, is as follows (benefits paid in the table below include only those amounts contributed directly to or paid directly from plan assets):
(in millions)
Retirement Plans
Postretirement Plans
2025
2024
2025
2024
Net benefit obligation at beginning of year
$
1,323
$
1,425
$
17
$
20
Service cost
2
2
—
—
Interest cost
69
69
1
1
Actuarial loss (gain)
23
(89)
1
(1)
Gross benefits paid
(76)
(76)
(3)
(3)
Foreign currency effect
25
(8)
—
—
Net benefit obligation at end of year
1,366
1,323
16
17
Fair value of plan assets at beginning of year
1,395
1,473
1
1
Actual return on plan assets
98
(9)
—
—
Employer contributions
10
11
2
2
Gross benefits paid
(76)
(75)
(3)
(2)
Foreign currency effect
20
(5)
—
—
Fair value of plan assets at end of year
1,447
1,395
—
1
Funded status
$
81
$
72
$
(16)
$
(16)
Amounts recognized in consolidated balance sheets:
Non-current assets
$
254
$
246
$
—
$
—
Current liabilities
(9)
(10)
(2)
—
Non-current liabilities
(164)
(164)
(14)
(16)
$
81
$
72
$
(16)
$
(16)
Accumulated benefit obligation
$
1,360
$
1,317
Plans with accumulated benefit obligation in excess of the fair value of plan assets:
Projected benefit obligation
$
173
$
173
Accumulated benefit obligation
$
168
$
168
Fair value of plan assets
$
—
$
—
Amounts recognized in accumulated other comprehensive loss, net of tax:
Net actuarial loss (gain)
$
429
$
418
$
(34)
$
(36)
Prior service credit
—
—
(9)
(10)
Total recognized
$
429
$
418
$
(43)
$
(46)
106
Table of Contents
Net Periodic Benefit Cost
For purposes of determining annual pension cost, prior service costs are being amortized straight-line over the average expected remaining lifetime of plan participants expected to receive benefits.
A summary of net periodic benefit cost for our retirement and postretirement plans for the years ended December 31, is as follows:
(in millions)
Retirement Plans
Postretirement Plans
2025
2024
2023
2025
2024
2023
Service cost
$
2
$
2
$
2
$
—
$
—
$
—
Interest cost
69
69
74
1
1
1
Expected return on assets
(97)
(97)
(101)
—
—
—
Amortization of:
Actuarial loss (gain)
8
8
6
(2)
(2)
(2)
Prior service credit
—
—
—
(2)
(2)
(2)
Net periodic benefit cost
(18)
(18)
(19)
(3)
(3)
(3)
Settlement charge 1
—
—
23
—
—
—
Total net periodic benefit cost
$
(18)
$
(18)
$
4
$
(3)
$
(3)
$
(3)
1Lump sum withdrawals exceeded the combined total anticipated annual service and interest cost of our U.S. retirement plan during the year ended December 31, 2023, triggering the recognition of non-cash pre-tax settlement charges of $23 million.
Our U.K. retirement plan accounted for a cost of $6 million, $3 million and $4 million in 2025, 2024 and 2023, respectively, of the net periodic benefit cost attributable to the funded plans.
Other changes in plan assets and benefit obligations recognized in other comprehensive income, net of tax for the years ended December 31, are as follows:
(in millions)
Retirement Plans
Postretirement Plans
2025
2024
2023
2025
2024
2023
Net actuarial loss (gain)
$
17
$
14
$
33
$
1
$
(1)
$
1
Recognized actuarial (gain) loss
(6)
(6)
(5)
1
2
1
Prior service cost
—
—
—
1
1
1
Settlement charge 1
—
—
(18)
—
—
—
Total recognized
$
11
$
8
$
10
$
3
$
2
$
3
1Lump sum withdrawals exceeded the combined total anticipated annual service and interest cost of our U.S. retirement plan during the year ended December 31, 2023, triggering the recognition of non-cash pre-tax settlement charges of $23 million.
The total cost for our retirement plans was $155 million for 2025, $159 million for 2024 and $170 million for 2023. Included in the total retirement plans cost are defined contribution plans cost of $117 million, $126 million and $120 million for 2025, 2024 and 2023, respectively.
Assumptions
Retirement Plans
Postretirement Plans
2025
2024
2023
2025
2024
2023
Benefit obligation:
Discount rate 1
5.45
%
5.74
%
5.27
%
5.16
%
5.57
%
5.18
%
Net periodic cost:
Discount rate - U.S. plan 1
5.74
%
5.27
%
5.63
%
5.57
%
5.18
%
5.52
%
Discount rate - U.K. plan 1
5.53
%
4.50
%
4.76
%
Return on assets 2
6.25
%
6.00
%
6.00
%
1Effective January 1, 2025, we changed our discount rate assumption on our U.S. retirement plans to 5.74% from 5.27% in 2024 and changed our discount rate assumption on our U.K. plan to 5.53% from 4.50% in 2024.
107
Table of Contents
2The expected return on assets assumption is calculated based on the plan’s asset allocation strategy and projected market returns over the long-term. Effective January 1, 2026, we changed our return on assets assumption to 6.30% from 6.25% for the U.S. plan in 2025 and to 5.50% from 5.40% for the U.K. plan in 2025.
Cash Flows
Expected employer contributions in 2026 are $11 million and $2 million for our retirement and postretirement plans, respectively. In 2026, we may elect to make non-required contributions depending on investment performance and the pension plan status.
Information about the expected cash flows for our retirement and postretirement plans is as follows:
(in millions)
Retirement
Plans 1
Postretirement Plans 2
2026
$
82
2
2027
84
2
2028
85
2
2029
87
2
2030
90
1
2031-2035
469
5
1Reflects the total benefits expected to be paid from the plans or from our assets including both our share of the benefit cost and the participants’ share of the cost.
2Reflects the total benefits expected to be paid from our assets.
Fair Value of Plan Assets
In accordance with authoritative guidance for fair value measurements certain assets and liabilities are required to be recorded at fair value. Fair value is defined as the amount that would be received for selling an asset or paid to transfer a liability in an orderly transaction between market participants. A fair value hierarchy has been established which requires us to maximize the use of observable inputs and minimize the use of unobservable inputs when measuring fair value. The three levels of inputs used to measure fair value are as follows:
•Level 1 - Unadjusted quoted prices in active markets for identical assets or liabilities.
•Level 2 - Observable inputs other than Level 1 prices, such as quoted prices for similar assets or liabilities; quoted prices in markets that are not active; or other inputs that are observable or can be corroborated by observable market data for substantially the full term of the assets or liabilities.
•Level 3 - Unobservable inputs that are supported by little or no market activity and that are significant to the fair value of the assets or liabilities.
The fair value of our defined benefit plans assets as of December 31, 2025 and 2024, by asset class is as follows:
(in millions)
December 31, 2025
Total
Level 1
Level 2
Level 3
Cash and short-term investments
$
2
$
2
$
—
$
—
Fixed income:
Long duration strategy 1
956
—
956
—
Asset-backed securities 2
66
—
66
—
Total
1,024
2
1,022
—
Common collective trust funds measured at net asset value as a practical expedient:
Collective investment funds3
423
Total
$
1,447
108
Table of Contents
(in millions)
December 31, 2024
Total
Level 1
Level 2
Level 3
Cash and short-term investments
$
2
$
2
$
—
$
—
Fixed income:
Long duration strategy 1
905
—
905
—
Total
$
907
$
2
$
905
$
—
Common collective trust funds measured at net asset value as a practical expedient:
Collective investment funds 3
488
Total
$
1,395
1Includes securities that are mainly investment grade obligations of issuers in the U.S.
2Includes a fund that invests in asset-backed securities for the U.K. Plan.
3Includes the Standard & Poor’s MidCap 600 Composite Stock Index, Standard & Poor’s 500 Composite Stock Index, the Standard & Poor’s MidCap 400 Composite Stock Index, a short-term investment fund which is a common collective trust vehicle, and other various asset classes
For securities that are quoted in active markets, the trustee/custodian determines fair value by applying securities’ prices obtained from its pricing vendors. For commingled funds that are not actively traded, the trustee applies pricing information provided by investment management firms to the unit quantities of such funds. Investment management firms employ their own pricing vendors to value the securities underlying each commingled fund. Underlying securities that are not actively traded derive their prices from investment managers, which in turn, employ vendors that use pricing models (e.g., discounted cash flow, comparables). The domestic defined benefit plans have no investment in our stock, except through the S&P 500 commingled trust index fund.
The trustee obtains estimated prices from vendors for securities that are not easily quotable and they are categorized accordingly as Level 3. During the year ended December 31, 2025, we did not hold any securities categorized as Level 3.
Pension Trusts’ Asset Allocations
There are two pension trusts, one in the U.S. and one in the U.K.
•The U.S. pension trust had assets of $1,165 million and $1,130 million as of December 31, 2025 and 2024 respectively, and the target allocations in 2025 include 91% fixed income, 4% domestic equities, 3% international equities and 2% cash and cash equivalents.
•The U.K. pension trust had assets of $282 million and $265 million as of December 31, 2025 and 2024, respectively, and the target allocations in 2025 include 100% fixed income.
The pension assets are invested with the goal of producing a combination of capital growth, income and a liability hedge. The mix of assets is established after consideration of the long-term performance and risk characteristics of asset classes. Investments are selected based on their potential to enhance returns, preserve capital and reduce overall volatility. Holdings are diversified within each asset class. The portfolios employ a mix of index and actively managed equity strategies by market capitalization, style, geographic regions and economic sectors. The fixed income strategies include U.S. long duration securities, core fixed income, intermediate credit, high yield, and U.K. debt instruments. The short-term portfolio, whose primary goal is capital preservation for liquidity purposes, is composed of government and government-agency securities, uninvested cash, receivables and payables. The portfolios do not employ any financial leverage.
U.S. Defined Contribution Plan
Assets of the defined contribution plan in the U.S. consist primarily of investment options, which include actively managed equity, indexed equity, actively managed equity/bond funds, target date funds, S&P Global Inc. common stock, stable value and money market strategies. There is also a self-directed mutual fund investment option. The plan purchased 104,317 shares and sold 179,394 shares of S&P Global Inc. common stock in 2025 and purchased 81,400 shares and sold 159,810 shares of S&P Global Inc. common stock in 2024. The plan held approximately 1.0 million and 1.1 million shares of S&P Global Inc. common stock as of December 31, 2025 and 2024, respectively, with market values of $535 million and $547 million, respectively. The plan received dividends on S&P Global Inc. common stock of $4.3 million and $4.4 million during the years ended December 31, 2025 and December 31, 2024, respectively.
109
Table of Contents
8. Stock-Based Compensation
We issue stock-based incentive awards to our eligible employees under the 2019 Employee Stock Incentive Plan and to our eligible non-employee members of the Board of Directors under a Director Deferred Stock Ownership Plan. No further awards may be granted under the 2002 Employee Stock Incentive Plan (the “2002 Plan”), although awards granted under the 2002 Plan prior to the adoption of the new 2019 Plan in June of 2019 remain outstanding in accordance with their terms.
•2019 Employee Stock Incentive Plan (the “2019 Plan”) – The 2019 Plan permits the granting of stock options, stock appreciation rights, restricted stock awards, performance awards, and other stock-based awards.
•Director Deferred Stock Ownership Plan (the “Director Plan”) – Under the Director Plan, common stock reserved may be credited to deferred stock accounts for eligible non-employee members of the Board of Directors. In general, the plan requires that 50% of eligible Directors’ annual compensation and dividend equivalents be credited to deferred stock accounts. Each Director may also elect to defer all or a portion of the remaining compensation and have an equivalent number of shares credited to their deferred stock account. Recipients under this plan are not required to provide consideration to us other than rendering service. Shares will be delivered as of the date a recipient ceases to be a member of the Board of Directors or within five years thereafter, if so elected. The plan will remain in effect until terminated by the Board of Directors or until no shares of stock remain available under the plan.
•2014 Equity Incentive Award Plan and the Amended and Restated IHS Inc. 2004 Long-Term Incentive Plan (the “IHS Markit’s equity plans”) – In connection with the merger with IHS Markit, we assumed the outstanding restricted stock units, performance-based restricted stock units, deferred stock units, and stock options granted under IHS Markit’s equity plans, converted using the 0.2838 merger exchange ratio. From the merger date, no additional awards under these plans may be granted; however, the outstanding awards that were converted at the merger date continue to vest in accordance with the terms of the merger agreement.
The number of common shares reserved for issuance under the 2019 Plan are as follows:
(in millions)
December 31,
2025
2024
Shares available for granting 1
17.9
18.0
Options outstanding
—
—
Total shares reserved for issuance
17.9
18.0
1 Shares reserved for issuance under the Director Plan are less than 1.0 million at both December 31, 2025 and 2024.
We issue treasury shares upon the issuance of restricted stock and other stock-based awards and the exercise of stock options. To offset the dilutive effect of our equity compensation plans, we periodically repurchase shares. See Note 9 – Equity for further discussion.
Stock-based compensation expense and the corresponding tax benefit are as follows:
(in millions)
Year Ended December 31,
2025
2024
2023
Restricted stock and other stock-based awards expense
$
236
$
247
$
171
Stock option expense
—
—
—
Total stock-based compensation expense
$
236
$
247
$
171
Tax benefit
$
43
$
49
$
32
Restricted Stock and Other Stock-Based Awards
Restricted stock and other stock-based awards (performance and non-performance) have been granted under the 2002 Plan and 2019 Plan. Performance unit awards only vest if we achieve certain financial goals over the performance period. Restricted stock non-performance awards have various vesting periods (generally three years). Recipients of restricted stock and unit awards are not required to provide consideration to us other than rendering service.
110
Table of Contents
The stock-based compensation expense for restricted stock and other stock-based awards is determined based on the market price of our stock at the grant date of the award applied to the total number of awards that are anticipated to fully vest. For performance awards, adjustments are made to expense consistent with the expected percent achievement of the performance goals.
Restricted stock and other stock-based award activity is as follows:
(in millions, except per award amounts)
Shares
Weighted-average grant-date fair value
Balance as of December 31, 2024
1.2
$
387.14
Granted
0.4
$
525.67
Vested
(0.4)
$
392.96
Forfeited
(0.3)
$
404.59
Balance as of December 31, 2025
0.9
$
436.46
Total unrecognized compensation expense related to restricted awards
$
173
Weighted-average years to be recognized over
1.2
Year Ended December 31,
2025
2024
2023
Weighted-average grant-date fair value per award
$
525.67
$
427.84
$
374.00
Total fair value of restricted stock and other stock-based awards vested
$
222
$
230
$
323
Tax benefit relating to restricted award activity
$
60
$
56
$
71
Stock Options
Stock options may not be granted at a price less than the fair market value of our common stock on the date of grant. Stock options granted vest over a four-year service period and have a maximum term of 10 years. Stock option compensation costs are recognized from the date of grant, utilizing a four-year graded vesting method. Under this method, more than half of the costs are recognized over the first twelve months, approximately one-quarter of the costs are recognized over a twenty-four month period starting from the date of grant, approximately one-tenth of the costs are recognized over a thirty-six month period starting from the date of grant, and the remaining costs are recognized over a forty-eight month period starting from the date of grant.
There were no stock options granted in 2025, 2024 and 2023.
Stock option activity is as follows:
(in millions, except per award amounts)
Shares
Weighted average exercise price
Weighted-average remaining years of contractual term
Aggregate intrinsic value
Options outstanding as of December 31, 2024
—
$
74.46
Options outstanding as of December 31, 2025
—
$
74.46
1.22
$
5
Options exercisable as of December 31, 2025
—
$
74.46
1.22
$
5
1 There are less than 0.1 million options outstanding and exercisable.
Information regarding our stock option exercises is as follows:
(in millions)
Year Ended December 31,
2025
2024
2023
Net cash proceeds from the exercise of stock options
$
—
$
4
$
13
Total intrinsic value of stock option exercises
$
—
$
19
$
55
Income tax benefit realized from stock option exercises
$
—
$
5
$
12
111
Table of Contents
9. Equity
Capital Stock
Two million shares of preferred stock, par value $1 per share, are authorized; none have been issued.
On January 14, 2026, the Board of Directors approved an increase in the dividends for 2026 to a quarterly common stock dividend of $0.97 per share.
Year Ended December 31,
2025
2024
2023
Annualized dividend rate1
$
3.84
$
3.64
$
3.60
Dividends paid (in millions)
$
1,170
$
1,134
$
1,147
1 The quarterly dividend rate was $0.96 per share for the year ended December 31 2025. The quarterly dividend rate was $0.91 per share for the year ended December 31 2024.The quarterly dividend rate was $0.90 per share for the year ended December 31 2023.
Stock Repurchases
On November 13, 2025, the Board of Directors approved a share repurchase program authorizing the purchase of 30 million shares (the “2025 Repurchase Program”), which was approximately 10% of the total shares of our outstanding common stock at the time. On June 22, 2022, the Board of Directors approved a share repurchase program authorizing the purchase of 30 million shares (the “2022 Repurchase Program”), which was approximately 9% of the total shares of our outstanding common stock at that time.
Our purchased shares may be used for general corporate purposes, including the issuance of shares for stock compensation plans and to offset the dilutive effect of the exercise of employee stock options. As of December 31, 2025, 30.0 million shares remained under the 2025 Repurchase Program and 2.7 million shares remained available under the 2022 Repurchase Program. Our 2025 Repurchase Program and 2022 Repurchase Program have no expiration date and purchases under these programs may be made from time to time on the open market and in private transactions, depending on market conditions.
We have entered into accelerated share repurchase (“ASR”) agreements with financial institutions to initiate share repurchases of our common stock. Under an ASR agreement, we pay a specified amount to the financial institution and receive an initial delivery of shares. Upon settlement of the ASR agreement, the financial institution typically delivers additional shares. The total number of shares ultimately delivered, and therefore the average price paid per share, is determined at the end of the applicable purchase period of each ASR agreement based on the volume weighted-average share price, less a discount. We account for our ASR agreements as two transactions: a stock purchase transaction and a forward stock purchase contract. The shares delivered under the ASR agreements resulted in a reduction of outstanding shares used to determine our weighted average common shares outstanding for purposes of calculating basic and diluted earnings per share. The repurchased shares are held in Treasury. The forward stock purchase contracts are classified as equity instruments.
Effective January 1, 2023, the Inflation Reduction Act of 2022 has mandated a 1% excise tax on share repurchases. Excise tax obligations that result from the Company’s share repurchases are accounted for as a cost of the treasury stock transaction, and are included in other current liabilities on our consolidated balance sheets. The amount recorded in other current liabilities was $46 million and $30 million as of December 31, 2025 and December 31, 2024, respectively. During the years ended December 30, 2025 and 2024, the Company made an excise tax payment of $30 million and $29 million, respectively, which is included in financing activities in the consolidated statement of cash flows.
112
Table of Contents
The terms of each ASR agreement entered into for the years ended December 31, 2025, 2024 and 2023, structured as outlined above, are as follows:
(in millions, except average price)
ASR Agreement Initiation Date
ASR Agreement Completion Date
Initial Shares Delivered
Additional Shares Delivered
Total Number of Shares Purchased
Average Price Paid Per Share
Total Cash Utilized
December 4, 2025 1
4.0
—
4.0
$
—
$
2,500
August 12, 2025 2
October 23, 2025
1.7
0.6
2.3
$
513.82
$
1,200
May 6, 20253
August 8, 2025
1.0
0.2
1.2
$
518.47
$
650
February 19, 2025 4
May 6, 2025
1.0
0.3
1.3
$
491.12
$
650
October 28, 2024 5
February 18, 2025
2.3
0.3
2.6
$
500.95
$
1,300
July 31, 2024 6
October 22, 2024
2.6
0.3
3.0
$
505.19
$
1,500
February 12, 2024 7
April 12, 2024
1.0
0.2
1.2
$
421.05
$
500
November 13, 2023 8
February 7, 2024
2.8
0.2
3.0
$
428.45
$
1,300
August 7, 2023 9
September 8, 2023
1.1
0.2
1.3
$
387.36
$
500
May 8, 2023 10
August 4, 2023
2.5
0.1
2.6
$
384.75
$
1,000
February 13, 2023 11
May 5, 2023
1.1
0.3
1.4
$
341.95
$
500
1 The ASR agreement was structured as an uncapped ASR agreement in which we paid $2.5 billion and initially received shares valued at 80% of the $2.5 billion at a price equal to the market price of the Company’s common stock on December 5, 2025. The Company received an initial delivery of 4.0 million shares from the ASR program. We completed the ASR agreement on February 3, 2026 and received an additional 0.8 million shares. We repurchased a total of 4.8 million shares under the ASR agreement for an average purchase price $519.39 per share. The ASR agreement was executed under our 2022 Repurchase Program.
2 The ASR agreement was structured as an uncapped ASR agreement in which we paid $1.2 billion and initially received shares valued at 80% of the $1.2 billion at a price equal to the market price of the Company’s common stock on August 12, 2025. The Company received an initial delivery of 1.7 million shares from the ASR program. We completed the ASR agreement on October 23, 2025 and received an additional 0.6 million shares. The ASR agreement was executed under our 2022 Repurchase Program.
3 The ASR agreement was structured as an uncapped ASR agreement in which we paid $650 million and initially received shares valued at 80% of the $650 million at a price equal to the market price of the Company’s common stock on May 6, 2025. The Company received an initial delivery of 1.0 million shares from the ASR program. We completed the ASR agreement on August 8, 2025 and received an additional 0.2 million shares. The ASR agreement was executed under our 2022 Repurchase Program.
4 The ASR agreement was structured as an uncapped ASR agreement in which we paid $650 million and initially received shares valued at 80% of the $650 million at a price equal to the market price of the Company’s common stock on February 19, 2025. The Company received an initial delivery of 1.0 million shares from the ASR program. We completed the ASR agreement on May 6, 2025 and received an additional 0.3 million shares. The ASR agreement was executed under our 2022 Repurchase Program.
5 The ASR agreement was structured as an uncapped ASR agreement in which we paid $1.3 billion and initially received shares valued at 85% of the $1.3 billion at a price equal to the market price of the Company’s common stock on October 28, 2024 when the Company received an initial delivery of 2.3 million shares from the ASR program. We completed the ASR agreement on February 18, 2025 and received an additional 0.3 million shares from the ASR program. The ASR agreement was executed under our 2022 Repurchase Program.
6 The ASR agreement was structured as an uncapped ASR agreement in which we paid $1.5 billion and initially received shares valued at 85% of the $1.5 billion at a price equal to the market price of the Company’s common stock on July 31, 2024 when the Company received an initial delivery of 2.6 million shares from the ASR program on August 1, 2024. We completed the ASR agreement on October 22, 2024 and received an additional 0.3 million shares. The ASR agreement was executed under our 2022 Repurchase Program.
7 The ASR agreement was structured as an uncapped ASR agreement in which we paid $500 million and initially received shares valued at 85% of the $500 million at a price equal to the market price of the Company’s common stock on February 12, 2024 when the Company received an initial delivery of 1.0 million shares from the ASR program. We completed the ASR agreement on April 12, 2024 and received an additional 0.2 million shares. The ASR agreement was executed under our 2022 Repurchase Program.
8 The ASR agreement was structured as an uncapped ASR agreement in which we paid $1.3 billion and initially received shares valued at 85% of the $1.3 billion at a price equal to the market price of the Company’s common stock on November 13, 2023 when the Company received an initial delivery of 2.8 million shares from the ASR program. We completed the ASR agreement on February 7, 2024 and received an additional 0.2 million shares. The ASR agreement was executed under our 2022 Repurchase Program.
9 The ASR agreement was structured as an uncapped ASR agreement in which we paid $500 million and initially received shares valued at 85% of the $500 million at a price equal to the market price of the Company’s common stock on August 7, 2023 when the Company received an initial delivery of 1.1 million shares from the ASR program. We completed the ASR agreement on September 8, 2023 and received an additional 0.2 million shares. The ASR agreement was executed under our 2022 Repurchase Program.
113
Table of Contents
10 The ASR agreement was structured as an uncapped ASR agreement in which we paid $1 billion and initially received shares valued at 87.5% of the $1 billion at a price equal to the market price of the Company’s common stock on May 8, 2023 when the Company received an initial delivery of 2.5 million shares from the ASR program.We completed the ASR agreement on August 4, 2023 and received an additional 0.1 million shares. The ASR agreement was executed under our 2022 Repurchase Program.
11 The ASR agreement was structured as an uncapped ASR agreement in which we paid $500 million and initially received shares valued at 85% of the $500 million at a price equal to the market price of the Company’s common stock on February 13, 2023 when the Company received an initial delivery of 1.1 million shares from the ASR program. We completed the ASR agreement on May 5, 2023 and received an additional 0.3 million shares. The ASR agreement was executed under our 2022 Repurchase Program..
During the year ended December 31, 2025, we received a total of 9.3 million shares, including 0.3 million shares received in February of 2025 related to our October 28, 2024 ASR agreement, resulting in $5.0 billion of cash used to purchase shares. During the year ended December 31, 2024 we received a total of 6.7 million shares, including 0.2 million shares received in February of 2024 related to our November 13, 2023 ASR agreement, resulting in $3.3 billion of cash used to purchase shares. During the year ended December 31, 2023, we received a total of 8.6 million shares, including 0.4 million shares received in February of 2023 related to our December 2, 2022 ASR agreement, resulting in $3.3 billion of cash used to purchase shares.
Redeemable Noncontrolling Interests
Our redeemable noncontrolling interests include an agreement with the minority partners that own 27% of our S&P Dow Jones Indices LLC joint venture contains redemption features whereby interests held by minority partners are redeemable either (i) at the option of the holder or (ii) upon the occurrence of an event that is not solely within our control. Specifically, under the terms of the operating agreement of S&P Dow Jones Indices LLC, CME Group and CME Group Index Services LLC (“CGIS”) has the right at any time to sell, and we are obligated to buy, at least 20% of their share in S&P Dow Jones Indices LLC. In addition, in the event there is a change of control of the Company, for the 15 days following a change in control, CME Group and CGIS will have the right to put their interest to us at the then fair value of CME Group’s and CGIS’ minority interest.
If interests were to be redeemed under this agreement, we would generally be required to purchase the interest at fair value on the date of redemption. This interest is presented on the consolidated balance sheets outside of equity under the caption “Redeemable noncontrolling interests” with an initial value based on fair value for the portion attributable to the net assets we acquired, and based on our historical cost for the portion attributable to our S&P Index business. We adjust the redeemable noncontrolling interest each reporting period to its estimated redemption value, but never less than its initial fair value, using both income and market valuation approaches. Our income and market valuation approaches may incorporate Level 3 fair value measures for instances when observable inputs are not available. The more significant judgmental assumptions used to estimate the value of the S&P Dow Jones Indices LLC joint venture include an estimated discount rate, a range of assumptions that form the basis of the expected future net cash flows (e.g., the revenue growth rates and operating margins), and a company specific beta. The significant judgmental assumptions used that incorporate market data, including the relative weighting of market observable information and the comparability of that information in our valuation models, are forward-looking and could be affected by future economic and market conditions. Any adjustments to the redemption value will impact retained income.
Noncontrolling interests that do not contain such redemption features are presented in equity.
Changes to redeemable noncontrolling interests during the year ended December 31, 2025 were as follows:
(in millions)
Balance as of December 31, 2024
$
4,252
Net income attributable to redeemable noncontrolling interests
317
Distributions to noncontrolling interests
(301)
Redemption value adjustment
614
Other 1
35
Balance as of December 31, 2025 2
$
4,917
1 Relates to foreign currency translation adjustments
2 As of December 31, 2025, $4,914 million relates to our redeemable noncontrolling interest in the Indices business
114
Table of Contents
Accumulated Other Comprehensive Loss
The following table summarizes the changes in the components of accumulated other comprehensive loss for the year ended December 31, 2025:
(in millions)
Foreign Currency Translation Adjustments
Pension and Postretirement Benefit Plans
Unrealized Gain (Loss)
on Cash Flow Hedges 3
Accumulated Other Comprehensive Loss
Balance as of December 31, 2024
$
(609)
$
(372)
$
98
$
(883)
Other comprehensive income (loss) before reclassifications
202
1
(18)
(2)
182
Reclassifications from accumulated other comprehensive income (loss) to net earnings
4
4
2
(4)
3
4
Net other comprehensive income (loss)
206
(14)
(6)
186
Balance as of December 31, 2025
$
(403)
$
(386)
$
92
$
(697)
1Includes an unrealized loss related to our cross currency swaps. See Note 6 – Derivative Instruments for additional detail of items recognized in accumulated other comprehensive loss.
2Reflects amortization of net actuarial losses and is net of a tax benefit of less than $1 million for the year ended December 31, 2025. See Note 7 —Employee Benefits for additional details of items reclassed from accumulated other comprehensive loss to net earnings.
3See Note 6 – Derivative Instruments for additional details of items reclassified from accumulated other comprehensive loss to net earnings.
10. Earnings per Share
Basic earnings per common share (“EPS”) is computed by dividing net income attributable to the common shareholders of the Company by the weighted-average number of common shares outstanding. Diluted EPS is computed in the same manner as basic EPS, except the number of shares is increased to include additional common shares that would have been outstanding if potential common shares with a dilutive effect had been issued. Potential common shares consist primarily of restricted performance shares and stock options calculated using the treasury stock method.
The calculation for basic and diluted EPS is as follows:
(in millions, except per share data)
Year Ended December 31,
2025
2024
2023
Amount attributable to S&P Global Inc. common shareholders:
Net income
$
4,471
$
3,852
$
2,626
Basic weighted-average number of common shares outstanding
304.8
311.6
318.4
Effect of dilutive securities
0.3
0.3
0.5
Diluted weighted-average number of common shares outstanding
305.1
311.9
318.9
Earnings per share attributable to S&P Global Inc. common shareholders:
Net income:
Basic
$
14.67
$
12.36
$
8.25
Diluted
$
14.66
$
12.35
$
8.23
We have certain stock options and restricted performance shares that are potentially excluded from the computation of diluted EPS. The effect of the potential exercise of stock options is excluded when the average market price of our common stock is lower than the exercise price of the related option during the period or when a net loss exists because the effect would have been antidilutive. Additionally, restricted performance shares are excluded because the necessary vesting conditions had not been met or when a net loss exists. Restricted performance shares outstanding of 0.4 million, 0.5 million and 0.7 million as of December 31, 2025, 2024 and 2023, respectively, were excluded. As of December 31, 2025, 2024 and 2023, there were no stock options excluded.
115
Table of Contents
11. Restructuring
We continuously evaluate our cost structure to identify cost savings associated with streamlining our management structure. Our 2025 and 2024 restructuring plans consisted of company-wide workforce reductions of approximately 1,300 and 1,230 positions, respectively, and are further detailed below. The charges for each restructuring plan are classified as selling and general expenses within the consolidated statements of income and the reserves are included in other current liabilities in the consolidated balance sheets.
In certain circumstances, reserves are no longer needed because employees previously identified for separation resigned from the Company and did not receive severance or were reassigned due to circumstances not foreseen when the original plans were initiated. In these cases, we reverse reserves through the consolidated statements of income during the period when it is determined they are no longer needed.
The initial restructuring charge recorded and the ending reserve balance as of December 31, 2025 by segment is as follows:
2025 Restructuring Plan
2024 Restructuring Plan
(in millions)
Initial Charge Recorded
Ending Reserve Balance
Initial Charge Recorded
Ending Reserve Balance
Market Intelligence
$
56
$
25
$
77
$
7
Ratings
17
5
4
1
Energy
19
12
13
—
Mobility
15
11
6
1
Indices
4
4
1
—
Corporate
46
28
24
6
Total
$
157
$
85
$
125
$
15
For the year ended December 31, 2025, we recorded a pre-tax restructuring charge of $157 million primarily related to employee severance charges for the 2025 restructuring plan and have reduced the reserve by $72 million. For the years ended December 31, 2025 and 2024, we have reduced the reserve for the 2024 restructuring plan by $73 million and $37 million, respectively. The reductions primarily related to cash payments for employee severance charges.
12. Segment and Geographic Information
As discussed in Note 1 – Accounting Policies, we have five reportable segments: Market Intelligence, Ratings, Energy, Mobility and Indices.
Our Chief Executive Officer is our chief operating decision-maker (“CODM”) and evaluates performance of our segments and allocates resources (including employees, property, and financial or capital resources) based primarily on operating profit for each segment. Segment operating profit does not include Corporate Unallocated expense, equity in income on unconsolidated subsidiaries, other (income) expense, net, or interest expense, net, as these are amounts that do not affect the operating results of our reportable segments. We use the same accounting policies for our segments as those described in Note 1 – Accounting Policies.
116
Table of Contents
Operating results for the years ended December 31, 2025, 2024 and 2023 are as follows:
(in millions)
Market Intelligence
Ratings
Energy
Mobility
Indices
Engineering Solutions
Total
2025
Revenue from external customers
$
4,902
$
4,549
$
2,299
$
1,747
$
1,839
$
—
$
15,336
Intersegment revenue 1
14
175
—
—
11
—
200
Revenue
4,916
4,724
2,299
1,747
1,850
—
15,536
Intersegment elimination
(200)
Total revenue
15,336
Less: segment expenses 2
3,246
1,645
1,205
1,051
537
—
7,684
Less: other segment items 3
679
66
151
318
42
—
1,256
Intersegment elimination
(200)
Segment operating profit
$
991
$
3,013
$
943
$
378
$
1,271
$
—
$
6,596
Corporate Unallocated expense 4
146
Equity in income on unconsolidated subsidiaries
(28)
Operating profit
6,478
Other income, net
(36)
Interest expense, net
287
Income before taxes on income
$
6,227
(in millions)
Market Intelligence
Ratings
Energy
Mobility
Indices
Engineering Solutions
Total
2024
Revenue from external customers
$
4,633
$
4,207
$
2,142
$
1,609
$
1,617
$
—
$
14,208
Intersegment revenue 1
12
163
—
—
11
—
186
Revenue
4,645
4,370
2,142
1,609
1,628
—
14,394
Intersegment elimination
(186)
Total revenue
14,208
Less: segment expenses 2
3,133
1,617
1,139
982
483
—
7,354
Less: other segment items 3
637
46
158
315
42
—
1,198
Intersegment elimination
(186)
Segment operating profit
$
875
$
2,707
$
845
$
312
$
1,103
$
—
$
5,842
Corporate Unallocated expense 4
305
Equity in income on unconsolidated subsidiaries
(43)
Operating profit
5,580
Other income, net
(25)
Interest expense, net
297
Income before taxes on income
$
5,308
117
Table of Contents
(in millions)
Market Intelligence
Ratings
Energy
Mobility
Indices
Engineering Solutions
Total
2023
Revenue from external customers
$
4,365
$
3,177
$
1,946
$
1,484
$
1,392
$
133
$
12,497
Intersegment revenue 1
11
155
—
—
11
—
177
Revenue
$
4,376
$
3,332
$
1,946
$
1,484
$
1,403
$
133
$
12,674
Intersegment elimination
(177)
Total revenue
12,497
Less: segment expenses 2
2,933
1,449
1,049
908
436
113
6,888
Less: other segment items 3
729
19
193
316
42
1
1,300
Intersegment elimination
(177)
Segment operating profit
$
714
$
1,864
$
704
$
260
$
925
$
19
$
4,486
Corporate Unallocated expense 4
502
Equity in income on unconsolidated subsidiaries
(36)
Operating profit
4,020
Other expense, net
15
Interest expense, net
334
Income before taxes on income
$
3,671
1Intersegment revenue primarily relates to a royalty charged to Market Intelligence for the rights to use and distribute content and data developed by Ratings.
2The segment expense category for Market Intelligence, Ratings, Energy, Mobility and Indices for the years ended December 31, 2025, 2024 and 2023 primarily include an aggregation of compensation costs, technology costs and strategic investments. The segment expense category for Engineering Solutions for the year ended December 31, 2023 primarily includes an aggregation of technology costs and compensation costs. The CODM considers actual-to-actual and budget-to-actual variances when making decisions about allocating personnel and capital to the segments; however, the CODM does not receive the individual expense items underlying the overall segment expenses. Variance explanations include segment expenses including compensation costs, technology costs and strategic investments, but the CODM is otherwise not provided, and cannot easily calculate, lower-level expense information.
3 Other segment items for the year ended December 31, 2025 for each reportable segment primarily include amortization of intangibles from acquisitions, gain on dispositions and certain items primarily including employee severance charges, acquisition and disposition-related costs, legal costs and Executive Leadership Team transition costs. Other segment items for the years ended December 31, 2024 and 2023 for each reportable segment primarily include amortization of intangibles from acquisitions, (gain) loss on dispositions and certain items primarily including IHS Markit merger costs, employee severance charges and acquisition and disposition-related costs.
4 Corporate Unallocated expense includes costs for corporate functions, select initiatives, unoccupied office space and Kensho, included in selling and general expenses.
118
Table of Contents
The following table presents our revenue disaggregated by revenue type for the years ended December 31:
(in millions)
Market Intelligence
Ratings
Energy
Mobility
Indices
Engineering Solutions
Intersegment Elimination 1
Total
2025
Subscription
$
4,107
$
—
$
2,016
$
1,422
$
320
$
—
$
—
$
7,865
Non-subscription / Transaction
186
2,470
163
325
—
—
—
3,144
Non-transaction
—
2,254
—
—
—
—
(200)
2,054
Asset-linked fees
—
—
—
—
1,206
—
—
1,206
Sales usage-based royalties
—
—
120
—
324
—
—
444
Recurring variable
623
—
—
—
—
—
—
623
Total revenue
$
4,916
$
4,724
$
2,299
$
1,747
$
1,850
$
—
$
(200)
$
15,336
Timing of revenue recognition
Services transferred at a point in time
$
186
$
2,470
$
163
$
325
$
—
$
—
$
—
$
3,144
Services transferred over time
4,730
2,254
2,136
1,422
1,850
—
(200)
12,192
Total revenue
$
4,916
$
4,724
$
2,299
$
1,747
$
1,850
$
—
$
(200)
$
15,336
(in millions)
Market Intelligence
Ratings
Energy
Mobility
Indices
Engineering Solutions
Intersegment Elimination 1
Total
2024
Subscription
$
3,882
$
—
$
1,873
$
1,299
$
292
$
—
$
—
$
7,346
Non-subscription / Transaction
184
2,326
166
310
—
—
—
2,986
Non-transaction
—
2,044
—
—
—
—
(186)
1,858
Asset-linked fees
—
—
—
—
1,046
—
—
1,046
Sales usage-based royalties
—
—
103
—
290
—
—
393
Recurring variable
579
—
—
—
—
—
—
579
Total revenue
$
4,645
$
4,370
$
2,142
$
1,609
$
1,628
$
—
$
(186)
$
14,208
Timing of revenue recognition
Services transferred at a point in time
$
184
$
2,326
$
166
$
310
$
—
$
—
$
—
$
2,986
Services transferred over time
4,461
2,044
1,976
1,299
1,628
—
(186)
11,222
Total revenue
$
4,645
$
4,370
$
2,142
$
1,609
$
1,628
$
—
$
(186)
$
14,208
119
Table of Contents
(in millions)
Market Intelligence
Ratings
Energy
Mobility
Indices
Engineering Solutions
Intersegment Elimination 1
Total
2023
Subscription
$
3,685
$
—
$
1,707
$
1,169
$
277
$
125
$
—
$
6,963
Non-subscription / Transaction
187
1,425
158
315
—
8
—
2,093
Non-transaction
—
1,907
—
—
—
—
(177)
1,730
Asset-linked fees
—
—
—
—
859
—
—
859
Sales usage-based royalties
—
—
81
—
267
—
—
348
Recurring variable
504
—
—
—
—
—
—
504
Total revenue
$
4,376
$
3,332
$
1,946
$
1,484
$
1,403
$
133
$
(177)
$
12,497
Timing of revenue recognition
Services transferred at a point in time
$
187
$
1,425
$
158
$
315
$
—
$
8
$
—
$
2,093
Services transferred over time
4,189
1,907
1,788
1,169
1,403
125
(177)
10,404
Total revenue
$
4,376
$
3,332
$
1,946
$
1,484
$
1,403
$
133
$
(177)
$
12,497
1 Intersegment eliminations mainly consists of a royalty charged to Market Intelligence for the rights to use and distribute content and data developed by Ratings.
Segment information for the years ended December 31 is as follows:
(in millions)
Depreciation & Amortization
Capital Expenditures
2025
2024
2023
2025
2024
2023
Market Intelligence
$
631
$
627
$
597
$
78
$
61
$
73
Ratings
32
37
37
64
29
24
Energy
138
137
137
11
7
7
Mobility
320
317
314
28
18
22
Indices
43
42
42
4
3
13
Engineering Solutions
—
—
2
—
—
—
Total reportable segments
1,164
1,160
1,129
185
118
139
Corporate
15
13
14
10
6
4
Total
$
1,179
$
1,173
$
1,143
$
195
$
124
$
143
120
Table of Contents
Segment information as of December 31 is as follows:
(in millions)
Total Assets
2025
2024
Market Intelligence
$
31,234
$
29,478
Ratings
1,137
1,056
Energy
8,543
8,636
Mobility
12,974
13,222
Indices
3,378
3,200
Total reportable segments
57,266
55,592
Corporate 1
3,738
4,629
Assets held for sale2
196
—
Total
$
61,200
$
60,221
1Corporate assets consist principally of cash and cash equivalents, goodwill and other intangible assets, investments, assets for pension benefits and prepaid income taxes.
2Relates to the anticipated divestitures of the Enterprise Data Management and thinkFolio businesses within our Market Intelligence segment and fixed assets related to our intent to sell our facility in Centennial, Colorado.
We do not have operations in any foreign country that represent more than 7% of our consolidated revenue. Transfers between geographic areas are recorded at agreed upon prices and intercompany revenue and profit are eliminated. No single customer accounted for more than 10% of our consolidated revenue.
The following provides revenue and long-lived assets by geographic region:
(in millions)
Revenue
Long-lived Assets 1
Year ended December 31,
December 31,
2025
2024
2023
2025
2024
U.S.
$
9,322
$
8,640
$
7,542
$
483
$
483
European region
3,531
3,256
2,822
153
115
Asia
1,640
1,491
1,375
203
182
Rest of the world
843
821
758
34
32
Total
$
15,336
$
14,208
$
12,497
$
873
$
812
Revenue
Long-lived Assets 1
Year ended December 31,
December 31,
2025
2024
2023
2025
2024
U.S.
61
%
61
%
60
%
55
%
60
%
European region
23
23
23
18
14
Asia
11
10
11
23
22
Rest of the world
5
6
6
4
4
Total
100
%
100
%
100
%
100
%
100
%
1Long-lived assets include right of use assets, property and equipment, net and capitalized technology costs, net.
See Note 2 – Acquisitions andDivestitures and Note 11 – Restructuring, for actions that impacted the segment operating results.
13. Commitments and Contingencies
Leases
We determine whether an arrangement meets the criteria for an operating lease or a finance lease at the inception of the arrangement. We have operating leases for office space and equipment. Our leases have remaining lease terms of 1 year to 15 years, some of which include options to extend the leases for up to 12 years, and some of which include options to terminate the
121
Table of Contents
leases early. We sublease certain real estate leases to third parties which mainly consist of operating leases for space within our offices.
Leases with an initial term of 12 months or less are not recorded on the balance sheet; we recognize lease expenses for these leases on a straight line-basis over the lease term in operating-related expenses and selling and general expenses.
Operating lease ROU assets and operating lease liabilities are recognized based on the present value of future minimum lease payments over the lease term at commencement date. Our future minimum based payments used to determine our lease liabilities include minimum based rent payments and escalations. As most of our leases do not provide an implicit rate, we use our estimated incremental borrowing rate based on the information available at commencement date in determining the present value of lease payments.
During the years ended December 31, 2025, 2024 and 2023 we recorded a pre-tax impairment charge of $3 million, $3 million and $26 million, respectively, related to the impairment and abandonment of operating lease related ROU assets. The impairment charges are included in selling and general expenses within the consolidated statements of income.
The following table provides information on the location and amounts of our leases on our consolidated balance sheets as of December 31, 2025 and 2024:
(in millions)
2025
2024
Balance Sheet Location
Assets
Right of use assets
Lease right-of-use assets
$
413
$
413
Liabilities
Other current liabilities
Current lease liabilities
124
109
Lease liabilities — non-current
Non-current lease liabilities
494
535
The components of lease expense for the years ended December 31 are as follows:
(in millions)
2025
2024
2023
Operating lease cost
$
112
$
129
$
134
Sublease income
(14)
(13)
(16)
Total lease cost
$
98
$
116
$
118
Supplemental information related to leases for the years ended December 31 are as follows:
(in millions)
2025
2024
2023
Cash paid for amounts included in the measurement for operating lease liabilities
Operating cash flows for operating leases
141
140
149
Right of use assets obtained in exchange for lease obligations
Operating leases
118
106
35
Weighted-average remaining lease term and discount rate for our operating leases as of December 31 are as follows:
2025
2024
Weighted-average remaining lease term (years)
5.3
5.6
Weighted-average discount rate
4.25
%
4.02
%
122
Table of Contents
Maturities of lease liabilities for our operating leases are as follows:
(in millions)
2026
$
145
2027
133
2028
106
2029
85
2030
63
2031 and beyond
175
Total undiscounted lease payments
$
707
Less: Imputed interest
89
Present value of lease liabilities
$
618
As of December 31, 2025, the Company has certain lease agreements that have not yet commenced with total estimated future lease payments of $78 million which have been excluded from the table above. These leases are expected to begin in 2026 and continue through 2037, with lease terms ranging from 1 year to 12 years.
Related Party Agreement
In June of 2012, we entered into a license agreement (the “License Agreement”) with the holder of S&P Dow Jones Indices LLC noncontrolling interest, CME Group, which replaced the 2005 license agreement between Indices and CME Group. Under the terms of the License Agreement, S&P Dow Jones Indices LLC receives a share of the profits from the trading and clearing of CME Group’s equity index products. During the years ended December 31, 2025, 2024 and 2023, S&P Dow Jones Indices LLC earned $193 million, $192 million and $174 million of revenue under the terms of the License Agreement, respectively. The entire amount of this revenue is included in our consolidated statement of income and the portion related to the 27% noncontrolling interest is removed in net income attributable to noncontrolling interests.
Contractual Obligations
We typically have various contractual obligations, which are recorded as liabilities in our consolidated balance sheets, while other items, such as certain purchase commitments and other executory contracts, are not recognized. For example, we are contractually committed to contracts for information-technology outsourcing, certain enterprise-wide information-technology software licensing and maintenance. In the first quarter of 2023, S&P Global and Amazon Web Services (“AWS”) entered into a multi-year strategic collaboration agreement with a purchase obligation of $1.0 billion, before incremental credits, over a five-year period. With AWS as its preferred cloud provider, S&P Global will enhance its cloud infrastructure, accelerate business growth, engineer new innovations for key industry segments, and help their customers navigate rapidly changing market conditions.
Legal & Regulatory Matters
In the normal course of business both in the United States and abroad, the Company and its subsidiaries are defendants in a number of legal proceedings and are often subjected to government and regulatory proceedings, investigations and inquiries.
A class action lawsuit was filed in Australia on August 7, 2020 against the Company and a subsidiary of the Company. The lawsuit relates to alleged investment losses in collateralized debt obligations rated by Ratings prior to the financial crisis between 2005 and 2007. We can provide no assurance that we will not be obligated to pay significant amounts in order to resolve the lawsuit on terms deemed acceptable.
From time to time, the Company receives customer complaints. The Company believes it has strong contractual protections in the terms and conditions included in its arrangements with customers. Nonetheless, in the interest of managing customer relationships, the Company from time to time engages in dialogue with such customers in an effort to resolve such complaints, and if such complaints cannot be resolved through dialogue, may face litigation regarding such complaints. The Company does not expect to incur material losses as a result of these matters.
Moreover, various government and self-regulatory agencies frequently make inquiries and conduct investigations into our compliance with applicable laws and regulations, including those related to our regulated products and services, antitrust matters and other matters, such as ESG. For example, as a nationally recognized statistical rating organization registered with
123
Table of Contents
the SEC under Section 15E of the Exchange Act, S&P Global Ratings is in ongoing communication with the staff of the SEC regarding compliance with its extensive obligations under the federal securities laws. Although S&P Global seeks to promptly address any compliance issues that it detects or that the staff of the SEC or another regulator raises, there can be no assurance that the SEC or another regulator will not seek remedies against S&P Global for one or more compliance deficiencies. Any of these proceedings, investigations or inquiries could ultimately result in adverse judgments, damages, fines, penalties or activity restrictions, which could adversely impact our consolidated financial condition, cash flows, business or competitive position.
In view of the uncertainty inherent in litigation and government and regulatory enforcement matters, we cannot predict the eventual outcome of such matters or the timing of their resolution, or in most cases reasonably estimate what the eventual judgments, damages, fines, penalties or impact of activity (if any) restrictions may be. As a result, we cannot provide assurance that such outcomes will not have a material adverse effect on our consolidated financial condition, cash flows, business or competitive position. As litigation or the process to resolve pending matters progresses, as the case may be, we will continue to review the latest information available and assess our ability to predict the outcome of such matters and the effects, if any, on our consolidated financial condition, cash flows, business or competitive position, which may require that we record liabilities in the consolidated financial statements in future periods.
124
Table of Contents
Item 9. Changes in and Disagreements with Accountants on Accounting and Financial Disclosure
None.
Item 9A. Controls and Procedures
We have filed the required certifications under Section 302 of the Sarbanes-Oxley Act of 2002 incorporated herein by reference from Exhibits (31.1) and (31.2) to this Annual Report on Form 10-K. In addition we have filed the required certifications under Section 906 of the Sarbanes-Oxley Act of 2002 incorporated herein by reference from Exhibit (32) to this Annual Report on Form 10-K.
This Item 9A. includes information concerning the controls and control evaluations referred to in the required certifications.
Disclosure Controls and Procedures
We maintain disclosure controls and procedures that are designed so that information required to be disclosed in our reports filed with the SEC is recorded, processed, summarized and reported within the time periods specified in the SEC’s rules and forms, and that such information is accumulated and communicated to management, including our Chief Executive Officer (“CEO”) and Chief Financial Officer (“CFO”), as appropriate, to allow timely decisions regarding required disclosure.
As of December 31, 2025, an evaluation was performed under the supervision and with the participation of management, including the CEO and CFO, of the effectiveness of the design and operation of our disclosure controls and procedures (as defined in Rules 13a-15(e) and 15d-15(e) under the U.S. Securities Exchange Act of 1934). Based on that evaluation, management, including the CEO and CFO, concluded that our disclosure controls and procedures were effective as of December 31, 2025.
Management’s Annual Report on Internal Control Over Financial Reporting
Pursuant to Section 404 of the Sarbanes-Oxley Act of 2002 and as defined in Rules 13a-15(f) and 15d-15(f) under the Exchange Act, management is required to provide the following report on our internal control over financial reporting:
1.Management is responsible for establishing and maintaining adequate internal control over financial reporting.
2.Management has evaluated the effectiveness of the system of internal control using the Committee of Sponsoring Organizations of the Treadway Commission 2013 framework (“COSO 2013 framework”). Management has selected the COSO 2013 framework for its evaluation as it is a control framework recognized by the SEC and the Public Company Accounting Oversight Board that is free from bias, permits reasonably consistent qualitative and quantitative measurement of our internal controls, is sufficiently complete so that relevant controls are not omitted and is relevant to an evaluation of internal controls over financial reporting.
3.Based on management’s evaluation under this framework, management has concluded that our internal controls over financial reporting were effective as of December 31, 2025. There are no material weaknesses in our internal control over financial reporting that have been identified by management.
4.Our independent registered public accounting firm, Ernst & Young LLP, has audited our consolidated financial statements for the year ended December 31, 2025, and has issued their reports on the financial statements and the effectiveness of our internal control over financial reporting. These reports are located on pages 74, 75 and 76 of this Annual Report on Form 10-K.
Changes in Internal Control over Financial Reporting
There have been no changes in our internal control over financial reporting during the most recent quarter that have materially affected, or are reasonably likely to materially affect, our internal control over financial reporting.
Item 9B. Other Information
IRAN THREAT REDUCTION AND SYRIA HUMAN RIGHTS ACT DISCLOSURE
Pursuant to Section 219 of the Iran Threat Reduction and Syria Human Rights Act of 2012, which amended the Securities Exchange Act of 1934, an issuer is required to disclose in its annual or quarterly reports, as applicable, whether, during the reporting period, it or any of its affiliates knowingly engaged in certain activities, transactions or dealings relating to Iran or
125
Table of Contents
with individuals or entities designated pursuant to certain Executive Orders. Disclosure is generally required even where the activities, transactions or dealings were conducted in compliance with applicable laws and regulations.
During 2025, the Company engaged in limited transactions or dealings related to the purchase or sale of information and informational materials, which are generally exempt from U.S. economic sanctions, with persons that are owned or controlled, or appear to be owned or controlled, by the Government of Iran or are otherwise subject to disclosure pursuant to Section 219 of the Iran Threat Reduction and Syria Human Rights Act of 2012. Energy provided subscribers access to proprietary data, analytics, and industry information that enable commodities markets to perform with greater transparency and efficiency. Market Intelligence sourced certain trade data from Iran. The Company will continue to monitor such activities closely. During 2025, the Company recorded de minimis revenue and net profit attributable to the Energy transactions and dealings described above. The Company attributes a de minimis amount of revenue and net profit to the data sourced from Iran by Market Intelligence.
RULE 10b5-1 PLAN ELECTIONS
No Rule 10b5-1 trading arrangements or "non-Rule 10b5-1 trading arrangements" (as defined by S-K Item 408(c)) were entered into or terminated by our directors or officers (as defined in Rule 16a-1(f) under the Securities Exchange Act of 1934, as amended) during the fourth quarter of 2025.
Item 9C. Disclosure Regarding Foreign Jurisdictions that Prevent Inspections
None.
126
Table of Contents
PART III
Item 10. Directors, Executive Officers and Corporate Governance
Information about our directors is contained under the caption “Board of Directors and Corporate Governance-Director Biographies” in our Proxy Statement for our 2026 Annual Meeting of Shareholders to be filed with the SEC within 120 days of the fiscal year ended December 31, 2025 (the “2026 Proxy Statement”) and is incorporated herein by reference.
The information under the heading “Information about our Executive Officers” in Part I of this Annual Report on Form 10-K is also incorporated herein by reference.
Code of Ethics
We have adopted a Code of Ethics that applies to our CEO, CFO, chief accounting officer and senior financial officers. To access such code, go to the Corporate Governance section of our Investor Relations website at http://investor.spglobal.com. Any waivers that may in the future be granted from such Code and amendments thereto will be posted at such website address. In addition to our Code of Ethics for the CEO and senior financial officers noted above, the following documents may be found on our website at the above website address:
•Code of Business Ethics for all employees;
•Code of Business Conduct and Ethics for Directors;
•Employee Complaint Procedures (Accounting and Auditing Matters);
•Certificate of Incorporation;
•By-Laws;
•Corporate Governance Guidelines;
•Audit Committee Charter;
•Compensation and Leadership Development Committee Charter;
•Nominating and Corporate Governance Committee Charter;
•Financial Committee Charter; and
•Executive Committee Charter.
The foregoing documents are also available in print, free of charge, to any shareholder who requests them. Requests for printed copies may be e-mailed to corporate.secretary@spglobal.com or mailed to the Corporate Secretary, S&P Global Inc., 55 Water Street, New York, NY 10041-0001.
Information about the procedures by which security holders may recommend nominees to our Board of Directors can be found in our 2026 Proxy Statement under the caption “Board of Directors and Corporate Governance-Committees of the Board of Directors-Nominating and Corporate Governance Committee” and is incorporated herein by reference.
Information concerning the composition of the Audit Committee and our Audit Committee financial experts is contained in our 2026 Proxy Statement under the caption “Board of Directors and Corporate Governance-Committees of the Board of Directors-Audit Committee” and is incorporated herein by reference.
Information about our insider trading policies governing the purchase, sale, and/or other dispositions of our securities by directors, officers and employees will be contained in our 2026 Proxy Statement under the caption "Compensation Discussion and Analysis" and is incorporated herein by reference.
Information concerning compliance with Section 16(a) of the Exchange Act will be contained in our 2026 Proxy Statement under the caption "Ownership of Company Stock-Delinquent Section 16(a) Reports" and is incorporated herein by reference.
127
Table of Contents
New York Stock Exchange Certification
Promptly following the 2026 annual meeting of shareholders, we intend to file with the NYSE the CEO certification regarding our compliance with the NYSE’s corporate governance listing standards as required by NYSE Rule 303A.12. Last year, we filed this CEO certification with the NYSE on May 29, 2025.
Item 11. Executive Compensation
Information about director and executive officer compensation that is required by this Item 11, Compensation Committee interlocks and the Compensation Committee Report will be contained in our 2026 Proxy Statement under the captions “Compensation Discussion and Analysis,” “Executive Compensation Tables,” “Director Compensation,” and “Board of Directors and Corporate Governance-Compensation Committee Interlocks and Insider Participation” and is incorporated herein by reference.
Item 12. Security Ownership of Certain Beneficial Owners and Management and Related Stockholder Matters
Set forth below is information with respect to securities authorized for issuance under equity compensation plans:
The following table details information about our equity compensation plans as of December 31, 2025:
Equity Compensation Plans’ Information
(a)
(b)
(c)
Plan category
Number of securities to be issued upon exercise of outstanding options, warrants and rights
Weighted-average exercise price of outstanding options, warrants and rights
Number of securities remaining available for future issuance under equity compensation plans (excluding securities reflected in column (a))
Equity compensation plans approved by security holders
982,406
1
$
74.46
2
18,372,433
3,4
Equity compensation plans not approved by security holders
—
$
—
—
Total
982,406
$
74.46
18,372,433
1Includes shares to be issued upon exercise of outstanding options, restricted stock units, performance stock units and director deferred phantom stock units under our equity compensation plans. The number of performance stock unit awards is based on the target number of units granted.
2Restricted stock units, performance stock units and director deferred phantom stock units do not have an exercise price and are delivered without any payment or consideration other than service.
3Included in this number are 469,981 shares reserved for issuance under the Director Deferred Stock Ownership Plan. The remaining 17,902,452 shares are reserved for issuance under the 2019 Stock Incentive Plan (the “2019 Plan”) for performance stock, restricted stock, other stock-based awards, stock options and stock appreciation rights.
4Under the terms of the 2019 Plan, shares subject to an award or shares paid in settlement of a dividend equivalent reduce the number of shares available under the 2019 Plan by one share for each such share granted or paid.
The 2019 Plan is also governed by certain share recapture provisions. Only shares underlying awards granted under the 2019 Plan that are forfeited, expired, cancelled, terminated, settled in cash or property other than shares, or otherwise not distributable, are added back to the shares available for issuance. Shares withheld to satisfy the exercise price of an award or to satisfy any required tax withholding obligations, or that are repurchased by the Company with option proceeds are not added back to the shares available for issuance.
Information on the number of shares our common stock beneficially owned by each director and named executive officer, by all directors and executive officers as a group and on each beneficial owner of more than 5% of our common stock is contained under the caption “Ownership of Company Stock” in our 2026 Proxy Statement and is incorporated herein by reference.
Item 13. Certain Relationships and Related Transactions, and Director Independence
Information with respect to certain relationships and related transactions and director independence is contained under the captions “Board of Directors and Corporate Governance-Transactions with Related Persons” in our 2026 Proxy Statement and is incorporated herein by reference.
128
Table of Contents
Item 14. Principal Accountant Fees and Services
During the year ended December 31, 2025, Ernst & Young LLP audited the consolidated financial statements of the Registrant and its subsidiaries.
Information on our Audit Committee’s pre-approval policy for audit services and information on our principal accountant fees and services is contained in our 2026 Proxy Statement under the caption “Independent Registered Public Accounting Firm’s Fees and Services” and is incorporated herein by reference.
129
Table of Contents
PART IV
Item 15. Exhibits, Financial Statement Schedules
(a) Documents filed as part of this Annual Report on Form 10-K:
1.Financial Statements
•Reports of Independent Registered Public Accounting Firm
•Consolidated Statements of Income for the three years ended December 31, 2025
•Consolidated Statements of Comprehensive Income for the three years ended December 31, 2025
•Consolidated Balance Sheets as of December 31, 2025 and 2024
•Consolidated Statements of Cash Flows for the three years ended December 31, 2025
•Consolidated Statements of Equity for the three years ended December 31, 2025
•Notes to the Consolidated Financial Statements
2.Financial Schedule
•Schedule II—Valuation and Qualifying Accounts
All other schedules have been omitted since the required information is not present or not present in amounts sufficient to require submission of the schedule, or because the information required is included in the consolidated financial statements or the notes thereto.
3.Exhibits – The exhibits filed as part of this Annual Report on Form 10-K are listed in the Exhibit Index immediately preceding such Exhibits, and such Exhibit Index is incorporated herein by reference.
130
Table of Contents
S&P Global
Schedule II – Valuation and Qualifying Accounts
(in millions)
Additions/(deductions)
Balance at beginning of year
Net charges to income
Deductions and other 1
Balance at end of year
Year ended December 31, 2025
Allowance for doubtful accounts
$
44
$
40
$
(34)
$
50
Year ended December 31, 2024
Allowance for doubtful accounts
$
54
$
42
$
(52)
$
44
Year ended December 31, 2023
Allowance for doubtful accounts
$
48
$
27
$
(21)
$
54
1Primarily includes uncollectible accounts written off, net of recoveries, impact of acquisitions and divestitures and adjustments for foreign currency translation.
Registrant’s 2019 Stock Incentive Plan, incorporated by reference from Appendix A to the Registrant’s Definitive Proxy Statement on Schedule 14A filed on March 25, 2019.
Cover Page Interactive Data File (formatted as Inline XBRL with applicable taxonomy extension information contained in Exhibit 101)
† Pursuant to Item 601(b)(2) or 601(b)(10) of Regulation S-K, as applicable, portions of the exhibit have been omitted. The Company hereby agrees to furnish an unredacted copy of the exhibit to the SEC upon request.
* These exhibits relate to management contracts or compensatory plan arrangements.
138
Table of Contents
Item 16. Form 10-K Summary
None.
Signatures
Pursuant to the requirements of Section 13 or 15(d) of the Securities Exchange Act of 1934, the Registrant has duly caused this Form 10-K to be signed on its behalf by the undersigned, thereunto duly authorized.
S&P Global Inc.
Registrant
By:
/s/ Martina L. Cheung
Martina L. Cheung
President and Chief Executive Officer
February 10, 2026
Each individual whose signature appears below constitutes and appoints Martina L. Cheung and Eric W. Aboaf, and each of them singly, his or her true and lawful attorneys-in-fact and agents with full power of substitution, for him or her and in his or her name, place and stead, in any and all capacities, to sign any and all amendments to this Form 10-K filed with the Securities and Exchange Commission, granting unto said attorneys-in-fact and agents, and each of them, full power and authority to do and perform each and every act and thing requisite and necessary to be done in and about the premises, as fully to all intents and purposes as he or she might or could do in person, hereby ratifying and confirming all the said attorneys-in-fact and agents or any of them or their or his or her substitute or substitutes, may lawfully do or cause to be done by virtue hereof.
Pursuant to the requirements of the Securities Exchange Act of 1934, this report has been signed on February 10, 2026 on behalf of the Registrant by the following persons who signed in the capacities as set forth below under their respective names.
/s/ Martina L. Cheung
Martina L. Cheung
President and Chief Executive Officer and Director
/s/ Eric W. Aboaf
Eric W. Aboaf
Executive Vice President and Chief Financial Officer