| Investor Day 2026 May 12, 2026 |

| MOBILITY GLOBAL Welcome Tejal Engman Head of Investor Relations MOBILITY GLOBAL 2 |

| MOBILITY GLOBAL This presentation (this “Presentation”) has been prepared solely for informational purposes from information supplied by or on behalf of Mobility Global, Inc (“Mobility”) and S&P Global, Inc (“SPGI”). None of Mobility, SPGI, or any of its subsidiaries, stockholders, partners, members, affiliates, directors, officers, employees, advisers, representatives or agents makes any representation or warranty as to the accuracy, reliability, reasonableness or completeness of this information and shall not have any liability whatsoever, including liability for direct, indirect, incidental, exemplary, compensatory, punitive, special or consequential damages, costs, expenses, legal fees or losses (including lost income or profits and opportunity costs) in connection with the use of the information contained in, or for any omission of information from, this Presentation. Forward-Looking Statements This Presentation, as well as other statements made by Mobility and SPGI, contain forward-looking statements that reflect, when made, Mobility’s and SPGI’s current views with respect to current events, certain investments and acquisitions and financial performance. Such forward-looking statements are subject to many risks, uncertainties and factors relating to Mobility’s operations and business environment, which may cause the actual results of Mobility to be materially different from any future results. All statements that address future operating, financial or business performance or Mobility’s strategies or expectations are forward-looking statements. Factors that could cause actual results to differ materially from these forward-looking statements include, but are not limited to, the following: worldwide economic, financial, political, and regulatory conditions and factors that contribute to uncertainty; the volatility and health of debt, equity, commodities, energy and automotive markets; the demand and market for credit ratings in and across the sectors and geographies where Mobility operates; Mobility’s ability to maintain adequate physical, technical and administrative safeguards to protect the security of confidential information and data, and the potential for a system or network disruption that results in regulatory penalties and remedial costs or improper disclosure of confidential information or data; the outcome of litigation, government and regulatory proceedings, investigations and inquiries; concerns in the marketplace affecting Mobility’s credibility or otherwise affecting market perceptions of the integrity or utility of services; the effect of competitive products (including those incorporating artificial intelligence and pricing, including the level of success of new product developments and global expansion; the impact of customer cost-cutting pressures; a decline in the demand for our products and services by our customers and other market participants; our ability to develop new products or technologies, to integrate our products with new technologies; the introduction of competing products or technologies by other companies; our ability to protect our intellectual property from unauthorized use and infringement; our ability to attract, incentivize and retain key employees; the continuously evolving regulatory environment in Europe, the United States and elsewhere around the globe; Mobility’s exposure to potential criminal sanctions or civil penalties for noncompliance with foreign and U.S. laws and regulations that are applicable in the jurisdictions in which it operates; Mobility’s ability to make acquisitions and dispositions and successfully integrate the businesses we acquire; consolidation of Mobility’s customers or suppliers; the ability of Mobility, and its third-party service providers, to maintain adequate physical and technological infrastructure; Mobility’s ability to successfully recover from a disaster or other business continuity problem; the separation of Mobility from SPGI not being consummated within the anticipated time period or at all; the ability of the separation of Mobility to qualify for tax-free treatment for U.S. federal income tax purposes; any disruption to Mobility’s business in connection with the proposed separation of Mobility; any loss of synergies from separating the businesses of Mobility and SPGI that adversely impact the results of operations of both businesses; and following the separation of Mobility, the combined value of the common stock of the two publicly-traded companies not being equal to or greater than the value of SPGI’s common stock had the separation not occurred. Additional factors are discussed under the captions “Risk Factors” and “Management’s Discussion and Analysis of Financial Condition and Results of Operations” in SPGI’s filings with the Securities and Exchange Commission. New risks and uncertainties arise from time to time, and it is impossible for us to predict these events or how they may affect Mobility or SPGI. It should be remembered that the price of ordinary shares and any income from them can go down as well as up. Mobility and SPGI disclaims any intention or obligation to update or revise any forward-looking statements, whether as a result of new information, future events and/or otherwise, except as may be required by law. Non-GAAP Financial Measures This Presentation includes certain non-GAAP financial measures as defined by SEC rules. Such non-GAAP financial measures are presented as supplemental financial measurements in the evaluation of our business. We believe the presentation of these financial measures helps investors to assess our operating performance from period to period and enhances understanding of our financial performance and highlights operational trends. Non-GAAP financial measures are widely used by investors in the valuation, comparison, rating and investment recommendations of companies. However, such measurements may not be comparable to those of other companies in our industry, which limits their usefulness as a comparative measure. Such measures are not required by or calculated in accordance with GAAP and should not be considered as substitutes for net income or any other measure of operating cash flow or liquidity. For a reconciliation of these non-GAAP financial measures to the most directly comparable GAAP metrics, please see the appendix to this Presentation. Please refer to “Definitions” at the end of this Presentation for definitions of certain non-GAAP financial measures, including Adjusted EBITDA and margin, Free Cash Flow, Free Cash Flow Conversion and Gross Leverage Ratio. Market and Industry Data This presentation includes market and industry data and forecasts that Mobility has derived from independent consultant reports, publicly available information, various industry publications, other published industry sources, and its internal data and estimates. Independent consultant reports, industry publications and other published industry sources generally indicate that the information contained therein was obtained from sources believed to be reliable. Although Mobility believes that these third-party sources are reliable, it does not guarantee the accuracy or completeness of this information, and Mobility has not independently verified this information. Mobility’s internal data and estimates are based upon information obtained from trade and business organizations and other contacts in the markets in which Mobility operates and management’s understanding of industry conditions. Although Mobility believes that such information is reliable, it has not had this information verified by any independent sources. In addition, the information contained in this presentation is as of the date hereof (except where otherwise indicated), and Mobility has no obligation to update such information, including in the event that such information becomes inaccurate or if estimates change. Subsequent materials may be provided by or on behalf of Mobility in its discretion and such information may supplement, modify or supersede the information in these materials. Neither Mobility, nor any of its respective affiliates, advisors or representatives shall have any liability whatsoever (in negligence or otherwise) for any loss or damage howsoever arising from any use of these materials or their contents or otherwise arising in connection with these materials. All operational and financial metrics included in this Presentation reflect the period ending December 31, 2025, unless otherwise noted. Disclaimer 3 |
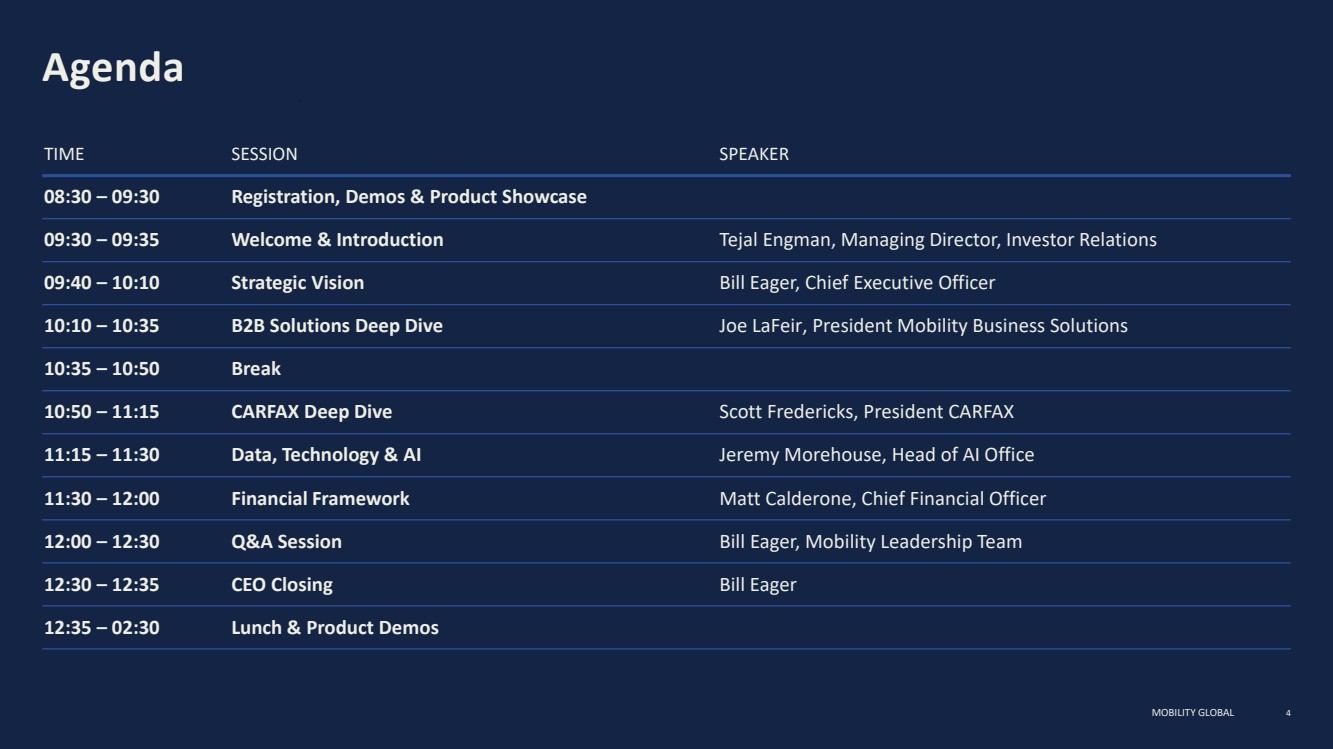
| MOBILITY GLOBAL Agenda 4 TIME SESSION SPEAKER 08:30 – 09:30 Registration, Demos & Product Showcase 09:30 – 09:35 Welcome & Introduction Tejal Engman, Managing Director, Investor Relations 09:40 – 10:10 Strategic Vision Bill Eager, Chief Executive Officer 10:10 – 10:35 B2B Solutions Deep Dive Joe LaFeir, President Mobility Business Solutions 10:35 – 10:50 Break 10:50 – 11:15 CARFAX Deep Dive Scott Fredericks, President CARFAX 11:15 – 11:30 Data, Technology & AI Jeremy Morehouse, Head of AI Office 11:30 – 12:00 Financial Framework Matt Calderone, Chief Financial Officer 12:00 – 12:30 Q&A Session Bill Eager, Mobility Leadership Team 12:30 – 12:35 CEO Closing Bill Eager 12:35 – 02:30 Lunch & Product Demos |
| MOBILITY GLOBAL MOBILITY GLOBAL 5 |

| MOBILITY GLOBAL Strategic Vision Bill Eager Chief Executive Officer 6 |

| MOBILITY GLOBAL To provide the trusted information that helps billions of people build, sell, and own vehicles with more confidence. Our Mission MOBILITY GLOBAL 7 |

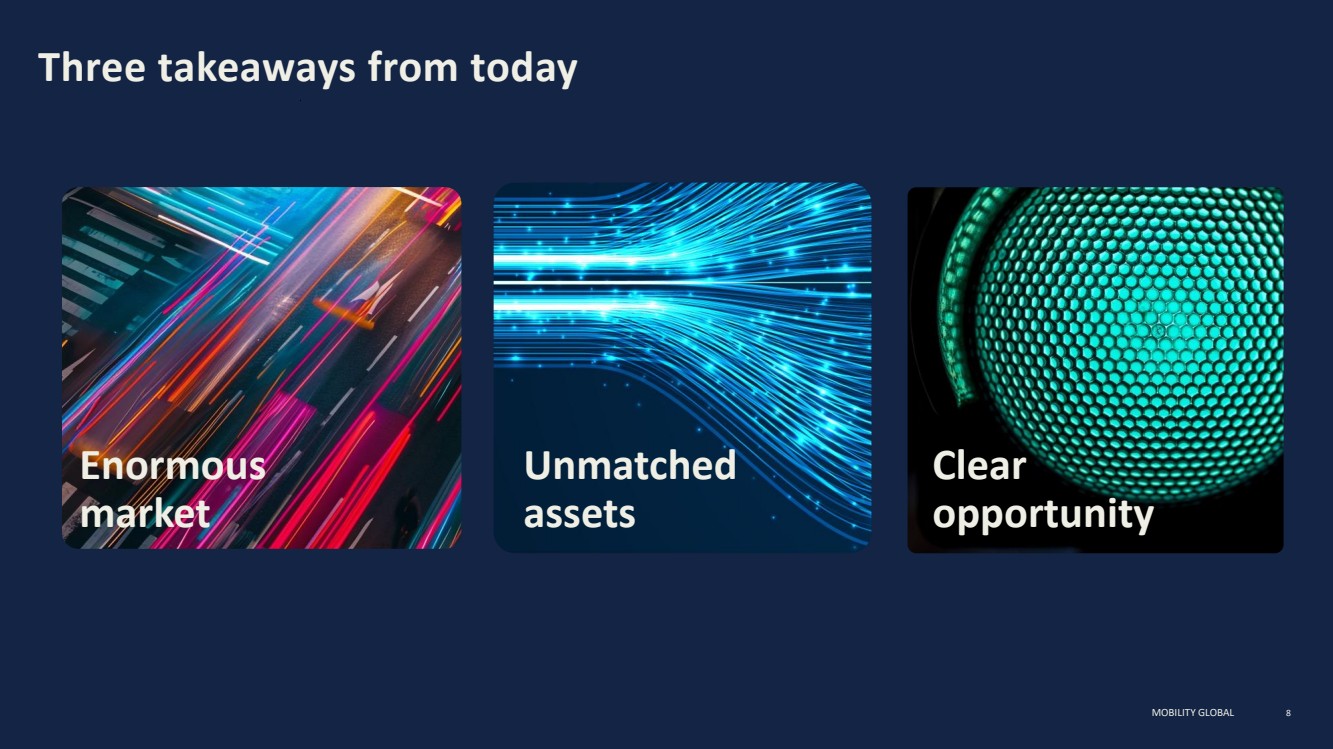
| MOBILITY GLOBAL 8 Three takeaways from today Design team: Please look for images that can represent the three topics that our CEO wants the audience to take away. Feel free to create a more compelling design but it should be simple so that he can freely talk about these points and people get drawn to what he says. Enormous market Unmatched assets Clear opportunity MOBILITY GLOBAL |
| MOBILITY GLOBAL Agenda CORE STRATEGIC ASSETS VISION AHEAD COMPELLING VALUE PROPOSITION INTRODUCTION TO MOBILITY GLOBAL 9 |
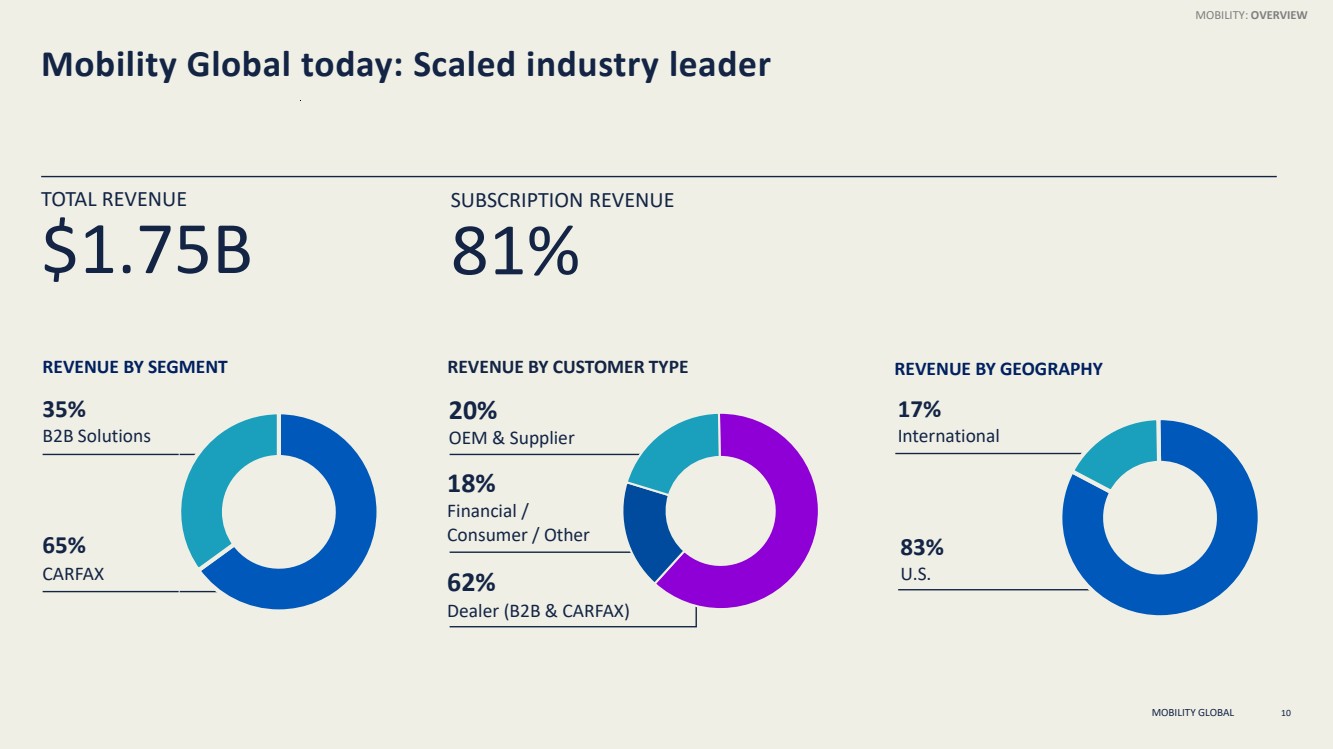
| MOBILITY GLOBAL Mobility Global today: Scaled industry leader REVENUE BY SEGMENT 65% CARFAX 35% B2B Solutions REVENUE BY GEOGRAPHY 83% U.S. 17% International REVENUE BY CUSTOMER TYPE TOTAL REVENUE $1.75B SUBSCRIPTION REVENUE 81% 20% OEM & Supplier 62% Dealer (B2B & CARFAX) 18% Financial / Consumer / Other 10 MOBILITY: OVERVIEW |
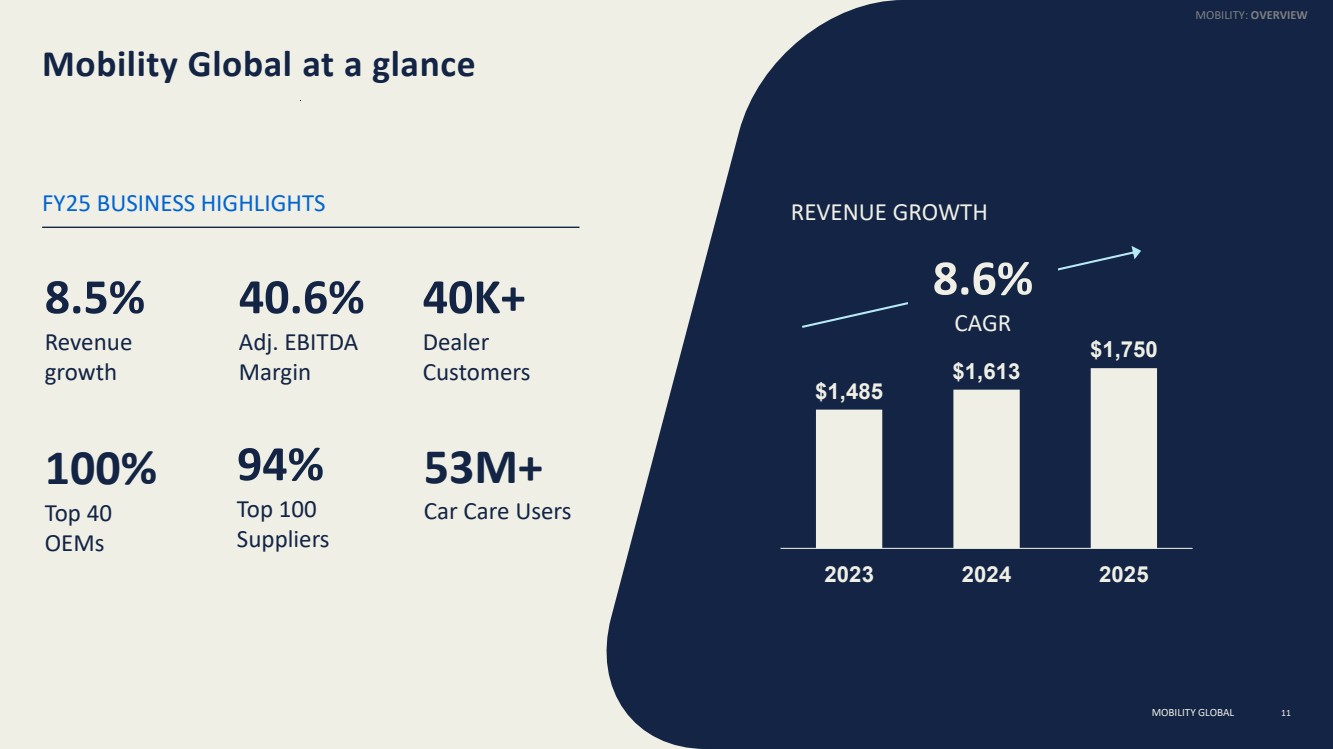
| MOBILITY GLOBAL Mobility Global at a glance FY25 BUSINESS HIGHLIGHTS $1,485 $1,613 $1,750 2023 2024 2025 REVENUE GROWTH 8.6% CAGR 11 8.5% Revenue growth 40.6% Adj. EBITDA Margin 100% Top 40 OEMs 53M+ Car Care Users 40K+ Dealer Customers 94% Top 100 Suppliers MOBILITY: OVERVIEW MOBILITY GLOBAL |
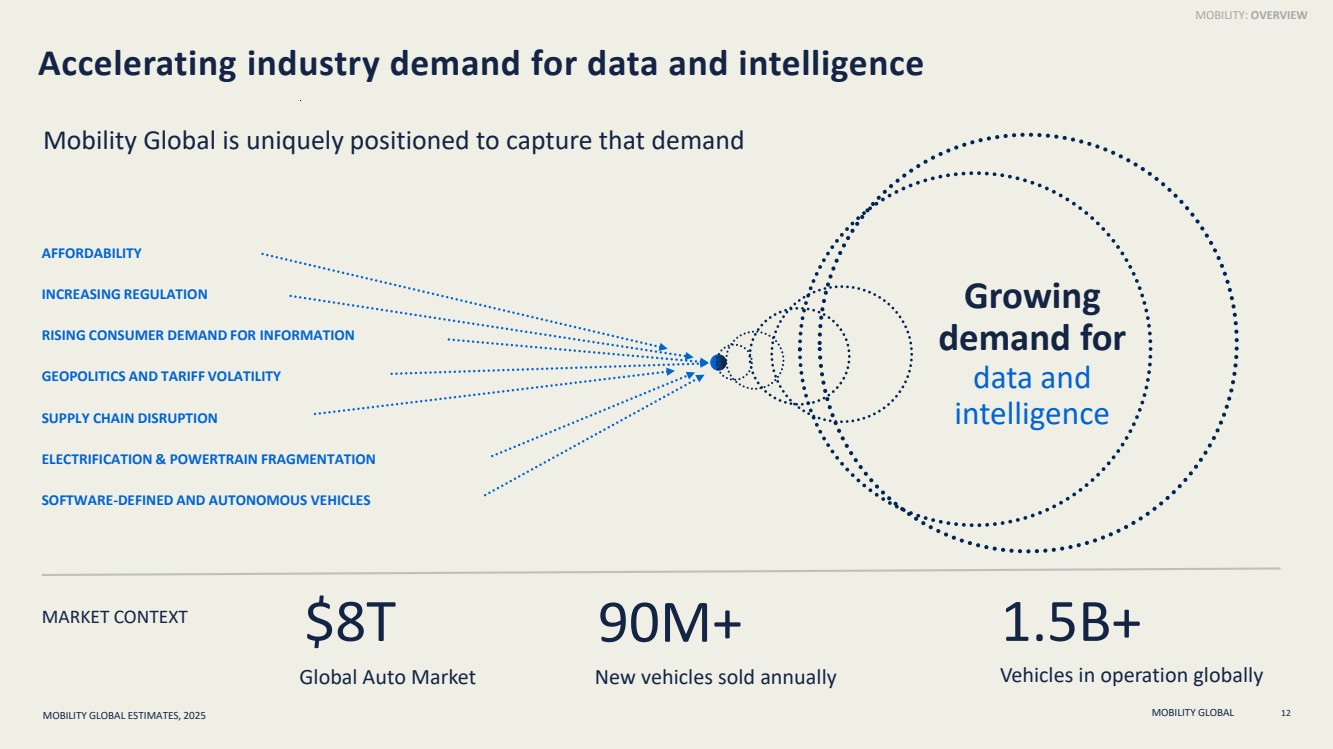
| MOBILITY GLOBAL Accelerating industry demand for data and intelligence 12 Mobility Global is uniquely positioned to capture that demand Growing demand for data and intelligence $8T Global Auto Market 90M+ New vehicles sold annually 1.5B+ Vehicles in operation globally AFFORDABILITY INCREASING REGULATION RISING CONSUMER DEMAND FOR INFORMATION GEOPOLITICS AND TARIFF VOLATILITY SUPPLY CHAIN DISRUPTION ELECTRIFICATION & POWERTRAIN FRAGMENTATION SOFTWARE-DEFINED AND AUTONOMOUS VEHICLES MARKET CONTEXT MOBILITY: OVERVIEW MOBILITY GLOBAL ESTIMATES, 2025 |
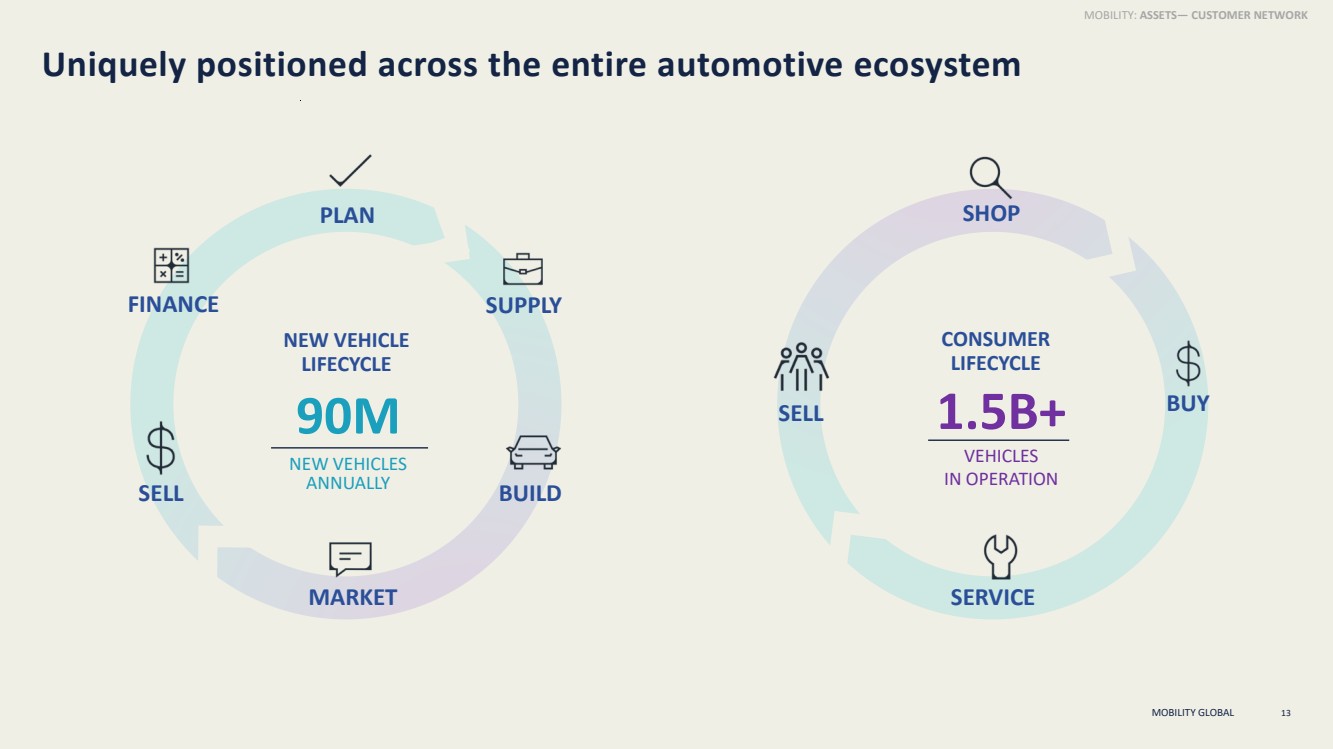
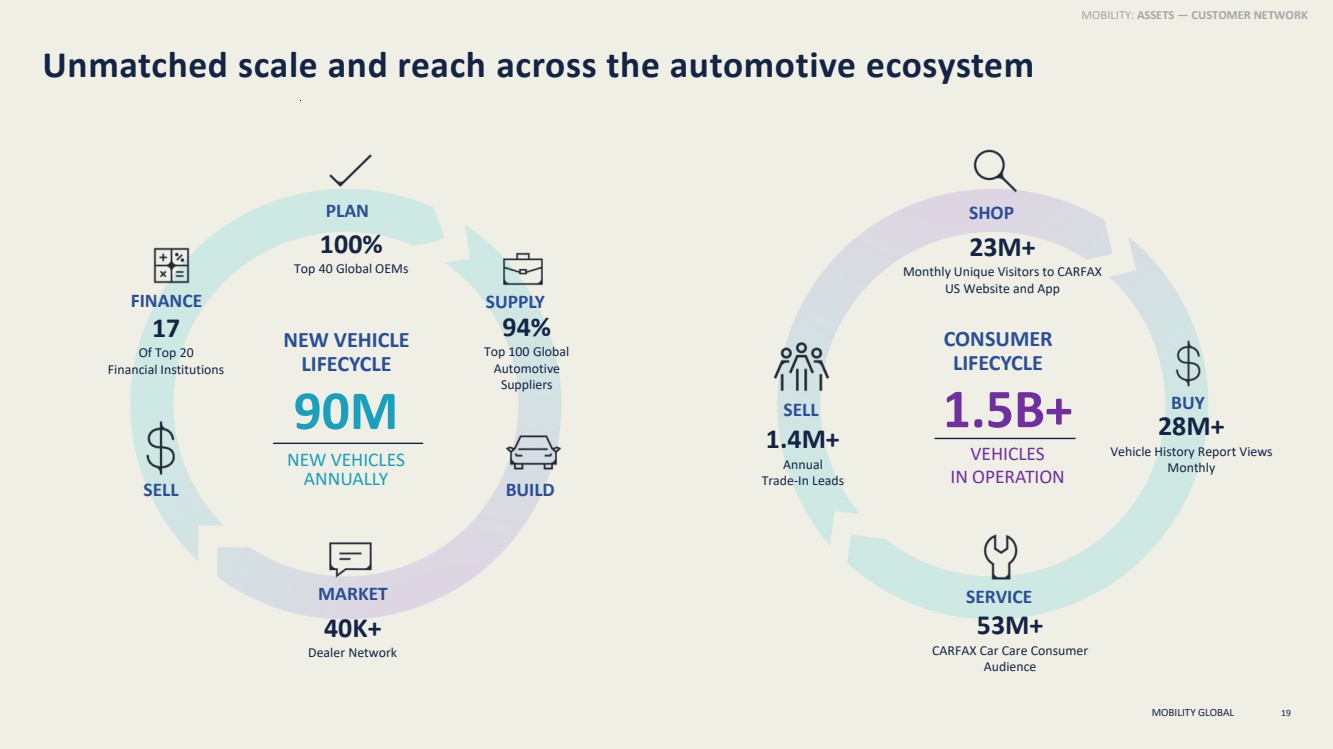
| MOBILITY GLOBAL Uniquely positioned across the entire automotive ecosystem 13 SUPPLY MARKET BUILD FINANCE SELL PLAN MOBILITY: ASSETS— CUSTOMER NETWORK 90M NEW VEHICLES ANNUALLY NEW VEHICLE LIFECYCLE SHOP BUY SERVICE SELL CONSUMER LIFECYCLE 1.5B+ VEHICLES IN OPERATION |
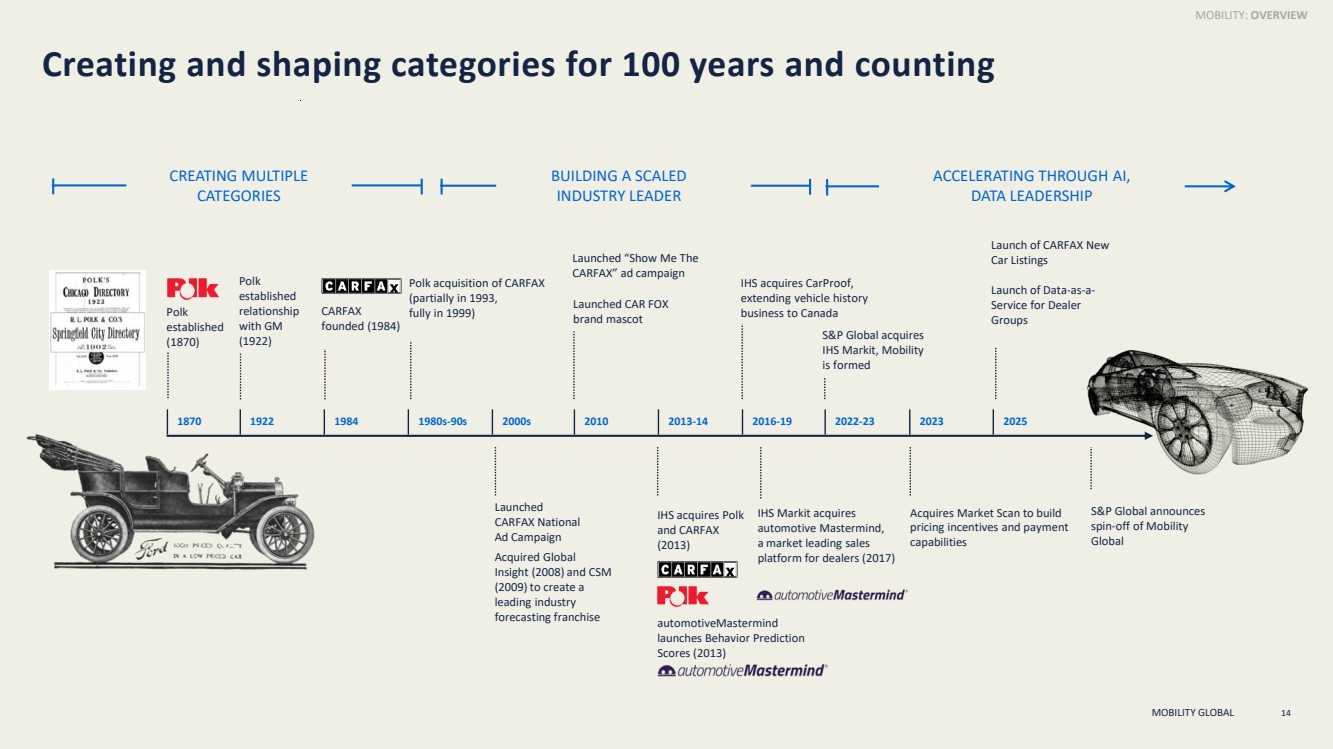
| MOBILITY GLOBAL Creating and shaping categories for 100 years and counting 14 Acquires Market Scan to build pricing incentives and payment capabilities Launched CARFAX National Ad Campaign Acquired Global Insight (2008) and CSM (2009) to create a leading industry forecasting franchise automotiveMastermind launches Behavior Prediction Scores (2013) IHS acquires Polk and CARFAX (2013) IHS Markit acquires automotive Mastermind, a market leading sales platform for dealers (2017) S&P Global announces spin-off of Mobility Global Launched “Show Me The CARFAX” ad campaign Launched CAR FOX brand mascot CARFAX founded (1984) Polk acquisition of CARFAX (partially in 1993, fully in 1999) S&P Global acquires IHS Markit, Mobility is formed Launch of CARFAX New Car Listings Launch of Data-as-a-Service for Dealer Groups Polk established (1870) IHS acquires CarProof, extending vehicle history business to Canada 1870 1922 1984 1980s-90s 2000s 2010 2013-14 2016-19 2022-23 2023 2025 CREATING MULTIPLE CATEGORIES BUILDING A SCALED INDUSTRY LEADER ACCELERATING THROUGH AI, DATA LEADERSHIP Polk established relationship with GM (1922) MOBILITY: OVERVIEW |
| MOBILITY GLOBAL Agenda CORE STRATEGIC ASSETS VISION AHEAD COMPELLING VALUE PROPOSITION INTRODUCTION TO MOBILITY GLOBAL 15 |
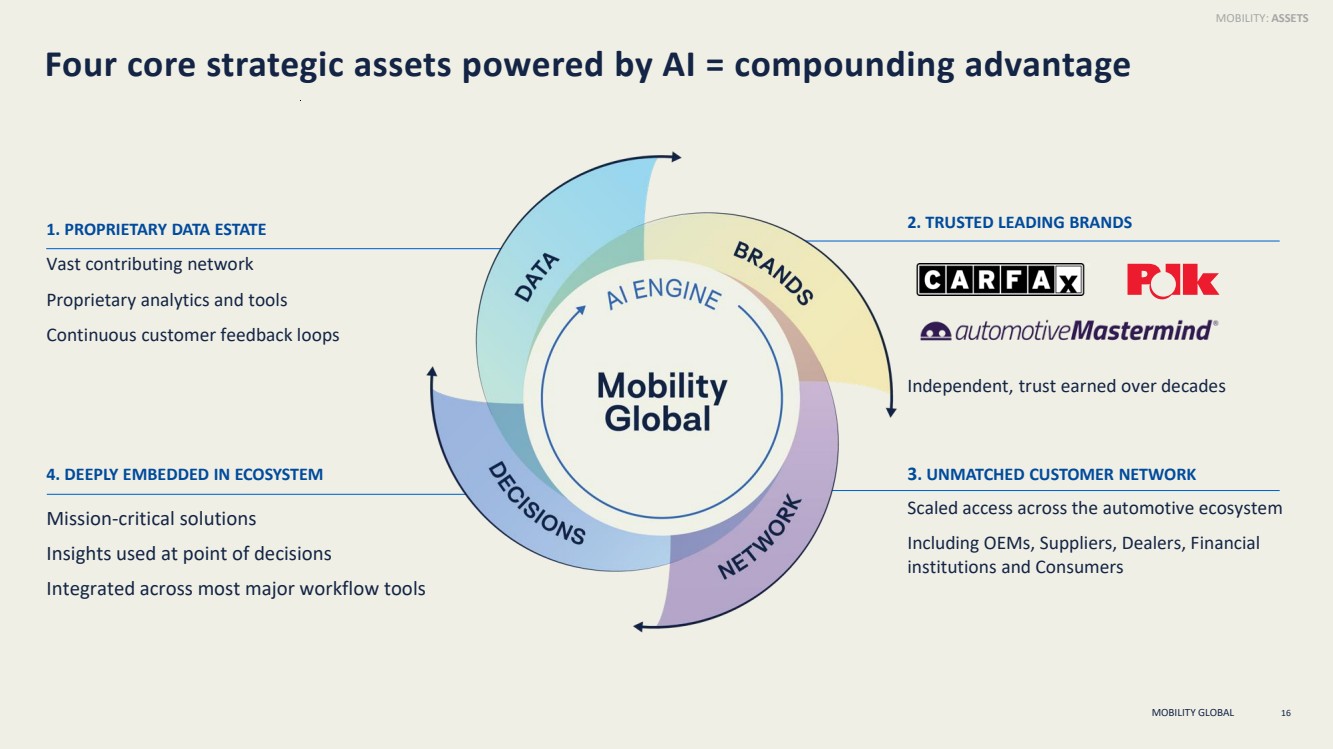
| MOBILITY GLOBAL 4. DEEPLY EMBEDDED IN ECOSYSTEM Mission-critical solutions Insights used at point of decisions Integrated across most major workflow tools 3. UNMATCHED CUSTOMER NETWORK Scaled access across the automotive ecosystem Including OEMs, Suppliers, Dealers, Financial institutions and Consumers 2. TRUSTED LEADING BRANDS Independent, trust earned over decades Four core strategic assets powered by AI = compounding advantage 16 1. PROPRIETARY DATA ESTATE Vast contributing network Proprietary analytics and tools Continuous customer feedback loops MOBILITY: ASSETS |
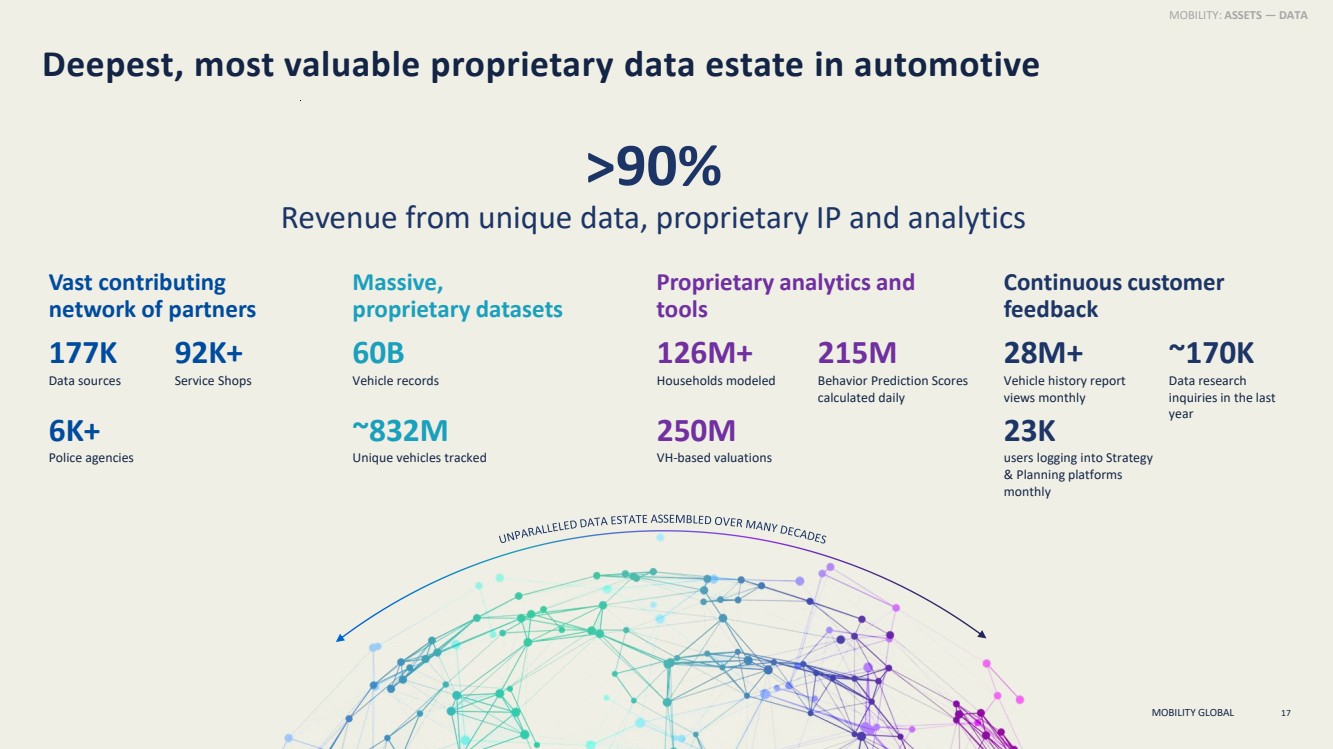
| MOBILITY GLOBAL Deepest, most valuable proprietary data estate in automotive 17 Vast contributing network of partners 6K+ Police agencies 177K Data sources 92K+ Service Shops Continuous customer feedback 28M+ Vehicle history report views monthly ~170K Data research inquiries in the last year 23K users logging into Strategy & Planning platforms monthly 126M+ Households modeled Proprietary analytics and tools 250M VH-based valuations 215M Behavior Prediction Scores calculated daily Massive, proprietary datasets ~832M Unique vehicles tracked 60B Vehicle records MOBILITY: ASSETS — DATA >90% Revenue from unique data, proprietary IP and analytics UNPARALLELED DATA ESTATE ASSEMBLED OVER MANY DECADES |
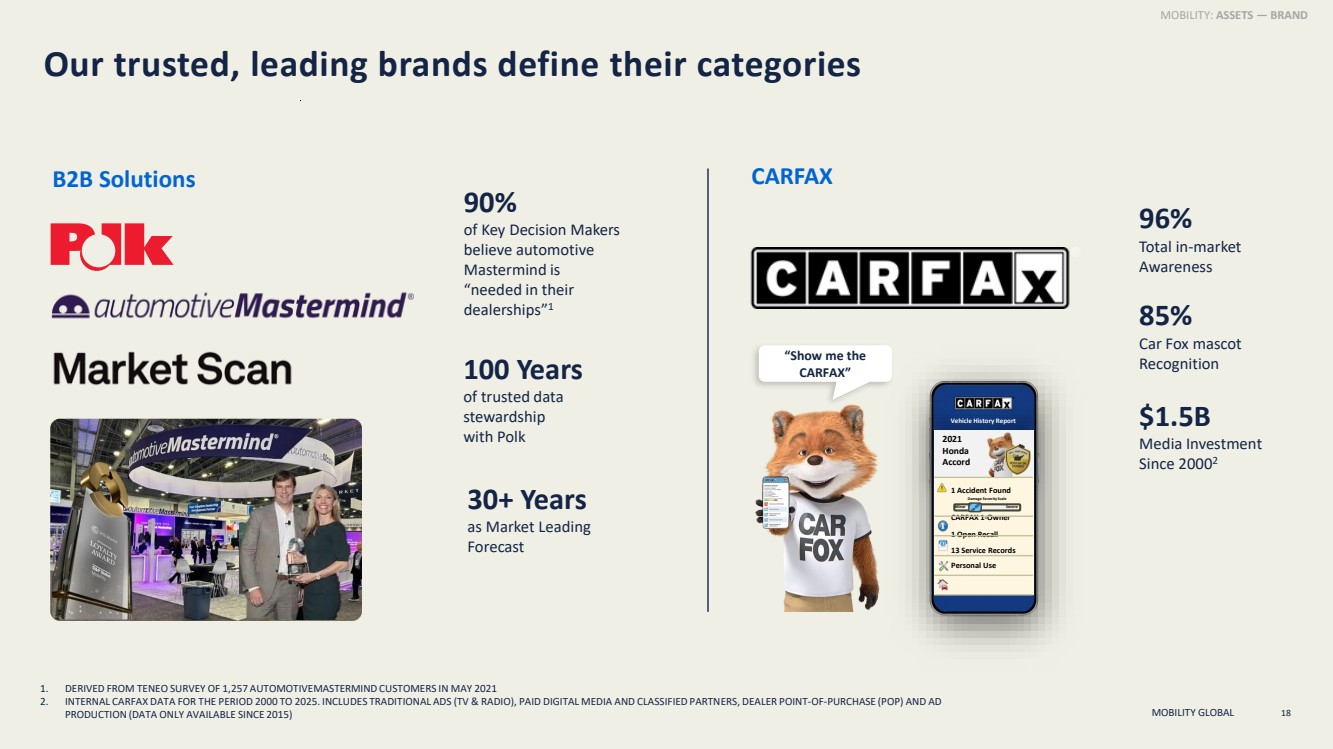
| MOBILITY GLOBAL Our trusted, leading brands define their categories 18 CARFAX 2021 Honda Accord Vehicle History Report 1 Accident Found CARFAX 1-Owner 1 Open Recall 13 Service Records Personal Use Minor Severe Damage Severity Scale 1. DERIVED FROM TENEO SURVEY OF 1,257 AUTOMOTIVEMASTERMIND CUSTOMERS IN MAY 2021 2. INTERNAL CARFAX DATA FOR THE PERIOD 2000 TO 2025. INCLUDES TRADITIONAL ADS (TV & RADIO), PAID DIGITAL MEDIA AND CLASSIFIED PARTNERS, DEALER POINT-OF-PURCHASE (POP) AND AD PRODUCTION (DATA ONLY AVAILABLE SINCE 2015) “Show me the CARFAX” 90% of Key Decision Makers believe automotive Mastermind is “needed in their dealerships”1 100 Years of trusted data stewardship with Polk 30+ Years as Market Leading Forecast 96% Total in-market Awareness 85% Car Fox mascot Recognition $1.5B Media Investment Since 20002 B2B Solutions MOBILITY: ASSETS — BRAND |
| MOBILITY GLOBAL Unmatched scale and reach across the automotive ecosystem 19 SUPPLY 94% Top 100 Global Automotive Suppliers MARKET 40K+ Dealer Network BUILD FINANCE 17 Of Top 20 Financial Institutions SELL PLAN MOBILITY: ASSETS — CUSTOMER NETWORK 100% Top 40 Global OEMs NEW VEHICLE LIFECYCLE 90M NEW VEHICLES ANNUALLY SHOP BUY SERVICE SELL 23M+ Monthly Unique Visitors to CARFAX US Website and App 1.4M+ Annual Trade-In Leads 28M+ Vehicle History Report Views Monthly 53M+ CARFAX Car Care Consumer Audience CONSUMER LIFECYCLE 1.5B+ VEHICLES IN OPERATION |
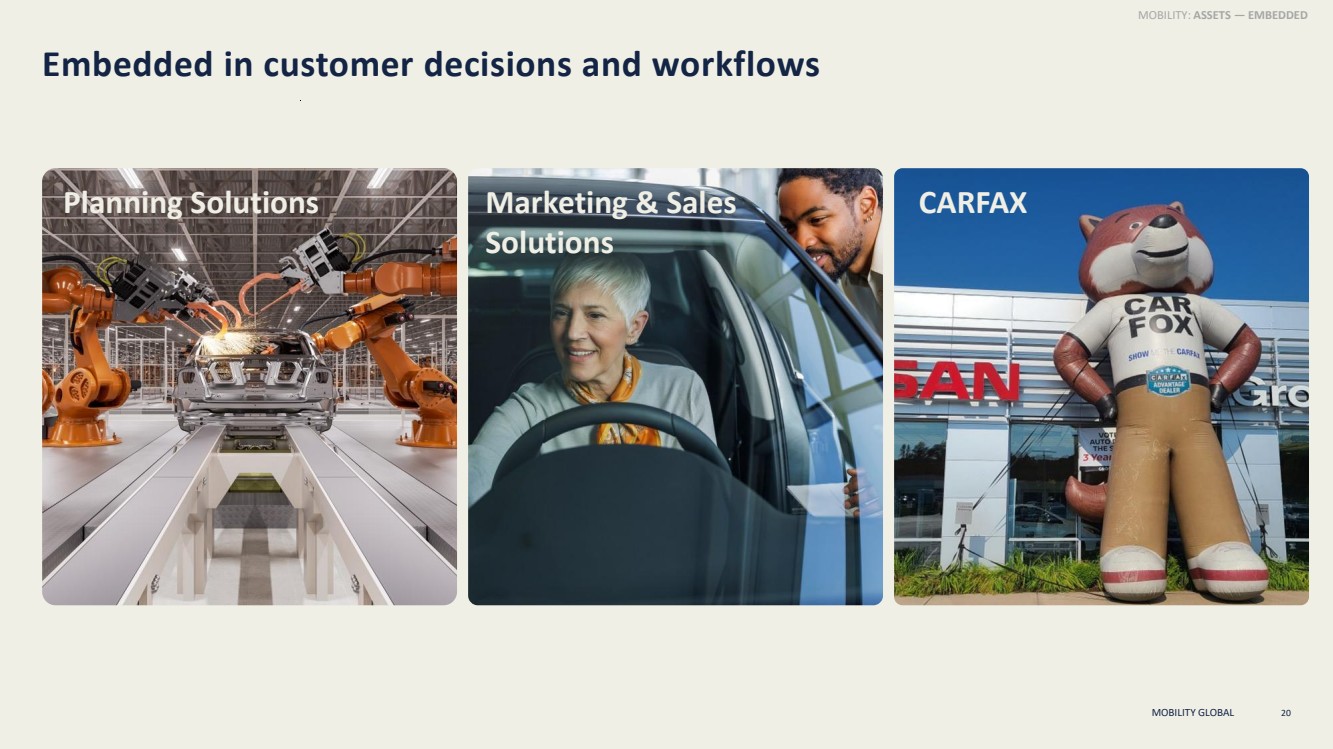
| MOBILITY GLOBAL Embedded in customer decisions and workflows 20 Planning Solutions Marketing & Sales Solutions CARFAX MOBILITY: ASSETS — EMBEDDED |
| MOBILITY GLOBAL Agenda CORE STRATEGIC ASSETS VISION AHEAD COMPELLING VALUE PROPOSITION INTRODUCTION TO MOBILITY GLOBAL 21 |
| MOBILITY GLOBAL 22 Our mission To provide the trusted information that helps billions of people build, sell, and own vehicles with more confidence. MOBILITY GLOBAL |

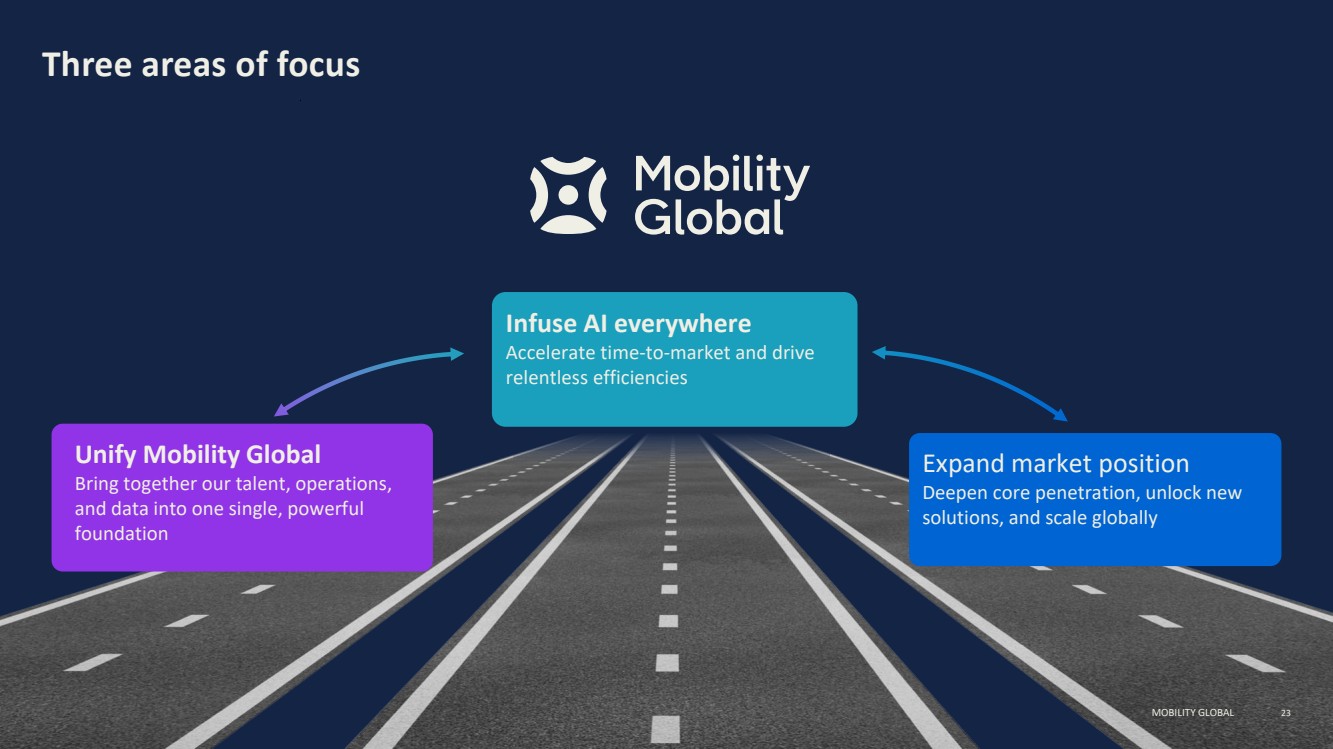
| MOBILITY GLOBAL 23 Three areas of focus Unify Mobility Global Bring together our talent, operations, and data into one single, powerful foundation Expand market position Deepen core penetration, unlock new solutions, and scale globally Infuse AI everywhere Accelerate time-to-market and drive relentless efficiencies MOBILITY GLOBAL |
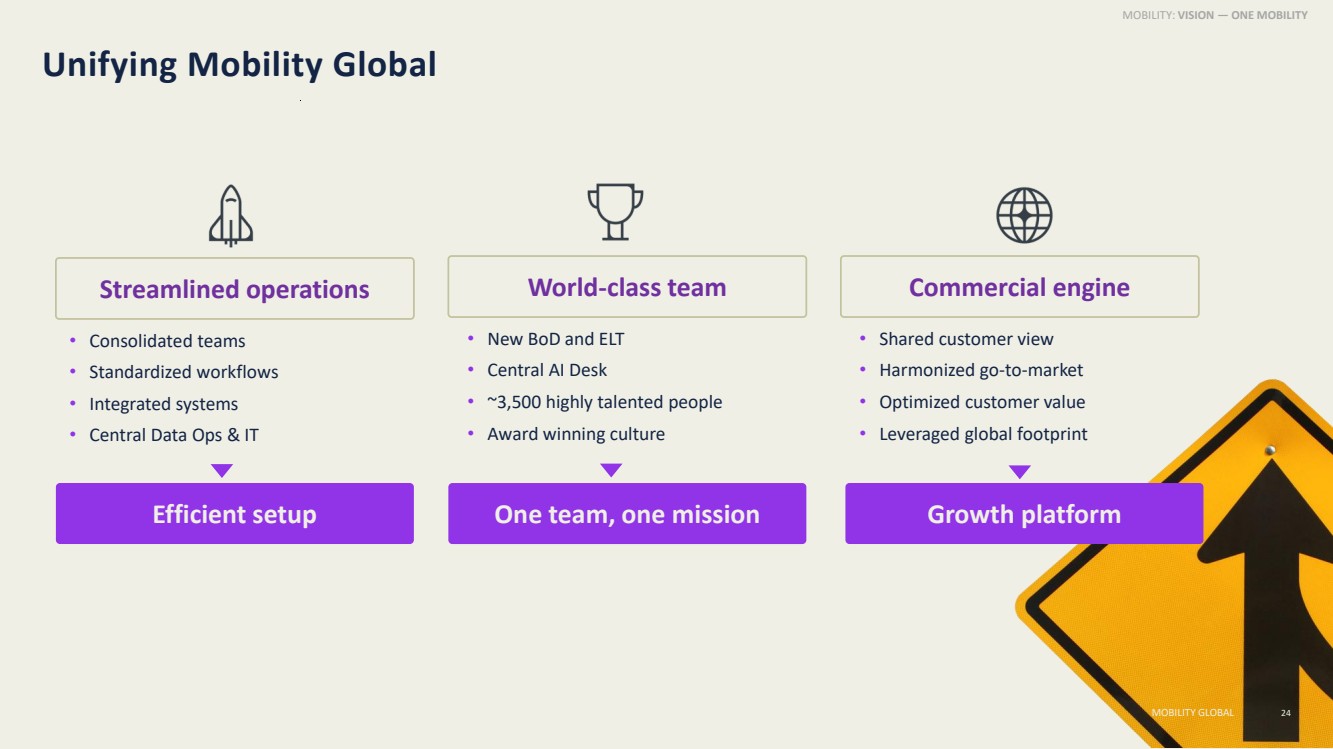
| MOBILITY GLOBAL Unifying Mobility Global 24 MOBILITY: VISION — ONE MOBILITY • New BoD and ELT • Central AI Desk • ~3,500 highly talented people • Award winning culture World-class team One team, one mission Commercial engine • Shared customer view • Harmonized go-to-market • Optimized customer value • Leveraged global footprint Growth platform Streamlined operations • Consolidated teams • Standardized workflows • Integrated systems • Central Data Ops & IT Efficient setup MOBILITY GLOBAL |
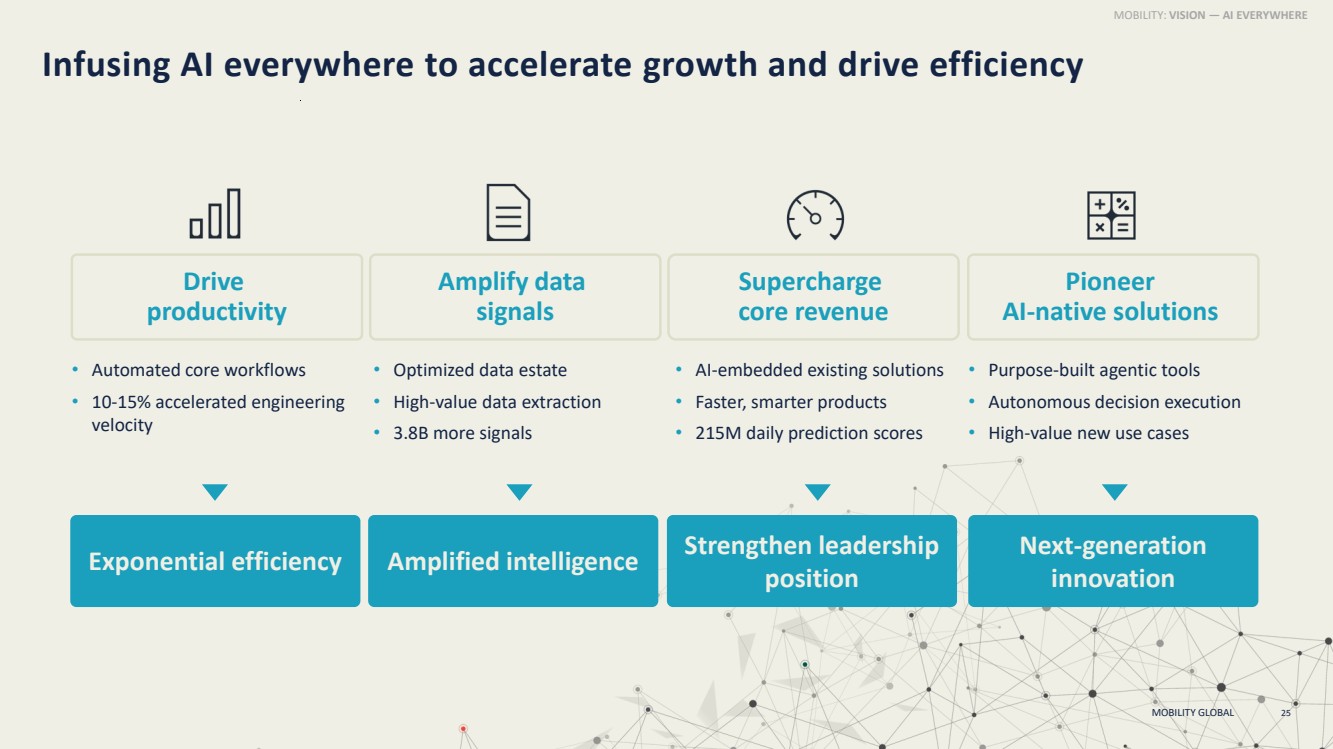
| MOBILITY GLOBAL Infusing AI everywhere to accelerate growth and drive efficiency 25 • Automated core workflows • 10-15% accelerated engineering velocity Drive productivity Amplify data signals Supercharge core revenue • Optimized data estate • High-value data extraction • 3.8B more signals • AI-embedded existing solutions • Faster, smarter products • 215M daily prediction scores Pioneer AI-native solutions • Purpose-built agentic tools • Autonomous decision execution • High-value new use cases Exponential efficiency Amplified intelligence Next-generation innovation MOBILITY: VISION — AI EVERYWHERE Strengthen leadership position |
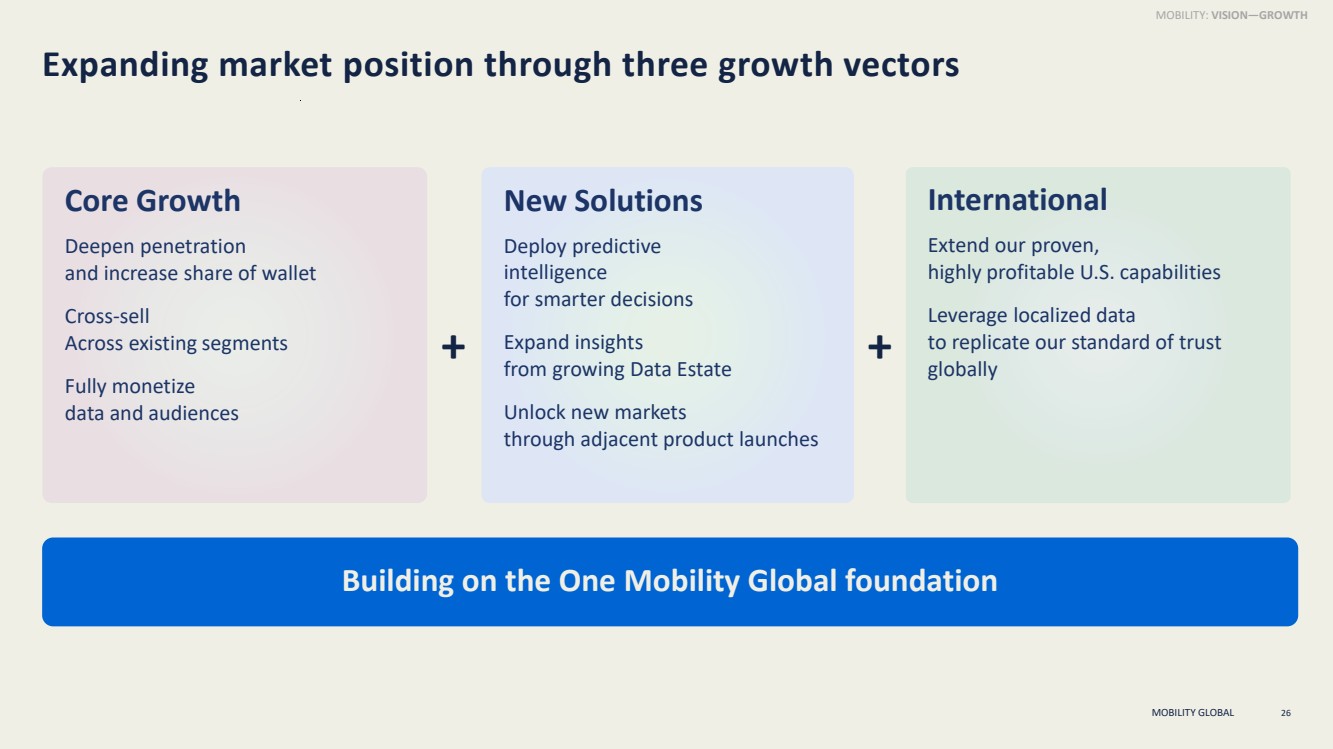
| MOBILITY GLOBAL Expanding market position through three growth vectors 26 International Extend our proven, highly profitable U.S. capabilities Leverage localized data to replicate our standard of trust globally Core Growth Deepen penetration and increase share of wallet Cross-sell Across existing segments Fully monetize data and audiences New Solutions Deploy predictive intelligence for smarter decisions Expand insights from growing Data Estate Unlock new markets through adjacent product launches Building on the One Mobility Global foundation + + MOBILITY: VISION—GROWTH |
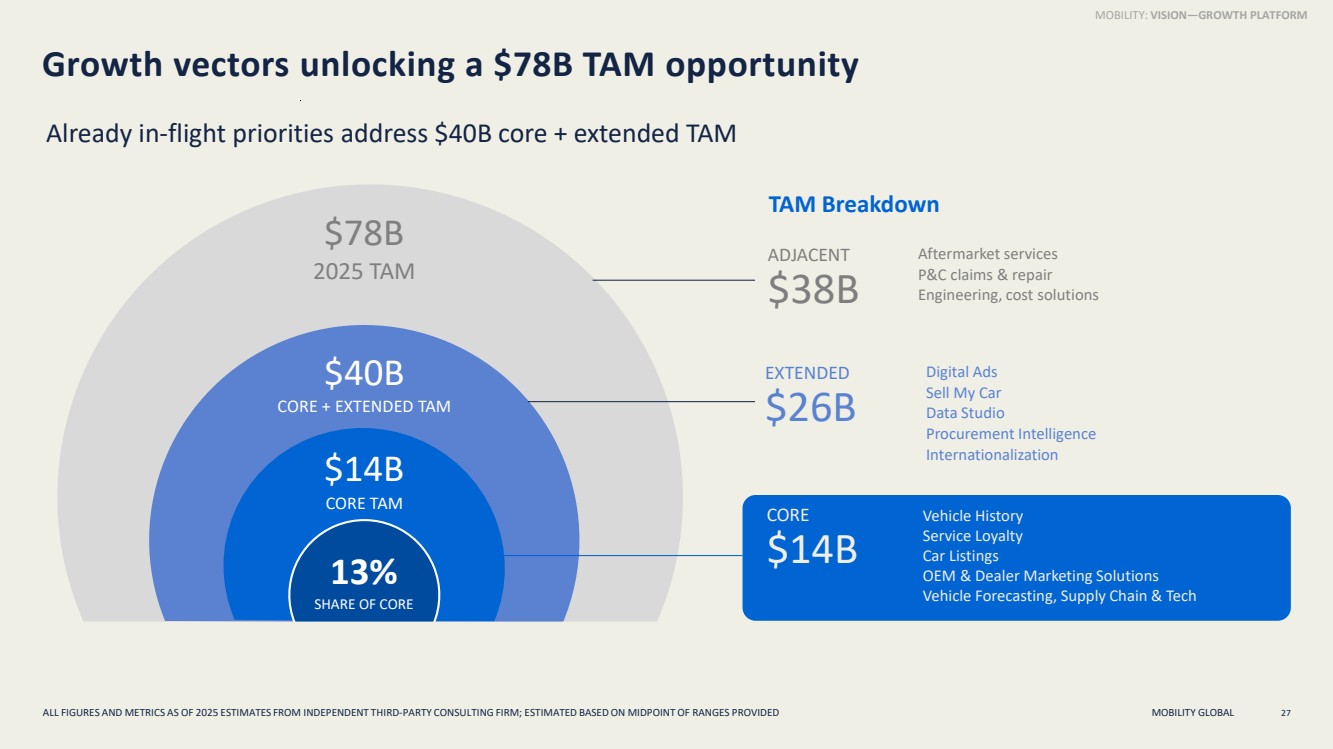
| MOBILITY GLOBAL Growth vectors unlocking a $78B TAM opportunity $78B 2025 TAM TAM Breakdown EXTENDED $26B Digital Ads Sell My Car Data Studio Procurement Intelligence Internationalization 27 13% SHARE OF CORE $14B CORE TAM $40B CORE + EXTENDED TAM ADJACENT $38B Aftermarket services P&C claims & repair Engineering, cost solutions CORE $14B Vehicle History Service Loyalty Car Listings OEM & Dealer Marketing Solutions Vehicle Forecasting, Supply Chain & Tech MOBILITY: VISION—GROWTH PLATFORM Already in-flight priorities address $40B core + extended TAM ALL FIGURES AND METRICS AS OF 2025 ESTIMATES FROM INDEPENDENT THIRD-PARTY CONSULTING FIRM; ESTIMATED BASED ON MIDPOINT OF RANGES PROVIDED |
| MOBILITY GLOBAL Agenda CORE STRATEGIC ASSETS VISION AHEAD COMPELLING VALUE PROPOSITION INTRODUCTION TO MOBILITY GLOBAL 28 |
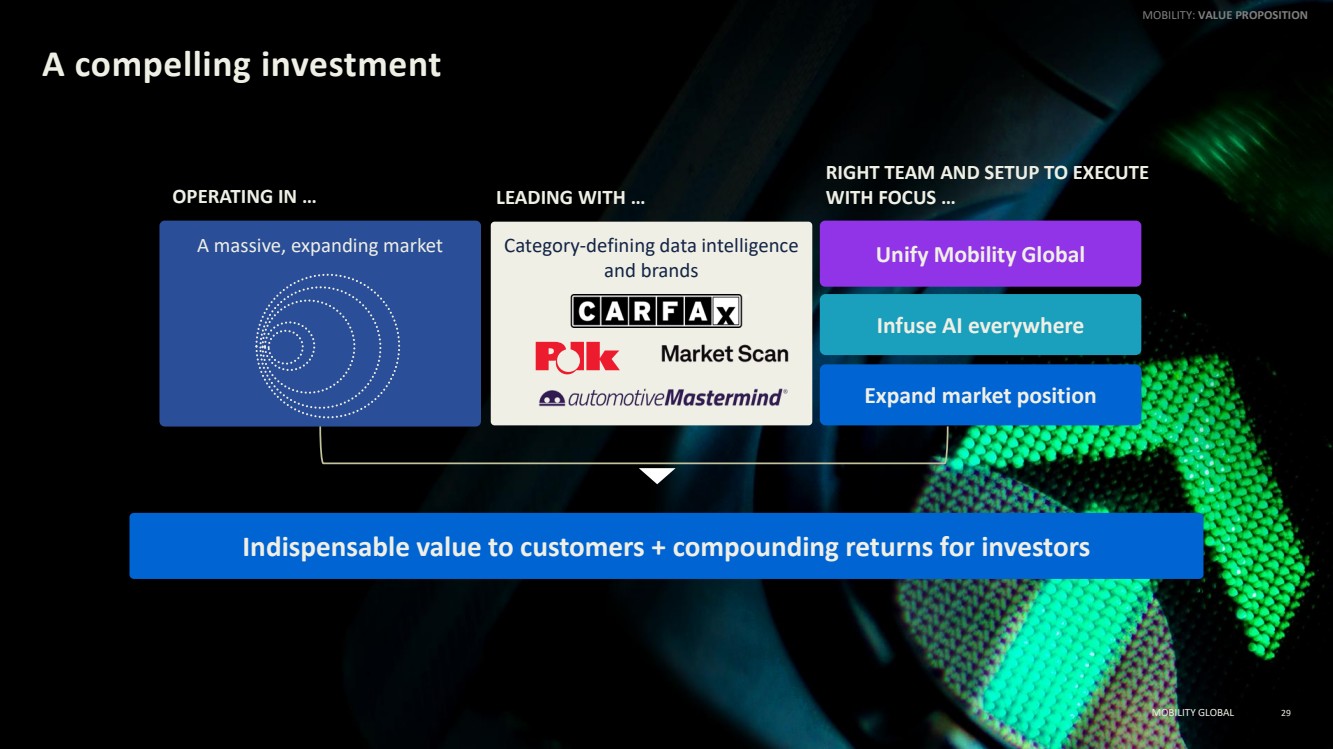
| MOBILITY GLOBAL A compelling investment 29 A massive, expanding market Category-defining data intelligence and brands Indispensable value to customers + compounding returns for investors OPERATING IN … LEADING WITH … RIGHT TEAM AND SETUP TO EXECUTE WITH FOCUS … Unify Mobility Global Infuse AI everywhere Expand market position MOBILITY: VALUE PROPOSITION MOBILITY GLOBAL |
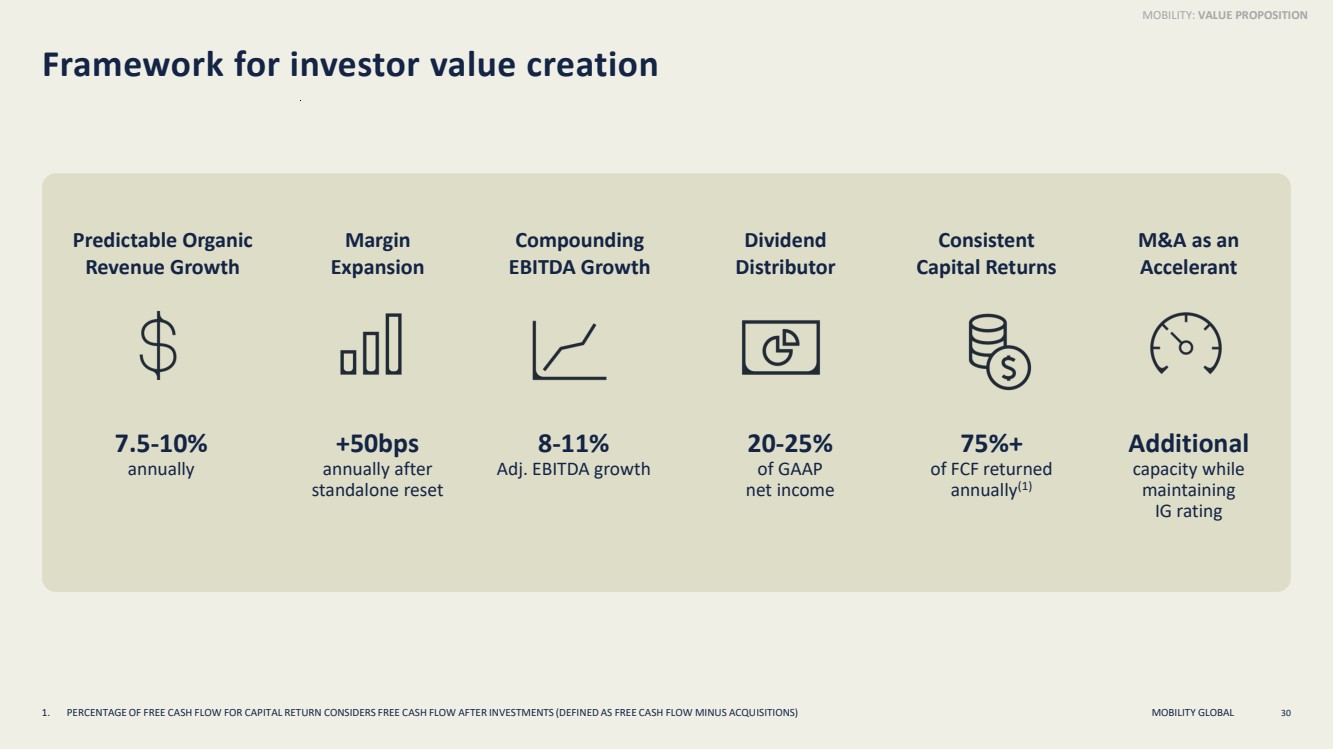
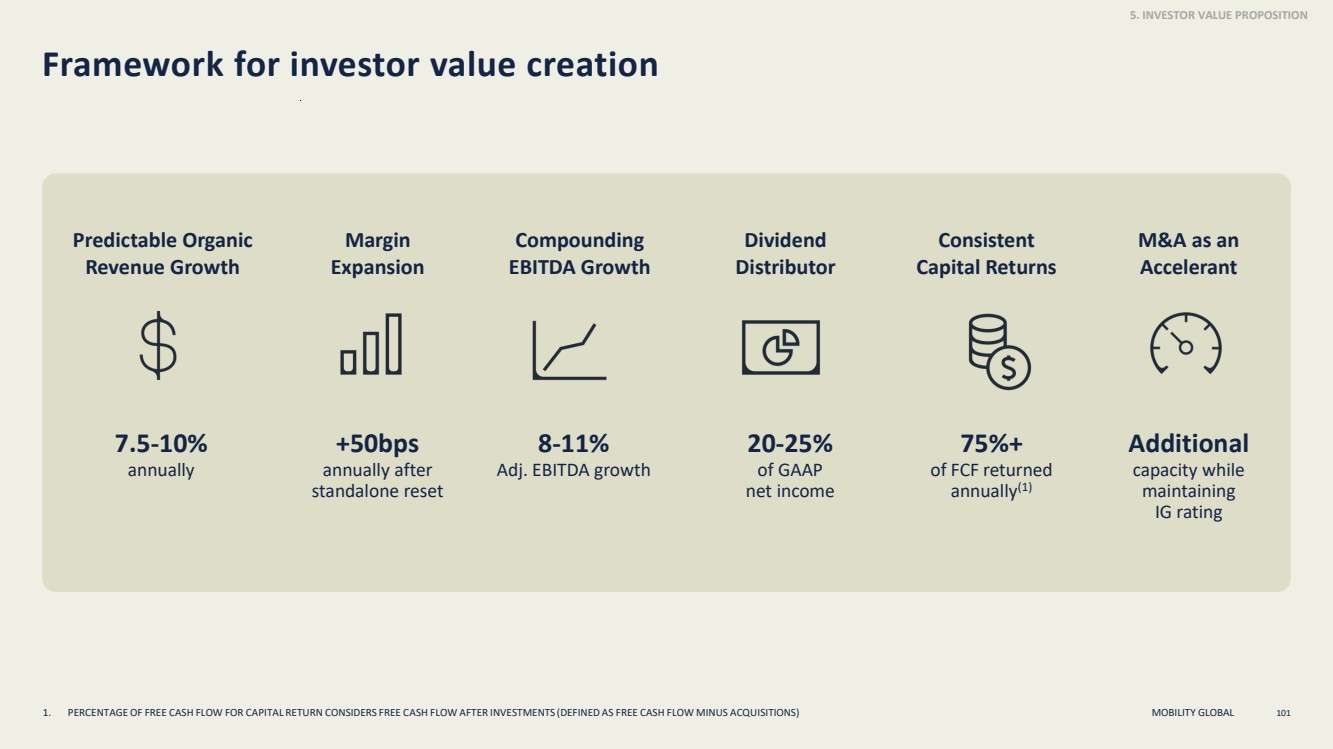
| MOBILITY GLOBAL Framework for investor value creation 1. PERCENTAGE OF FREE CASH FLOW FOR CAPITAL RETURN CONSIDERS FREE CASH FLOW AFTER INVESTMENTS (DEFINED AS FREE CASH FLOW MINUS ACQUISITIONS) 30 Margin Expansion Compounding EBITDA Growth Dividend Distributor M&A as an Accelerant Consistent Capital Returns Predictable Organic Revenue Growth 7.5-10% annually 20-25% of GAAP net income 75%+ of FCF returned annually(1) Additional capacity while maintaining IG rating 8-11% Adj. EBITDA growth MOBILITY: VALUE PROPOSITION +50bps annually after standalone reset |
| MOBILITY GLOBAL B2B Solutions Joe LaFeir President, Mobility Business Solutions 31 |

| MOBILITY GLOBAL Change background color → Right click → Format Background → Fill → Solid Fill → Color → Select color 100 Years of Trust Embedded in the Decisions that Matter 32 |

| MOBILITY GLOBAL Agenda CORE STRATEGIC ASSETS KEY GROWTH DRIVERS INTRODUCTION TO B2B SOLUTIONS 33 |
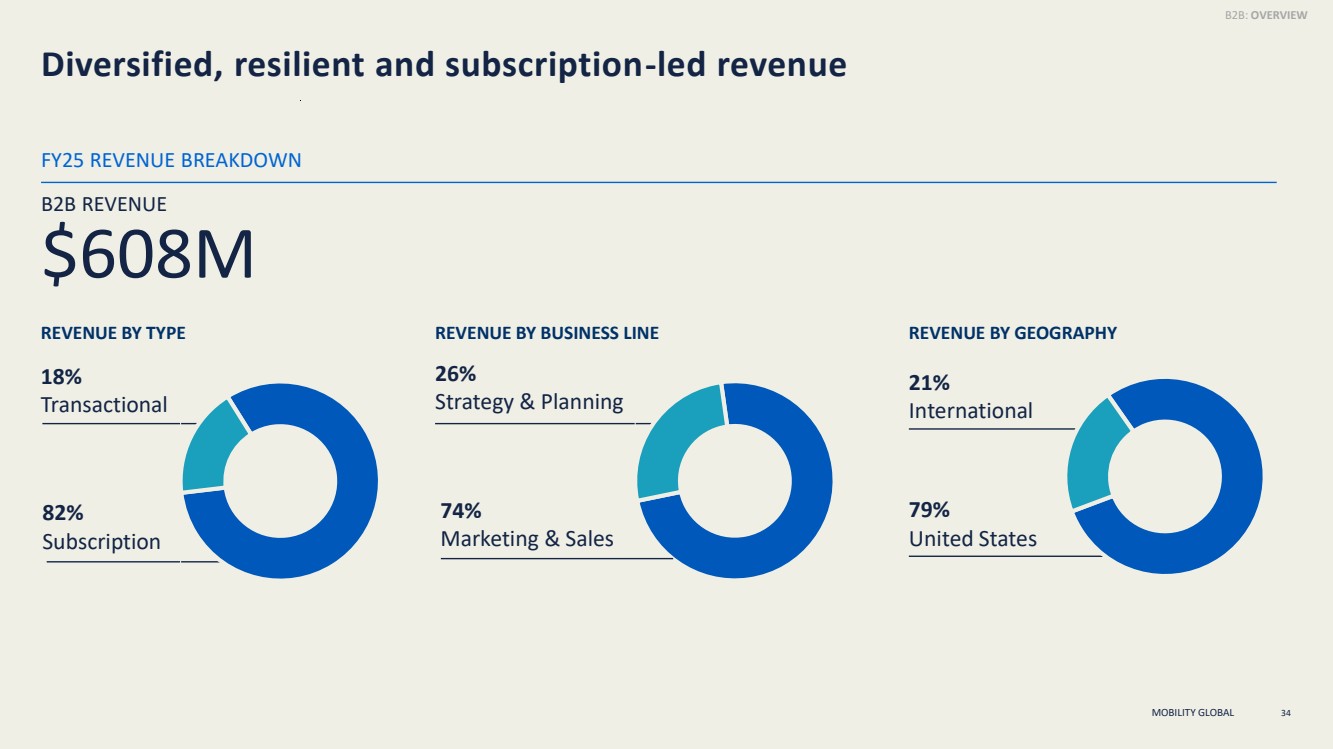
| MOBILITY GLOBAL Diversified, resilient and subscription-led revenue REVENUE BY TYPE 82% Subscription 18% Transactional REVENUE BY GEOGRAPHY 79% United States 21% International REVENUE BY BUSINESS LINE 34 B2B: OVERVIEW FY25 REVENUE BREAKDOWN B2B REVENUE $608M 74% Marketing & Sales 26% Strategy & Planning |
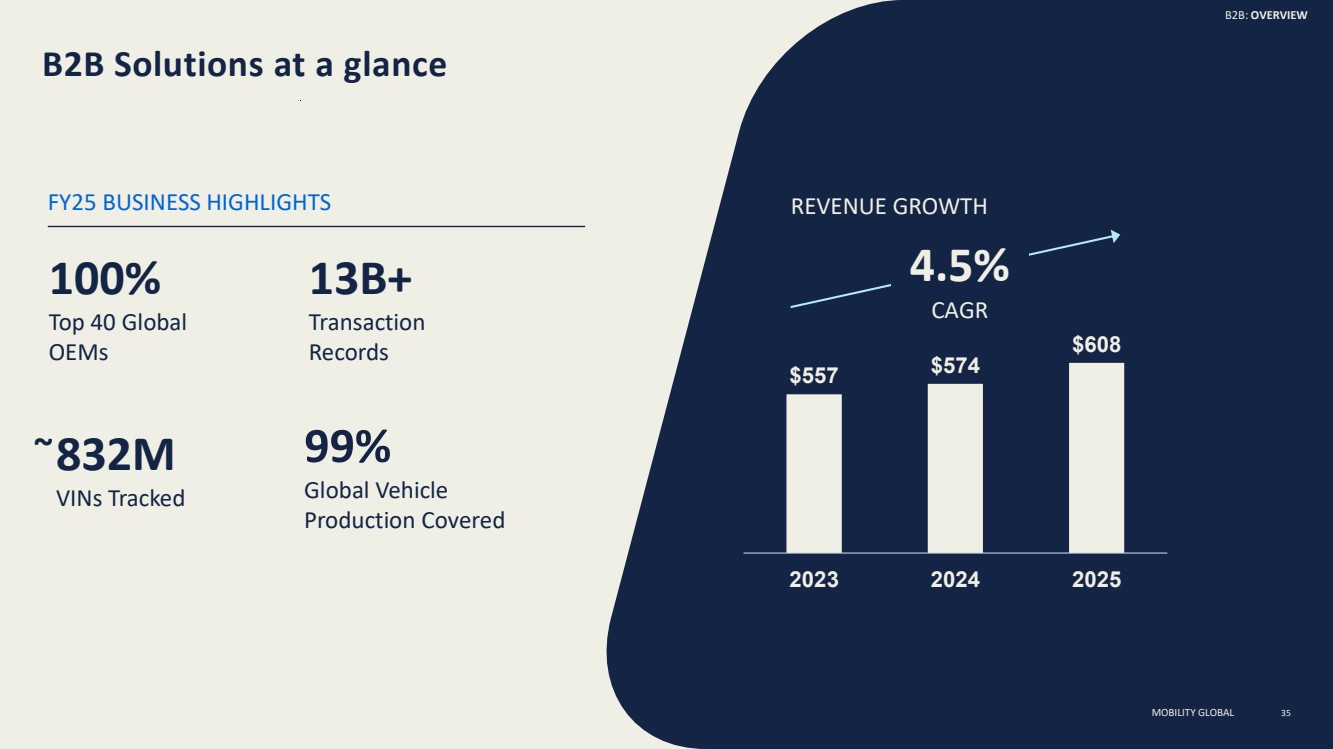
| MOBILITY GLOBAL B2B Solutions at a glance REVENUE GROWTH $557 $574 $608 2023 2024 2025 4.5% CAGR 35 FY25 BUSINESS HIGHLIGHTS 100% Top 40 Global OEMs 13B+ Transaction Records 832M VINs Tracked 99% Global Vehicle Production Covered B2B: OVERVIEW ~ MOBILITY GLOBAL |
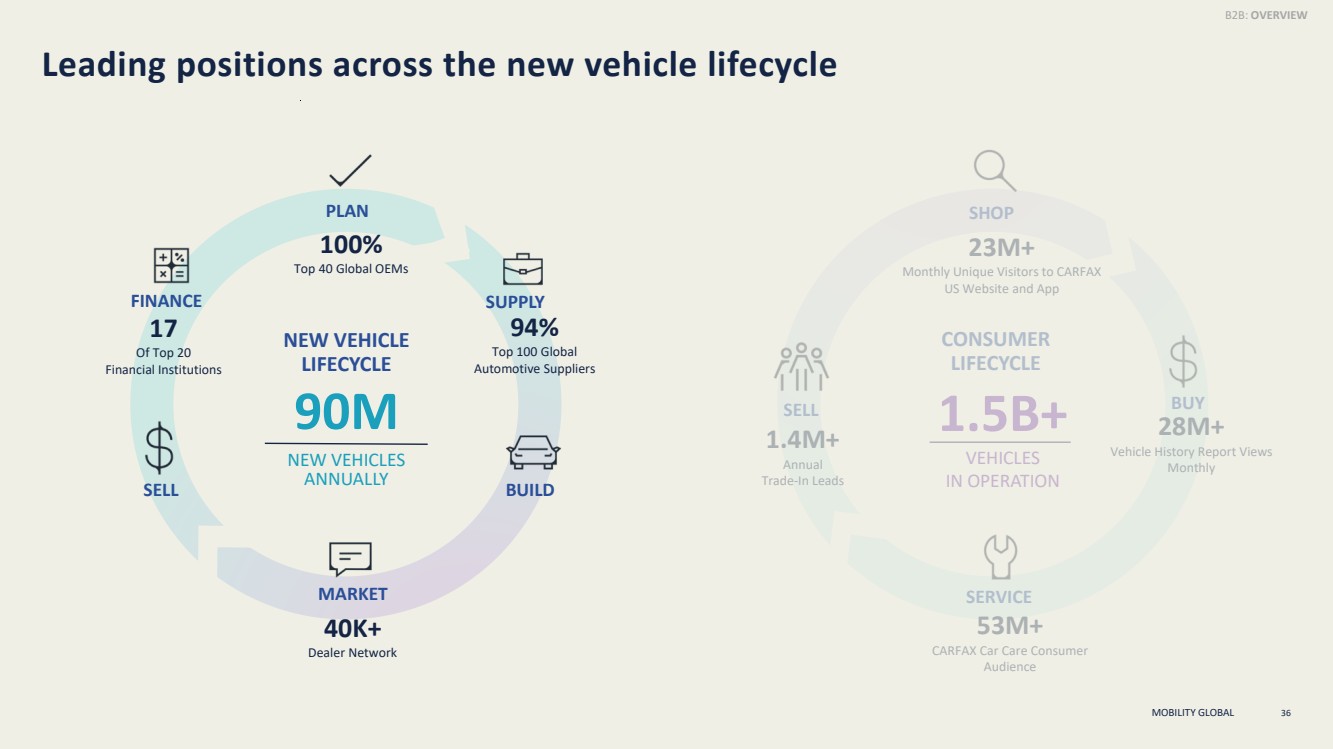
| MOBILITY GLOBAL Leading positions across the new vehicle lifecycle SHOP BUY SERVICE SELL 23M+ Monthly Unique Visitors to CARFAX US Website and App 1.4M+ Annual Trade-In Leads 28M+ Vehicle History Report Views Monthly 53M+ CARFAX Car Care Consumer Audience SUPPLY 94% Top 100 Global Automotive Suppliers MARKET 40K+ Dealer Network BUILD FINANCE 17 Of Top 20 Financial Institutions SELL PLAN 1.5B+ VEHICLES IN OPERATION 100% Top 40 Global OEMs CONSUMER LIFECYCLE NEW VEHICLE LIFECYCLE 90M NEW VEHICLES ANNUALLY B2B: OVERVIEW 36 |
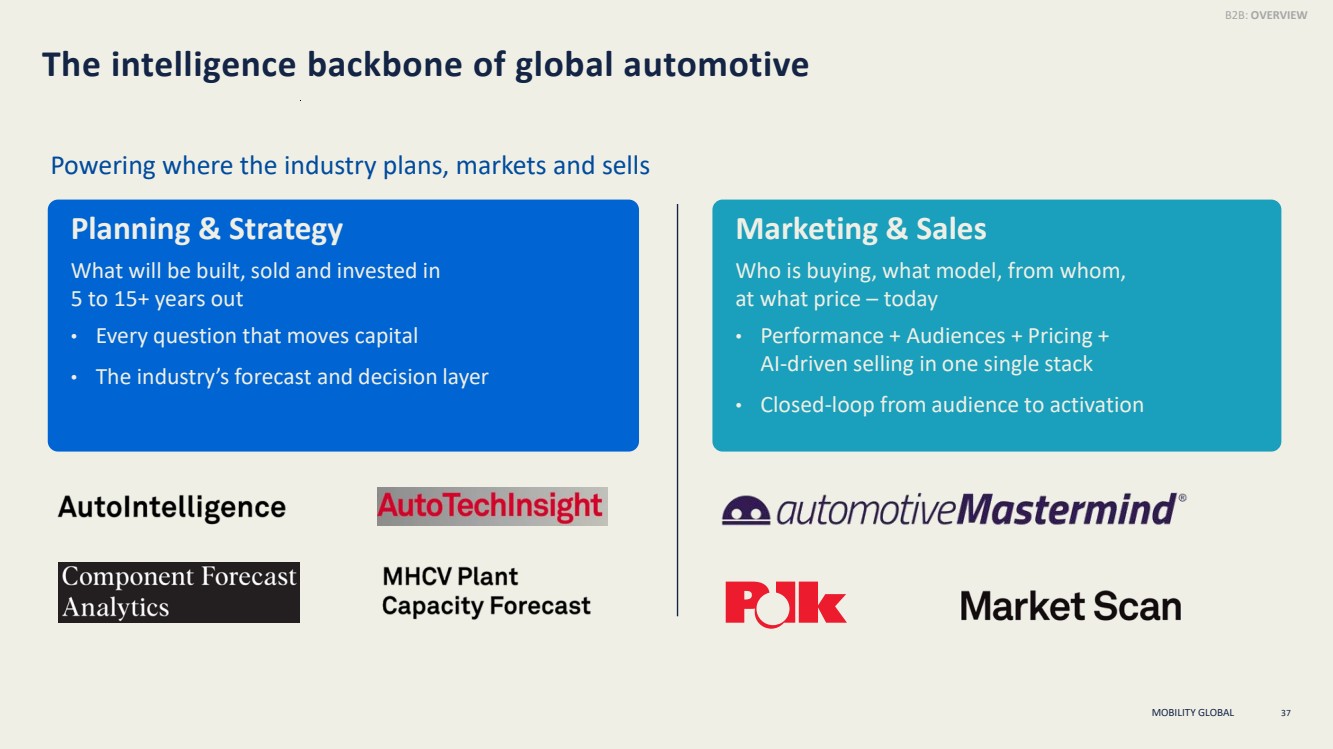
| MOBILITY GLOBAL Planning & Strategy What will be built, sold and invested in 5 to 15+ years out • Every question that moves capital • The industry’s forecast and decision layer Marketing & Sales Who is buying, what model, from whom, at what price – today • Performance + Audiences + Pricing + AI-driven selling in one single stack • Closed-loop from audience to activation The intelligence backbone of global automotive Powering where the industry plans, markets and sells B2B: OVERVIEW 37 |
| MOBILITY GLOBAL Agenda CORE STRATEGIC ASSETS KEY GROWTH DRIVERS INTRODUCTION TO B2B SOLUTIONS 38 |
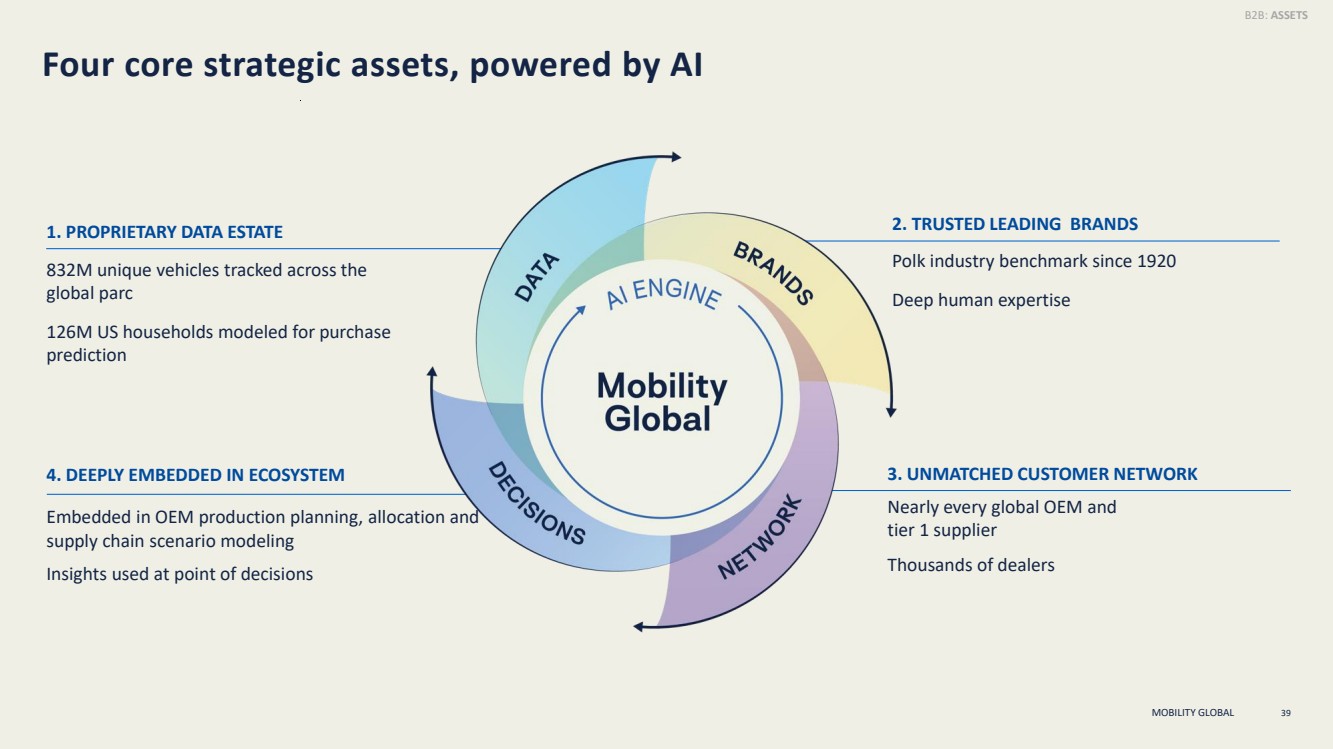
| MOBILITY GLOBAL 4. DEEPLY EMBEDDED IN ECOSYSTEM Embedded in OEM production planning, allocation and supply chain scenario modeling Insights used at point of decisions Four core strategic assets, powered by AI 39 3. UNMATCHED CUSTOMER NETWORK Nearly every global OEM and tier 1 supplier Thousands of dealers 2. TRUSTED LEADING BRANDS Polk industry benchmark since 1920 Deep human expertise 1. PROPRIETARY DATA ESTATE 832M unique vehicles tracked across the global parc 126M US households modeled for purchase prediction B2B: ASSETS |
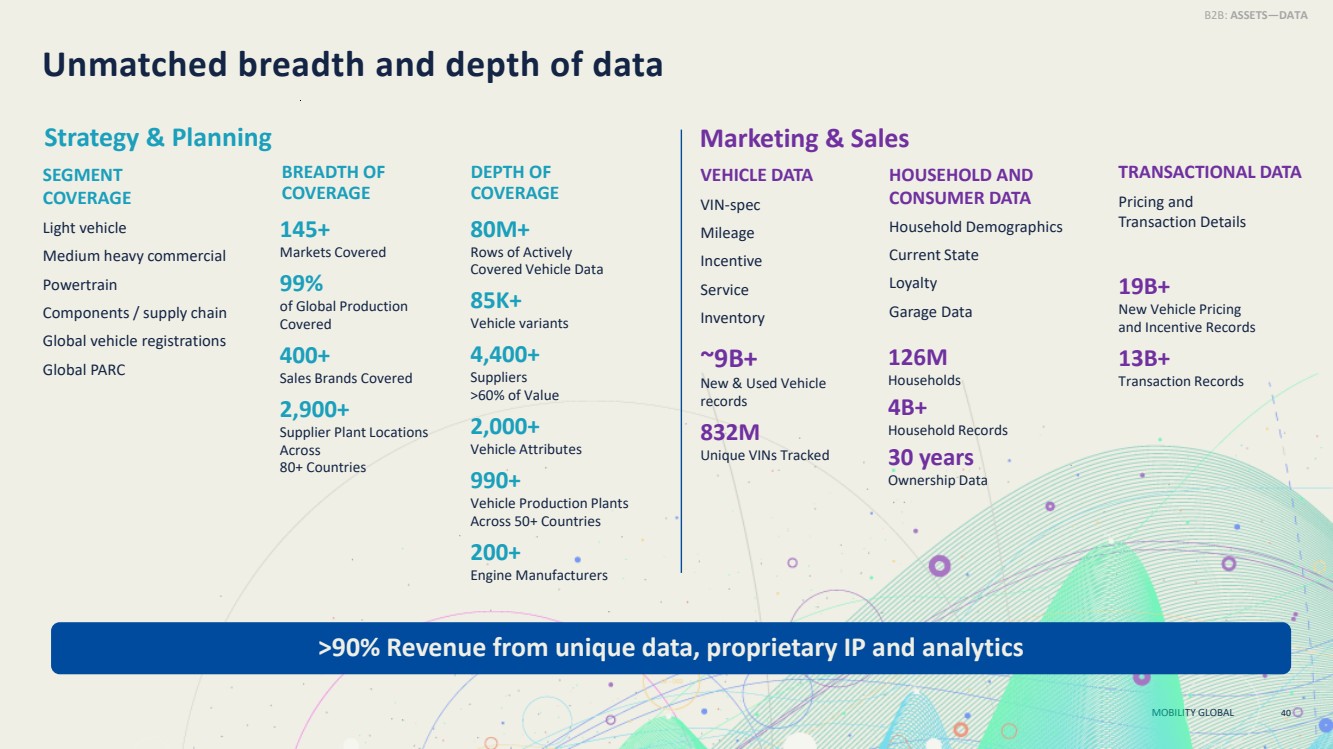
| MOBILITY GLOBAL Unmatched breadth and depth of data 40 B2B: ASSETS—DATA >90% Revenue from unique data, proprietary IP and analytics Strategy & Planning Marketing & Sales SEGMENT COVERAGE Light vehicle Medium heavy commercial Powertrain Components / supply chain Global vehicle registrations Global PARC BREADTH OF COVERAGE HOUSEHOLD AND CONSUMER DATA Household Demographics Current State Loyalty Garage Data TRANSACTIONAL DATA Pricing and Transaction Details VEHICLE DATA VIN-spec Mileage Incentive Service Inventory ~9B+ New & Used Vehicle records 832M Unique VINs Tracked 126M Households 4B+ Household Records 30 years Ownership Data 19B+ New Vehicle Pricing and Incentive Records 13B+ Transaction Records DEPTH OF COVERAGE 145+ Markets Covered 99% of Global Production Covered 400+ Sales Brands Covered 2,900+ Supplier Plant Locations Across 80+ Countries 80M+ Rows of Actively Covered Vehicle Data 85K+ Vehicle variants 4,400+ Suppliers >60% of Value 2,000+ Vehicle Attributes 990+ Vehicle Production Plants Across 50+ Countries 200+ Engine Manufacturers |
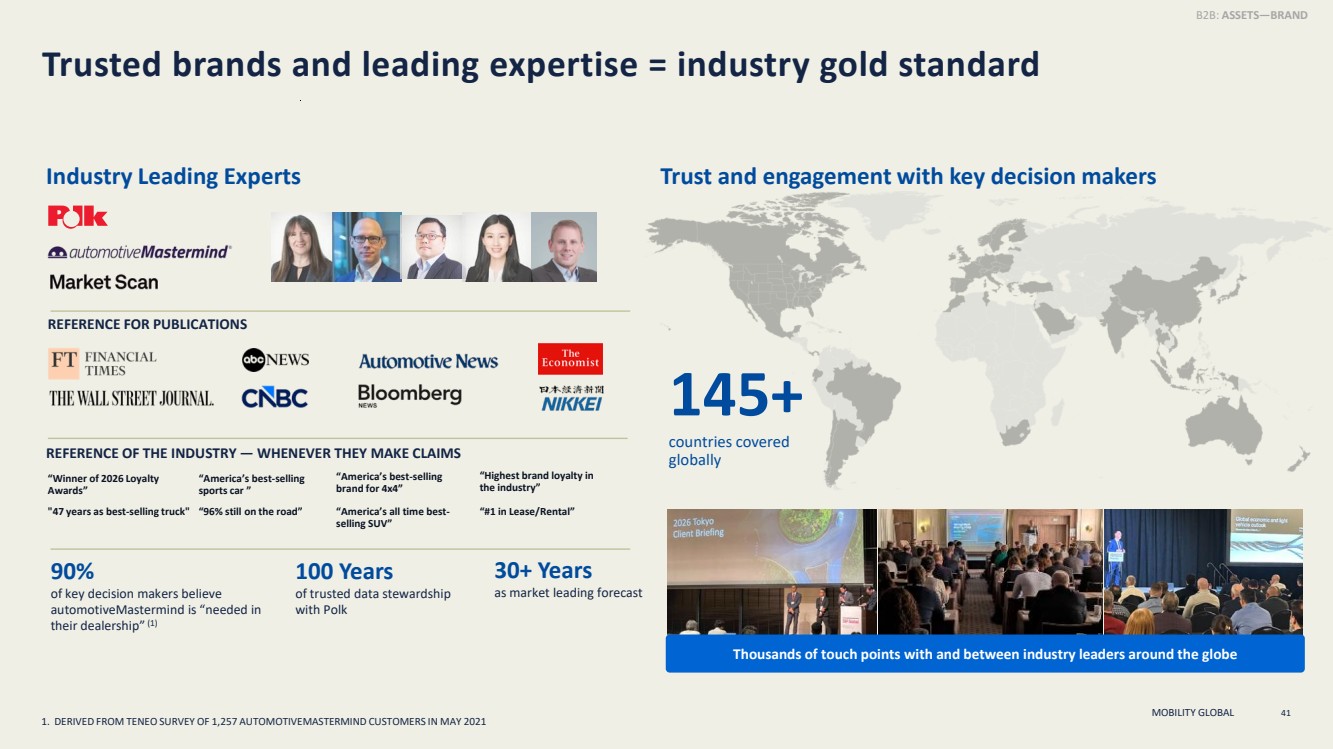
| MOBILITY GLOBAL Trusted brands and leading expertise = industry gold standard 41 B2B: ASSETS—BRAND 90% of key decision makers believe automotiveMastermind is “needed in their dealership” (1) 100 Years of trusted data stewardship with Polk 30+ Years as market leading forecast Trust and engagement with key decision makers 145+ countries covered globally Industry Leading Experts REFERENCE FOR PUBLICATIONS REFERENCE OF THE INDUSTRY — WHENEVER THEY MAKE CLAIMS "47 years as best-selling truck" “96% still on the road” “Winner of 2026 Loyalty Awards” “America’s all time best-selling SUV” “Highest brand loyalty in the industry” “America’s best-selling brand for 4x4” “#1 in Lease/Rental” “America’s best-selling sports car ” Thousands of touch points with and between industry leaders around the globe 1. DERIVED FROM TENEO SURVEY OF 1,257 AUTOMOTIVEMASTERMIND CUSTOMERS IN MAY 2021 |
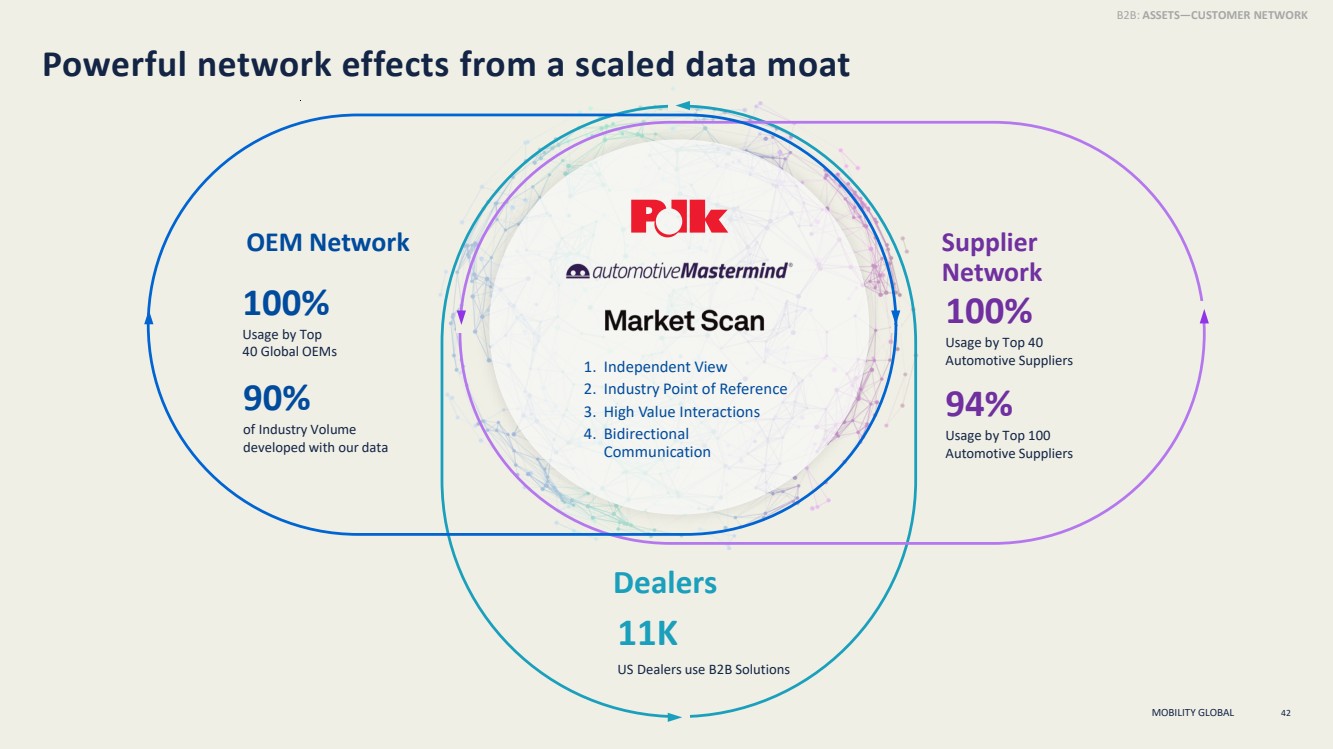
| MOBILITY GLOBAL Powerful network effects from a scaled data moat 42 FOOTER 100% Usage by Top 40 Global OEMs 90% of Industry Volume developed with our data 94% Usage by Top 100 Automotive Suppliers 100% Usage by Top 40 Automotive Suppliers 11K US Dealers use B2B Solutions OEM Network Supplier Network Dealers B2B: ASSETS—CUSTOMER NETWORK 1. Independent View 2. Industry Point of Reference 3. High Value Interactions 4. Bidirectional Communication |
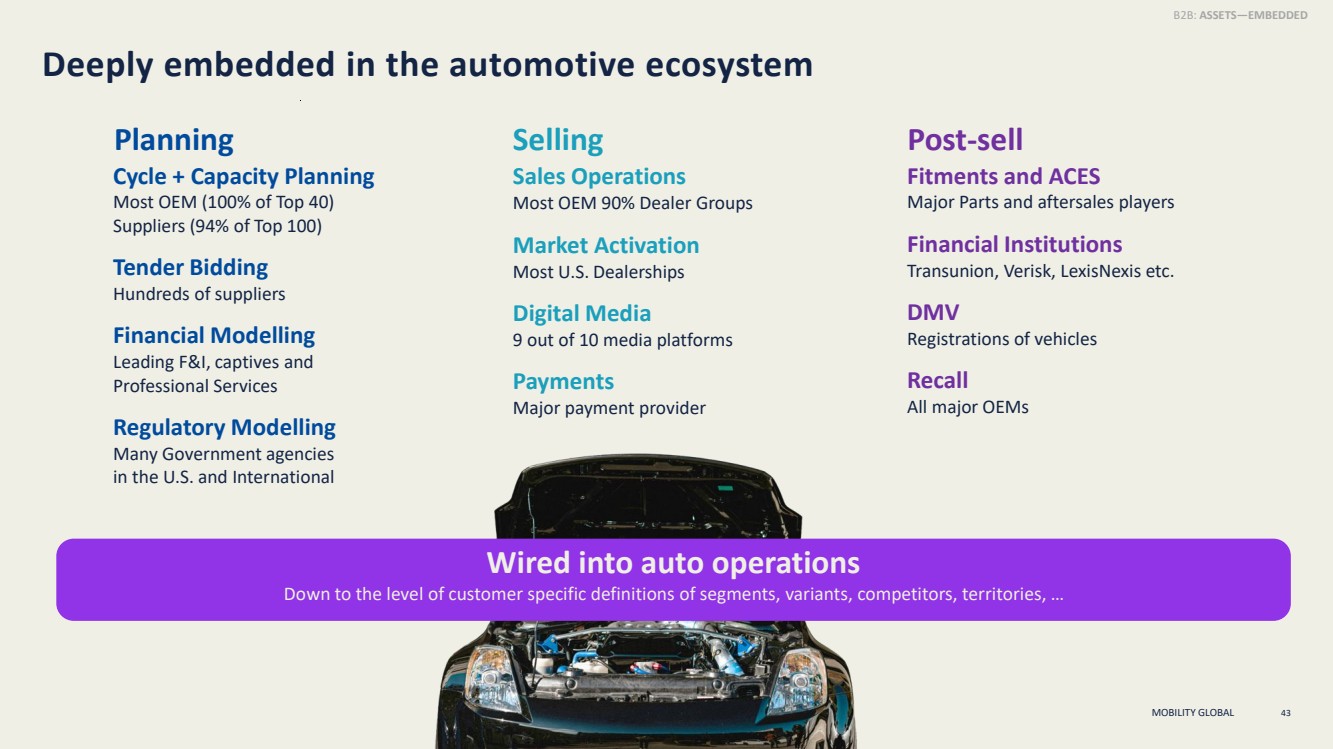
| MOBILITY GLOBAL 43 Deeply embedded in the automotive ecosystem Planning Selling Post-sell B2B: ASSETS—EMBEDDED Cycle + Capacity Planning Most OEM (100% of Top 40) Suppliers (94% of Top 100) Tender Bidding Hundreds of suppliers Financial Modelling Leading F&I, captives and Professional Services Regulatory Modelling Many Government agencies in the U.S. and International Sales Operations Most OEM 90% Dealer Groups Market Activation Most U.S. Dealerships Digital Media 9 out of 10 media platforms Payments Major payment provider Fitments and ACES Major Parts and aftersales players Financial Institutions Transunion, Verisk, LexisNexis etc. DMV Registrations of vehicles Recall All major OEMs Wired into auto operations Down to the level of customer specific definitions of segments, variants, competitors, territories, … |
| MOBILITY GLOBAL Agenda CORE STRATEGIC ASSETS KEY GROWTH DRIVERS INTRODUCTION TO B2B SOLUTIONS 44 |
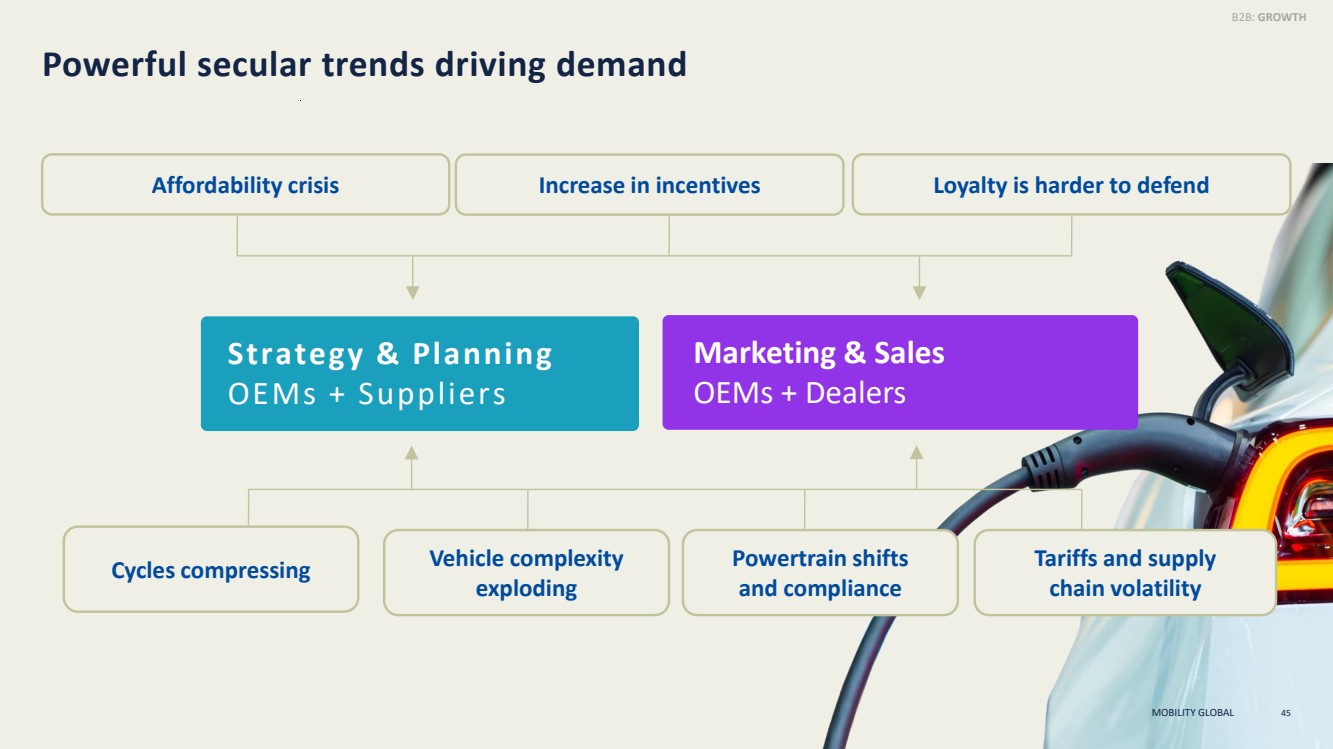
| MOBILITY GLOBAL Powerful secular trends driving demand 45 Marketing & Sales OEMs + Dealers Strategy & Planning OEMs + Suppliers Affordability crisis Increase in incentives Loyalty is harder to defend Powertrain shifts and compliance Tariffs and supply chain volatility Cycles compressing Vehicle complexity exploding MOBILITY GLOBAL B2B: GROWTH |
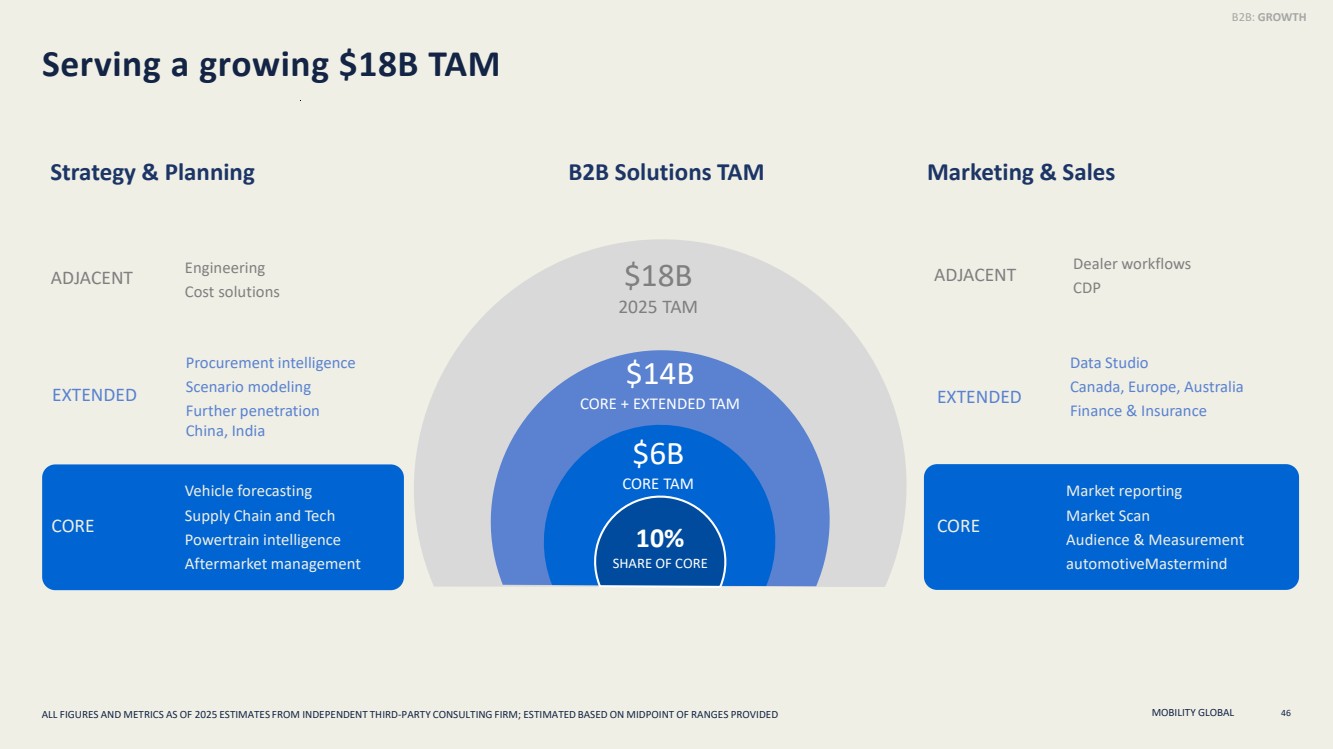
| MOBILITY GLOBAL B2B: GROWTH ADJACENT Engineering Cost solutions ADJACENT Dealer workflows CDP EXTENDED Data Studio Canada, Europe, Australia Finance & Insurance EXTENDED Procurement intelligence Scenario modeling Further penetration China, India Serving a growing $18B TAM Strategy & Planning Marketing & Sales CORE Vehicle forecasting Supply Chain and Tech Powertrain intelligence Aftermarket management B2B Solutions TAM 46 $18B 2025 TAM $6B CORE TAM 10% SHARE OF CORE $14B CORE + EXTENDED TAM ALL FIGURES AND METRICS AS OF 2025 ESTIMATES FROM INDEPENDENT THIRD-PARTY CONSULTING FIRM; ESTIMATED BASED ON MIDPOINT OF RANGES PROVIDED CORE Market reporting Market Scan Audience & Measurement automotiveMastermind |
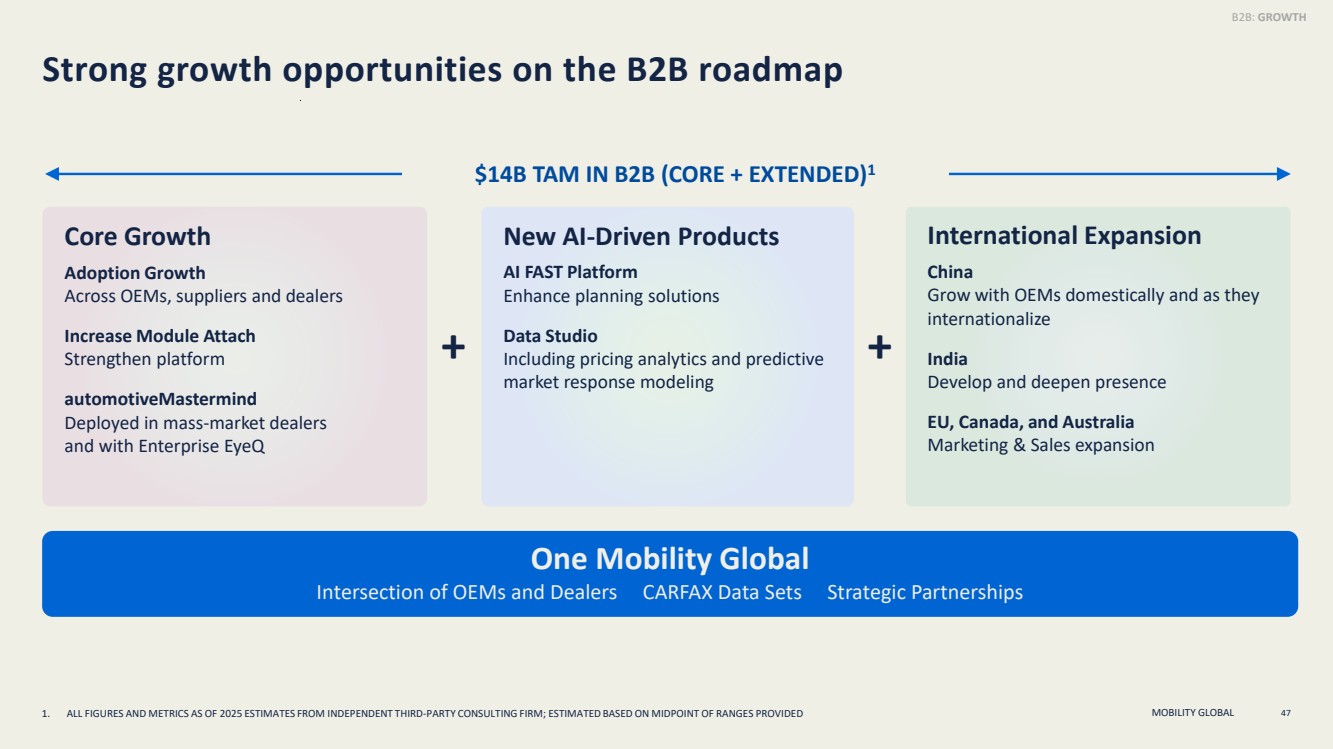
| MOBILITY GLOBAL Strong growth opportunities on the B2B roadmap 47 International Expansion China Grow with OEMs domestically and as they internationalize India Develop and deepen presence EU, Canada, and Australia Marketing & Sales expansion Core Growth Adoption Growth Across OEMs, suppliers and dealers Increase Module Attach Strengthen platform automotiveMastermind Deployed in mass-market dealers and with Enterprise EyeQ New AI-Driven Products AI FAST Platform Enhance planning solutions Data Studio Including pricing analytics and predictive market response modeling One Mobility Global Intersection of OEMs and Dealers CARFAX Data Sets Strategic Partnerships + + $14B TAM IN B2B (CORE + EXTENDED)1 1. ALL FIGURES AND METRICS AS OF 2025 ESTIMATES FROM INDEPENDENT THIRD-PARTY CONSULTING FIRM; ESTIMATED BASED ON MIDPOINT OF RANGES PROVIDED B2B: GROWTH |
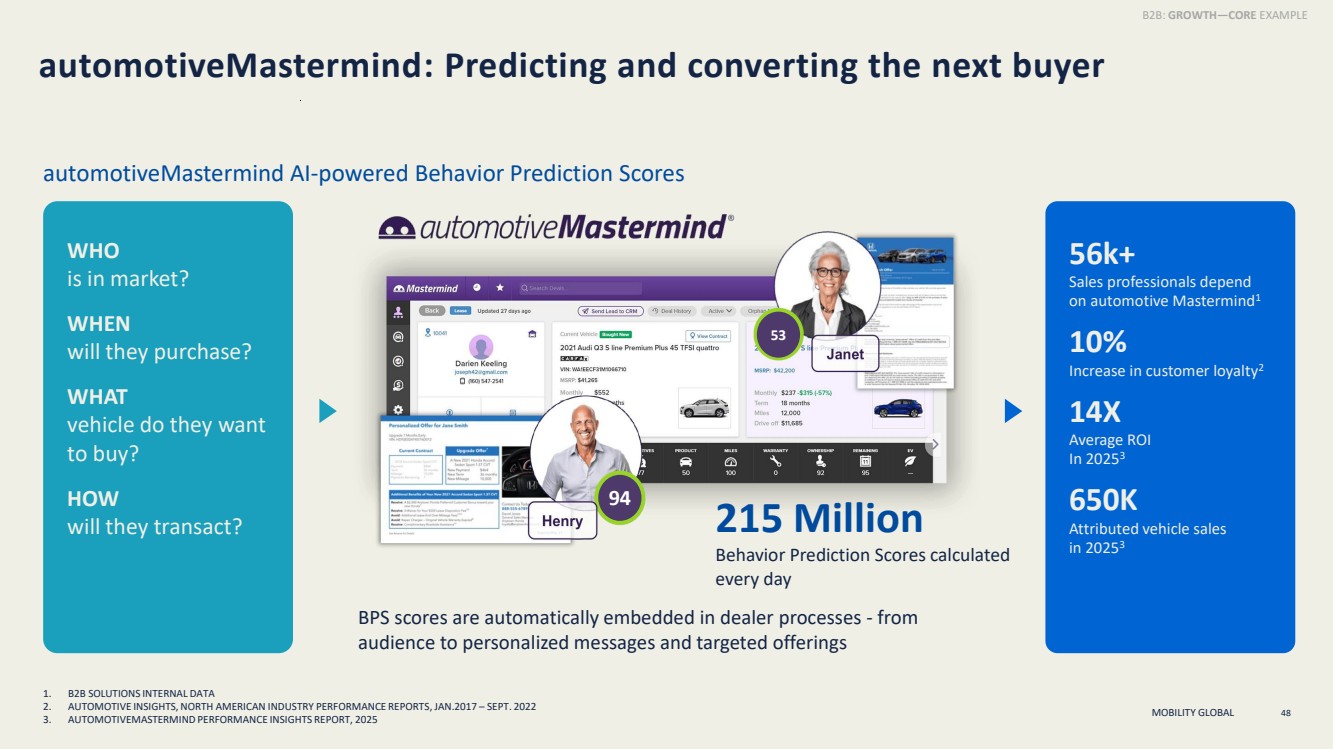
| MOBILITY GLOBAL automotiveMastermind AI-powered Behavior Prediction Scores automotiveMastermind: Predicting and converting the next buyer 215 Million Behavior Prediction Scores calculated every day BPS scores are automatically embedded in dealer processes - from audience to personalized messages and targeted offerings WHO is in market? WHEN will they purchase? WHAT vehicle do they want to buy? HOW will they transact? 56k+ Sales professionals depend on automotive Mastermind1 10% Increase in customer loyalty2 14X Average ROI In 20253 650K Attributed vehicle sales in 20253 48 B2B: GROWTH—CORE EXAMPLE 94 53 1. B2B SOLUTIONS INTERNAL DATA 2. AUTOMOTIVE INSIGHTS, NORTH AMERICAN INDUSTRY PERFORMANCE REPORTS, JAN.2017 – SEPT. 2022 3. AUTOMOTIVEMASTERMIND PERFORMANCE INSIGHTS REPORT, 2025 |
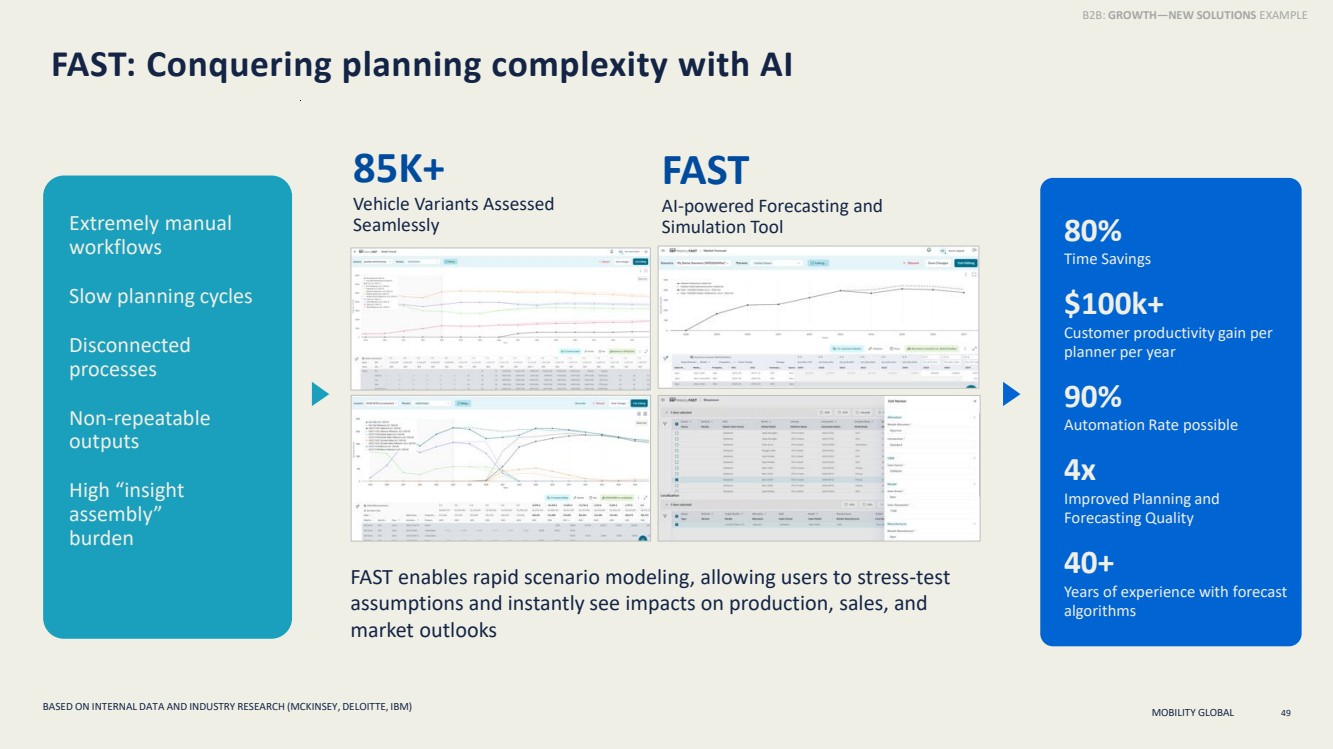
| MOBILITY GLOBAL FAST: Conquering planning complexity with AI 85K+ Vehicle Variants Assessed Seamlessly FAST enables rapid scenario modeling, allowing users to stress-test assumptions and instantly see impacts on production, sales, and market outlooks FAST AI-powered Forecasting and Simulation Tool 49 B2B: GROWTH—NEW SOLUTIONS EXAMPLE Extremely manual workflows Slow planning cycles Disconnected processes Non-repeatable outputs High “insight assembly” burden 80% Time Savings $100k+ Customer productivity gain per planner per year 90% Automation Rate possible 4x Improved Planning and Forecasting Quality 40+ Years of experience with forecast algorithms BASED ON INTERNAL DATA AND INDUSTRY RESEARCH (MCKINSEY, DELOITTE, IBM) |
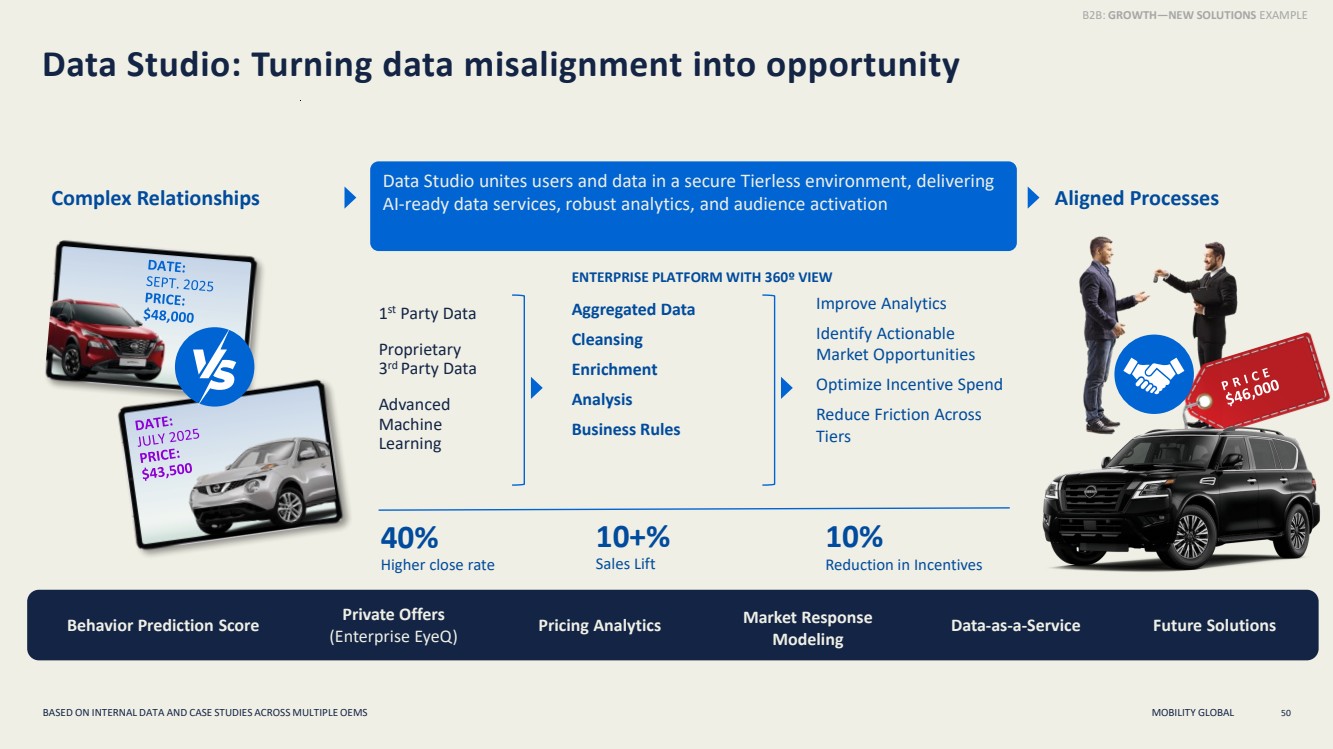
| MOBILITY GLOBAL Data Studio unites users and data in a secure Tierless environment, delivering AI-ready data services, robust analytics, and audience activation Data Studio: Turning data misalignment into opportunity 50 Complex Relationships Aligned Processes Improve Analytics Identify Actionable Market Opportunities Optimize Incentive Spend Reduce Friction Across Tiers Aggregated Data Cleansing Enrichment Analysis Business Rules 1 st Party Data Proprietary 3 rd Party Data Advanced Machine Learning Private Offers (Enterprise EyeQ) Behavior Prediction Score Pricing Analytics Data-as-a-Service Market Response Modeling Future Solutions 10+% Sales Lift 40% Higher close rate 10% Reduction in Incentives B2B: GROWTH—NEW SOLUTIONS EXAMPLE ENTERPRISE PLATFORM WITH 360º VIEW BASED ON INTERNAL DATA AND CASE STUDIES ACROSS MULTIPLE OEMS |
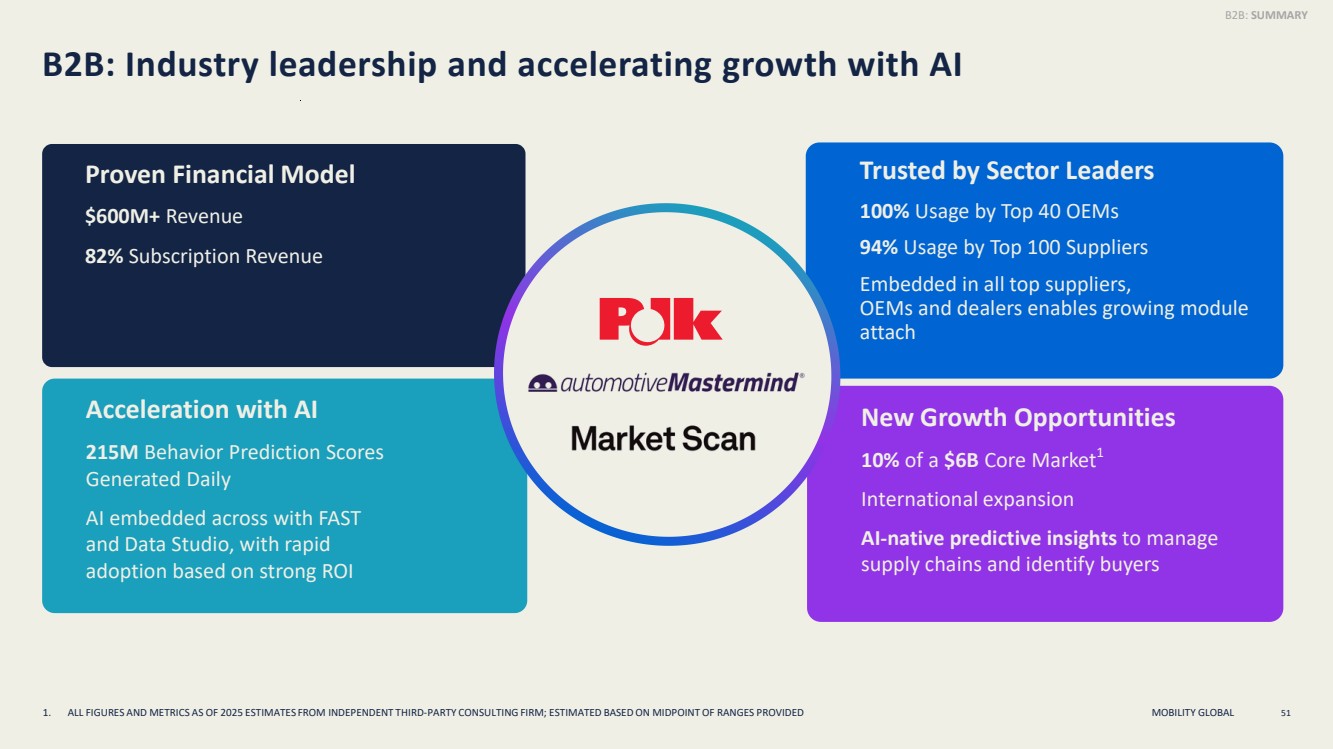
| MOBILITY GLOBAL Trusted by Sector Leaders 100% Usage by Top 40 OEMs 94% Usage by Top 100 Suppliers Embedded in all top suppliers, OEMs and dealers enables growing module attach Proven Financial Model $600M+ Revenue 82% Subscription Revenue Acceleration with AI 215M Behavior Prediction Scores Generated Daily AI embedded across with FAST and Data Studio, with rapid adoption based on strong ROI New Growth Opportunities 10% of a $6B Core Market1 International expansion AI-native predictive insights to manage supply chains and identify buyers B2B: Industry leadership and accelerating growth with AI 51 B2B: SUMMARY 1. ALL FIGURES AND METRICS AS OF 2025 ESTIMATES FROM INDEPENDENT THIRD-PARTY CONSULTING FIRM; ESTIMATED BASED ON MIDPOINT OF RANGES PROVIDED |
| Change background color → Right click → Format Background → Fill → Solid Fill → Color → Select color MOBILITY GLOBAL BREAK 52 |

| MOBILITY GLOBAL MOBILITY GLOBAL 53 |
| MOBILITY GLOBAL CARFAX Scott Fredericks President, CARFAX 54 |
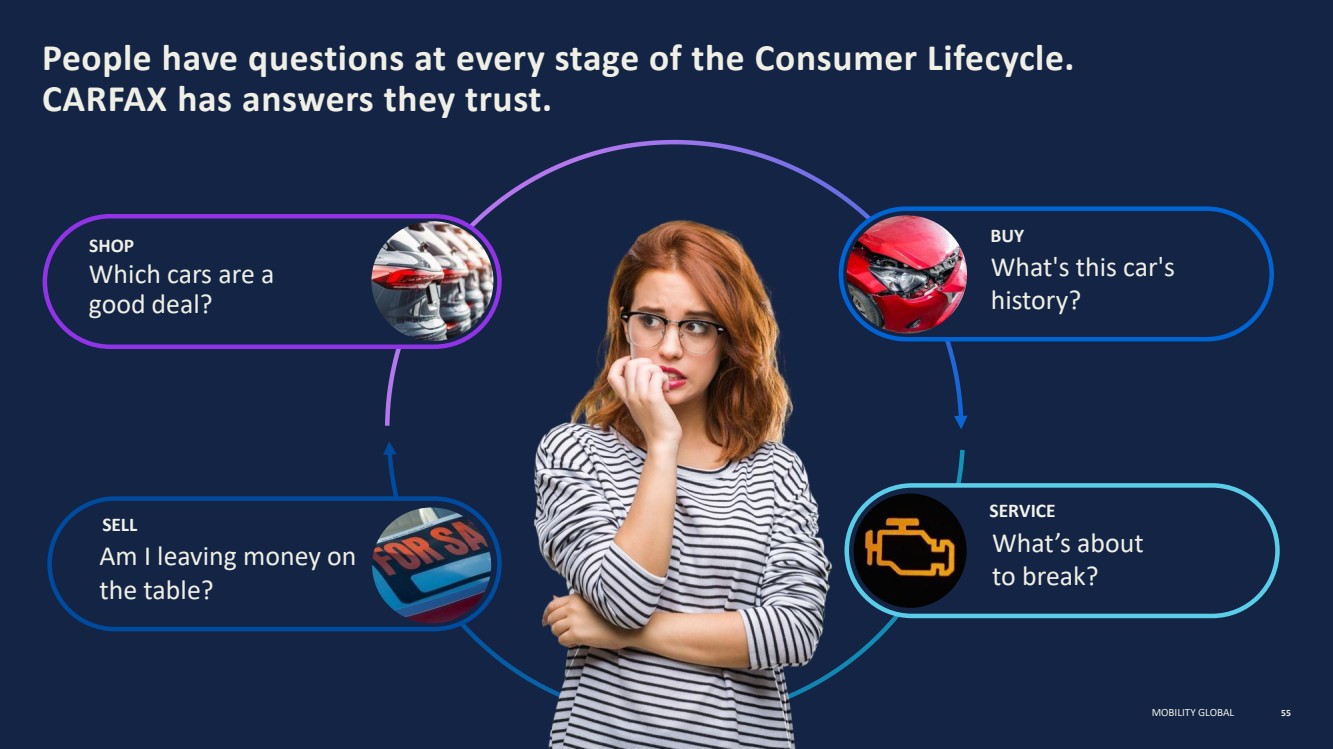
| MOBILITY GLOBAL People have questions at every stage of the Consumer Lifecycle. CARFAX has answers they trust. 55 Am I leaving money on the table? Which cars are a good deal? What’s about to break? What's this car's history? BUY SERVICE SHOP SELL |
| MOBILITY GLOBAL CORE STRATEGIC ASSETS KEY GROWTH DRIVERS INTRODUCTION TO CARFAX Agenda 56 |
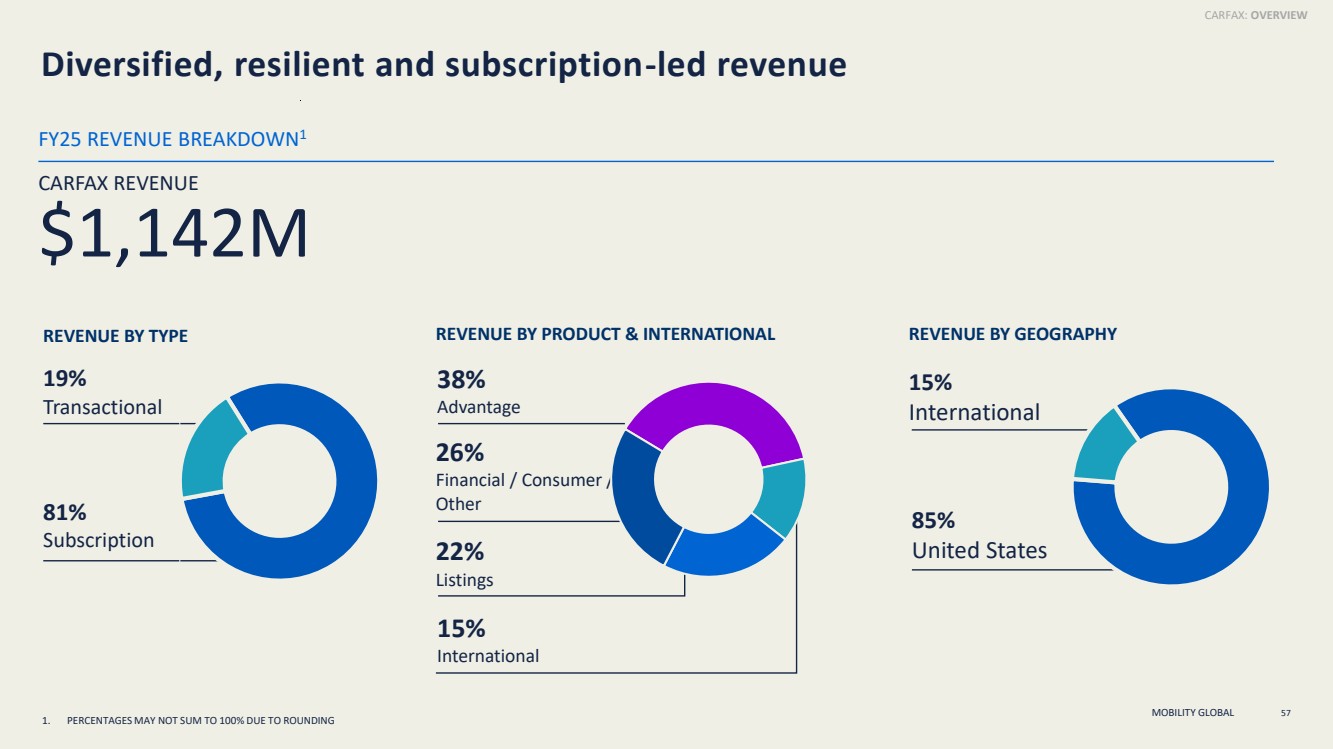
| MOBILITY GLOBAL Diversified, resilient and subscription-led revenue REVENUE BY TYPE 81% Subscription 19% Transactional REVENUE BY GEOGRAPHY 85% United States 15% International REVENUE BY PRODUCT & INTERNATIONAL 38% Advantage 22% Listings 26% Financial / Consumer / Other 57 1. PERCENTAGES MAY NOT SUM TO 100% DUE TO ROUNDING 15% International CARFAX: OVERVIEW FY25 REVENUE BREAKDOWN1 CARFAX REVENUE $1,142M |
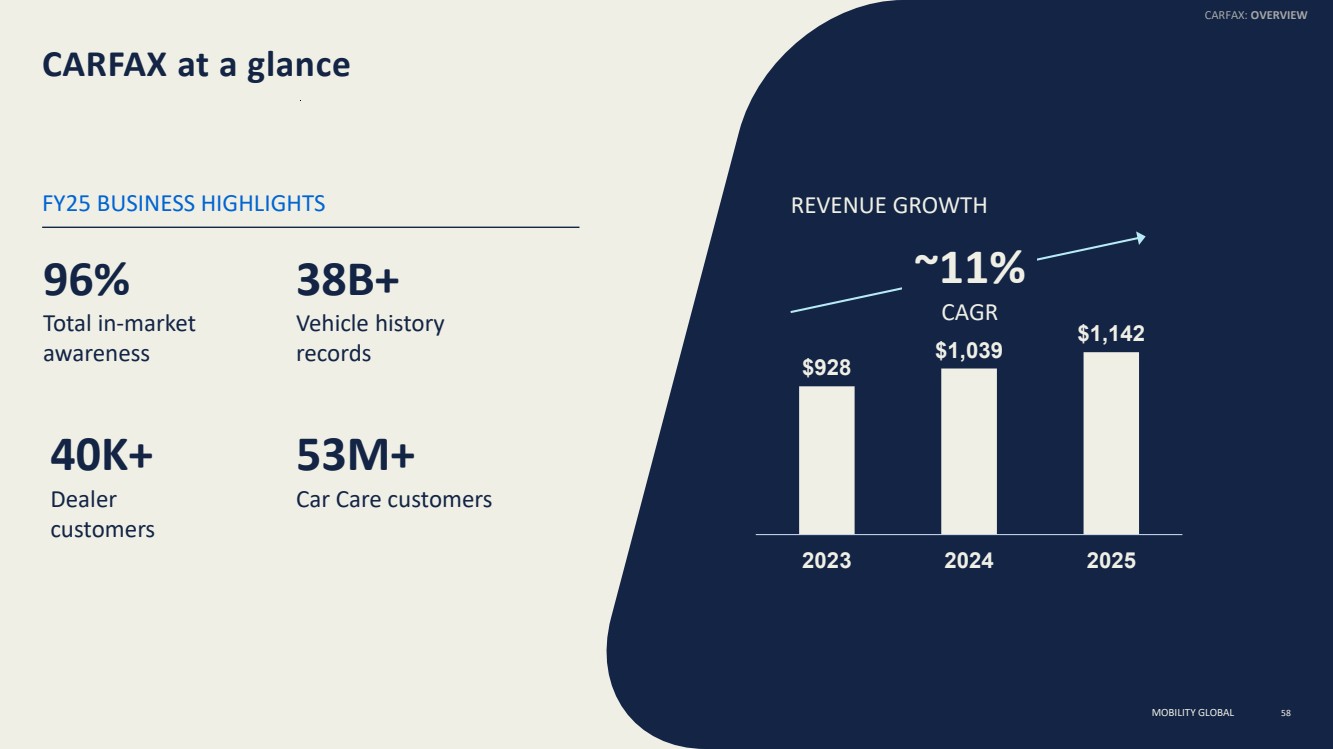
| MOBILITY GLOBAL $928 $1,039 $1,142 2023 2024 2025 CARFAX at a glance REVENUE GROWTH ~11% CAGR 58 96% Total in-market awareness 38B+ Vehicle history records 40K+ Dealer customers 53M+ Car Care customers FY25 BUSINESS HIGHLIGHTS CARFAX: OVERVIEW MOBILITY GLOBAL |
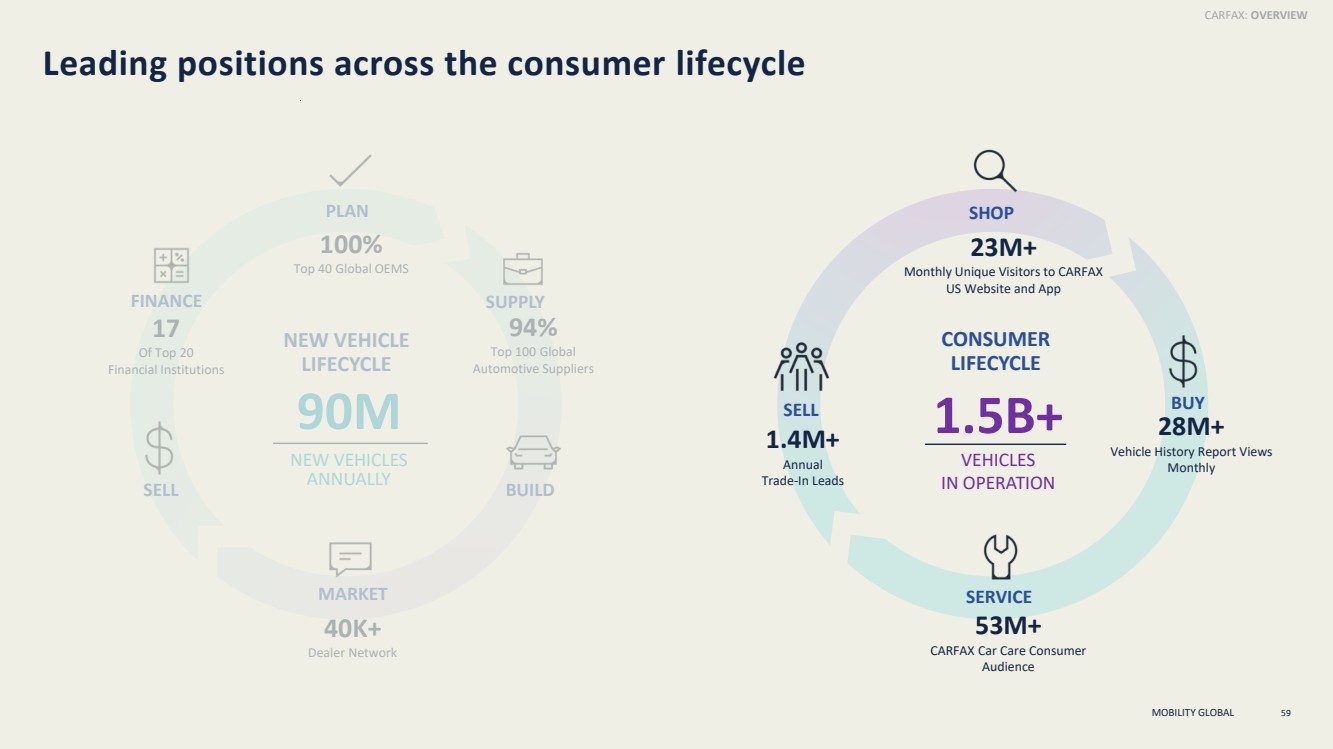
| MOBILITY GLOBAL Leading positions across the consumer lifecycle 59 SHOP BUY SERVICE SELL 23M+ Monthly Unique Visitors to CARFAX US Website and App 1.4M+ Annual Trade-In Leads 28M+ Vehicle History Report Views Monthly 53M+ CARFAX Car Care Consumer Audience SUPPLY 94% Top 100 Global Automotive Suppliers MARKET 40K+ Dealer Network BUILD FINANCE 17 Of Top 20 Financial Institutions SELL PLAN 1.5B+ VEHICLES IN OPERATION 100% Top 40 Global OEMS CONSUMER LIFECYCLE NEW VEHICLE LIFECYCLE 90M NEW VEHICLES ANNUALLY CARFAX: OVERVIEW |
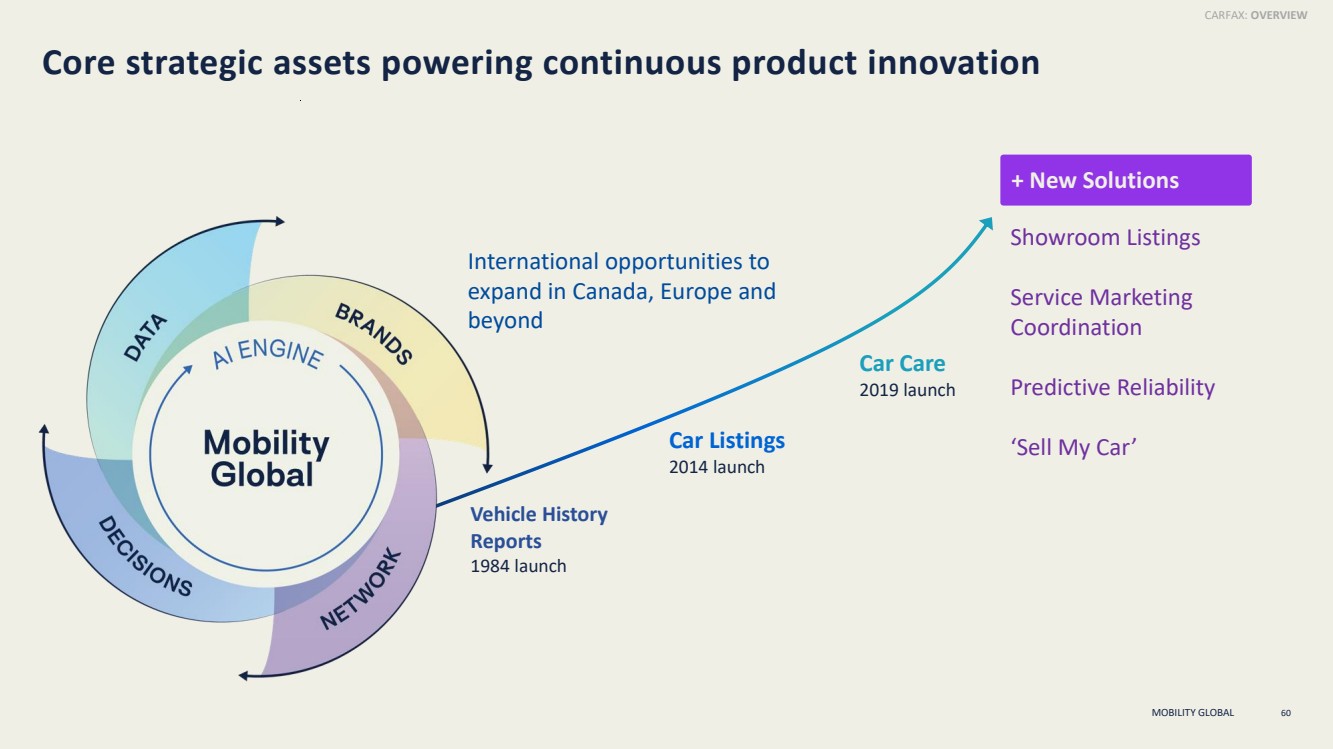
| MOBILITY GLOBAL International opportunities to expand in Canada, Europe and beyond Core strategic assets powering continuous product innovation + New Solutions 60 CARFAX: OVERVIEW Car Listings 2014 launch Car Care 2019 launch Showroom Listings Service Marketing Coordination Predictive Reliability ‘Sell My Car’ Vehicle History Reports 1984 launch |
| MOBILITY GLOBAL CORE STRATEGIC ASSETS KEY GROWTH DRIVERS INTRODUCTION TO CARFAX Agenda 61 |
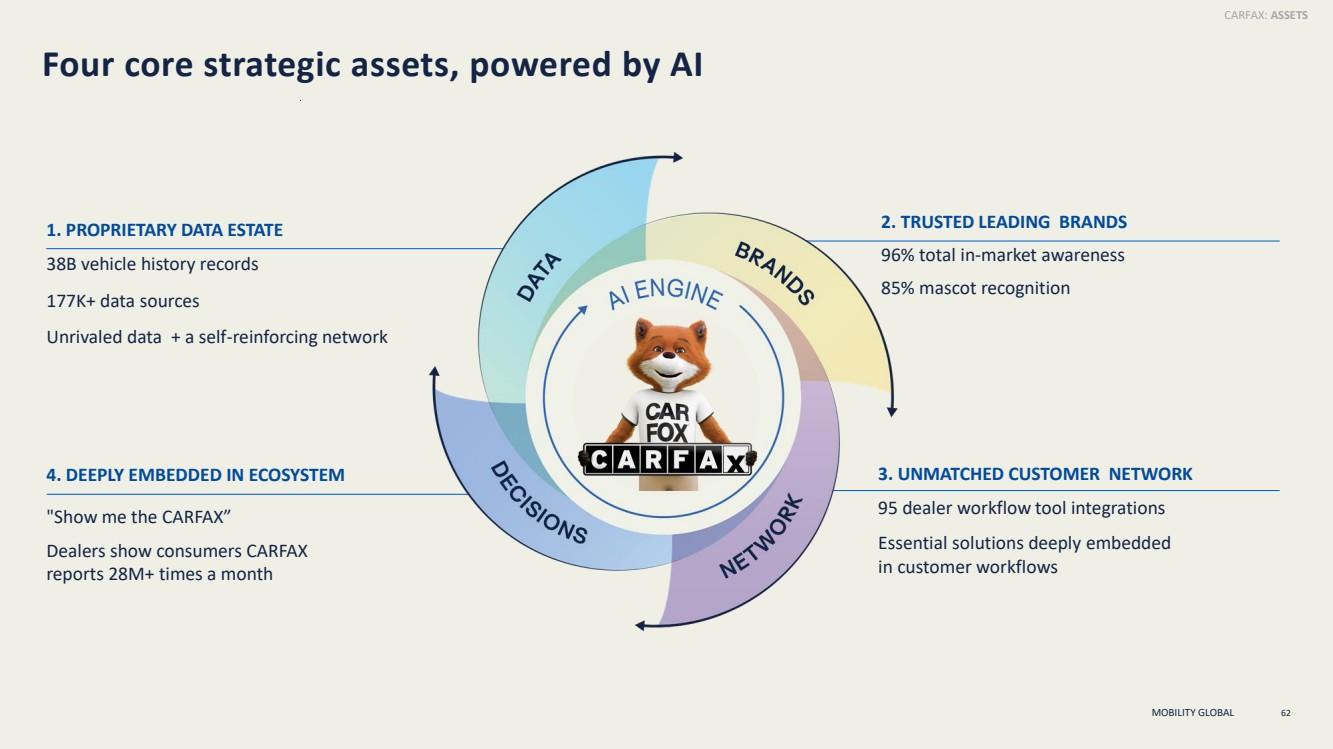
| MOBILITY GLOBAL 4. DEEPLY EMBEDDED IN ECOSYSTEM "Show me the CARFAX” Dealers show consumers CARFAX reports 28M+ times a month Four core strategic assets, powered by AI 62 3. UNMATCHED CUSTOMER NETWORK 95 dealer workflow tool integrations Essential solutions deeply embedded in customer workflows 2. TRUSTED LEADING BRANDS 96% total in-market awareness 85% mascot recognition 1. PROPRIETARY DATA ESTATE 38B vehicle history records 177K+ data sources Unrivaled data + a self-reinforcing network CARFAX: ASSETS |
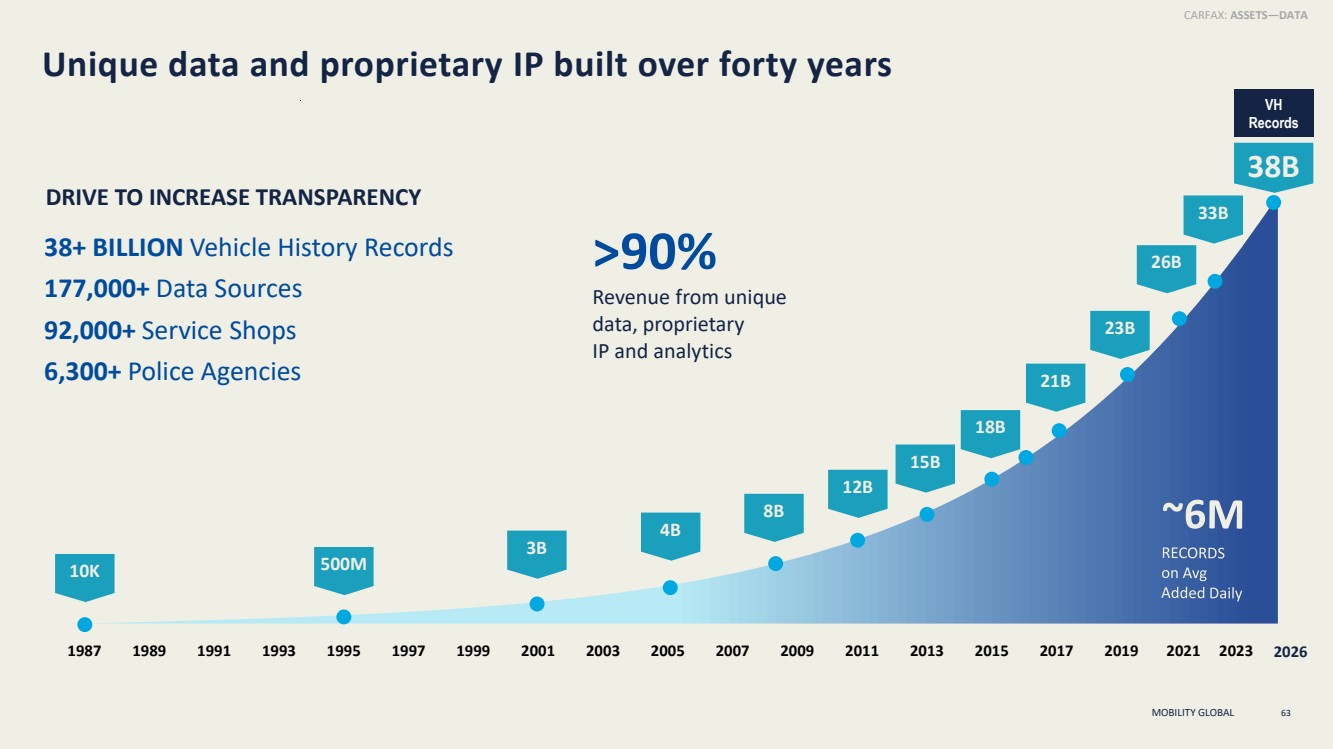
| MOBILITY GLOBAL Unique data and proprietary IP built over forty years 1987 1989 1991 1993 1995 1997 1999 2001 2003 2005 2007 2009 2011 2013 2015 2017 2019 2021 2023 10K 500M 3B 8B 12B 15B 18B 21B 23B 4B 26B 38B VH Records 33B 38+ BILLION Vehicle History Records 177,000+ Data Sources 92,000+ Service Shops 6,300+ Police Agencies DRIVE TO INCREASE TRANSPARENCY 2026 >90% Revenue from unique data, proprietary IP and analytics 63 CARFAX: ASSETS—DATA |
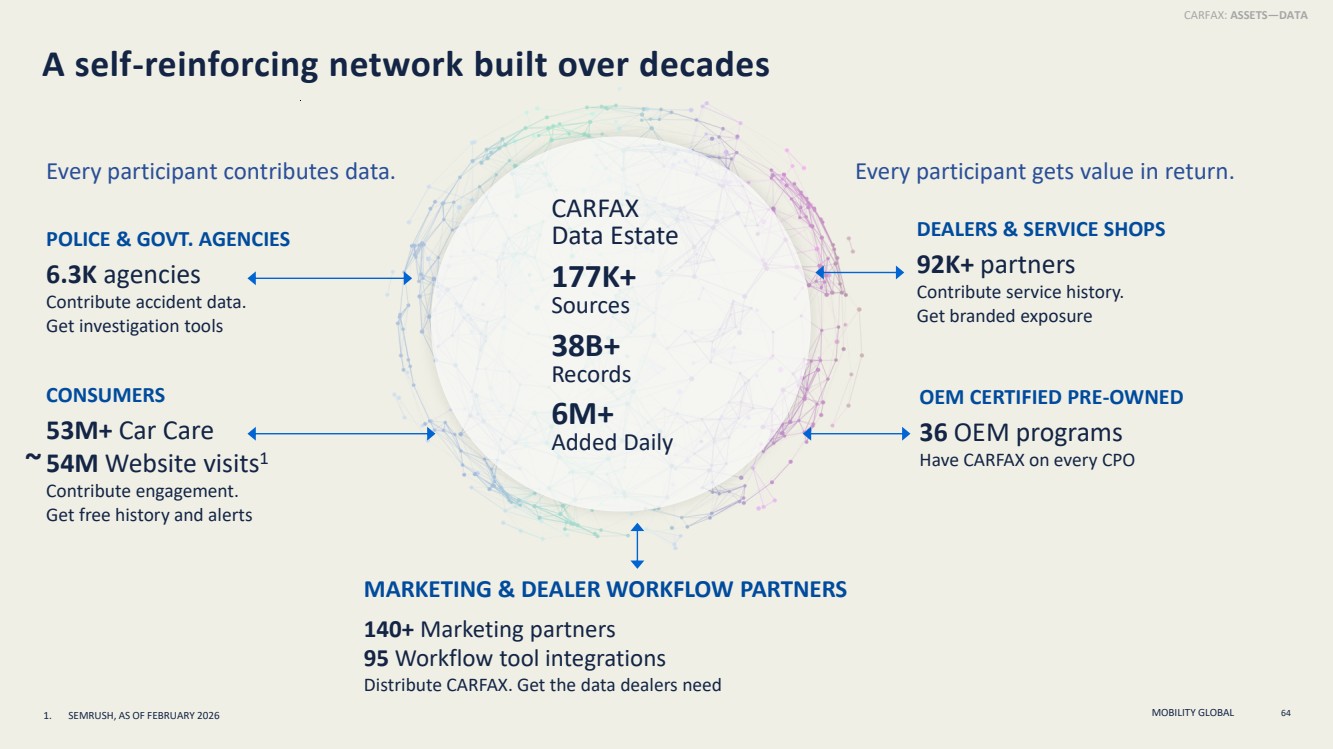
| MOBILITY GLOBAL Every participant contributes data. A self-reinforcing network built over decades DEALERS & SERVICE SHOPS 92K+ partners Contribute service history. Get branded exposure POLICE & GOVT. AGENCIES 6.3K agencies Contribute accident data. Get investigation tools CONSUMERS 53M+ Car Care 54M Website visits1 Contribute engagement. Get free history and alerts OEM CERTIFIED PRE-OWNED 36 OEM programs Have CARFAX on every CPO MARKETING & DEALER WORKFLOW PARTNERS 140+ Marketing partners 95 Workflow tool integrations Distribute CARFAX. Get the data dealers need 64 CARFAX: ASSETS—DATA CARFAX Data Estate 177K+ Sources 38B+ Records 6M+ Added Daily Every participant gets value in return. ~ 1. SEMRUSH, AS OF FEBRUARY 2026 |
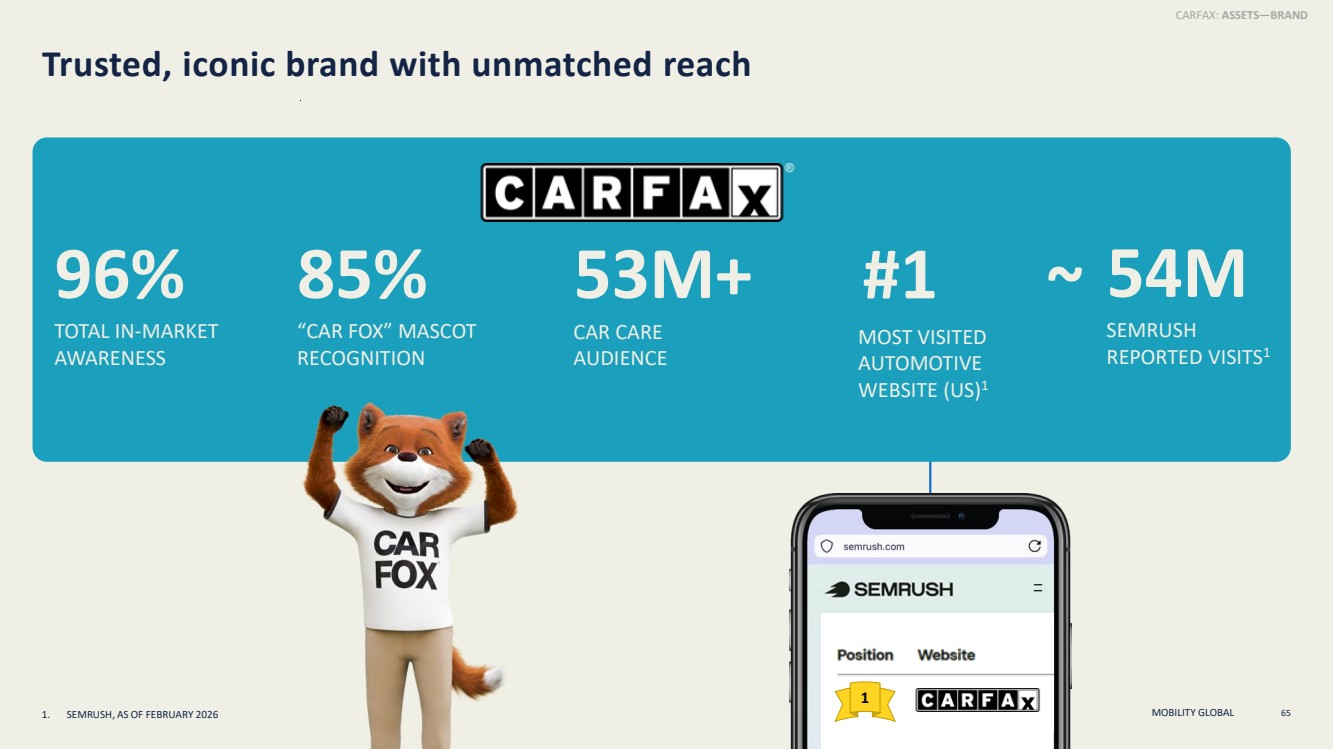
| MOBILITY GLOBAL Trusted, iconic brand with unmatched reach 96% TOTAL IN-MARKET AWARENESS 85% “CAR FOX” MASCOT RECOGNITION 53M+ CAR CARE AUDIENCE 54M SEMRUSH REPORTED VISITS1 #1 MOST VISITED AUTOMOTIVE WEBSITE (US)1 65 1 ~ CARFAX: ASSETS—BRAND 1. SEMRUSH, AS OF FEBRUARY 2026 |
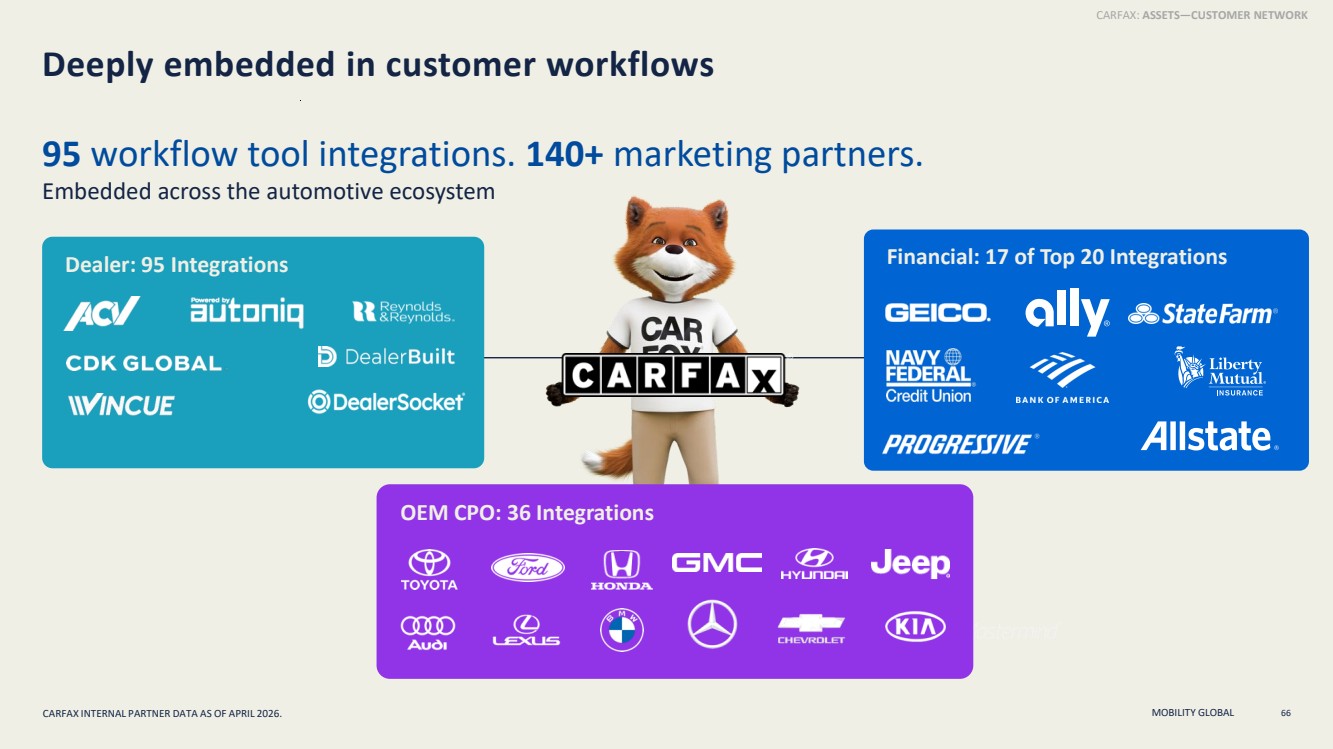
| MOBILITY GLOBAL Deeply embedded in customer workflows Dealer: 95 Integrations Financial: 17 of Top 20 Integrations OEM CPO: 36 Integrations 66 95 workflow tool integrations. 140+ marketing partners. Embedded across the automotive ecosystem CARFAX: ASSETS—CUSTOMER NETWORK CARFAX INTERNAL PARTNER DATA AS OF APRIL 2026. |
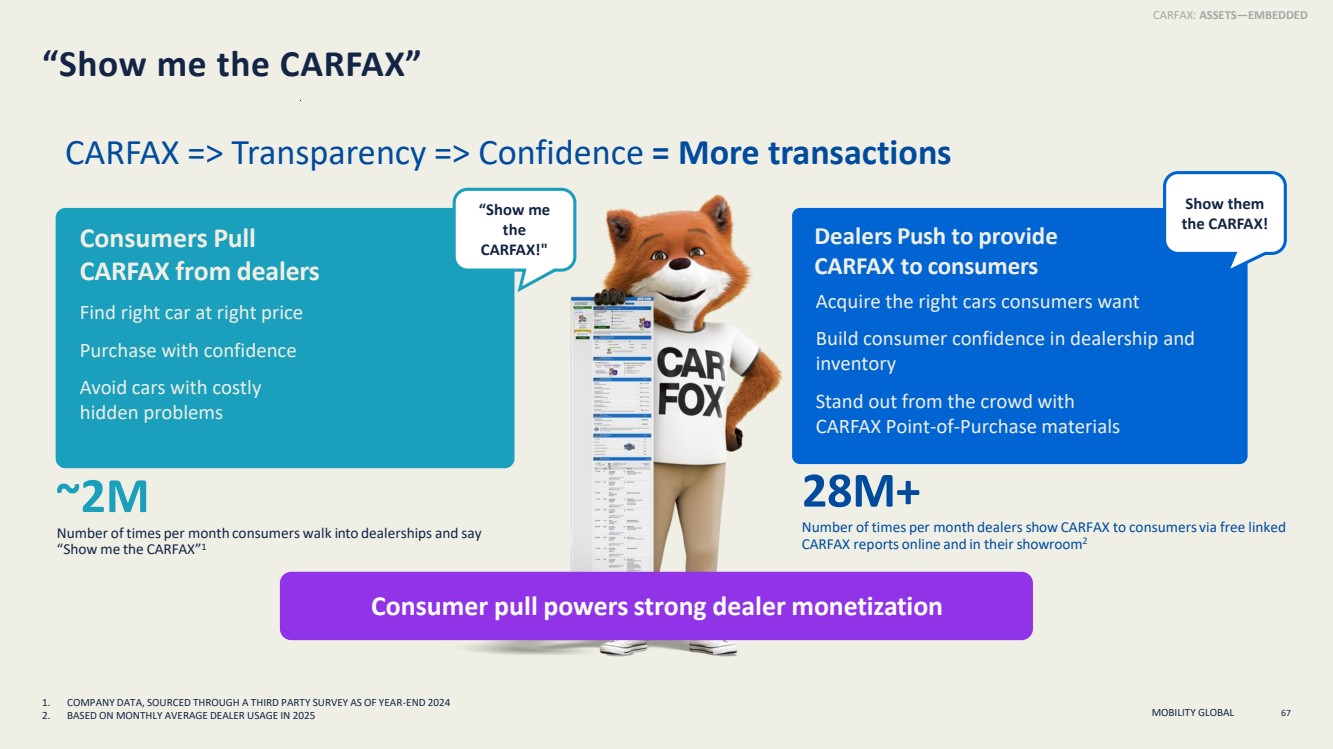
| MOBILITY GLOBAL “Show me the CARFAX” Consumers Pull CARFAX from dealers Find right car at right price Purchase with confidence Avoid cars with costly hidden problems Dealers Push to provide CARFAX to consumers Acquire the right cars consumers want Build consumer confidence in dealership and inventory Stand out from the crowd with CARFAX Point-of-Purchase materials CARFAX => Transparency => Confidence = More transactions Consumer pull powersstrong dealer monetization 1. COMPANY DATA, SOURCED THROUGH A THIRD PARTY SURVEY AS OF YEAR-END 2024 2. BASED ON MONTHLY AVERAGE DEALER USAGE IN 2025 ~2M Number of times per month consumers walk into dealerships and say “Show me the CARFAX”1 28M+ Number of times per month dealers show CARFAX to consumers via free linked CARFAX reports online and in theirshowroom2 “Show me the CARFAX!" Show them the CARFAX! 67 CARFAX: ASSETS—EMBEDDED |
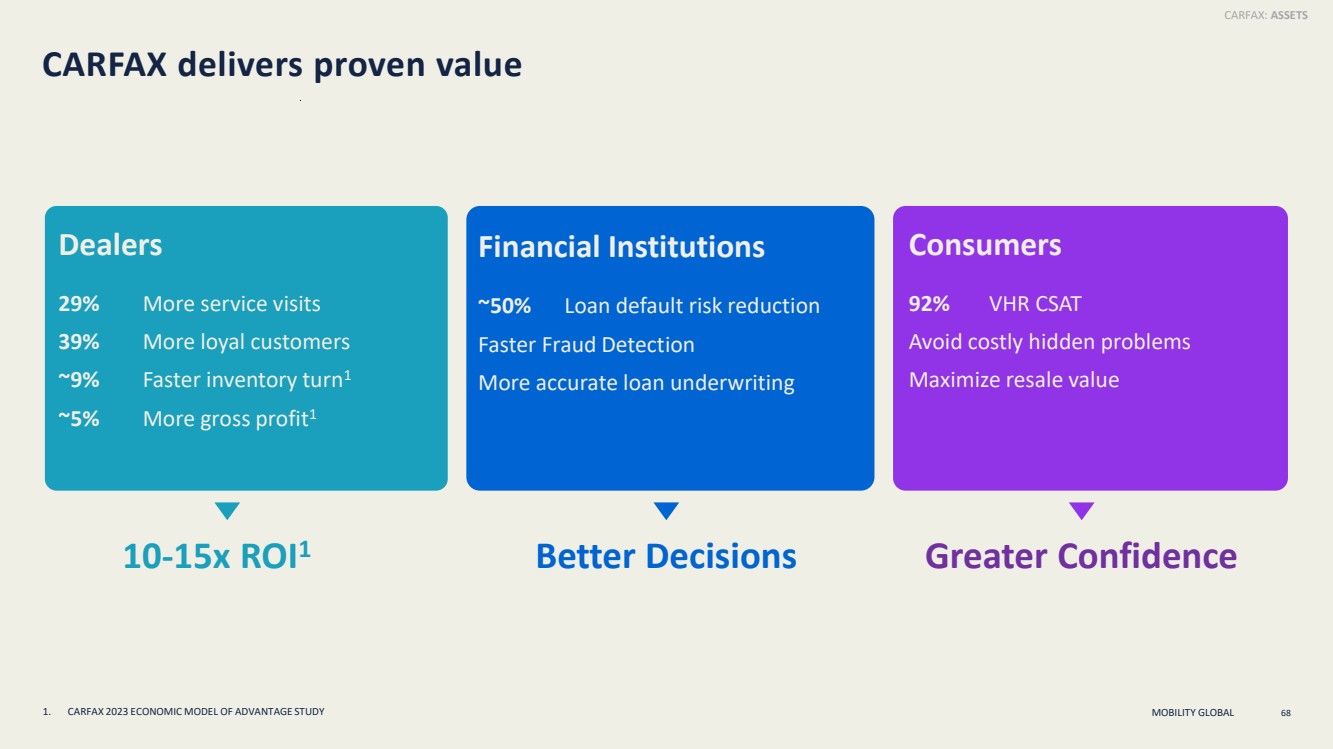
| MOBILITY GLOBAL CARFAX delivers proven value 10-15x ROI1 Better Decisions Greater Confidence Dealers 29% More service visits 39% More loyal customers ~9% Faster inventory turn1 ~5% More gross profit1 Financial Institutions ~50% Loan default risk reduction Faster Fraud Detection More accurate loan underwriting Consumers 92% VHR CSAT Avoid costly hidden problems Maximize resale value 1. CARFAX 2023 ECONOMIC MODEL OF ADVANTAGE STUDY 68 CARFAX: ASSETS |
| MOBILITY GLOBAL CORE STRATEGIC ASSETS KEY GROWTH DRIVERS INTRODUCTION TO CARFAX Agenda 69 |
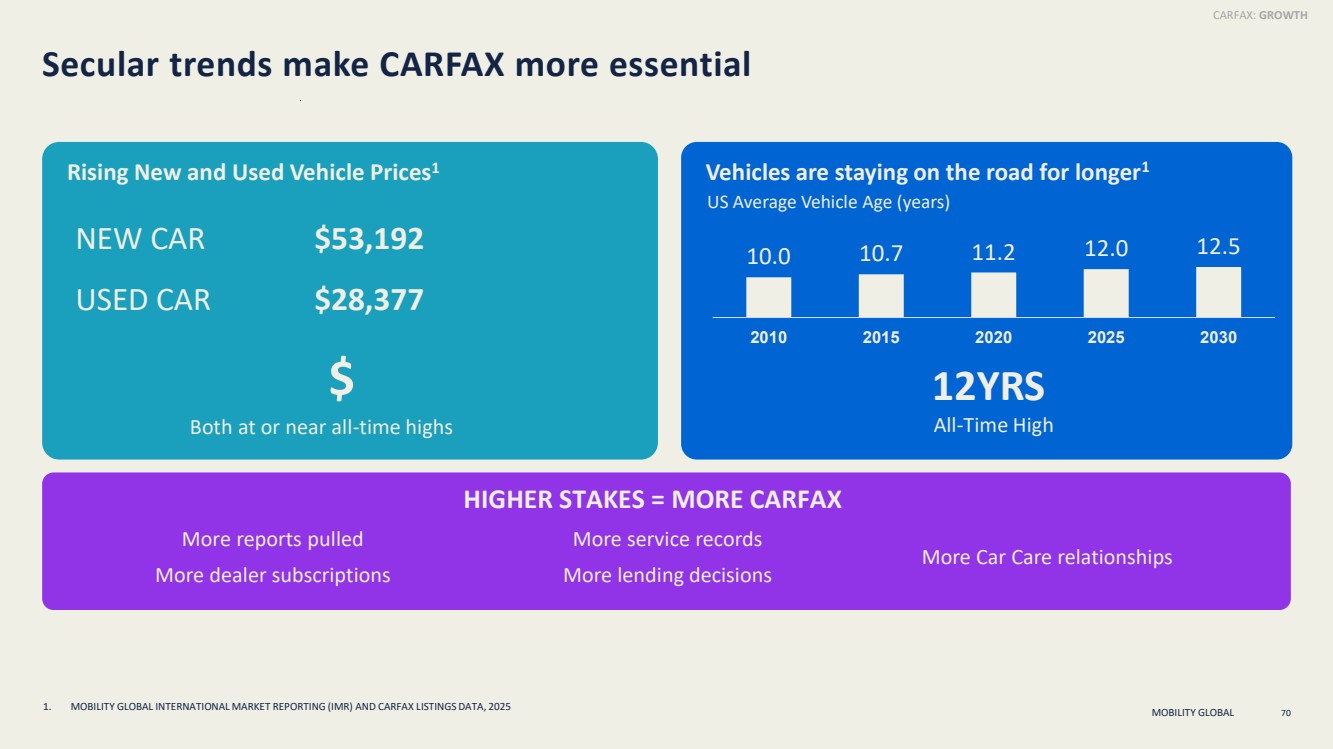
| MOBILITY GLOBAL Secular trends make CARFAX more essential HIGHER STAKES = MORE CARFAX More reports pulled More service records More Car Care relationships More dealer subscriptions More lending decisions Vehicles are staying on the road for longer1 Rising New and Used Vehicle Prices1 10.0 10.7 11.2 12.0 12.5 2010 2015 2020 2025 2030 US Average Vehicle Age (years) NEW CAR $53,192 USED CAR $28,377 Both at or near all-time highs $ All-Time High 12YRS 70 1. MOBILITY GLOBAL INTERNATIONAL MARKET REPORTING (IMR) AND CARFAX LISTINGS DATA, 2025 CARFAX: GROWTH |
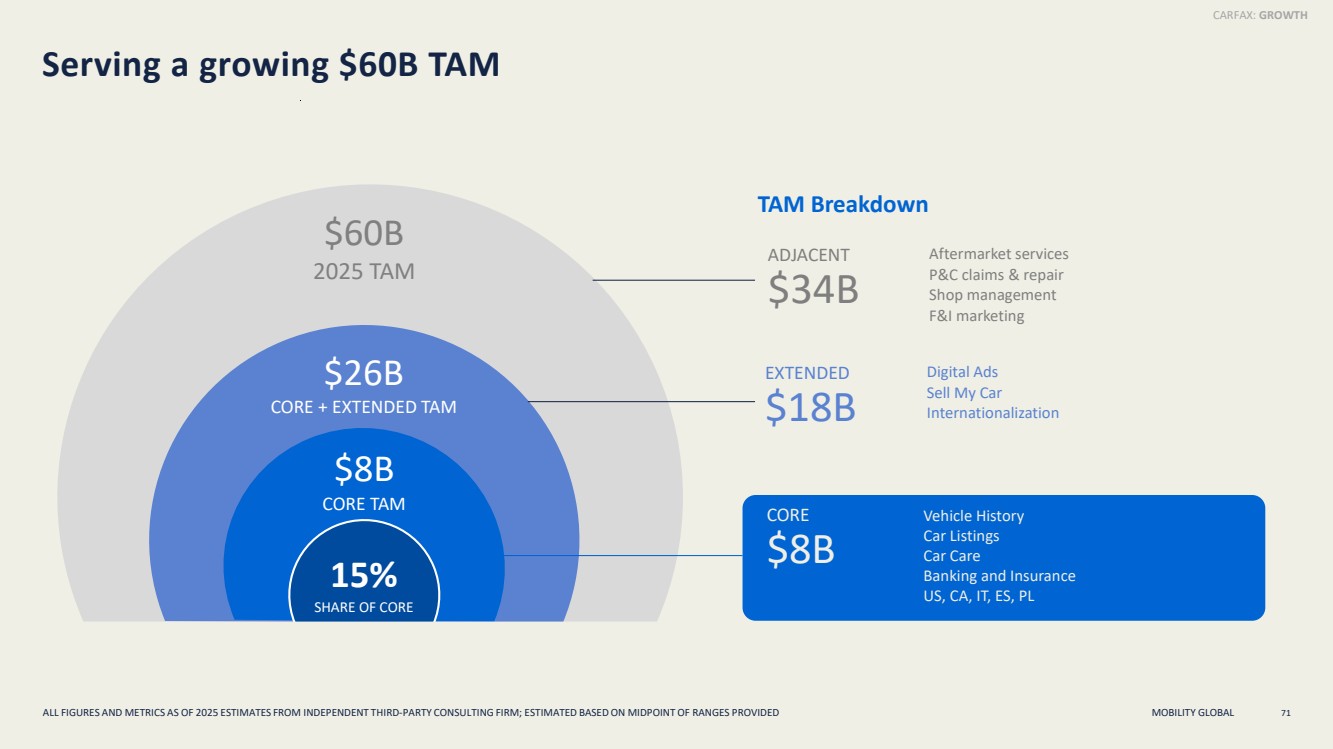
| MOBILITY GLOBAL Serving a growing $60B TAM $60B 2025 TAM TAM Breakdown EXTENDED $18B Digital Ads Sell My Car Internationalization 71 15% SHARE OF CORE $8B CORE TAM ALL FIGURES AND METRICS AS OF 2025 ESTIMATES FROM INDEPENDENT THIRD-PARTY CONSULTING FIRM; ESTIMATED BASED ON MIDPOINT OF RANGES PROVIDED $26B CORE + EXTENDED TAM ADJACENT $34B Aftermarket services P&C claims & repair Shop management F&I marketing CORE $8B Vehicle History Car Listings Car Care Banking and Insurance US, CA, IT, ES, PL CARFAX: GROWTH |
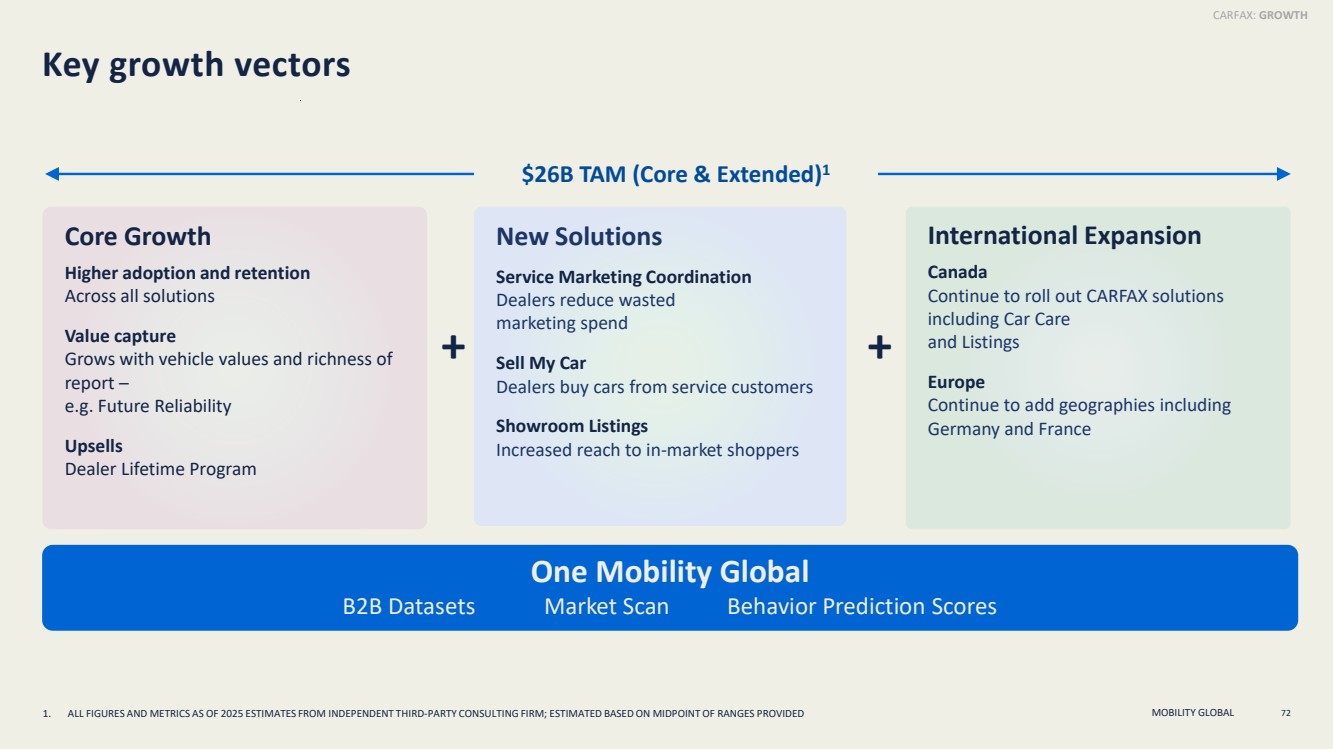
| MOBILITY GLOBAL Key growth vectors 72 International Expansion Canada Continue to roll out CARFAX solutions including Car Care and Listings Europe Continue to add geographies including Germany and France Core Growth Higher adoption and retention Across all solutions Value capture Grows with vehicle values and richness of report – e.g. Future Reliability Upsells Dealer Lifetime Program One Mobility Global B2B Datasets Market Scan Behavior Prediction Scores + + $26B TAM (Core & Extended)1 CARFAX: GROWTH 1. ALL FIGURES AND METRICS AS OF 2025 ESTIMATES FROM INDEPENDENT THIRD-PARTY CONSULTING FIRM; ESTIMATED BASED ON MIDPOINT OF RANGES PROVIDED New Solutions Service Marketing Coordination Dealers reduce wasted marketing spend Sell My Car Dealers buy cars from service customers Showroom Listings Increased reach to in-market shoppers |
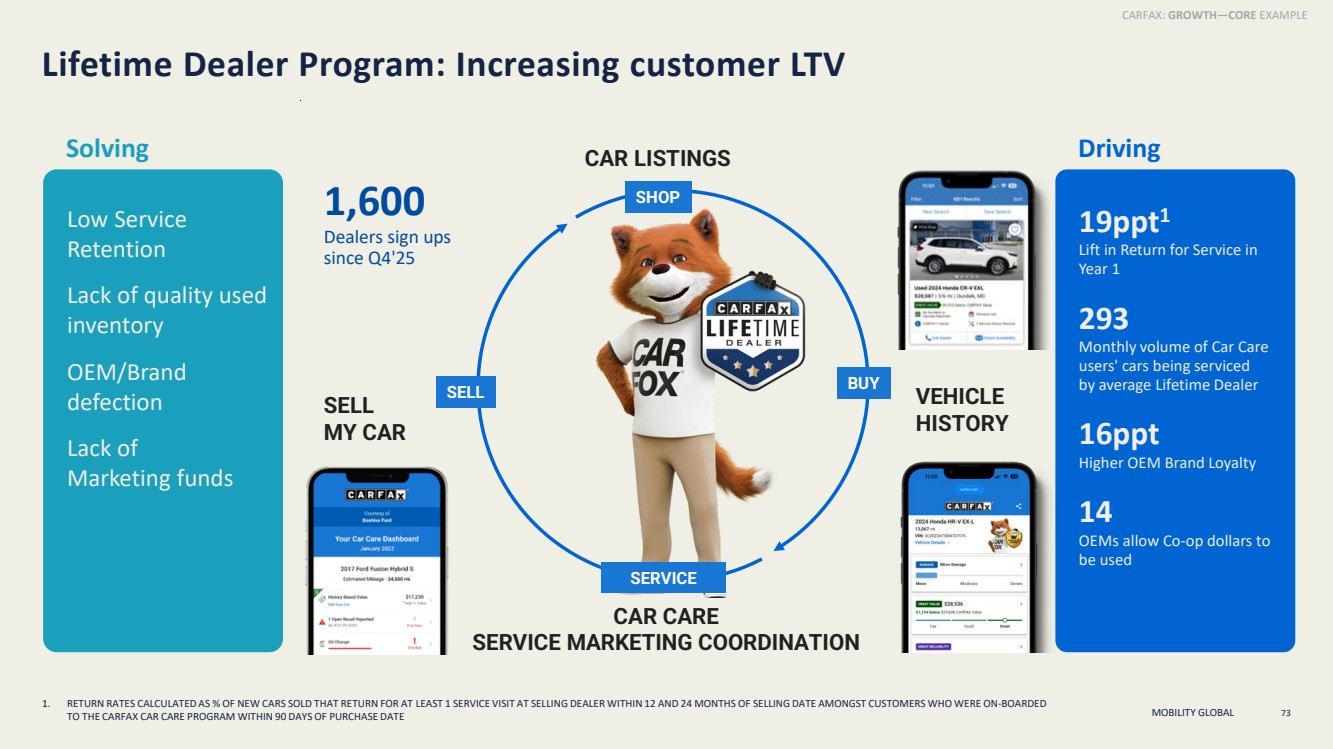
| MOBILITY GLOBAL Lifetime Dealer Program: Increasing customer LTV 293 Monthly volume of Car Care users' cars being serviced by average Lifetime Dealer 14 OEMs allow Co-op dollars to be used for Lifetime Dealer Program 19ppt Lift in Return for Service in Year 1 1,600 Dealers sign ups since Q4'25 Low Service Retention Lack of quality used inventory OEM/Brand defection Lack of Marketing funds Higher OEM Brand Loyalty 16ppt Solving Driving 19ppt1 Lift in Return for Service in Year 1 293 Monthly volume of Car Care users' cars being serviced by average Lifetime Dealer 16ppt Higher OEM Brand Loyalty 14 OEMs allow Co-op dollars to be used 73 SHOP BUY SERVICE SELL CAR LISTINGS VEHICLE HISTORY CAR CARE SERVICE MARKETING COORDINATION SELL MY CAR CARFAX: GROWTH—CORE EXAMPLE 1. RETURN RATES CALCULATED AS % OF NEW CARS SOLD THAT RETURN FOR AT LEAST 1 SERVICE VISIT AT SELLING DEALER WITHIN 12 AND 24 MONTHS OF SELLING DATE AMONGST CUSTOMERS WHO WERE ON-BOARDED TO THE CARFAX CAR CARE PROGRAM WITHIN 90 DAYS OF PURCHASE DATE |
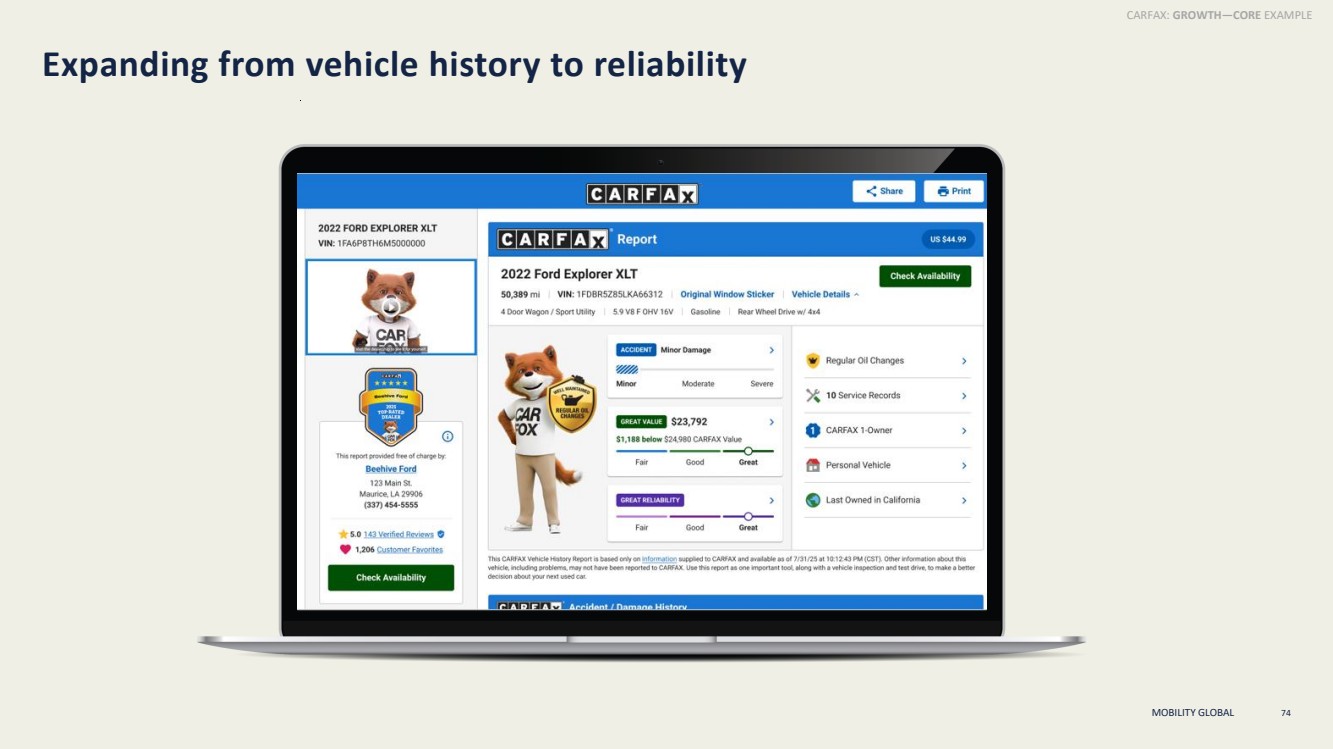
| MOBILITY GLOBAL Expanding from vehicle history to reliability 74 CARFAX: GROWTH—CORE EXAMPLE |
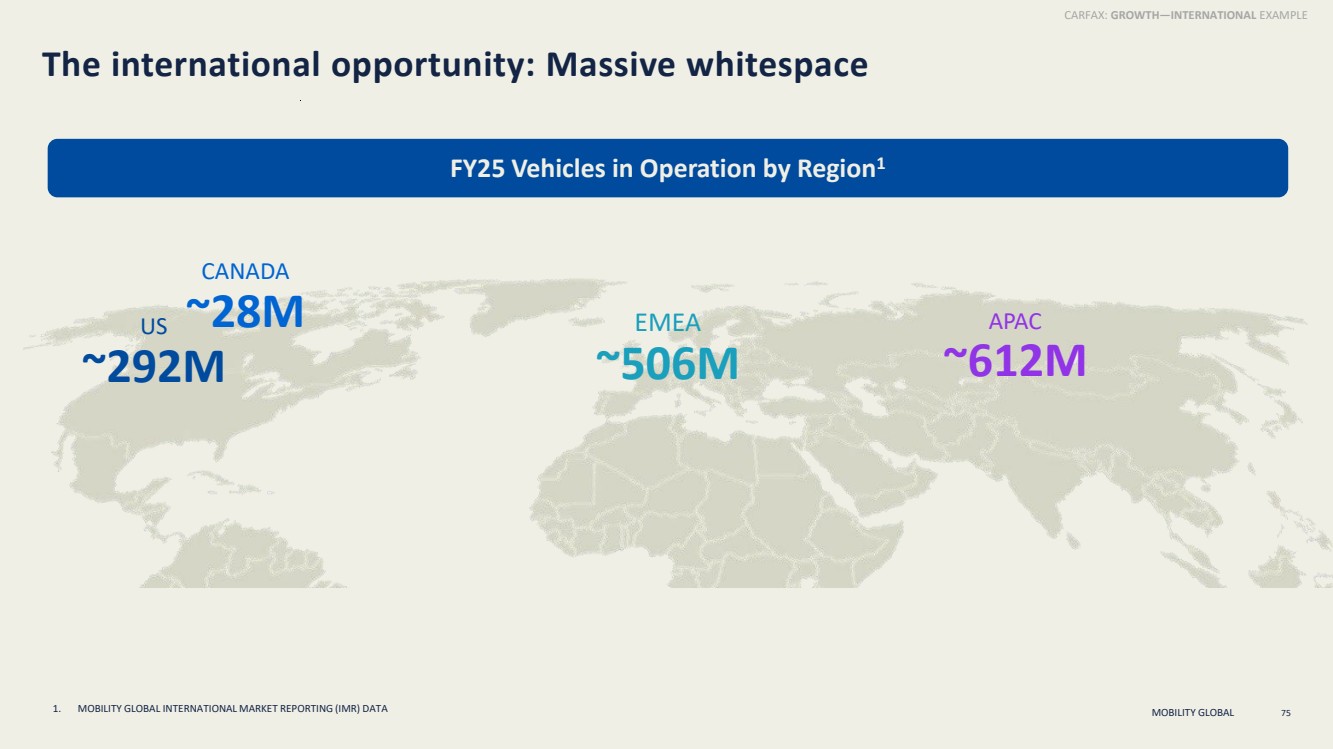
| MOBILITY GLOBAL The international opportunity: Massive whitespace FY25 Vehicles in Operation by Region1 US ~292M CANADA ~28M EMEA ~506M APAC ~612M 75 CARFAX: GROWTH—INTERNATIONAL EXAMPLE 1. MOBILITY GLOBAL INTERNATIONAL MARKET REPORTING (IMR) DATA |
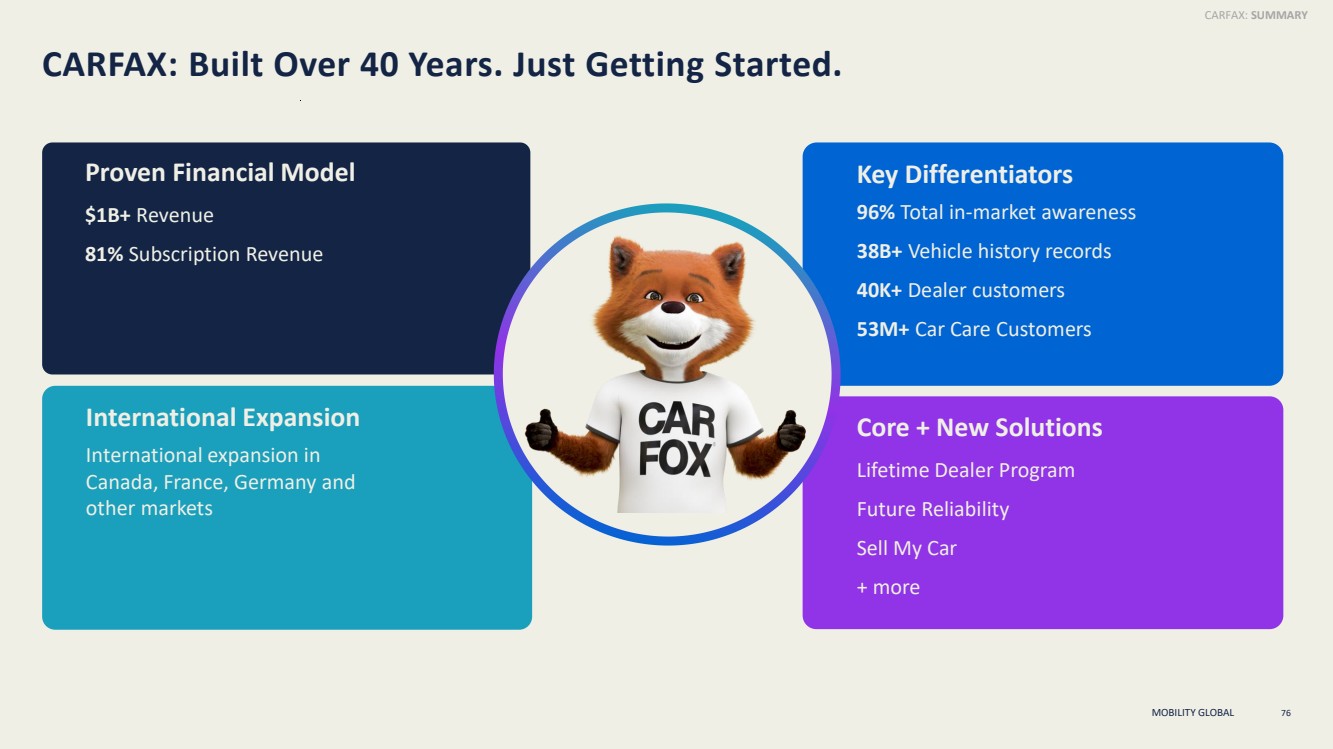
| MOBILITY GLOBAL Key Differentiators 96% Total in-market awareness 38B+ Vehicle history records 40K+ Dealer customers 53M+ Car Care Customers Proven Financial Model $1B+ Revenue 81% Subscription Revenue International Expansion International expansion in Canada, France, Germany and other markets Core + New Solutions Lifetime Dealer Program Future Reliability Sell My Car + more CARFAX: Built Over 40 Years. Just Getting Started. 76 CARFAX: SUMMARY |
| MOBILITY GLOBAL Data, Technology & AI Jeremy Morehouse Head of AI Office MOBILITY GLOBAL 77 |
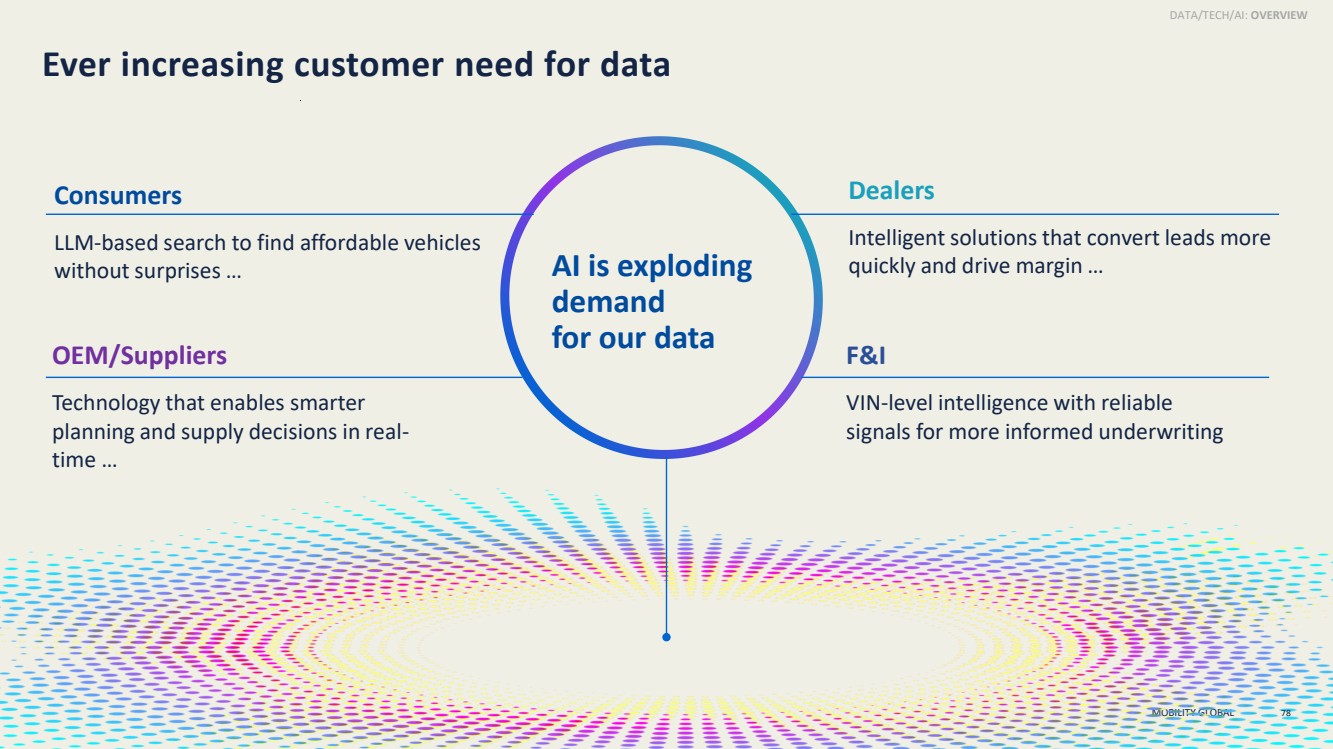
| MOBILITY GLOBAL Ever increasing customer need for data 78 Consumers LLM-based search to find affordable vehicles without surprises … Dealers Intelligent solutions that convert leads more quickly and drive margin … OEM/Suppliers Technology that enables smarter planning and supply decisions in real-time … F&I VIN-level intelligence with reliable signals for more informed underwriting AI is exploding demand for our data DATA/TECH/AI: OVERVIEW |
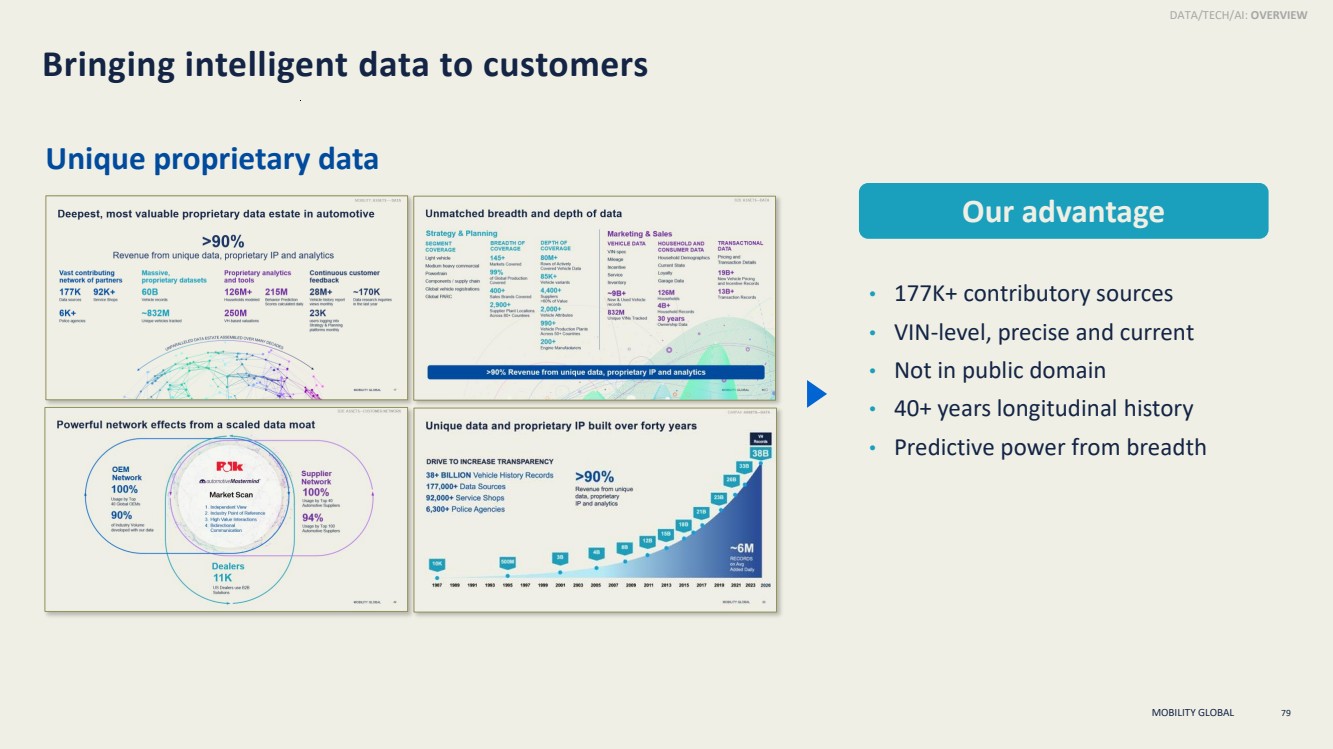
| MOBILITY GLOBAL 79 Bringing intelligent data to customers Unique proprietary data Our advantage • 177K+ contributory sources • VIN-level, precise and current • Not in public domain • 40+ years longitudinal history • Predictive power from breadth DATA/TECH/AI: OVERVIEW |
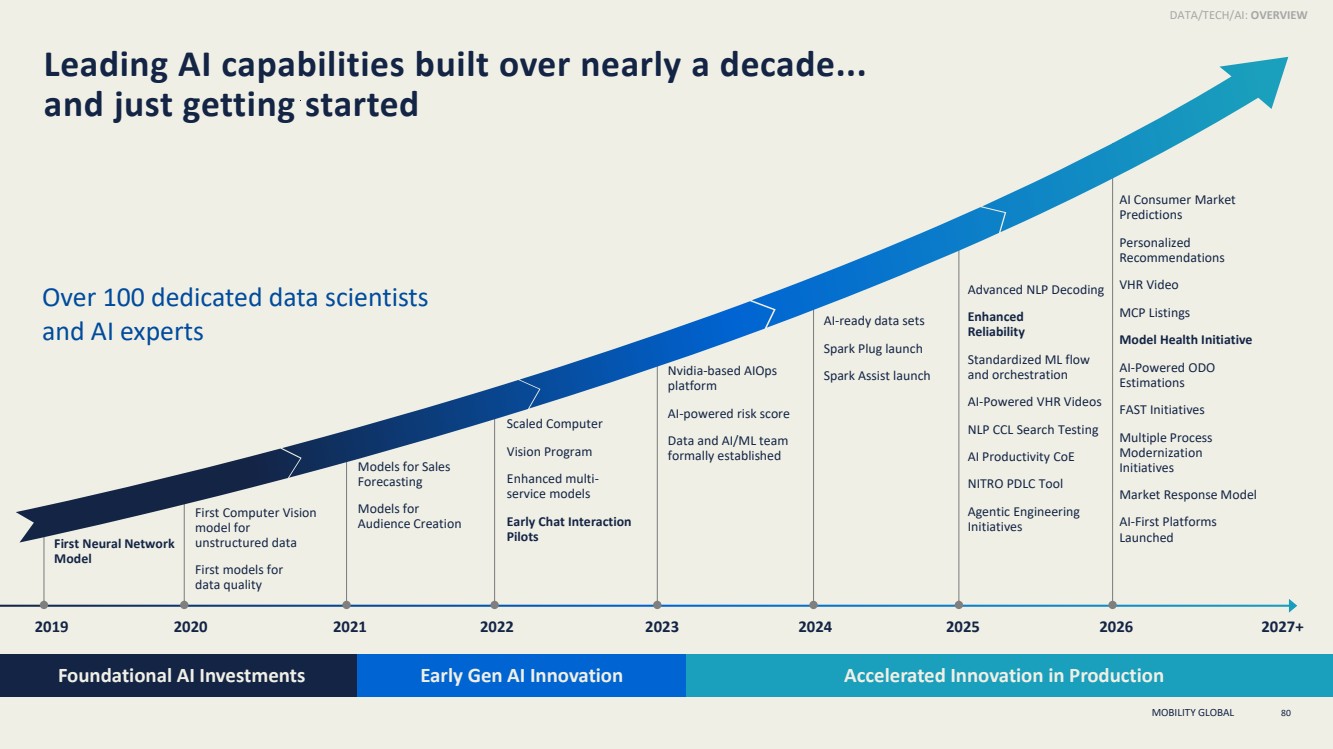
| MOBILITY GLOBAL Accelerated Innovation in Production Leading AI capabilities built over nearly a decade... and just getting started 80 Over 100 dedicated data scientists and AI experts DATA/TECH/AI: OVERVIEW 2019 2020 2021 2022 2023 2024 2025 2026 First Neural Network Model First Computer Vision model for unstructured data First models for data quality Models for Sales Forecasting Models for Audience Creation Scaled Computer Vision Program Enhanced multi-service models Early Chat Interaction Pilots Nvidia-based AIOps platform AI-powered risk score Data and AI/ML team formally established AI-ready data sets Spark Plug launch Spark Assist launch AI Consumer Market Predictions Personalized Recommendations VHR Video MCP Listings Model Health Initiative AI-Powered ODO Estimations FAST Initiatives Multiple Process Modernization Initiatives Market Response Model AI-First Platforms Launched Foundational AI Investments Early Gen AI Innovation Advanced NLP Decoding Enhanced Reliability Standardized ML flow and orchestration AI-Powered VHR Videos NLP CCL Search Testing AI Productivity CoE NITRO PDLC Tool Agentic Engineering Initiatives 2027+ |
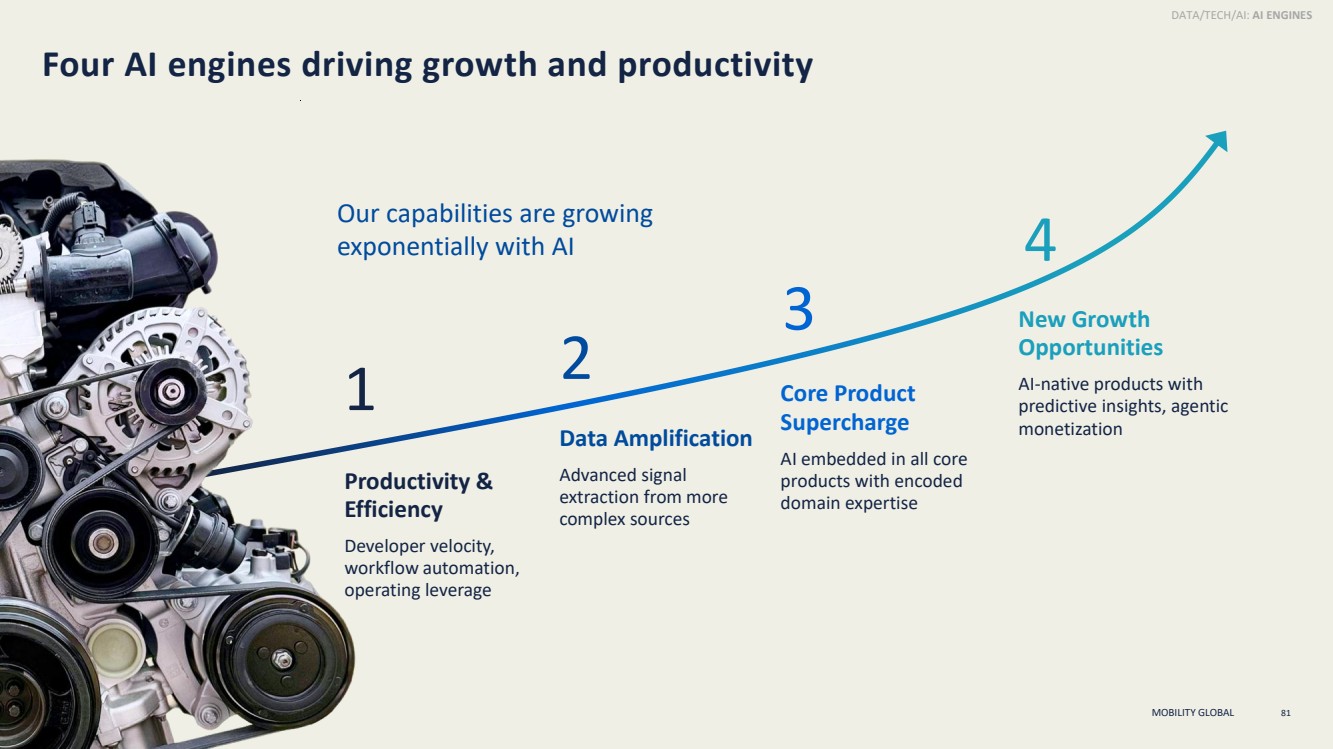
| MOBILITY GLOBAL Four AI engines driving growth and productivity Productivity & Efficiency Developer velocity, workflow automation, operating leverage Data Amplification Advanced signal extraction from more complex sources Core Product Supercharge AI embedded in all core products with encoded domain expertise New Growth Opportunities AI-native products with predictive insights, agentic monetization 1 2 3 4 DATA/TECH/AI: AI ENGINES 81 Our capabilities are growing exponentially with AI |
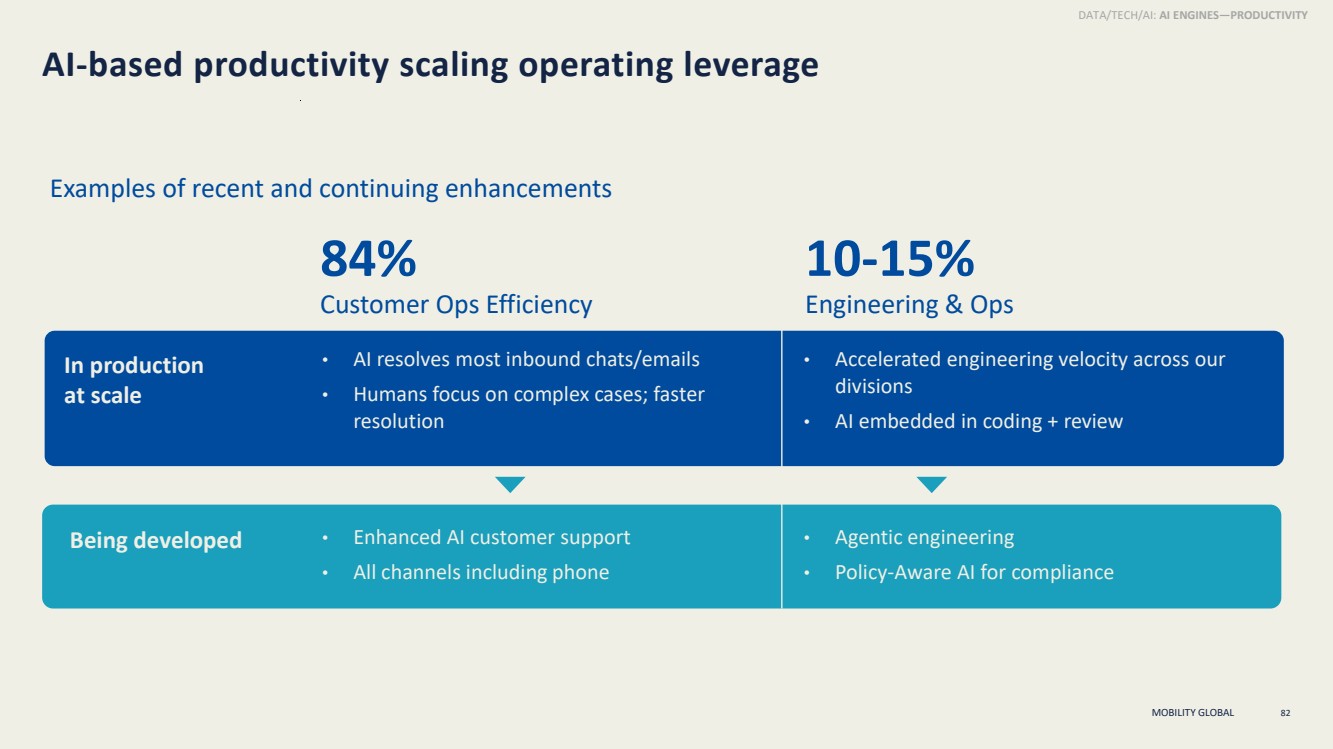
| MOBILITY GLOBAL AI-based productivity scaling operating leverage 82 • AI resolves most inbound chats/emails • Humans focus on complex cases; faster resolution 84% Customer Ops Efficiency • Accelerated engineering velocity across our divisions • AI embedded in coding + review 10-15% Engineering & Ops • Enhanced AI customer support • All channels including phone • Agentic engineering • Policy-Aware AI for compliance In production at scale Being developed DATA/TECH/AI: AI ENGINES—PRODUCTIVITY Examples of recent and continuing enhancements |
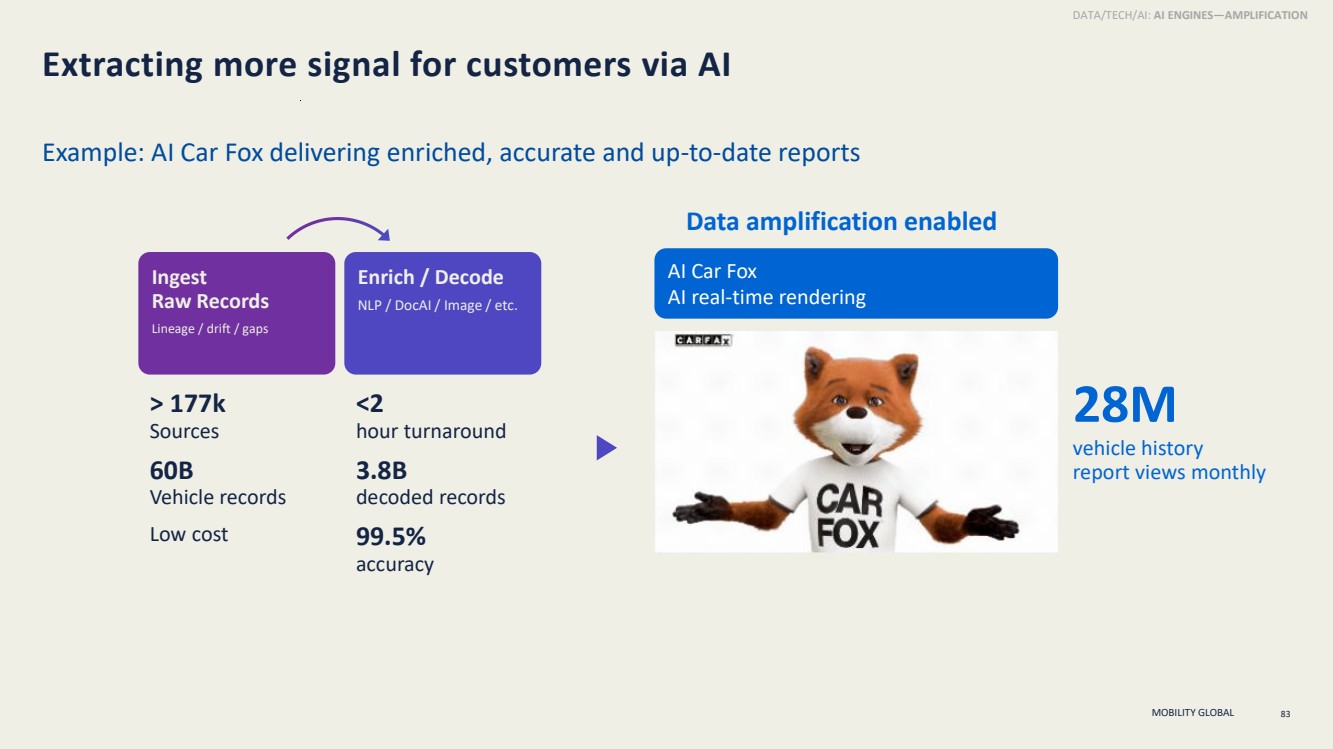
| MOBILITY GLOBAL Extracting more signal for customers via AI Data amplification enabled 83 Example: AI Car Fox delivering enriched, accurate and up-to-date reports DATA/TECH/AI: AI ENGINES—AMPLIFICATION Enrich / Decode NLP / DocAI / Image / etc. <2 hour turnaround 3.8B decoded records 99.5% accuracy Ingest Raw Records Lineage / drift / gaps > 177k Sources 60B Vehicle records Low cost AI Car Fox AI real-time rendering 28M vehicle history report views monthly |
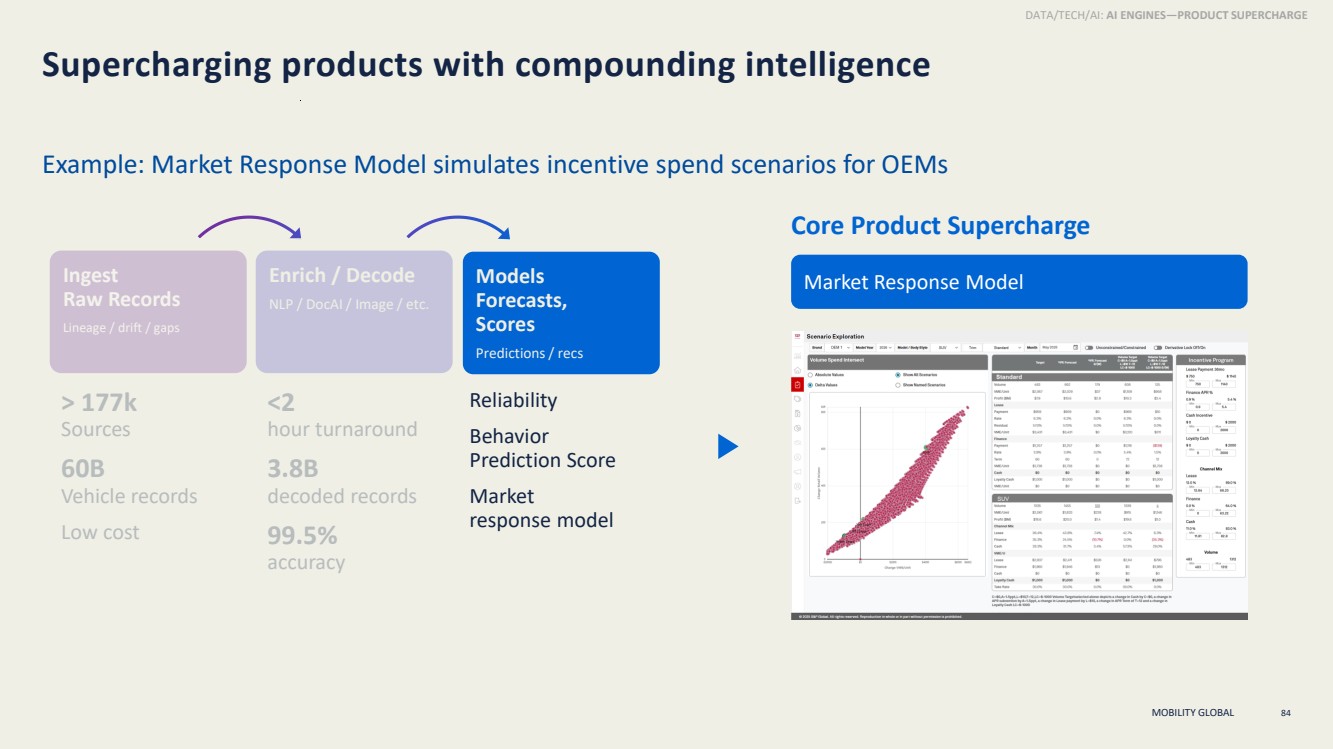
| MOBILITY GLOBAL 84 Supercharging products with compounding intelligence Core Product Supercharge DATA/TECH/AI: AI ENGINES—PRODUCT SUPERCHARGE Example: Market Response Model simulates incentive spend scenarios for OEMs Models Forecasts, Scores Predictions / recs Reliability Behavior Prediction Score Market response model Enrich / Decode NLP / DocAI/ Image / etc. <2 hour turnaround 3.8B decoded records 99.5% accuracy Ingest Raw Records Lineage / drift / gaps > 177k Sources 60B Vehicle records Low cost Market Response Model |
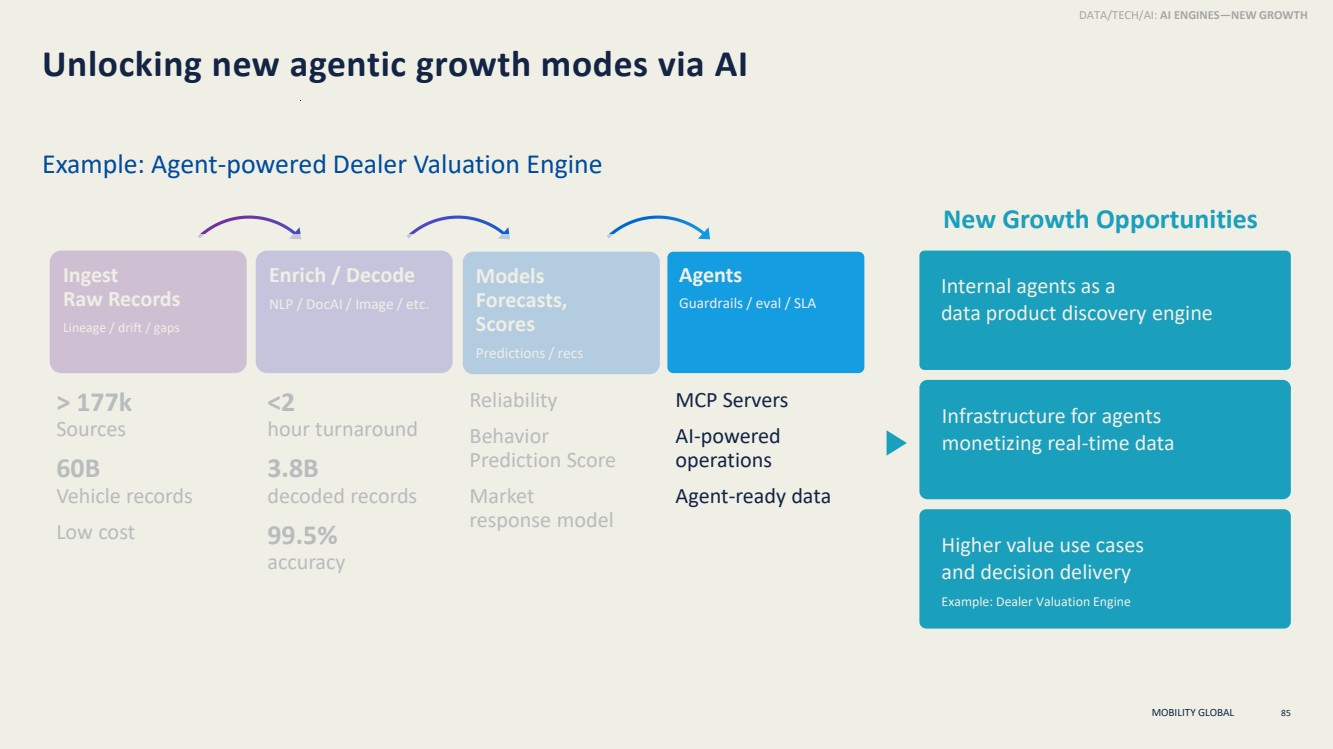
| MOBILITY GLOBAL Unlocking new agentic growth modes via AI New Growth Opportunities Internal agents as a data product discovery engine Infrastructure for agents monetizing real-time data Higher value use cases and decision delivery Example: Dealer Valuation Engine Models Forecasts, Scores Predictions / recs Agents Guardrails / eval / SLA Reliability Behavior Prediction Score Market response model MCP Servers AI-powered operations Agent-ready data Enrich / Decode NLP / DocAI/ Image / etc. <2 hour turnaround 3.8B decoded records 99.5% accuracy Ingest Raw Records Lineage / drift / gaps > 177k Sources 60B Vehicle records Low cost Example: Agent-powered Dealer Valuation Engine DATA/TECH/AI: AI ENGINES—NEW GROWTH 85 |
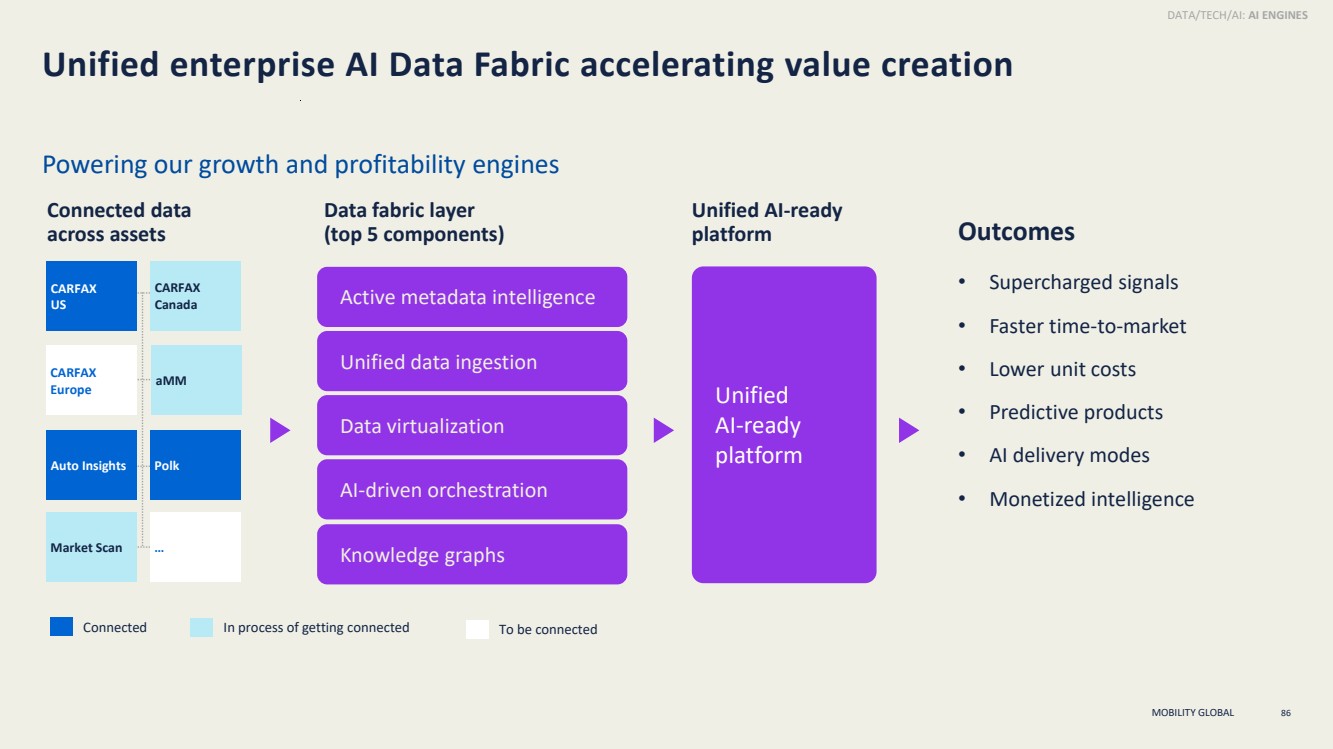
| MOBILITY GLOBAL Unified enterprise AI Data Fabric accelerating value creation 86 • Supercharged signals • Faster time-to-market • Lower unit costs • Predictive products • AI delivery modes • Monetized intelligence Outcomes Connected data across assets CARFAX US aMM CARFAX Canada Auto Insights Market Scan … Polk CARFAX Europe Unified AI-ready platform Unified AI-ready platform Data fabric layer (top 5 components) Active metadata intelligence Unified data ingestion Data virtualization AI-driven orchestration Knowledge graphs Connected In process of getting connected To be connected DATA/TECH/AI: AI ENGINES Powering our growth and profitability engines |
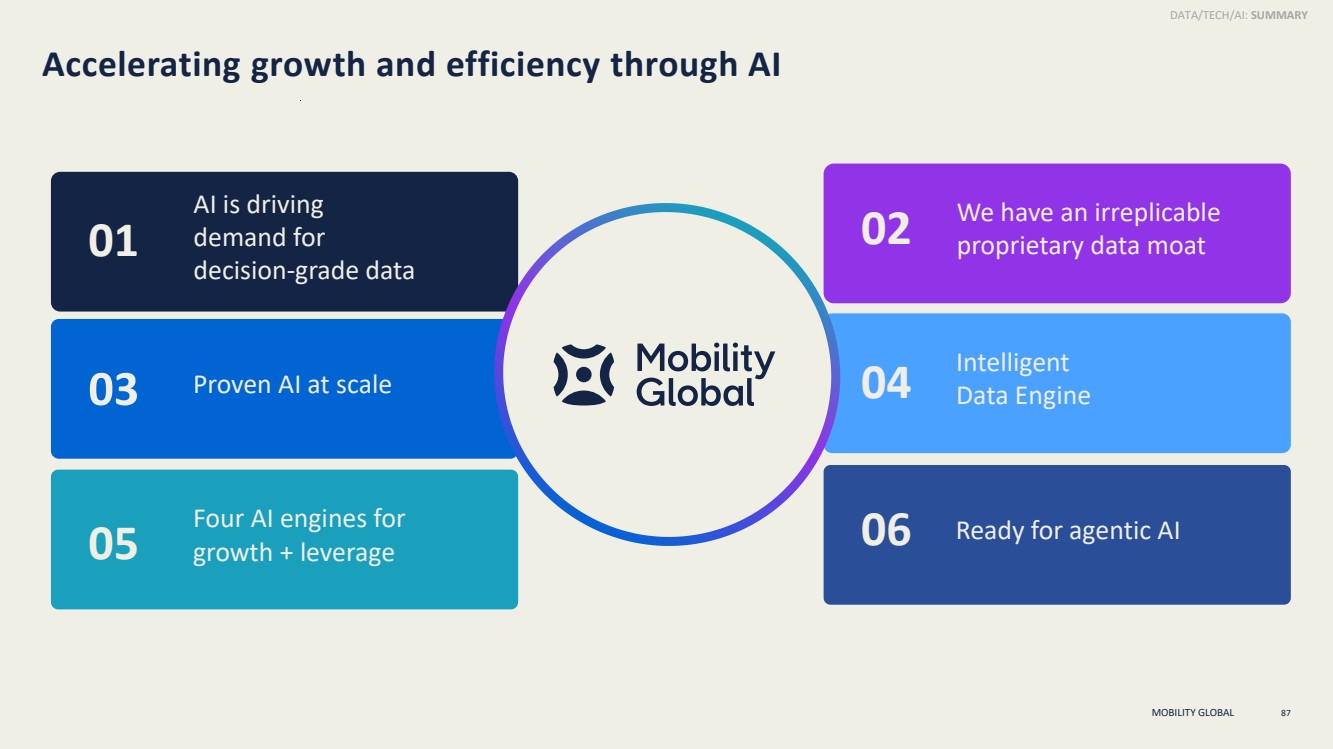
| MOBILITY GLOBAL Accelerating growth and efficiency through AI 87 We have an irreplicable proprietary data moat AI is driving demand for decision-grade data Proven AI at scale Intelligent Data Engine Four AI engines for growth + leverage Ready for agentic AI 01 03 05 02 04 06 DATA/TECH/AI: SUMMARY |
| MOBILITY GLOBAL Financial Framework Matt Calderone Chief Financial Officer 88 |

| MOBILITY GLOBAL Mobility Global financial highlights 2. High-margin, scalable business model 3. Strong balance sheet and cash flow generation 4. Disciplined approach to capital deployment 1. Resilient, compounding growth engine 89 5. Compelling investor value proposition 6. On track for mid-2026 public-company launch |
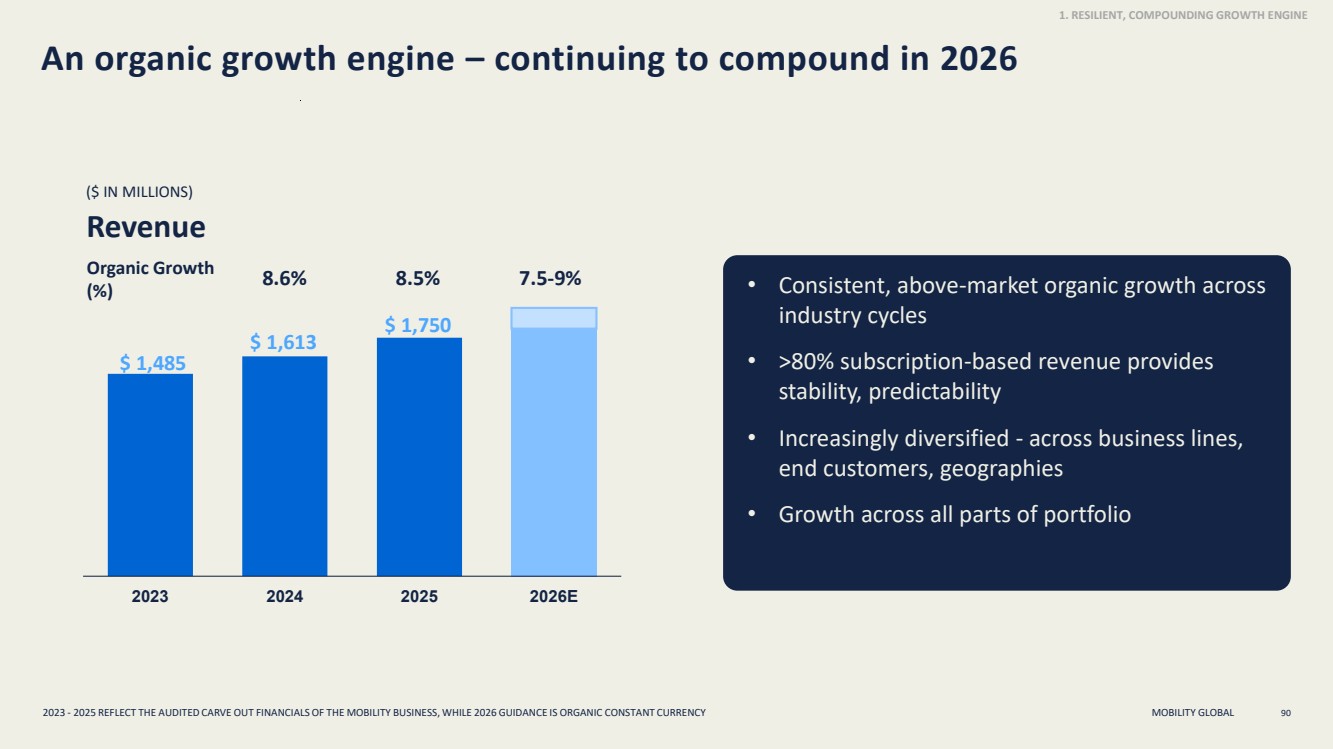
| MOBILITY GLOBAL An organic growth engine – continuing to compound in 2026 90 ($ IN MILLIONS) Revenue • Consistent, above-market organic growth across industry cycles • >80% subscription-based revenue provides stability, predictability • Increasingly diversified - across business lines, end customers, geographies • Growth across all parts of portfolio 8.6% 8.5% 7.5-9% 2023 - 2025 REFLECT THE AUDITED CARVE OUT FINANCIALS OF THE MOBILITY BUSINESS, WHILE 2026 GUIDANCE IS ORGANIC CONSTANT CURRENCY Organic Growth (%) $ 1,485 $ 1,613 $ 1,750 2023 2024 2025 2026E 1. RESILIENT, COMPOUNDING GROWTH ENGINE |
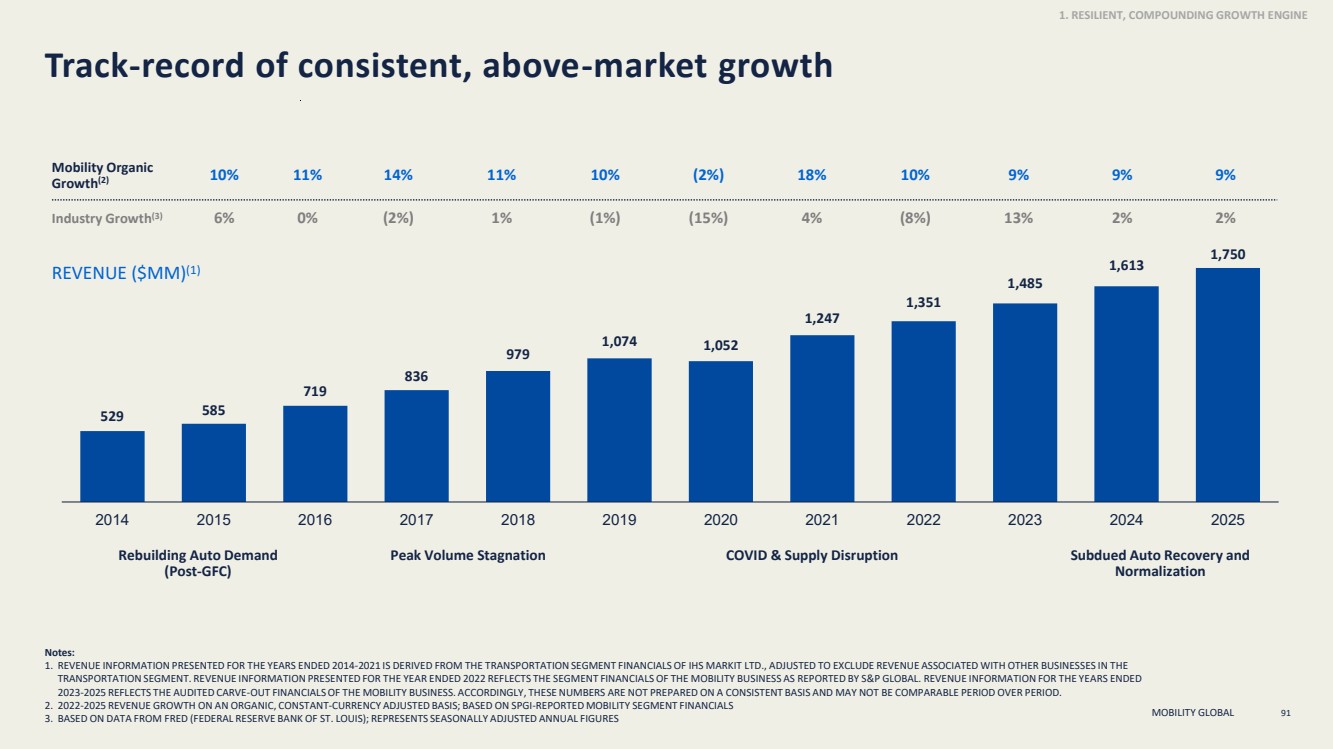
| MOBILITY GLOBAL Track-record of consistent, above-market growth Notes: 1. REVENUE INFORMATION PRESENTED FOR THE YEARS ENDED 2014-2021 IS DERIVED FROM THE TRANSPORTATION SEGMENT FINANCIALS OF IHS MARKIT LTD., ADJUSTED TO EXCLUDE REVENUE ASSOCIATED WITH OTHER BUSINESSES IN THE TRANSPORTATION SEGMENT. REVENUE INFORMATION PRESENTED FOR THE YEAR ENDED 2022 REFLECTS THE SEGMENT FINANCIALS OF THE MOBILITY BUSINESS AS REPORTED BY S&P GLOBAL. REVENUE INFORMATION FOR THE YEARS ENDED 2023-2025 REFLECTS THE AUDITED CARVE-OUT FINANCIALS OF THE MOBILITY BUSINESS. ACCORDINGLY, THESE NUMBERS ARE NOT PREPARED ON A CONSISTENT BASIS AND MAY NOT BE COMPARABLE PERIOD OVER PERIOD. 2. 2022-2025 REVENUE GROWTH ON AN ORGANIC, CONSTANT-CURRENCY ADJUSTED BASIS; BASED ON SPGI-REPORTED MOBILITY SEGMENT FINANCIALS 3. BASED ON DATA FROM FRED (FEDERAL RESERVE BANK OF ST. LOUIS); REPRESENTS SEASONALLY ADJUSTED ANNUAL FIGURES 529 585 719 836 979 1,074 1,052 1,247 1,351 1,485 1,613 1,750 2014 2015 2016 2017 2018 2019 2020 2021 2022 2023 2024 2025 REVENUE ($MM)(1) 91 Mobility Organic Growth(2) 10% 11% 14% 11% 10% (2%) 18% 10% 9% 9% 9% Industry Growth(3) 6% 0% (2%) 1% (1%) (15%) 4% (8%) 13% 2% 2% Subdued Auto Recovery and Normalization Rebuilding Auto Demand Peak Volume Stagnation COVID & Supply Disruption (Post-GFC) 1. RESILIENT, COMPOUNDING GROWTH ENGINE |
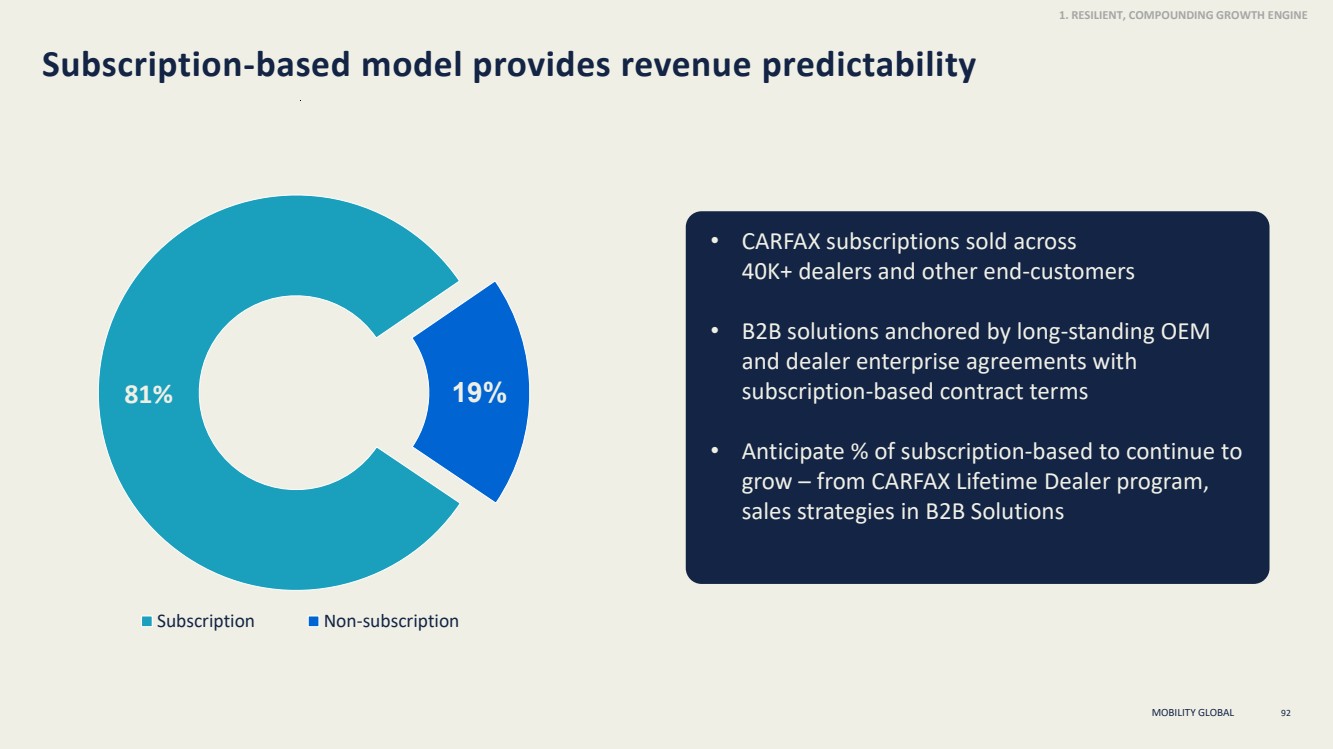
| MOBILITY GLOBAL Subscription-based model provides revenue predictability 92 • CARFAX subscriptions sold across 40K+ dealers and other end-customers • B2B solutions anchored by long-standing OEM and dealer enterprise agreements with subscription-based contract terms • Anticipate % of subscription-based to continue to grow – from CARFAX Lifetime Dealer program, sales strategies in B2B Solutions 81% 19% Subscription Non-subscription 1. RESILIENT, COMPOUNDING GROWTH ENGINE |
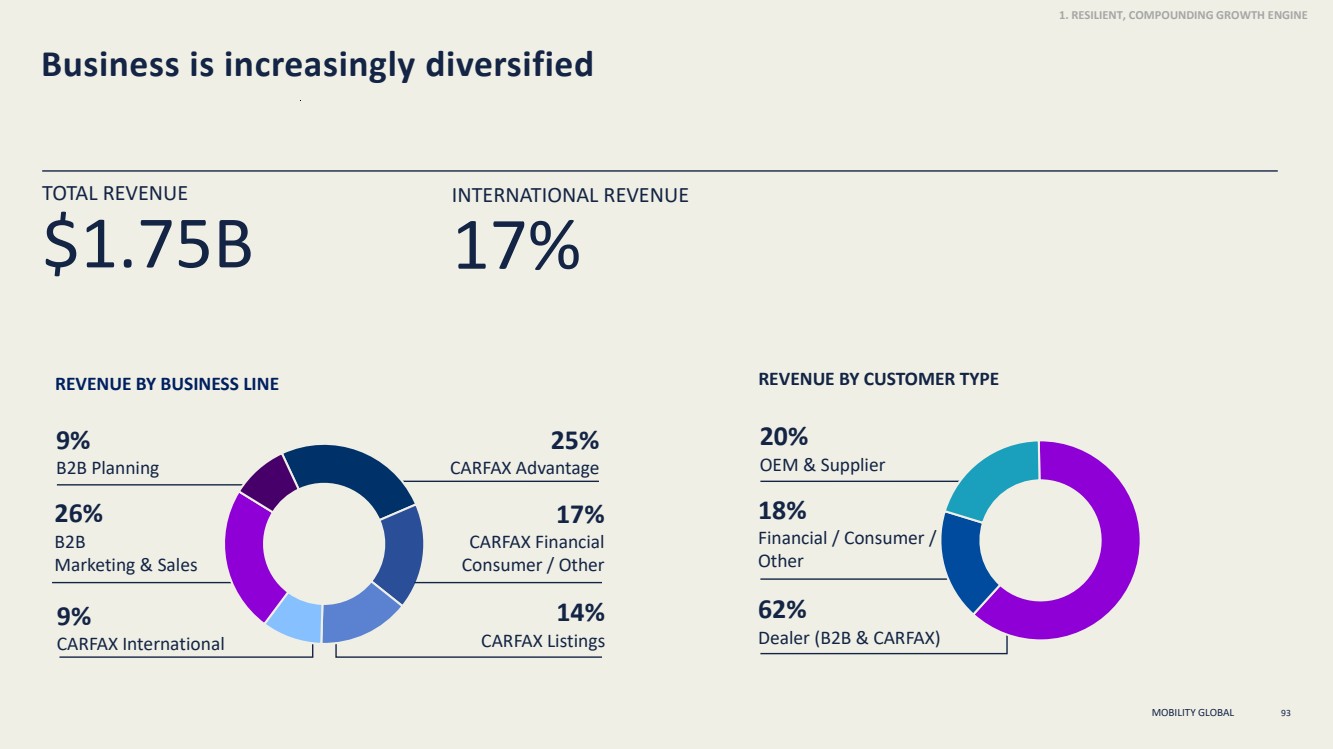
| MOBILITY GLOBAL Business is increasingly diversified 93 9% B2B Planning 9% CARFAX International 26% B2B Marketing & Sales 25% CARFAX Advantage 14% CARFAX Listings 17% CARFAX Financial Consumer / Other REVENUE BY BUSINESS LINE REVENUE BY CUSTOMER TYPE 20% OEM & Supplier 62% Dealer (B2B & CARFAX) 18% Financial / Consumer / Other TOTAL REVENUE $1.75B INTERNATIONAL REVENUE 17% 1. RESILIENT, COMPOUNDING GROWTH ENGINE |
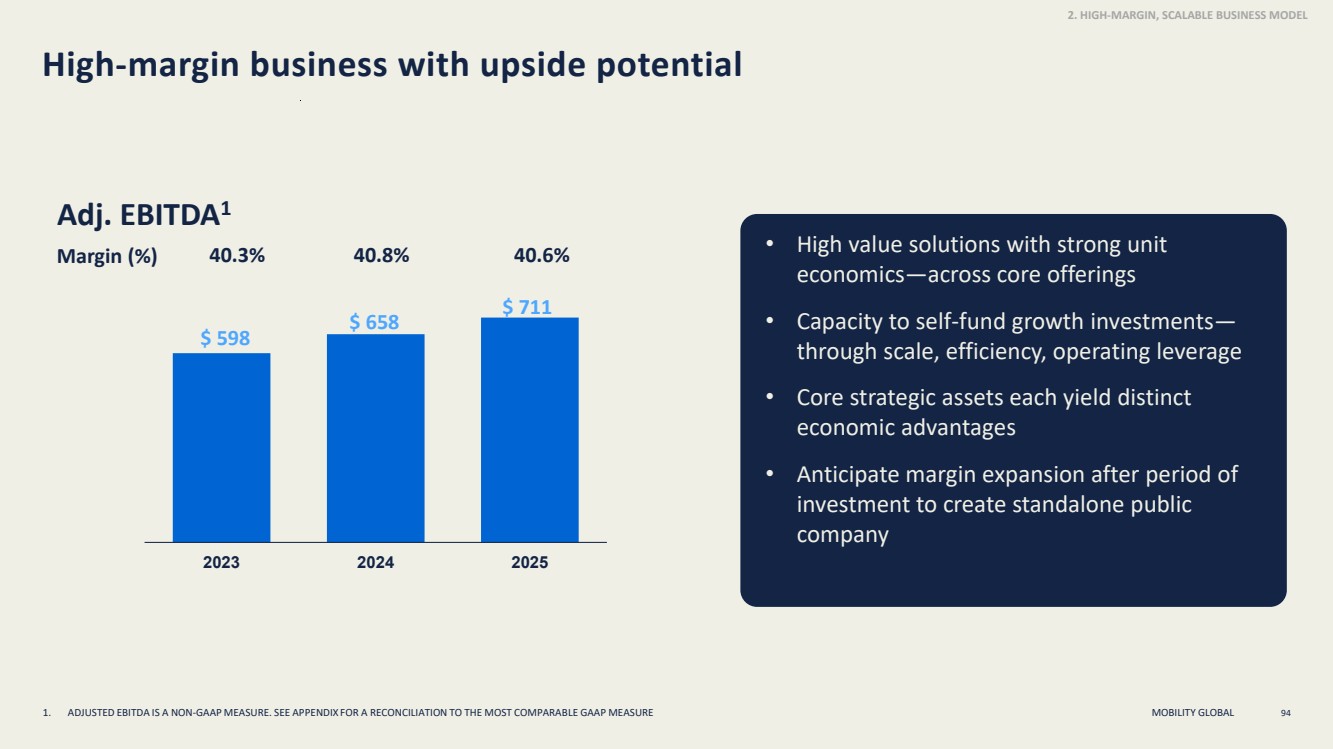
| MOBILITY GLOBAL $ 598 $ 658 $ 711 2023 2024 2025 High-margin business with upside potential 94 Adj. EBITDA1 • High value solutions with strong unit economics—across core offerings • Capacity to self-fund growth investments— through scale, efficiency, operating leverage • Core strategic assets each yield distinct economic advantages • Anticipate margin expansion after period of investment to create standalone public company Margin (%) 40.3% 40.8% 40.6% 1. ADJUSTED EBITDA IS A NON-GAAP MEASURE. SEE APPENDIX FOR A RECONCILIATION TO THE MOST COMPARABLE GAAP MEASURE 2. HIGH-MARGIN, SCALABLE BUSINESS MODEL |
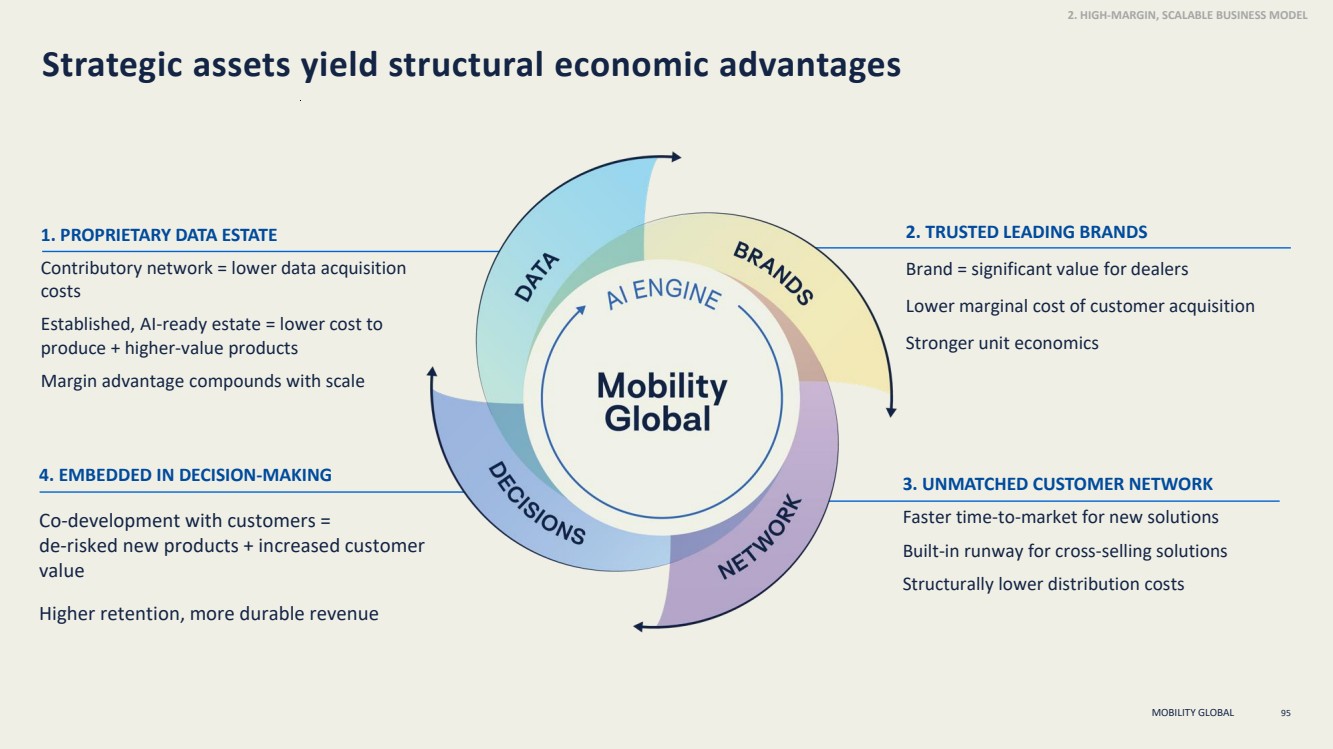
| MOBILITY GLOBAL 2. TRUSTED LEADING BRANDS Brand = significant value for dealers Lower marginal cost of customer acquisition Stronger unit economics 1. PROPRIETARY DATA ESTATE Contributory network = lower data acquisition costs Established, AI-ready estate = lower cost to produce + higher-value products Margin advantage compounds with scale 4. EMBEDDED IN DECISION-MAKING Co-development with customers = de-risked new products + increased customer value Higher retention, more durable revenue 3. UNMATCHED CUSTOMER NETWORK Faster time-to-market for new solutions Built-in runway for cross-selling solutions Structurally lower distribution costs Strategic assets yield structural economic advantages 95 2. HIGH-MARGIN, SCALABLE BUSINESS MODEL |
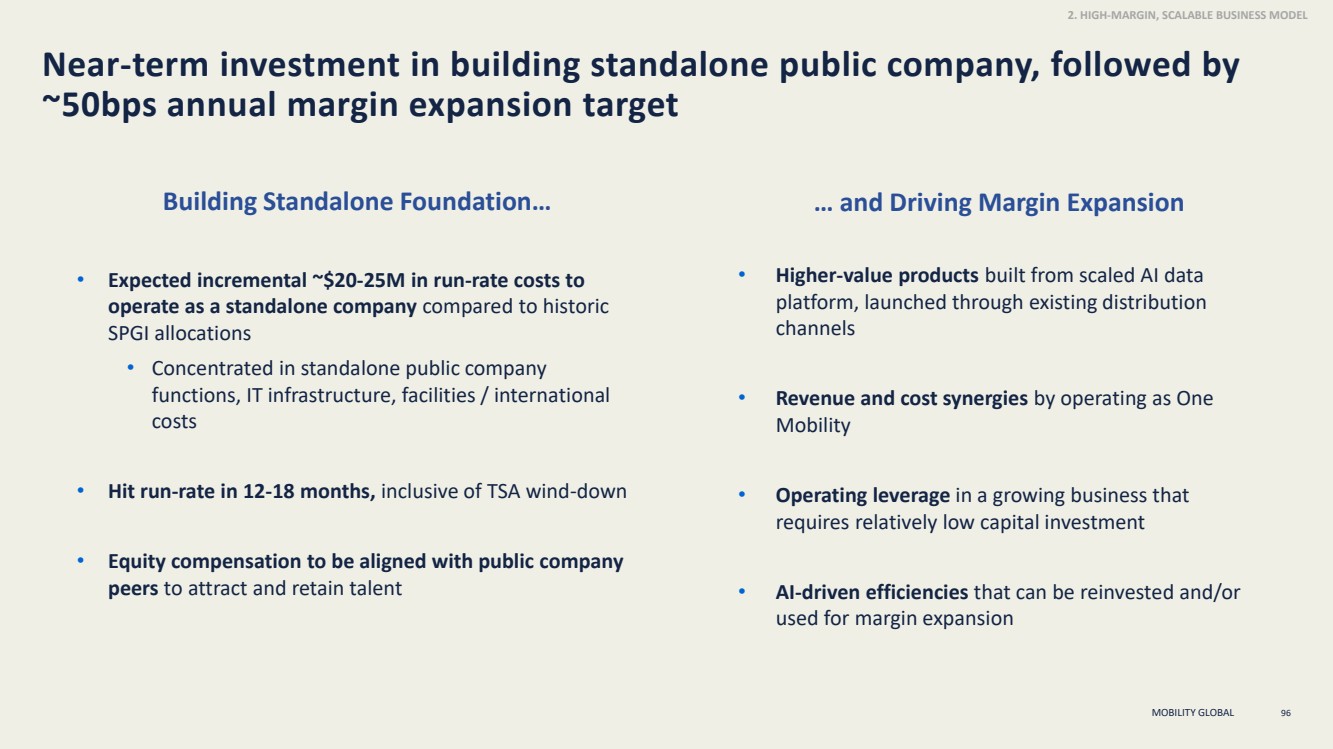
| MOBILITY GLOBAL Near-term investment in building standalone public company, followed by ~50bps annual margin expansion target 96 2. HIGH-MARGIN, SCALABLE BUSINESS MODEL Building Standalone Foundation… • Expected incremental ~$20-25M in run-rate costs to operate as a standalone company compared to historic SPGI allocations • Concentrated in standalone public company functions, IT infrastructure, facilities / international costs • Hit run-rate in 12-18 months, inclusive of TSA wind-down • Equity compensation to be aligned with public company peers to attract and retain talent … and Driving Margin Expansion • Higher-value products built from scaled AI data platform, launched through existing distribution channels • Revenue and cost synergies by operating as One Mobility • Operating leverage in a growing business that requires relatively low capital investment • AI-driven efficiencies that can be reinvested and/or used for margin expansion |
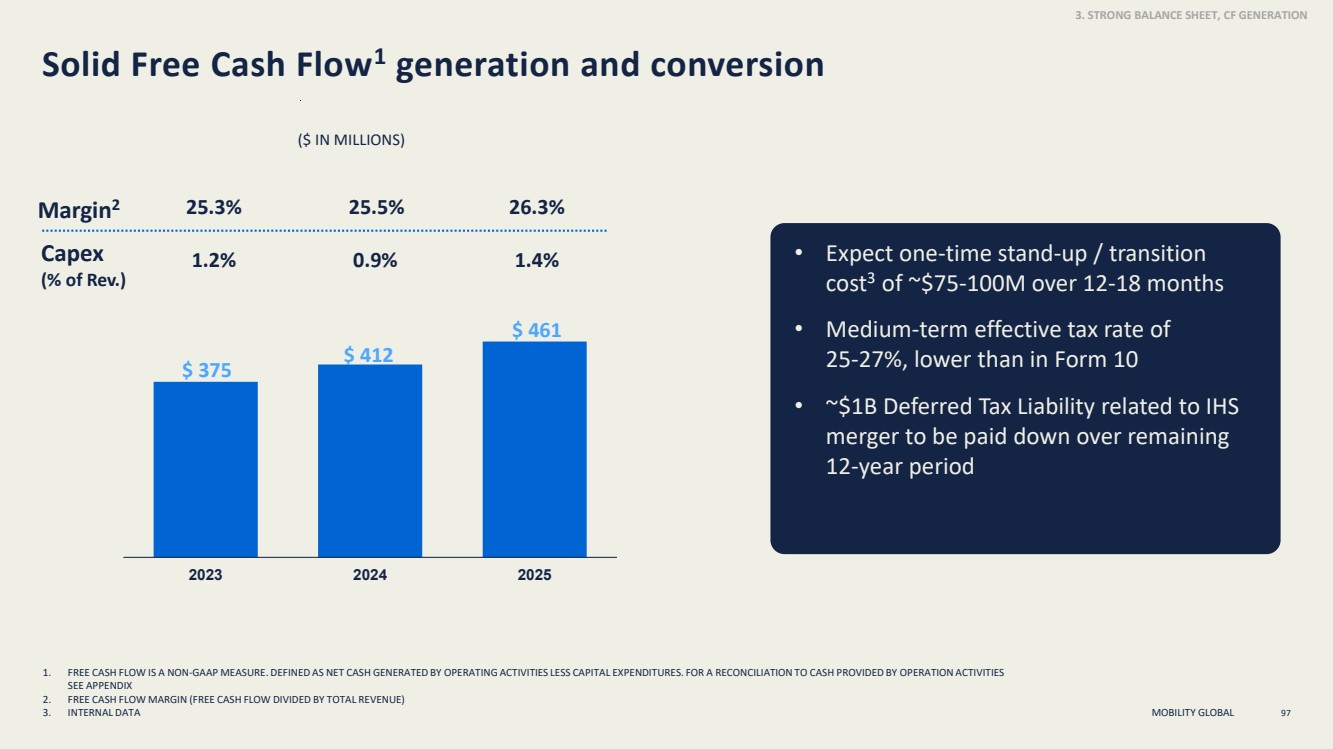
| MOBILITY GLOBAL Solid Free Cash Flow1 generation and conversion 97 • Expect one-time stand-up / transition cost3 of ~$75-100M over 12-18 months • Medium-term effective tax rate of 25-27%, lower than in Form 10 • ~$1B Deferred Tax Liability related to IHS merger to be paid down over remaining 12-year period 3. STRONG BALANCE SHEET, CF GENERATION Margin2 Capex (% of Rev.) $ 375 $ 412 $ 461 2023 2024 2025 1.2% 0.9% 1.4% 25.3% 25.5% 26.3% ($ IN MILLIONS) 1. FREE CASH FLOW IS A NON-GAAP MEASURE. DEFINED AS NET CASH GENERATED BY OPERATING ACTIVITIES LESS CAPITAL EXPENDITURES. FOR A RECONCILIATION TO CASH PROVIDED BY OPERATION ACTIVITIES SEE APPENDIX 2. FREE CASH FLOW MARGIN (FREE CASH FLOW DIVIDED BY TOTAL REVENUE) 3. INTERNAL DATA |
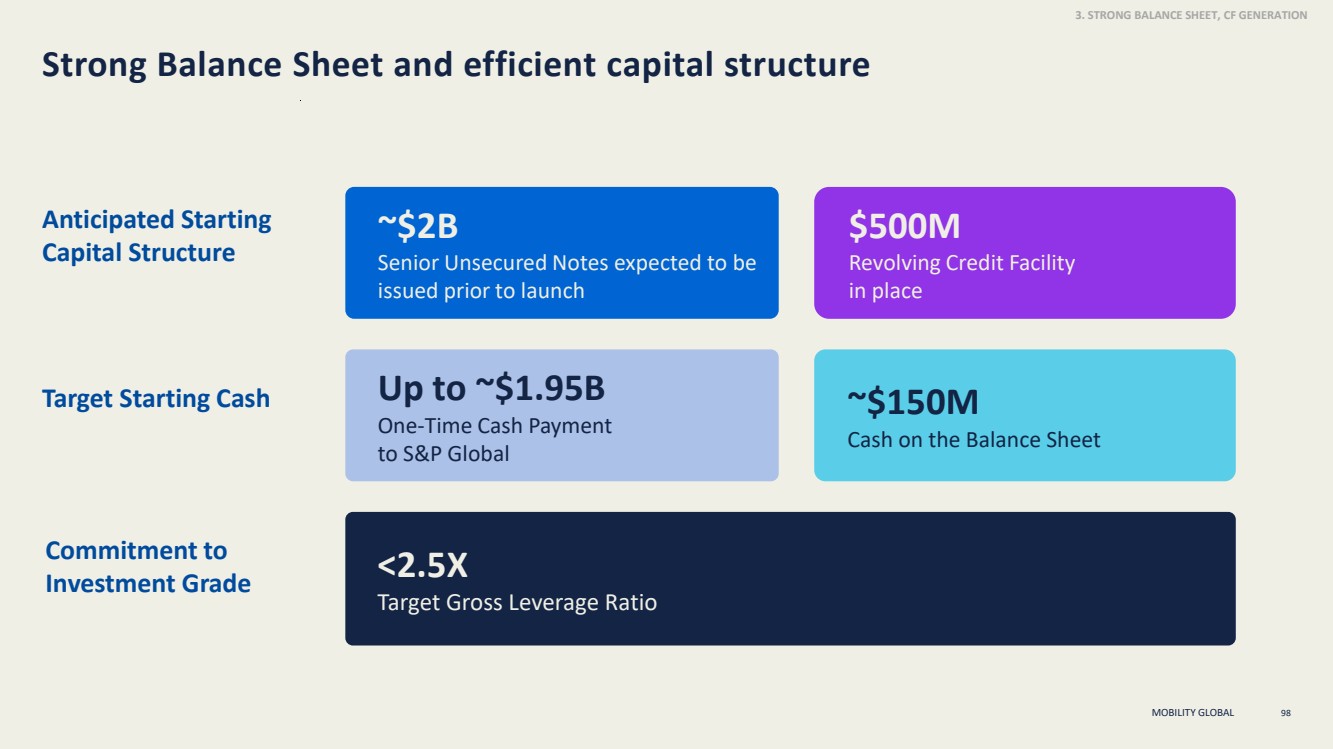
| MOBILITY GLOBAL Strong Balance Sheet and efficient capital structure 98 3. STRONG BALANCE SHEET, CF GENERATION ~$2B Senior Unsecured Notes expected to be issued prior to launch <2.5X Target Gross Leverage Ratio Anticipated Starting Capital Structure $500M Revolving Credit Facility in place ~$150M Cash on the Balance Sheet Target Starting Cash Commitment to Investment Grade Up to ~$1.95B One-Time Cash Payment to S&P Global |
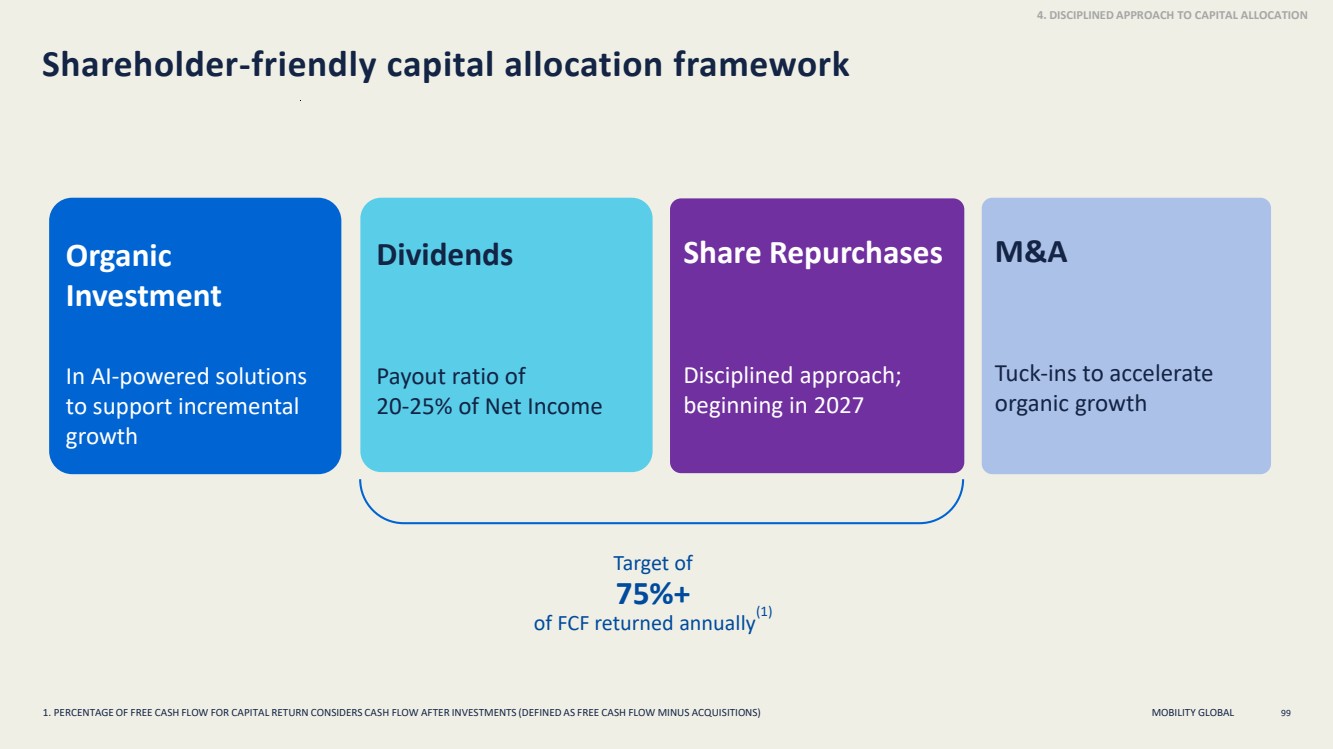
| MOBILITY GLOBAL Shareholder-friendly capital allocation framework 99 4. DISCIPLINED APPROACH TO CAPITAL ALLOCATION Dividends Payout ratio of 20-25% of Net Income Share Repurchases Disciplined approach; beginning in 2027 M&A Tuck-ins to accelerate organic growth Organic Investment In AI-powered solutions to support incremental growth Target of 75%+ of FCF returned annually(1) 1. PERCENTAGE OF FREE CASH FLOW FOR CAPITAL RETURN CONSIDERS CASH FLOW AFTER INVESTMENTS (DEFINED AS FREE CASH FLOW MINUS ACQUISITIONS) |
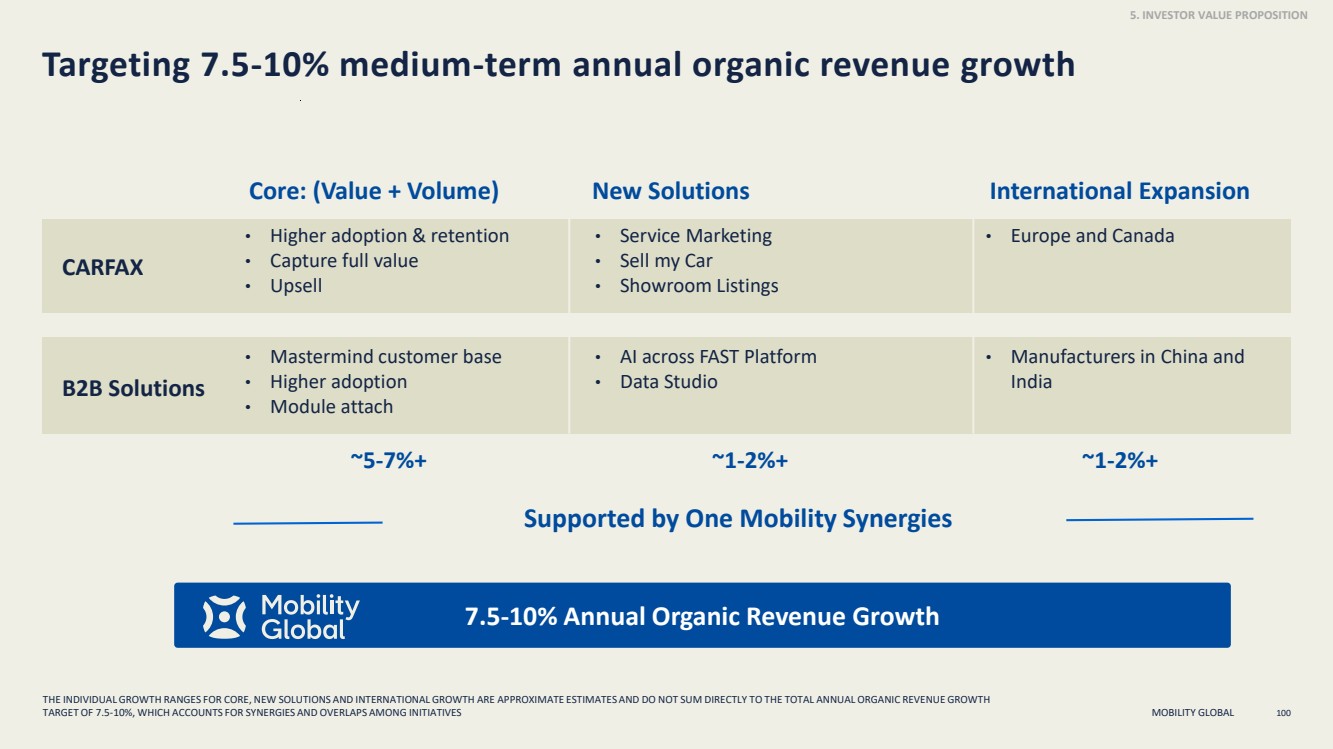
| MOBILITY GLOBAL Core: (Value + Volume) Targeting 7.5-10% medium-term annual organic revenue growth 100 7.5-10% Annual Organic Revenue Growth New Solutions International Expansion ~5-7%+ ~1-2%+ ~1-2%+ • Higher adoption & retention • Capture full value • Upsell • Service Marketing • Sell my Car • Showroom Listings • Europe and Canada • Mastermind customer base • Higher adoption • Module attach • AI across FAST Platform • Data Studio • Manufacturers in China and India B2B Solutions Supported by One Mobility Synergies CARFAX 5. INVESTOR VALUE PROPOSITION THE INDIVIDUAL GROWTH RANGES FOR CORE, NEW SOLUTIONS AND INTERNATIONAL GROWTH ARE APPROXIMATE ESTIMATES AND DO NOT SUM DIRECTLY TO THE TOTAL ANNUAL ORGANIC REVENUE GROWTH TARGET OF 7.5-10%, WHICH ACCOUNTS FOR SYNERGIES AND OVERLAPS AMONG INITIATIVES |
| MOBILITY GLOBAL Framework for investor value creation 1. PERCENTAGE OF FREE CASH FLOW FOR CAPITAL RETURN CONSIDERS FREE CASH FLOW AFTER INVESTMENTS (DEFINED AS FREE CASH FLOW MINUS ACQUISITIONS) 101 Margin Expansion Compounding EBITDA Growth Dividend Distributor M&A as an Accelerant Consistent Capital Returns Predictable Organic Revenue Growth 7.5-10% annually 20-25% of GAAP net income 75%+ of FCF returned annually(1) Additional capacity while maintaining IG rating 8-11% Adj. EBITDA growth +50bps annually after standalone reset 5. INVESTOR VALUE PROPOSITION |
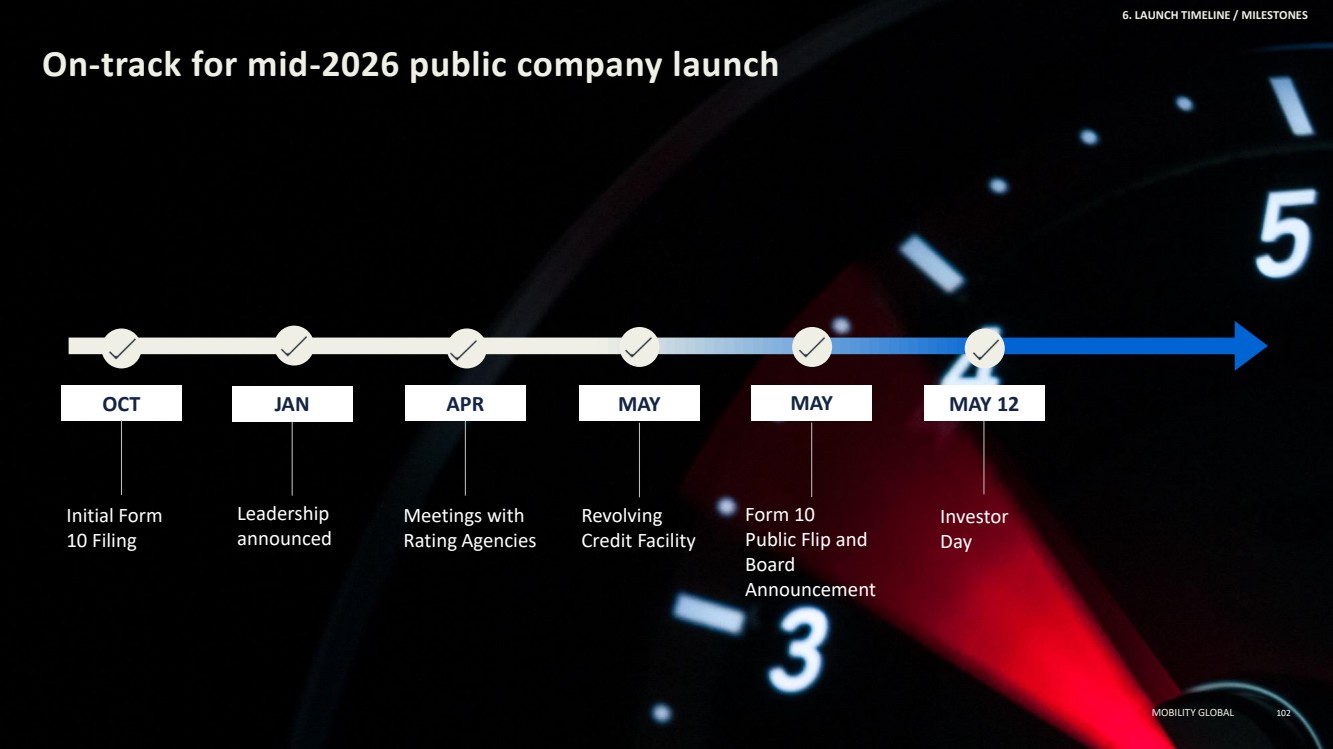
| MOBILITY GLOBAL On-track for mid-2026 public company launch 102 6. LAUNCH TIMELINE / MILESTONES OCT Initial Form 10 Filing Meetings with Rating Agencies Revolving Credit Facility Form 10 Public Flip and Board Announcement Investor Day JAN APR MAY MAY MAY 12 Leadership announced MOBILITY GLOBAL |
| MOBILITY GLOBAL Q&A Session Bill Eager Chief Executive Officer Matt Calderone Chief Financial Officer Scott Fredericks President, CARFAX Joe LaFeir President, Mobility Business Solutions MOBILITY GLOBAL 103 |
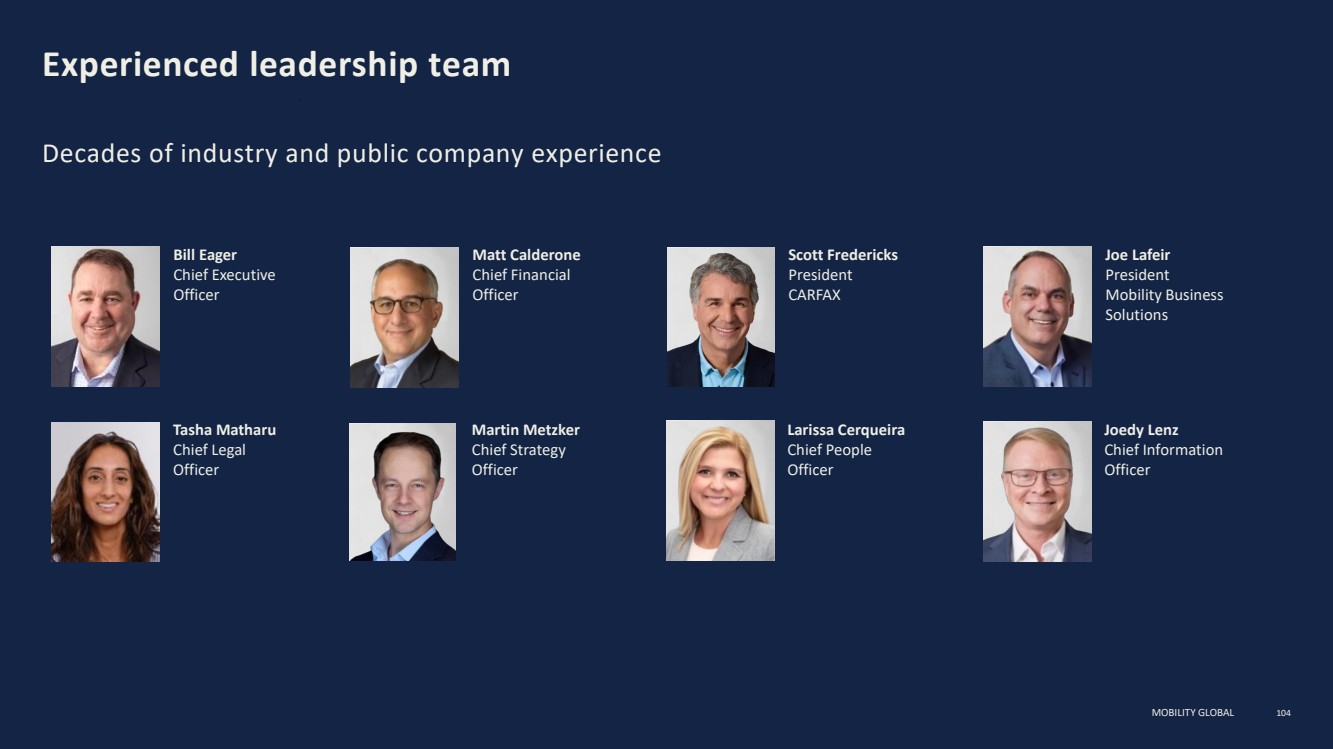
| MOBILITY GLOBAL Experienced leadership team Decades of industry and public company experience Bill Eager Chief Executive Officer Matt Calderone Chief Financial Officer Scott Fredericks President CARFAX Joe Lafeir President Mobility Business Solutions Tasha Matharu Chief Legal Officer Martin Metzker Chief Strategy Officer Larissa Cerqueira Chief People Officer Joedy Lenz Chief Information Officer 104 |
| MOBILITY GLOBAL Key Takeaways Bill Eager Chief Executive Officer 105 |
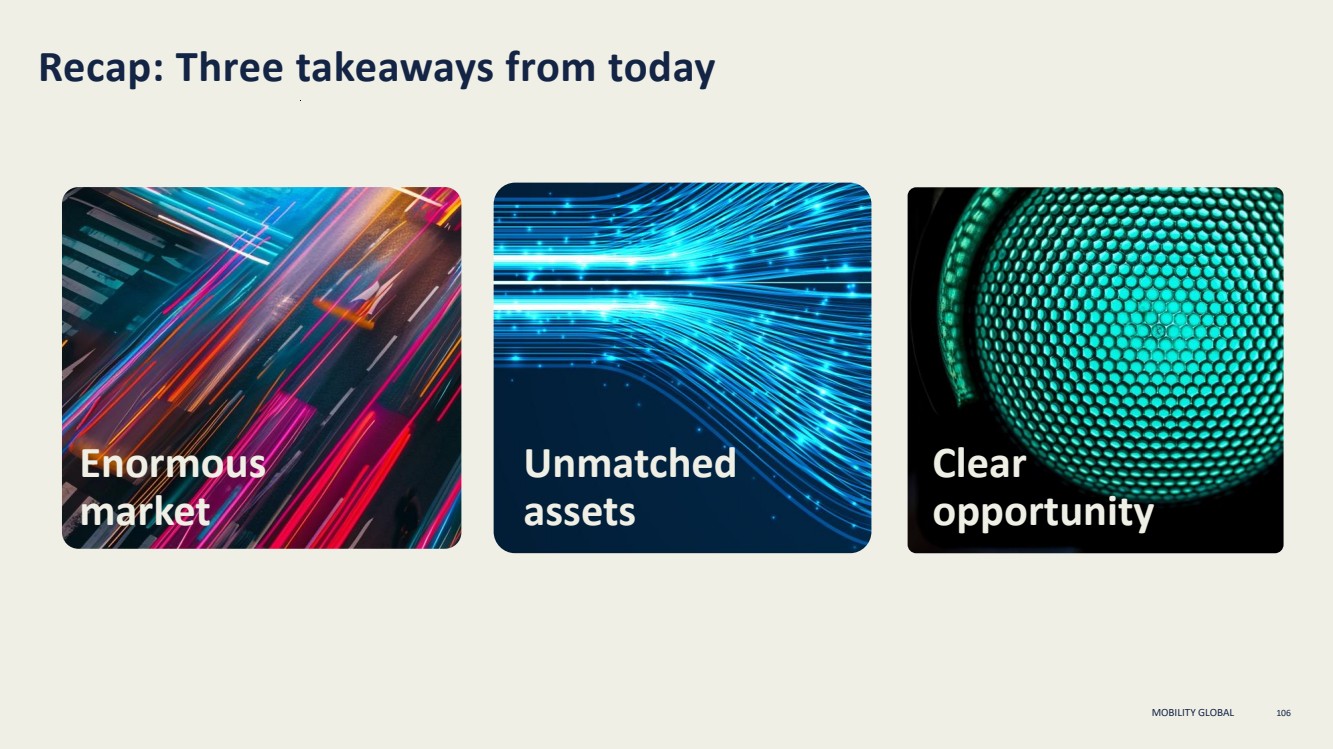
| MOBILITY GLOBAL 106 Recap: Three takeaways from today Enormous market Unmatched assets Clear opportunity |
| MOBILITY GLOBAL 107 Appendix |

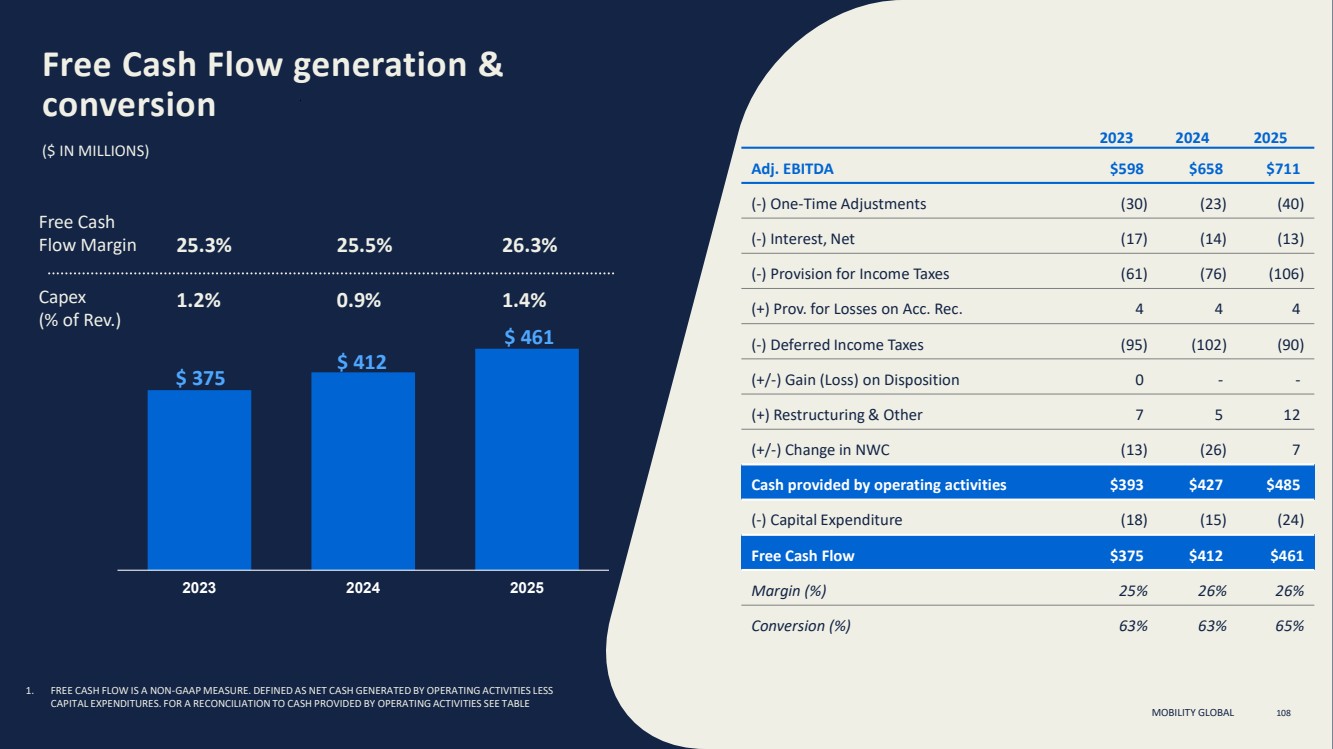
| MOBILITY GLOBAL ($ IN MILLIONS) Free Cash Flow generation & conversion 108 Free Cash Flow Margin Capex (% of Rev.) $ 375 $ 412 $ 461 2023 2024 2025 1.2% 0.9% 1.4% 25.3% 25.5% 26.3% 2023 2024 2025 Adj. EBITDA $598 $658 $711 (-) One-Time Adjustments (30) (23) (40) (-) Interest, Net (17) (14) (13) (-) Provision for Income Taxes (61) (76) (106) (+) Prov. for Losses on Acc. Rec. 4 4 4 (-) Deferred Income Taxes (95) (102) (90) (+/-) Gain (Loss) on Disposition 0 - - (+) Restructuring & Other 7 5 12 (+/-) Change in NWC (13) (26) 7 Cash provided by operating activities $393 $427 $485 (-) Capital Expenditure (18) (15) (24) Free Cash Flow $375 $412 $461 Margin (%) 25% 26% 26% Conversion (%) 63% 63% 65% 1. FREE CASH FLOW IS A NON-GAAP MEASURE. DEFINED AS NET CASH GENERATED BY OPERATING ACTIVITIES LESS CAPITAL EXPENDITURES. FOR A RECONCILIATION TO CASH PROVIDED BY OPERATING ACTIVITIES SEE TABLE MOBILITY GLOBAL |
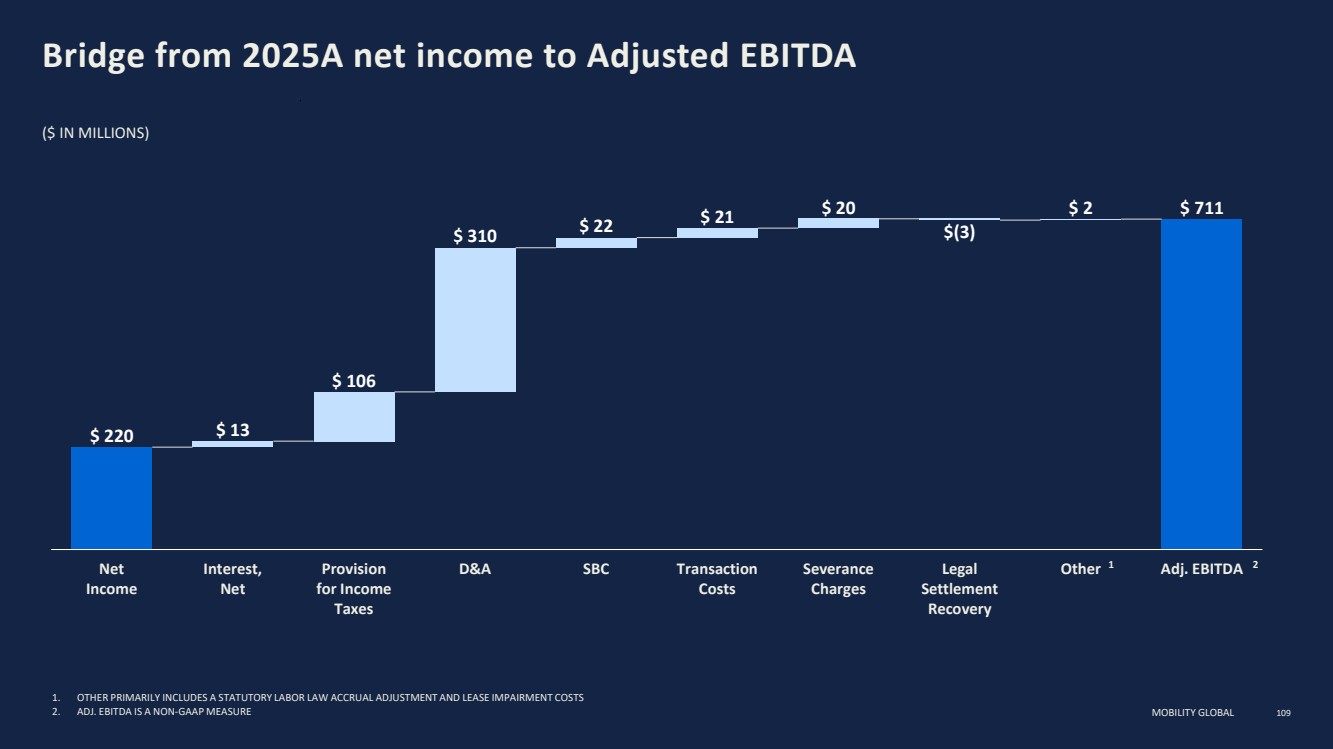
| MOBILITY GLOBAL ($ IN MILLIONS) Bridge from 2025A net income to Adjusted EBITDA 109 1 2 $ 220 $ 13 $ 106 $ 310 $ 22 $ 21 $ 20 $(3) $ 2 $ 711 Net Income Interest, Net Provision for Income Taxes D&A SBC Transaction Costs Severance Charges Legal Settlement Recovery Other Adj. EBITDA 1. OTHER PRIMARILY INCLUDES A STATUTORY LABOR LAW ACCRUAL ADJUSTMENT AND LEASE IMPAIRMENT COSTS 2. ADJ. EBITDA IS A NON-GAAP MEASURE |
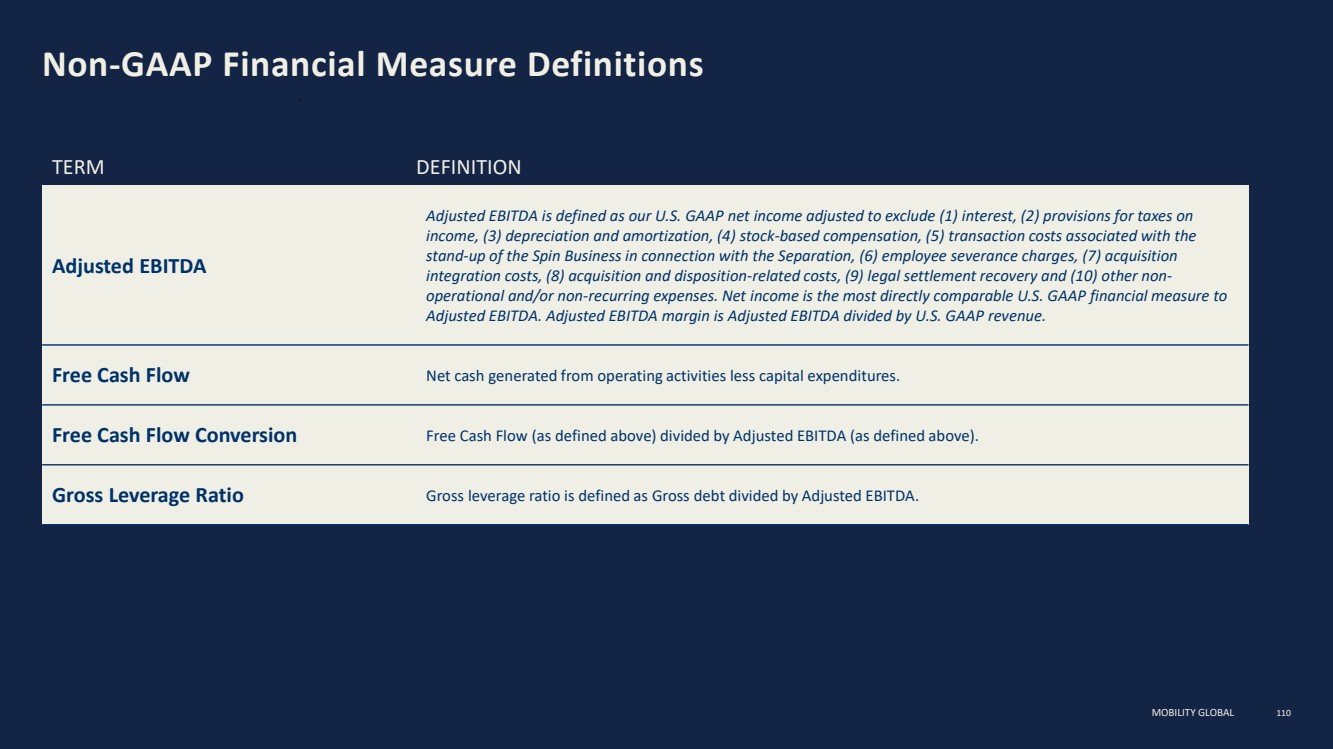
| MOBILITY GLOBAL Non-GAAP Financial Measure Definitions 110 TERM DEFINITION Adjusted EBITDA Adjusted EBITDA is defined as our U.S. GAAP net income adjusted to exclude (1) interest, (2) provisions for taxes on income, (3) depreciation and amortization, (4) stock-based compensation, (5) transaction costs associated with the stand-up of the Spin Business in connection with the Separation, (6) employee severance charges, (7) acquisition integration costs, (8) acquisition and disposition-related costs, (9) legal settlement recovery and (10) other non-operational and/or non-recurring expenses. Net income is the most directly comparable U.S. GAAP financial measure to Adjusted EBITDA. Adjusted EBITDA margin is Adjusted EBITDA divided by U.S. GAAP revenue. Free Cash Flow Net cash generated from operating activities less capital expenditures. Free Cash Flow Conversion Free Cash Flow (as defined above) divided by Adjusted EBITDA (as defined above). Gross Leverage Ratio Gross leverage ratio is defined as Gross debt divided by Adjusted EBITDA. |
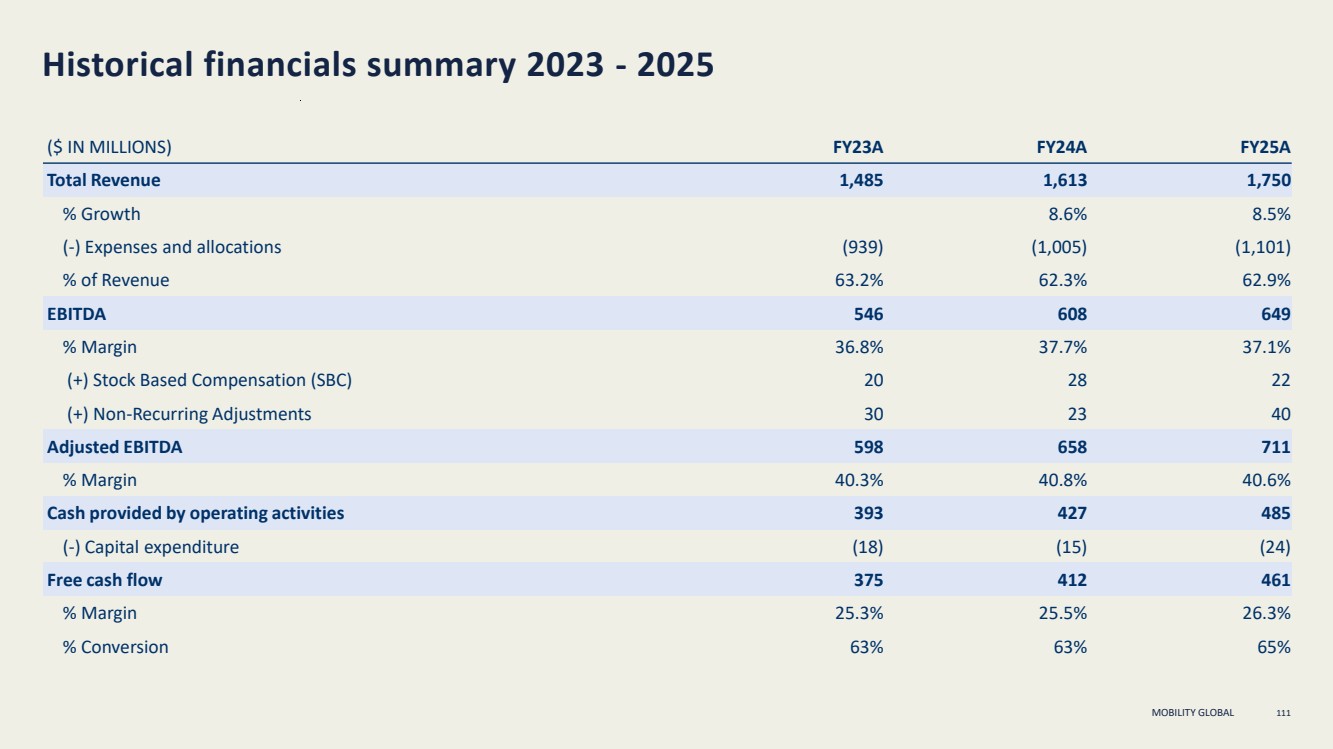
| MOBILITY GLOBAL Historical financials summary 2023 - 2025 111 ($ IN MILLIONS) FY23A FY24A FY25A Total Revenue 1,485 1,613 1,750 % Growth 8.6% 8.5% (-) Expenses and allocations (939) (1,005) (1,101) % of Revenue 63.2% 62.3% 62.9% EBITDA 546 608 649 % Margin 36.8% 37.7% 37.1% (+) Stock Based Compensation (SBC) 20 28 22 (+) Non-Recurring Adjustments 30 23 40 Adjusted EBITDA 598 658 711 % Margin 40.3% 40.8% 40.6% Cash provided by operating activities 393 427 485 (-) Capital expenditure (18) (15) (24) Free cash flow 375 412 461 % Margin 25.3% 25.5% 26.3% % Conversion 63% 63% 65% |
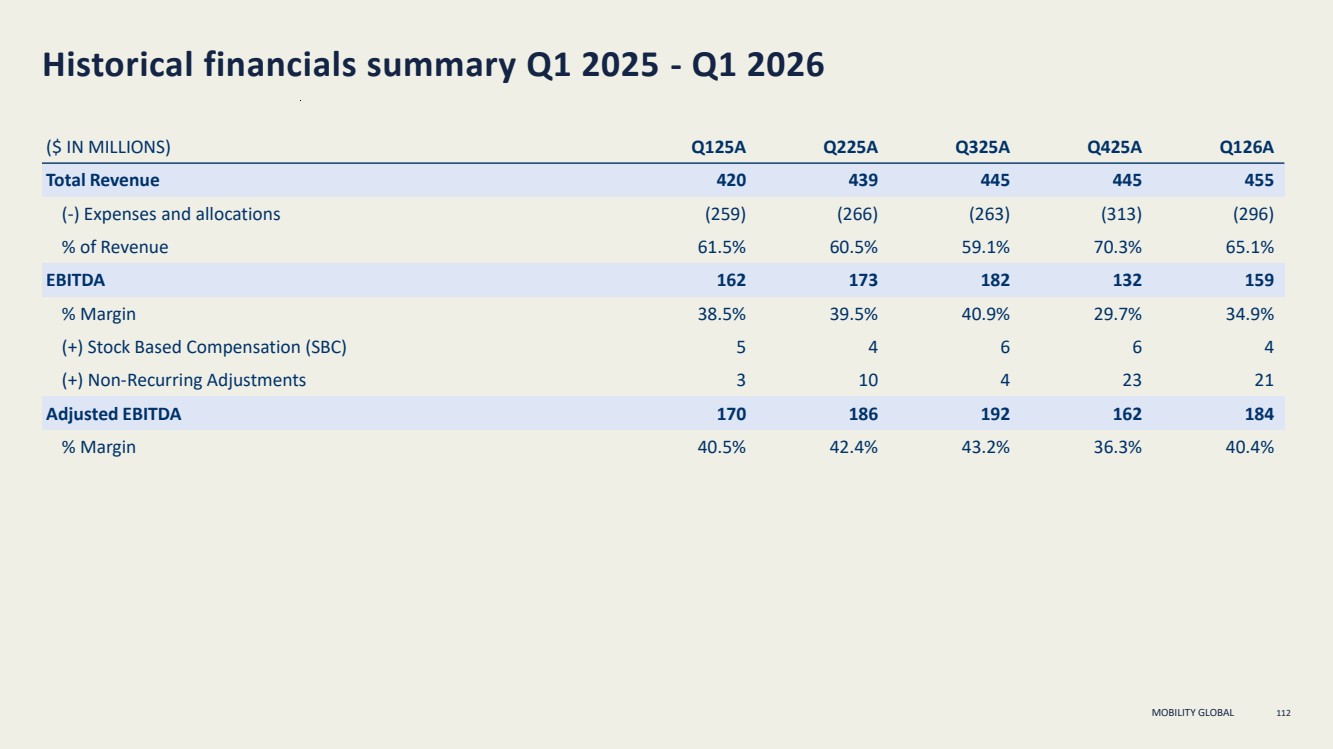
| MOBILITY GLOBAL Historical financials summary Q1 2025 - Q1 2026 112 ($ IN MILLIONS) Q125A Q225A Q325A Q425A Q126A Total Revenue 420 439 445 445 455 (-) Expenses and allocations (259) (266) (263) (313) (296) % of Revenue 61.5% 60.5% 59.1% 70.3% 65.1% EBITDA 162 173 182 132 159 % Margin 38.5% 39.5% 40.9% 29.7% 34.9% (+) Stock Based Compensation (SBC) 5 4 6 6 4 (+) Non-Recurring Adjustments 3 10 4 23 21 Adjusted EBITDA 170 186 192 162 184 % Margin 40.5% 42.4% 43.2% 36.3% 40.4% |
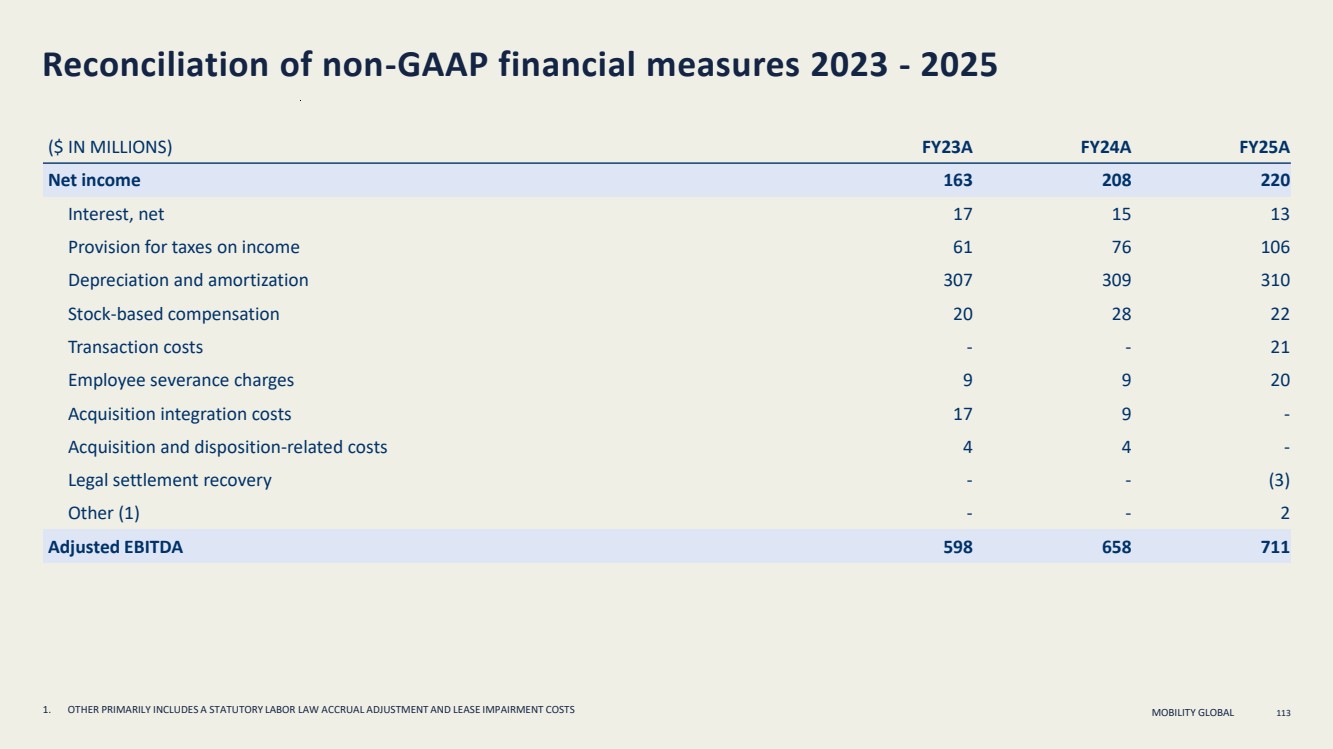
| MOBILITY GLOBAL Reconciliation of non-GAAP financial measures 2023 - 2025 113 ($ IN MILLIONS) FY23A FY24A FY25A Net income 163 208 220 Interest, net 17 15 13 Provision for taxes on income 61 76 106 Depreciation and amortization 307 309 310 Stock-based compensation 20 28 22 Transaction costs - - 21 Employee severance charges 9 9 20 Acquisition integration costs 17 9 - Acquisition and disposition-related costs 4 4 - Legal settlement recovery - - (3) Other (1) - - 2 Adjusted EBITDA 598 658 711 1. OTHER PRIMARILY INCLUDES A STATUTORY LABOR LAW ACCRUAL ADJUSTMENT AND LEASE IMPAIRMENT COSTS |
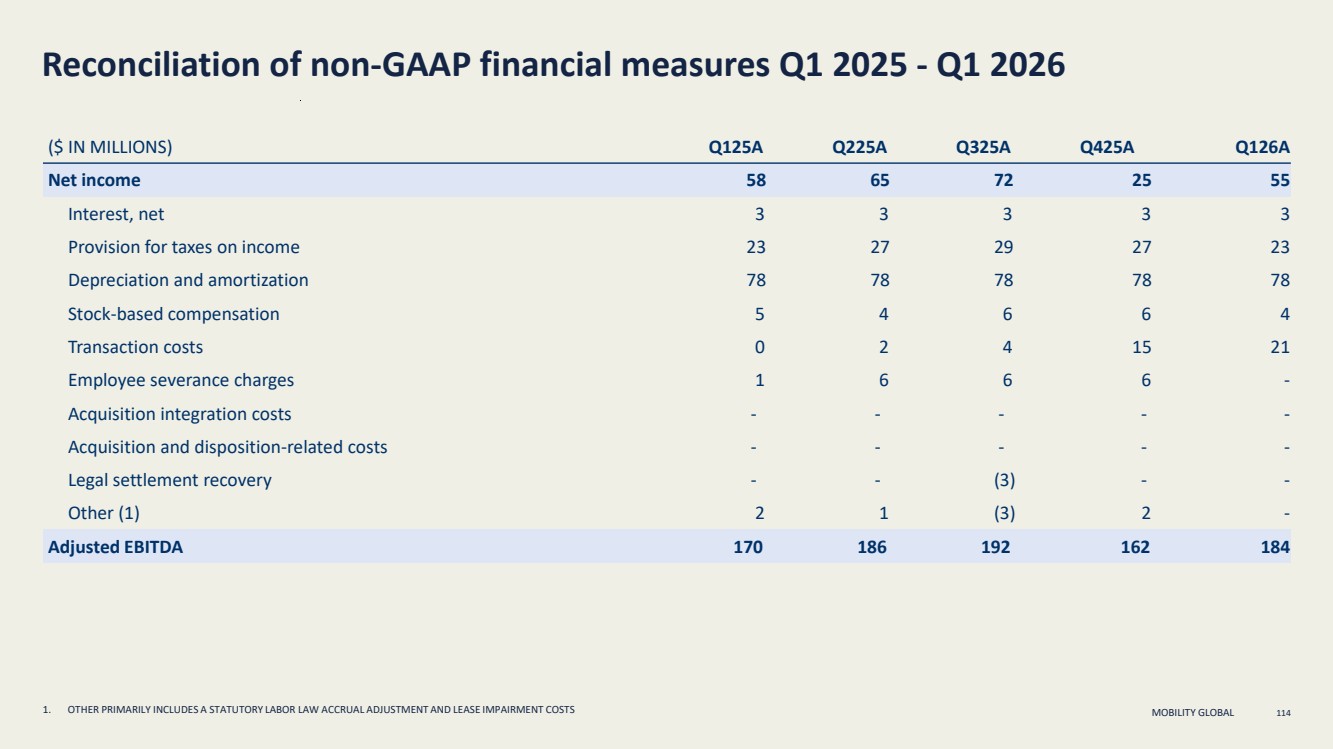
| MOBILITY GLOBAL Reconciliation of non-GAAP financial measures Q1 2025 - Q1 2026 114 ($ IN MILLIONS) Q125A Q225A Q325A Q425A Q126A Net income 58 65 72 25 55 Interest, net 3 3 3 3 3 Provision for taxes on income 23 27 29 27 23 Depreciation and amortization 78 78 78 78 78 Stock-based compensation 5 4 6 6 4 Transaction costs 0 2 4 15 21 Employee severance charges 1 6 6 6 - Acquisition integration costs - - - - - Acquisition and disposition-related costs - - - - - Legal settlement recovery - - (3) - - Other (1) 2 1 (3) 2 - Adjusted EBITDA 170 186 192 162 184 1. OTHER PRIMARILY INCLUDES A STATUTORY LABOR LAW ACCRUAL ADJUSTMENT AND LEASE IMPAIRMENT COSTS |
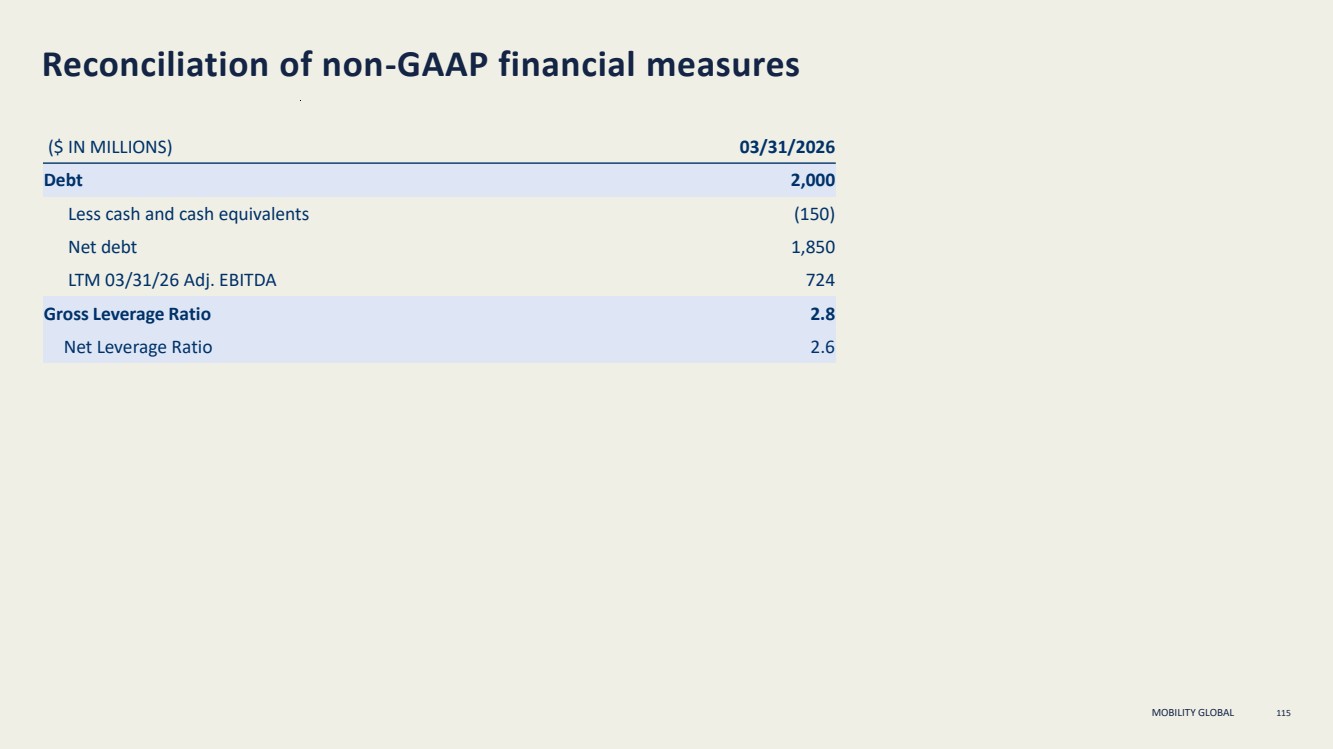
| MOBILITY GLOBAL Reconciliation of non-GAAP financial measures 115 ($ IN MILLIONS) 03/31/2026 Debt 2,000 Less cash and cash equivalents (150) Net debt 1,850 LTM 03/31/26 Adj. EBITDA 724 Gross Leverage Ratio 2.8 Net Leverage Ratio 2.6 |
|