
1ST QUARTER 2027 RESULTS May 27, 2026 THE PEOPLE CONNECTING AMERICA®
2 CAUTION CONCERNING FORWARD-LOOKING STATEMENTS This presentation contains forward-looking statements within the meaning of the Private Securities Litigation Reform Act of 1995. Forward looking statements can be identified with words such as “believe,” “expect,” “anticipate,” “estimate,” “intend,” “project,” “forecast,” “target,” “outlook,” “may,” “should,” “could,” and similar expressions, as well as statements written in the future tense. These statements, as well as any other written or oral forward-looking statements we may make from time to time in other SEC filings or other public communications are intended to qualify for the “safe harbor” from liability established by the Private Securities Litigation Reform Act of 1995. These forward-looking statements include those related to the Company’s current assumptions regarding future business and financial performance, including, but not limited to, those statements found under the “Outlook” section of this presentation. These forward-looking statements also include those related to the ability of the Company to consummate the anticipated transaction to acquire National Technology Integrators on a timely basis, or at all; the ability to retain the key employees of the acquired business; unfavorable reaction to the anticipated transaction by key stakeholders, including customers and employees; the ability of the Company to identify and recognize the anticipated benefits of the proposed transaction; and the ability to successfully integrate the acquired business and related operations. Forward-looking statements are based on management’s expectations, estimates and projections, are made solely as of the date these statements are made, and are subject to both known and unknown risks and uncertainties that may cause the actual results and occurrences discussed in these forward- looking statements to differ materially from those referenced or implied in the forward-looking statements contained in this presentation. The most significant of these known risks and uncertainties are described in the Company’s Form 10-K, Form 10-Q, and Form 8-K reports (including all amendments to those reports) and include: projections of revenues, income or loss, or capital expenditures; future economic conditions and trends in the industries we serve; changes in government policies and laws affecting our business, including related to funding for infrastructure projects, trade restrictions and tariff policies or changes to tax laws; our highly concentrated customer base; the competitive environment in which we operate; changes to customer capital budgets and spending priorities; our plans for future operations, growth and services, including contract backlog; our plans for future acquisitions, dispositions or financial needs; expected benefits and synergies of businesses acquired and future opportunities for the combined businesses; our significant accounts receivable and contract assets; the availability of capital; restrictions imposed by our senior notes and credit agreement; use of our cash flow to service our debt; potential liabilities or other adverse effects arising from occupational health, safety, and other regulatory matters; potential exposure to environmental liabilities; our potential exposure to litigation, indemnity claims, warranty claims, and other liabilities and disputes; whether the carrying value of the Company’s assets may be impaired; the impacts of public health emergencies; the impact of seasonality and adverse climate and weather conditions; the impact of technological change on our customers’ spending and our ability to keep pace with technological developments; our ability to attract qualified employees and subcontractors; the impact of a failure, outage or cybersecurity breach of our technology or information technology systems or those of third-party providers; and other risks and uncertainties detailed from time to time in the Company’s filings with the Securities and Exchange Commission. The Company does not undertake any obligation to update its forward- looking statements. NON-GAAP FINANCIAL MEASURES This presentation includes certain non-GAAP financial measures as defined by Regulation G of the SEC. As required by the SEC, an explanation of the non-GAAP financial measures and a reconciliation of those measures to the most directly comparable GAAP financial measures are provided beginning on slide 12 of this presentation. The Company does not reconcile its forward-looking non-GAAP financial measures to the corresponding U.S. GAAP measures, due to variability in making projections and/or certain information not being ascertainable; and because not all of the information and components necessary for a quantitative reconciliation of these forward-looking non-GAAP financial measures to the most directly comparable U.S. GAAP financial measure, is available to the Company without unreasonable efforts. For the same reasons, the Company is unable to address the probable significance of the unavailable information. Non-GAAP financial measures should be considered in addition to, but not as a substitute for, the Company’s reported GAAP results. IMPORTANT INFORMATION
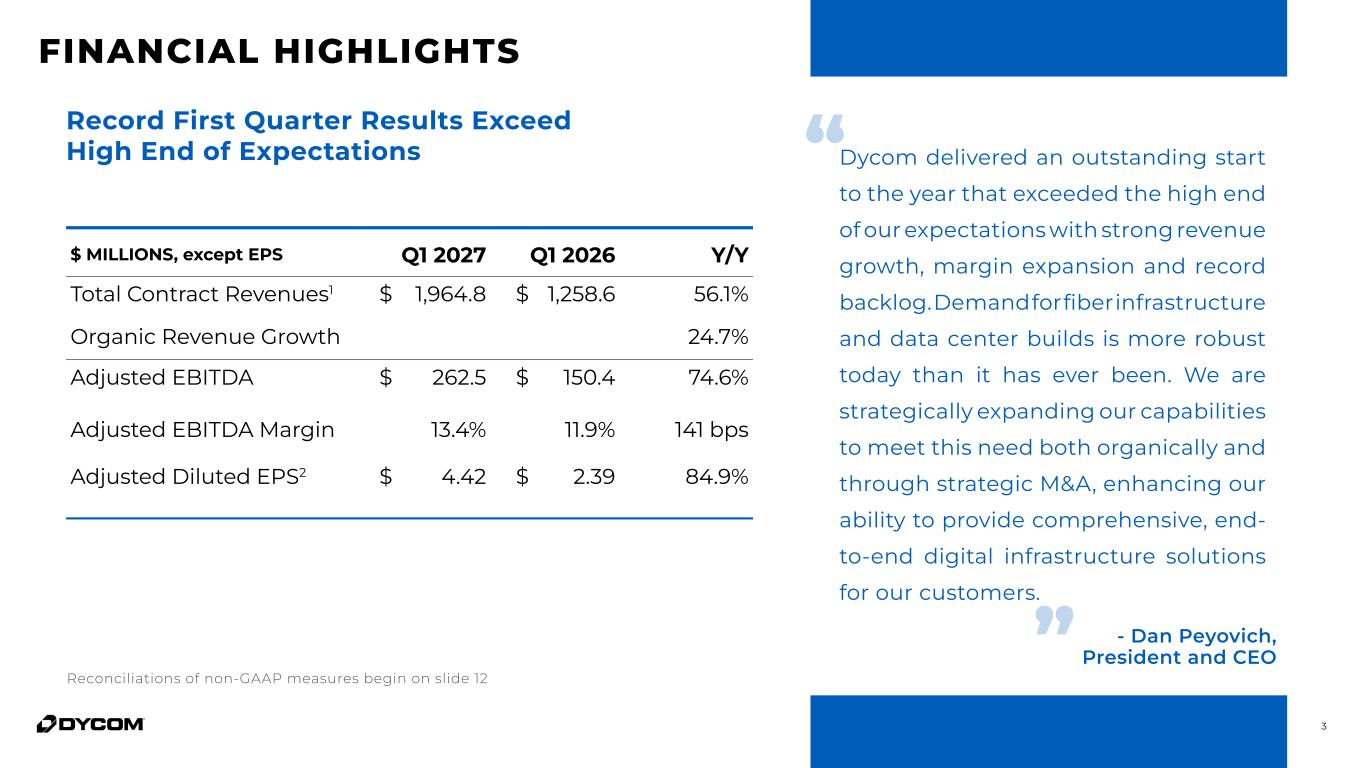
3 Dycom delivered an outstanding start to the year that exceeded the high end of our expectations with strong revenue growth, margin expansion and record backlog. Demand for fiber infrastructure and data center builds is more robust today than it has ever been. We are strategically expanding our capabilities to meet this need both organically and through strategic M&A, enhancing our ability to provide comprehensive, end- to-end digital infrastructure solutions for our customers. “ “ FINANCIAL HIGHLIGHTS Record First Quarter Results Exceed High End of Expectations $ MILLIONS, except EPS Q1 2027 Q1 2026 Y/Y Total Contract Revenues1 $ 1,964.8 $ 1,258.6 56.1% Organic Revenue Growth 24.7% Adjusted EBITDA $ 262.5 $ 150.4 74.6% Adjusted EBITDA Margin 13.4% 11.9% 141 bps Adjusted Diluted EPS2 $ 4.42 $ 2.39 84.9% Reconciliations of non-GAAP measures begin on slide 12 - Dan Peyovich, President and CEO
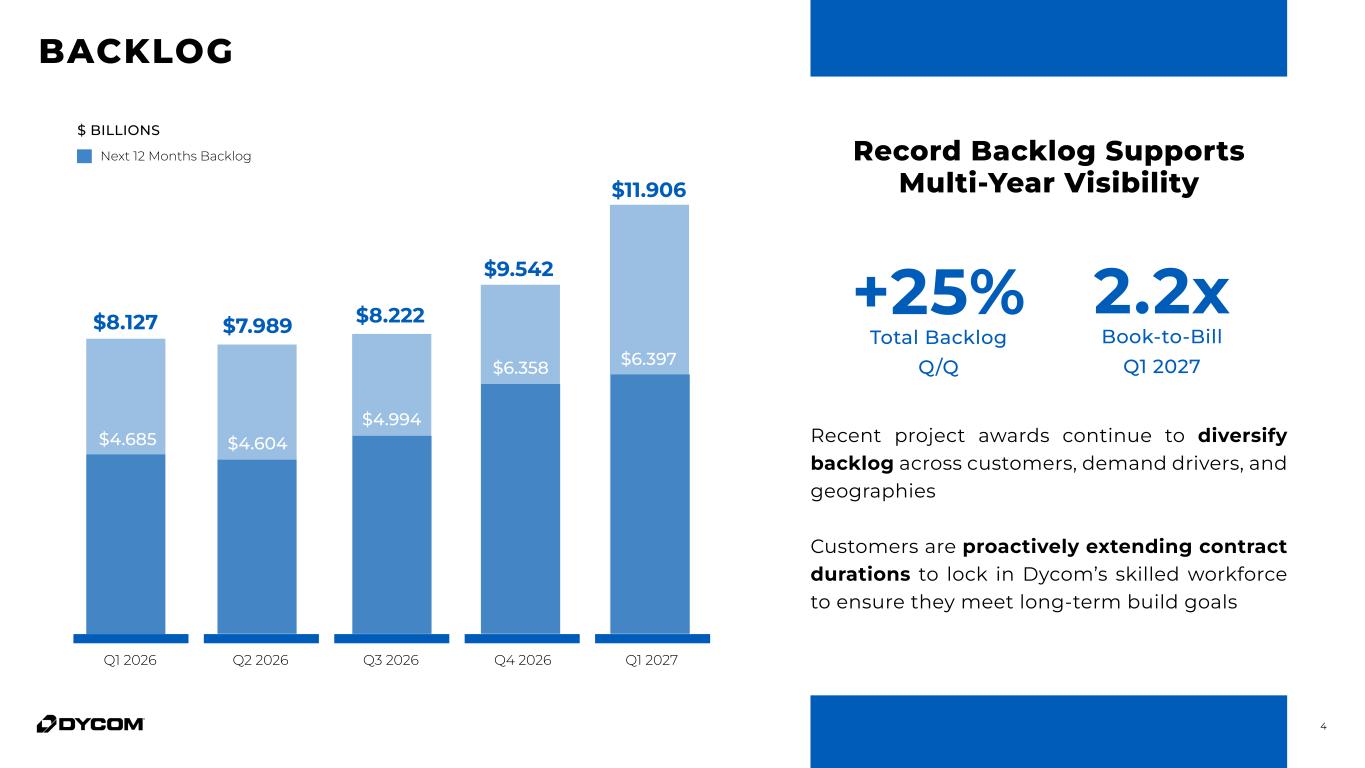
4 BACKLOG Record Backlog Supports Multi-Year Visibility $ BILLIONS Next 12 Months Backlog $11.906 $8.127 $7.989 Q1 2026 Q2 2026 Q3 2026 Q4 2026 Q1 2027 $6.397 $4.685 $4.604 $4.994 $6.358 $8.222 $9.542 2.2x Book-to-Bill Q1 2027 +25% Total Backlog Q/Q Recent project awards continue to diversify backlog across customers, demand drivers, and geographies Customers are proactively extending contract durations to lock in Dycom’s skilled workforce to ensure they meet long-term build goals
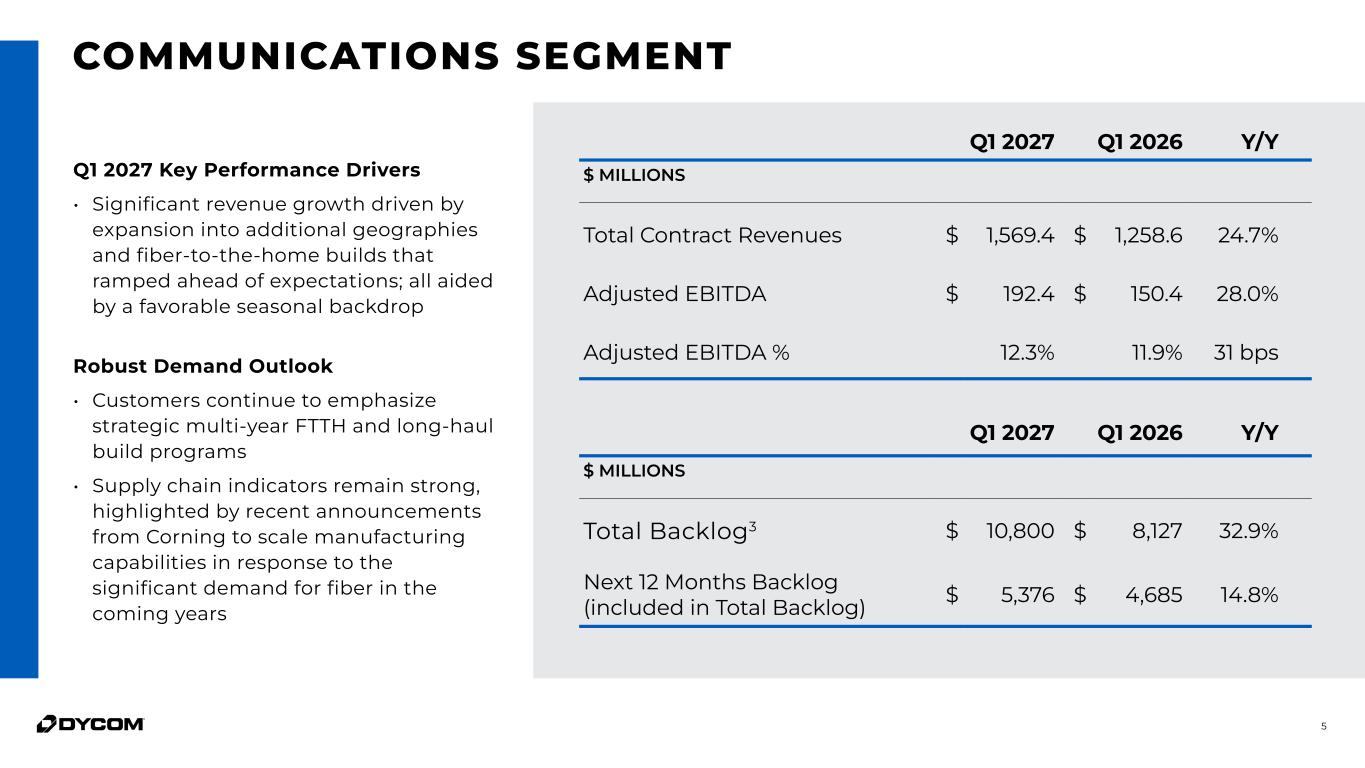
5 Q1 2027 Q1 2026 Y/Y $ MILLIONS Total Contract Revenues $ 1,569.4 $ 1,258.6 24.7% Adjusted EBITDA $ 192.4 $ 150.4 28.0% Adjusted EBITDA % 12.3% 11.9% 31 bps Q1 2027 Q1 2026 Y/Y $ MILLIONS Total Backlog3 $ 10,800 $ 8,127 32.9% Next 12 Months Backlog (included in Total Backlog) $ 5,376 $ 4,685 14.8% Q1 2027 Key Performance Drivers • Significant revenue growth driven by expansion into additional geographies and fiber-to-the-home builds that ramped ahead of expectations; all aided by a favorable seasonal backdrop Robust Demand Outlook • Customers continue to emphasize strategic multi-year FTTH and long-haul build programs • Supply chain indicators remain strong, highlighted by recent announcements from Corning to scale manufacturing capabilities in response to the significant demand for fiber in the coming years COMMUNICATIONS SEGMENT
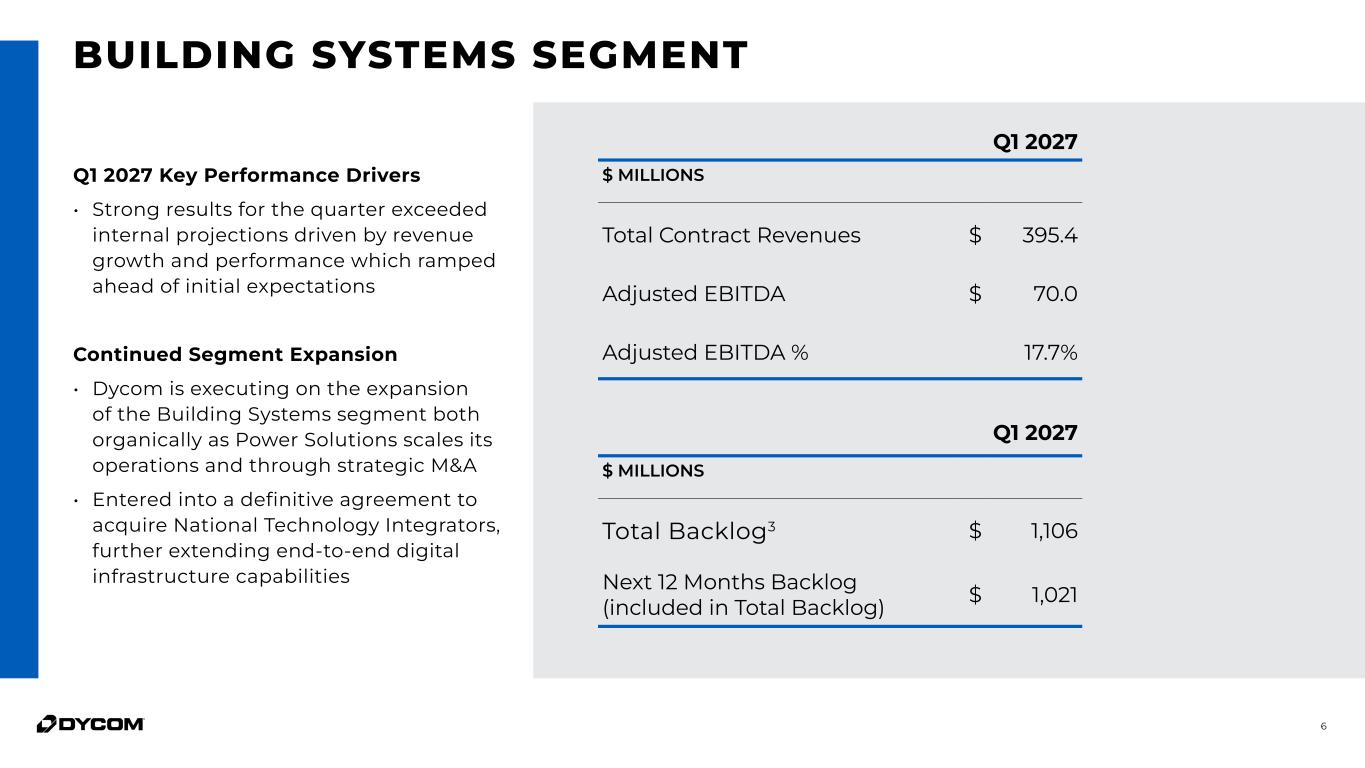
BUILDING SYSTEMS SEGMENT 6 Q1 2027 $ MILLIONS Total Contract Revenues $ 395.4 Adjusted EBITDA $ 70.0 Adjusted EBITDA % 17.7% Q1 2027 $ MILLIONS Total Backlog3 $ 1,106 Next 12 Months Backlog (included in Total Backlog) $ 1,021 Q1 2027 Key Performance Drivers • Strong results for the quarter exceeded internal projections driven by revenue growth and performance which ramped ahead of initial expectations Continued Segment Expansion • Dycom is executing on the expansion of the Building Systems segment both organically as Power Solutions scales its operations and through strategic M&A • Entered into a definitive agreement to acquire National Technology Integrators, further extending end-to-end digital infrastructure capabilities
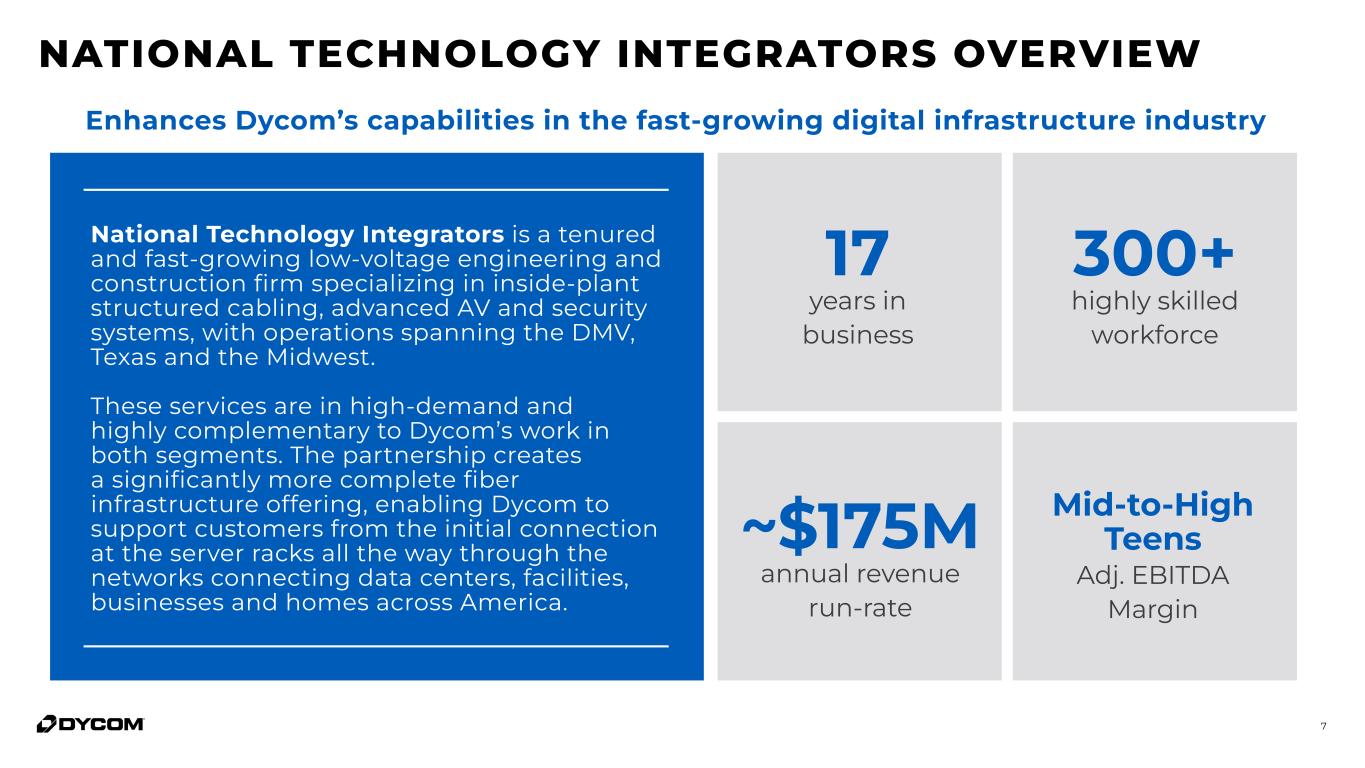
7 Enhances Dycom’s capabilities in the fast-growing digital infrastructure industry 17 years in business ~$175M annual revenue run-rate 300+ highly skilled workforce Mid-to-High Teens Adj. EBITDA Margin National Technology Integrators is a tenured and fast-growing low-voltage engineering and construction firm specializing in inside-plant structured cabling, advanced AV and security systems, with operations spanning the DMV, Texas and the Midwest. These services are in high-demand and highly complementary to Dycom’s work in both segments. The partnership creates a significantly more complete fiber infrastructure offering, enabling Dycom to support customers from the initial connection at the server racks all the way through the networks connecting data centers, facilities, businesses and homes across America. NATIONAL TECHNOLOGY INTEGRATORS OVERVIEW
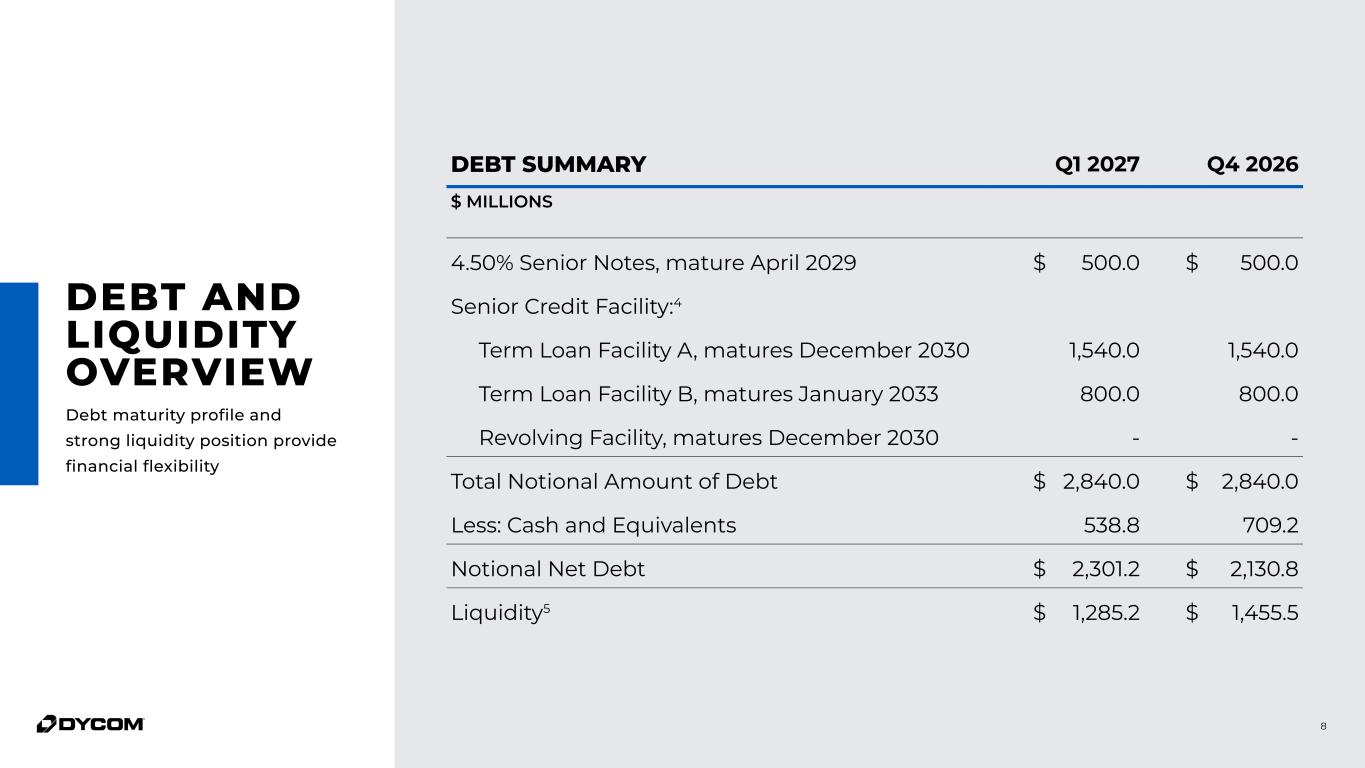
DEBT AND LIQUIDITY OVERVIEW Debt maturity profile and strong liquidity position provide financial flexibility DEBT SUMMARY Q1 2027 Q4 2026 $ MILLIONS 4.50% Senior Notes, mature April 2029 $ 500.0 $ 500.0 Senior Credit Facility:4 Term Loan Facility A, matures December 2030 1,540.0 1,540.0 Term Loan Facility B, matures January 2033 800.0 800.0 Revolving Facility, matures December 2030 - - Total Notional Amount of Debt $ 2,840.0 $ 2,840.0 Less: Cash and Equivalents 538.8 709.2 Notional Net Debt $ 2,301.2 $ 2,130.8 Liquidity5 $ 1,285.2 $ 1,455.5 8
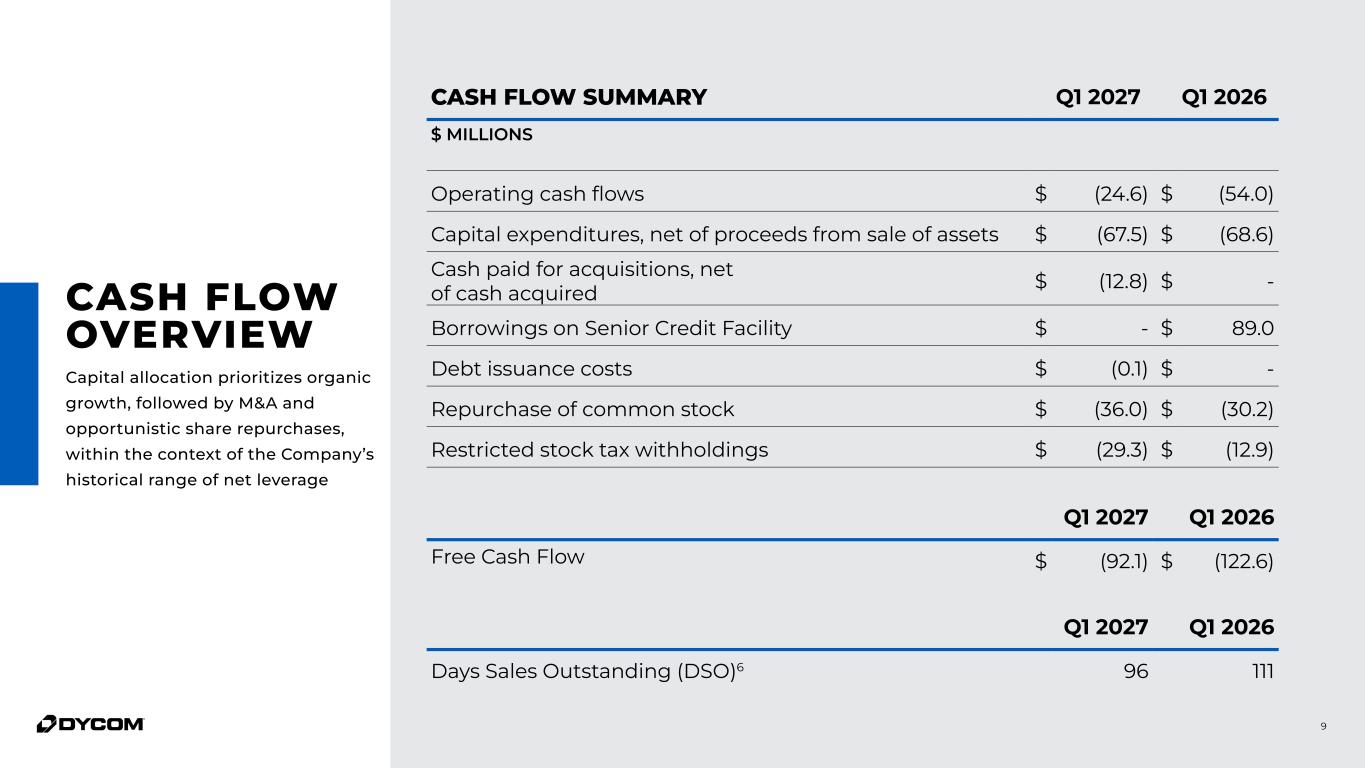
CASH FLOW OVERVIEW Capital allocation prioritizes organic growth, followed by M&A and opportunistic share repurchases, within the context of the Company’s historical range of net leverage CASH FLOW SUMMARY Q1 2027 Q1 2026 $ MILLIONS Operating cash flows $ (24.6) $ (54.0) Capital expenditures, net of proceeds from sale of assets $ (67.5) $ (68.6) Cash paid for acquisitions, net of cash acquired $ (12.8) $ - Borrowings on Senior Credit Facility $ - $ 89.0 Debt issuance costs $ (0.1) $ - Repurchase of common stock $ (36.0) $ (30.2) Restricted stock tax withholdings $ (29.3) $ (12.9) Q1 2027 Q1 2026 Free Cash Flow $ (92.1) $ (122.6) Q1 2027 Q1 2026 Days Sales Outstanding (DSO)6 96 111 9
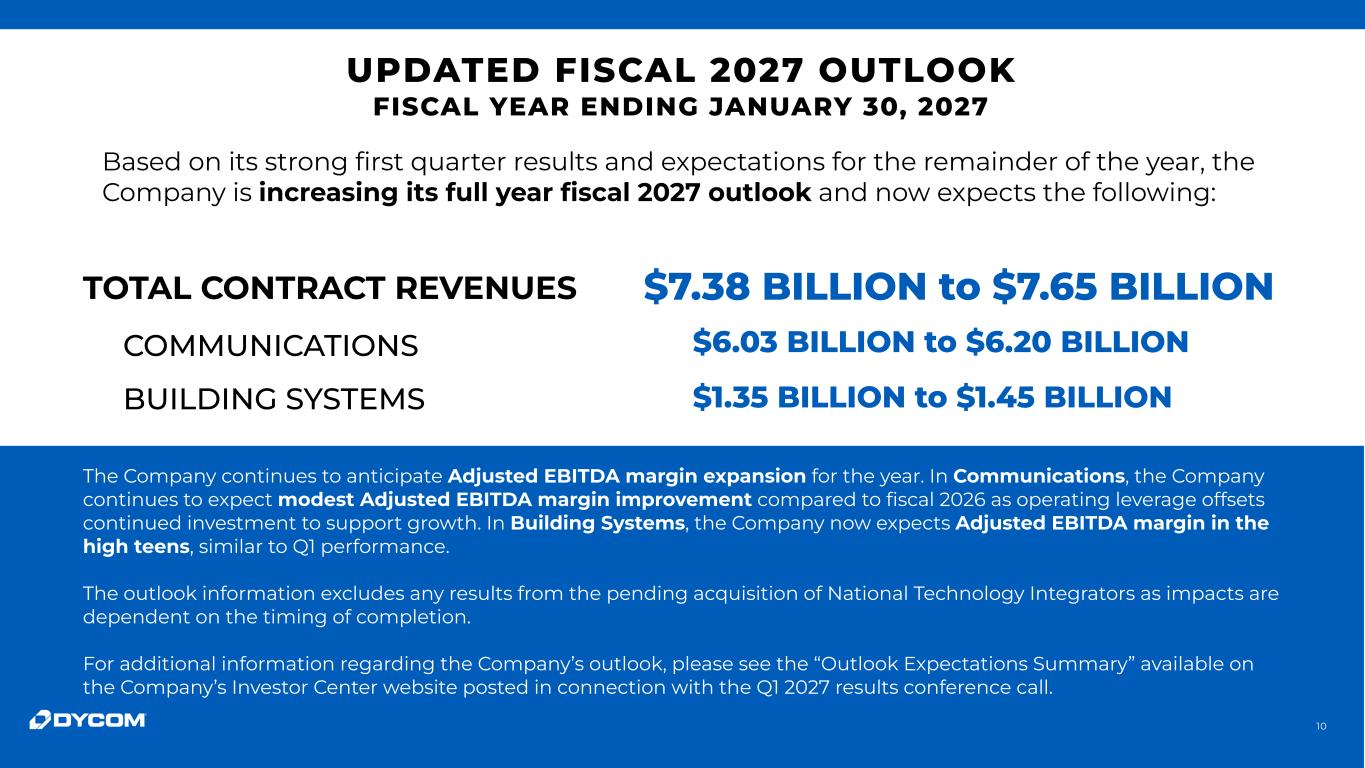
10 $7.38 BILLION to $7.65 BILLIONTOTAL CONTRACT REVENUES UPDATED FISCAL 2027 OUTLOOK FISCAL YEAR ENDING JANUARY 30, 2027 COMMUNICATIONS BUILDING SYSTEMS $6.03 BILLION to $6.20 BILLION $1.35 BILLION to $1.45 BILLION The Company continues to anticipate Adjusted EBITDA margin expansion for the year. In Communications, the Company continues to expect modest Adjusted EBITDA margin improvement compared to fiscal 2026 as operating leverage offsets continued investment to support growth. In Building Systems, the Company now expects Adjusted EBITDA margin in the high teens, similar to Q1 performance. The outlook information excludes any results from the pending acquisition of National Technology Integrators as impacts are dependent on the timing of completion. For additional information regarding the Company’s outlook, please see the “Outlook Expectations Summary” available on the Company’s Investor Center website posted in connection with the Q1 2027 results conference call. Based on its strong first quarter results and expectations for the remainder of the year, the Company is increasing its full year fiscal 2027 outlook and now expects the following:
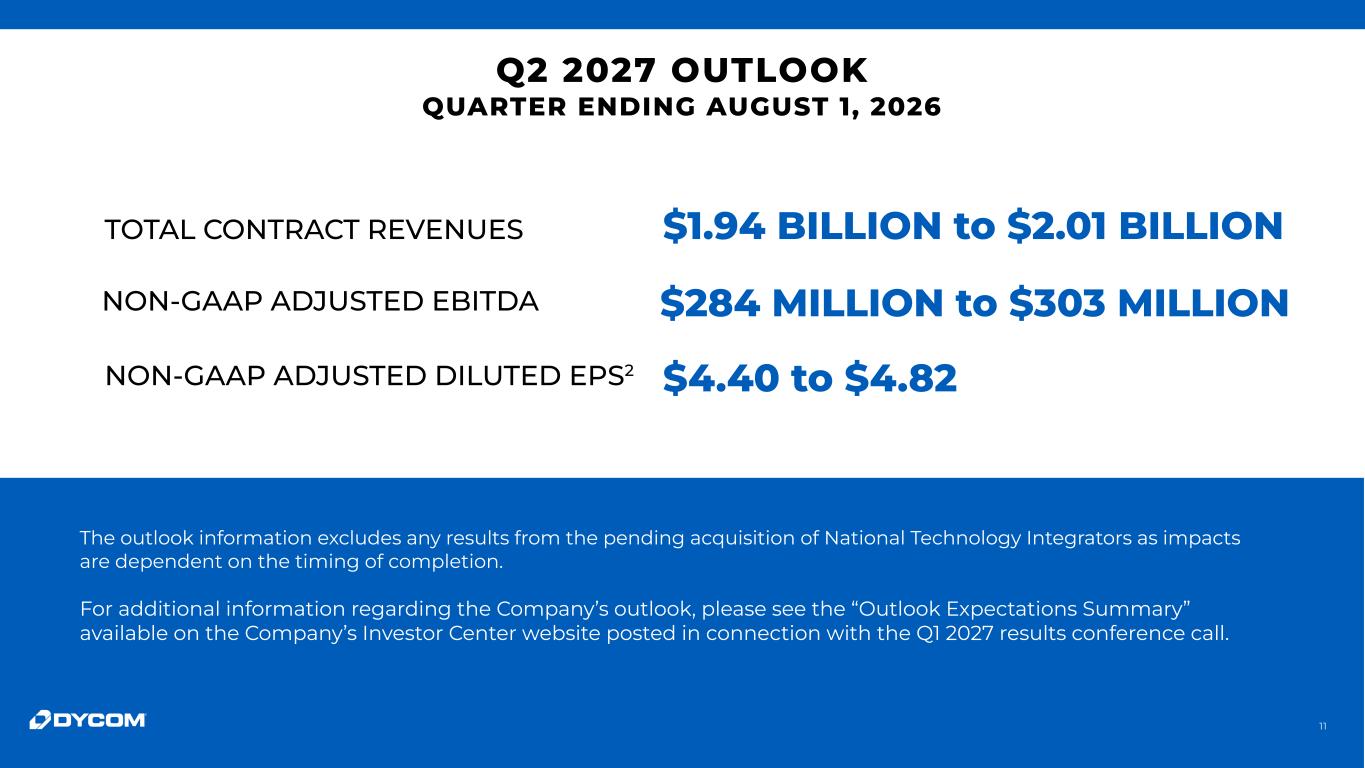
11 Q2 2027 OUTLOOK QUARTER ENDING AUGUST 1, 2026 $1.94 BILLION to $2.01 BILLIONTOTAL CONTRACT REVENUES $284 MILLION to $303 MILLIONNON-GAAP ADJUSTED EBITDA NON-GAAP ADJUSTED DILUTED EPS2 $4.40 to $4.82 The outlook information excludes any results from the pending acquisition of National Technology Integrators as impacts are dependent on the timing of completion. For additional information regarding the Company’s outlook, please see the “Outlook Expectations Summary” available on the Company’s Investor Center website posted in connection with the Q1 2027 results conference call.
Q1 2027 NON-GAAP RECONCILIATIONS
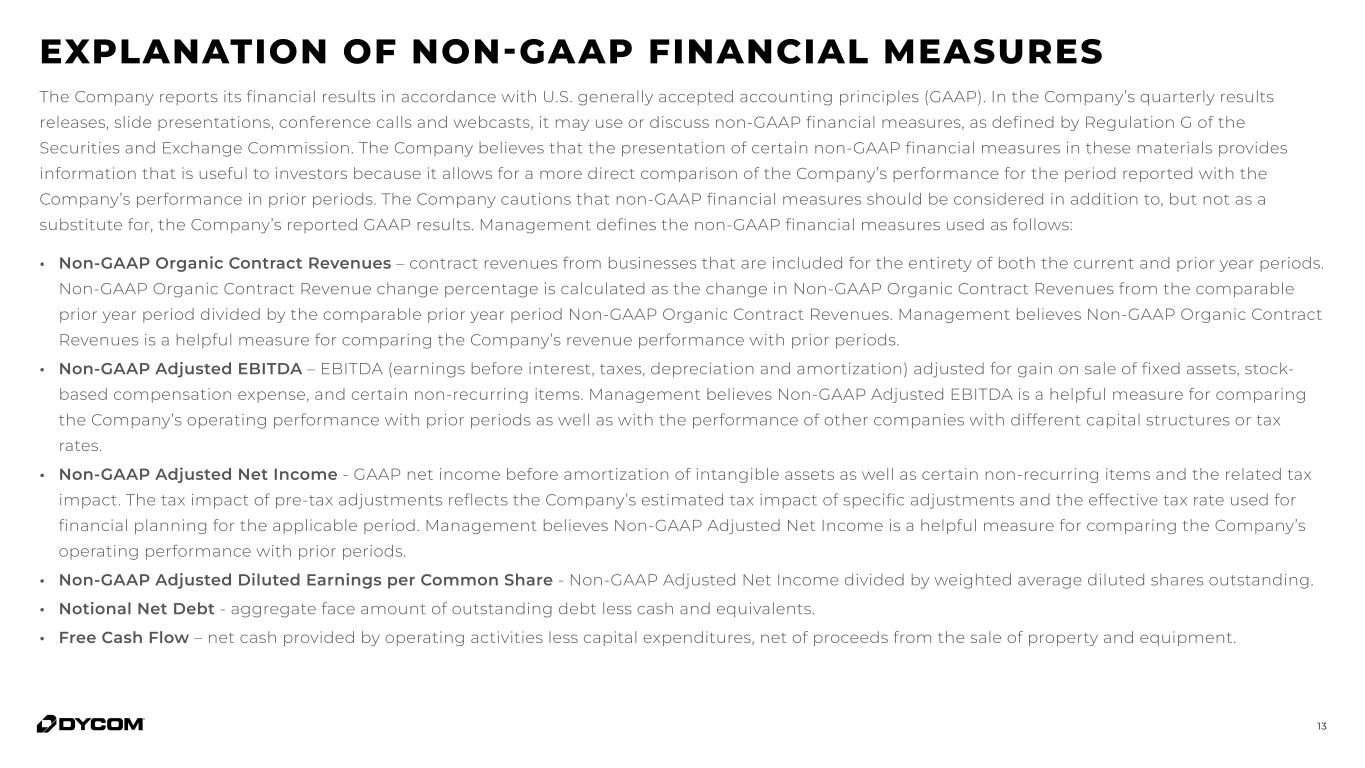
13 The Company reports its financial results in accordance with U.S. generally accepted accounting principles (GAAP). In the Company’s quarterly results releases, slide presentations, conference calls and webcasts, it may use or discuss non-GAAP financial measures, as defined by Regulation G of the Securities and Exchange Commission. The Company believes that the presentation of certain non-GAAP financial measures in these materials provides information that is useful to investors because it allows for a more direct comparison of the Company’s performance for the period reported with the Company’s performance in prior periods. The Company cautions that non-GAAP financial measures should be considered in addition to, but not as a substitute for, the Company’s reported GAAP results. Management defines the non-GAAP financial measures used as follows: • Non-GAAP Organic Contract Revenues – contract revenues from businesses that are included for the entirety of both the current and prior year periods. Non-GAAP Organic Contract Revenue change percentage is calculated as the change in Non-GAAP Organic Contract Revenues from the comparable prior year period divided by the comparable prior year period Non-GAAP Organic Contract Revenues. Management believes Non-GAAP Organic Contract Revenues is a helpful measure for comparing the Company’s revenue performance with prior periods. • Non-GAAP Adjusted EBITDA – EBITDA (earnings before interest, taxes, depreciation and amortization) adjusted for gain on sale of fixed assets, stock- based compensation expense, and certain non-recurring items. Management believes Non-GAAP Adjusted EBITDA is a helpful measure for comparing the Company’s operating performance with prior periods as well as with the performance of other companies with different capital structures or tax rates. • Non-GAAP Adjusted Net Income - GAAP net income before amortization of intangible assets as well as certain non-recurring items and the related tax impact. The tax impact of pre-tax adjustments reflects the Company’s estimated tax impact of specific adjustments and the effective tax rate used for financial planning for the applicable period. Management believes Non-GAAP Adjusted Net Income is a helpful measure for comparing the Company’s operating performance with prior periods. • Non-GAAP Adjusted Diluted Earnings per Common Share - Non-GAAP Adjusted Net Income divided by weighted average diluted shares outstanding. • Notional Net Debt - aggregate face amount of outstanding debt less cash and equivalents. • Free Cash Flow – net cash provided by operating activities less capital expenditures, net of proceeds from the sale of property and equipment. EXPLANATION OF NON-GAAP FINANCIAL MEASURES
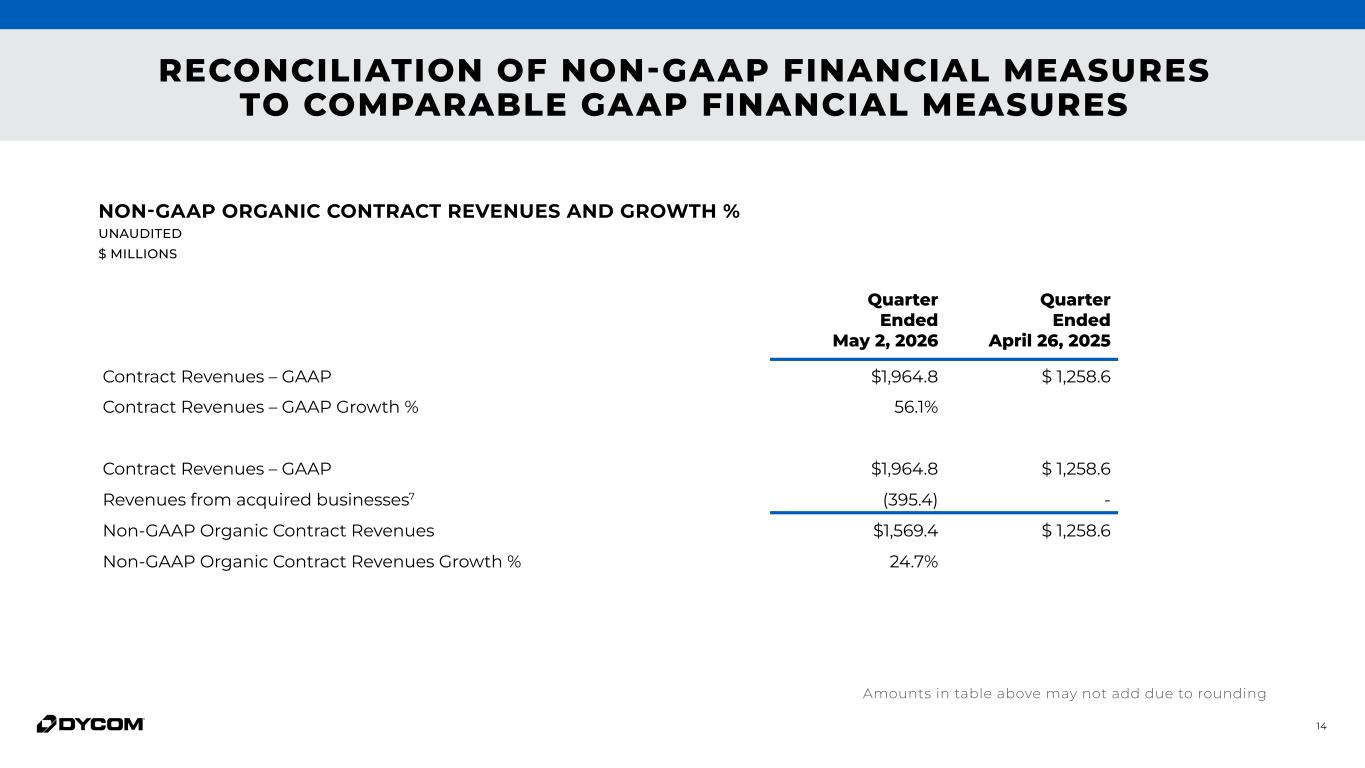
14 RECONCILIATION OF NON-GAAP FINANCIAL MEASURES TO COMPARABLE GAAP FINANCIAL MEASURES Quarter Ended May 2, 2026 Quarter Ended April 26, 2025 Contract Revenues – GAAP $1,964.8 $ 1,258.6 Contract Revenues – GAAP Growth % 56.1% Contract Revenues – GAAP $1,964.8 $ 1,258.6 Revenues from acquired businesses7 (395.4) - Non-GAAP Organic Contract Revenues $1,569.4 $ 1,258.6 Non-GAAP Organic Contract Revenues Growth % 24.7% NON-GAAP ORGANIC CONTRACT REVENUES AND GROWTH % UNAUDITED $ MILLIONS Amounts in table above may not add due to rounding
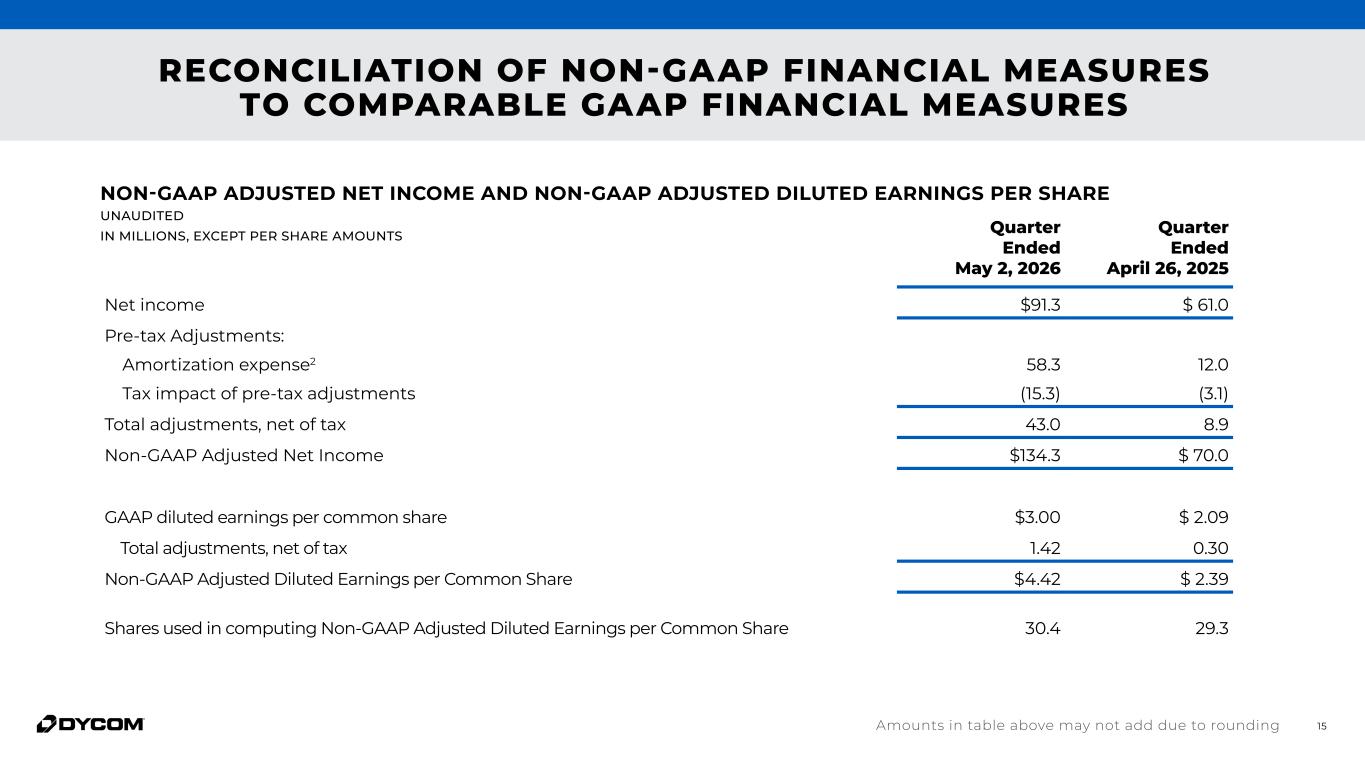
15 Quarter Ended May 2, 2026 Quarter Ended April 26, 2025 Net income $91.3 $ 61.0 Pre-tax Adjustments: Amortization expense2 58.3 12.0 Tax impact of pre-tax adjustments (15.3) (3.1) Total adjustments, net of tax 43.0 8.9 Non-GAAP Adjusted Net Income $134.3 $ 70.0 GAAP diluted earnings per common share $3.00 $ 2.09 Total adjustments, net of tax 1.42 0.30 Non-GAAP Adjusted Diluted Earnings per Common Share $4.42 $ 2.39 Shares used in computing Non-GAAP Adjusted Diluted Earnings per Common Share 30.4 29.3 NON-GAAP ADJUSTED NET INCOME AND NON-GAAP ADJUSTED DILUTED EARNINGS PER SHARE UNAUDITED IN MILLIONS, EXCEPT PER SHARE AMOUNTS Amounts in table above may not add due to rounding RECONCILIATION OF NON-GAAP FINANCIAL MEASURES TO COMPARABLE GAAP FINANCIAL MEASURES
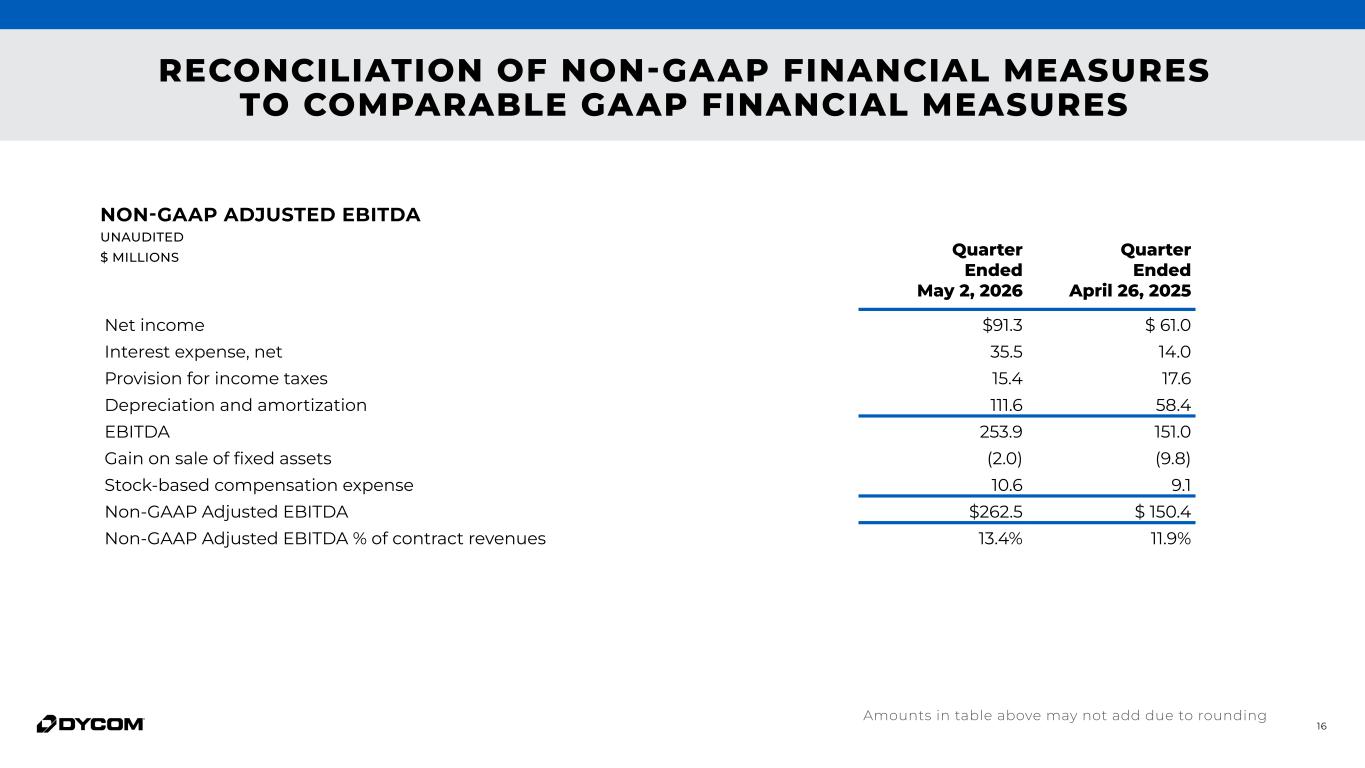
16 Quarter Ended May 2, 2026 Quarter Ended April 26, 2025 Net income $91.3 $ 61.0 Interest expense, net 35.5 14.0 Provision for income taxes 15.4 17.6 Depreciation and amortization 111.6 58.4 EBITDA 253.9 151.0 Gain on sale of fixed assets (2.0) (9.8) Stock-based compensation expense 10.6 9.1 Non-GAAP Adjusted EBITDA $262.5 $ 150.4 Non-GAAP Adjusted EBITDA % of contract revenues 13.4% 11.9% NON-GAAP ADJUSTED EBITDA UNAUDITED $ MILLIONS Amounts in table above may not add due to rounding RECONCILIATION OF NON-GAAP FINANCIAL MEASURES TO COMPARABLE GAAP FINANCIAL MEASURES
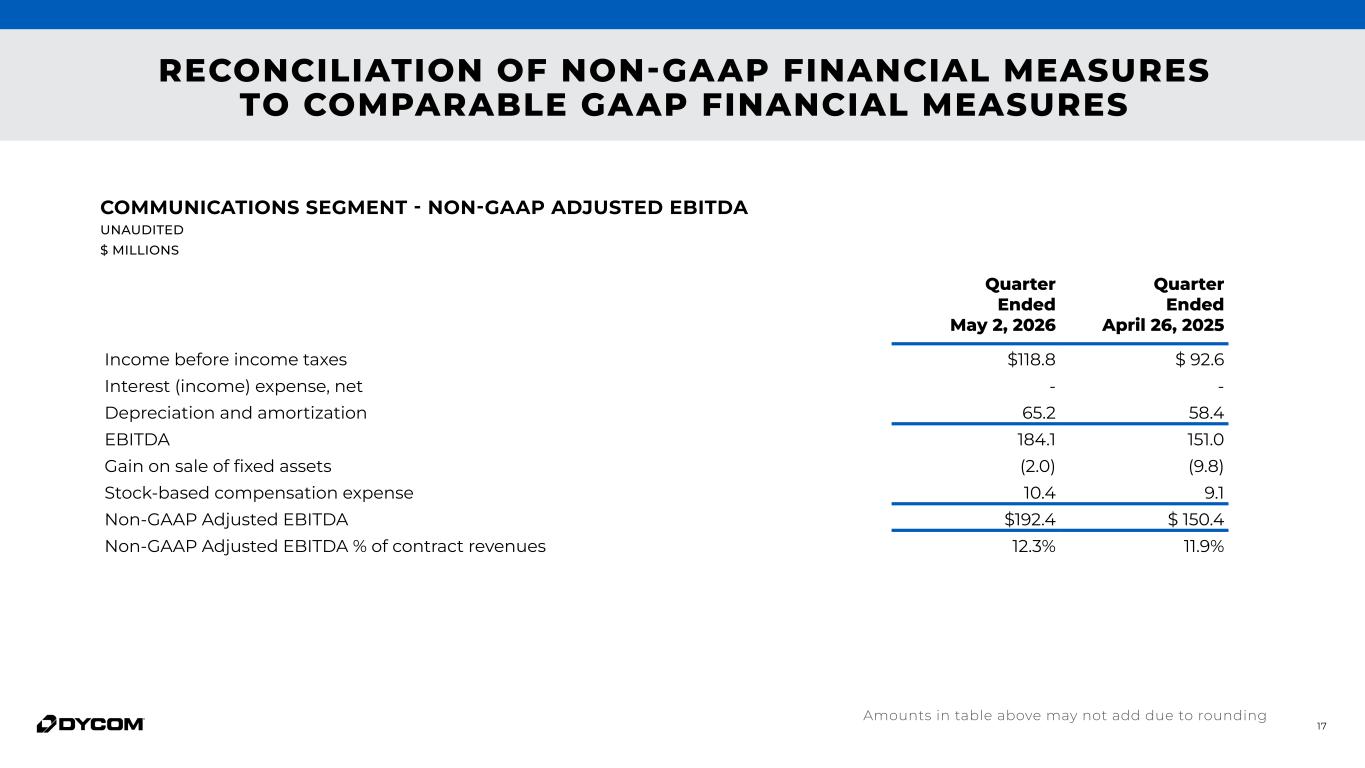
17 Quarter Ended May 2, 2026 Quarter Ended April 26, 2025 Income before income taxes $118.8 $ 92.6 Interest (income) expense, net - - Depreciation and amortization 65.2 58.4 EBITDA 184.1 151.0 Gain on sale of fixed assets (2.0) (9.8) Stock-based compensation expense 10.4 9.1 Non-GAAP Adjusted EBITDA $192.4 $ 150.4 Non-GAAP Adjusted EBITDA % of contract revenues 12.3% 11.9% COMMUNICATIONS SEGMENT - NON-GAAP ADJUSTED EBITDA UNAUDITED $ MILLIONS Amounts in table above may not add due to rounding RECONCILIATION OF NON-GAAP FINANCIAL MEASURES TO COMPARABLE GAAP FINANCIAL MEASURES
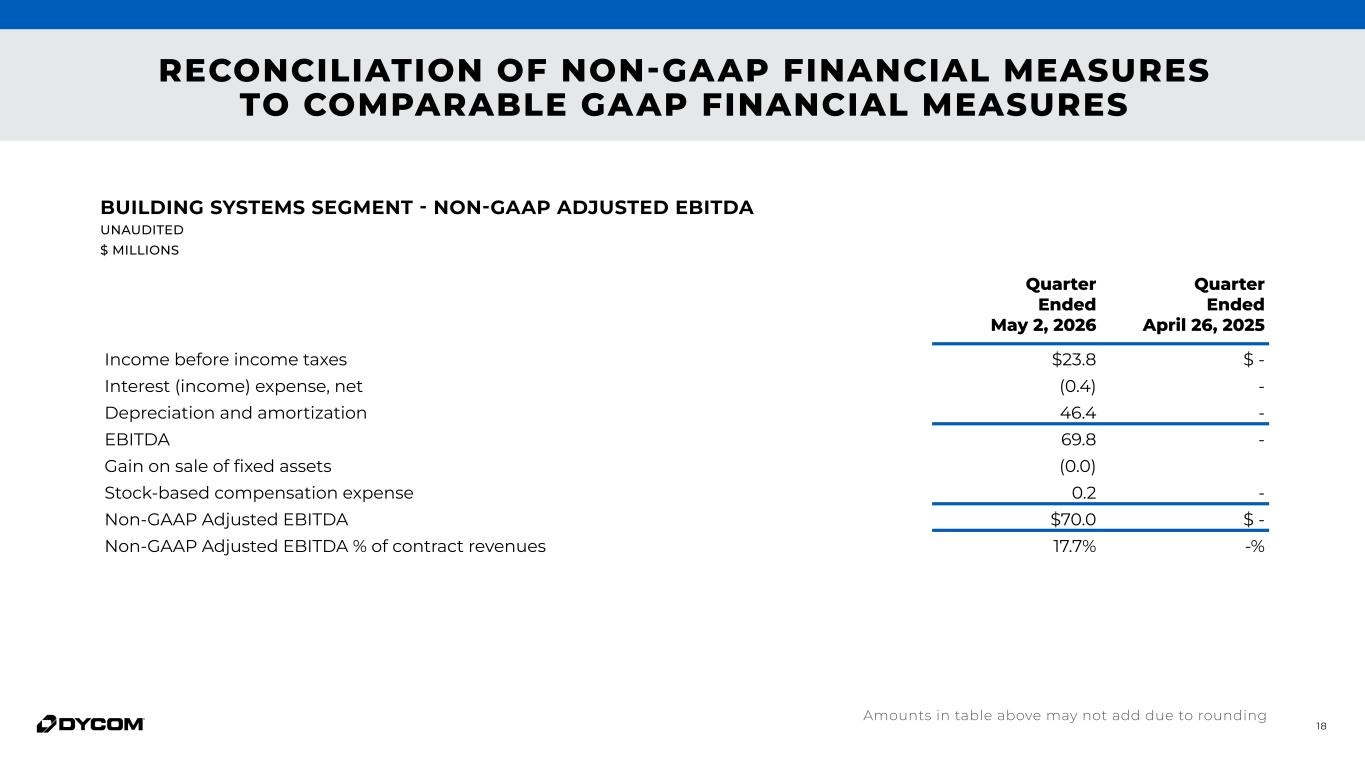
18 Quarter Ended May 2, 2026 Quarter Ended April 26, 2025 Income before income taxes $23.8 $ - Interest (income) expense, net (0.4) - Depreciation and amortization 46.4 - EBITDA 69.8 - Gain on sale of fixed assets (0.0) Stock-based compensation expense 0.2 - Non-GAAP Adjusted EBITDA $70.0 $ - Non-GAAP Adjusted EBITDA % of contract revenues 17.7% -% BUILDING SYSTEMS SEGMENT - NON-GAAP ADJUSTED EBITDA UNAUDITED $ MILLIONS Amounts in table above may not add due to rounding RECONCILIATION OF NON-GAAP FINANCIAL MEASURES TO COMPARABLE GAAP FINANCIAL MEASURES
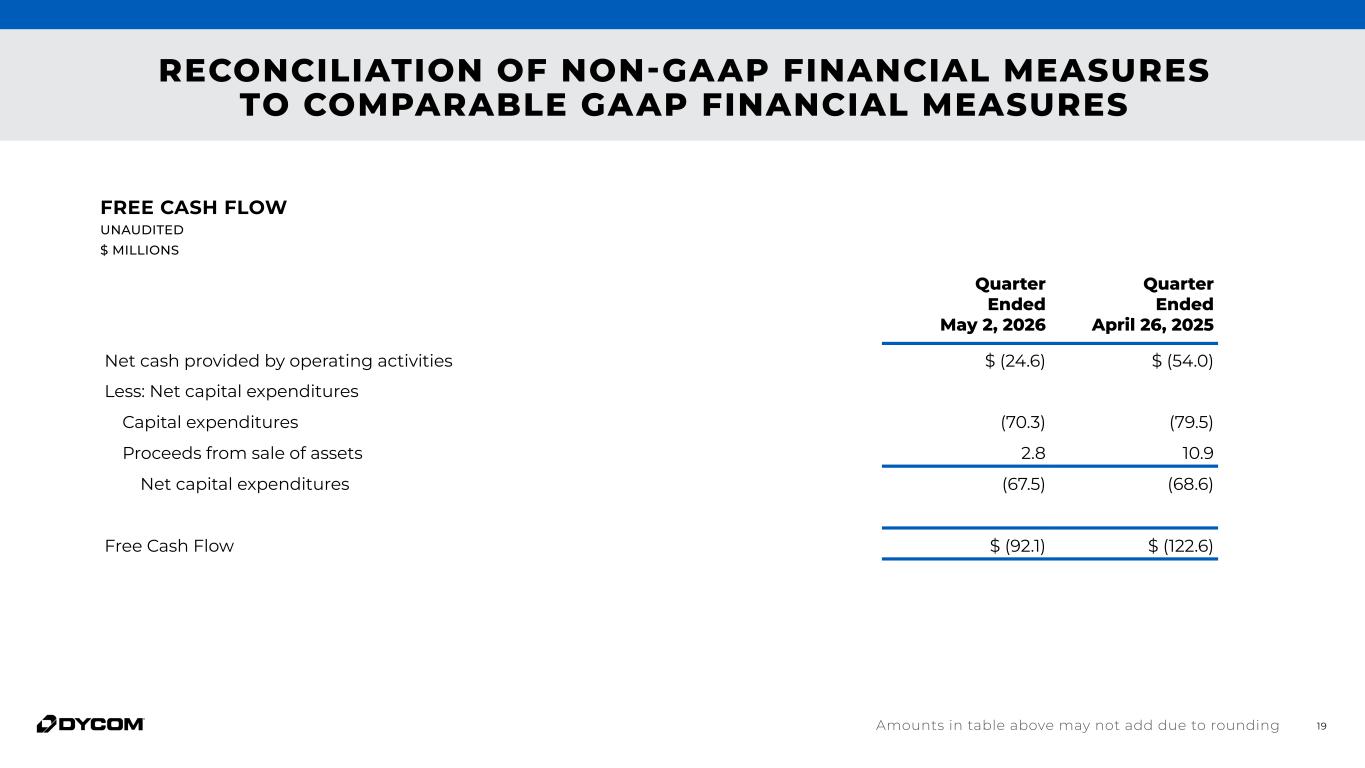
19 Quarter Ended May 2, 2026 Quarter Ended April 26, 2025 Net cash provided by operating activities $ (24.6) $ (54.0) Less: Net capital expenditures Capital expenditures (70.3) (79.5) Proceeds from sale of assets 2.8 10.9 Net capital expenditures (67.5) (68.6) Free Cash Flow $ (92.1) $ (122.6) FREE CASH FLOW UNAUDITED $ MILLIONS Amounts in table above may not add due to rounding RECONCILIATION OF NON-GAAP FINANCIAL MEASURES TO COMPARABLE GAAP FINANCIAL MEASURES
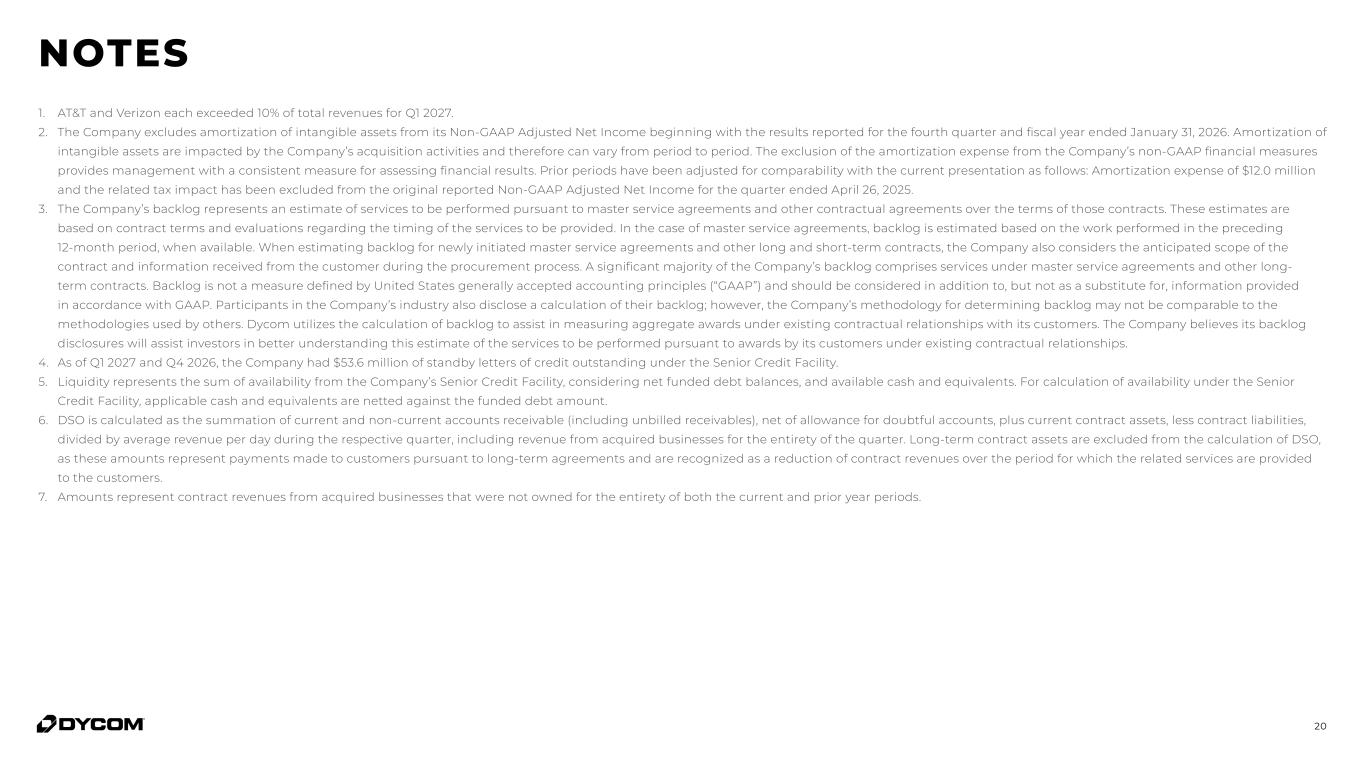
20 1. AT&T and Verizon each exceeded 10% of total revenues for Q1 2027. 2. The Company excludes amortization of intangible assets from its Non-GAAP Adjusted Net Income beginning with the results reported for the fourth quarter and fiscal year ended January 31, 2026. Amortization of intangible assets are impacted by the Company’s acquisition activities and therefore can vary from period to period. The exclusion of the amortization expense from the Company’s non-GAAP financial measures provides management with a consistent measure for assessing financial results. Prior periods have been adjusted for comparability with the current presentation as follows: Amortization expense of $12.0 million and the related tax impact has been excluded from the original reported Non-GAAP Adjusted Net Income for the quarter ended April 26, 2025. 3. The Company’s backlog represents an estimate of services to be performed pursuant to master service agreements and other contractual agreements over the terms of those contracts. These estimates are based on contract terms and evaluations regarding the timing of the services to be provided. In the case of master service agreements, backlog is estimated based on the work performed in the preceding 12-month period, when available. When estimating backlog for newly initiated master service agreements and other long and short-term contracts, the Company also considers the anticipated scope of the contract and information received from the customer during the procurement process. A significant majority of the Company’s backlog comprises services under master service agreements and other long- term contracts. Backlog is not a measure defined by United States generally accepted accounting principles (“GAAP”) and should be considered in addition to, but not as a substitute for, information provided in accordance with GAAP. Participants in the Company’s industry also disclose a calculation of their backlog; however, the Company’s methodology for determining backlog may not be comparable to the methodologies used by others. Dycom utilizes the calculation of backlog to assist in measuring aggregate awards under existing contractual relationships with its customers. The Company believes its backlog disclosures will assist investors in better understanding this estimate of the services to be performed pursuant to awards by its customers under existing contractual relationships. 4. As of Q1 2027 and Q4 2026, the Company had $53.6 million of standby letters of credit outstanding under the Senior Credit Facility. 5. Liquidity represents the sum of availability from the Company’s Senior Credit Facility, considering net funded debt balances, and available cash and equivalents. For calculation of availability under the Senior Credit Facility, applicable cash and equivalents are netted against the funded debt amount. 6. DSO is calculated as the summation of current and non-current accounts receivable (including unbilled receivables), net of allowance for doubtful accounts, plus current contract assets, less contract liabilities, divided by average revenue per day during the respective quarter, including revenue from acquired businesses for the entirety of the quarter. Long-term contract assets are excluded from the calculation of DSO, as these amounts represent payments made to customers pursuant to long-term agreements and are recognized as a reduction of contract revenues over the period for which the related services are provided to the customers. 7. Amounts represent contract revenues from acquired businesses that were not owned for the entirety of both the current and prior year periods. NOTES
21 Callie Tomasso VP Investor Relations & Corporate Communications (561) 799-2260 InvestorRelations@dycomind.com 300 Banyan Boulevard, Suite 1101 West Palm Beach, FL 33401 (561) 627-7171 dycomind.com dycom-industries CONTACT US Investor and Media Contact Corporate Office

THE PEOPLE CONNECTING AMERICA®