Bank of America 2Q26 Financial Results July 14, 2026
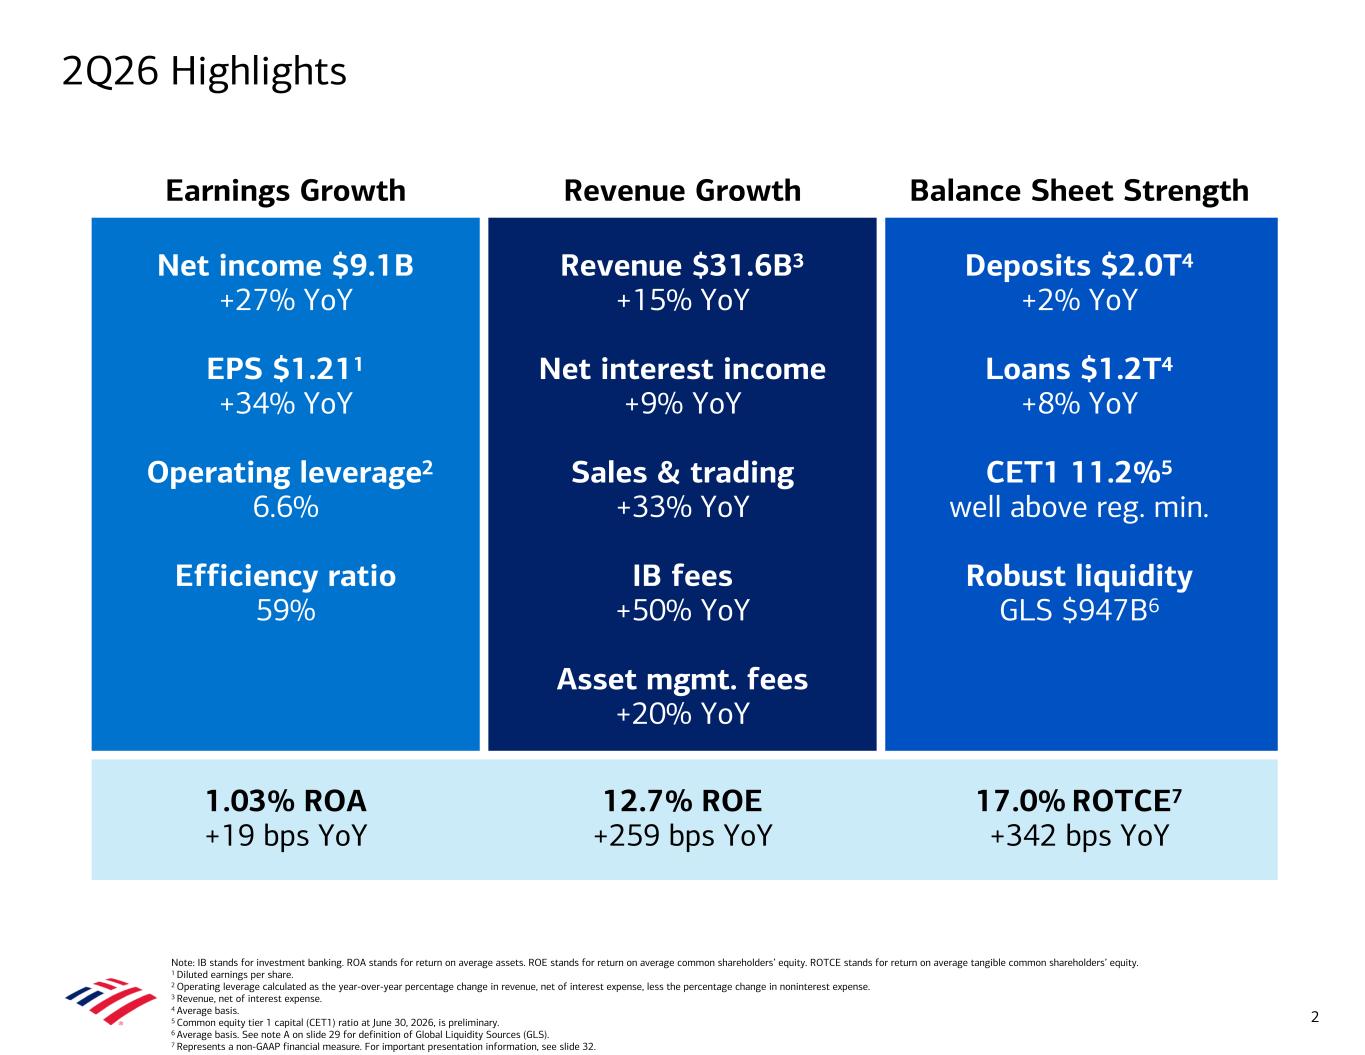
Note: IB stands for investment banking. ROA stands for return on average assets. ROE stands for return on average common shareholders’ equity. ROTCE stands for return on average tangible common shareholders’ equity. 1 Diluted earnings per share. 2 Operating leverage calculated as the year-over-year percentage change in revenue, net of interest expense, less the percentage change in noninterest expense. 3 Revenue, net of interest expense. 4 Average basis. 5 Common equity tier 1 capital (CET1) ratio at June 30, 2026, is preliminary. 6 Average basis. See note A on slide 29 for definition of Global Liquidity Sources (GLS). 7 Represents a non-GAAP financial measure. For important presentation information, see slide 32. Earnings Growth Revenue Growth Balance Sheet Strength Net income $9.1B +27% YoY EPS $1.211 +34% YoY Operating leverage2 6.6% Efficiency ratio 59% Revenue $31.6B3 +15% YoY Net interest income +9% YoY Sales & trading +33% YoY IB fees +50% YoY Asset mgmt. fees +20% YoY Deposits $2.0T4 +2% YoY Loans $1.2T4 +8% YoY CET1 11.2%5 well above reg. min. Robust liquidity GLS $947B6 1.03% ROA +19 bps YoY 12.7% ROE +259 bps YoY 17.0% ROTCE7 +342 bps YoY 2Q26 Highlights 2
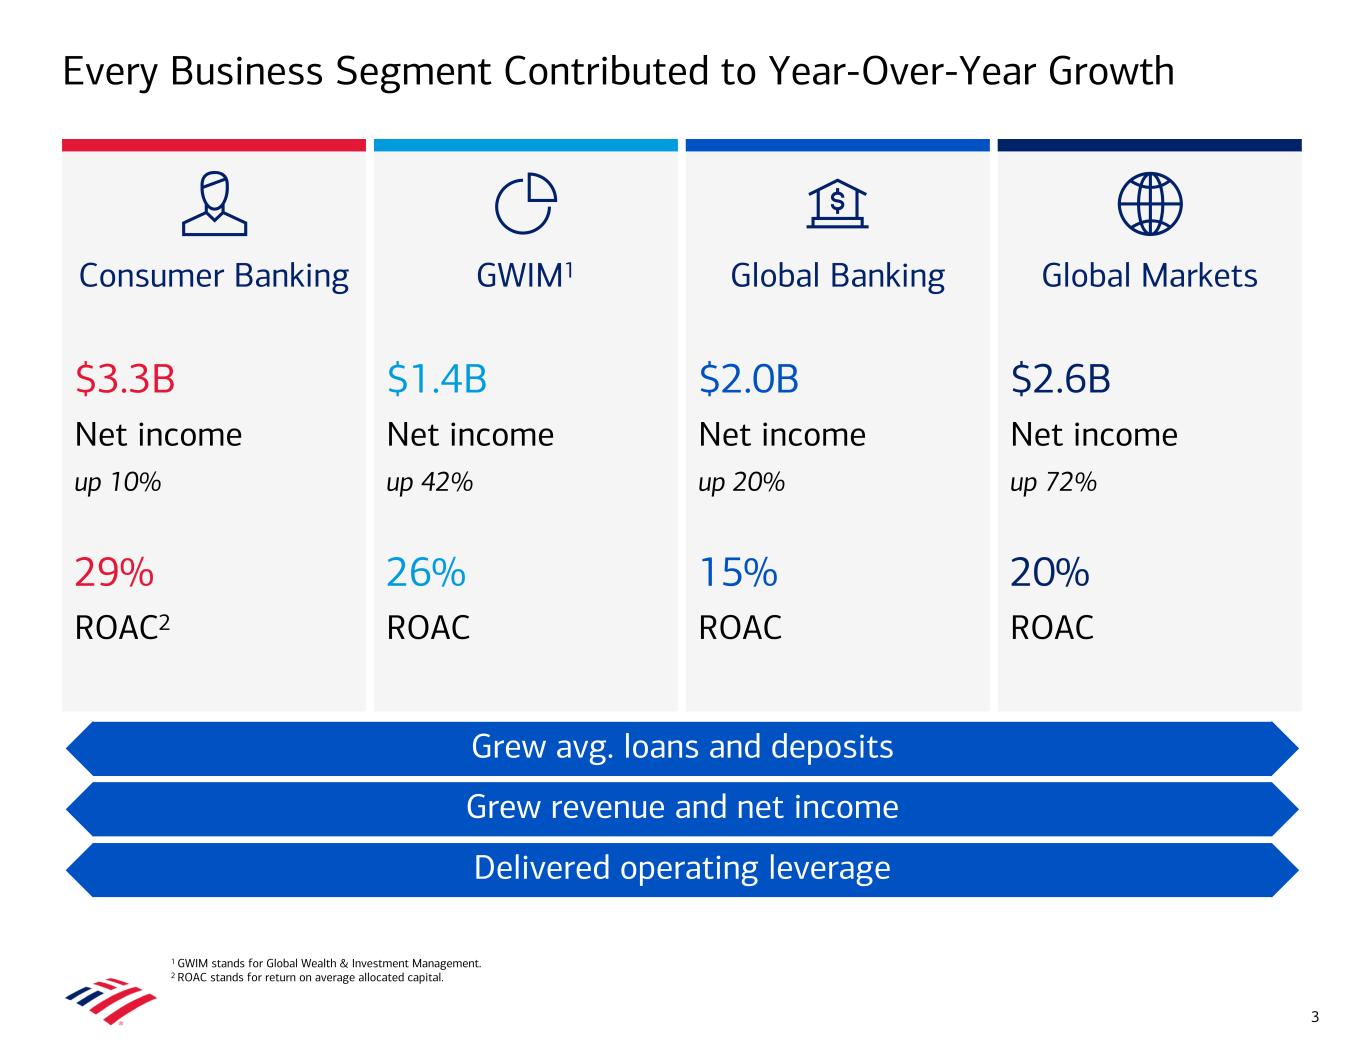
1 GWIM stands for Global Wealth & Investment Management. 2 ROAC stands for return on average allocated capital. Every Business Segment Contributed to Year-Over-Year Growth 3 Consumer Banking $3.3B Net income up 10% 29% ROAC2 GWIM1 $1.4B Net income up 42% 26% ROAC Global Markets $2.6B Net income up 72% 20% ROAC Global Banking $2.0B Net income up 20% 15% ROAC Grew avg. loans and deposits Grew revenue and net income Delivered operating leverage
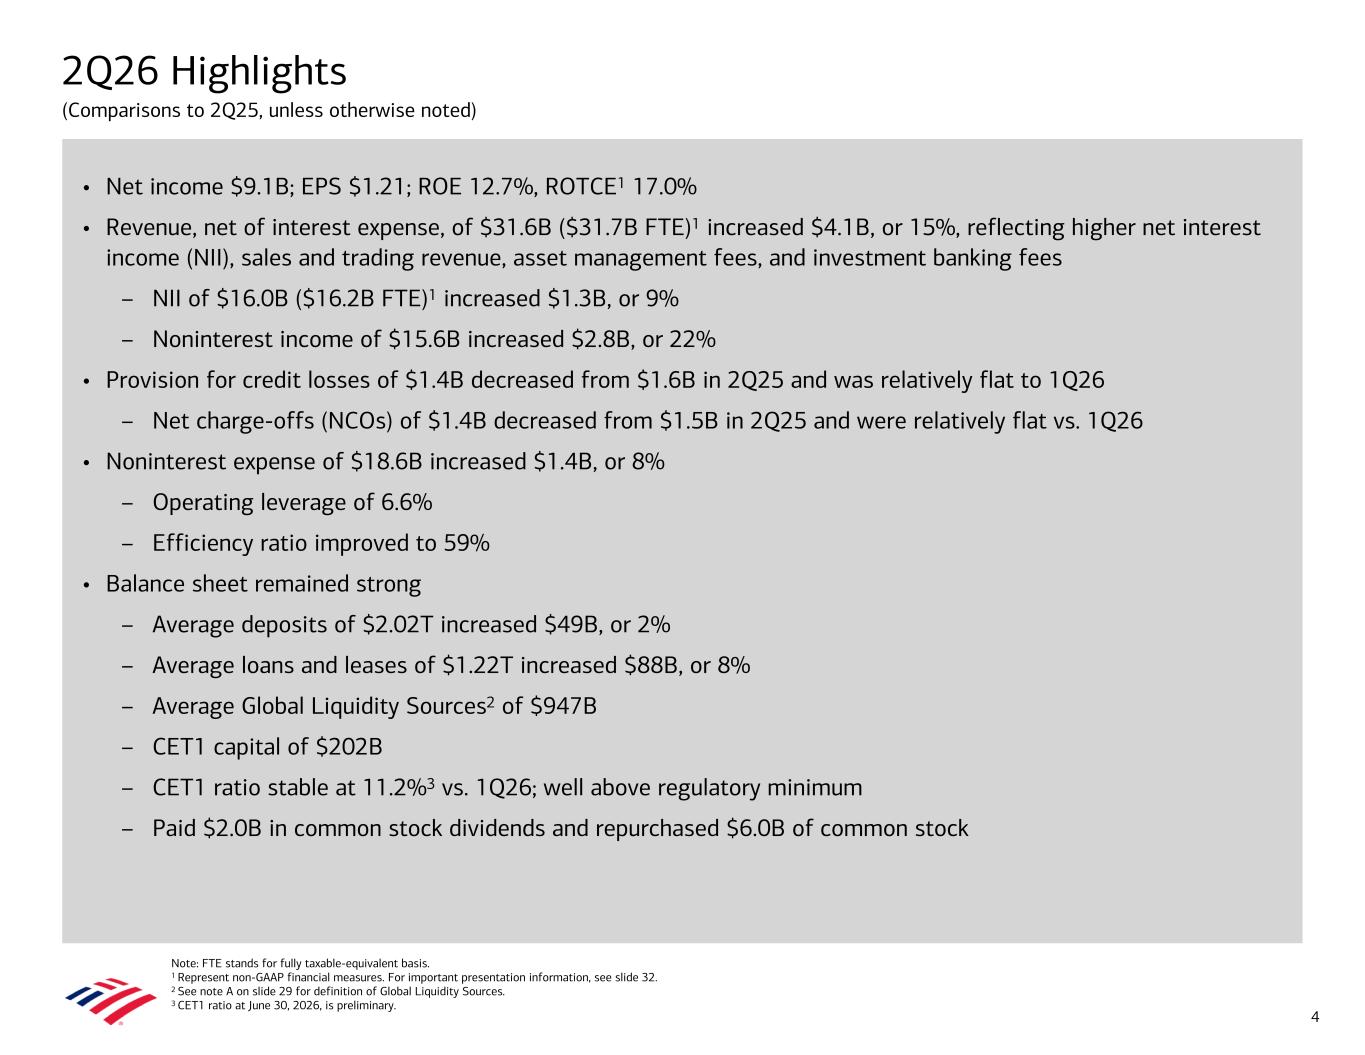
• Net income $9.1B; EPS $1.21; ROE 12.7%, ROTCE1 17.0% • Revenue, net of interest expense, of $31.6B ($31.7B FTE)1 increased $4.1B, or 15%, reflecting higher net interest income (NII), sales and trading revenue, asset management fees, and investment banking fees – NII of $16.0B ($16.2B FTE)1 increased $1.3B, or 9% – Noninterest income of $15.6B increased $2.8B, or 22% • Provision for credit losses of $1.4B decreased from $1.6B in 2Q25 and was relatively flat to 1Q26 – Net charge-offs (NCOs) of $1.4B decreased from $1.5B in 2Q25 and were relatively flat vs. 1Q26 • Noninterest expense of $18.6B increased $1.4B, or 8% – Operating leverage of 6.6% – Efficiency ratio improved to 59% • Balance sheet remained strong – Average deposits of $2.02T increased $49B, or 2% – Average loans and leases of $1.22T increased $88B, or 8% – Average Global Liquidity Sources2 of $947B – CET1 capital of $202B – CET1 ratio stable at 11.2%3 vs. 1Q26; well above regulatory minimum – Paid $2.0B in common stock dividends and repurchased $6.0B of common stock Note: FTE stands for fully taxable-equivalent basis. 1 Represent non-GAAP financial measures. For important presentation information, see slide 32. 2 See note A on slide 29 for definition of Global Liquidity Sources. 3 CET1 ratio at June 30, 2026, is preliminary. 2Q26 Highlights (Comparisons to 2Q25, unless otherwise noted) 4
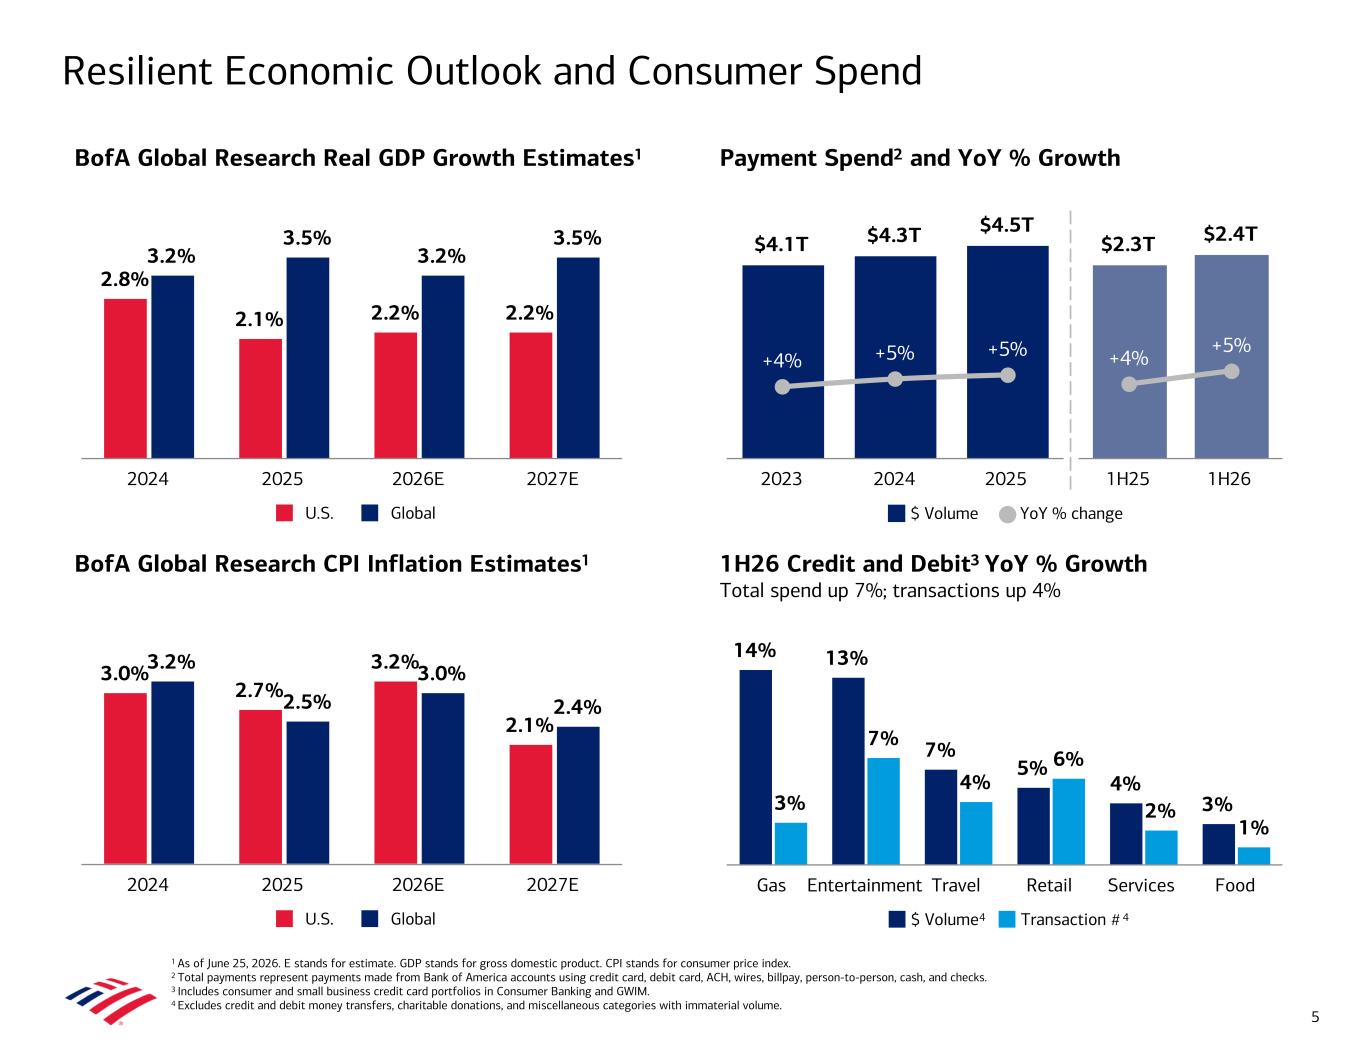
Resilient Economic Outlook and Consumer Spend BofA Global Research CPI Inflation Estimates1 5 1H26 Credit and Debit3 YoY % Growth Total spend up 7%; transactions up 4% 14% 13% 7% 5% 4% 3%3% 7% 4% 6% 2% 1% $ Volume Transaction # Gas Entertainment Travel Retail Services Food Payment Spend2 and YoY % Growth $4.1T $4.3T $4.5T +4% +5% +5% 2023 2024 2025 BofA Global Research Real GDP Growth Estimates1 1 As of June 25, 2026. E stands for estimate. GDP stands for gross domestic product. CPI stands for consumer price index. 2 Total payments represent payments made from Bank of America accounts using credit card, debit card, ACH, wires, billpay, person-to-person, cash, and checks. 3 Includes consumer and small business credit card portfolios in Consumer Banking and GWIM. 4 Excludes credit and debit money transfers, charitable donations, and miscellaneous categories with immaterial volume. 4 4 2.8% 2.1% 2.2% 2.2% 3.2% 3.5% 3.2% 3.5% U.S. Global 2024 2025 2026E 2027E 3.0% 2.7% 3.2% 2.1% 3.2% 2.5% 3.0% 2.4% U.S. Global 2024 2025 2026E 2027E $2.3T $2.4T +4% +5% 1H25 1H26 $ Volume YoY % change
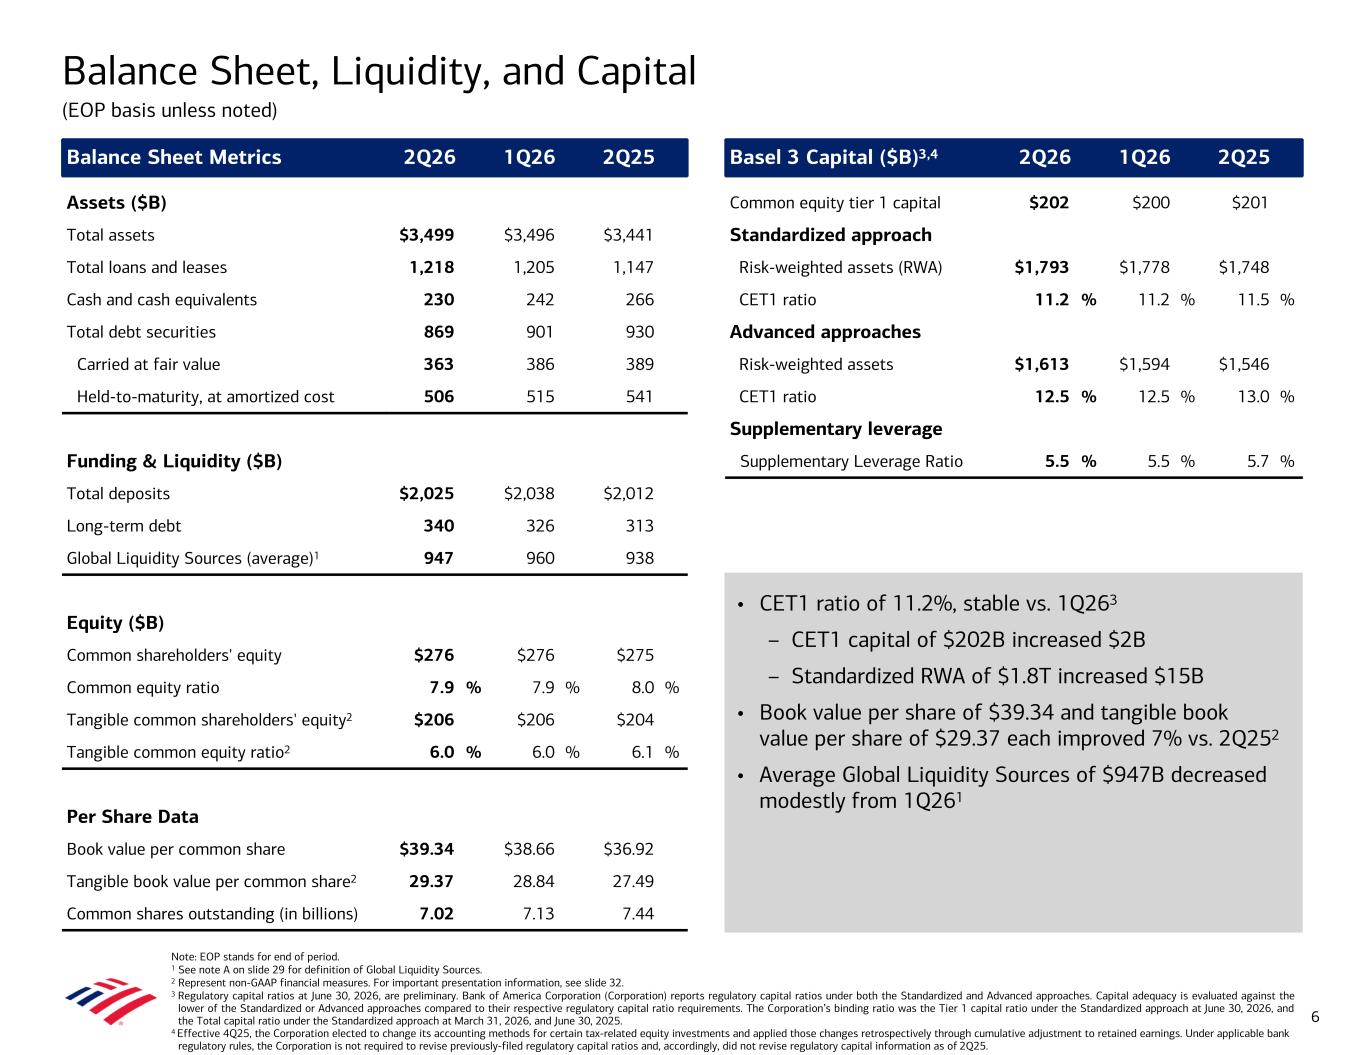
Balance Sheet Metrics 2Q26 1Q26 2Q25 Basel 3 Capital ($B)3,4 2Q26 1Q26 2Q25 Assets ($B) Common equity tier 1 capital $202 $200 $201 Total assets $3,499 $3,496 $3,441 Standardized approach Total loans and leases 1,218 1,205 1,147 Risk-weighted assets (RWA) $1,793 $1,778 $1,748 Cash and cash equivalents 230 242 266 CET1 ratio 11.2 % 11.2 % 11.5 % Total debt securities 869 901 930 Advanced approaches Carried at fair value 363 386 389 Risk-weighted assets $1,613 $1,594 $1,546 Held-to-maturity, at amortized cost 506 515 541 CET1 ratio 12.5 % 12.5 % 13.0 % Supplementary leverage Funding & Liquidity ($B) Supplementary Leverage Ratio 5.5 % 5.5 % 5.7 % Total deposits $2,025 $2,038 $2,012 Long-term debt 340 326 313 Global Liquidity Sources (average)1 947 960 938 Equity ($B) Common shareholders' equity $276 $276 $275 Common equity ratio 7.9 % 7.9 % 8.0 % Tangible common shareholders' equity2 $206 $206 $204 Tangible common equity ratio2 6.0 % 6.0 % 6.1 % Per Share Data Book value per common share $39.34 $38.66 $36.92 Tangible book value per common share2 29.37 28.84 27.49 Common shares outstanding (in billions) 7.02 7.13 7.44 Balance Sheet, Liquidity, and Capital (EOP basis unless noted) 6 • CET1 ratio of 11.2%, stable vs. 1Q263 – CET1 capital of $202B increased $2B – Standardized RWA of $1.8T increased $15B • Book value per share of $39.34 and tangible book value per share of $29.37 each improved 7% vs. 2Q252 • Average Global Liquidity Sources of $947B decreased modestly from 1Q261 Note: EOP stands for end of period. 1 See note A on slide 29 for definition of Global Liquidity Sources. 2 Represent non-GAAP financial measures. For important presentation information, see slide 32. 3 Regulatory capital ratios at June 30, 2026, are preliminary. Bank of America Corporation (Corporation) reports regulatory capital ratios under both the Standardized and Advanced approaches. Capital adequacy is evaluated against the lower of the Standardized or Advanced approaches compared to their respective regulatory capital ratio requirements. The Corporation’s binding ratio was the Tier 1 capital ratio under the Standardized approach at June 30, 2026, and the Total capital ratio under the Standardized approach at March 31, 2026, and June 30, 2025. 4 Effective 4Q25, the Corporation elected to change its accounting methods for certain tax-related equity investments and applied those changes retrospectively through cumulative adjustment to retained earnings. Under applicable bank regulatory rules, the Corporation is not required to revise previously-filed regulatory capital ratios and, accordingly, did not revise regulatory capital information as of 2Q25.
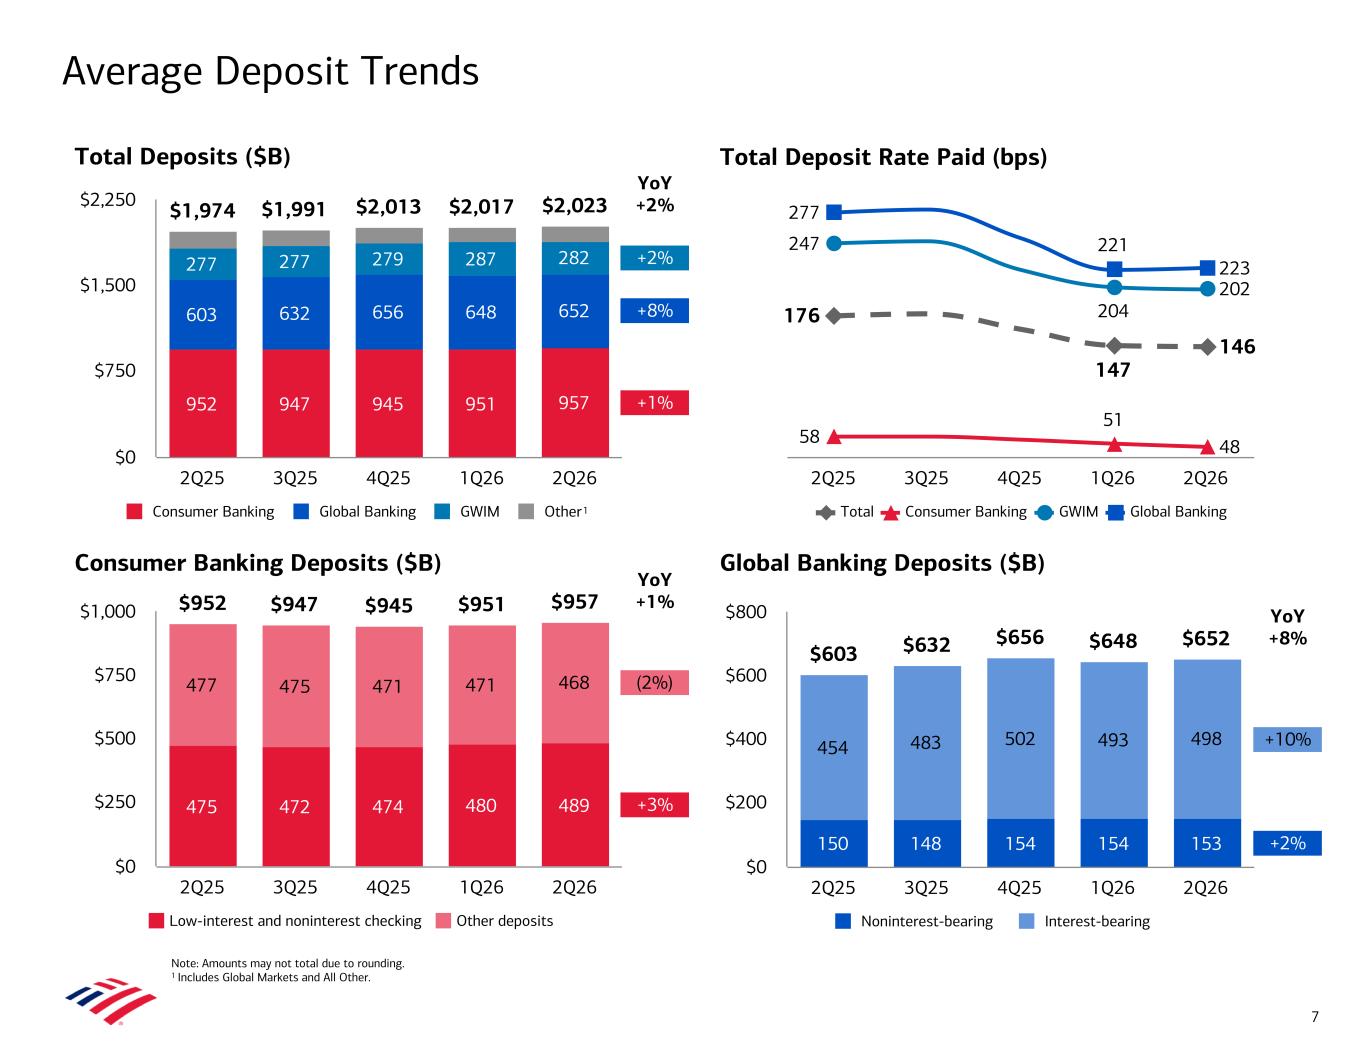
$952 $947 $945 $951 $957 475 472 474 480 489 477 475 471 471 468 Low-interest and noninterest checking Other deposits 2Q25 3Q25 4Q25 1Q26 2Q26 $0 $250 $500 $750 $1,000 +3% (2%) Average Deposit Trends YoY +2% Note: Amounts may not total due to rounding. 1 Includes Global Markets and All Other. YoY +1% Global Banking Deposits ($B) Consumer Banking Deposits ($B) Total Deposit Rate Paid (bps)Total Deposits ($B) 176 147 146 58 51 48 247 204 202 277 221 223 Total Consumer Banking GWIM Global Banking 2Q25 3Q25 4Q25 1Q26 2Q26 7 $603 $632 $656 $648 $652 150 148 154 154 153 454 483 502 493 498 Noninterest-bearing Interest-bearing 2Q25 3Q25 4Q25 1Q26 2Q26 $0 $200 $400 $600 $800 $1,974 $1,991 $2,013 $2,017 $2,023 952 947 945 951 957 603 632 656 648 652 277 277 279 287 282 Consumer Banking Global Banking GWIM Other 2Q25 3Q25 4Q25 1Q26 2Q26 $0 $750 $1,500 $2,250 +1% +2% +8% +10% +2% YoY +8% 1
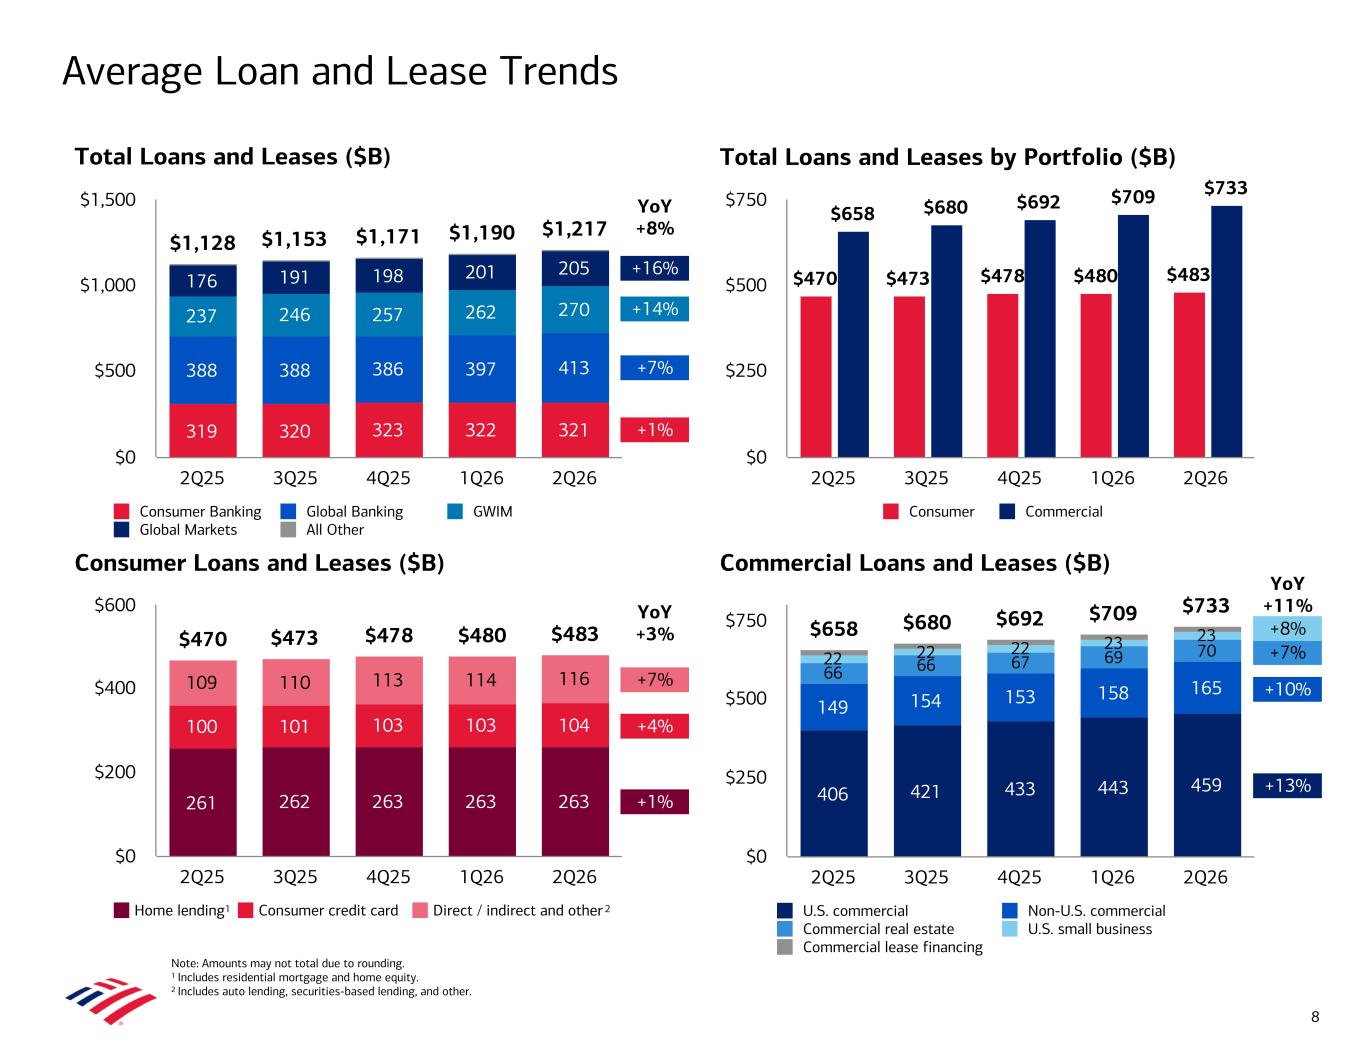
$470 $473 $478 $480 $483 261 262 263 263 263 100 101 103 103 104 109 110 113 114 116 Home lending Consumer credit card Direct / indirect and other 2Q25 3Q25 4Q25 1Q26 2Q26 $0 $200 $400 $600 +1% +4% +7% Average Loan and Lease Trends YoY +8% YoY +3% Note: Amounts may not total due to rounding. 1 Includes residential mortgage and home equity. 2 Includes auto lending, securities-based lending, and other. Commercial Loans and Leases ($B) Consumer Loans and Leases ($B) Total Loans and Leases by Portfolio ($B)Total Loans and Leases ($B) $470 $473 $478 $480 $483 $658 $680 $692 $709 $733 Consumer Commercial 2Q25 3Q25 4Q25 1Q26 2Q26 $0 $250 $500 $750 8 $658 $680 $692 $709 $733 406 421 433 443 459 149 154 153 158 165 66 66 67 69 7022 22 22 23 23 U.S. commercial Non-U.S. commercial Commercial real estate U.S. small business Commercial lease financing 2Q25 3Q25 4Q25 1Q26 2Q26 $0 $250 $500 $750 $1,128 $1,153 $1,171 $1,190 $1,217 319 320 323 322 321 388 388 386 397 413 237 246 257 262 270 176 191 198 201 205 Consumer Banking Global Banking GWIM Global Markets All Other 2Q25 3Q25 4Q25 1Q26 2Q26 $0 $500 $1,000 $1,500 +1% +14% +7% +16% 1 +13% +10% +7% YoY +11% +8% 2
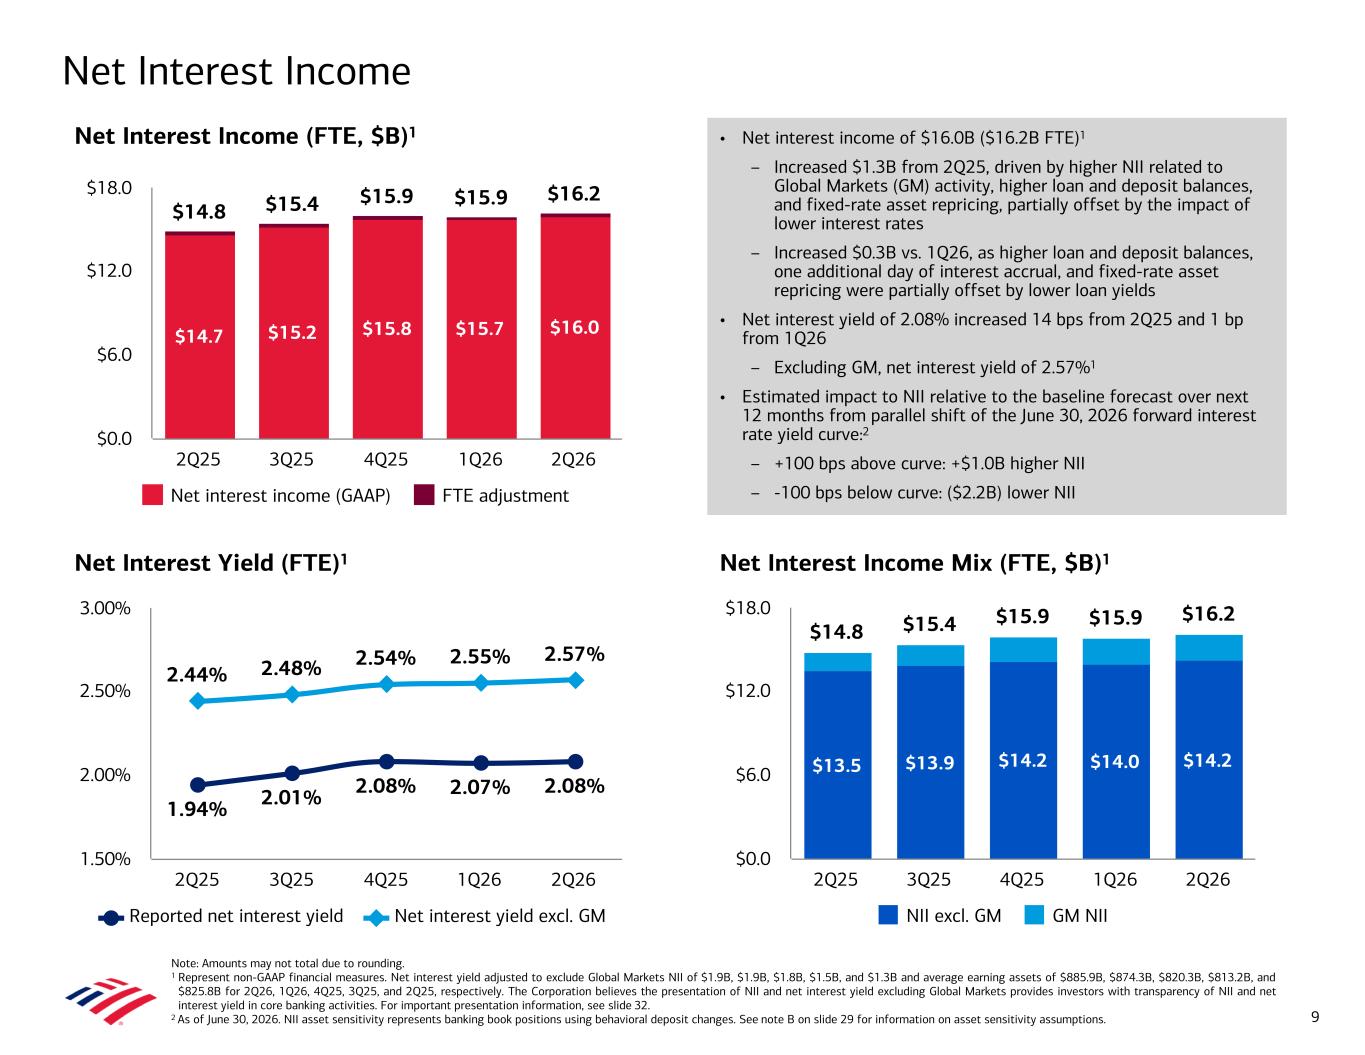
• Net interest income of $16.0B ($16.2B FTE)1 – Increased $1.3B from 2Q25, driven by higher NII related to Global Markets (GM) activity, higher loan and deposit balances, and fixed-rate asset repricing, partially offset by the impact of lower interest rates – Increased $0.3B vs. 1Q26, as higher loan and deposit balances, one additional day of interest accrual, and fixed-rate asset repricing were partially offset by lower loan yields • Net interest yield of 2.08% increased 14 bps from 2Q25 and 1 bp from 1Q26 – Excluding GM, net interest yield of 2.57%1 • Estimated impact to NII relative to the baseline forecast over next 12 months from parallel shift of the June 30, 2026 forward interest rate yield curve:2 – +100 bps above curve: +$1.0B higher NII – -100 bps below curve: ($2.2B) lower NII Net Interest Income (FTE, $B)1 Net Interest Income Note: Amounts may not total due to rounding. 1 Represent non-GAAP financial measures. Net interest yield adjusted to exclude Global Markets NII of $1.9B, $1.9B, $1.8B, $1.5B, and $1.3B and average earning assets of $885.9B, $874.3B, $820.3B, $813.2B, and $825.8B for 2Q26, 1Q26, 4Q25, 3Q25, and 2Q25, respectively. The Corporation believes the presentation of NII and net interest yield excluding Global Markets provides investors with transparency of NII and net interest yield in core banking activities. For important presentation information, see slide 32. 2 As of June 30, 2026. NII asset sensitivity represents banking book positions using behavioral deposit changes. See note B on slide 29 for information on asset sensitivity assumptions. Net Interest Yield (FTE)1 1.94% 2.01% 2.08% 2.07% 2.08% 2.44% 2.48% 2.54% 2.55% 2.57% Reported net interest yield Net interest yield excl. GM 2Q25 3Q25 4Q25 1Q26 2Q26 1.50% 2.00% 2.50% 3.00% $14.8 $15.4 $15.9 $15.9 $16.2 $14.7 $15.2 $15.8 $15.7 $16.0 Net interest income (GAAP) FTE adjustment 2Q25 3Q25 4Q25 1Q26 2Q26 $0.0 $6.0 $12.0 $18.0 9 Net Interest Income Mix (FTE, $B)1 $14.8 $15.4 $15.9 $15.9 $16.2 $13.5 $13.9 $14.2 $14.0 $14.2 NII excl. GM GM NII 2Q25 3Q25 4Q25 1Q26 2Q26 $0.0 $6.0 $12.0 $18.0
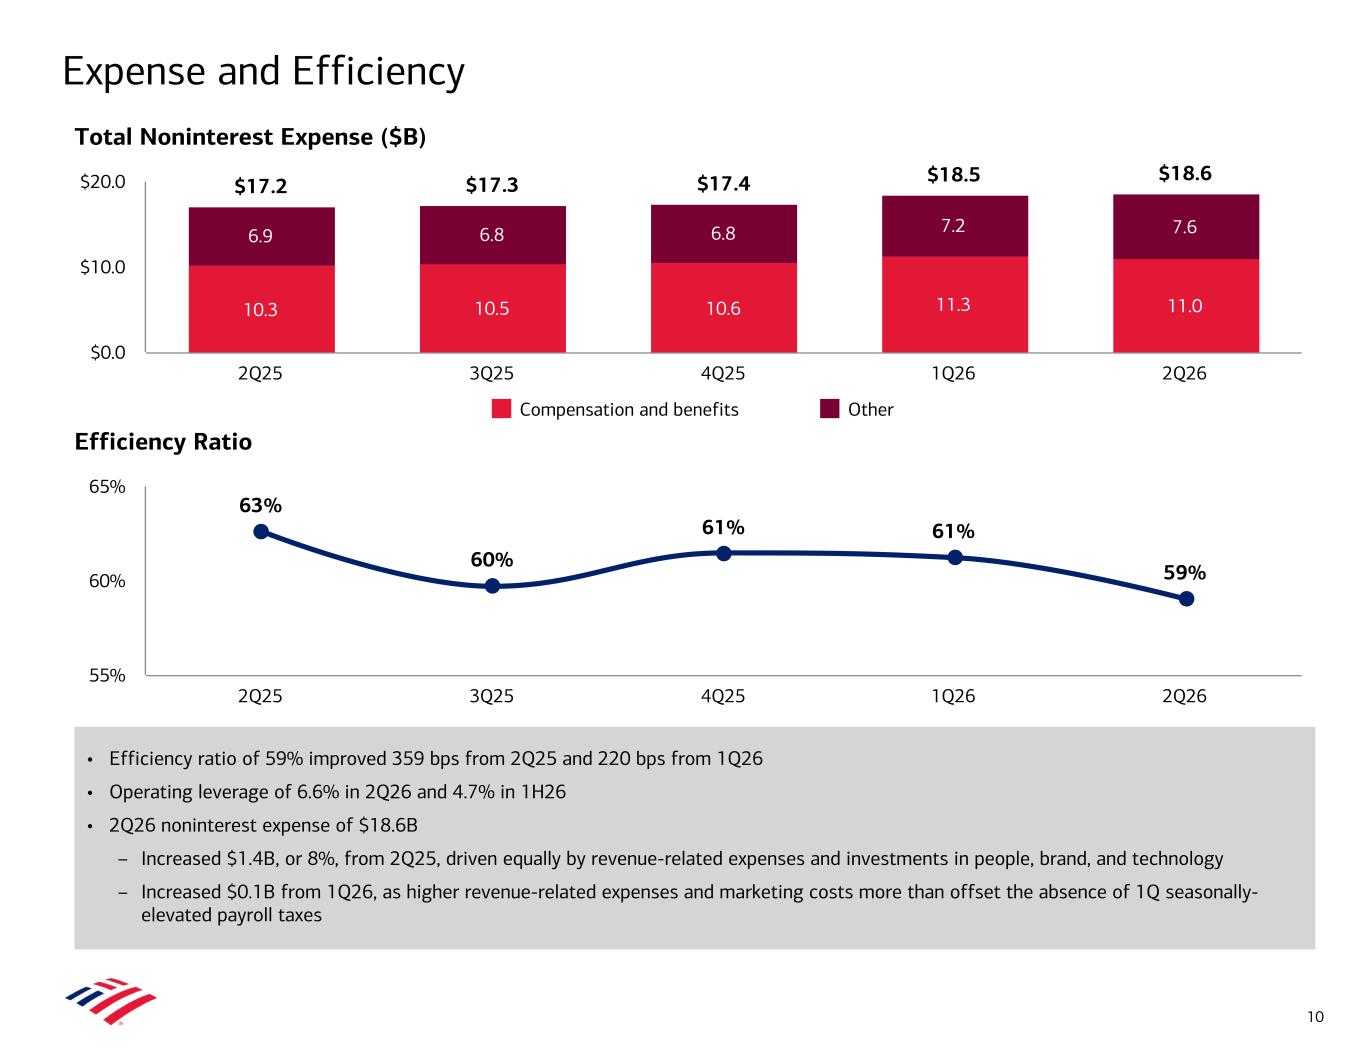
• Efficiency ratio of 59% improved 359 bps from 2Q25 and 220 bps from 1Q26 • Operating leverage of 6.6% in 2Q26 and 4.7% in 1H26 • 2Q26 noninterest expense of $18.6B – Increased $1.4B, or 8%, from 2Q25, driven equally by revenue-related expenses and investments in people, brand, and technology – Increased $0.1B from 1Q26, as higher revenue-related expenses and marketing costs more than offset the absence of 1Q seasonally- elevated payroll taxes $17.2 $17.3 $17.4 $18.5 $18.6 10.3 10.5 10.6 11.3 11.0 6.9 6.8 6.8 7.2 7.6 Compensation and benefits Other 2Q25 3Q25 4Q25 1Q26 2Q26 $0.0 $10.0 $20.0 63% 60% 61% 61% 59% 2Q25 3Q25 4Q25 1Q26 2Q26 55% 60% 65% Total Noninterest Expense ($B) Efficiency Ratio Expense and Efficiency 10
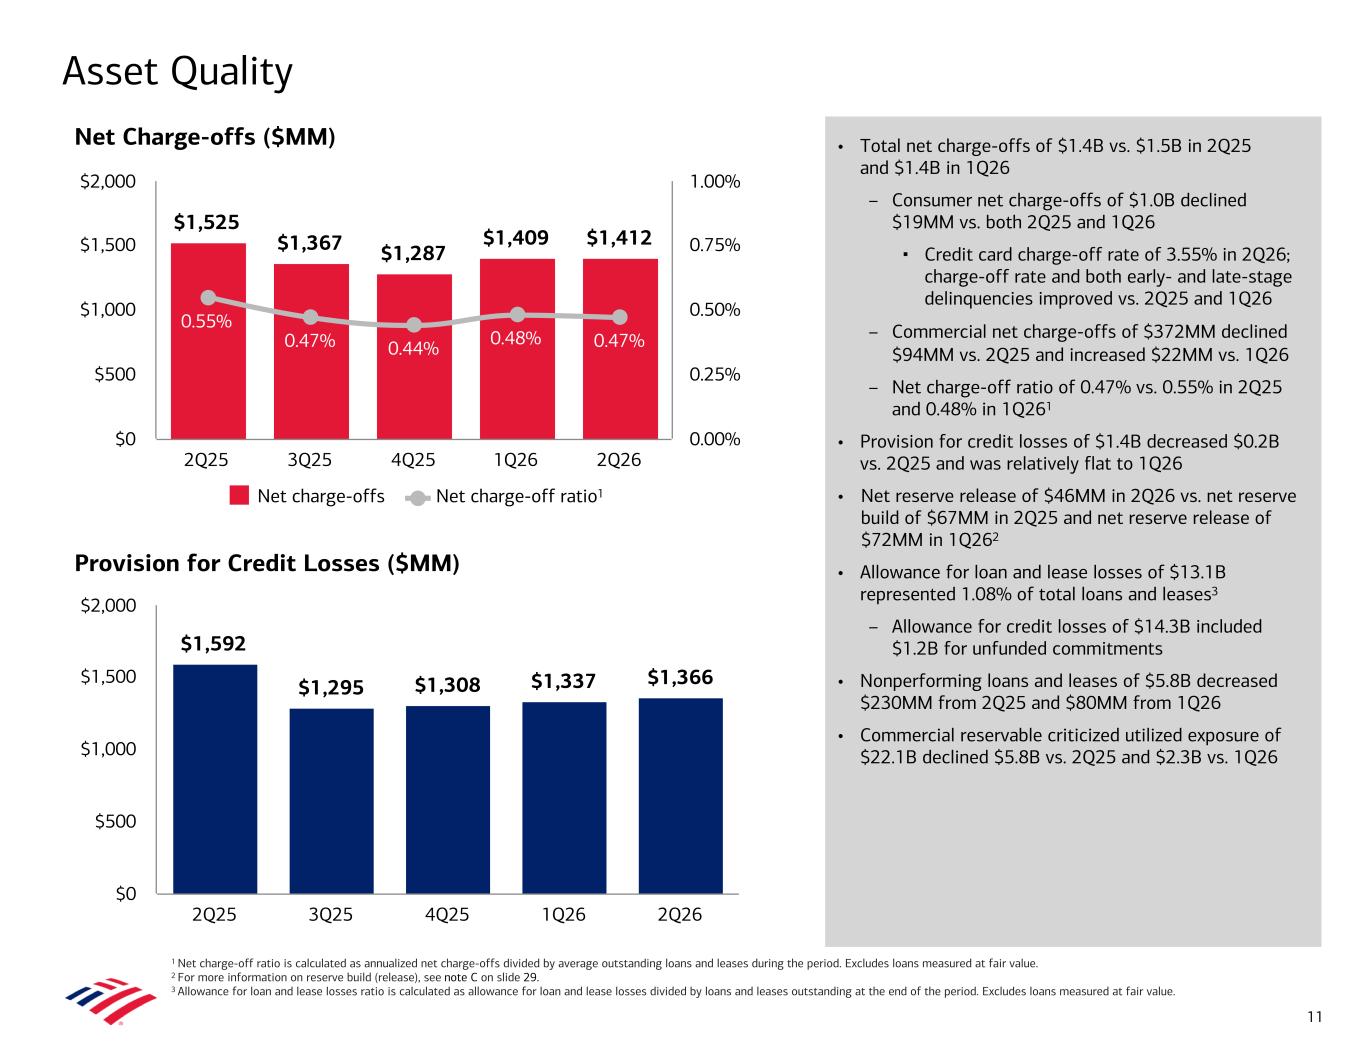
Asset Quality 1 Net charge-off ratio is calculated as annualized net charge-offs divided by average outstanding loans and leases during the period. Excludes loans measured at fair value. 2 For more information on reserve build (release), see note C on slide 29. 3 Allowance for loan and lease losses ratio is calculated as allowance for loan and lease losses divided by loans and leases outstanding at the end of the period. Excludes loans measured at fair value. Provision for Credit Losses ($MM) Net Charge-offs ($MM) $1,592 $1,295 $1,308 $1,337 $1,366 2Q25 3Q25 4Q25 1Q26 2Q26 $0 $500 $1,000 $1,500 $2,000 $1,525 $1,367 $1,287 $1,409 $1,412 0.55% 0.47% 0.44% 0.48% 0.47% Net charge-offs Net charge-off ratio 2Q25 3Q25 4Q25 1Q26 2Q26 $0 $500 $1,000 $1,500 $2,000 0.00% 0.25% 0.50% 0.75% 1.00% 11 • Total net charge-offs of $1.4B vs. $1.5B in 2Q25 and $1.4B in 1Q26 – Consumer net charge-offs of $1.0B declined $19MM vs. both 2Q25 and 1Q26 ▪ Credit card charge-off rate of 3.55% in 2Q26; charge-off rate and both early- and late-stage delinquencies improved vs. 2Q25 and 1Q26 – Commercial net charge-offs of $372MM declined $94MM vs. 2Q25 and increased $22MM vs. 1Q26 – Net charge-off ratio of 0.47% vs. 0.55% in 2Q25 and 0.48% in 1Q261 • Provision for credit losses of $1.4B decreased $0.2B vs. 2Q25 and was relatively flat to 1Q26 • Net reserve release of $46MM in 2Q26 vs. net reserve build of $67MM in 2Q25 and net reserve release of $72MM in 1Q262 • Allowance for loan and lease losses of $13.1B represented 1.08% of total loans and leases3 – Allowance for credit losses of $14.3B included $1.2B for unfunded commitments • Nonperforming loans and leases of $5.8B decreased $230MM from 2Q25 and $80MM from 1Q26 • Commercial reservable criticized utilized exposure of $22.1B declined $5.8B vs. 2Q25 and $2.3B vs. 1Q26 1
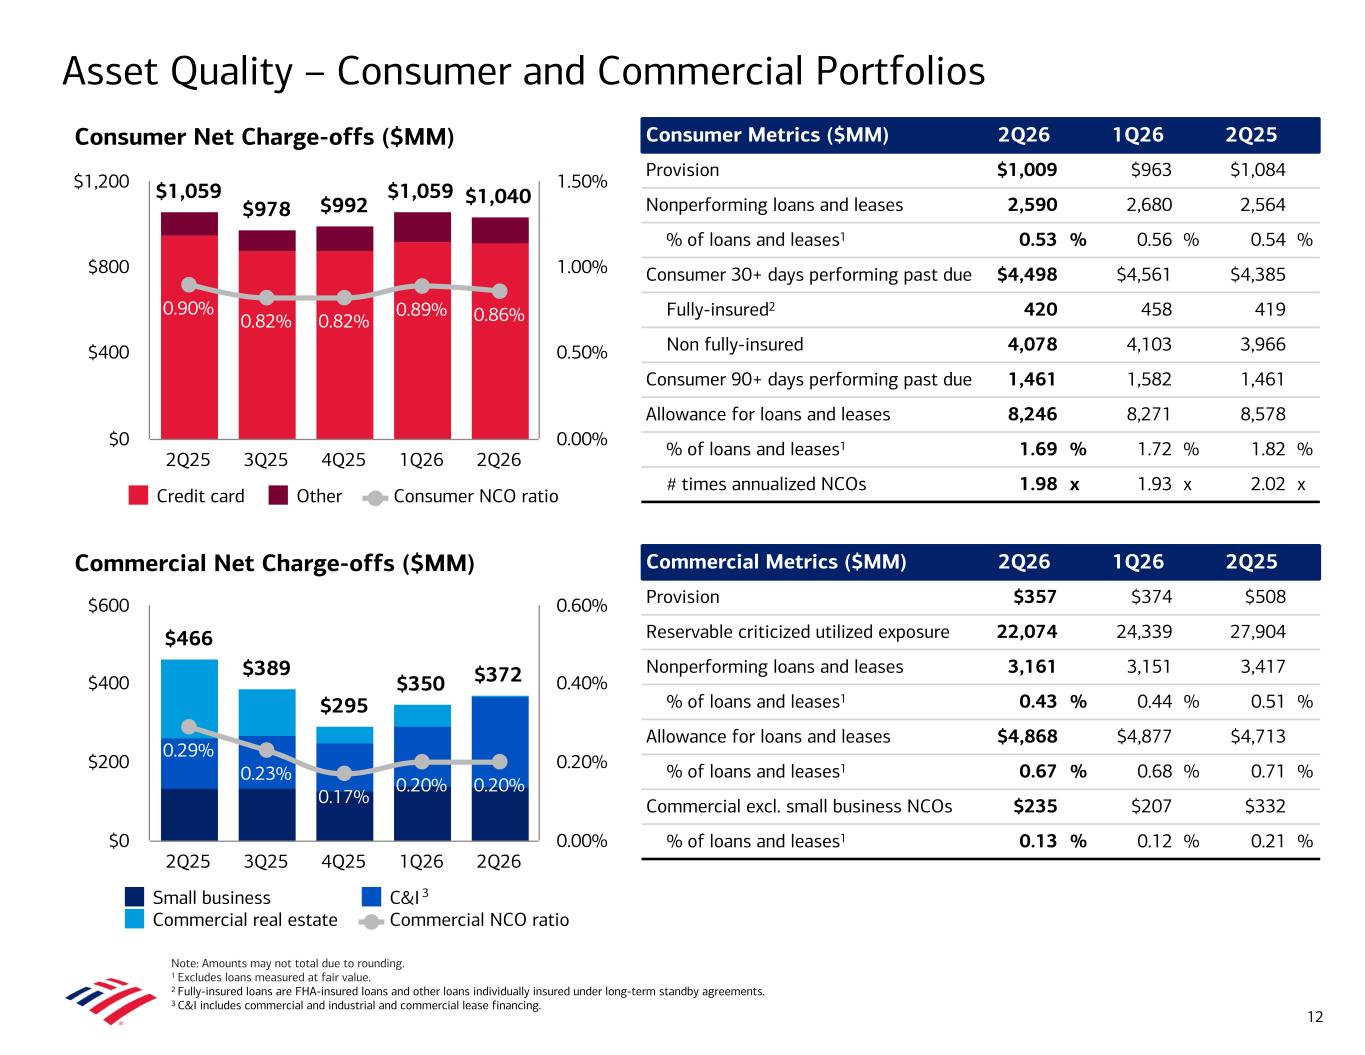
Commercial Net Charge-offs ($MM) Consumer Net Charge-offs ($MM) Asset Quality – Consumer and Commercial Portfolios $466 $389 $295 $350 $372 0.29% 0.23% 0.17% 0.20% 0.20% Small business C&I Commercial real estate Commercial NCO ratio 2Q25 3Q25 4Q25 1Q26 2Q26 $0 $200 $400 $600 0.00% 0.20% 0.40% 0.60% $1,059 $978 $992 $1,059 $1,040 0.90% 0.82% 0.82% 0.89% 0.86% Credit card Other Consumer NCO ratio 2Q25 3Q25 4Q25 1Q26 2Q26 $0 $400 $800 $1,200 0.00% 0.50% 1.00% 1.50% Commercial Metrics ($MM) 2Q26 1Q26 2Q25 Provision $357 $374 $508 Reservable criticized utilized exposure 22,074 24,339 27,904 Nonperforming loans and leases 3,161 3,151 3,417 % of loans and leases1 0.43 % 0.44 % 0.51 % Allowance for loans and leases $4,868 $4,877 $4,713 % of loans and leases1 0.67 % 0.68 % 0.71 % Commercial excl. small business NCOs $235 $207 $332 % of loans and leases1 0.13 % 0.12 % 0.21 % Consumer Metrics ($MM) 2Q26 1Q26 2Q25 Provision $1,009 $963 $1,084 Nonperforming loans and leases 2,590 2,680 2,564 % of loans and leases1 0.53 % 0.56 % 0.54 % Consumer 30+ days performing past due $4,498 $4,561 $4,385 Fully-insured2 420 458 419 Non fully-insured 4,078 4,103 3,966 Consumer 90+ days performing past due 1,461 1,582 1,461 Allowance for loans and leases 8,246 8,271 8,578 % of loans and leases1 1.69 % 1.72 % 1.82 % # times annualized NCOs 1.98 x 1.93 x 2.02 x 12 3 Note: Amounts may not total due to rounding. 1 Excludes loans measured at fair value. 2 Fully-insured loans are FHA-insured loans and other loans individually insured under long-term standby agreements. 3 C&I includes commercial and industrial and commercial lease financing.
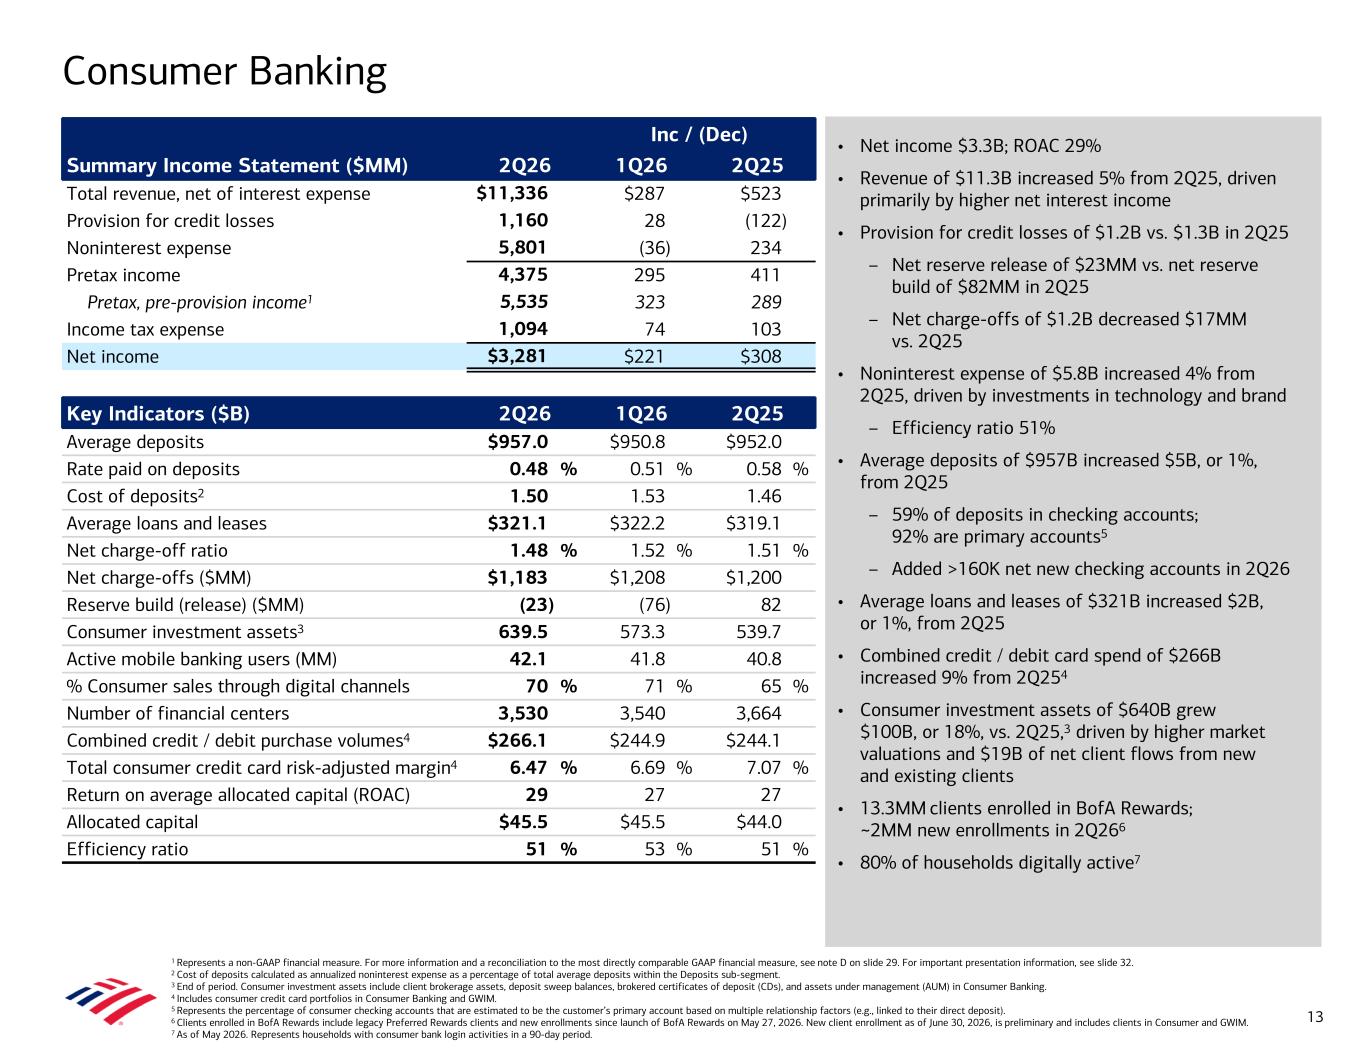
Consumer Banking 1 Represents a non-GAAP financial measure. For more information and a reconciliation to the most directly comparable GAAP financial measure, see note D on slide 29. For important presentation information, see slide 32. 2 Cost of deposits calculated as annualized noninterest expense as a percentage of total average deposits within the Deposits sub-segment. 3 End of period. Consumer investment assets include client brokerage assets, deposit sweep balances, brokered certificates of deposit (CDs), and assets under management (AUM) in Consumer Banking. 4 Includes consumer credit card portfolios in Consumer Banking and GWIM. 5 Represents the percentage of consumer checking accounts that are estimated to be the customer’s primary account based on multiple relationship factors (e.g., linked to their direct deposit). 6 Clients enrolled in BofA Rewards include legacy Preferred Rewards clients and new enrollments since launch of BofA Rewards on May 27, 2026. New client enrollment as of June 30, 2026, is preliminary and includes clients in Consumer and GWIM. 7 As of May 2026. Represents households with consumer bank login activities in a 90-day period. Inc / (Dec) Summary Income Statement ($MM) 2Q26 1Q26 2Q25 Total revenue, net of interest expense $11,336 $287 $523 Provision for credit losses 1,160 28 (122) Noninterest expense 5,801 (36) 234 Pretax income 4,375 295 411 Pretax, pre-provision income1 5,535 323 289 Income tax expense 1,094 74 103 Net income $3,281 $221 $308 Key Indicators ($B) 2Q26 1Q26 2Q25 Average deposits $957.0 $950.8 $952.0 Rate paid on deposits 0.48 % 0.51 % 0.58 % Cost of deposits2 1.50 1.53 1.46 Average loans and leases $321.1 $322.2 $319.1 Net charge-off ratio 1.48 % 1.52 % 1.51 % Net charge-offs ($MM) $1,183 $1,208 $1,200 Reserve build (release) ($MM) (23) (76) 82 Consumer investment assets3 639.5 573.3 539.7 Active mobile banking users (MM) 42.1 41.8 40.8 % Consumer sales through digital channels 70 % 71 % 65 % Number of financial centers 3,530 3,540 3,664 Combined credit / debit purchase volumes4 $266.1 $244.9 $244.1 Total consumer credit card risk-adjusted margin4 6.47 % 6.69 % 7.07 % Return on average allocated capital (ROAC) 29 27 27 Allocated capital $45.5 $45.5 $44.0 Efficiency ratio 51 % 53 % 51 % 13 • Net income $3.3B; ROAC 29% • Revenue of $11.3B increased 5% from 2Q25, driven primarily by higher net interest income • Provision for credit losses of $1.2B vs. $1.3B in 2Q25 – Net reserve release of $23MM vs. net reserve build of $82MM in 2Q25 – Net charge-offs of $1.2B decreased $17MM vs. 2Q25 • Noninterest expense of $5.8B increased 4% from 2Q25, driven by investments in technology and brand – Efficiency ratio 51% • Average deposits of $957B increased $5B, or 1%, from 2Q25 – 59% of deposits in checking accounts; 92% are primary accounts5 – Added >160K net new checking accounts in 2Q26 • Average loans and leases of $321B increased $2B, or 1%, from 2Q25 • Combined credit / debit card spend of $266B increased 9% from 2Q254 • Consumer investment assets of $640B grew $100B, or 18%, vs. 2Q25,3 driven by higher market valuations and $19B of net client flows from new and existing clients • 13.3MM clients enrolled in BofA Rewards; ~2MM new enrollments in 2Q266 • 80% of households digitally active7
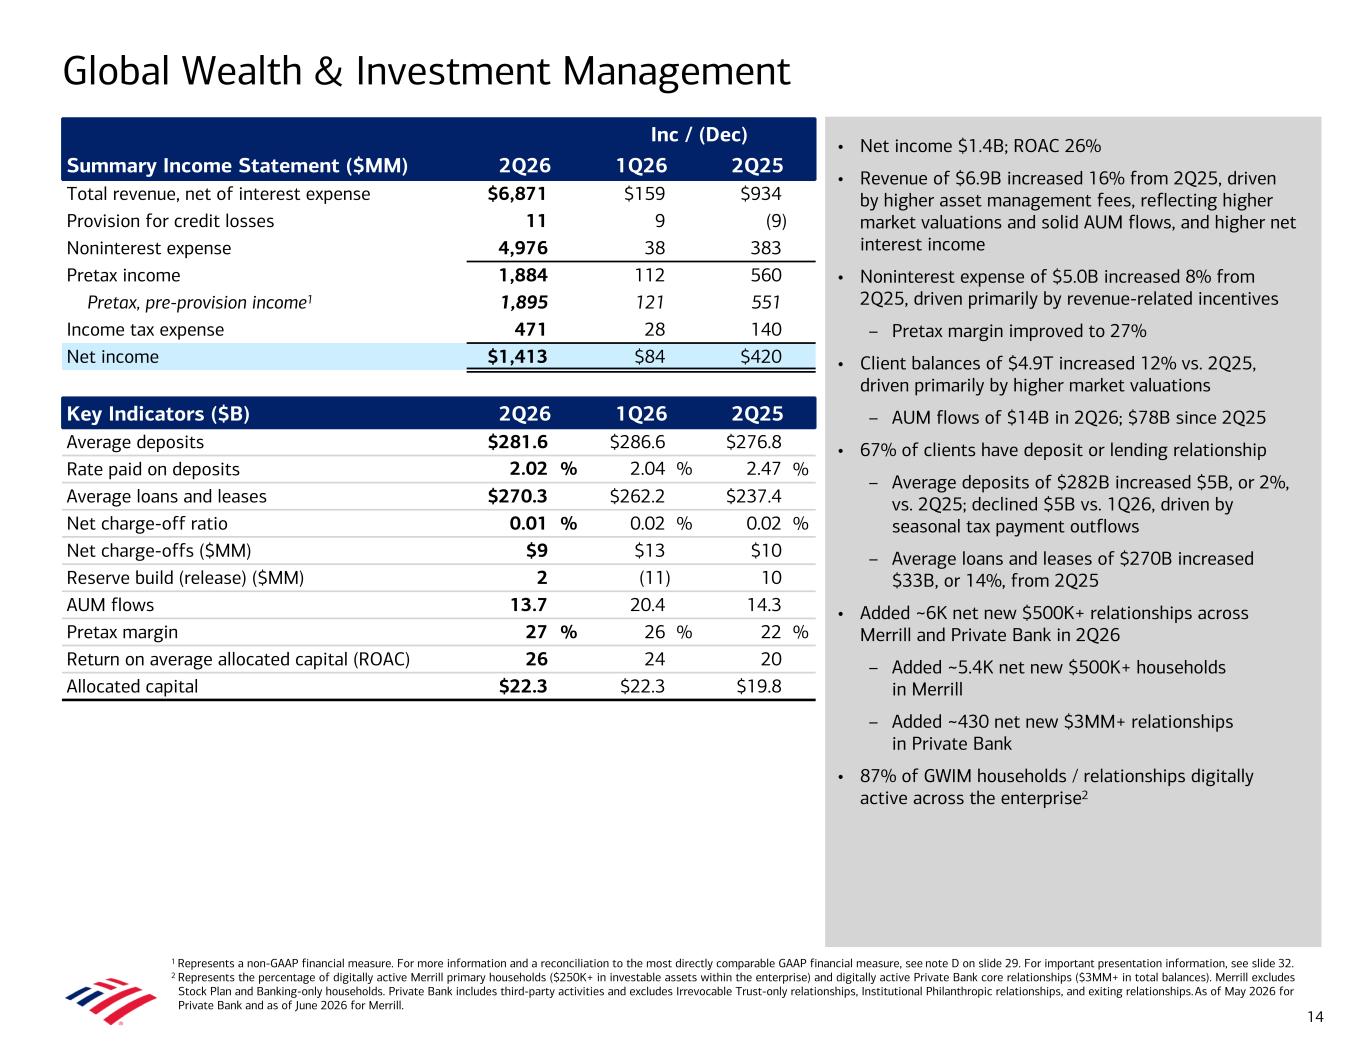
• Net income $1.4B; ROAC 26% • Revenue of $6.9B increased 16% from 2Q25, driven by higher asset management fees, reflecting higher market valuations and solid AUM flows, and higher net interest income • Noninterest expense of $5.0B increased 8% from 2Q25, driven primarily by revenue-related incentives – Pretax margin improved to 27% • Client balances of $4.9T increased 12% vs. 2Q25, driven primarily by higher market valuations – AUM flows of $14B in 2Q26; $78B since 2Q25 • 67% of clients have deposit or lending relationship – Average deposits of $282B increased $5B, or 2%, vs. 2Q25; declined $5B vs. 1Q26, driven by seasonal tax payment outflows – Average loans and leases of $270B increased $33B, or 14%, from 2Q25 • Added ~6K net new $500K+ relationships across Merrill and Private Bank in 2Q26 – Added ~5.4K net new $500K+ households in Merrill – Added ~430 net new $3MM+ relationships in Private Bank • 87% of GWIM households / relationships digitally active across the enterprise2 Global Wealth & Investment Management 1 Represents a non-GAAP financial measure. For more information and a reconciliation to the most directly comparable GAAP financial measure, see note D on slide 29. For important presentation information, see slide 32. 2 Represents the percentage of digitally active Merrill primary households ($250K+ in investable assets within the enterprise) and digitally active Private Bank core relationships ($3MM+ in total balances). Merrill excludes Stock Plan and Banking-only households. Private Bank includes third-party activities and excludes Irrevocable Trust-only relationships, Institutional Philanthropic relationships, and exiting relationships. As of May 2026 for Private Bank and as of June 2026 for Merrill. Inc / (Dec) Summary Income Statement ($MM) 2Q26 1Q26 2Q25 Total revenue, net of interest expense $6,871 $159 $934 Provision for credit losses 11 9 (9) Noninterest expense 4,976 38 383 Pretax income 1,884 112 560 Pretax, pre-provision income1 1,895 121 551 Income tax expense 471 28 140 Net income $1,413 $84 $420 Key Indicators ($B) 2Q26 1Q26 2Q25 Average deposits $281.6 $286.6 $276.8 Rate paid on deposits 2.02 % 2.04 % 2.47 % Average loans and leases $270.3 $262.2 $237.4 Net charge-off ratio 0.01 % 0.02 % 0.02 % Net charge-offs ($MM) $9 $13 $10 Reserve build (release) ($MM) 2 (11) 10 AUM flows 13.7 20.4 14.3 Pretax margin 27 % 26 % 22 % Return on average allocated capital (ROAC) 26 24 20 Allocated capital $22.3 $22.3 $19.8 14
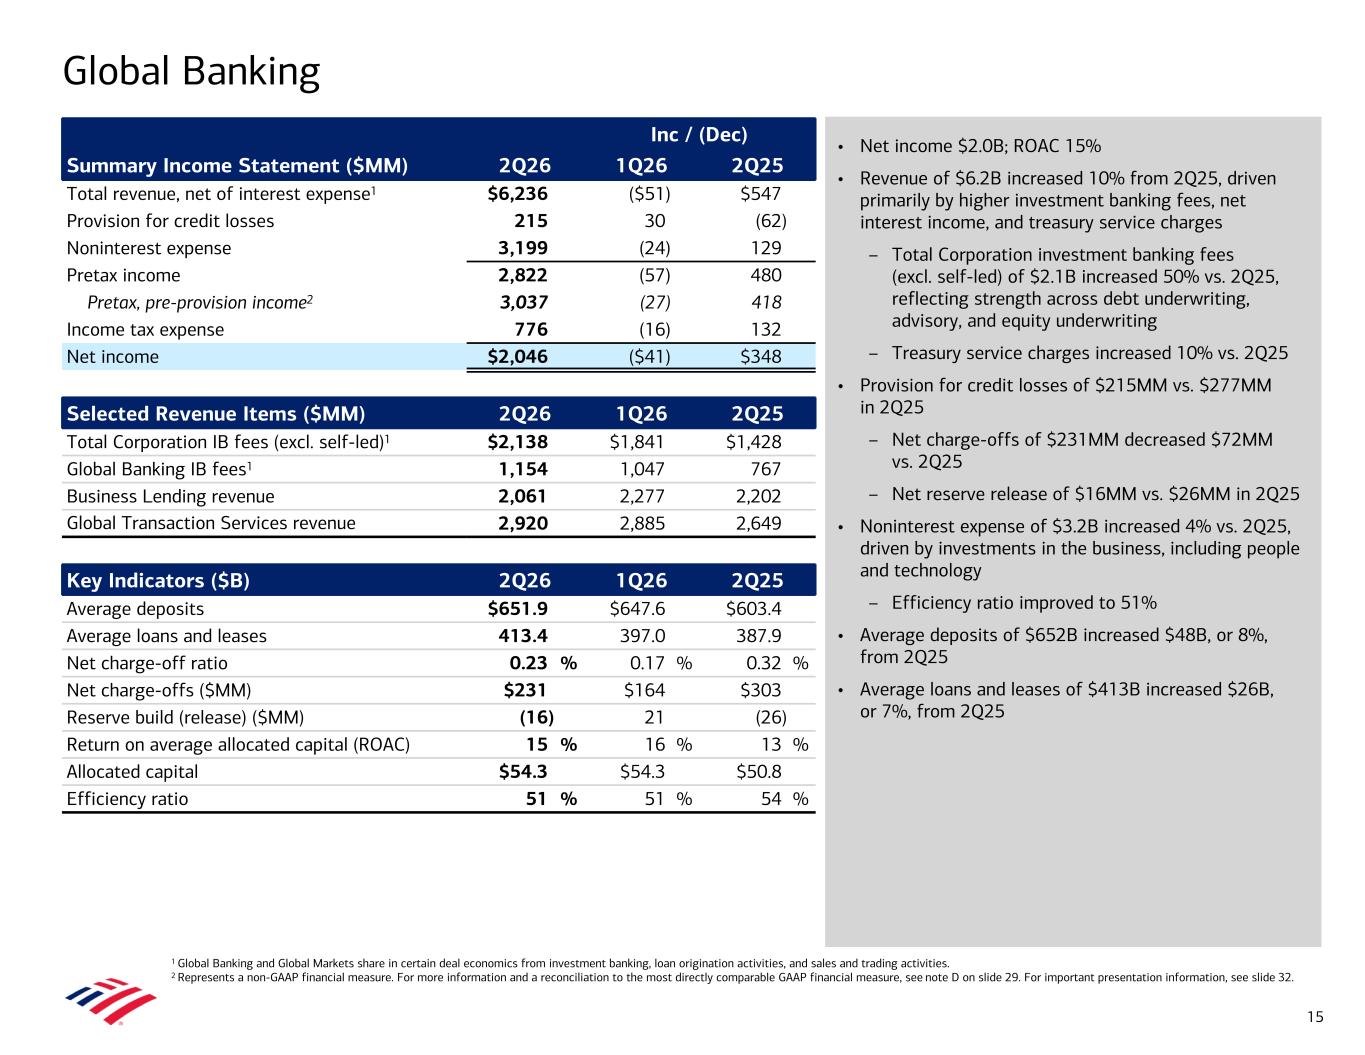
Global Banking 1 Global Banking and Global Markets share in certain deal economics from investment banking, loan origination activities, and sales and trading activities. 2 Represents a non-GAAP financial measure. For more information and a reconciliation to the most directly comparable GAAP financial measure, see note D on slide 29. For important presentation information, see slide 32. Inc / (Dec) Summary Income Statement ($MM) 2Q26 1Q26 2Q25 Total revenue, net of interest expense1 $6,236 ($51) $547 Provision for credit losses 215 30 (62) Noninterest expense 3,199 (24) 129 Pretax income 2,822 (57) 480 Pretax, pre-provision income2 3,037 (27) 418 Income tax expense 776 (16) 132 Net income $2,046 ($41) $348 Selected Revenue Items ($MM) 2Q26 1Q26 2Q25 Total Corporation IB fees (excl. self-led)1 $2,138 $1,841 $1,428 Global Banking IB fees1 1,154 1,047 767 Business Lending revenue 2,061 2,277 2,202 Global Transaction Services revenue 2,920 2,885 2,649 Key Indicators ($B) 2Q26 1Q26 2Q25 Average deposits $651.9 $647.6 $603.4 Average loans and leases 413.4 397.0 387.9 Net charge-off ratio 0.23 % 0.17 % 0.32 % Net charge-offs ($MM) $231 $164 $303 Reserve build (release) ($MM) (16) 21 (26) Return on average allocated capital (ROAC) 15 % 16 % 13 % Allocated capital $54.3 $54.3 $50.8 Efficiency ratio 51 % 51 % 54 % 15 • Net income $2.0B; ROAC 15% • Revenue of $6.2B increased 10% from 2Q25, driven primarily by higher investment banking fees, net interest income, and treasury service charges – Total Corporation investment banking fees (excl. self-led) of $2.1B increased 50% vs. 2Q25, reflecting strength across debt underwriting, advisory, and equity underwriting – Treasury service charges increased 10% vs. 2Q25 • Provision for credit losses of $215MM vs. $277MM in 2Q25 – Net charge-offs of $231MM decreased $72MM vs. 2Q25 – Net reserve release of $16MM vs. $26MM in 2Q25 • Noninterest expense of $3.2B increased 4% vs. 2Q25, driven by investments in the business, including people and technology – Efficiency ratio improved to 51% • Average deposits of $652B increased $48B, or 8%, from 2Q25 • Average loans and leases of $413B increased $26B, or 7%, from 2Q25
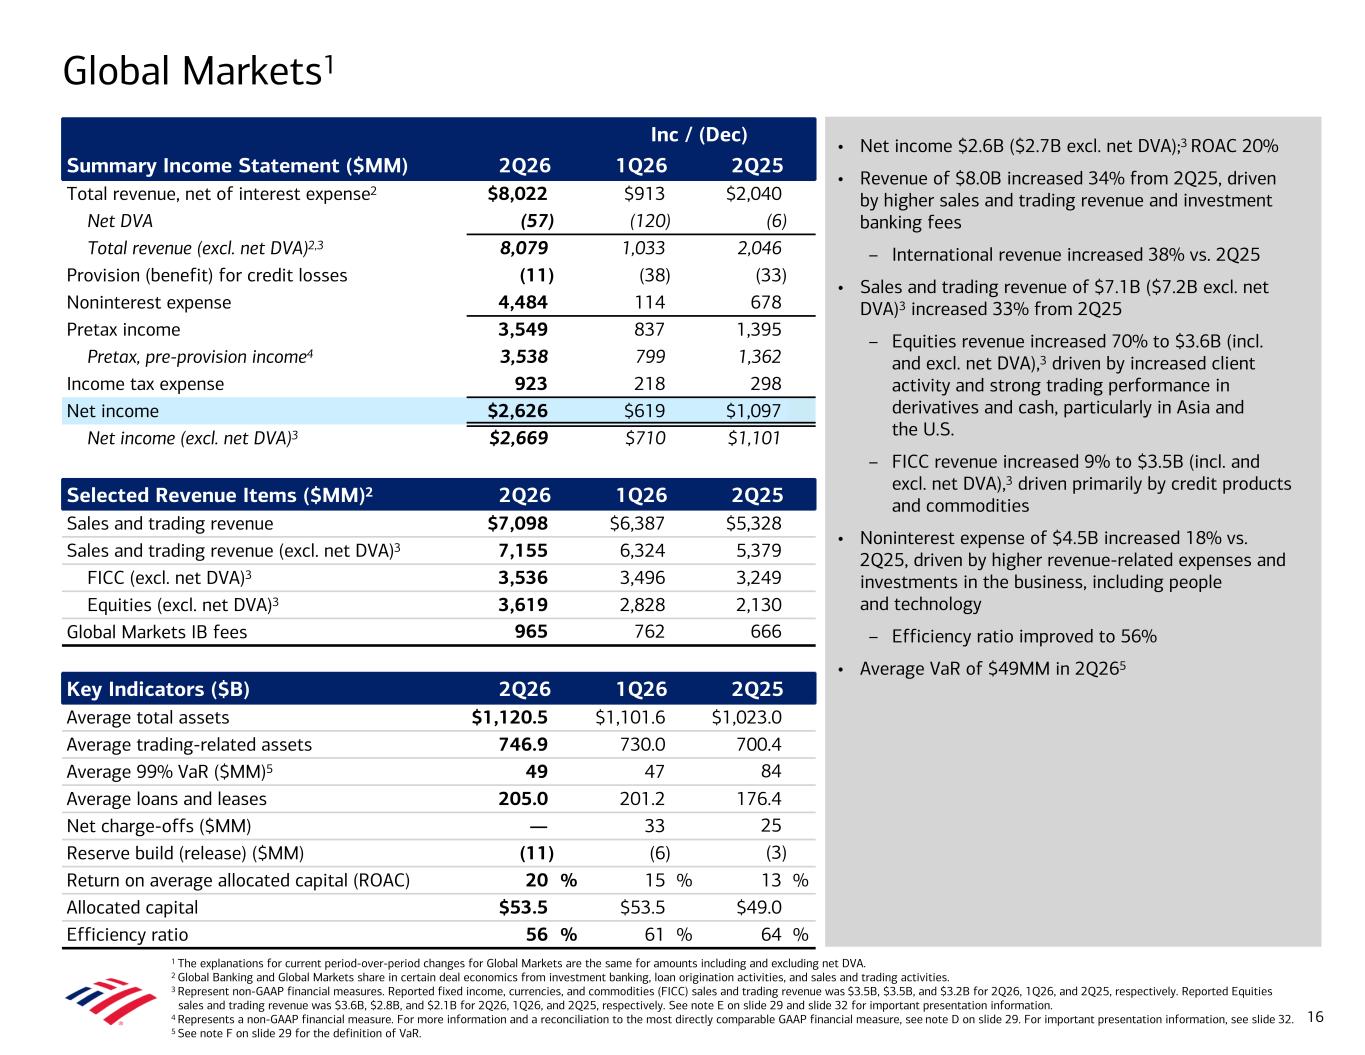
Global Markets1 1 The explanations for current period-over-period changes for Global Markets are the same for amounts including and excluding net DVA. 2 Global Banking and Global Markets share in certain deal economics from investment banking, loan origination activities, and sales and trading activities. 3 Represent non-GAAP financial measures. Reported fixed income, currencies, and commodities (FICC) sales and trading revenue was $3.5B, $3.5B, and $3.2B for 2Q26, 1Q26, and 2Q25, respectively. Reported Equities sales and trading revenue was $3.6B, $2.8B, and $2.1B for 2Q26, 1Q26, and 2Q25, respectively. See note E on slide 29 and slide 32 for important presentation information. 4 Represents a non-GAAP financial measure. For more information and a reconciliation to the most directly comparable GAAP financial measure, see note D on slide 29. For important presentation information, see slide 32. 5 See note F on slide 29 for the definition of VaR. Inc / (Dec) Summary Income Statement ($MM) 2Q26 1Q26 2Q25 Total revenue, net of interest expense2 $8,022 $913 $2,040 Net DVA (57) (120) (6) Total revenue (excl. net DVA)2,3 8,079 1,033 2,046 Provision (benefit) for credit losses (11) (38) (33) Noninterest expense 4,484 114 678 Pretax income 3,549 837 1,395 Pretax, pre-provision income4 3,538 799 1,362 Income tax expense 923 218 298 Net income $2,626 $619 $1,097 Net income (excl. net DVA)3 $2,669 $710 $1,101 Selected Revenue Items ($MM)2 2Q26 1Q26 2Q25 Sales and trading revenue $7,098 $6,387 $5,328 Sales and trading revenue (excl. net DVA)3 7,155 6,324 5,379 FICC (excl. net DVA)3 3,536 3,496 3,249 Equities (excl. net DVA)3 3,619 2,828 2,130 Global Markets IB fees 965 762 666 Key Indicators ($B) 2Q26 1Q26 2Q25 Average total assets $1,120.5 $1,101.6 $1,023.0 Average trading-related assets 746.9 730.0 700.4 Average 99% VaR ($MM)5 49 47 84 Average loans and leases 205.0 201.2 176.4 Net charge-offs ($MM) — 33 25 Reserve build (release) ($MM) (11) (6) (3) Return on average allocated capital (ROAC) 20 % 15 % 13 % Allocated capital $53.5 $53.5 $49.0 Efficiency ratio 56 % 61 % 64 % 16 • Net income $2.6B ($2.7B excl. net DVA);3 ROAC 20% • Revenue of $8.0B increased 34% from 2Q25, driven by higher sales and trading revenue and investment banking fees – International revenue increased 38% vs. 2Q25 • Sales and trading revenue of $7.1B ($7.2B excl. net DVA)3 increased 33% from 2Q25 – Equities revenue increased 70% to $3.6B (incl. and excl. net DVA),3 driven by increased client activity and strong trading performance in derivatives and cash, particularly in Asia and the U.S. – FICC revenue increased 9% to $3.5B (incl. and excl. net DVA),3 driven primarily by credit products and commodities • Noninterest expense of $4.5B increased 18% vs. 2Q25, driven by higher revenue-related expenses and investments in the business, including people and technology – Efficiency ratio improved to 56% • Average VaR of $49MM in 2Q265
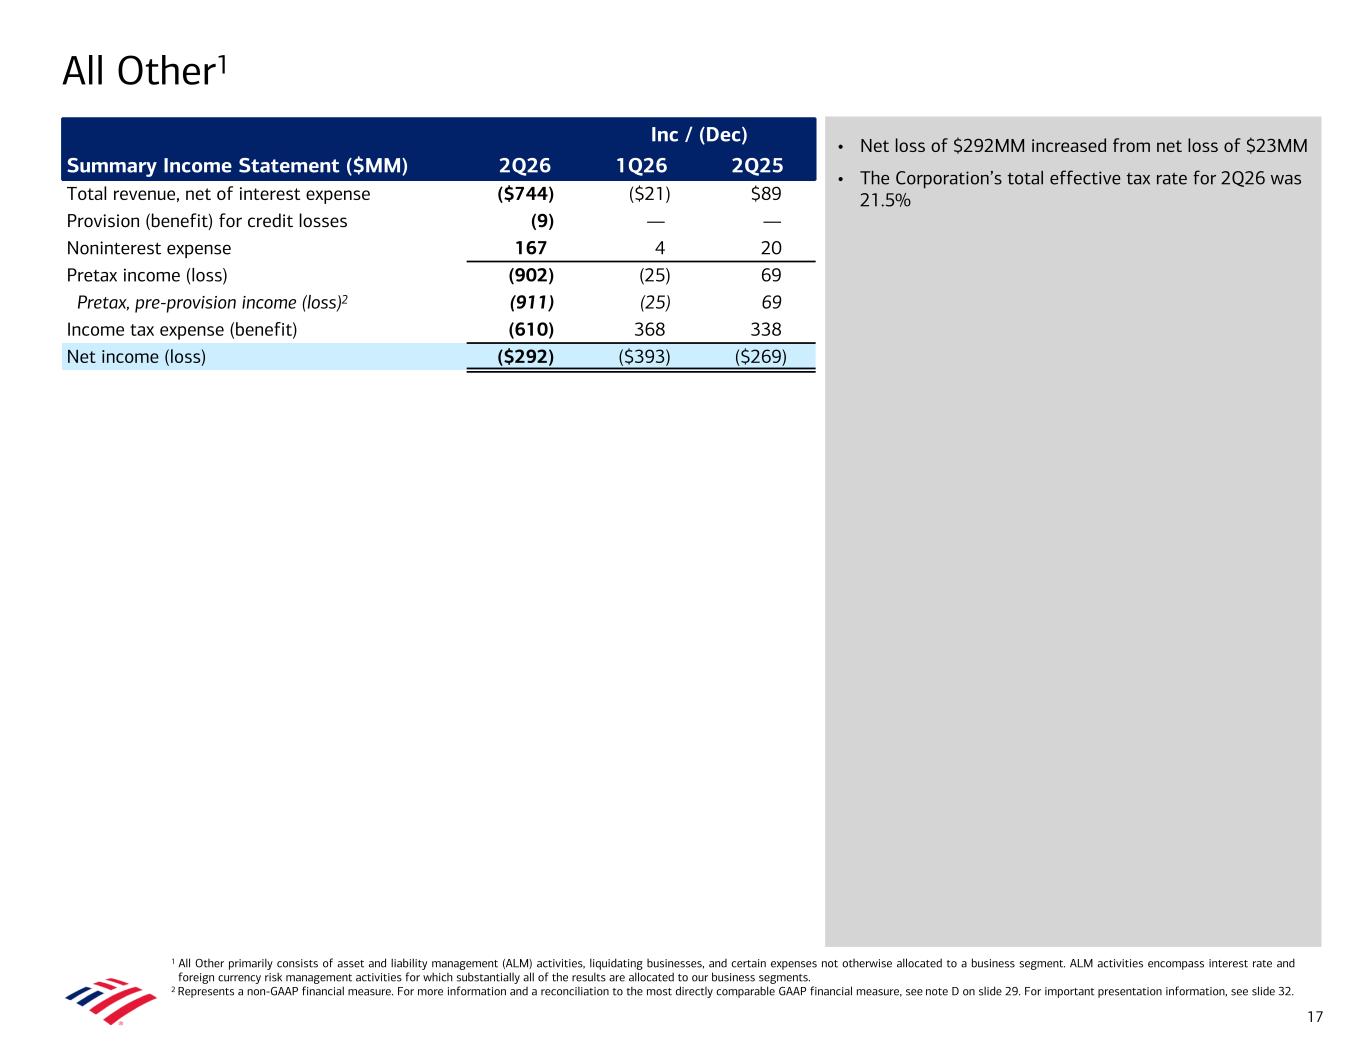
• Net loss of $292MM increased from net loss of $23MM • The Corporation’s total effective tax rate for 2Q26 was 21.5% All Other1 1 All Other primarily consists of asset and liability management (ALM) activities, liquidating businesses, and certain expenses not otherwise allocated to a business segment. ALM activities encompass interest rate and foreign currency risk management activities for which substantially all of the results are allocated to our business segments. 2 Represents a non-GAAP financial measure. For more information and a reconciliation to the most directly comparable GAAP financial measure, see note D on slide 29. For important presentation information, see slide 32. Inc / (Dec) Summary Income Statement ($MM) 2Q26 1Q26 2Q25 Total revenue, net of interest expense ($744) ($21) $89 Provision (benefit) for credit losses (9) — — Noninterest expense 167 4 20 Pretax income (loss) (902) (25) 69 Pretax, pre-provision income (loss)2 (911) (25) 69 Income tax expense (benefit) (610) 368 338 Net income (loss) ($292) ($393) ($269) 17

Additional Presentation Information
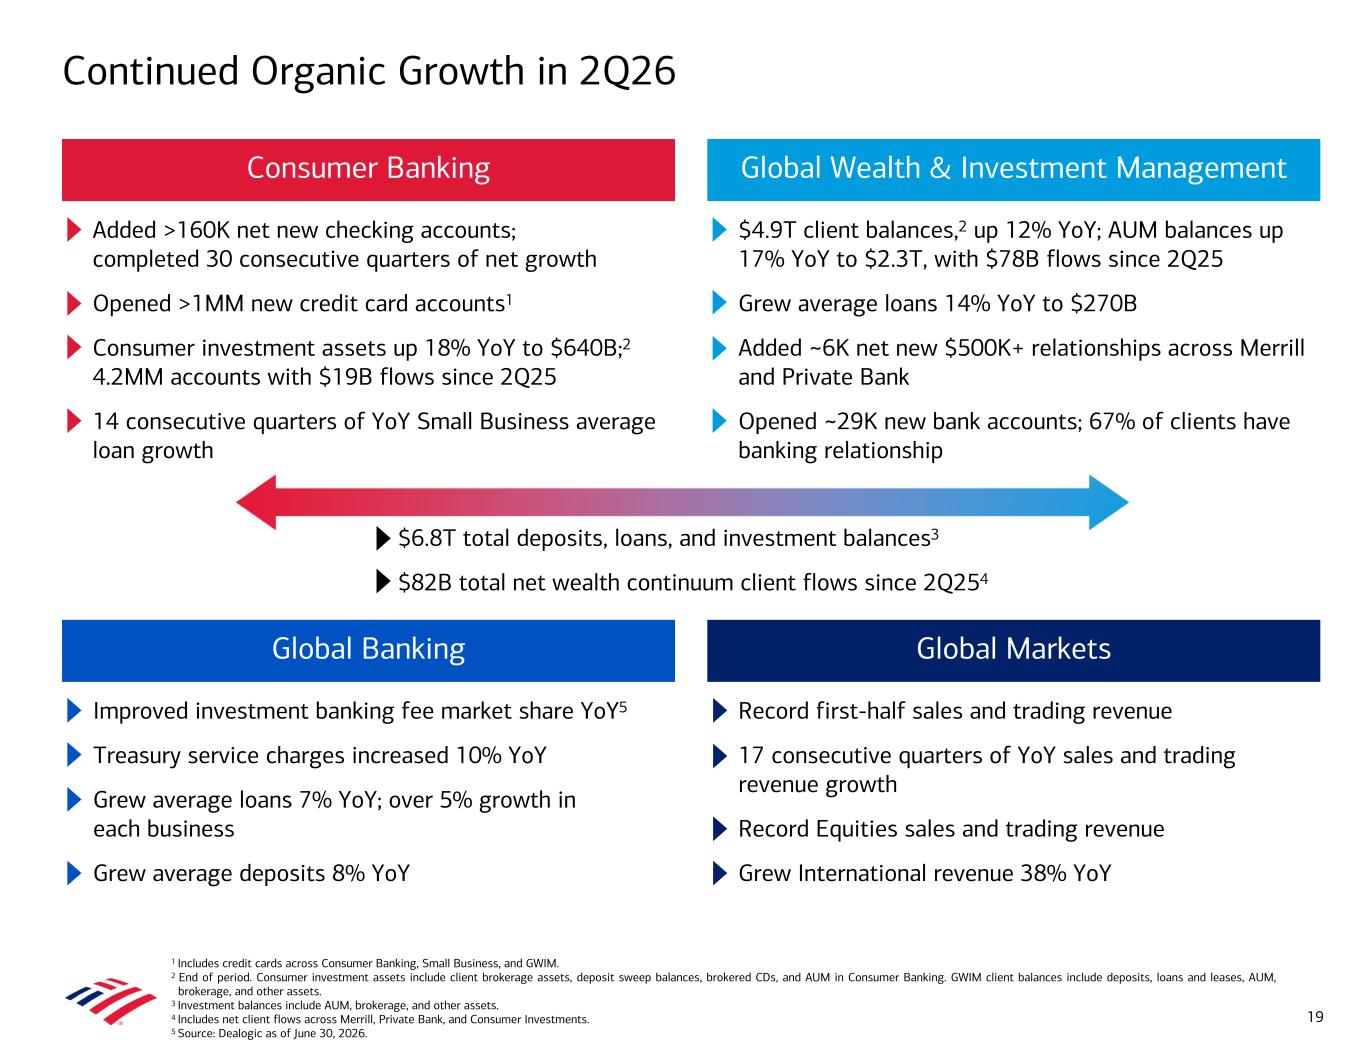
Added >160K net new checking accounts; completed 30 consecutive quarters of net growth Opened >1MM new credit card accounts1 Consumer investment assets up 18% YoY to $640B;2 4.2MM accounts with $19B flows since 2Q25 14 consecutive quarters of YoY Small Business average loan growth 1 Includes credit cards across Consumer Banking, Small Business, and GWIM. 2 End of period. Consumer investment assets include client brokerage assets, deposit sweep balances, brokered CDs, and AUM in Consumer Banking. GWIM client balances include deposits, loans and leases, AUM, brokerage, and other assets. 3 Investment balances include AUM, brokerage, and other assets. 4 Includes net client flows across Merrill, Private Bank, and Consumer Investments. 5 Source: Dealogic as of June 30, 2026. Continued Organic Growth in 2Q26 19 Consumer Banking Global Wealth & Investment Management Global Banking Global Markets $6.8T total deposits, loans, and investment balances3 $82B total net wealth continuum client flows since 2Q254 $4.9T client balances,2 up 12% YoY; AUM balances up 17% YoY to $2.3T, with $78B flows since 2Q25 Grew average loans 14% YoY to $270B Added ~6K net new $500K+ relationships across Merrill and Private Bank Opened ~29K new bank accounts; 67% of clients have banking relationship Record first-half sales and trading revenue 17 consecutive quarters of YoY sales and trading revenue growth Record Equities sales and trading revenue Grew International revenue 38% YoY Improved investment banking fee market share YoY5 Treasury service charges increased 10% YoY Grew average loans 7% YoY; over 5% growth in each business Grew average deposits 8% YoY
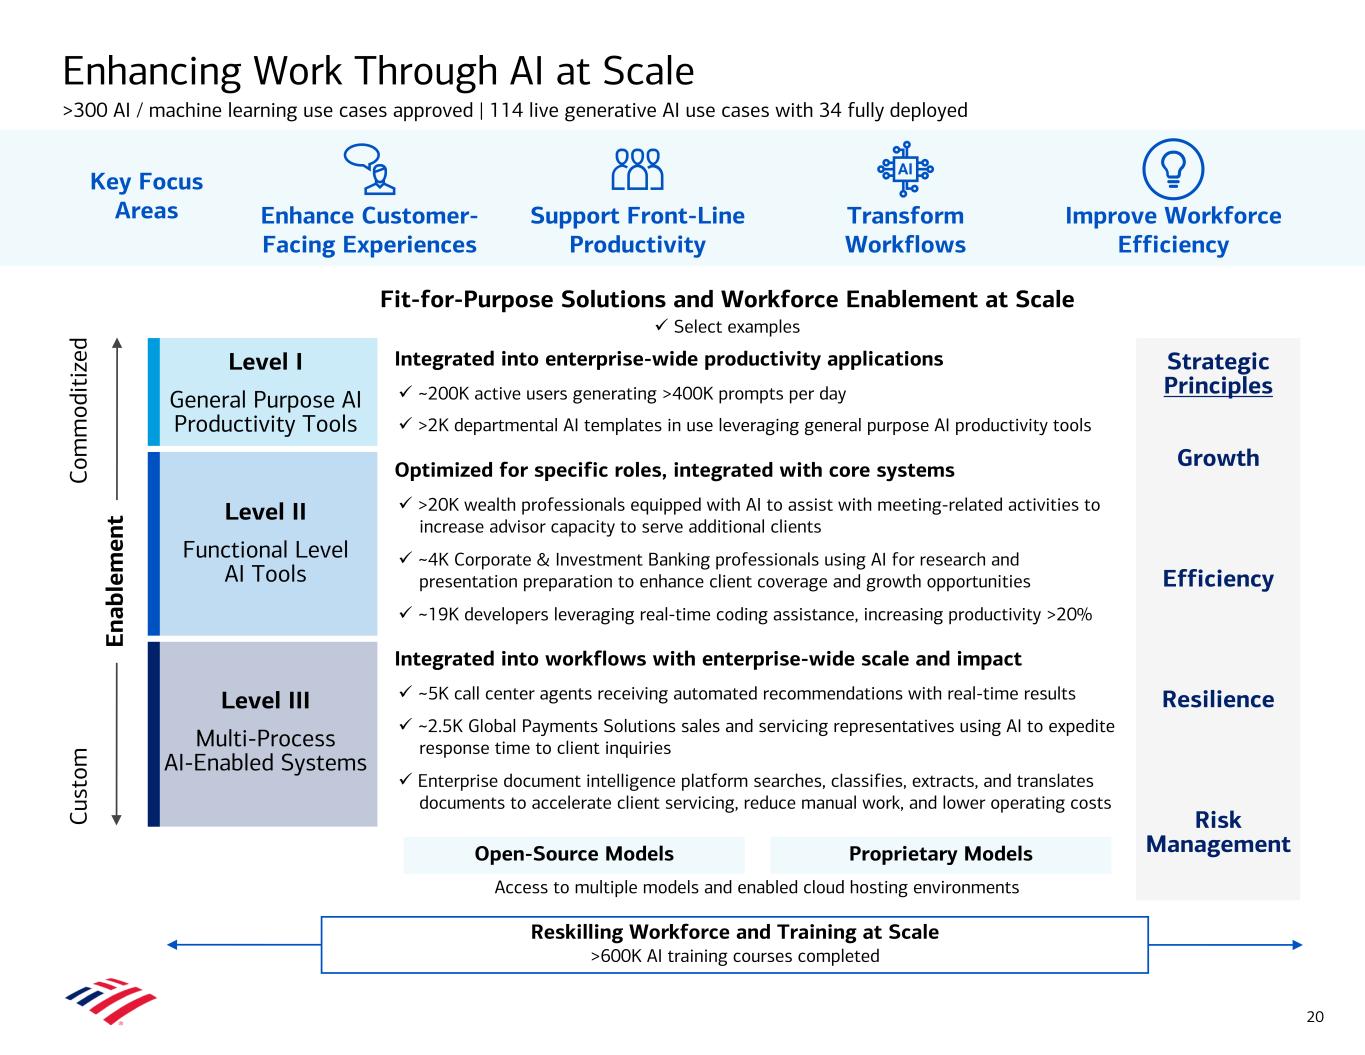
Fit-for-Purpose Solutions and Workforce Enablement at Scale ü Select examples Level I General Purpose AI Productivity Tools Integrated into enterprise-wide productivity applications Strategic Principles Growth Efficiency Resilience Risk Management ü ~200K active users generating >400K prompts per day ü >2K departmental AI templates in use leveraging general purpose AI productivity tools Level II Functional Level AI Tools Optimized for specific roles, integrated with core systems ü >20K wealth professionals equipped with AI to assist with meeting-related activities to increase advisor capacity to serve additional clients ü ~4K Corporate & Investment Banking professionals using AI for research and presentation preparation to enhance client coverage and growth opportunities ü ~19K developers leveraging real-time coding assistance, increasing productivity >20% Level III Multi-Process AI-Enabled Systems Integrated into workflows with enterprise-wide scale and impact ü ~5K call center agents receiving automated recommendations with real-time results ü ~2.5K Global Payments Solutions sales and servicing representatives using AI to expedite response time to client inquiries ü Enterprise document intelligence platform searches, classifies, extracts, and translates documents to accelerate client servicing, reduce manual work, and lower operating costs Access to multiple models and enabled cloud hosting environments Support Front-Line Productivity Enhancing Work Through AI at Scale >300 AI / machine learning use cases approved | 114 live generative AI use cases with 34 fully deployed 20 Co m m od it iz ed Cu st om Key Focus Areas Enhance Customer- Facing Experiences Transform Workflows Improve Workforce Efficiency En ab le m en t Reskilling Workforce and Training at Scale >600K AI training courses completed Open-Source Models Proprietary Models

Supplemental Business Segment Trends
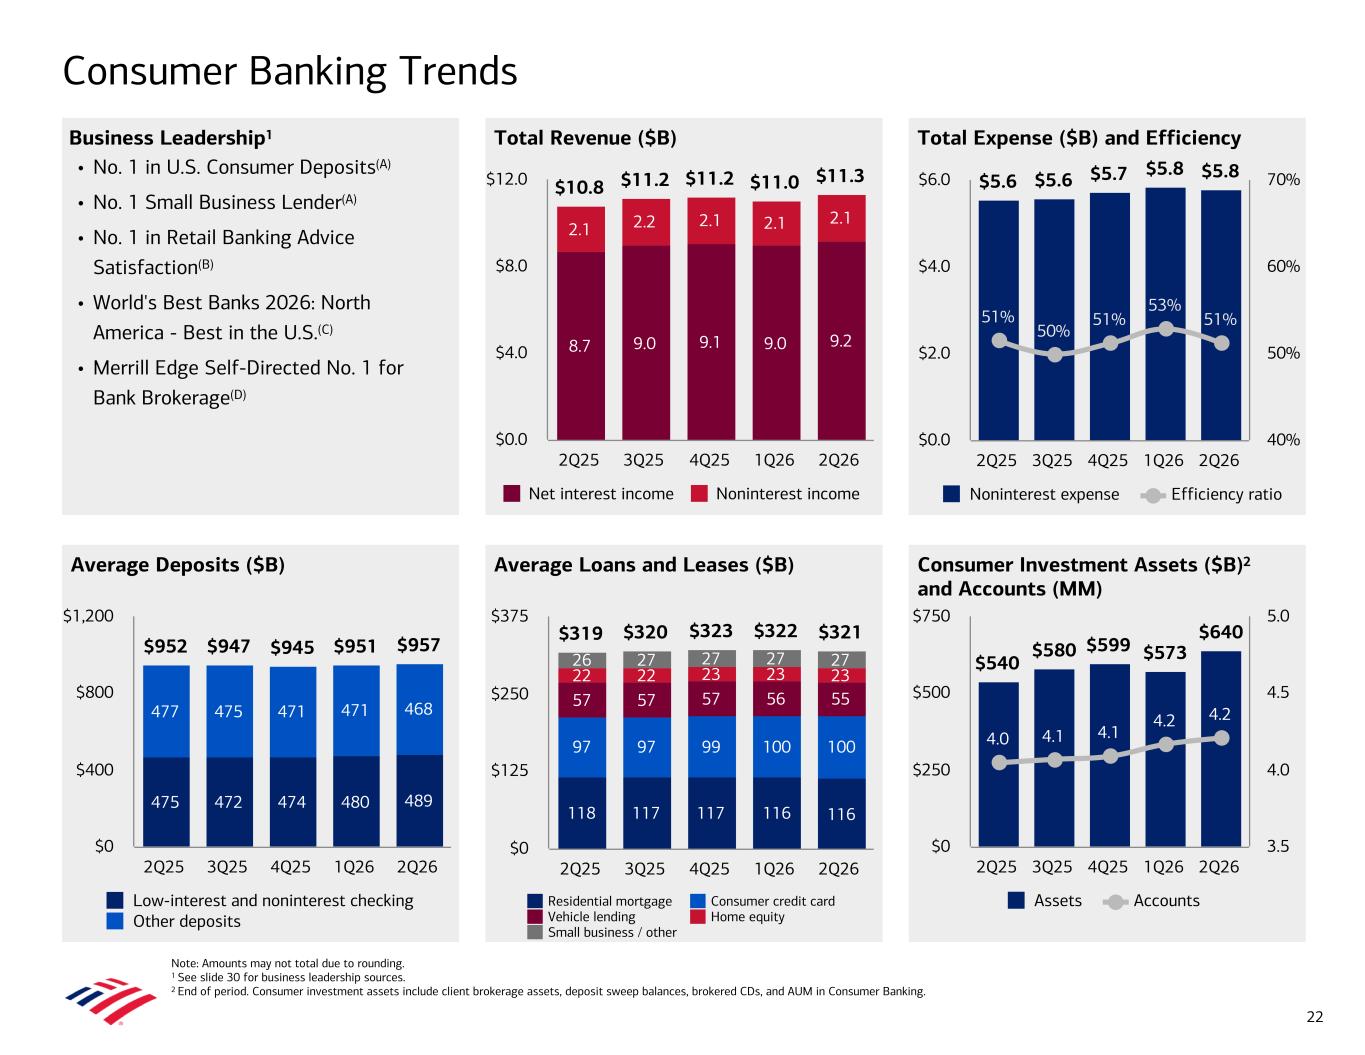
Total Expense ($B) and Efficiency Total Revenue ($B) Average Deposits ($B) Consumer Investment Assets ($B)2 and Accounts (MM) Average Loans and Leases ($B) Consumer Banking Trends Note: Amounts may not total due to rounding. 1 See slide 30 for business leadership sources. 2 End of period. Consumer investment assets include client brokerage assets, deposit sweep balances, brokered CDs, and AUM in Consumer Banking. $10.8 $11.2 $11.2 $11.0 $11.3 8.7 9.0 9.1 9.0 9.2 2.1 2.2 2.1 2.1 2.1 Net interest income Noninterest income 2Q25 3Q25 4Q25 1Q26 2Q26 $0.0 $4.0 $8.0 $12.0 $5.6 $5.6 $5.7 $5.8 $5.8 51% 50% 51% 53% 51% Noninterest expense Efficiency ratio 2Q25 3Q25 4Q25 1Q26 2Q26 $0.0 $2.0 $4.0 $6.0 40% 50% 60% 70% $952 $947 $945 $951 $957 475 472 474 480 489 477 475 471 471 468 Low-interest and noninterest checking Other deposits 2Q25 3Q25 4Q25 1Q26 2Q26 $0 $400 $800 $1,200 $319 $320 $323 $322 $321 118 117 117 116 116 97 97 99 100 100 57 57 57 56 55 22 22 23 23 23 26 27 27 27 27 Residential mortgage Consumer credit card Vehicle lending Home equity Small business / other 2Q25 3Q25 4Q25 1Q26 2Q26 $0 $125 $250 $375 22 $540 $580 $599 $573 $640 4.0 4.1 4.1 4.2 4.2 Assets Accounts 2Q25 3Q25 4Q25 1Q26 2Q26 $0 $250 $500 $750 3.5 4.0 4.5 5.0 Business Leadership1 • No. 1 in U.S. Consumer Deposits(A) • No. 1 Small Business Lender(A) • No. 1 in Retail Banking Advice Satisfaction(B) • World's Best Banks 2026: North America - Best in the U.S.(C) • Merrill Edge Self-Directed No. 1 for Bank Brokerage(D)
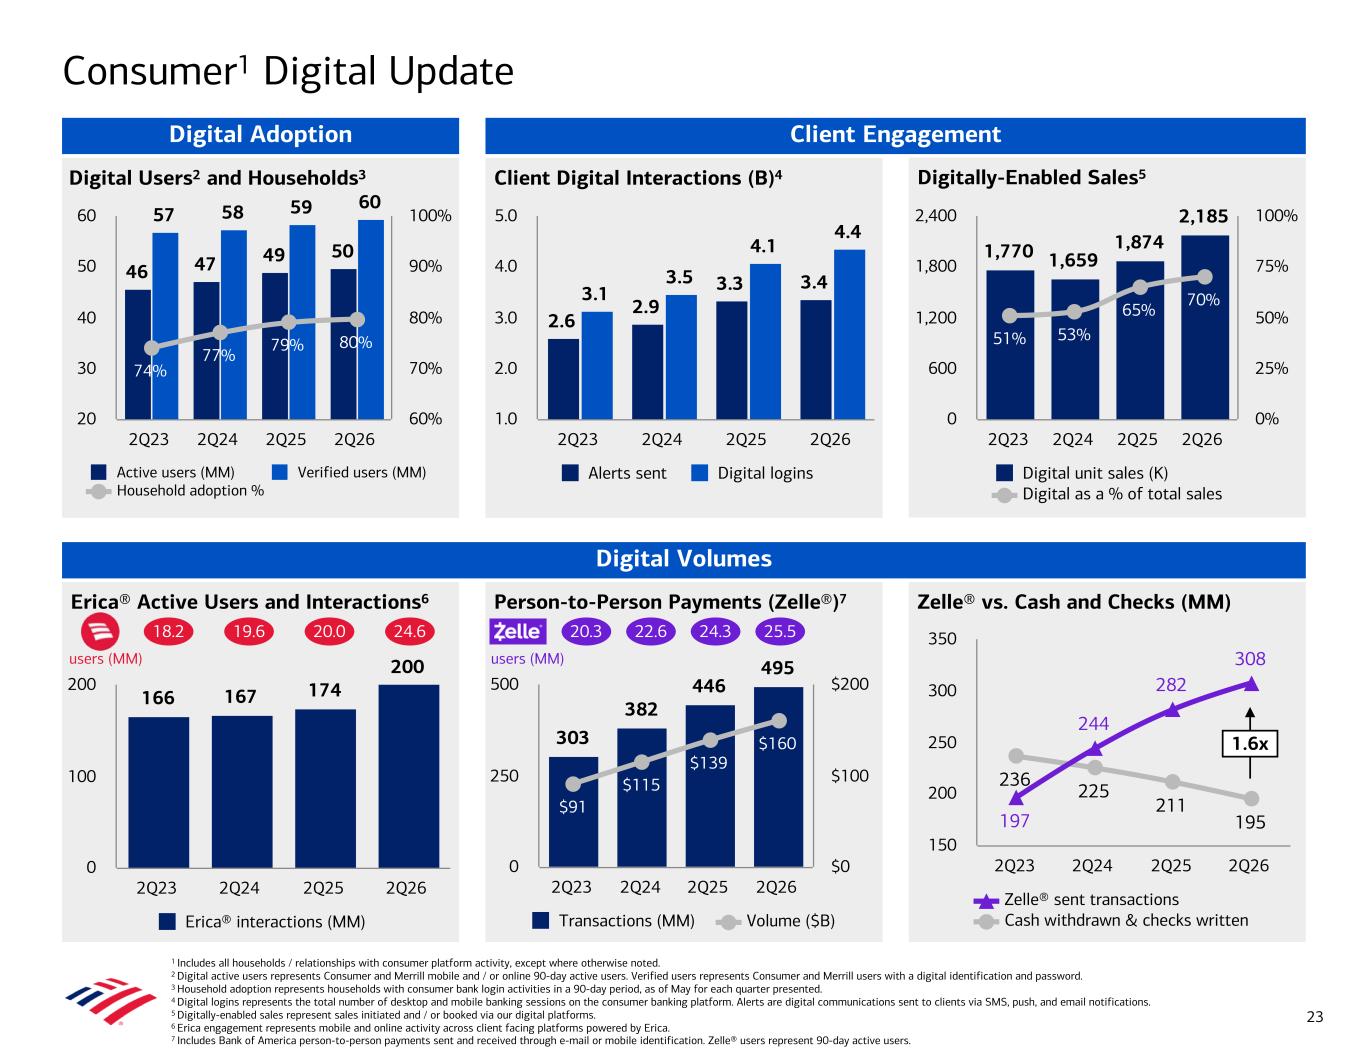
Erica® Active Users and Interactions6 Zelle® vs. Cash and Checks (MM) Digitally-Enabled Sales5Digital Users2 and Households3 Client Digital Interactions (B)4 1,770 1,659 1,874 2,185 51% 53% 65% 70% Digital unit sales (K) Digital as a % of total sales 2Q23 2Q24 2Q25 2Q26 0 600 1,200 1,800 2,400 0% 25% 50% 75% 100% 2.6 2.9 3.3 3.43.1 3.5 4.1 4.4 Alerts sent Digital logins 2Q23 2Q24 2Q25 2Q26 1.0 2.0 3.0 4.0 5.0 46 47 49 50 57 58 59 60 74% 77% 79% 80% Active users (MM) Verified users (MM) Household adoption % 2Q23 2Q24 2Q25 2Q26 20 30 40 50 60 60% 70% 80% 90% 100% Client Engagement Person-to-Person Payments (Zelle®)7 Digital Volumes 303 382 446 495 $91 $115 $139 $160 Transactions (MM) Volume ($B) 2Q23 2Q24 2Q25 2Q26 0 250 500 $0 $100 $200 Consumer1 Digital Update 1 Includes all households / relationships with consumer platform activity, except where otherwise noted. 2 Digital active users represents Consumer and Merrill mobile and / or online 90-day active users. Verified users represents Consumer and Merrill users with a digital identification and password. 3 Household adoption represents households with consumer bank login activities in a 90-day period, as of May for each quarter presented. 4 Digital logins represents the total number of desktop and mobile banking sessions on the consumer banking platform. Alerts are digital communications sent to clients via SMS, push, and email notifications. 5 Digitally-enabled sales represent sales initiated and / or booked via our digital platforms. 6 Erica engagement represents mobile and online activity across client facing platforms powered by Erica. 7 Includes Bank of America person-to-person payments sent and received through e-mail or mobile identification. Zelle® users represent 90-day active users. 20.3 22.6 24.3 25.5 users (MM) 23 Digital Adoption 166 167 174 200 Erica® interactions (MM) 2Q23 2Q24 2Q25 2Q26 0 100 200 236 225 211 195197 244 282 308 Zelle® sent transactions Cash withdrawn & checks written 2Q23 2Q24 2Q25 2Q26 150 200 250 300 350 1.6x 18.2 19.6 20.0 24.6 users (MM)
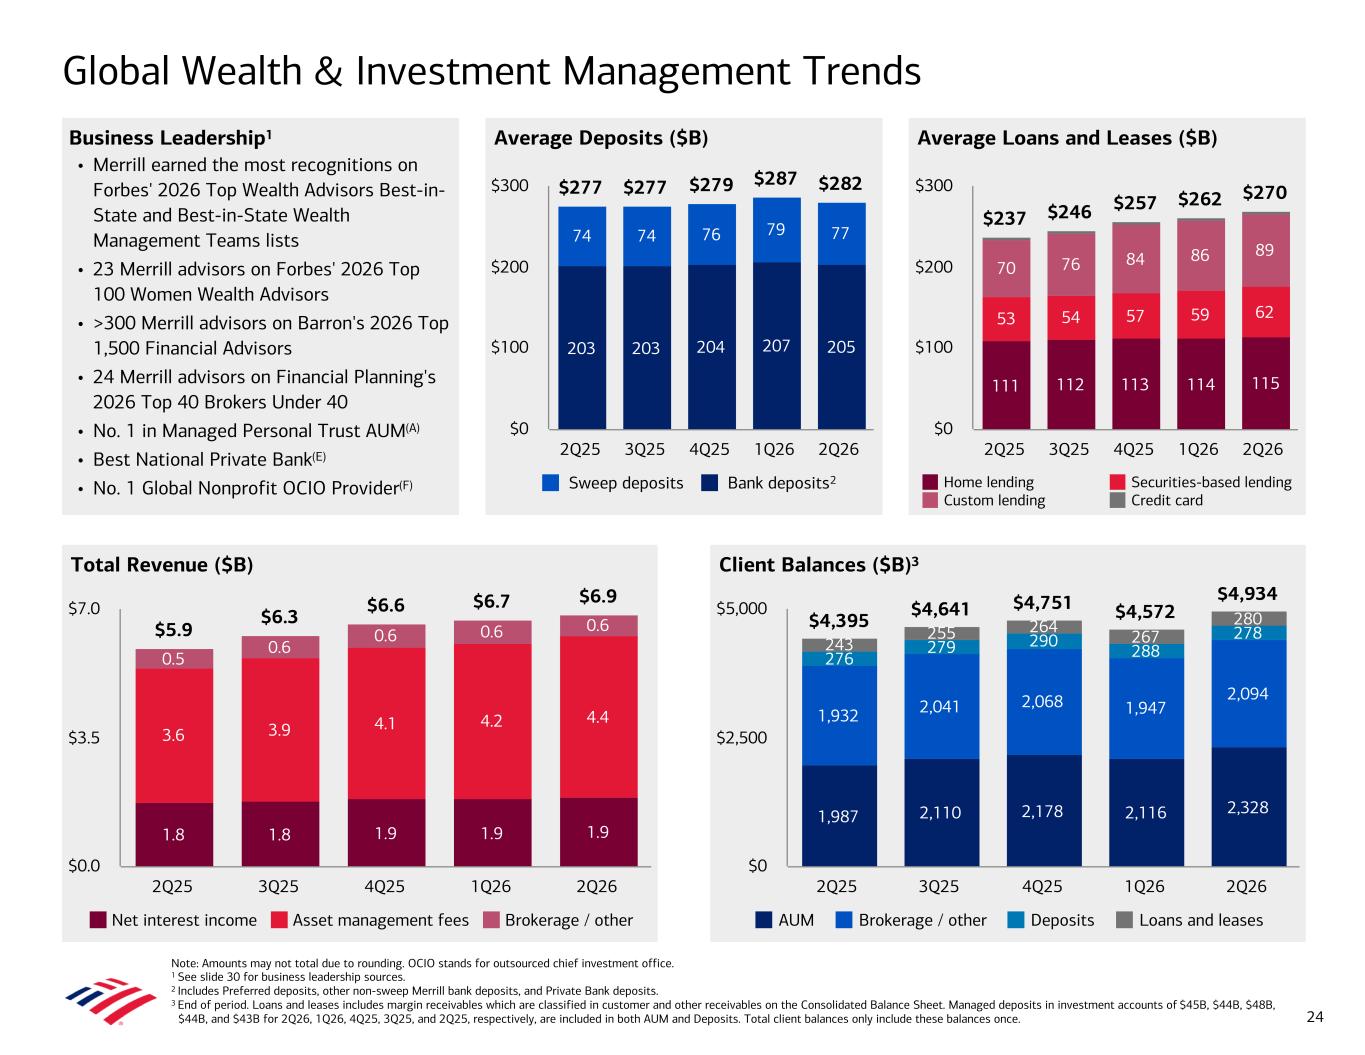
Note: Amounts may not total due to rounding. OCIO stands for outsourced chief investment office. 1 See slide 30 for business leadership sources. 2 Includes Preferred deposits, other non-sweep Merrill bank deposits, and Private Bank deposits. 3 End of period. Loans and leases includes margin receivables which are classified in customer and other receivables on the Consolidated Balance Sheet. Managed deposits in investment accounts of $45B, $44B, $48B, $44B, and $43B for 2Q26, 1Q26, 4Q25, 3Q25, and 2Q25, respectively, are included in both AUM and Deposits. Total client balances only include these balances once. Average Deposits ($B) Global Wealth & Investment Management Trends Business Leadership1 • Merrill earned the most recognitions on Forbes' 2026 Top Wealth Advisors Best-in- State and Best-in-State Wealth Management Teams lists • 23 Merrill advisors on Forbes' 2026 Top 100 Women Wealth Advisors • >300 Merrill advisors on Barron's 2026 Top 1,500 Financial Advisors • 24 Merrill advisors on Financial Planning's 2026 Top 40 Brokers Under 40 • No. 1 in Managed Personal Trust AUM(A) • Best National Private Bank(E) • No. 1 Global Nonprofit OCIO Provider(F) Average Loans and Leases ($B) Total Revenue ($B) Client Balances ($B)3 $5.9 $6.3 $6.6 $6.7 $6.9 1.8 1.8 1.9 1.9 1.9 3.6 3.9 4.1 4.2 4.4 0.5 0.6 0.6 0.6 0.6 Net interest income Asset management fees Brokerage / other 2Q25 3Q25 4Q25 1Q26 2Q26 $0.0 $3.5 $7.0 1,987 2,110 2,178 2,116 2,328 1,932 2,041 2,068 1,947 2,094 276 279 290 288 278 243 255 264 267 280$4,395 $4,641 $4,751 $4,572 $4,934 AUM Brokerage / other Deposits Loans and leases 2Q25 3Q25 4Q25 1Q26 2Q26 $0 $2,500 $5,000 $237 $246 $257 $262 $270 111 112 113 114 115 53 54 57 59 62 70 76 84 86 89 Home lending Securities-based lending Custom lending Credit card 2Q25 3Q25 4Q25 1Q26 2Q26 $0 $100 $200 $300$277 $277 $279 $287 $282 203 203 204 207 205 74 74 76 79 77 Sweep deposits Bank deposits 2Q25 3Q25 4Q25 1Q26 2Q26 $0 $100 $200 $300 24 2
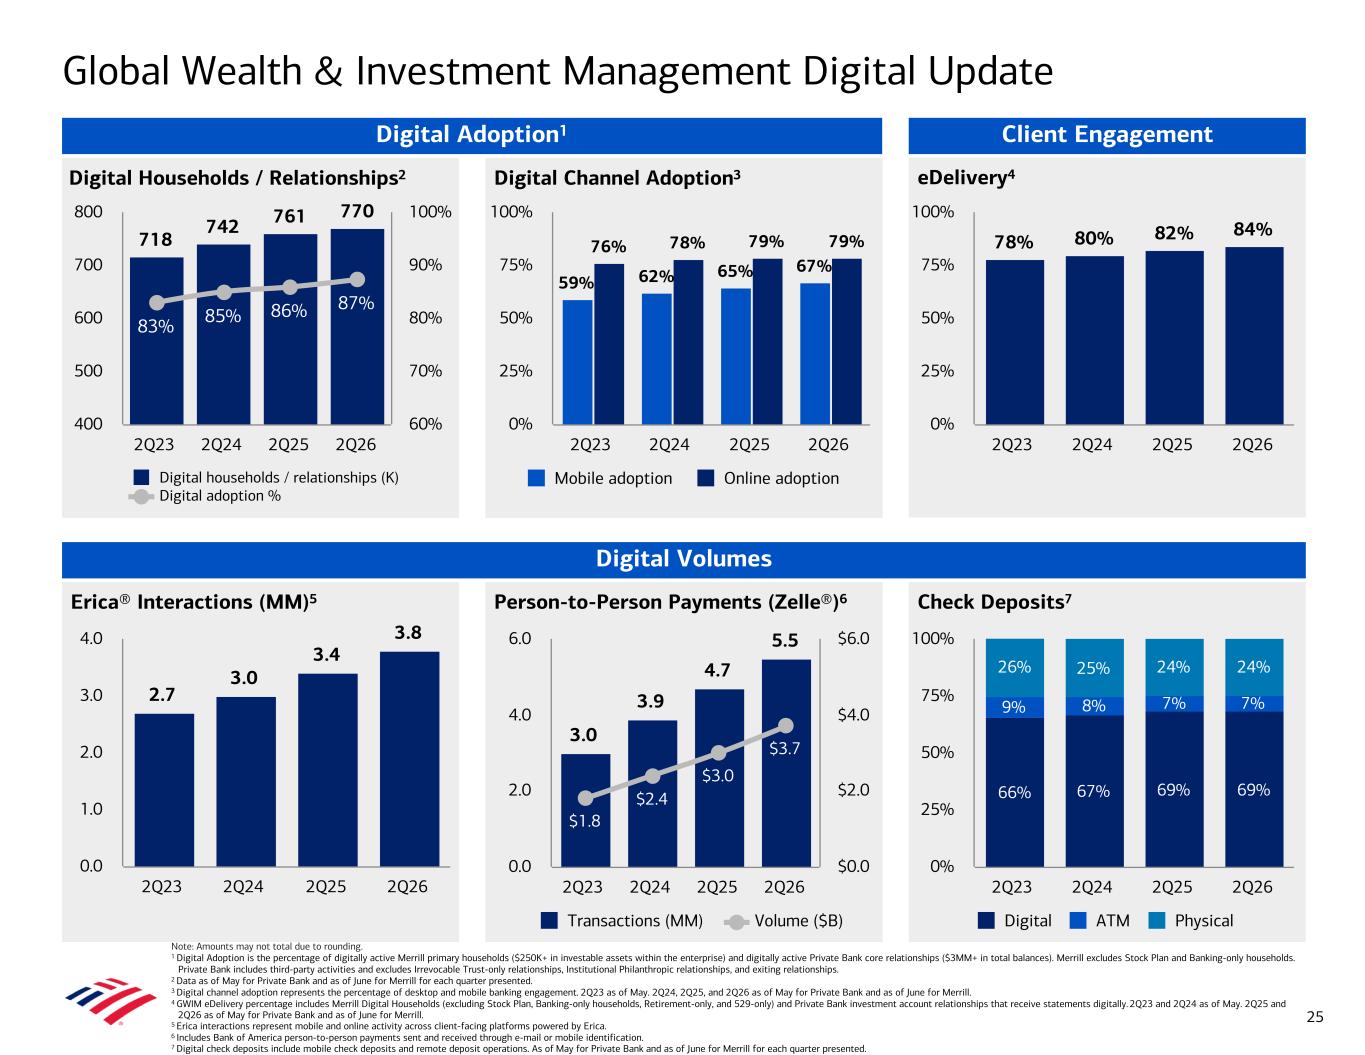
Erica® Interactions (MM)5 2.7 3.0 3.4 3.8 2Q23 2Q24 2Q25 2Q26 0.0 1.0 2.0 3.0 4.0 Person-to-Person Payments (Zelle®)6 Check Deposits7 eDelivery4Digital Households / Relationships2 Digital Channel Adoption3 78% 80% 82% 84% 2Q23 2Q24 2Q25 2Q26 0% 25% 50% 75% 100% 59% 62% 65% 67% 76% 78% 79% 79% Mobile adoption Online adoption 2Q23 2Q24 2Q25 2Q26 0% 25% 50% 75% 100% 718 742 761 770 83% 85% 86% 87% Digital households / relationships (K) Digital adoption % 2Q23 2Q24 2Q25 2Q26 400 500 600 700 800 60% 70% 80% 90% 100% Client Engagement Digital Volumes Global Wealth & Investment Management Digital Update 25 Digital Adoption1 3.0 3.9 4.7 5.5 $1.8 $2.4 $3.0 $3.7 Transactions (MM) Volume ($B) 2Q23 2Q24 2Q25 2Q26 0.0 2.0 4.0 6.0 $0.0 $2.0 $4.0 $6.0 66% 67% 69% 69% 9% 8% 7% 7% 26% 25% 24% 24% Digital ATM Physical 2Q23 2Q24 2Q25 2Q26 0% 25% 50% 75% 100% Note: Amounts may not total due to rounding. 1 Digital Adoption is the percentage of digitally active Merrill primary households ($250K+ in investable assets within the enterprise) and digitally active Private Bank core relationships ($3MM+ in total balances). Merrill excludes Stock Plan and Banking-only households. Private Bank includes third-party activities and excludes Irrevocable Trust-only relationships, Institutional Philanthropic relationships, and exiting relationships. 2 Data as of May for Private Bank and as of June for Merrill for each quarter presented. 3 Digital channel adoption represents the percentage of desktop and mobile banking engagement. 2Q23 as of May. 2Q24, 2Q25, and 2Q26 as of May for Private Bank and as of June for Merrill. 4 GWIM eDelivery percentage includes Merrill Digital Households (excluding Stock Plan, Banking-only households, Retirement-only, and 529-only) and Private Bank investment account relationships that receive statements digitally. 2Q23 and 2Q24 as of May. 2Q25 and 2Q26 as of May for Private Bank and as of June for Merrill. 5 Erica interactions represent mobile and online activity across client-facing platforms powered by Erica. 6 Includes Bank of America person-to-person payments sent and received through e-mail or mobile identification. 7 Digital check deposits include mobile check deposits and remote deposit operations. As of May for Private Bank and as of June for Merrill for each quarter presented.
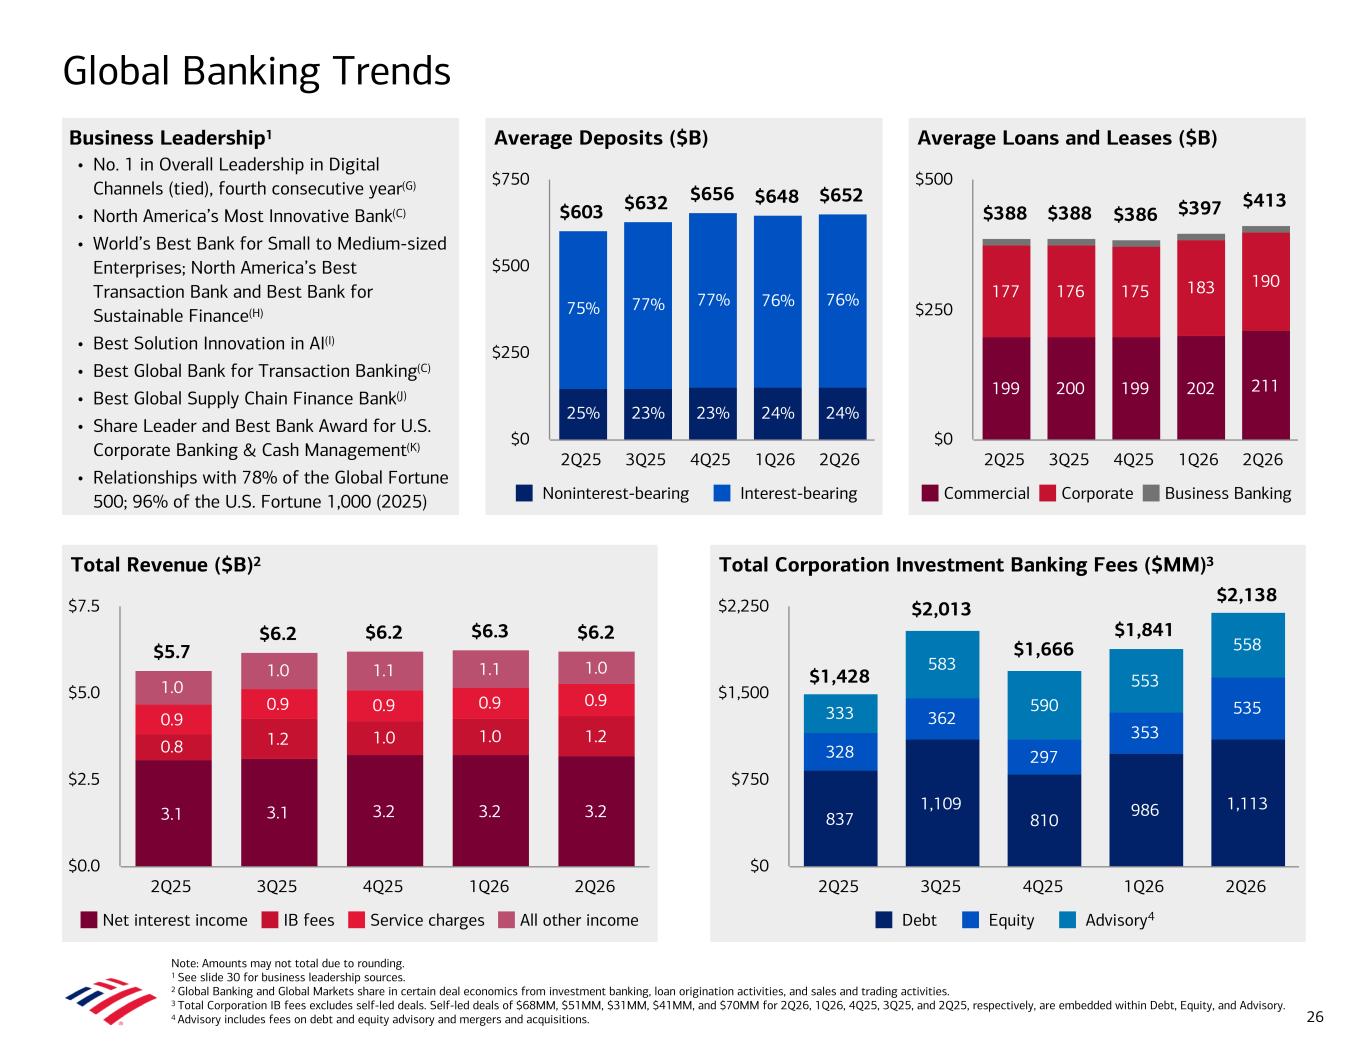
Global Banking Trends Note: Amounts may not total due to rounding. 1 See slide 30 for business leadership sources. 2 Global Banking and Global Markets share in certain deal economics from investment banking, loan origination activities, and sales and trading activities. 3 Total Corporation IB fees excludes self-led deals. Self-led deals of $68MM, $51MM, $31MM, $41MM, and $70MM for 2Q26, 1Q26, 4Q25, 3Q25, and 2Q25, respectively, are embedded within Debt, Equity, and Advisory. 4 Advisory includes fees on debt and equity advisory and mergers and acquisitions. Average Deposits ($B)Business Leadership1 • No. 1 in Overall Leadership in Digital Channels (tied), fourth consecutive year(G) • North America’s Most Innovative Bank(C) • World’s Best Bank for Small to Medium-sized Enterprises; North America’s Best Transaction Bank and Best Bank for Sustainable Finance(H) • Best Solution Innovation in AI(I) • Best Global Bank for Transaction Banking(C) • Best Global Supply Chain Finance Bank(J) • Share Leader and Best Bank Award for U.S. Corporate Banking & Cash Management(K) • Relationships with 78% of the Global Fortune 500; 96% of the U.S. Fortune 1,000 (2025) Average Loans and Leases ($B) Total Revenue ($B)2 Total Corporation Investment Banking Fees ($MM)3 $5.7 $6.2 $6.2 $6.3 $6.2 3.1 3.1 3.2 3.2 3.2 0.8 1.2 1.0 1.0 1.2 0.9 0.9 0.9 0.9 0.9 1.0 1.0 1.1 1.1 1.0 Net interest income IB fees Service charges All other income 2Q25 3Q25 4Q25 1Q26 2Q26 $0.0 $2.5 $5.0 $7.5 837 1,109 810 986 1,113 328 362 297 353 535333 583 590 553 558 $1,428 $2,013 $1,666 $1,841 $2,138 Debt Equity Advisory 2Q25 3Q25 4Q25 1Q26 2Q26 $0 $750 $1,500 $2,250 199 200 199 202 211 177 176 175 183 190 $388 $388 $386 $397 $413 Commercial Corporate Business Banking 2Q25 3Q25 4Q25 1Q26 2Q26 $0 $250 $500 4 $603 $632 $656 $648 $652 Noninterest-bearing Interest-bearing 2Q25 3Q25 4Q25 1Q26 2Q26 $0 $250 $500 $750 26 25% 23% 23% 24% 24% 75% 77% 77% 76% 76%
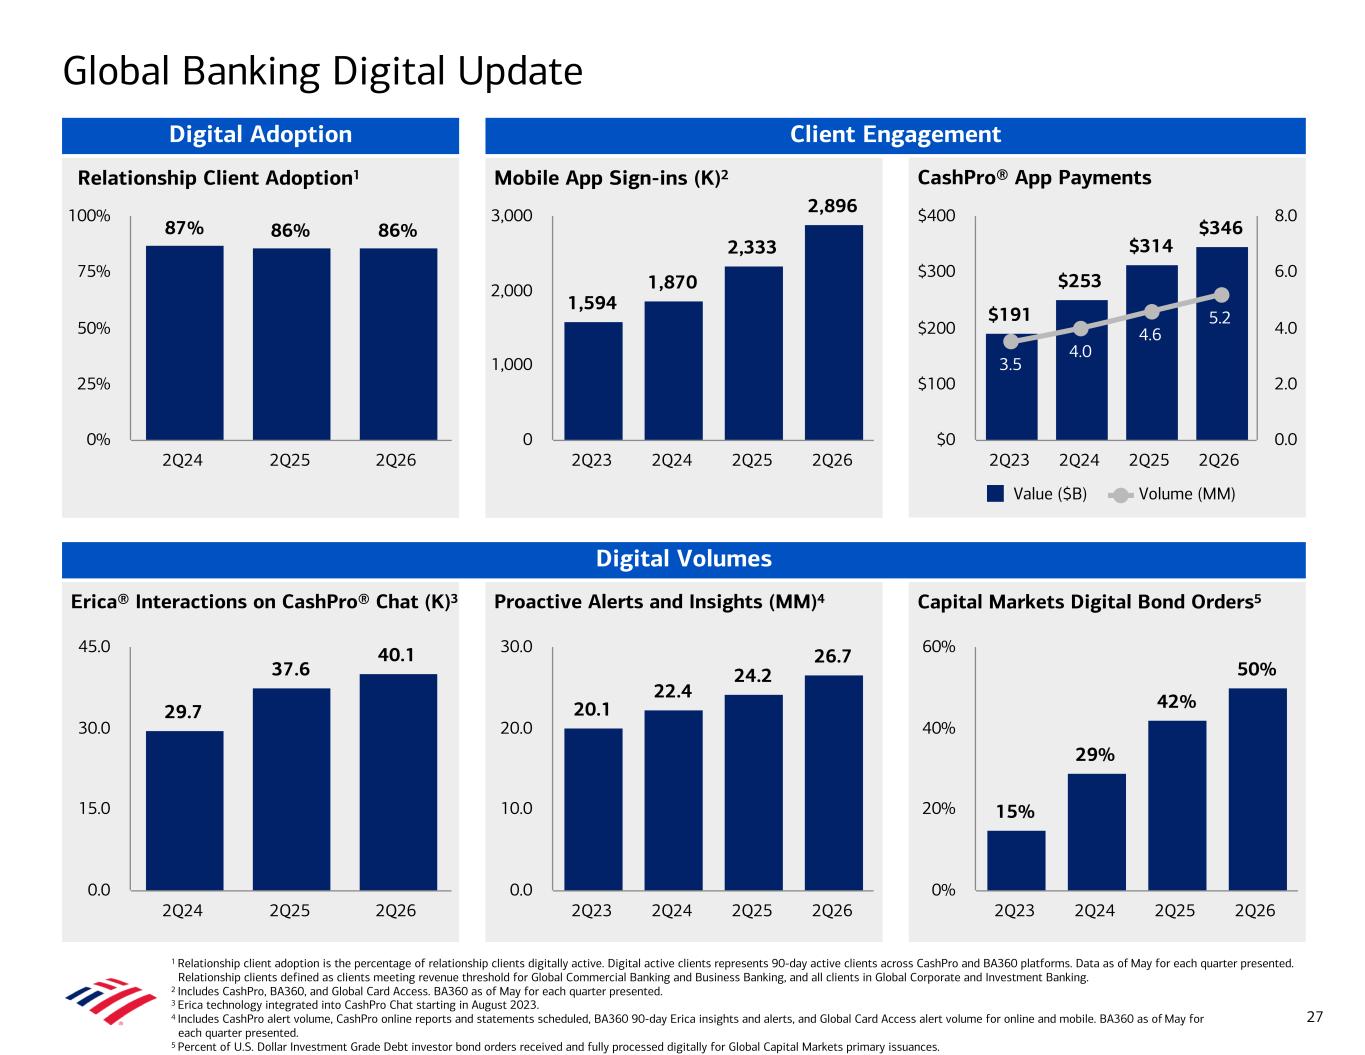
1 Relationship client adoption is the percentage of relationship clients digitally active. Digital active clients represents 90-day active clients across CashPro and BA360 platforms. Data as of May for each quarter presented. Relationship clients defined as clients meeting revenue threshold for Global Commercial Banking and Business Banking, and all clients in Global Corporate and Investment Banking. 2 Includes CashPro, BA360, and Global Card Access. BA360 as of May for each quarter presented. 3 Erica technology integrated into CashPro Chat starting in August 2023. 4 Includes CashPro alert volume, CashPro online reports and statements scheduled, BA360 90-day Erica insights and alerts, and Global Card Access alert volume for online and mobile. BA360 as of May for each quarter presented. 5 Percent of U.S. Dollar Investment Grade Debt investor bond orders received and fully processed digitally for Global Capital Markets primary issuances. Capital Markets Digital Bond Orders5 Erica® Interactions on CashPro® Chat (K)3 Proactive Alerts and Insights (MM)4 15% 29% 42% 50% 2Q23 2Q24 2Q25 2Q26 0% 20% 40% 60% 20.1 22.4 24.2 26.7 2Q23 2Q24 2Q25 2Q26 0.0 10.0 20.0 30.0 29.7 37.6 40.1 2Q24 2Q25 2Q26 0.0 15.0 30.0 45.0 CashPro® App PaymentsRelationship Client Adoption1 Mobile App Sign-ins (K)2 $191 $253 $314 $346 3.5 4.0 4.6 5.2 Value ($B) Volume (MM) 2Q23 2Q24 2Q25 2Q26 $0 $100 $200 $300 $400 0.0 2.0 4.0 6.0 8.0 1,594 1,870 2,333 2,896 2Q23 2Q24 2Q25 2Q26 0 1,000 2,000 3,000 87% 86% 86% 2Q24 2Q25 2Q26 0% 25% 50% 75% 100% Client Engagement Digital Volumes Global Banking Digital Update 27 Digital Adoption
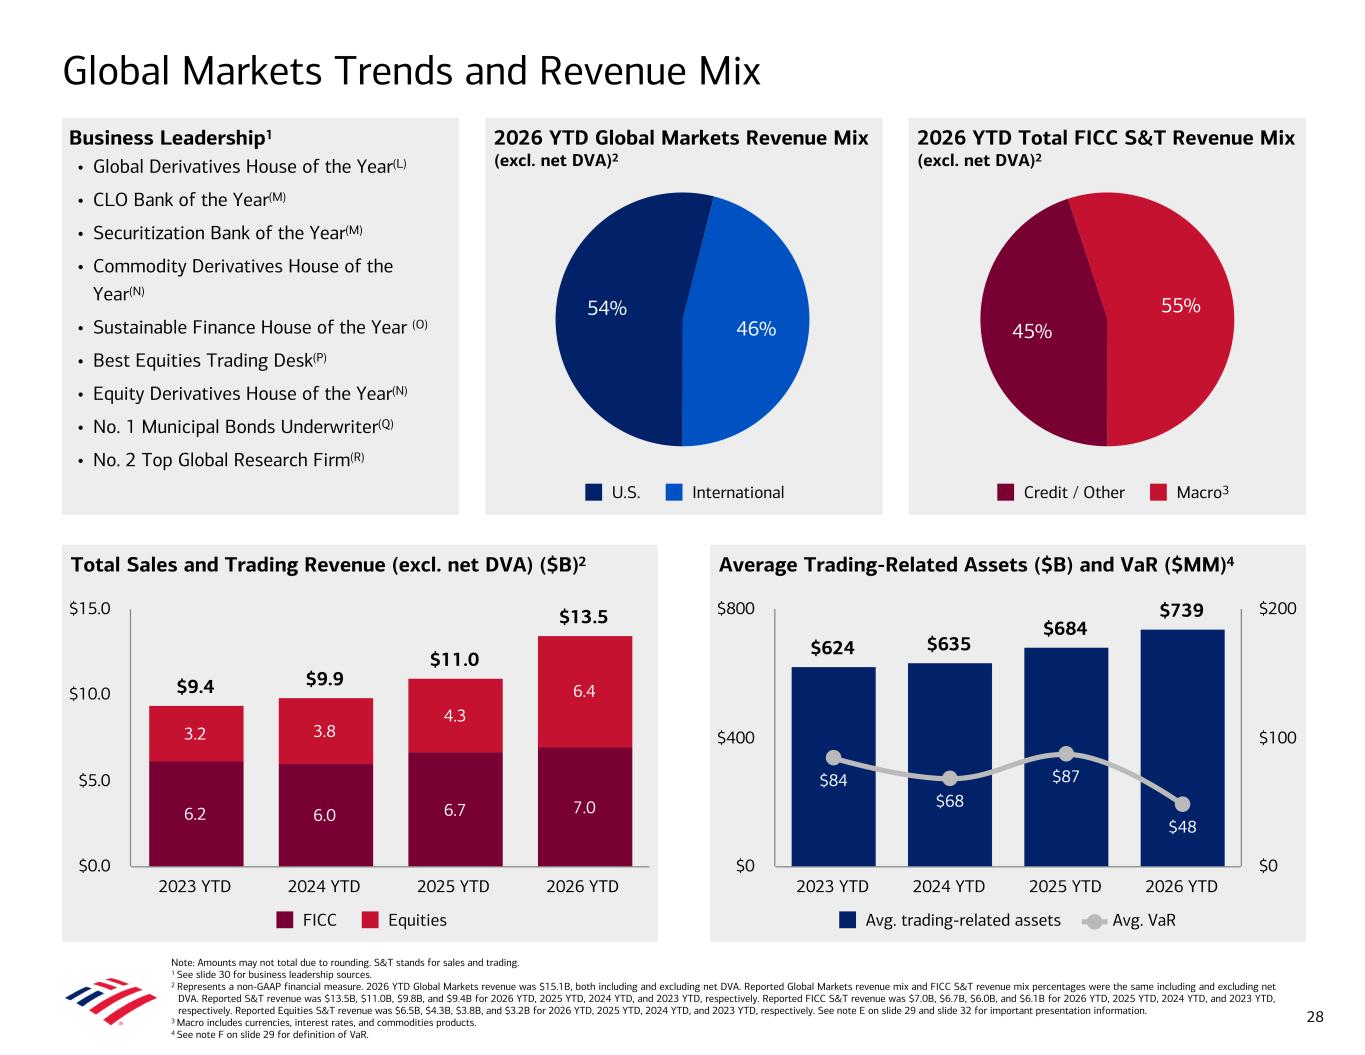
Note: Amounts may not total due to rounding. S&T stands for sales and trading. 1 See slide 30 for business leadership sources. 2 Represents a non-GAAP financial measure. 2026 YTD Global Markets revenue was $15.1B, both including and excluding net DVA. Reported Global Markets revenue mix and FICC S&T revenue mix percentages were the same including and excluding net DVA. Reported S&T revenue was $13.5B, $11.0B, $9.8B, and $9.4B for 2026 YTD, 2025 YTD, 2024 YTD, and 2023 YTD, respectively. Reported FICC S&T revenue was $7.0B, $6.7B, $6.0B, and $6.1B for 2026 YTD, 2025 YTD, 2024 YTD, and 2023 YTD, respectively. Reported Equities S&T revenue was $6.5B, $4.3B, $3.8B, and $3.2B for 2026 YTD, 2025 YTD, 2024 YTD, and 2023 YTD, respectively. See note E on slide 29 and slide 32 for important presentation information. 3 Macro includes currencies, interest rates, and commodities products. 4 See note F on slide 29 for definition of VaR. Global Markets Trends and Revenue Mix 2026 YTD Global Markets Revenue Mix (excl. net DVA)2 Business Leadership1 • Global Derivatives House of the Year(L) • CLO Bank of the Year(M) • Securitization Bank of the Year(M) • Commodity Derivatives House of the Year(N) • Sustainable Finance House of the Year (O) • Best Equities Trading Desk(P) • Equity Derivatives House of the Year(N) • No. 1 Municipal Bonds Underwriter(Q) • No. 2 Top Global Research Firm(R) 2026 YTD Total FICC S&T Revenue Mix (excl. net DVA)2 Total Sales and Trading Revenue (excl. net DVA) ($B)2 Average Trading-Related Assets ($B) and VaR ($MM)4 $9.4 $9.9 $11.0 $13.5 6.2 6.0 6.7 7.0 3.2 3.8 4.3 6.4 FICC Equities 2023 YTD 2024 YTD 2025 YTD 2026 YTD $0.0 $5.0 $10.0 $15.0 $624 $635 $684 $739 $84 $68 $87 $48 Avg. trading-related assets Avg. VaR 2023 YTD 2024 YTD 2025 YTD 2026 YTD $0 $400 $800 $0 $100 $200 54% 46% U.S. International 45% 55% Credit / Other Macro 28 3
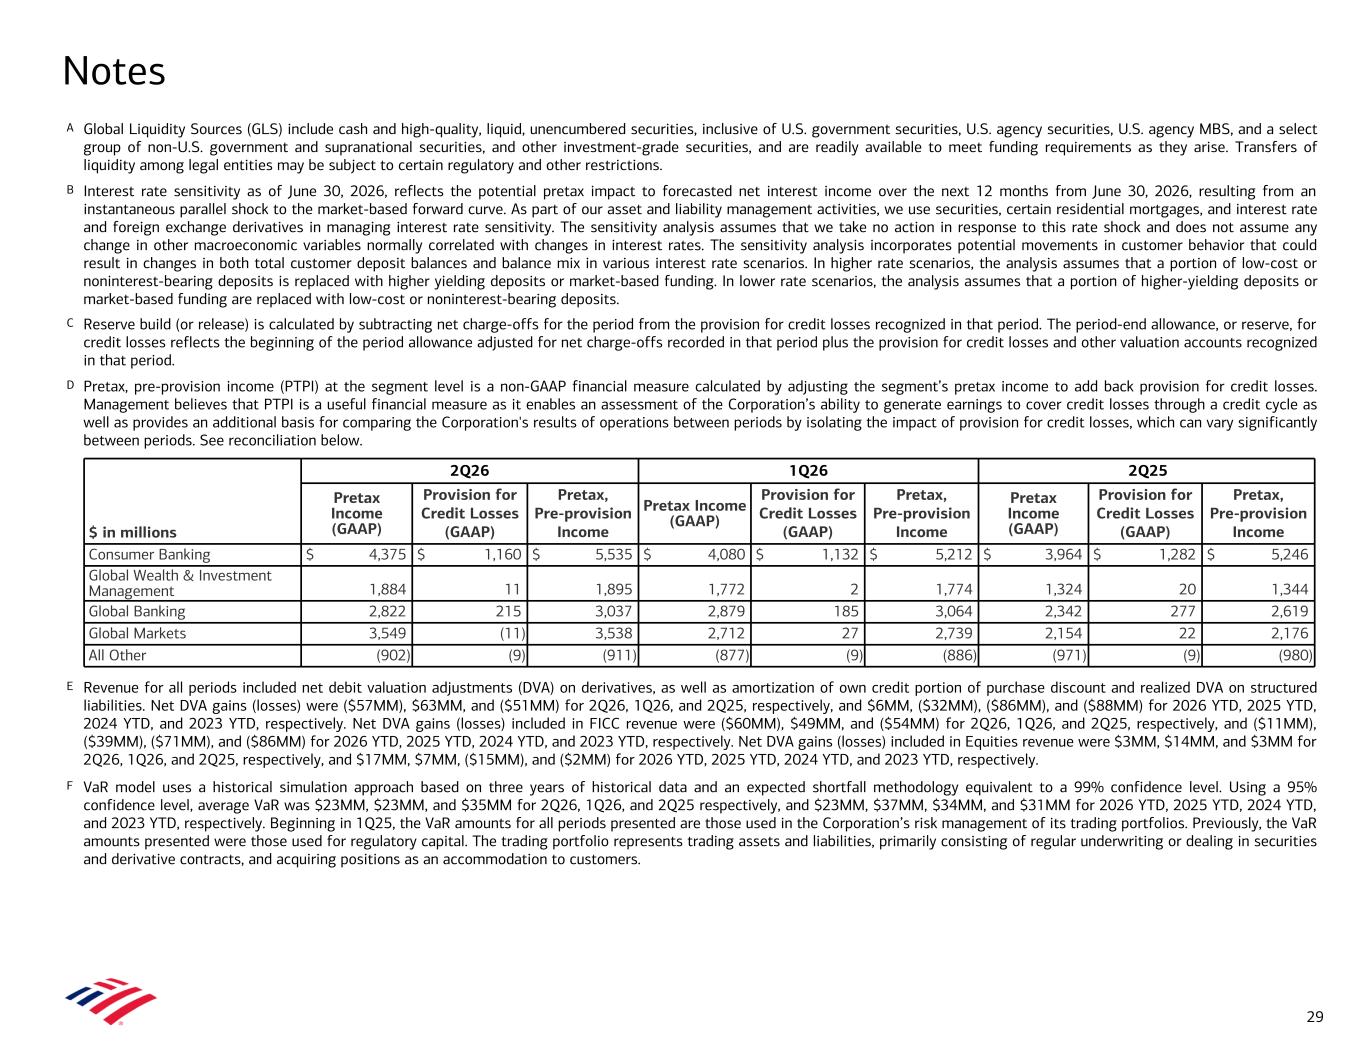
A Global Liquidity Sources (GLS) include cash and high-quality, liquid, unencumbered securities, inclusive of U.S. government securities, U.S. agency securities, U.S. agency MBS, and a select group of non-U.S. government and supranational securities, and other investment-grade securities, and are readily available to meet funding requirements as they arise. Transfers of liquidity among legal entities may be subject to certain regulatory and other restrictions. B Interest rate sensitivity as of June 30, 2026, reflects the potential pretax impact to forecasted net interest income over the next 12 months from June 30, 2026, resulting from an instantaneous parallel shock to the market-based forward curve. As part of our asset and liability management activities, we use securities, certain residential mortgages, and interest rate and foreign exchange derivatives in managing interest rate sensitivity. The sensitivity analysis assumes that we take no action in response to this rate shock and does not assume any change in other macroeconomic variables normally correlated with changes in interest rates. The sensitivity analysis incorporates potential movements in customer behavior that could result in changes in both total customer deposit balances and balance mix in various interest rate scenarios. In higher rate scenarios, the analysis assumes that a portion of low-cost or noninterest-bearing deposits is replaced with higher yielding deposits or market-based funding. In lower rate scenarios, the analysis assumes that a portion of higher-yielding deposits or market-based funding are replaced with low-cost or noninterest-bearing deposits. C Reserve build (or release) is calculated by subtracting net charge-offs for the period from the provision for credit losses recognized in that period. The period-end allowance, or reserve, for credit losses reflects the beginning of the period allowance adjusted for net charge-offs recorded in that period plus the provision for credit losses and other valuation accounts recognized in that period. D Pretax, pre-provision income (PTPI) at the segment level is a non-GAAP financial measure calculated by adjusting the segment’s pretax income to add back provision for credit losses. Management believes that PTPI is a useful financial measure as it enables an assessment of the Corporation’s ability to generate earnings to cover credit losses through a credit cycle as well as provides an additional basis for comparing the Corporation's results of operations between periods by isolating the impact of provision for credit losses, which can vary significantly between periods. See reconciliation below. E Revenue for all periods included net debit valuation adjustments (DVA) on derivatives, as well as amortization of own credit portion of purchase discount and realized DVA on structured liabilities. Net DVA gains (losses) were ($57MM), $63MM, and ($51MM) for 2Q26, 1Q26, and 2Q25, respectively, and $6MM, ($32MM), ($86MM), and ($88MM) for 2026 YTD, 2025 YTD, 2024 YTD, and 2023 YTD, respectively. Net DVA gains (losses) included in FICC revenue were ($60MM), $49MM, and ($54MM) for 2Q26, 1Q26, and 2Q25, respectively, and ($11MM), ($39MM), ($71MM), and ($86MM) for 2026 YTD, 2025 YTD, 2024 YTD, and 2023 YTD, respectively. Net DVA gains (losses) included in Equities revenue were $3MM, $14MM, and $3MM for 2Q26, 1Q26, and 2Q25, respectively, and $17MM, $7MM, ($15MM), and ($2MM) for 2026 YTD, 2025 YTD, 2024 YTD, and 2023 YTD, respectively. F VaR model uses a historical simulation approach based on three years of historical data and an expected shortfall methodology equivalent to a 99% confidence level. Using a 95% confidence level, average VaR was $23MM, $23MM, and $35MM for 2Q26, 1Q26, and 2Q25 respectively, and $23MM, $37MM, $34MM, and $31MM for 2026 YTD, 2025 YTD, 2024 YTD, and 2023 YTD, respectively. Beginning in 1Q25, the VaR amounts for all periods presented are those used in the Corporation’s risk management of its trading portfolios. Previously, the VaR amounts presented were those used for regulatory capital. The trading portfolio represents trading assets and liabilities, primarily consisting of regular underwriting or dealing in securities and derivative contracts, and acquiring positions as an accommodation to customers. Notes $ in millions 2Q26 1Q26 2Q25 Pretax Income (GAAP) Provision for Credit Losses (GAAP) Pretax, Pre-provision Income Pretax Income (GAAP) Provision for Credit Losses (GAAP) Pretax, Pre-provision Income Pretax Income (GAAP) Provision for Credit Losses (GAAP) Pretax, Pre-provision Income Consumer Banking $ 4,375 $ 1,160 $ 5,535 $ 4,080 $ 1,132 $ 5,212 $ 3,964 $ 1,282 $ 5,246 Global Wealth & Investment Management 1,884 11 1,895 1,772 2 1,774 1,324 20 1,344 Global Banking 2,822 215 3,037 2,879 185 3,064 2,342 277 2,619 Global Markets 3,549 (11) 3,538 2,712 27 2,739 2,154 22 2,176 All Other (902) (9) (911) (877) (9) (886) (971) (9) (980) 29
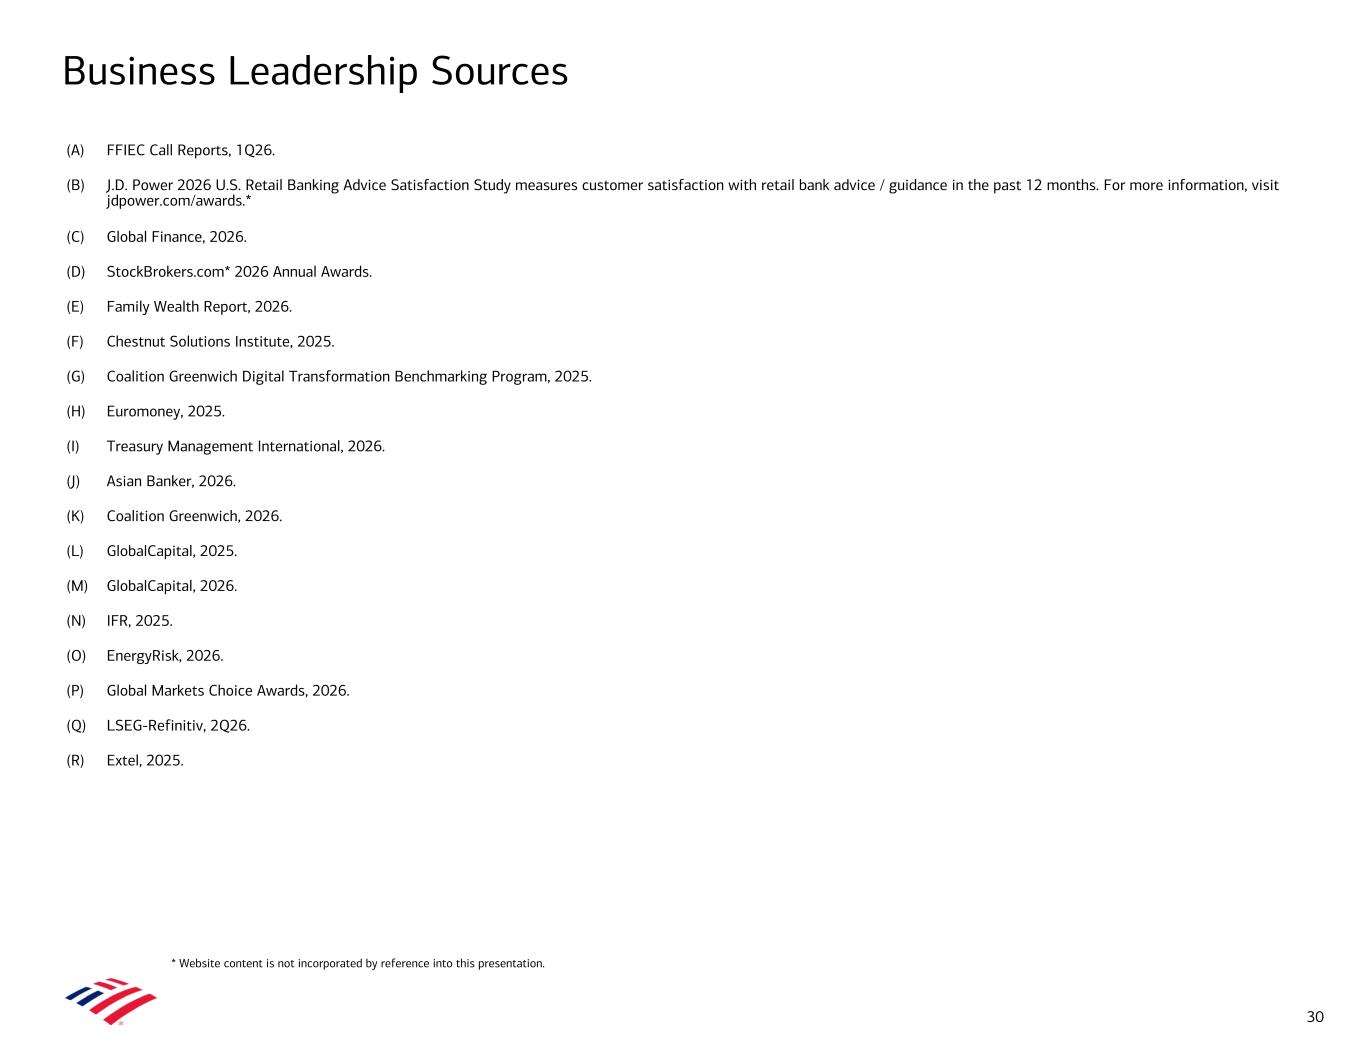
Business Leadership Sources (A) FFIEC Call Reports, 1Q26. (B) J.D. Power 2026 U.S. Retail Banking Advice Satisfaction Study measures customer satisfaction with retail bank advice / guidance in the past 12 months. For more information, visit jdpower.com/awards.* (C) Global Finance, 2026. (D) StockBrokers.com* 2026 Annual Awards. (E) Family Wealth Report, 2026. (F) Chestnut Solutions Institute, 2025. (G) Coalition Greenwich Digital Transformation Benchmarking Program, 2025. (H) Euromoney, 2025. (I) Treasury Management International, 2026. (J) Asian Banker, 2026. (K) Coalition Greenwich, 2026. (L) GlobalCapital, 2025. (M) GlobalCapital, 2026. (N) IFR, 2025. (O) EnergyRisk, 2026. (P) Global Markets Choice Awards, 2026. (Q) LSEG-Refinitiv, 2Q26. (R) Extel, 2025. 30 * Website content is not incorporated by reference into this presentation.
Forward-Looking Statements Bank of America Corporation (the Corporation) and its management may make certain statements that constitute “forward-looking statements” within the meaning of the Private Securities Litigation Reform Act of 1995. These statements can be identified by the fact that they do not relate strictly to historical or current facts. Forward-looking statements often use words such as “anticipates,” “targets,” “expects,” “hopes,” “estimates,” “intends,” “plans,” “goals,” “outlook,” “believes,” “continue” and other similar expressions or future or conditional verbs such as “will,” “may,” “might,” “should,” “would” and “could.” Forward-looking statements represent the Corporation’s current expectations, plans or forecasts of its or its business segments' future results, which may include, among other measures, revenue, liquidity, net interest income, other income, provision for credit losses, expenses, operating leverage, effective tax rate, efficiency ratio, capital measures, deposits and assets, as well as strategy, future business and economic conditions more generally, and other future matters. These statements are not guarantees of future results or performance and involve certain known and unknown risks, uncertainties and assumptions that are difficult to predict and are often beyond the Corporation’s control. Actual outcomes and results may differ materially from those expressed in, or implied by, any of these forward-looking statements. You should not place undue reliance on any forward-looking statement and should consider the following uncertainties and risks, as well as the risks and uncertainties more fully discussed under Item 1A. Risk Factors of the Corporation’s 2025 Annual Report on Form 10-K and in any of the Corporation’s subsequent U.S. Securities and Exchange Commission (SEC) filings: the Corporation’s potential judgments, orders, settlements, penalties, fines and reputational damage, which are inherently difficult to predict, resulting from pending, threatened or future litigation and regulatory inquiries, demands, requests, investigations, proceedings and enforcement actions, which the Corporation is subject to in the ordinary course of business, including matters related to our processing of unemployment benefits for California and certain other states, the features of our automatic credit card payment service, the adequacy of the Corporation’s anti- money laundering and economic sanctions programs and the processing of electronic payments, including through the Zelle network, and related fraud, which are in various stages; in connection with ongoing litigation, the impact of certain changes to Visa’s and Mastercard’s respective card payment network rules and reductions in interchange fees for U.S.-based merchants; the possibility that the Corporation's future liabilities may be in excess of its recorded liability and estimated range of possible loss for litigation, and regulatory and government actions; the impact of U.S. and global interest rates (including the potential for ongoing fluctuations in interest rates), inflation, currency exchange rates, economic conditions, trade policies and tensions, including changes in, or the imposition of, tariffs and / or trade barriers and the economic impacts, volatility and uncertainty resulting therefrom, which may have varying effects across industries and geographies, and geopolitical instability; uncertainties about the financial stability and growth rates of non-U.S. jurisdictions, the risk that those jurisdictions may face difficulties servicing their sovereign debt, and related stresses on financial markets, currencies and trade, and the Corporation’s exposures to such risks, including direct, indirect and operational; the impact of the interest rate, inflationary, macroeconomic, banking and regulatory environment on the Corporation’s assets, business, financial condition and results of operations; the impact of adverse developments affecting the U.S. or global banking industry, including a deterioration in private credit markets, bank failures and liquidity concerns, resulting in worsening economic and market volatility, and regulatory responses thereto; the possibility that future credit losses may be higher than currently expected, including due to changes in economic assumptions, which may include unemployment rates, real estate prices, gross domestic product levels and corporate bond spreads, customer behavior, adverse developments with respect to U.S. or global economic conditions and other uncertainties, such as the impact of trade policies, supply chain disruptions, commodity prices, inflationary pressures and labor shortages on economic conditions and our business; potential losses related to the Corporation’s concentration of credit risk; the Corporation's ability to achieve its expense targets (including noninterest expense) and expectations regarding revenue, net interest income, operating leverage, other income, provision for credit losses, net charge-offs, effective tax rate, loan or deposit growth or other projections and targets; variances to the underlying assumptions and judgments used in estimating banking book net interest income sensitivity; adverse changes to the Corporation’s credit ratings from the major credit rating agencies; an inability to access capital markets or maintain deposits or borrowing costs; estimates of the fair value and other accounting values, subject to impairment assessments, of certain of the Corporation’s assets and liabilities; the estimated or actual impact of changes in accounting standards or assumptions in applying those standards; uncertainty regarding the content, timing and impact of regulatory capital and liquidity requirements; the impact of adverse changes to total loss-absorbing capacity requirements, stress capital buffer requirements and / or global systemically important bank surcharges; the potential impact of actions of the Board of Governors of the Federal Reserve System on the Corporation’s capital plans; the effect of changes in or interpretations of income tax laws and regulations, including impacts from the 2025 Budget Reconciliation Act; the impact of implementation and compliance with U.S. and international laws, regulations and regulatory interpretations, including recovery and resolution planning requirements, Federal Deposit Insurance Corporation assessments, fiduciary standards, derivatives regulations and potential changes to loss allocations between financial institutions and customers, including for losses incurred from the use of our products and services, including electronic payments and payment of checks, that were authorized by the customer but induced by fraud; the impact of failures or disruptions in or breaches of the Corporation’s operations or information systems, or those of various third parties, including regulators and federal and state governments, such as from cybersecurity incidents; the risks related to the development, implementation, use and management of emerging technologies, including artificial intelligence and the ability to achieve expected or potential benefits, such as increased productivity and cost savings; the risks related to the transition and physical impacts of climate change; our ability to achieve environmental goals or the impact of any changes in the Corporation's sustainability or human capital management strategy or goals; the impact of uncertain or changing political conditions, federal government shutdowns, including partial shutdowns, and uncertainty regarding the federal government’s debt limit or changes in fiscal, monetary, trade or regulatory policy; the emergence of widespread health emergencies or pandemics; the impact of natural disasters, extreme weather events, military conflicts (including the Russia / Ukraine conflict, the conflicts in the Middle East, the possible expansion of such conflicts and potential geopolitical and economic consequences), civil unrest, terrorism or other geopolitical events; and other matters. Forward-looking statements speak only as of the date they are made, and the Corporation undertakes no obligation to update any forward-looking statement to reflect the impact of circumstances or events that arise after the date the forward-looking statement was made. 31
Important Presentation Information 32 • The information contained herein is preliminary and based on Corporation data available at the time of the earnings presentation. It speaks only as of the particular date or dates included in the accompanying slides. Bank of America does not undertake an obligation to, and disclaims any duty to, update any of the information provided. • The Corporation may present certain metrics and ratios, including year-over-year comparisons of revenue, noninterest expense, and pretax income, excluding certain items (e.g., DVA), and ratios utilizing tangible equity and tangible assets, that are non-GAAP financial measures. The Corporation believes the use of these non-GAAP financial measures provides additional clarity in understanding its results of operations and trends. For more information about the non-GAAP financial measures contained herein, please see the presentation of the most directly comparable financial measures calculated in accordance with GAAP and accompanying reconciliations in the earnings press release for the quarter ended June 30, 2026, and other earnings-related information available through the Bank of America Investor Relations website at: https://investor.bankofamerica.com/quarterly- earnings, the content of which is not incorporated by reference into this presentation. • The Corporation presents certain key financial and nonfinancial performance indicators (KPIs) that management uses when assessing consolidated and / or segment results. The Corporation believes this information is useful because it provides management with information about underlying operational performance and trends. KPIs are presented herein, including in the 2Q26 Highlights on slides 2 and 4 and on Summary Income Statement for each segment. • The Corporation also views net interest income and related ratios and analyses on a fully taxable-equivalent (FTE) basis, which when presented on a consolidated basis are non-GAAP financial measures. The Corporation believes managing the business with net interest income on an FTE basis provides investors with meaningful information on the interest margin for comparative purposes. The Corporation believes that the presentation allows for comparison of amounts from both taxable and tax-exempt sources and is consistent with industry practices. The FTE adjustments were $163MM, $162MM, $165MM, $154MM, and $145MM for 2Q26, 1Q26, 4Q25, 3Q25, and 2Q25, respectively. • The Corporation allocates capital to its business segments using a methodology that considers the effect of regulatory capital requirements in addition to internal risk-based capital models. Allocated capital is reviewed periodically and refinements are made based on multiple considerations that include, but are not limited to, risk-weighted assets measured under Basel 3 Standardized and Advanced approaches, business segment exposures and risk profile, and strategic plans. As a result of this process, in 1Q26, the Corporation adjusted the amount of capital being allocated to its business segments.