October 2025 Investor Presentation INVESTOR RELATIONS
Safe Harbor DISCLAIMERS CONFIDENTIAL 2 Forward Looking Statements This presentation contains “forward-looking statements” within the meaning of the Private Securities Litigation Reform Act of 1995, as amended. All statements other than statements of historical facts are forward-looking statements. Words such as “will,” “may,” “could,” “would,” “should,” “anticipates,” “believes,” “estimates,” “expects,” “plans,” “intends,” “guidance,” “outlook,” and similar expressions are intended to identify these forward-looking statements but are not the exclusive means of identifying them. These statements are not guarantees that our expectations will prove to be correct and involve a number of risks, uncertainties, and assumptions. Many factors, including those discussed more fully elsewhere in this release and in documents filed with the Securities and Exchange Commission by NPK International Inc. (“NPK”), particularly its Annual Report on Form 10-K, and its Quarterly Reports on Form 10-Q, as well as others, could cause actual plans or results to differ materially from those expressed in, or implied by, these statements. These risk factors include, but are not limited to, risks related to our sale of the Fluids Systems business; our ability to generate organic growth; economic and market conditions that may impact our customers’ future spending; the effective management of our fleet, including our ability to properly manufacture, safeguard, and maintain our fleet; international operations; operating hazards present in our and our customers’ industries and substantial liability claims; our contracts that can be terminated or downsized by our customers without penalty; our product offering and market expansion; our ability to attract, retain, and develop qualified leaders, key employees, and skilled personnel; expanding our services in the utilities sector, which may require unionized labor; the price and availability of raw materials; inflation; capital investments and business acquisitions; market competition; technological developments and intellectual property; severe weather, natural disasters, and seasonality; public health crises, epidemics, and pandemics; our cost and continued availability of borrowed funds, including noncompliance with debt covenants; environmental laws and regulations; legal compliance; the inherent limitations of insurance coverage; income taxes; cybersecurity incidents or business system disruptions; activist stockholders that may attempt to effect changes at our Company or acquire control over our Company; share repurchases; and our amended and restated bylaws, which could limit our stockholders’ ability to obtain what such stockholders believe to be a favorable judicial forum for disputes with us or our directors, officers or other employees. We assume no obligation to update any forward-looking statements, whether as a result of new information, future events or otherwise, except as required by securities laws. NPK's filings with the Securities and Exchange Commission can be obtained at no charge at www.sec.gov, as well as through our website at www.npki.com. Non-GAAP Financial Measures This presentation includes references to financial measurements that are supplemental to the Company’s financial performance as calculated in accordance with generally accepted accounting principles (“GAAP”). These non-GAAP financial measures include Adjusted Income (Loss) from Continuing Operations, Adjusted Income (Loss) from Continuing Operations Per Common Share, earnings before interest, taxes, depreciation and amortization (“EBITDA”) from Continuing Operations, Adjusted EBITDA from Continuing Operations, Adjusted EBITDA Margin from Continuing Operations, Free Cash Flow, and Net Debt (Cash). We believe these non-GAAP financial measures are frequently used by investors, securities analysts and other parties in the evaluation of our performance and liquidity with that of other companies in our industry. Management uses these measures to evaluate our operating performance, liquidity and capital structure. In addition, our incentive compensation plan measures performance based on our consolidated EBITDA, along with other factors. The methods we use to produce these non-GAAP financial measures may differ from methods used by other companies. These measures should be considered in addition to, not as a substitute for, financial measures prepared in accordance with GAAP.
Business Overview CONFIDENTIAL 3
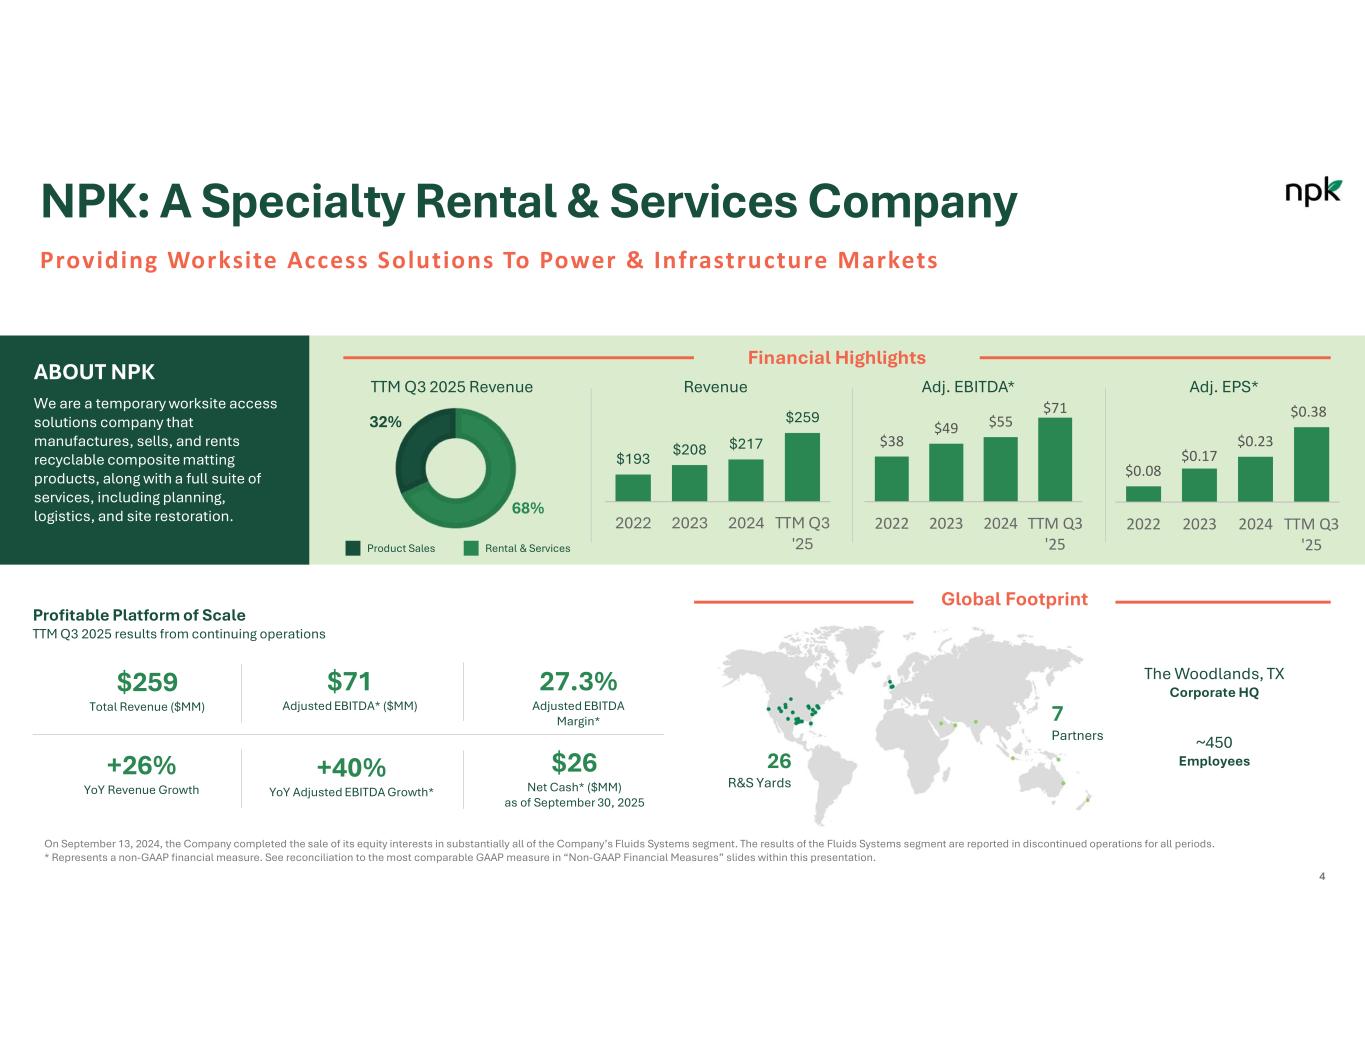
4 NPK: A Specialty Rental & Services Company Providing Worksite Access Solutions To Power & Infrastructure Markets ABOUT NPK We are a temporary worksite access solutions company that manufactures, sells, and rents recyclable composite matting products, along with a full suite of services, including planning, logistics, and site restoration. Financial Highlights 68% 32% Profitable Platform of Scale TTM Q3 2025 results from continuing operations Global Footprint 26 R&S Yards 7 Partners The Woodlands, TX Corporate HQ ~450 Employees $259 Total Revenue ($MM) $71 Adjusted EBITDA* ($MM) 27.3% Adjusted EBITDA Margin* +40% YoY Adjusted EBITDA Growth* +26% YoY Revenue Growth $26 Net Cash* ($MM) as of September 30, 2025 Rental & ServicesProduct Sales $193 $208 $217 $259 2022 2023 2024 TTM Q3 '25 Revenue $38 $49 $55 $71 2022 2023 2024 TTM Q3 '25 Adj. EBITDA* Adj. EPS* On September 13, 2024, the Company completed the sale of its equity interests in substantially all of the Company’s Fluids Systems segment. The results of the Fluids Systems segment are reported in discontinued operations for all periods. * Represents a non-GAAP financial measure. See reconciliation to the most comparable GAAP measure in “Non-GAAP Financial Measures” slides within this presentation. TTM Q3 2025 Revenue $0.08 $0.17 $0.23 $0.38 2022 2023 2024 TTM Q3 '25
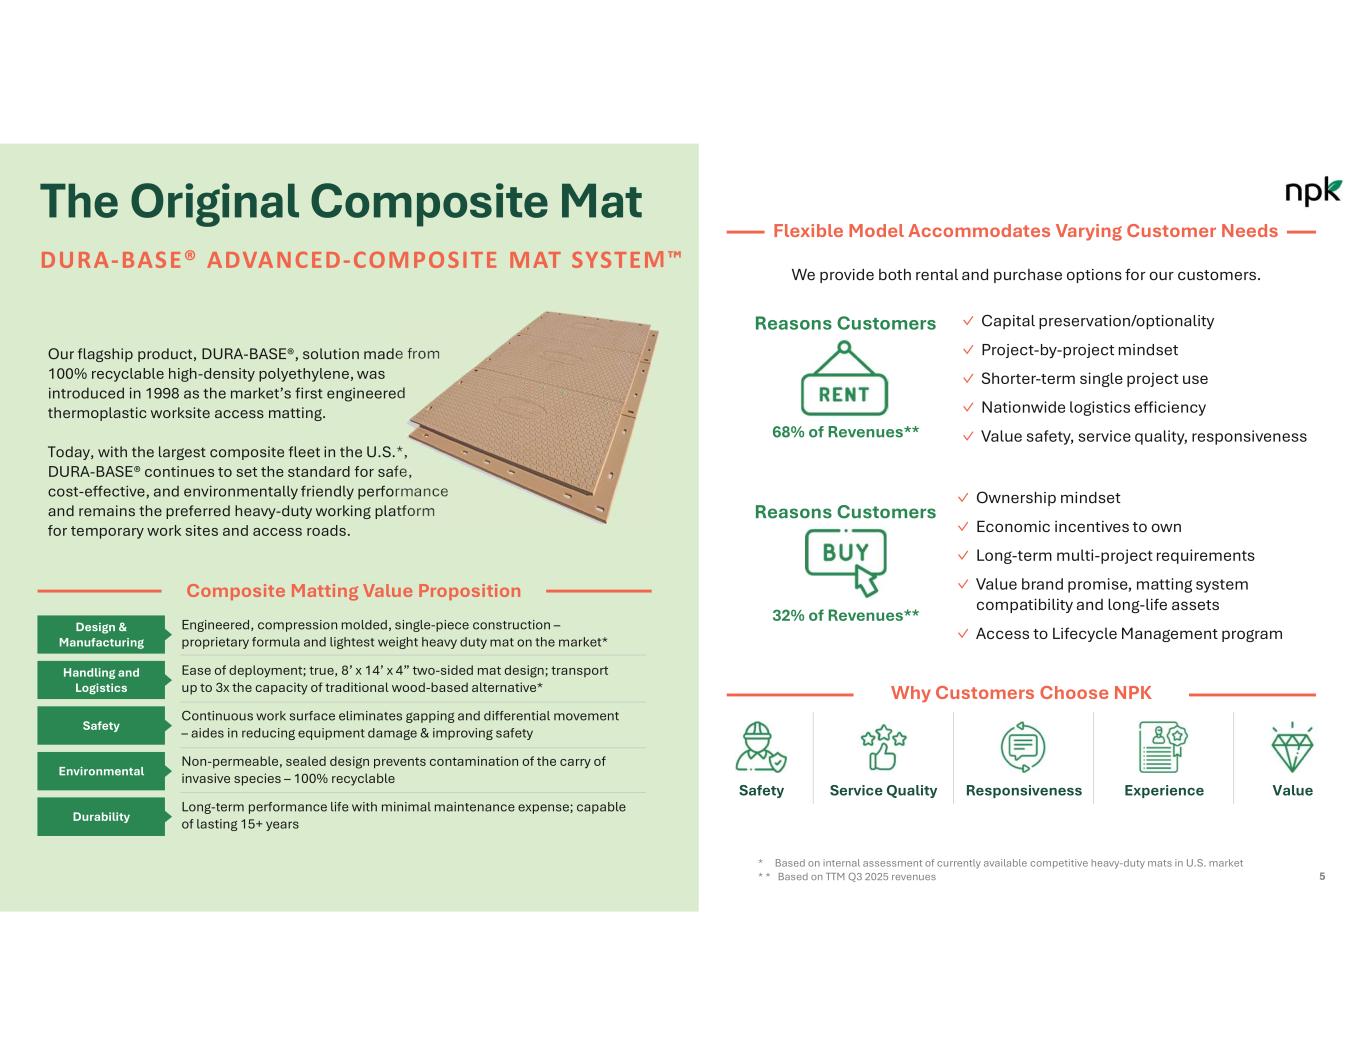
5 The Original Composite Mat DURA-BASE® ADVANCED-COMPOSITE MAT SYSTEM Our flagship product, DURA-BASE®, solution made from 100% recyclable high-density polyethylene, was introduced in 1998 as the market’s first engineered thermoplastic worksite access matting. Today, with the largest composite fleet in the U.S.*, DURA-BASE® continues to set the standard for safe, cost-effective, and environmentally friendly performance and remains the preferred heavy-duty working platform for temporary work sites and access roads. Composite Matting Value Proposition Engineered, compression molded, single-piece construction – proprietary formula and lightest weight heavy duty mat on the market* Design & Manufacturing Ease of deployment; true, 8’ x 14’ x 4” two-sided mat design; transport up to 3x the capacity of traditional wood-based alternative* Handling and Logistics Continuous work surface eliminates gapping and differential movement – aides in reducing equipment damage & improving safetySafety Non-permeable, sealed design prevents contamination of the carry of invasive species – 100% recyclable Environmental Long-term performance life with minimal maintenance expense; capable of lasting 15+ years Durability * Based on internal assessment of currently available competitive heavy-duty mats in U.S. market * * Based on TTM Q3 2025 revenues ✓ Capital preservation/optionality ✓ Project-by-project mindset ✓ Shorter-term single project use ✓ Nationwide logistics efficiency ✓ Value safety, service quality, responsiveness We provide both rental and purchase options for our customers. Flexible Model Accommodates Varying Customer Needs ✓ Ownership mindset ✓ Economic incentives to own ✓ Long-term multi-project requirements ✓ Value brand promise, matting system compatibility and long-life assets ✓ Access to Lifecycle Management program Reasons Customers 68% of Revenues** Reasons Customers 32% of Revenues** Why Customers Choose NPK Safety Service Quality Responsiveness Experience Value
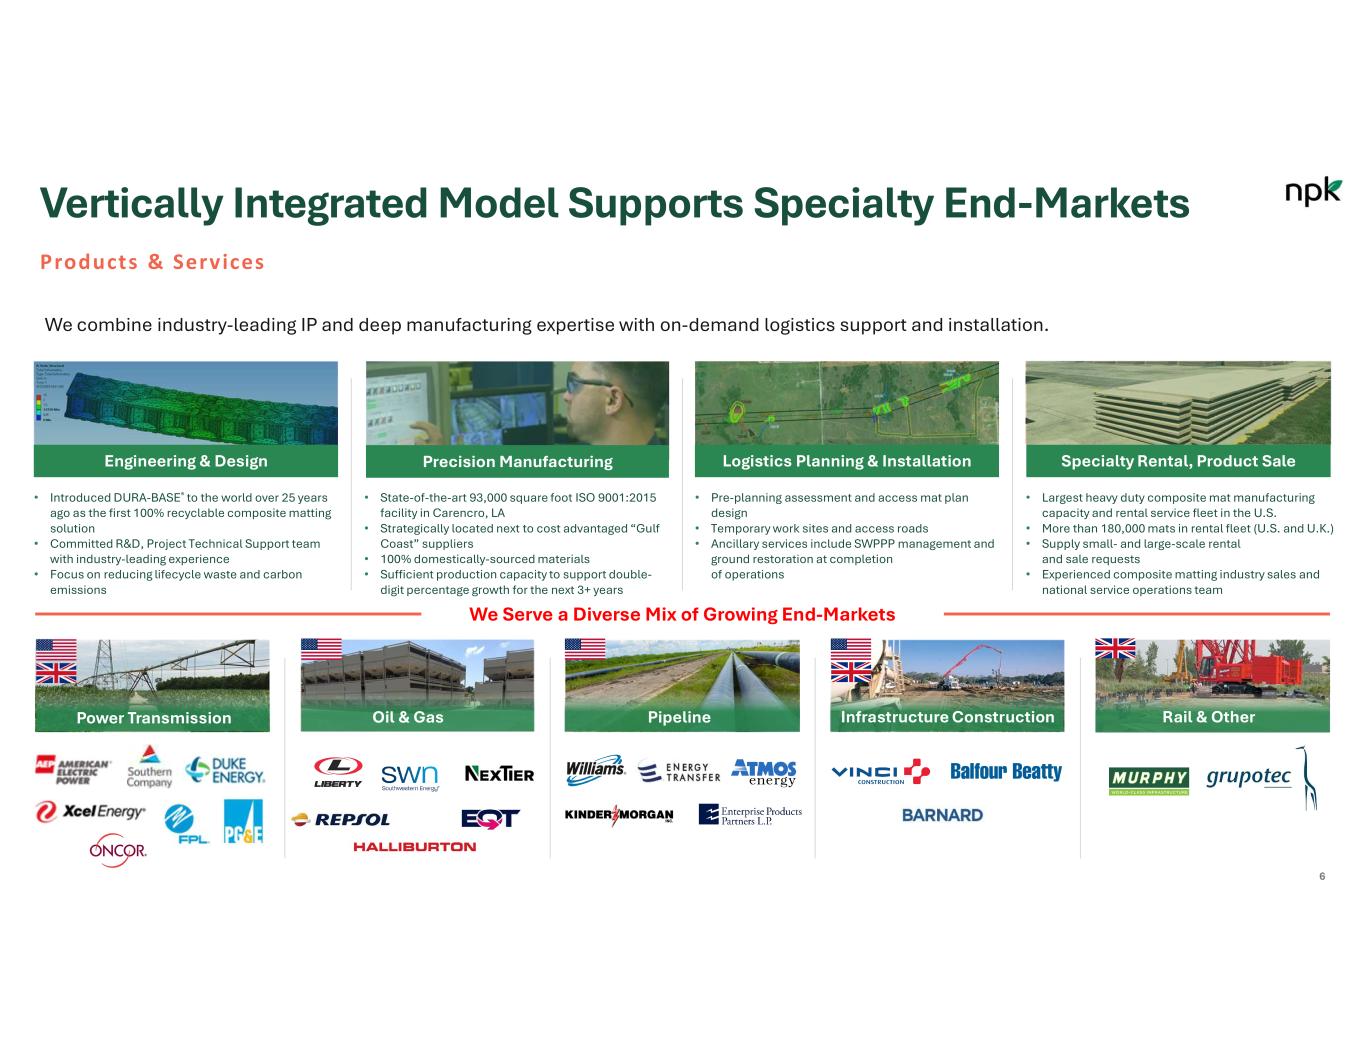
6 Vertically Integrated Model Supports Specialty End-Markets Products & Services • Introduced DURA-BASE® to the world over 25 years ago as the first 100% recyclable composite matting solution • Committed R&D, Project Technical Support team with industry-leading experience • Focus on reducing lifecycle waste and carbon emissions • State-of-the-art 93,000 square foot ISO 9001:2015 facility in Carencro, LA • Strategically located next to cost advantaged “Gulf Coast” suppliers • 100% domestically-sourced materials • Sufficient production capacity to support double- digit percentage growth for the next 3+ years • Pre-planning assessment and access mat plan design • Temporary work sites and access roads • Ancillary services include SWPPP management and ground restoration at completion of operations • Largest heavy duty composite mat manufacturing capacity and rental service fleet in the U.S. • More than 180,000 mats in rental fleet (U.S. and U.K.) • Supply small- and large-scale rental and sale requests • Experienced composite matting industry sales and national service operations team We Serve a Diverse Mix of Growing End-Markets Engineering & Design Precision Manufacturing Logistics Planning & Installation Specialty Rental, Product Sale Oil & Gas Pipeline Infrastructure Construction Rail & OtherPower Transmission We combine industry-leading IP and deep manufacturing expertise with on-demand logistics support and installation.
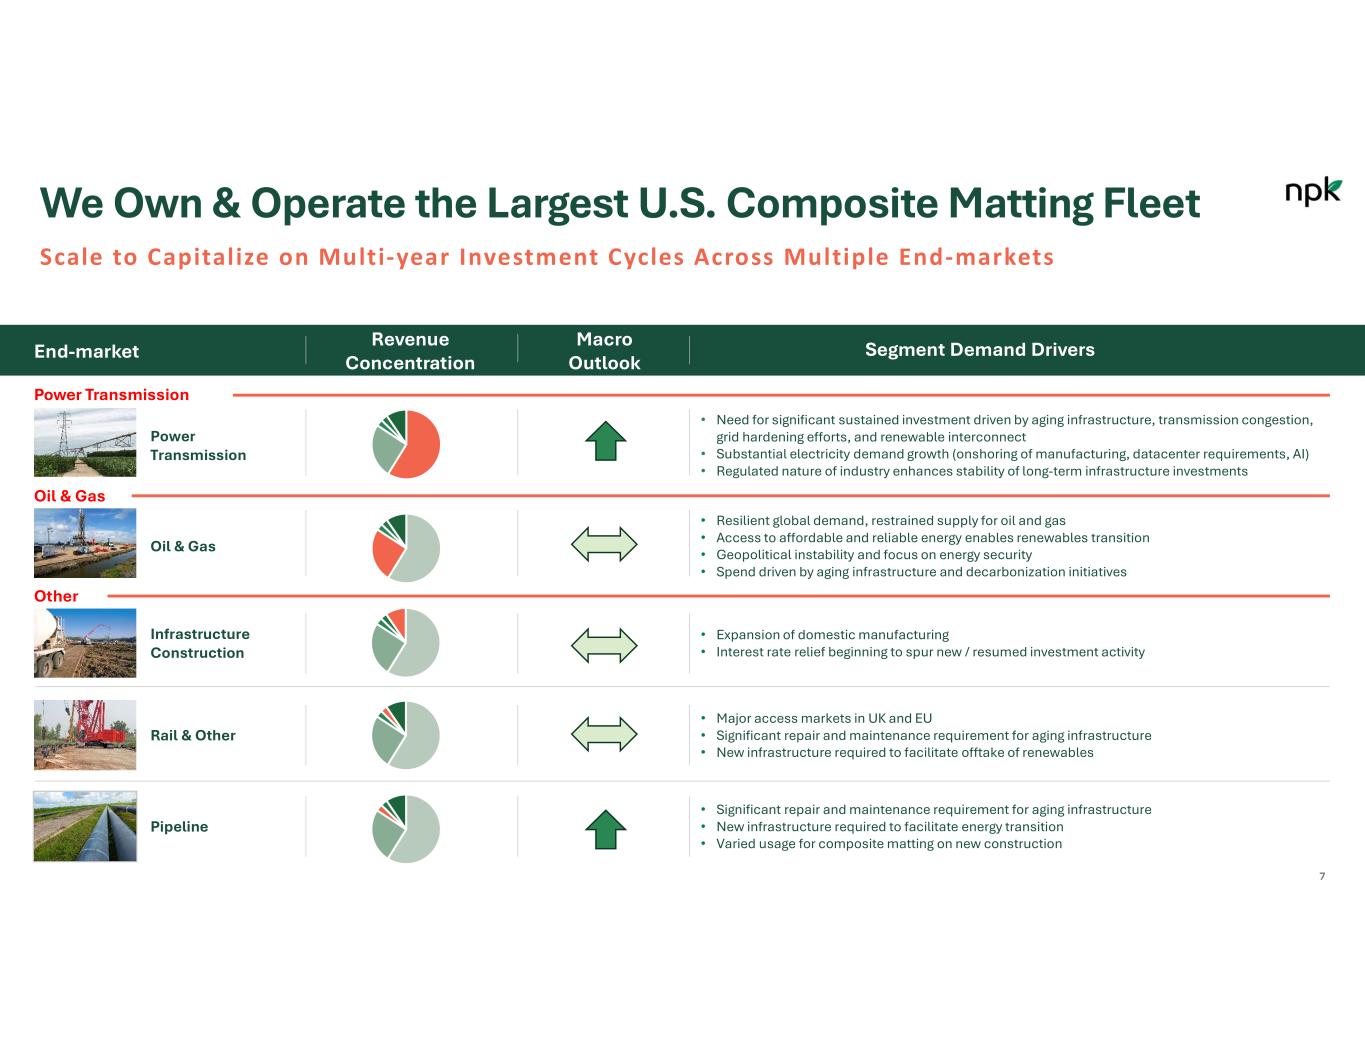
End-market Revenue Concentration Power Transmission Oil & Gas Other Power Transmission • Need for significant sustained investment driven by aging infrastructure, transmission congestion, grid hardening efforts, and renewable interconnect • Substantial electricity demand growth (onshoring of manufacturing, datacenter requirements, AI) • Regulated nature of industry enhances stability of long-term infrastructure investments Oil & Gas • Resilient global demand, restrained supply for oil and gas • Access to affordable and reliable energy enables renewables transition • Geopolitical instability and focus on energy security • Spend driven by aging infrastructure and decarbonization initiatives Rail & Other • Major access markets in UK and EU • Significant repair and maintenance requirement for aging infrastructure • New infrastructure required to facilitate offtake of renewables Segment Demand DriversMacro Outlook Pipeline • Significant repair and maintenance requirement for aging infrastructure • New infrastructure required to facilitate energy transition • Varied usage for composite matting on new construction Infrastructure Construction • Expansion of domestic manufacturing • Interest rate relief beginning to spur new / resumed investment activity 7 We Own & Operate the Largest U.S. Composite Matting Fleet Scale to Capitalize on Multi-year Investment Cycles Across Multiple End-markets
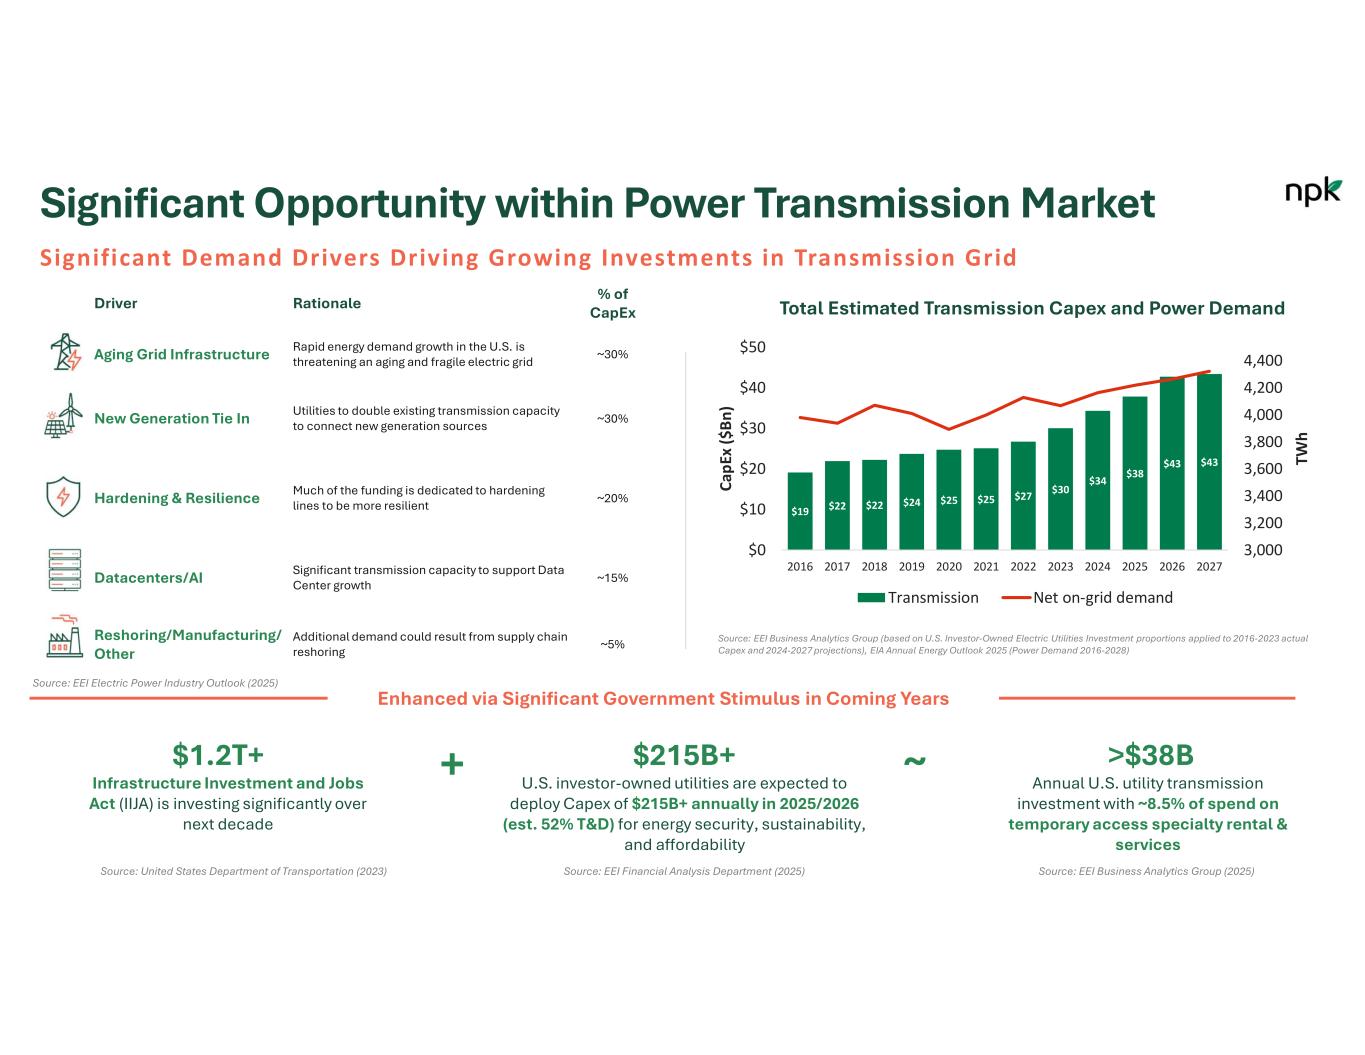
Significant Opportunity within Power Transmission Market Significant Demand Drivers Driving Growing Investments in Transmission Grid Source: EEI Business Analytics Group (based on U.S. Investor-Owned Electric Utilities Investment proportions applied to 2016-2023 actual Capex and 2024-2027 projections), EIA Annual Energy Outlook 2025 (Power Demand 2016-2028) Total Estimated Transmission Capex and Power Demand $1.2T+ $215B+ >$38B + ~ Infrastructure Investment and Jobs Act (IIJA) is investing significantly over next decade U.S. investor-owned utilities are expected to deploy Capex of $215B+ annually in 2025/2026 (est. 52% T&D) for energy security, sustainability, and affordability Annual U.S. utility transmission investment with ~8.5% of spend on temporary access specialty rental & services Source: United States Department of Transportation (2023) Source: EEI Financial Analysis Department (2025) Source: EEI Business Analytics Group (2025) Enhanced via Significant Government Stimulus in Coming Years % of CapExRationaleDriver ~30%Rapid energy demand growth in the U.S. is threatening an aging and fragile electric gridAging Grid Infrastructure ~30% Utilities to double existing transmission capacity to connect new generation sourcesNew Generation Tie In ~20% Much of the funding is dedicated to hardening lines to be more resilientHardening & Resilience ~15% Significant transmission capacity to support Data Center growthDatacenters/AI ~5%Additional demand could result from supply chain reshoring Reshoring/Manufacturing/ Other $19 $22 $22 $24 $25 $25 $27 $30 $34 $38 $43 $43 3,000 3,200 3,400 3,600 3,800 4,000 4,200 4,400 $0 $10 $20 $30 $40 $50 2016 2017 2018 2019 2020 2021 2022 2023 2024 2025 2026 2027 TW h Ca pE x ($ Bn ) Transmission Net on-grid demand Source: EEI Electric Power Industry Outlook (2025)
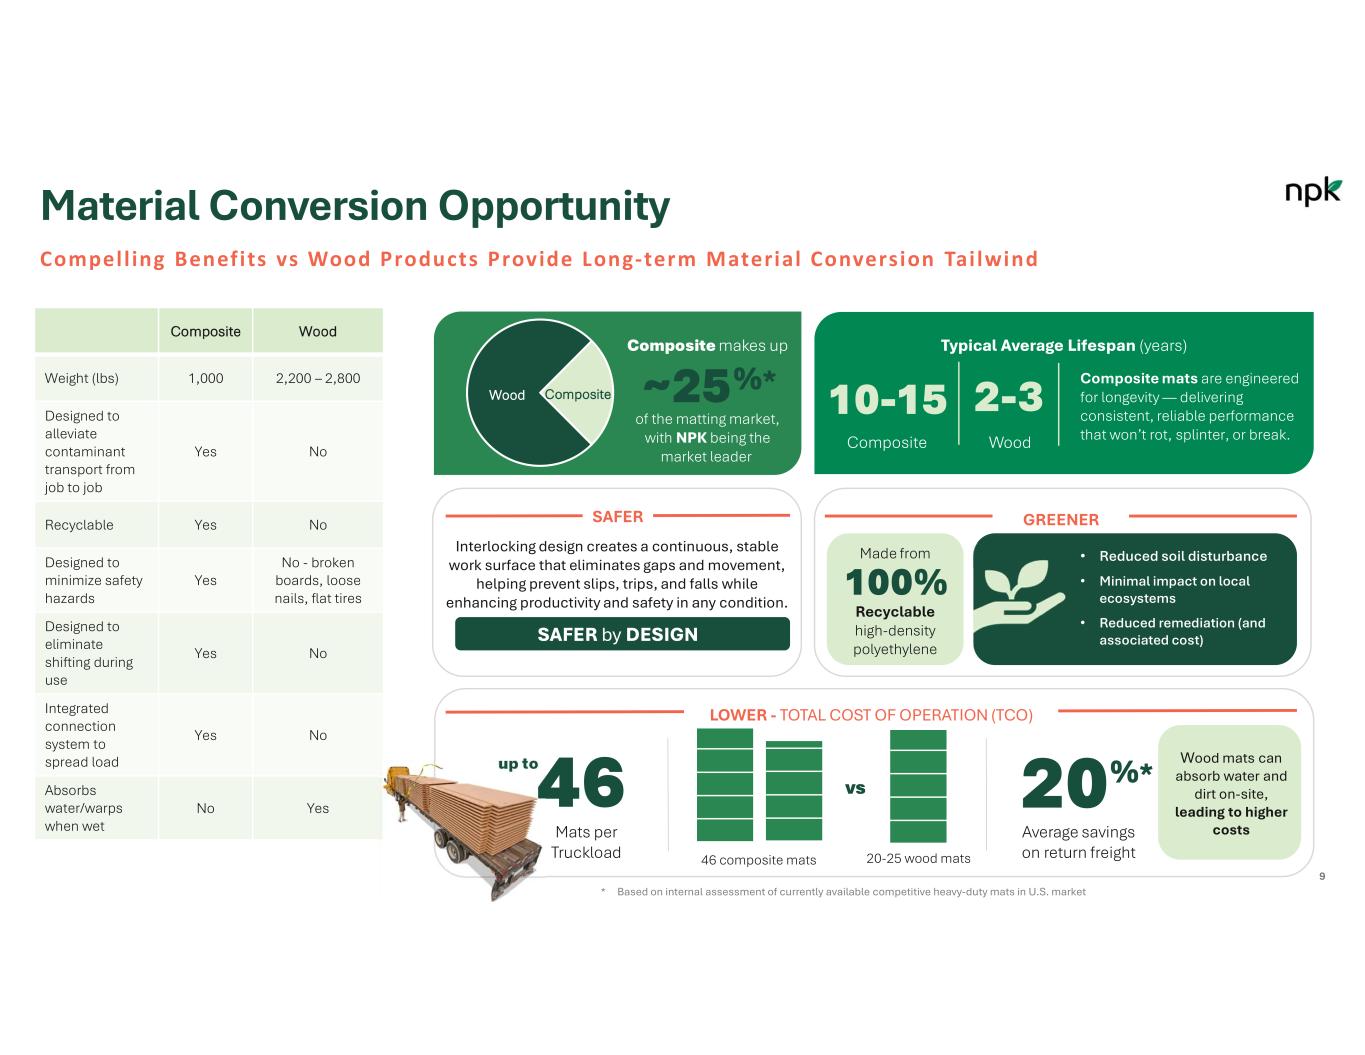
9 Material Conversion Opportunity Compell ing Benefits vs Wood Products Provide Long-term Material Conversion Tai lwind WoodComposite 2,200 – 2,800 1,000Weight (lbs) NoYes Designed to alleviate contaminant transport from job to job NoYesRecyclable No - broken boards, loose nails, flat tires Yes Designed to minimize safety hazards NoYes Designed to eliminate shifting during use NoYes Integrated connection system to spread load YesNo Absorbs water/warps when wet Composite makes up of the matting market, with NPK being the market leader ~25 Typical Average Lifespan (years) 10-15 2-3 Composite Wood SAFER GREENER Interlocking design creates a continuous, stable work surface that eliminates gaps and movement, helping prevent slips, trips, and falls while enhancing productivity and safety in any condition. SAFER by DESIGN • Reduced soil disturbance • Minimal impact on local ecosystems • Reduced remediation (and associated cost) 100% Made from Recyclable high-density polyethylene LOWER - TOTAL COST OF OPERATION (TCO) 46up to Mats per Truckload vs Wood mats can absorb water and dirt on-site, leading to higher costsAverage savings on return freight46 composite mats 20-25 wood mats 20%* Composite mats are engineered for longevity — delivering consistent, reliable performance that won’t rot, splinter, or break. Wood Composite %* * Based on internal assessment of currently available competitive heavy-duty mats in U.S. market
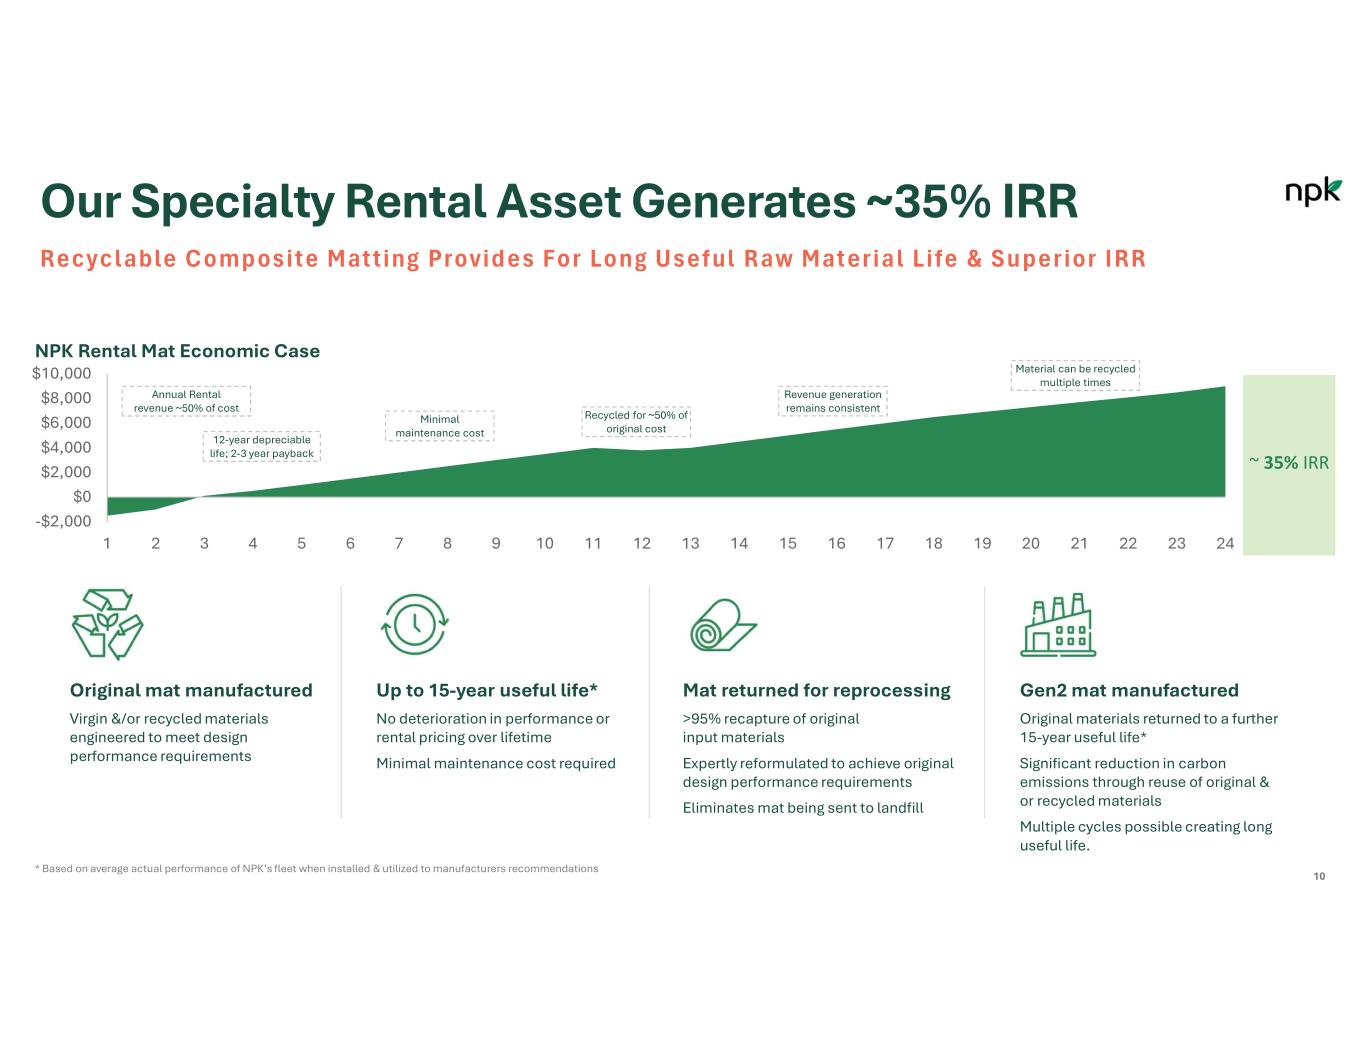
10 Our Specialty Rental Asset Generates ~35% IRR Recyclable Comp osit e Mat ting Provid es For Long Useful R aw Mat eria l Life & Superior IRR -$2,000 $0 $2,000 $4,000 $6,000 $8,000 $10,000 1 2 3 4 5 6 7 8 9 10 11 12 13 14 15 16 17 18 19 20 21 22 23 24 NPK Rental Mat Economic Case ~ 35% IRR Annual Rental revenue ~50% of cost 12-year depreciable life; 2-3 year payback Minimal maintenance cost Recycled for ~50% of original cost Revenue generation remains consistent Material can be recycled multiple times Original mat manufactured Virgin &/or recycled materials engineered to meet design performance requirements Up to 15-year useful life* No deterioration in performance or rental pricing over lifetime Minimal maintenance cost required Mat returned for reprocessing >95% recapture of original input materials Expertly reformulated to achieve original design performance requirements Eliminates mat being sent to landfill Gen2 mat manufactured Original materials returned to a further 15-year useful life* Significant reduction in carbon emissions through reuse of original & or recycled materials Multiple cycles possible creating long useful life. * Based on average actual performance of NPK’s fleet when installed & utilized to manufacturers recommendations
Recent Performance CONFIDENTIAL 11
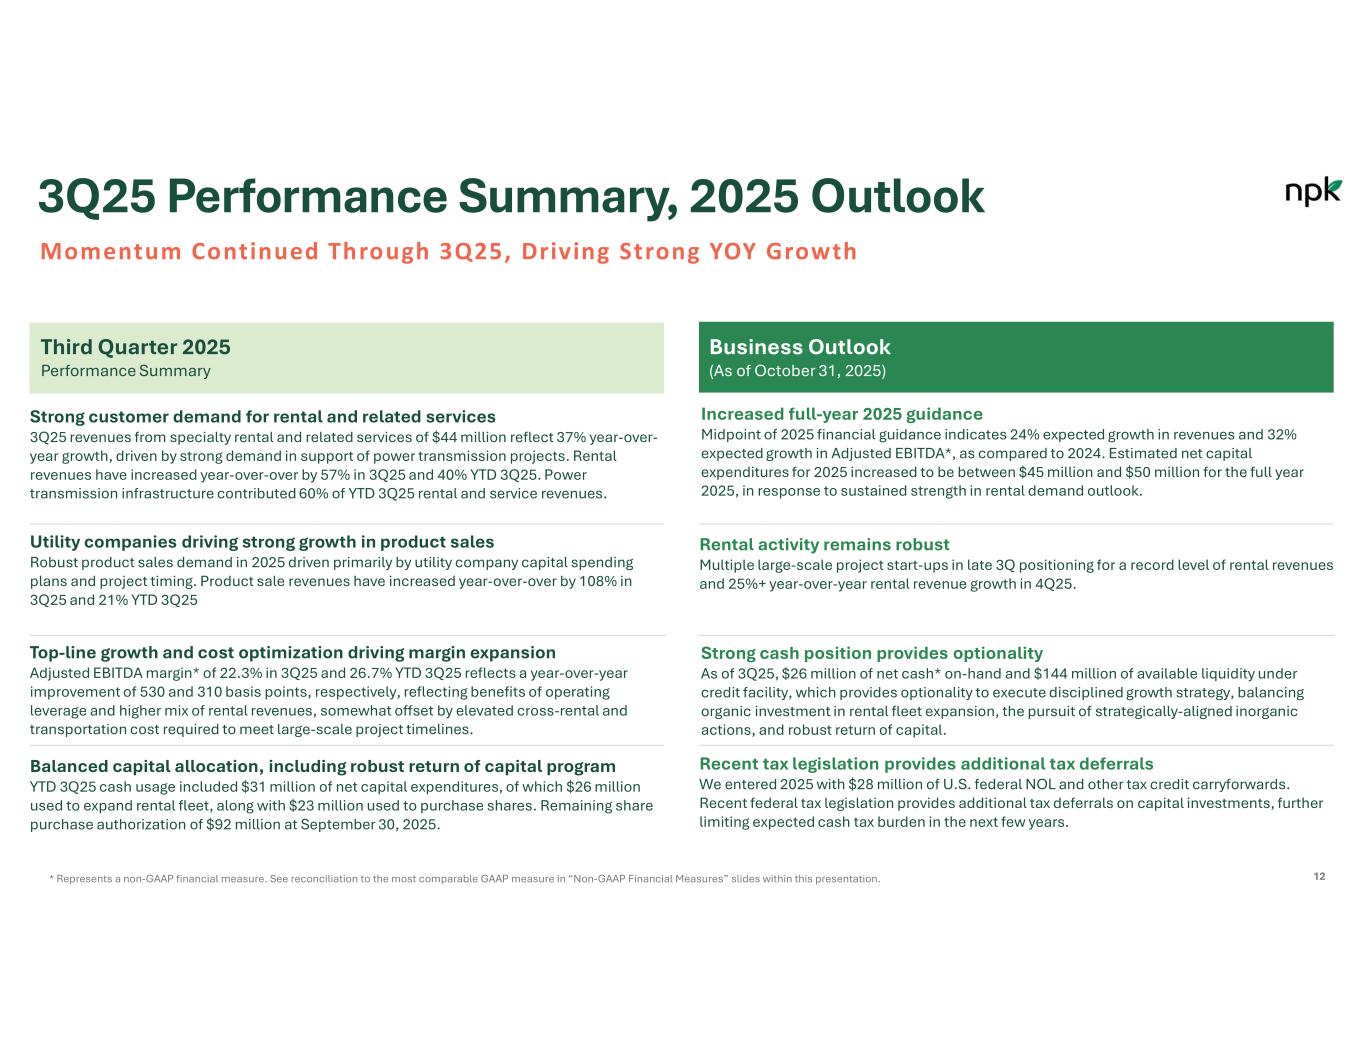
12 3Q25 Performance Summary, 2025 Outlook Momentum Continued Through 3Q25, Driving Strong YOY Growth Third Quarter 2025 Performance Summary Business Outlook (As of October 31, 2025) Strong customer demand for rental and related services 3Q25 revenues from specialty rental and related services of $44 million reflect 37% year-over- year growth, driven by strong demand in support of power transmission projects. Rental revenues have increased year-over-over by 57% in 3Q25 and 40% YTD 3Q25. Power transmission infrastructure contributed 60% of YTD 3Q25 rental and service revenues. Balanced capital allocation, including robust return of capital program YTD 3Q25 cash usage included $31 million of net capital expenditures, of which $26 million used to expand rental fleet, along with $23 million used to purchase shares. Remaining share purchase authorization of $92 million at September 30, 2025. Top-line growth and cost optimization driving margin expansion Adjusted EBITDA margin* of 22.3% in 3Q25 and 26.7% YTD 3Q25 reflects a year-over-year improvement of 530 and 310 basis points, respectively, reflecting benefits of operating leverage and higher mix of rental revenues, somewhat offset by elevated cross-rental and transportation cost required to meet large-scale project timelines. Utility companies driving strong growth in product sales Robust product sales demand in 2025 driven primarily by utility company capital spending plans and project timing. Product sale revenues have increased year-over-over by 108% in 3Q25 and 21% YTD 3Q25 Recent tax legislation provides additional tax deferrals We entered 2025 with $28 million of U.S. federal NOL and other tax credit carryforwards. Recent federal tax legislation provides additional tax deferrals on capital investments, further limiting expected cash tax burden in the next few years. Rental activity remains robust Multiple large-scale project start-ups in late 3Q positioning for a record level of rental revenues and 25%+ year-over-year rental revenue growth in 4Q25. Increased full-year 2025 guidance Midpoint of 2025 financial guidance indicates 24% expected growth in revenues and 32% expected growth in Adjusted EBITDA*, as compared to 2024. Estimated net capital expenditures for 2025 increased to be between $45 million and $50 million for the full year 2025, in response to sustained strength in rental demand outlook. Strong cash position provides optionality As of 3Q25, $26 million of net cash* on-hand and $144 million of available liquidity under credit facility, which provides optionality to execute disciplined growth strategy, balancing organic investment in rental fleet expansion, the pursuit of strategically-aligned inorganic actions, and robust return of capital. * Represents a non-GAAP financial measure. See reconciliation to the most comparable GAAP measure in “Non-GAAP Financial Measures” slides within this presentation.
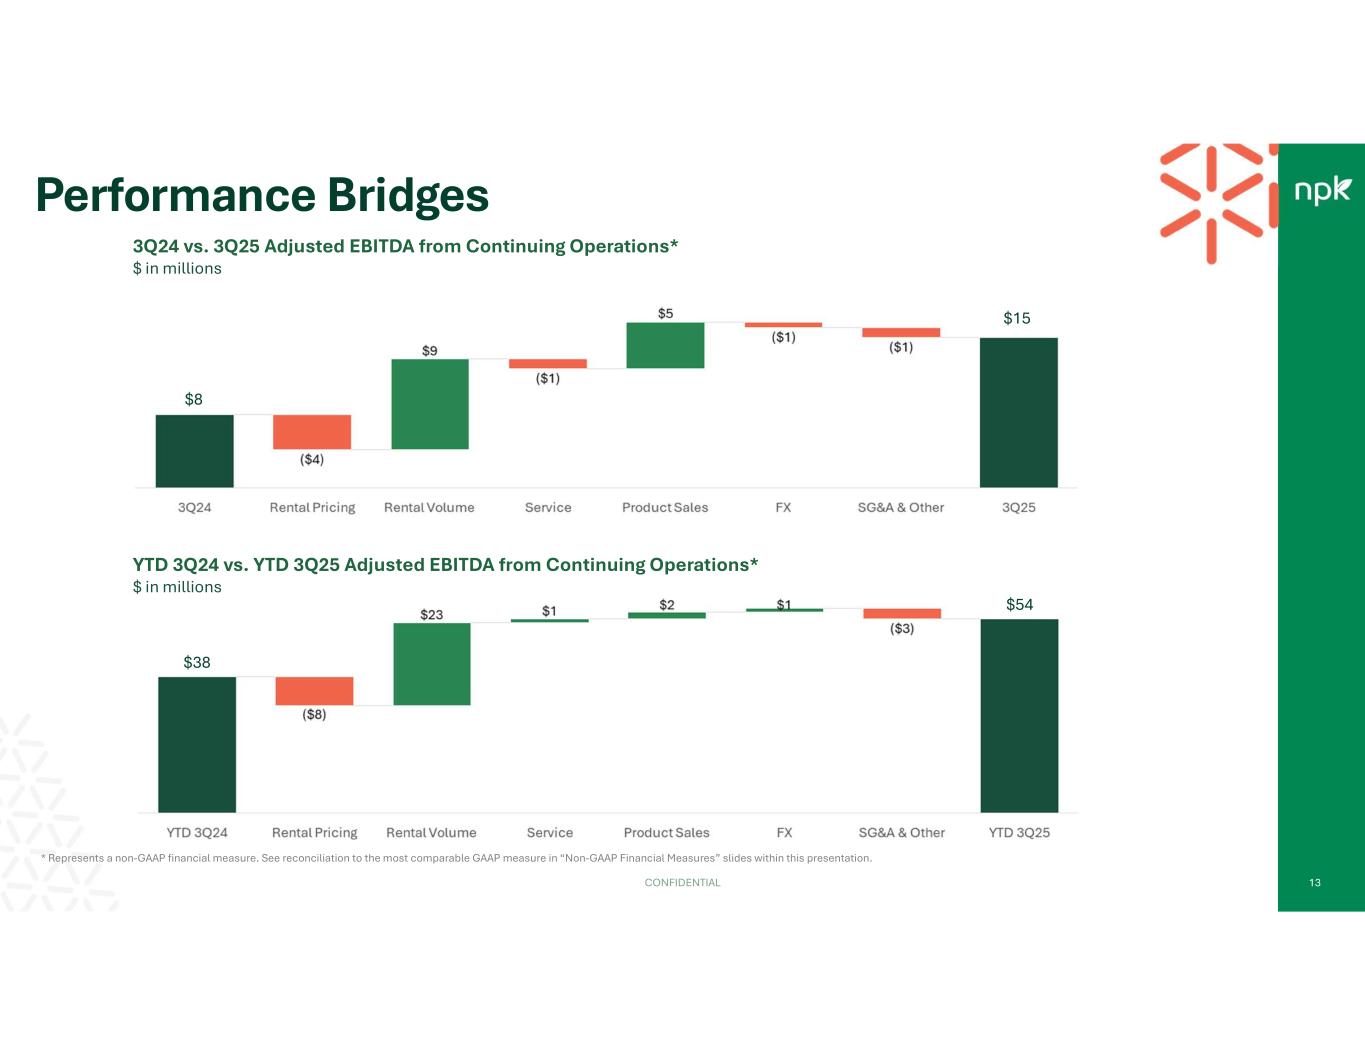
CONFIDENTIAL 13 Performance Bridges 3Q24 vs. 3Q25 Adjusted EBITDA from Continuing Operations* $ in millions * Represents a non-GAAP financial measure. See reconciliation to the most comparable GAAP measure in “Non-GAAP Financial Measures” slides within this presentation. $8 $15 $38 $54 YTD 3Q24 vs. YTD 3Q25 Adjusted EBITDA from Continuing Operations* $ in millions
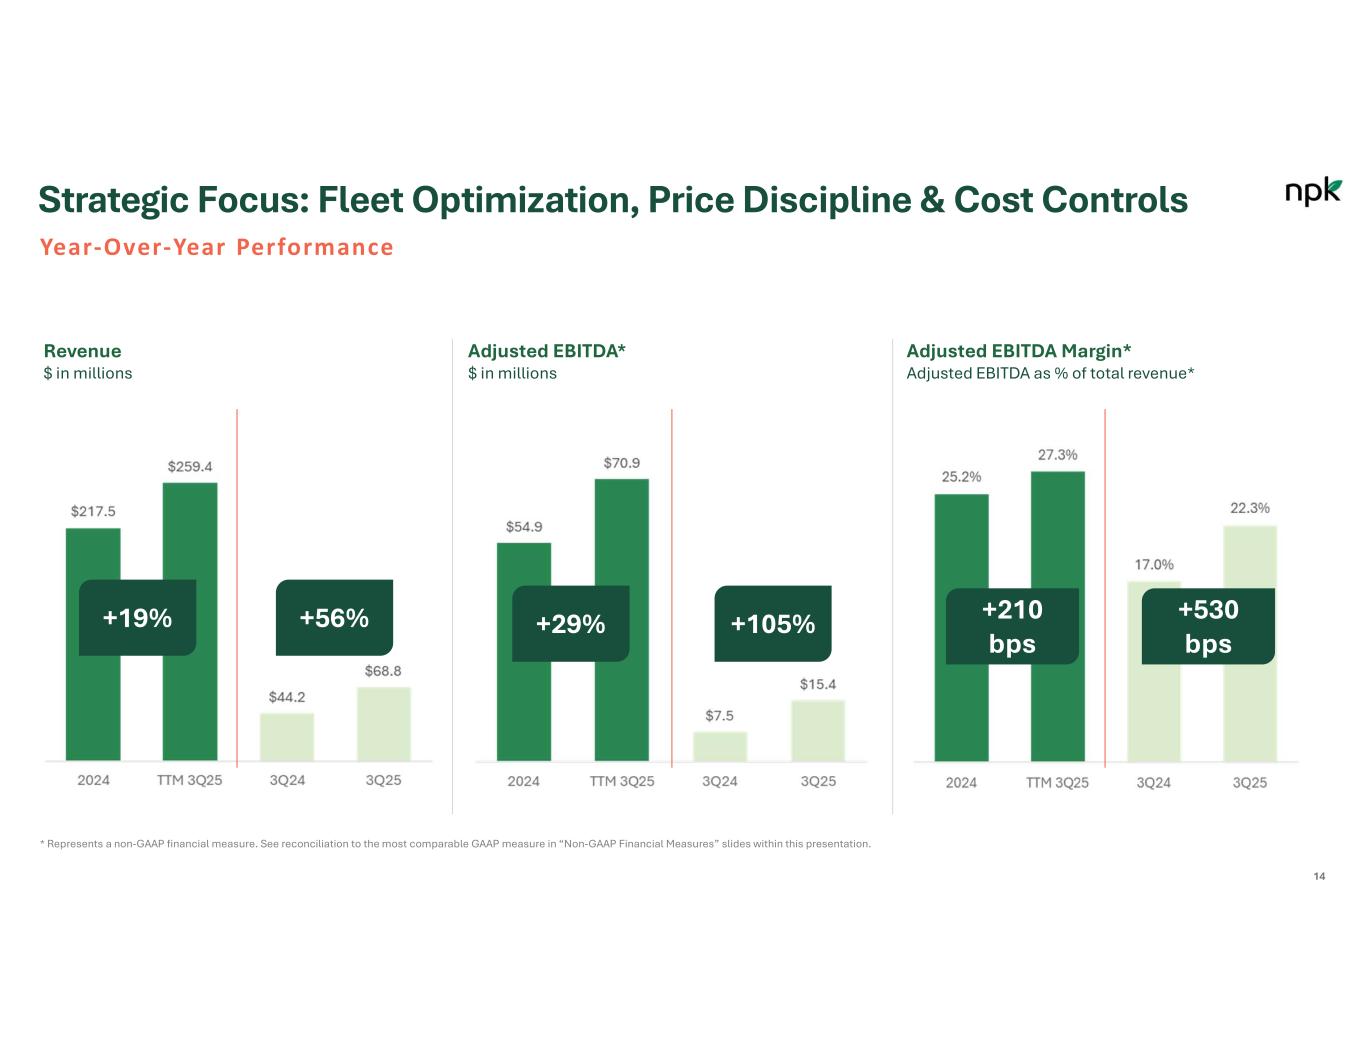
14 Strategic Focus: Fleet Optimization, Price Discipline & Cost Controls Year-Over-Year Performance Revenue $ in millions Adjusted EBITDA* $ in millions Adjusted EBITDA Margin* Adjusted EBITDA as % of total revenue* * Represents a non-GAAP financial measure. See reconciliation to the most comparable GAAP measure in “Non-GAAP Financial Measures” slides within this presentation. +19% +56% +29% +105% +210 bps +530 bps
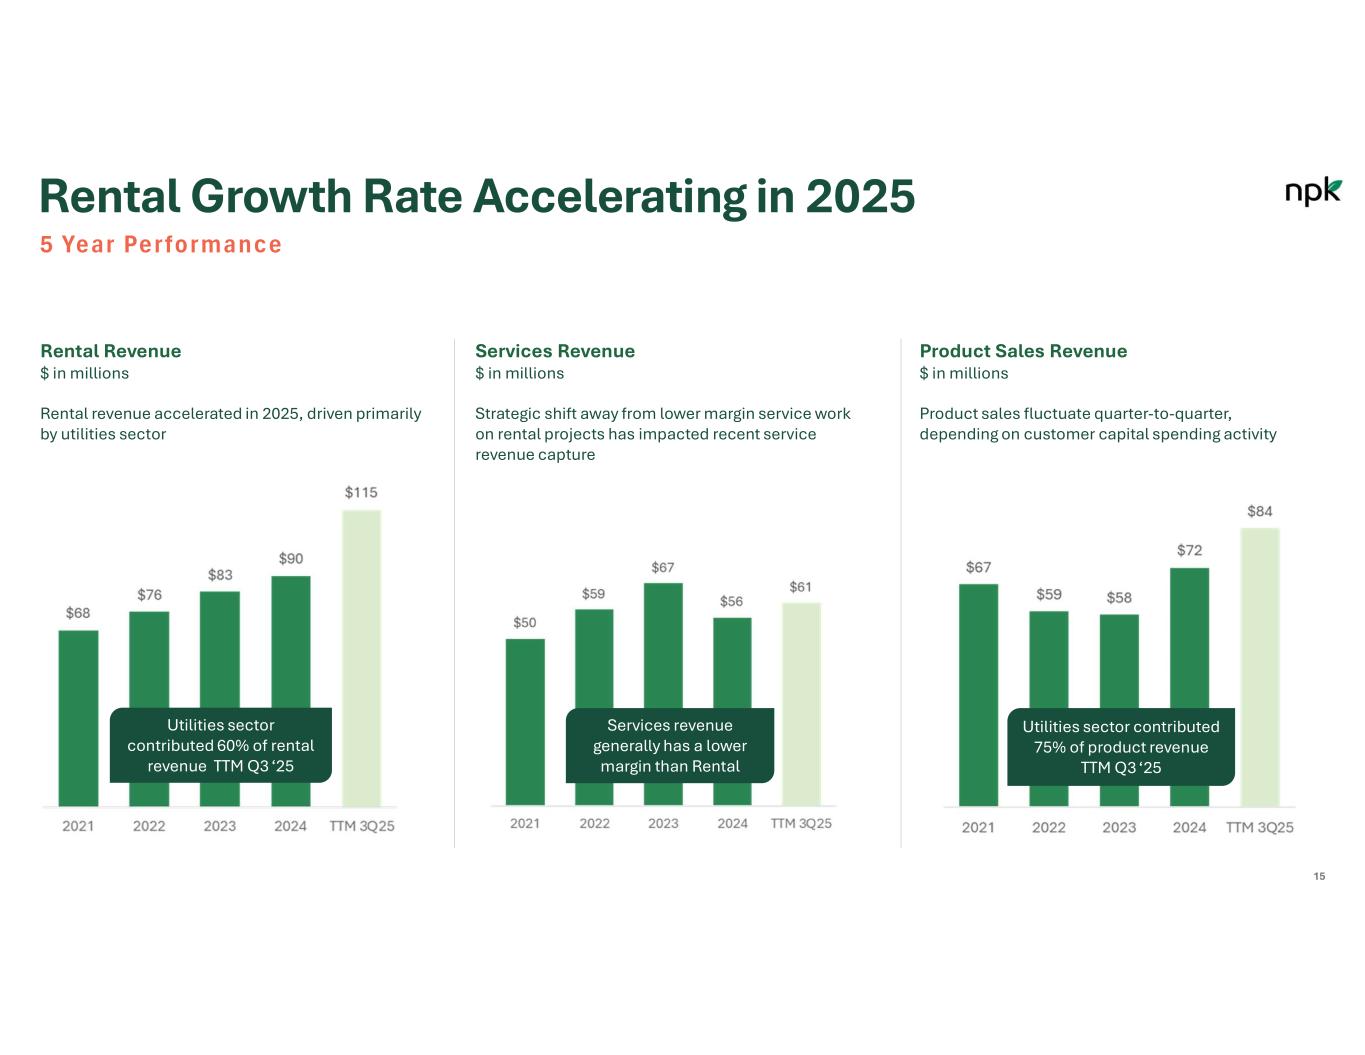
15 Rental Growth Rate Accelerating in 2025 5 Year Performance Services Revenue $ in millions Product Sales Revenue $ in millions Rental revenue accelerated in 2025, driven primarily by utilities sector Strategic shift away from lower margin service work on rental projects has impacted recent service revenue capture Product sales fluctuate quarter-to-quarter, depending on customer capital spending activity Rental Revenue $ in millions Utilities sector contributed 60% of rental revenue TTM Q3 ‘25 Services revenue generally has a lower margin than Rental Utilities sector contributed 75% of product revenue TTM Q3 ‘25
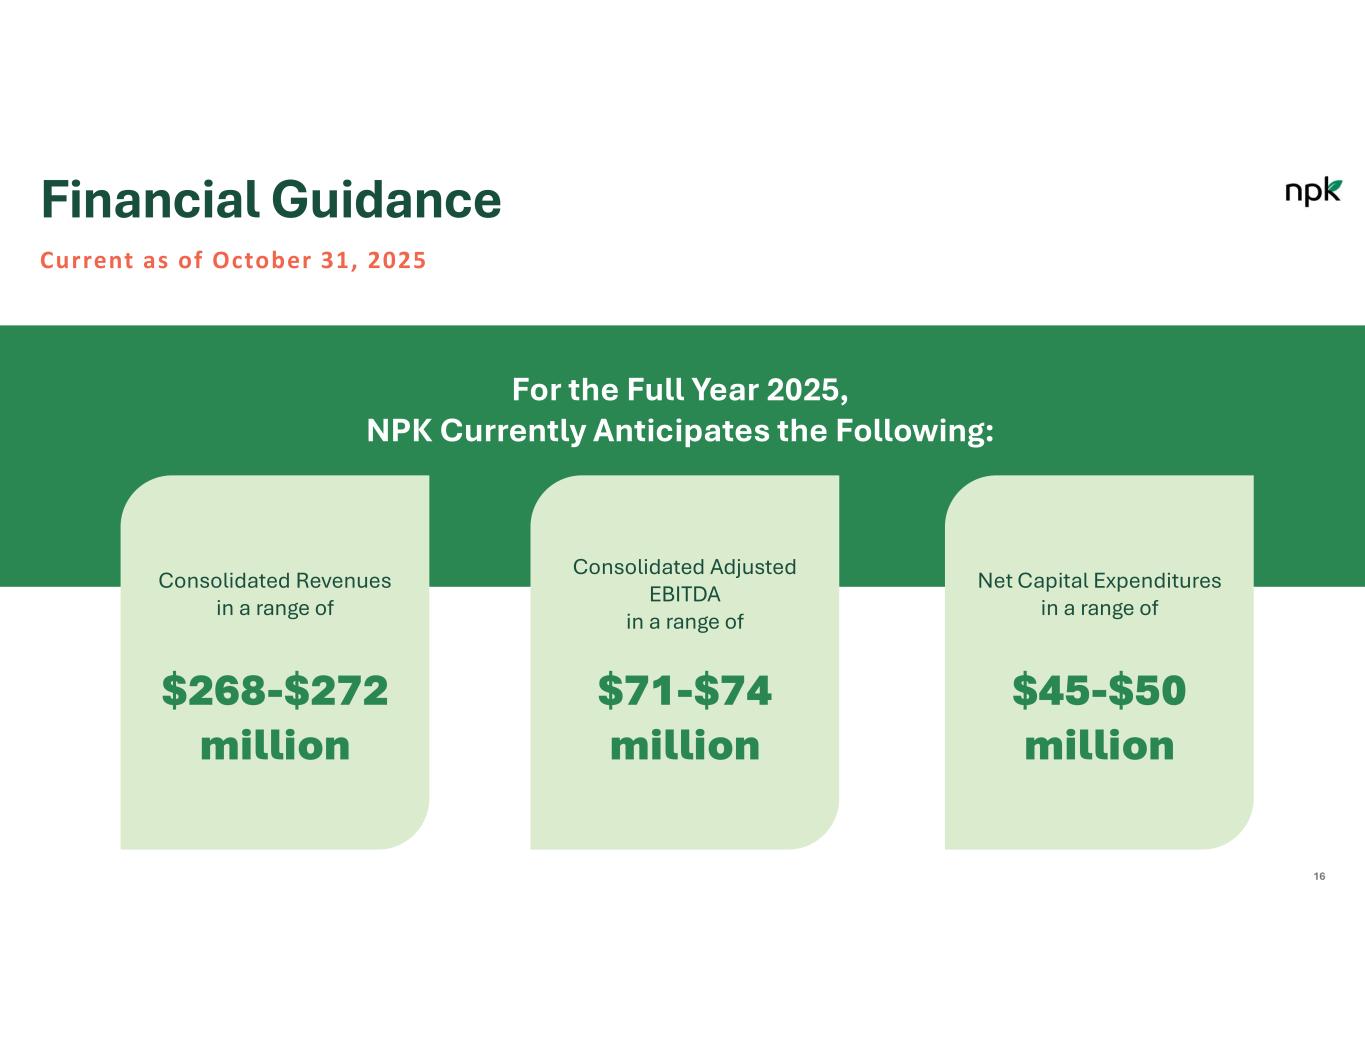
For the Full Year 2025, NPK Currently Anticipates the Following: Financial Guidance Current as of October 31, 2025 Consolidated Revenues in a range of Consolidated Adjusted EBITDA in a range of Net Capital Expenditures in a range of $268-$272 million $71-$74 million $45-$50 million 16
Value Creation Roadmap CONFIDENTIAL 17
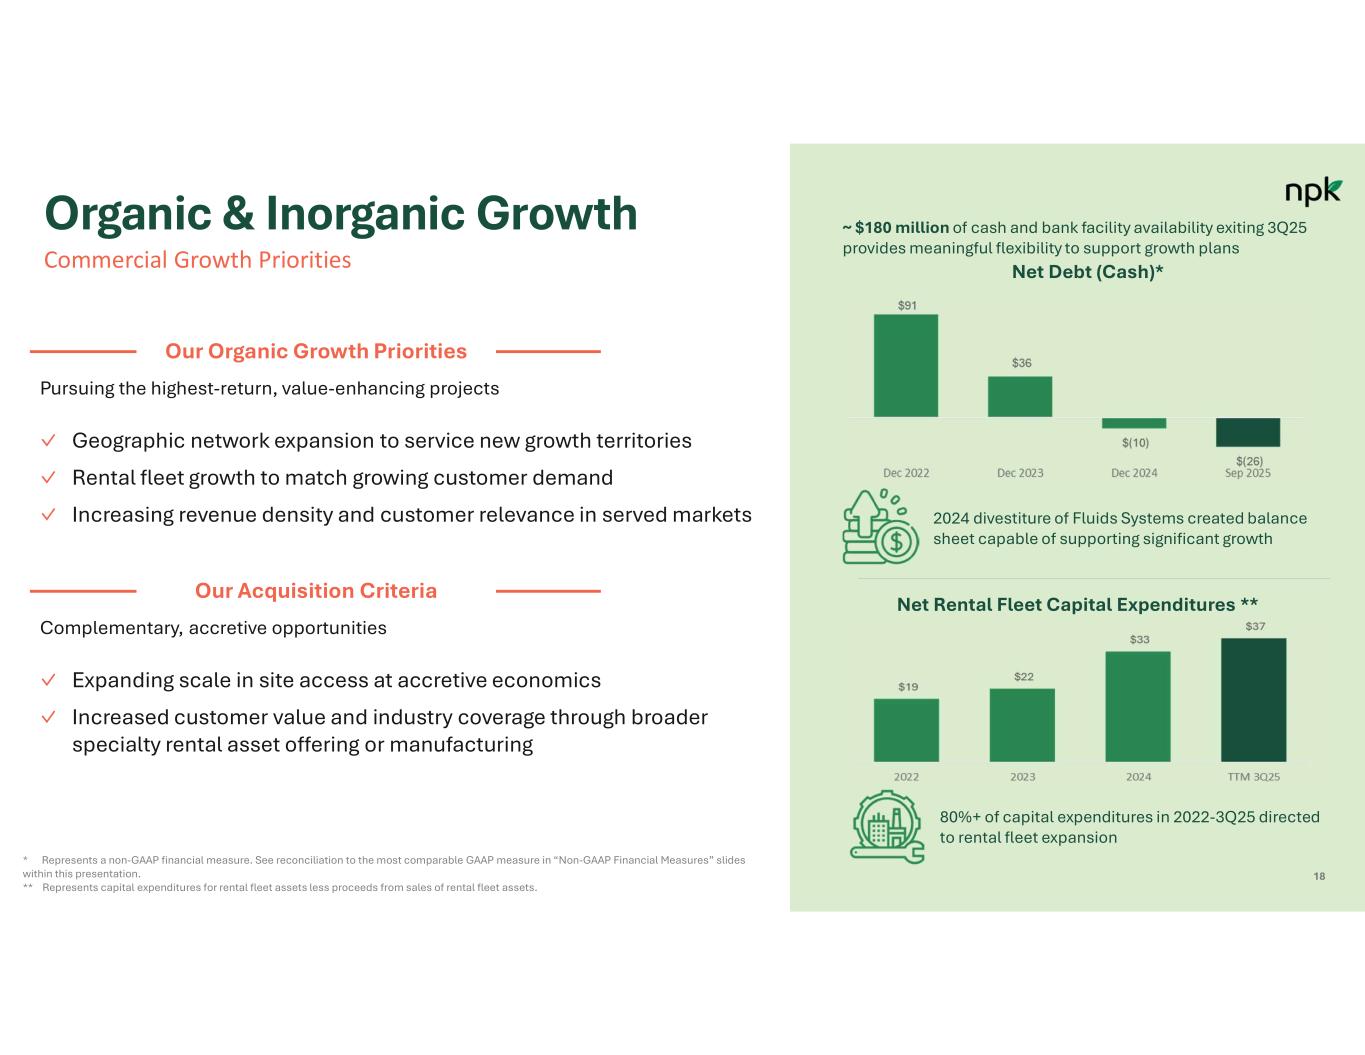
18 ✓ Geographic network expansion to service new growth territories ✓ Rental fleet growth to match growing customer demand ✓ Increasing revenue density and customer relevance in served markets Pursuing the highest-return, value-enhancing projects Our Organic Growth Priorities ✓ Expanding scale in site access at accretive economics ✓ Increased customer value and industry coverage through broader specialty rental asset offering or manufacturing Complementary, accretive opportunities Our Acquisition Criteria ~ $180 million of cash and bank facility availability exiting 3Q25 provides meaningful flexibility to support growth plans 2024 divestiture of Fluids Systems created balance sheet capable of supporting significant growth 80%+ of capital expenditures in 2022-3Q25 directed to rental fleet expansion Net Debt (Cash)* Net Rental Fleet Capital Expenditures ** * Represents a non-GAAP financial measure. See reconciliation to the most comparable GAAP measure in “Non-GAAP Financial Measures” slides within this presentation. ** Represents capital expenditures for rental fleet assets less proceeds from sales of rental fleet assets. Organic & Inorganic Growth Commercial Growth Priorities
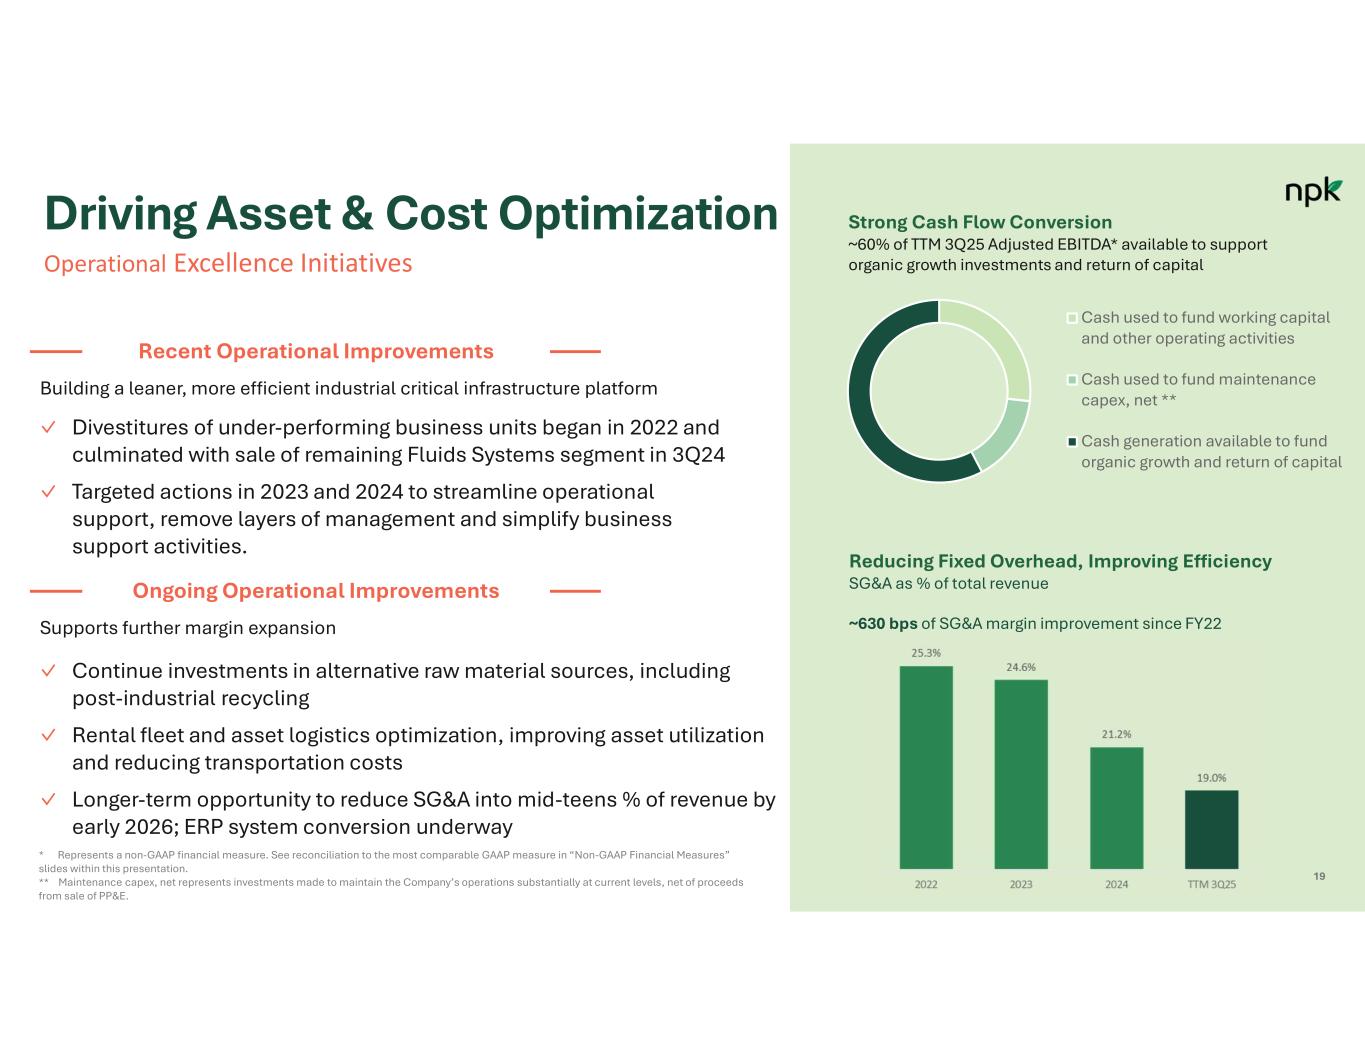
19 ✓ Divestitures of under-performing business units began in 2022 and culminated with sale of remaining Fluids Systems segment in 3Q24 ✓ Targeted actions in 2023 and 2024 to streamline operational support, remove layers of management and simplify business support activities. Building a leaner, more efficient industrial critical infrastructure platform Recent Operational Improvements ✓ Continue investments in alternative raw material sources, including post-industrial recycling ✓ Rental fleet and asset logistics optimization, improving asset utilization and reducing transportation costs ✓ Longer-term opportunity to reduce SG&A into mid-teens % of revenue by early 2026; ERP system conversion underway Supports further margin expansion Ongoing Operational Improvements ~630 bps of SG&A margin improvement since FY22 Reducing Fixed Overhead, Improving Efficiency SG&A as % of total revenue Strong Cash Flow Conversion ~60% of TTM 3Q25 Adjusted EBITDA* available to support organic growth investments and return of capital Cash used to fund working capital and other operating activities Cash used to fund maintenance capex, net ** Cash generation available to fund organic growth and return of capital * Represents a non-GAAP financial measure. See reconciliation to the most comparable GAAP measure in “Non-GAAP Financial Measures” slides within this presentation. ** Maintenance capex, net represents investments made to maintain the Company’s operations substantially at current levels, net of proceeds from sale of PP&E. Driving Asset & Cost Optimization Operational Excellence Initiatives
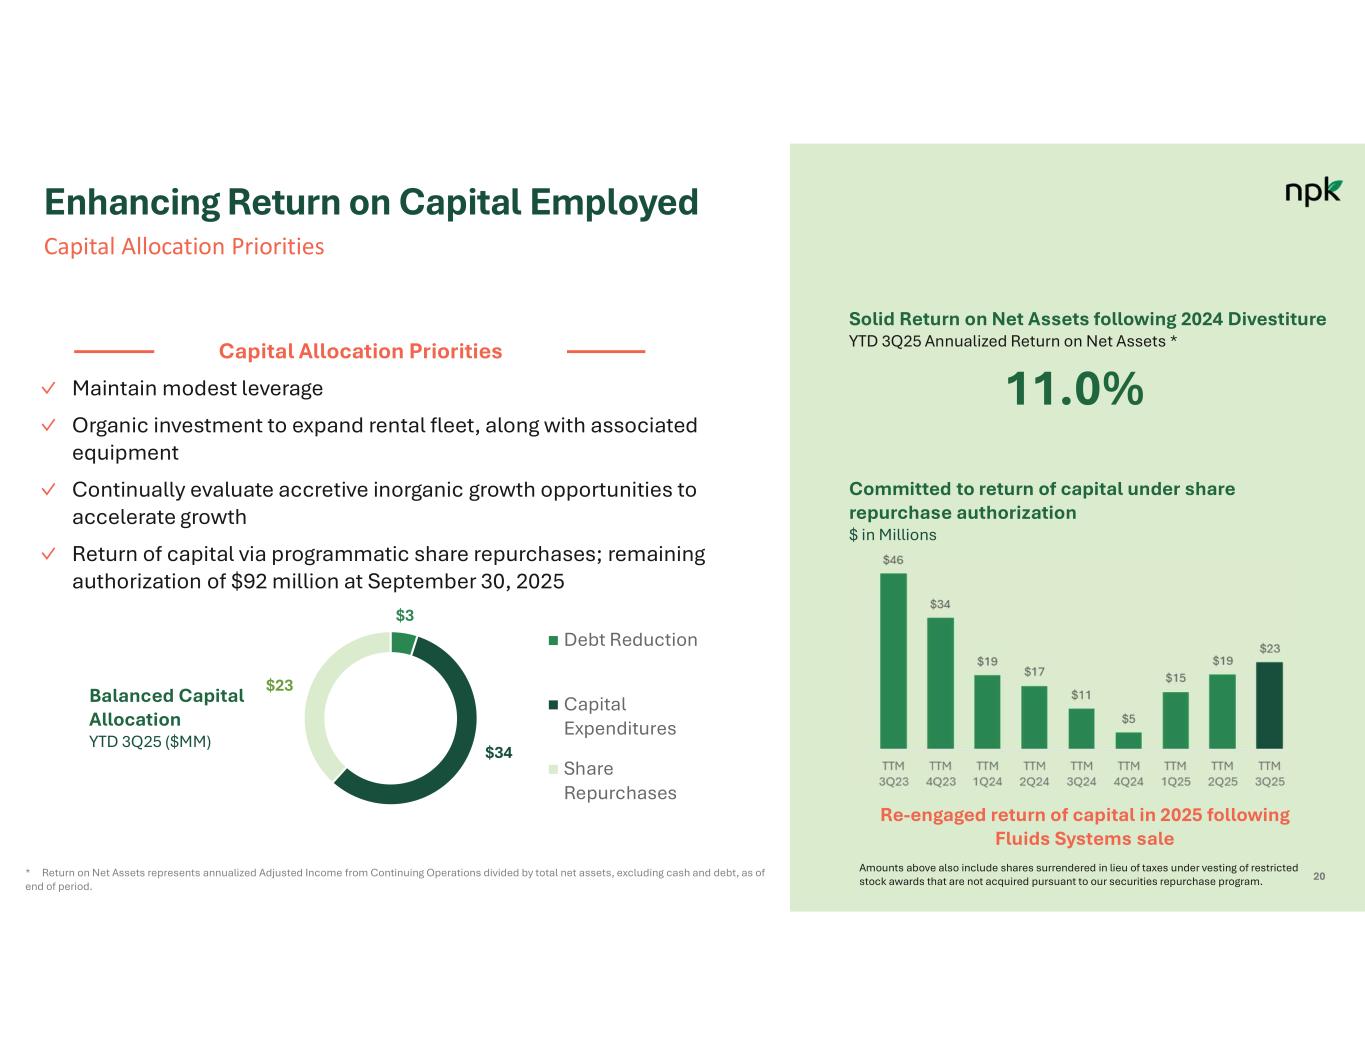
20 ✓ Maintain modest leverage ✓ Organic investment to expand rental fleet, along with associated equipment ✓ Continually evaluate accretive inorganic growth opportunities to accelerate growth ✓ Return of capital via programmatic share repurchases; remaining authorization of $92 million at September 30, 2025 Capital Allocation Priorities Committed to return of capital under share repurchase authorization $ in Millions Balanced Capital Allocation YTD 3Q25 ($MM) Debt Reduction Capital Expenditures Share Repurchases $3 $34 $23 Re-engaged return of capital in 2025 following Fluids Systems sale Amounts above also include shares surrendered in lieu of taxes under vesting of restricted stock awards that are not acquired pursuant to our securities repurchase program. Solid Return on Net Assets following 2024 Divestiture YTD 3Q25 Annualized Return on Net Assets * * Return on Net Assets represents annualized Adjusted Income from Continuing Operations divided by total net assets, excluding cash and debt, as of end of period. 11.0% Enhancing Return on Capital Employed Capital Allocation Priorities
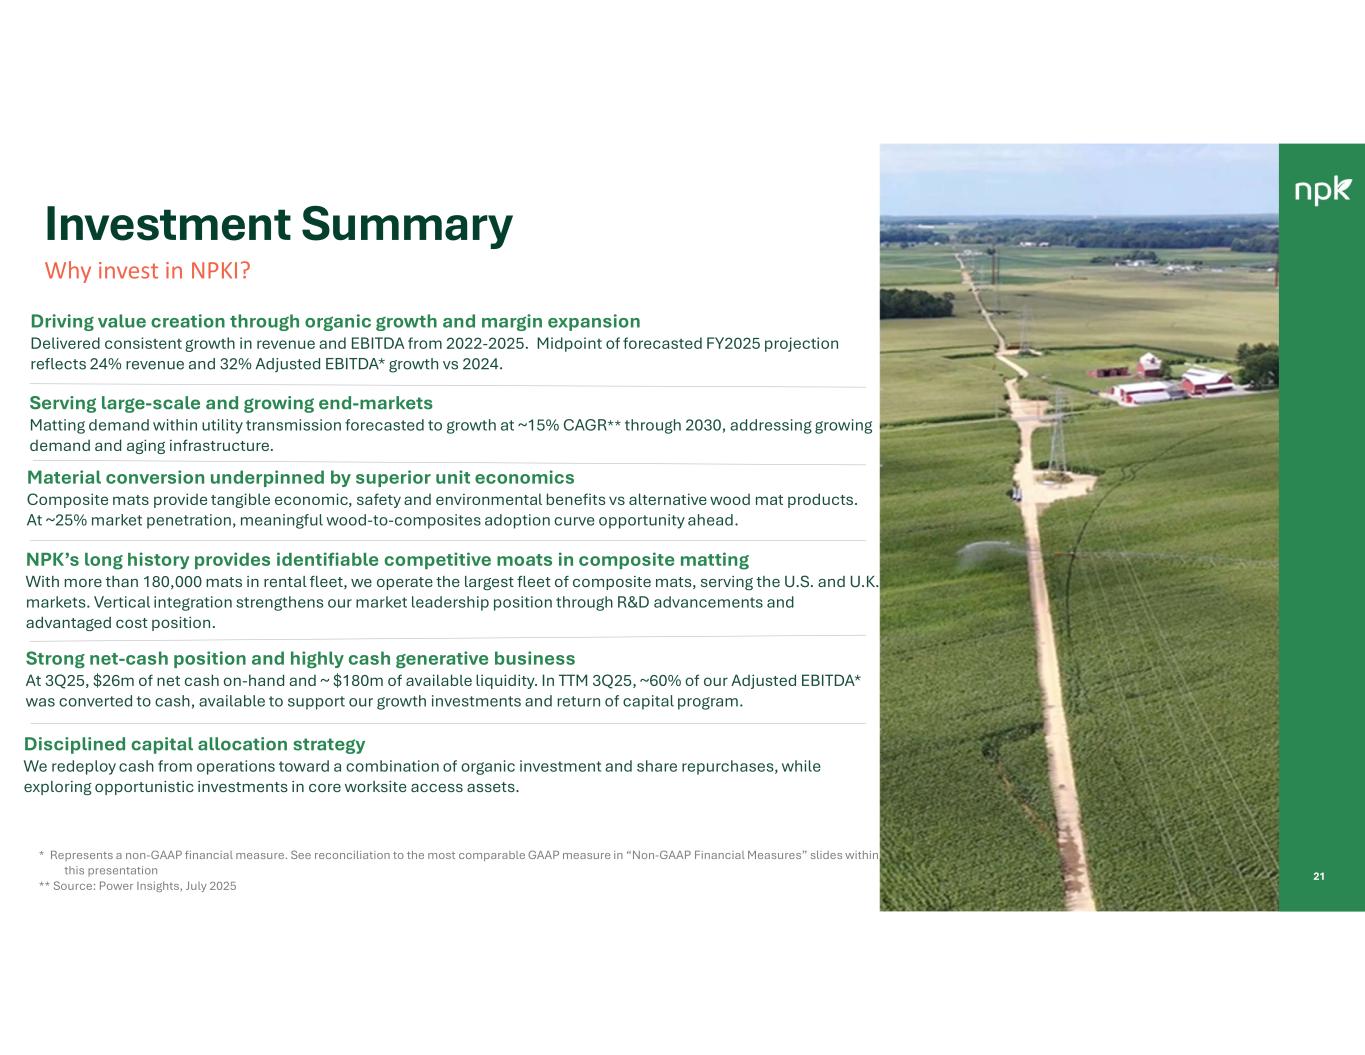
21 Driving value creation through organic growth and margin expansion Delivered consistent growth in revenue and EBITDA from 2022-2025. Midpoint of forecasted FY2025 projection reflects 24% revenue and 32% Adjusted EBITDA* growth vs 2024. NPK’s long history provides identifiable competitive moats in composite matting With more than 180,000 mats in rental fleet, we operate the largest fleet of composite mats, serving the U.S. and U.K. markets. Vertical integration strengthens our market leadership position through R&D advancements and advantaged cost position. Disciplined capital allocation strategy We redeploy cash from operations toward a combination of organic investment and share repurchases, while exploring opportunistic investments in core worksite access assets. Strong net-cash position and highly cash generative business At 3Q25, $26m of net cash on-hand and ~ $180m of available liquidity. In TTM 3Q25, ~60% of our Adjusted EBITDA* was converted to cash, available to support our growth investments and return of capital program. * Represents a non-GAAP financial measure. See reconciliation to the most comparable GAAP measure in “Non-GAAP Financial Measures” slides within this presentation ** Source: Power Insights, July 2025 Investment Summary Why invest in NPKI? Serving large-scale and growing end-markets Matting demand within utility transmission forecasted to growth at ~15% CAGR** through 2030, addressing growing demand and aging infrastructure. Material conversion underpinned by superior unit economics Composite mats provide tangible economic, safety and environmental benefits vs alternative wood mat products. At ~25% market penetration, meaningful wood-to-composites adoption curve opportunity ahead.
Appendix CONFIDENTIAL 22

10/31/2025 23 Matthew joined NPK in April 2016 as President, Newpark Industrial Solutions, and was appointed as our Chief Executive Officer in March 2022. • From April 2014 to June 2015, Mr. Lanigan served as a Managing Director of Custom Fleet Services in Australia for GE Capital Corporation, a financial services unit of General Electric. • From September 2010 to March 2014, he served as Commercial Excellence Leader in Asia Pacific for GE Capital. • Previous to September 2010, Mr. Lanigan held various executive positions in marketing and sales for GE Capital Corporation and spent his early career with ExxonMobil as a Drilling & Completions Engineer and an Offshore Production Engineer and Marketer for Crude & LPG. • Mr. Lanigan received his Bachelor's degree in Chemical Engineering from Royal Melbourne Institute of Technology and his MBA from the Melbourne Business School at the University of Melbourne and is certified as a Six Sigma Master Black Belt. Gregg joined NPK in April 2007 as Vice President, Controller and Chief Accounting Officer and promoted to Chief Financial Officer in October 2011. • Prior to joining NPK, Mr. Piontek was Vice President and Chief Accounting Officer of Stewart & Stevenson LLC, where, as a member of the executive team, he directed all start-up and purchase accounting functions related to the purchase of assets from Stewart & Stevenson Services, Inc. and served as lead executive financial officer for their $150 million public debt offering. • Previously, from 2001 to 2006, he held the positions of Assistant Corporate Controller and Controller, Power Products Division at Stewart & Stevenson Services, Inc. • Prior to that, Mr. Piontek served in various financial roles at General Electric, CNH Global N.V. and Deloitte & Touche LLP. • Mr. Piontek received a Master of Business Administration from Marquette University and a Bachelor of Science degree in Accounting from Arizona State University. Lori joined NPK in October 2017 as Senior Director, Business Transformation & Integration, was promoted to the position of Vice President, Marketing for Newpark Industrial Solutions in January 2021, and has been responsible for business operations since September 2021. • Ms. Briggs has progressed her career by blending her expertise in marketing, business development, pricing, and finance to optimize team performance and drive profitability across multiple platforms. • Prior to joining NPK, she held leadership roles with progressing responsibility in various divisions of GE (including Oil & Gas, Capital, and Aviation) for over 25 years, most recently holding the position of Global Pricing Leader for GE Oil & Gas, an energy subsidiary. • Ms. Briggs received her Bachelor of Science degree in Finance and Statistics/ Mathematics from Miami University and her MBA from Washington University in St. Louis. Celeste joined NPK in April 2008 as Senior Corporate Counsel and was promoted to the position of Vice President, General Counsel, Chief Compliance Officer & Corporate Secretary in May 2023. • Since joining NPK in 2008, Ms. Frugé has served in various legal roles of increasing responsibility, including the role of Associate General Counsel from January 2011 to February 2020 and as the Company's Deputy General Counsel and Assistant Corporate Secretary since February 2020. • In her capacity as Deputy General Counsel, she was responsible for managing and overseeing various global legal matters including complex commercial matters, acquisitions and divestitures, litigation and pre- litigation disputes, joint ventures and other legal issues including but not limited to data privacy, information governance, regulatory matters, and tax matters. • Prior to joining NPK, Ms. Frugé practiced law at Winstead, PC where she was a member of the Corporate, Securities/M&A practice group and at Stibbs & Burbach, PC in The Woodlands, Texas. • Ms. Frugé received her undergraduate degree from Loyola University and earned her J.D. from Loyola University New Orleans College of Law. Matthew S. Lanigan President & Chief Executive Officer Gregg S. Piontek Chief Financial Officer Lori Briggs Executive Vice President, Business Operations Celeste Frugé Vice President, General Counsel, Chief Compliance Officer & Corporate Secretary Experienced Executive Leadership Team APPENDIX
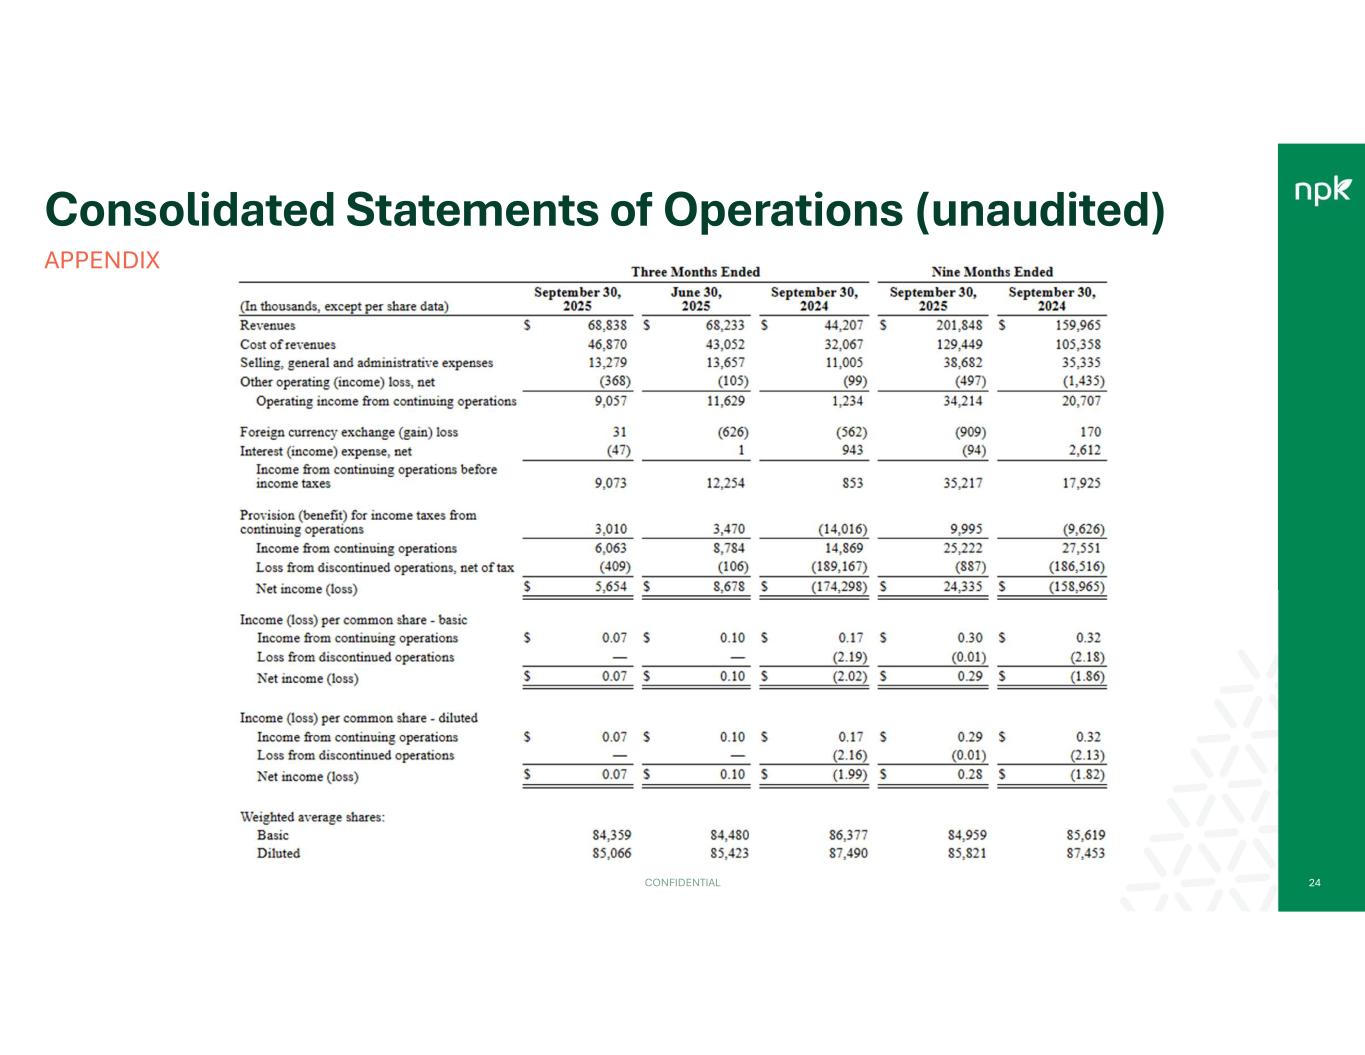
Consolidated Statements of Operations (unaudited) APPENDIX CONFIDENTIAL 24
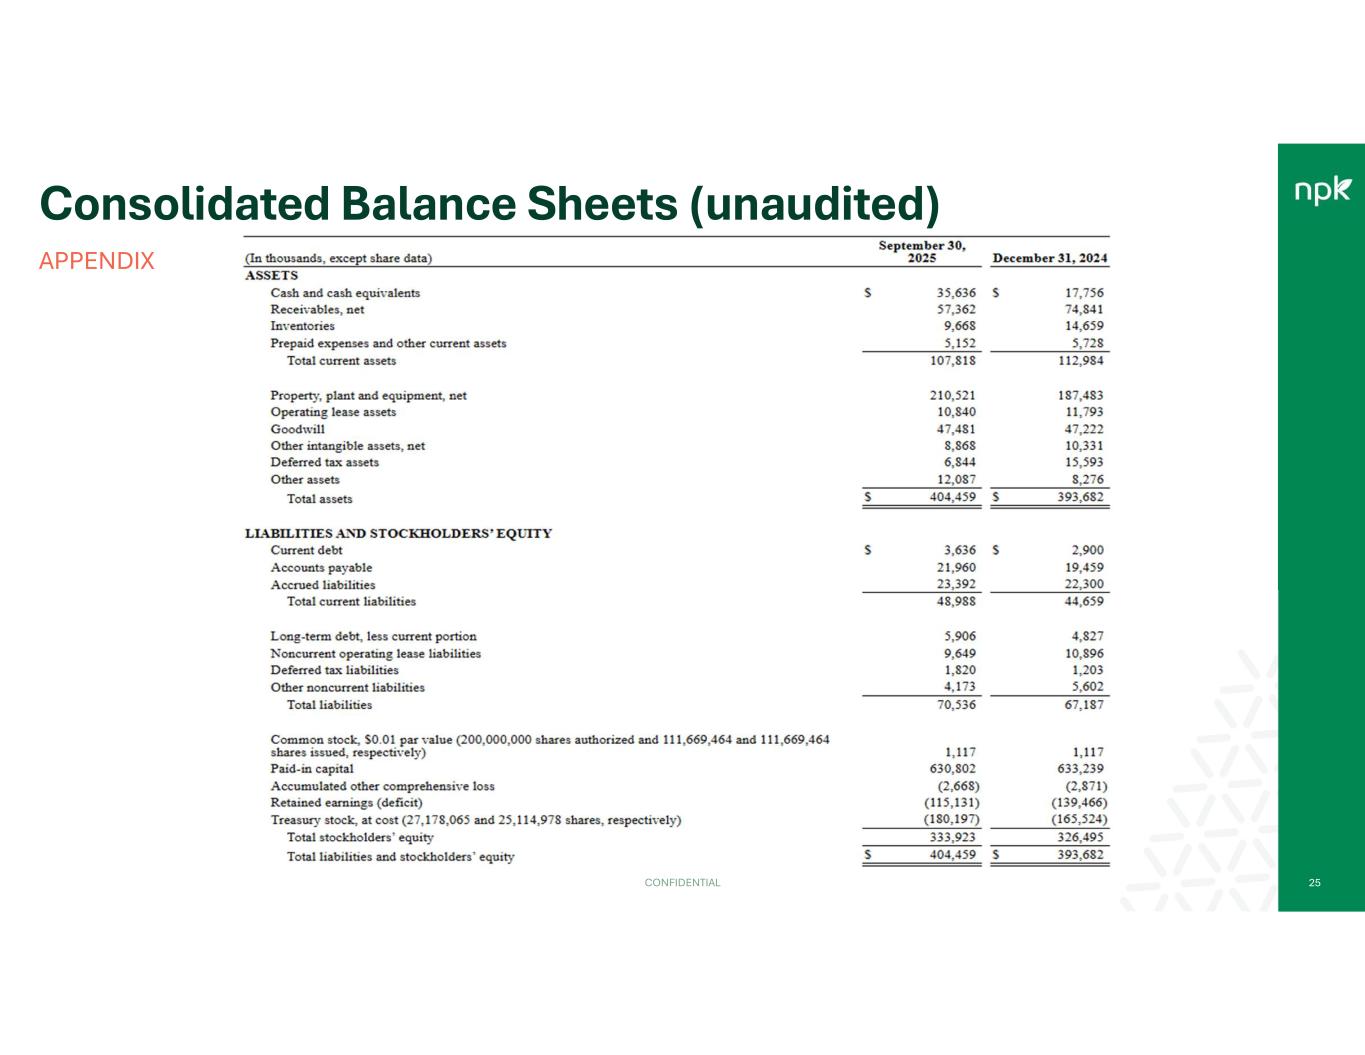
Consolidated Balance Sheets (unaudited) APPENDIX CONFIDENTIAL 25
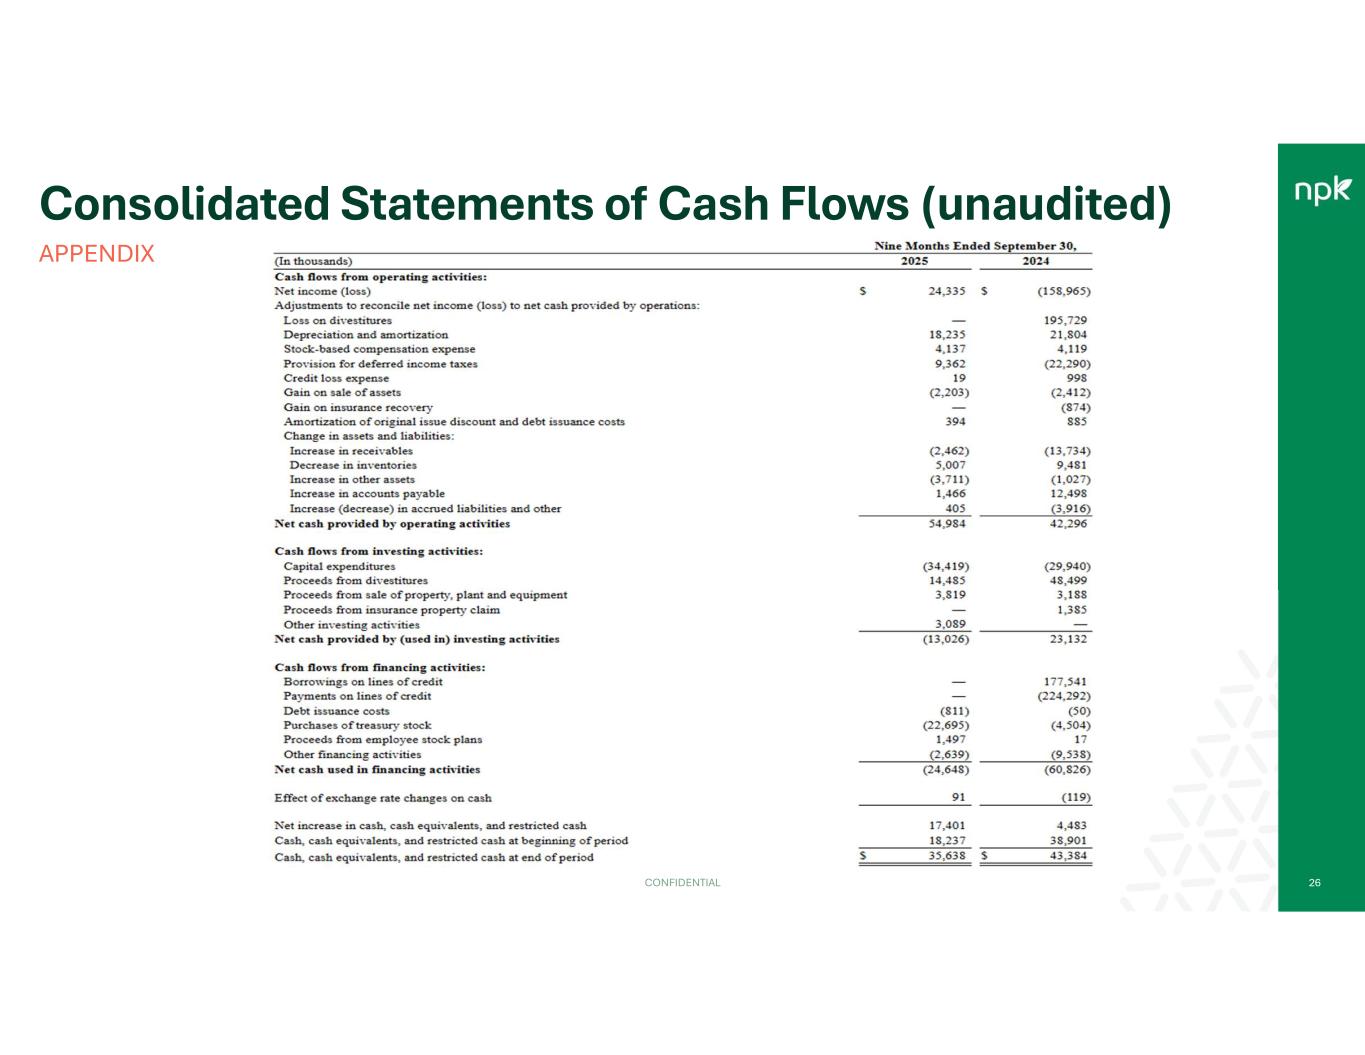
Consolidated Statements of Cash Flows (unaudited) APPENDIX CONFIDENTIAL 26
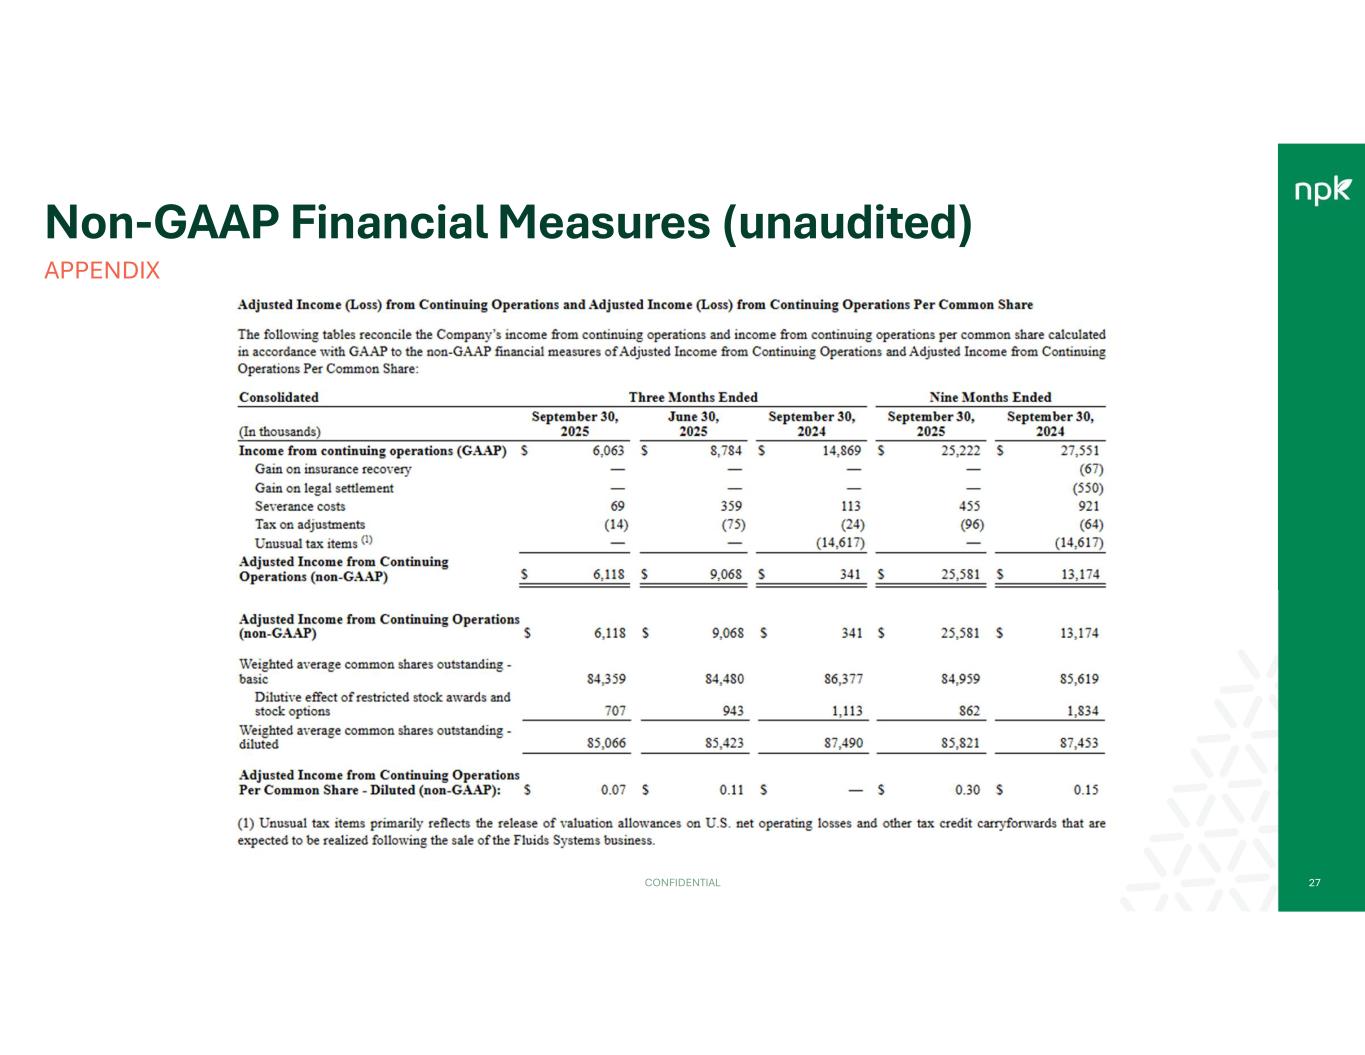
Non-GAAP Financial Measures (unaudited) APPENDIX CONFIDENTIAL 27
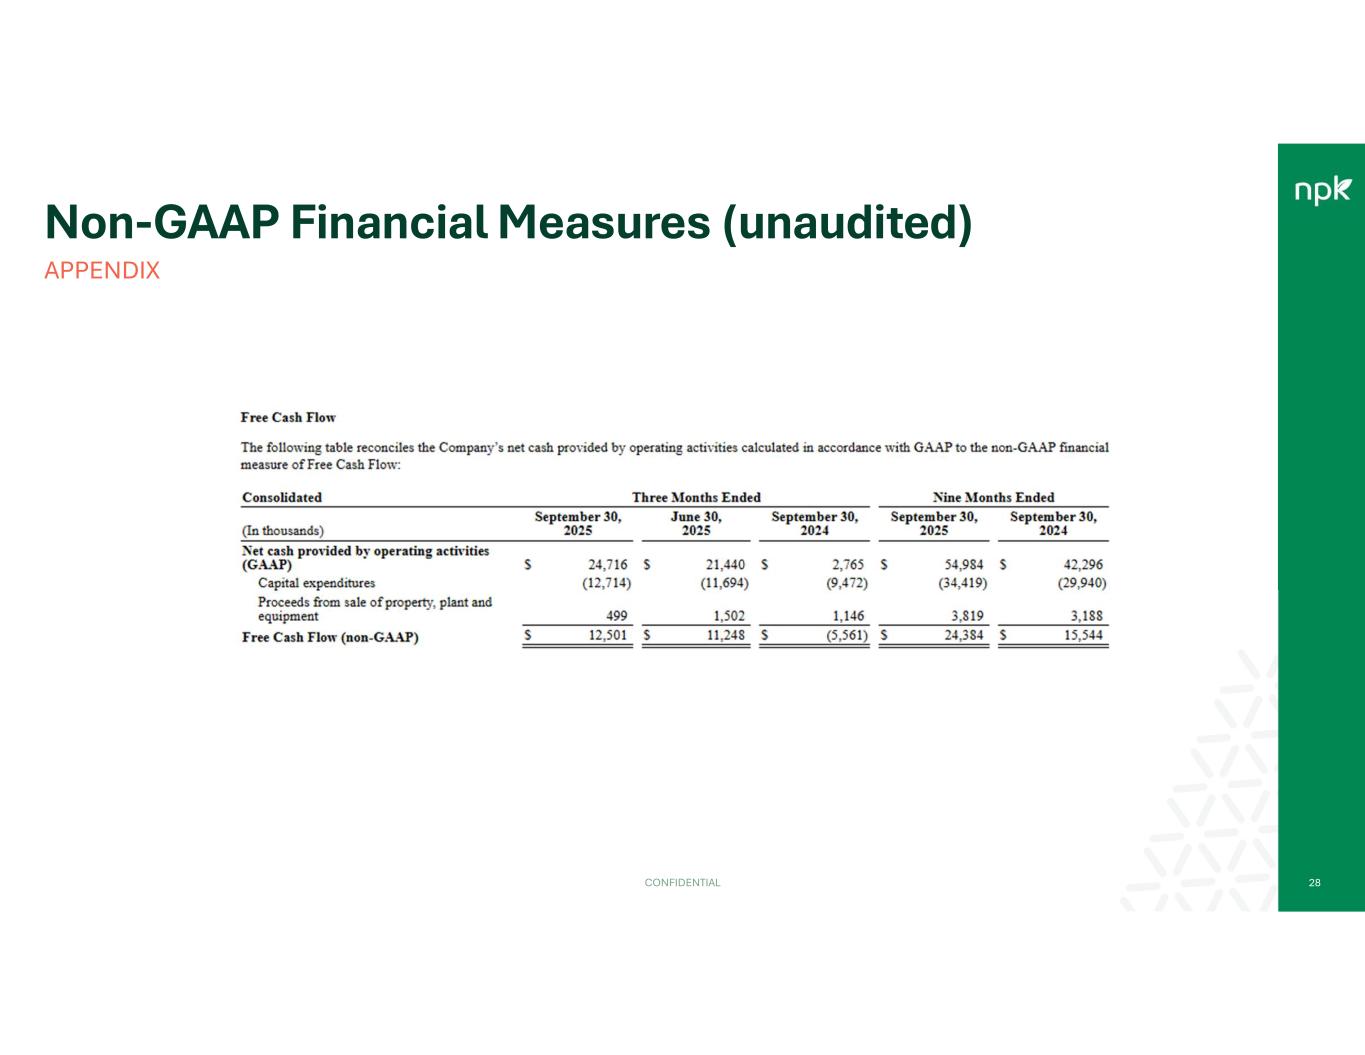
Non-GAAP Financial Measures (unaudited) APPENDIX CONFIDENTIAL 28
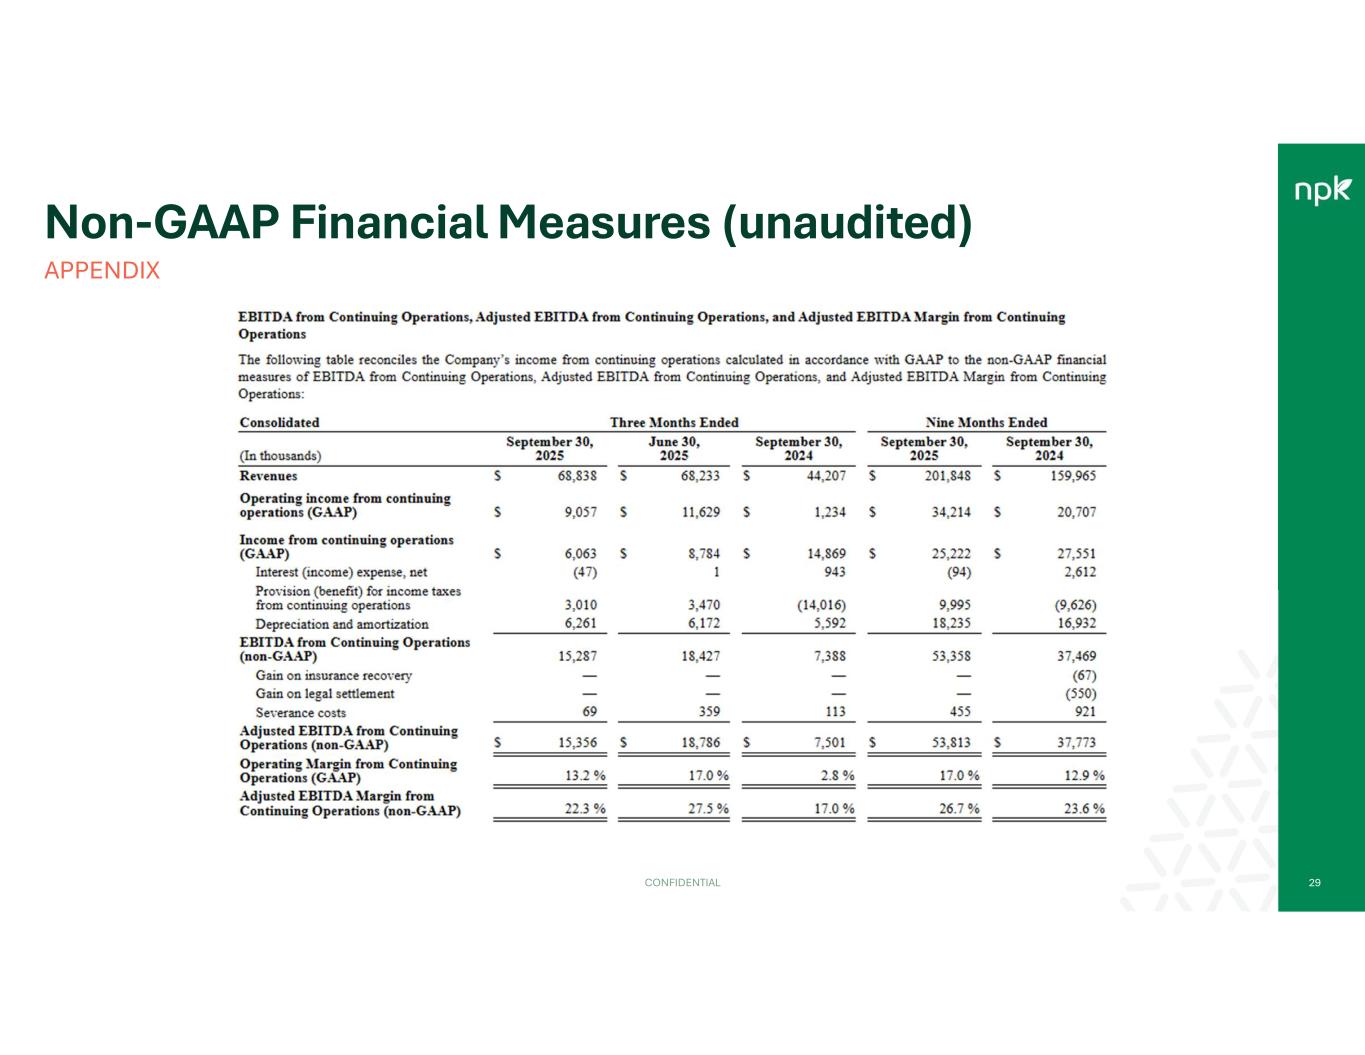
Non-GAAP Financial Measures (unaudited) APPENDIX CONFIDENTIAL 29
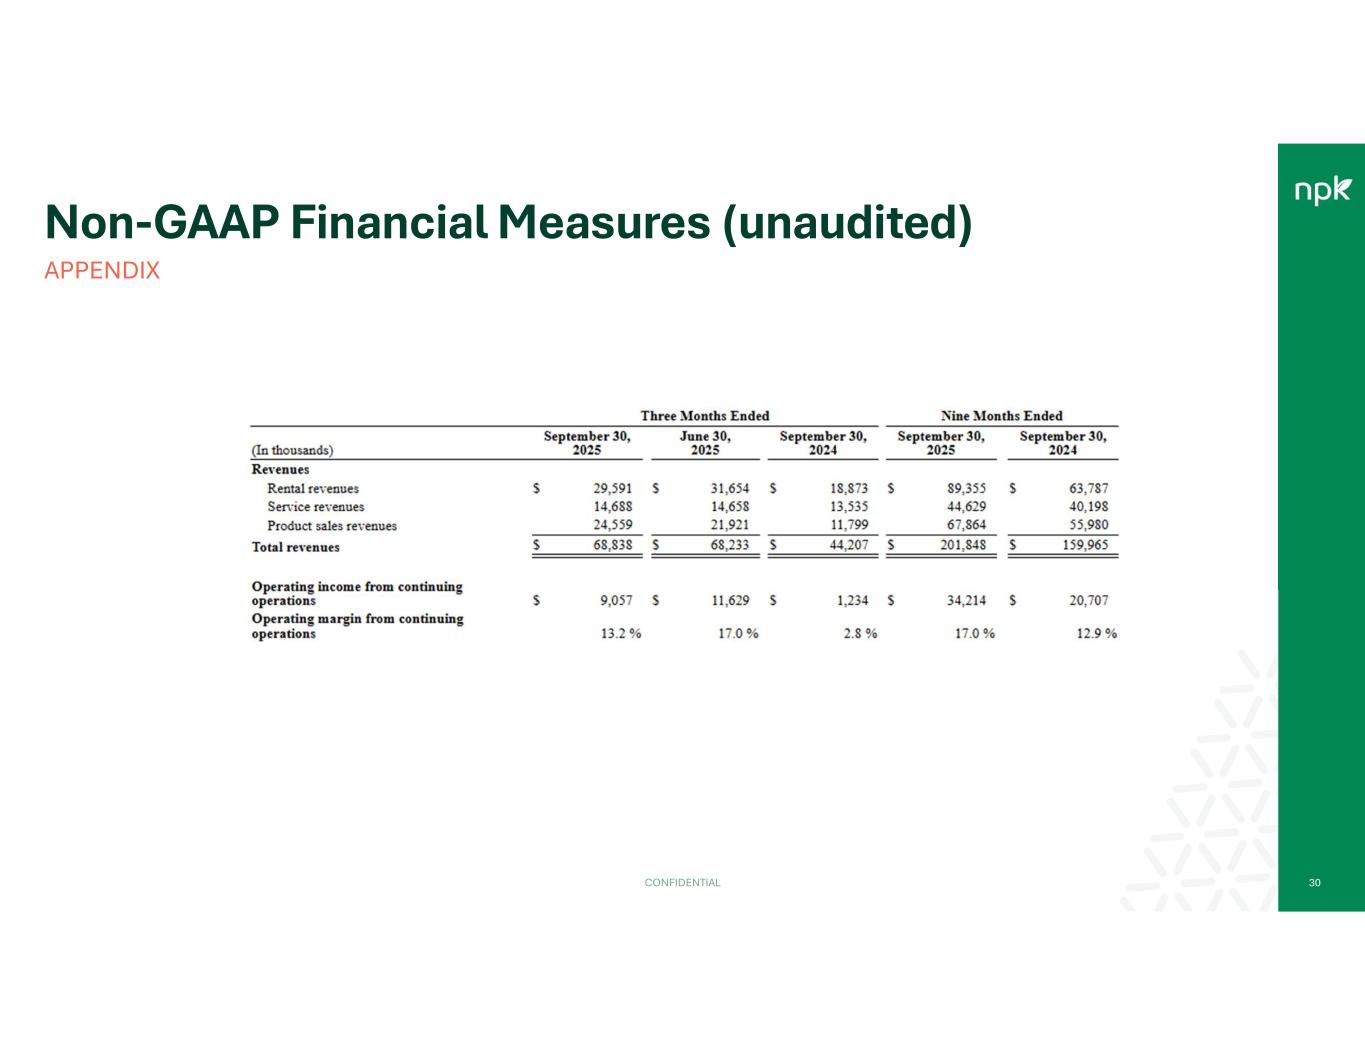
Non-GAAP Financial Measures (unaudited) APPENDIX CONFIDENTIAL 30
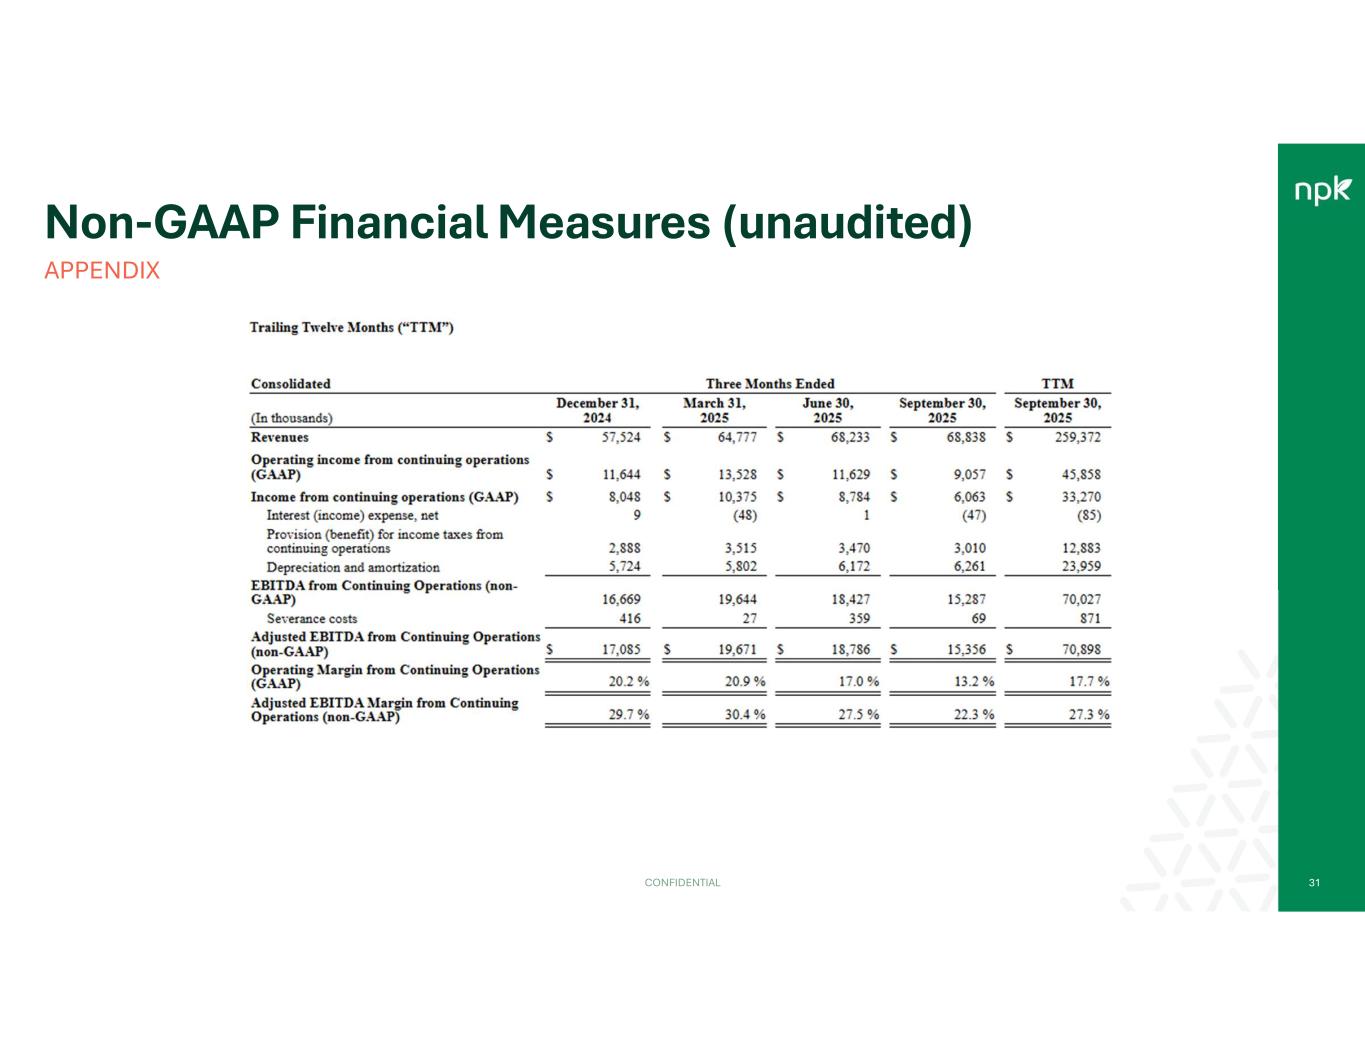
Non-GAAP Financial Measures (unaudited) APPENDIX CONFIDENTIAL 31
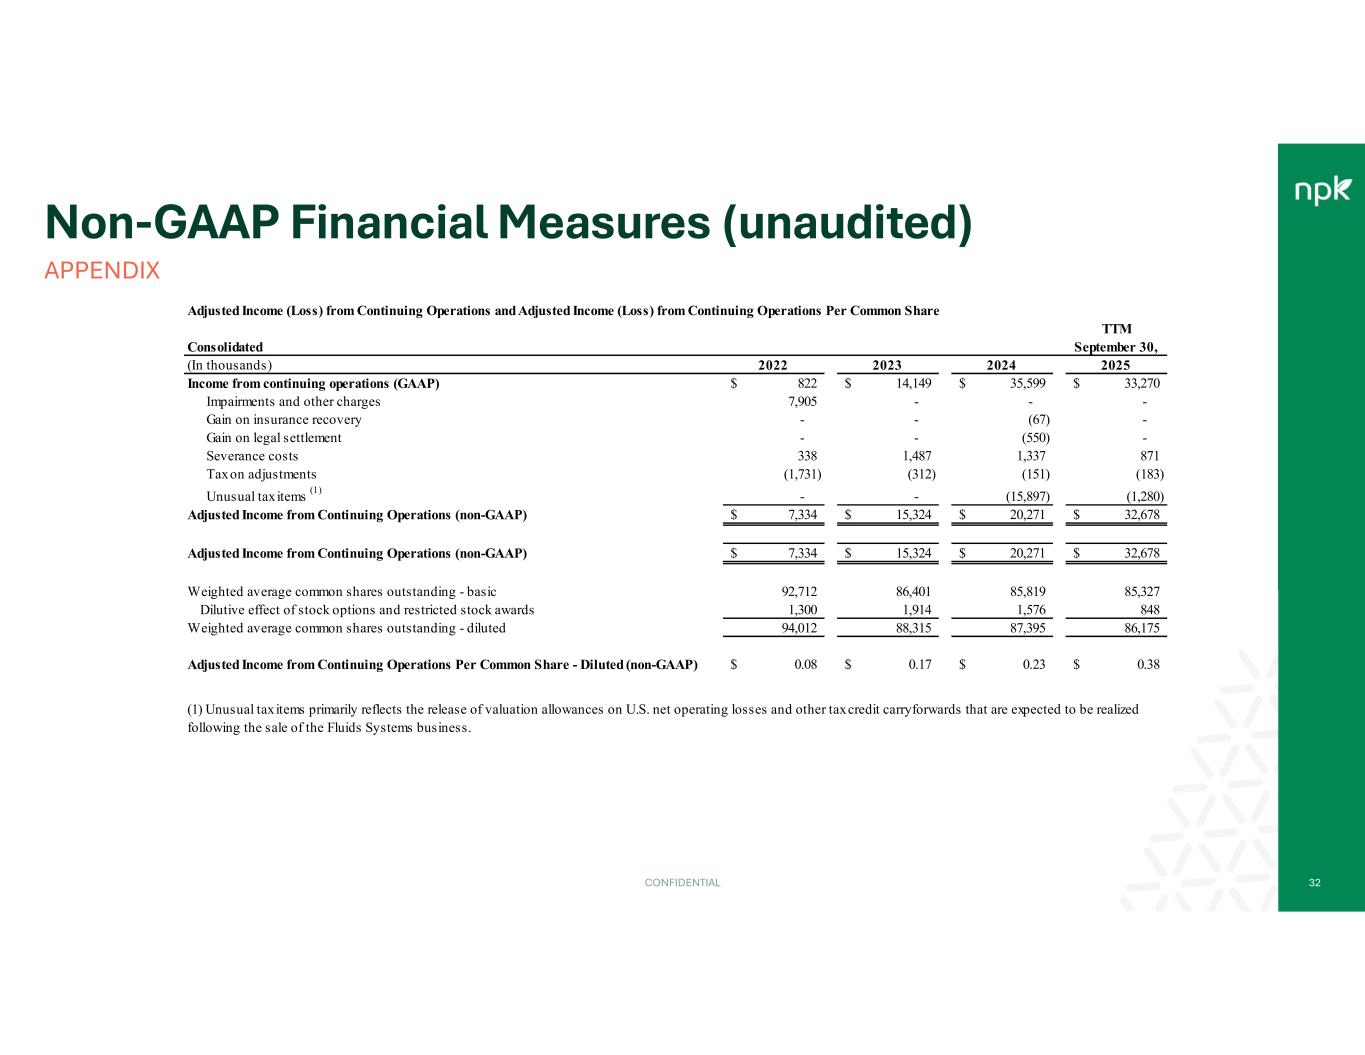
Non-GAAP Financial Measures (unaudited) APPENDIX CONFIDENTIAL 32 Consolidated (In thousands) 2022 2023 2024 2025 Income from continuing operations (GAAP) 822$ 14,149$ 35,599$ 33,270$ Impairments and other charges 7,905 - - - Gain on insurance recovery - - (67) - Gain on legal settlement - - (550) - Severance costs 338 1,487 1,337 871 Tax on adjustments (1,731) (312) (151) (183) Unusual tax items (1) - - (15,897) (1,280) Adjusted Income from Continuing Operations (non-GAAP) 7,334$ 15,324$ 20,271$ 32,678$ Adjusted Income from Continuing Operations (non-GAAP) 7,334$ 15,324$ 20,271$ 32,678$ Weighted average common shares outstanding - basic 92,712 86,401 85,819 85,327 Dilutive effect of stock options and restricted stock awards 1,300 1,914 1,576 848 Weighted average common shares outstanding - diluted 94,012 88,315 87,395 86,175 Adjusted Income from Continuing Operations Per Common Share - Diluted (non-GAAP) 0.08$ 0.17$ 0.23$ 0.38$ Adjusted Income (Loss) from Continuing Operations and Adjusted Income (Loss) from Continuing Operations Per Common Share TTM September 30, (1) Unusual tax items primarily reflects the release of valuation allowances on U.S. net operating losses and other tax credit carryforwards that are expected to be realized following the sale of the Fluids Systems business.
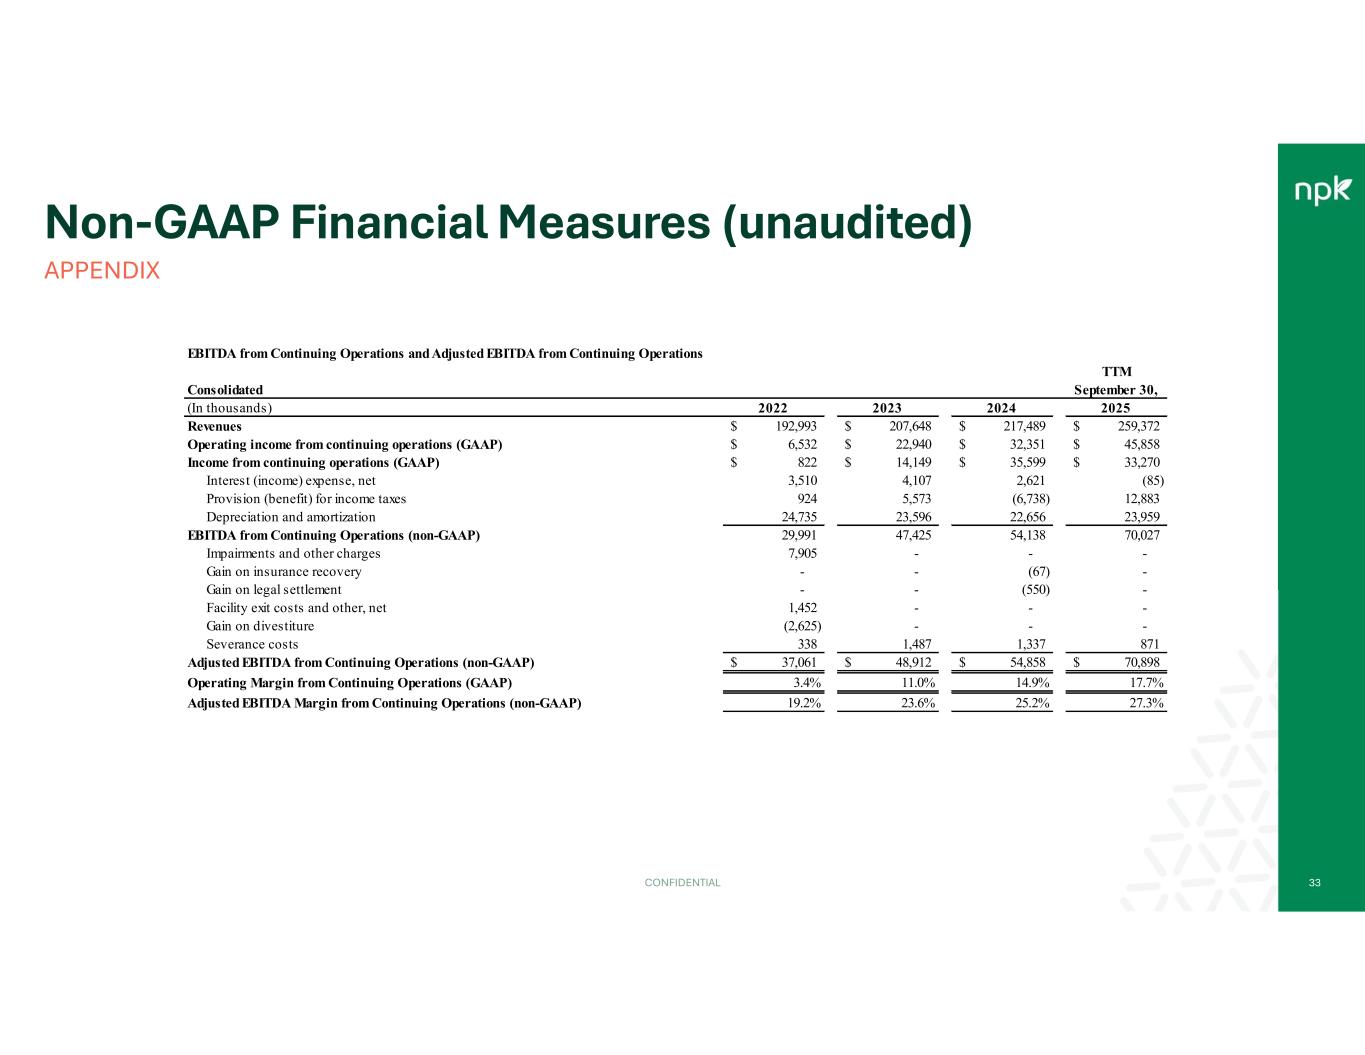
Non-GAAP Financial Measures (unaudited) APPENDIX CONFIDENTIAL 33 Consolidated (In thousands) 2022 2023 2024 2025 Revenues 192,993$ 207,648$ 217,489$ 259,372$ Operating income from continuing operations (GAAP) 6,532$ 22,940$ 32,351$ 45,858$ Income from continuing operations (GAAP) 822$ 14,149$ 35,599$ 33,270$ Interest (income) expense, net 3,510 4,107 2,621 (85) Provision (benefit) for income taxes 924 5,573 (6,738) 12,883 Depreciation and amortization 24,735 23,596 22,656 23,959 EBITDA from Continuing Operations (non-GAAP) 29,991 47,425 54,138 70,027 Impairments and other charges 7,905 - - - Gain on insurance recovery - - (67) - Gain on legal settlement - - (550) - Facility exit costs and other, net 1,452 - - - Gain on divestiture (2,625) - - - Severance costs 338 1,487 1,337 871 Adjusted EBITDA from Continuing Operations (non-GAAP) 37,061$ 48,912$ 54,858$ 70,898$ Operating Margin from Continuing Operations (GAAP) 3.4% 11.0% 14.9% 17.7% Adjusted EBITDA Margin from Continuing Operations (non-GAAP) 19.2% 23.6% 25.2% 27.3% TTM September 30, EBITDA from Continuing Operations and Adjusted EBITDA from Continuing Operations
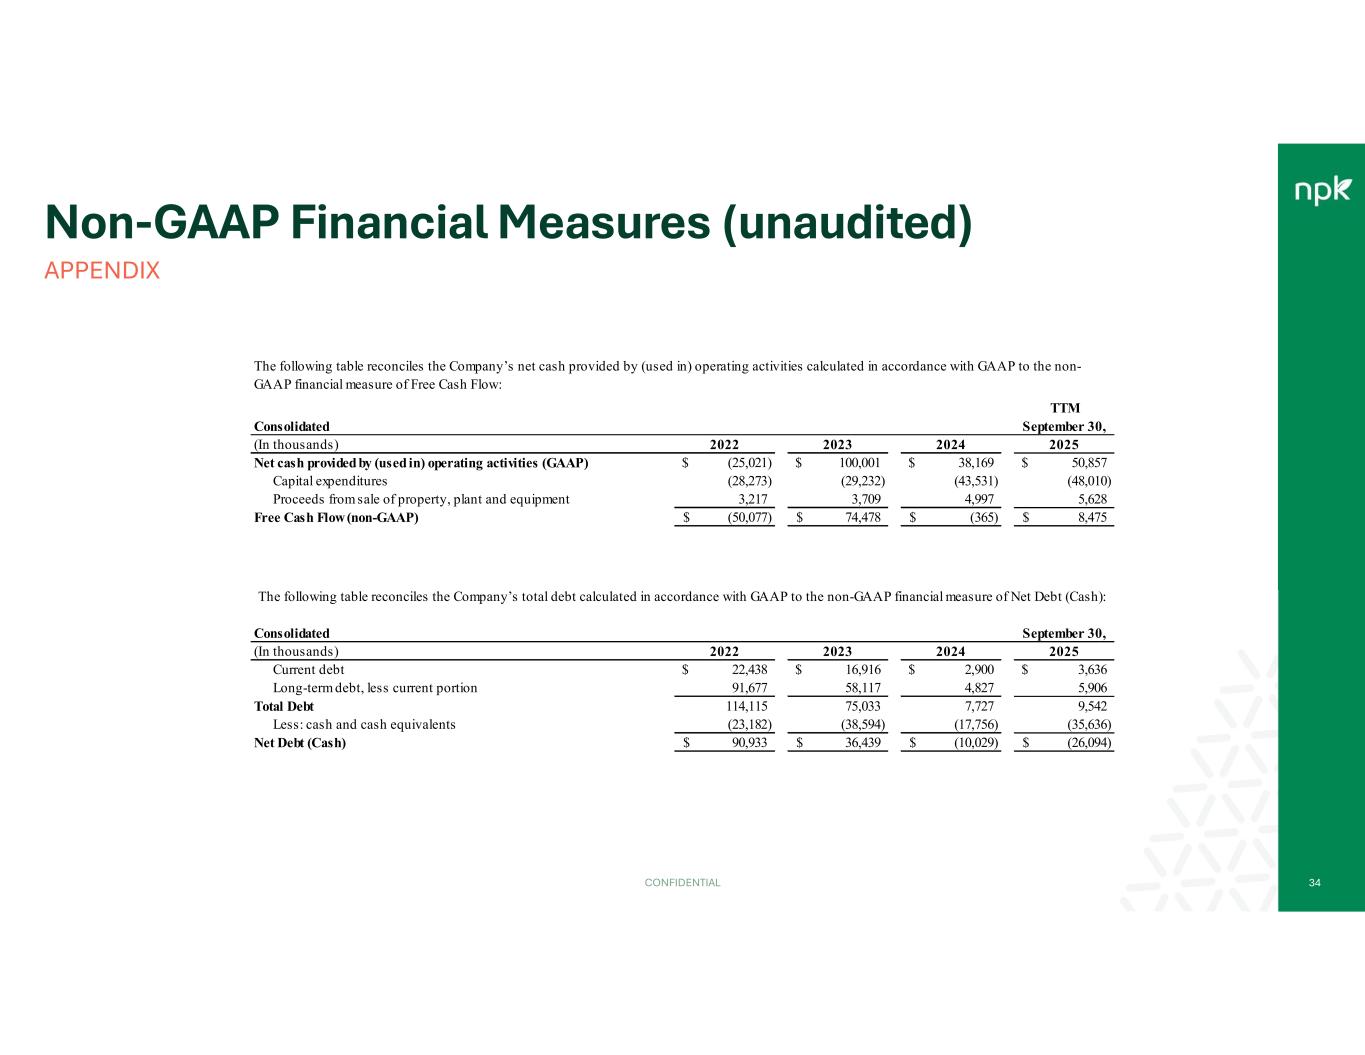
Non-GAAP Financial Measures (unaudited) APPENDIX CONFIDENTIAL 34 Consolidated (In thousands) 2022 2023 2024 2025 Net cash provided by (used in) operating activities (GAAP) (25,021)$ 100,001$ 38,169$ 50,857$ Capital expenditures (28,273) (29,232) (43,531) (48,010) Proceeds from sale of property, plant and equipment 3,217 3,709 4,997 5,628 Free Cash Flow (non-GAAP) (50,077)$ 74,478$ (365)$ 8,475$ TTM September 30, The following table reconciles the Company’s net cash provided by (used in) operating activities calculated in accordance with GAAP to the non- GAAP financial measure of Free Cash Flow: Consolidated (In thousands) 2022 2023 2024 2025 Current debt 22,438$ 16,916$ 2,900$ 3,636$ Long-term debt, less current portion 91,677 58,117 4,827 5,906 Total Debt 114,115 75,033 7,727 9,542 Less: cash and cash equivalents (23,182) (38,594) (17,756) (35,636) Net Debt (Cash) 90,933$ 36,439$ (10,029)$ (26,094)$ September 30, The following table reconciles the Company’s total debt calculated in accordance with GAAP to the non-GAAP financial measure of Net Debt (Cash):