
© 2026 Wells Fargo Bank, N.A. All rights reserved. 3Q26 Financial Results October 13, 2026 .3
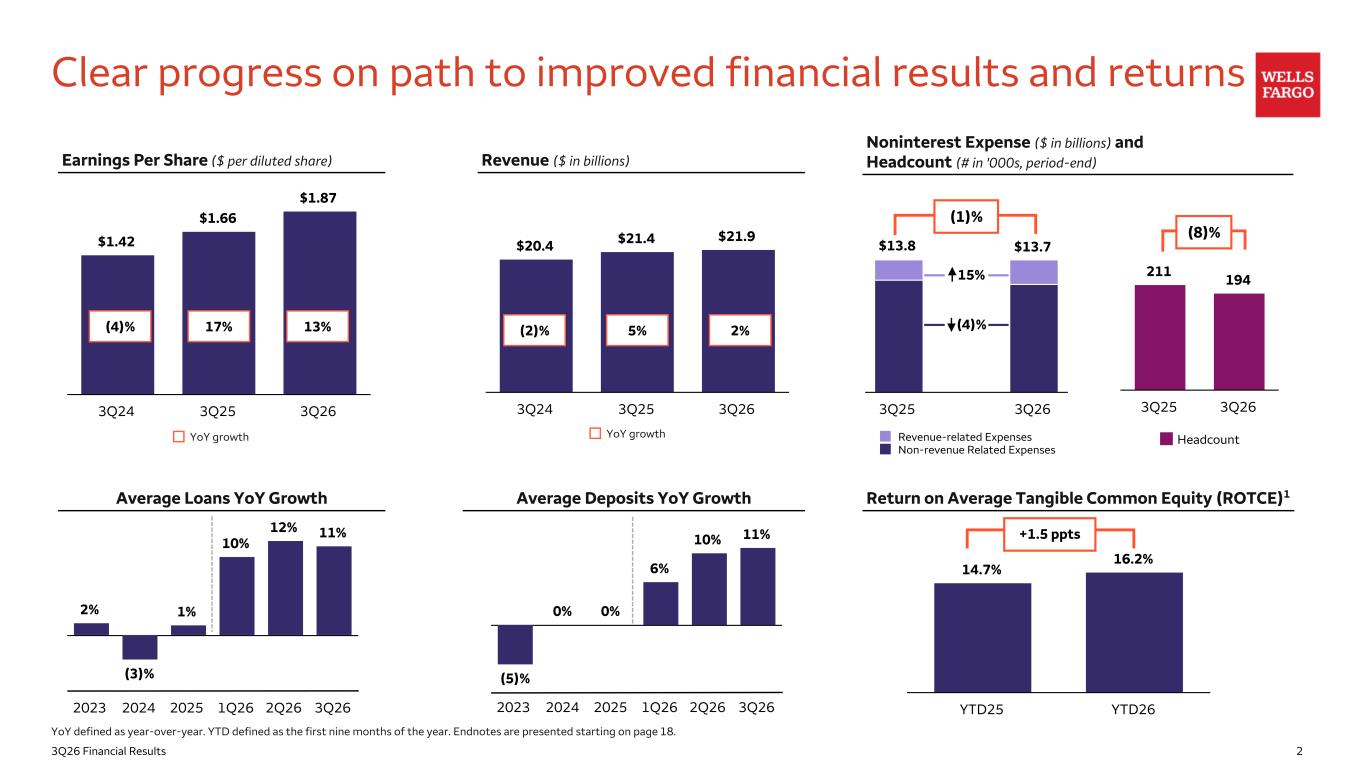
23Q26 Financial Results 14.7% 16.2% YTD25 YTD26 $13.8 $13.7 Revenue-related Expenses Non-revenue Related Expenses 3Q25 3Q26 211 194 Headcount 3Q25 3Q26 Clear progress on path to improved financial results and returns Earnings Per Share ($ per diluted share) $20.4 $21.4 $21.9 3Q24 3Q25 3Q26 Return on Average Tangible Common Equity (ROTCE)1 Noninterest Expense ($ in billions) and Headcount (# in '000s, period-end) YoY defined as year-over-year. YTD defined as the first nine months of the year. Endnotes are presented starting on page 18. Revenue ($ in billions) $1.42 $1.66 $1.87 3Q24 3Q25 3Q26 (4)% 17% 13% (2)% 5% 2% +1.5 ppts Average Loans YoY Growth Average Deposits YoY Growth 2% (3)% 1% 10% 12% 11% 2023 2024 2025 1Q26 2Q26 3Q26 (5)% 0% 0% 6% 10% 11% 2023 2024 2025 1Q26 2Q26 3Q26 (8)% (1)% (4)% 15% YoY growth YoY growth
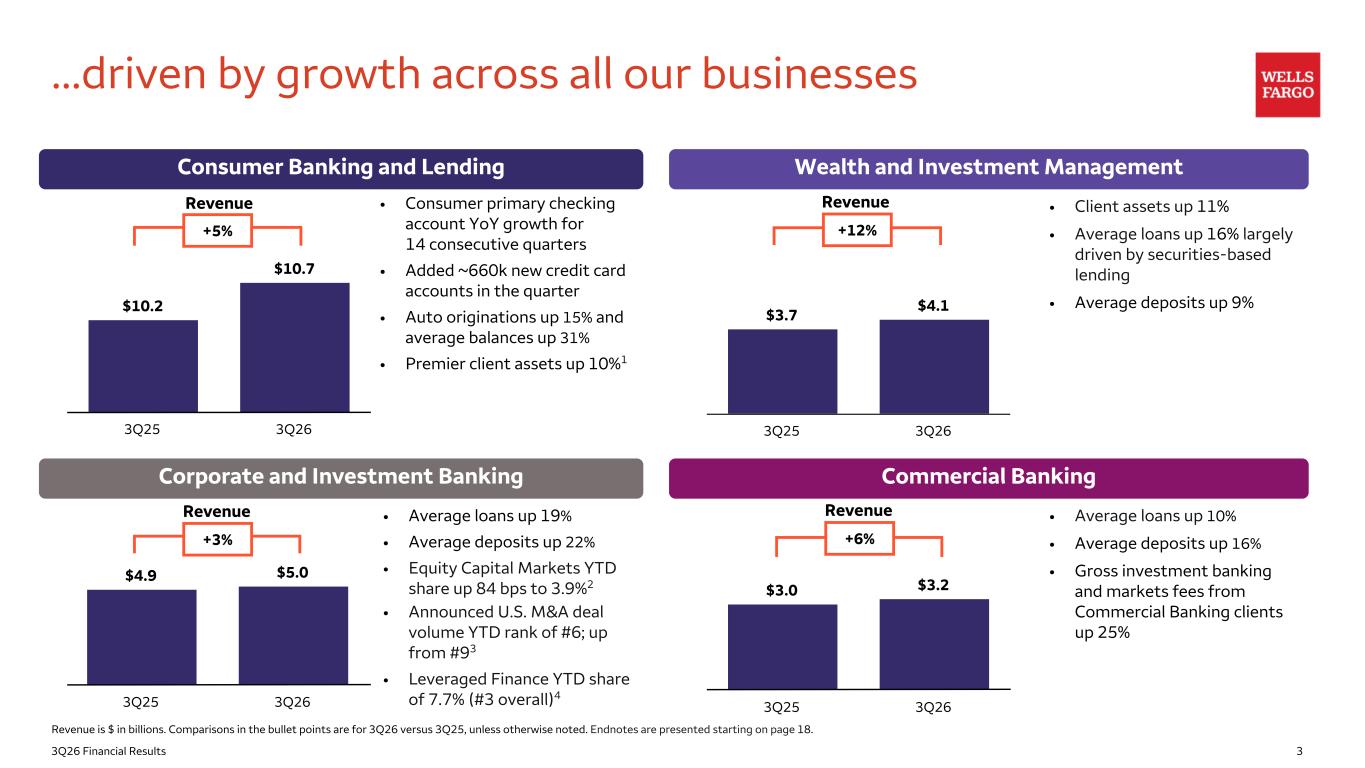
33Q26 Financial Results $10.2 $10.7 3Q25 3Q26 $4.9 $5.0 3Q25 3Q26 $3.0 $3.2 3Q25 3Q26 $3.7 $4.1 3Q25 3Q26 ...driven by growth across all our businesses Consumer Banking and Lending Corporate and Investment Banking Wealth and Investment Management Commercial Banking Revenue is $ in billions. Comparisons in the bullet points are for 3Q26 versus 3Q25, unless otherwise noted. Endnotes are presented starting on page 18. • Consumer primary checking account YoY growth for 14 consecutive quarters • Added ~660k new credit card accounts in the quarter • Auto originations up 15% and average balances up 31% • Premier client assets up 10%1 • Average loans up 19% • Average deposits up 22% • Equity Capital Markets YTD share up 84 bps to 3.9%2 • Announced U.S. M&A deal volume YTD rank of #6; up from #93 • Leveraged Finance YTD share of 7.7% (#3 overall)4 • Client assets up 11% • Average loans up 16% largely driven by securities-based lending • Average deposits up 9% • Average loans up 10% • Average deposits up 16% • Gross investment banking and markets fees from Commercial Banking clients up 25% +5% Revenue +3% Revenue Revenue +12% Revenue +6%
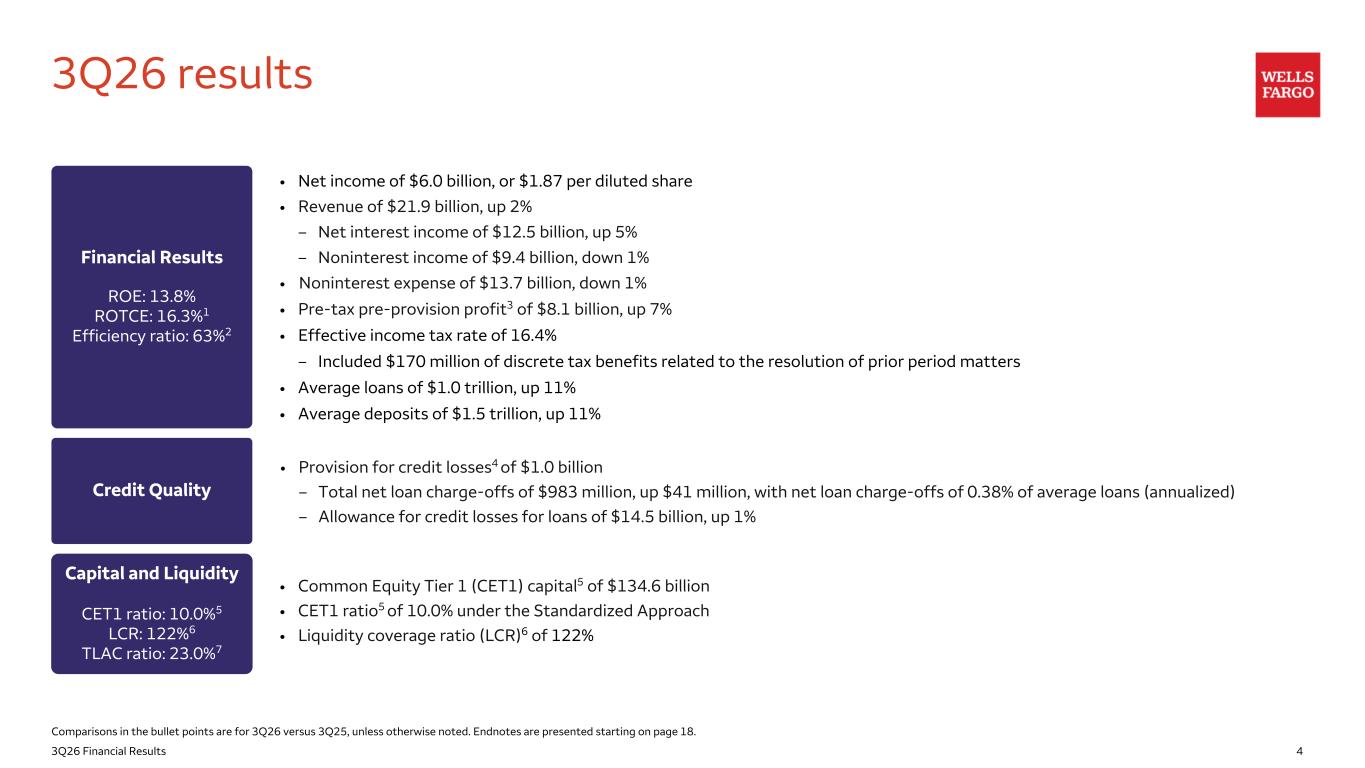
43Q26 Financial Results 3Q26 results Financial Results ROE: 13.8% ROTCE: 16.3%1 Efficiency ratio: 63%2 Credit Quality Capital and Liquidity CET1 ratio: 10.0%5 LCR: 122%6 TLAC ratio: 23.0%7 • Provision for credit losses4 of $1.0 billion – Total net loan charge-offs of $983 million, up $41 million, with net loan charge-offs of 0.38% of average loans (annualized) – Allowance for credit losses for loans of $14.5 billion, up 1% • Common Equity Tier 1 (CET1) capital5 of $134.6 billion • CET1 ratio5 of 10.0% under the Standardized Approach • Liquidity coverage ratio (LCR)6 of 122% • Net income of $6.0 billion, or $1.87 per diluted share • Revenue of $21.9 billion, up 2% – Net interest income of $12.5 billion, up 5% – Noninterest income of $9.4 billion, down 1% • Noninterest expense of $13.7 billion, down 1% • Pre-tax pre-provision profit3 of $8.1 billion, up 7% • Effective income tax rate of 16.4% – Included $170 million of discrete tax benefits related to the resolution of prior period matters • Average loans of $1.0 trillion, up 11% • Average deposits of $1.5 trillion, up 11% Comparisons in the bullet points are for 3Q26 versus 3Q25, unless otherwise noted. Endnotes are presented starting on page 18.
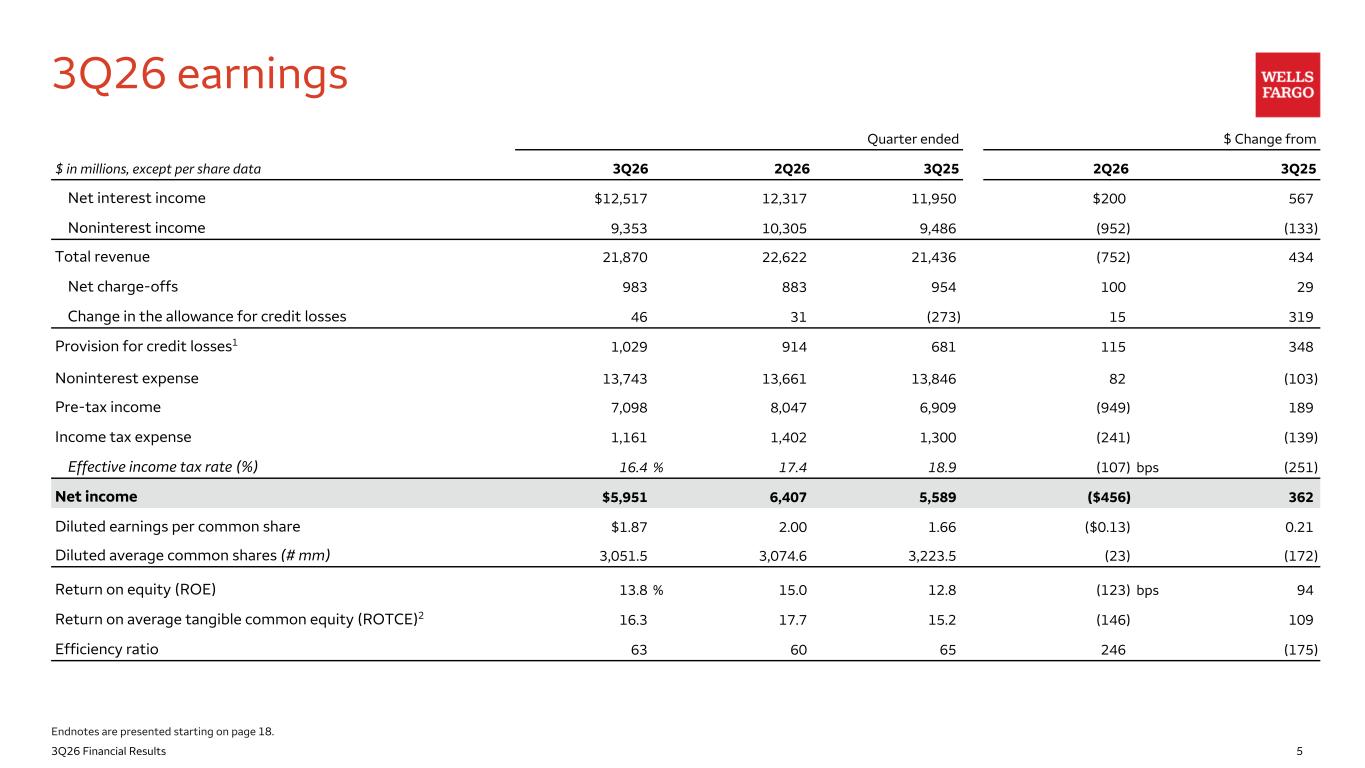
53Q26 Financial Results 3Q26 earnings Quarter ended $ Change from $ in millions, except per share data 3Q26 2Q26 3Q25 2Q26 3Q25 Net interest income $12,517 12,317 11,950 $200 567 Noninterest income 9,353 10,305 9,486 (952) (133) Total revenue 21,870 22,622 21,436 (752) 434 Net charge-offs 983 883 954 100 29 Change in the allowance for credit losses 46 31 (273) 15 319 Provision for credit losses1 1,029 914 681 115 348 Noninterest expense 13,743 13,661 13,846 82 (103) Pre-tax income 7,098 8,047 6,909 (949) 189 Income tax expense 1,161 1,402 1,300 (241) (139) Effective income tax rate (%) 16.4 % 17.4 18.9 (107) bps (251) Net income $5,951 6,407 5,589 ($456) 362 Diluted earnings per common share $1.87 2.00 1.66 ($0.13) 0.21 Diluted average common shares (# mm) 3,051.5 3,074.6 3,223.5 (23) (172) Return on equity (ROE) 13.8 % 15.0 12.8 (123) bps 94 Return on average tangible common equity (ROTCE)2 16.3 17.7 15.2 (146) 109 Efficiency ratio 63 60 65 246 (175) Endnotes are presented starting on page 18.
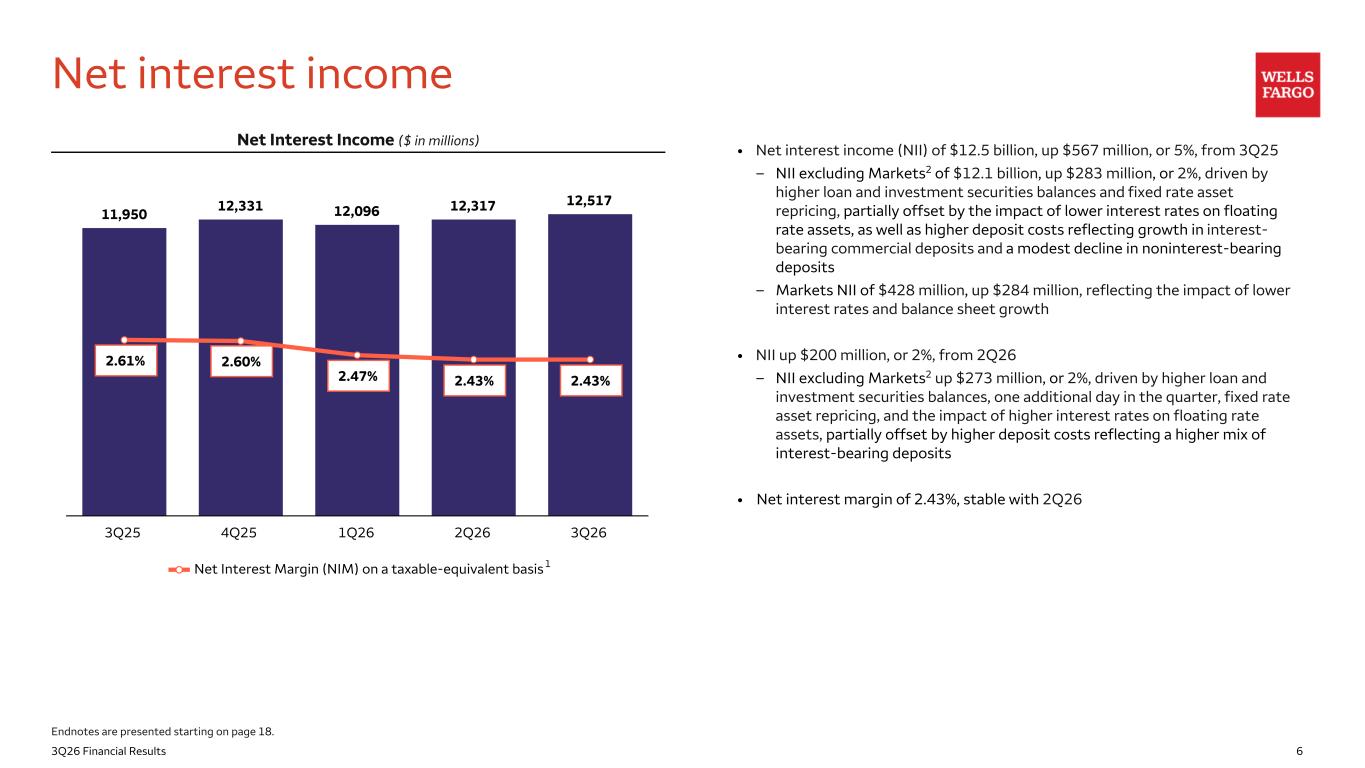
63Q26 Financial Results Net Interest Income ($ in millions) 11,950 12,331 12,096 12,317 12,517 Net Interest Margin (NIM) on a taxable-equivalent basis 3Q25 4Q25 1Q26 2Q26 3Q26 2.43% Net interest income • Net interest income (NII) of $12.5 billion, up $567 million, or 5%, from 3Q25 – NII excluding Markets2 of $12.1 billion, up $283 million, or 2%, driven by higher loan and investment securities balances and fixed rate asset repricing, partially offset by the impact of lower interest rates on floating rate assets, as well as higher deposit costs reflecting growth in interest- bearing commercial deposits and a modest decline in noninterest-bearing deposits – Markets NII of $428 million, up $284 million, reflecting the impact of lower interest rates and balance sheet growth • NII up $200 million, or 2%, from 2Q26 – NII excluding Markets2 up $273 million, or 2%, driven by higher loan and investment securities balances, one additional day in the quarter, fixed rate asset repricing, and the impact of higher interest rates on floating rate assets, partially offset by higher deposit costs reflecting a higher mix of interest-bearing deposits • Net interest margin of 2.43%, stable with 2Q26 2.61% 2.60% 2.47% 2.43% 1 Endnotes are presented starting on page 18.
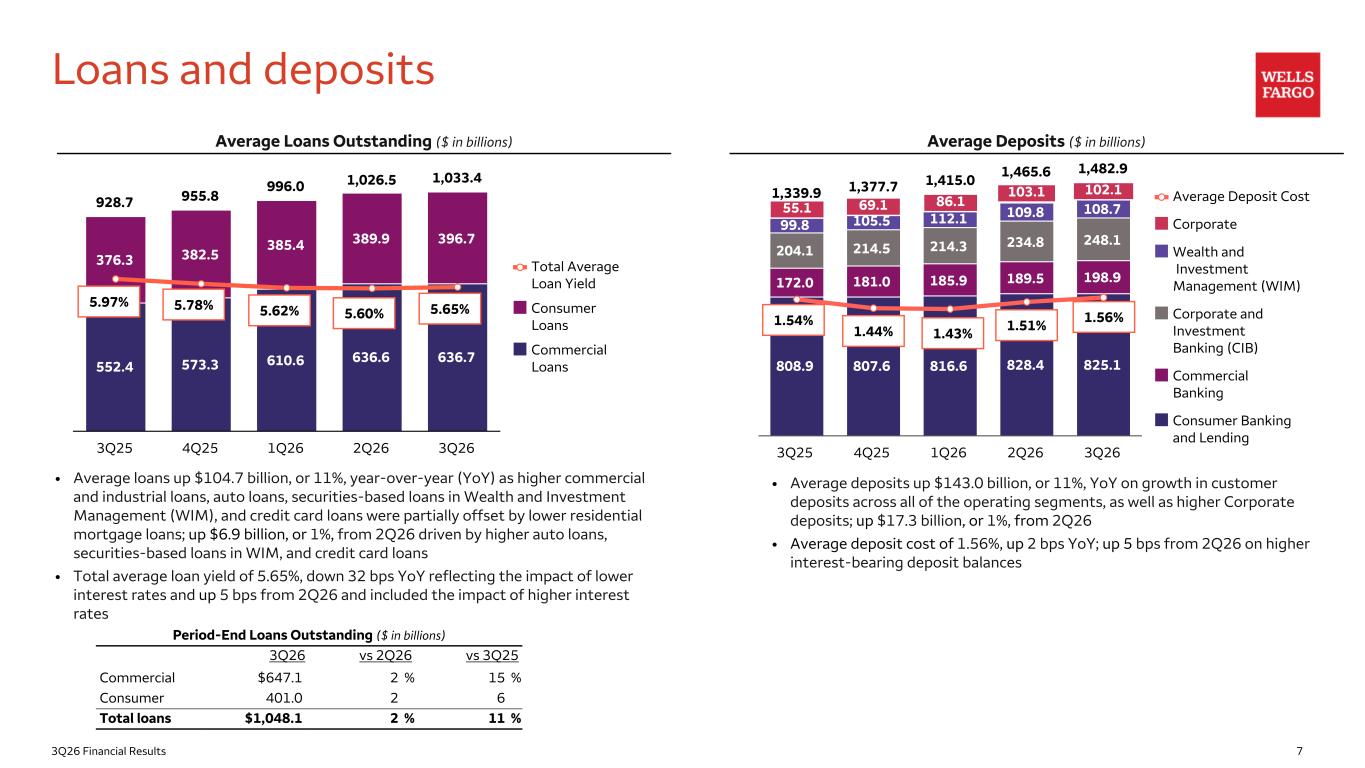
73Q26 Financial Results Loans and deposits • Average loans up $104.7 billion, or 11%, year-over-year (YoY) as higher commercial and industrial loans, auto loans, securities-based loans in Wealth and Investment Management (WIM), and credit card loans were partially offset by lower residential mortgage loans; up $6.9 billion, or 1%, from 2Q26 driven by higher auto loans, securities-based loans in WIM, and credit card loans • Total average loan yield of 5.65%, down 32 bps YoY reflecting the impact of lower interest rates and up 5 bps from 2Q26 and included the impact of higher interest rates Average Loans Outstanding ($ in billions) 928.7 955.8 996.0 1,026.5 1,033.4 552.4 573.3 610.6 636.6 636.7 376.3 382.5 385.4 389.9 396.7 Total Average Loan Yield Consumer Loans Commercial Loans 3Q25 4Q25 1Q26 2Q26 3Q26 5.97% 5.78% 5.62% 5.60% 5.65% Average Deposits ($ in billions) 1,339.9 1,377.7 1,415.0 1,465.6 1,482.9 808.9 807.6 816.6 828.4 825.1 172.0 181.0 185.9 189.5 198.9 204.1 214.5 214.3 234.8 248.1 99.8 105.5 112.1 109.8 108.7 Average Deposit Cost Corporate Wealth and Investment Management (WIM) Corporate and Investment Banking (CIB) Commercial Banking Consumer Banking and Lending 3Q25 4Q25 1Q26 2Q26 3Q26 Period-End Loans Outstanding ($ in billions) 3Q26 vs 2Q26 vs 3Q25 Commercial $647.1 2 % 15 % Consumer 401.0 2 6 Total loans $1,048.1 2 % 11 % • Average deposits up $143.0 billion, or 11%, YoY on growth in customer deposits across all of the operating segments, as well as higher Corporate deposits; up $17.3 billion, or 1%, from 2Q26 • Average deposit cost of 1.56%, up 2 bps YoY; up 5 bps from 2Q26 on higher interest-bearing deposit balances 102.1103.1 86.169.155.1 1.56%1.51%1.43%1.44% 1.54%
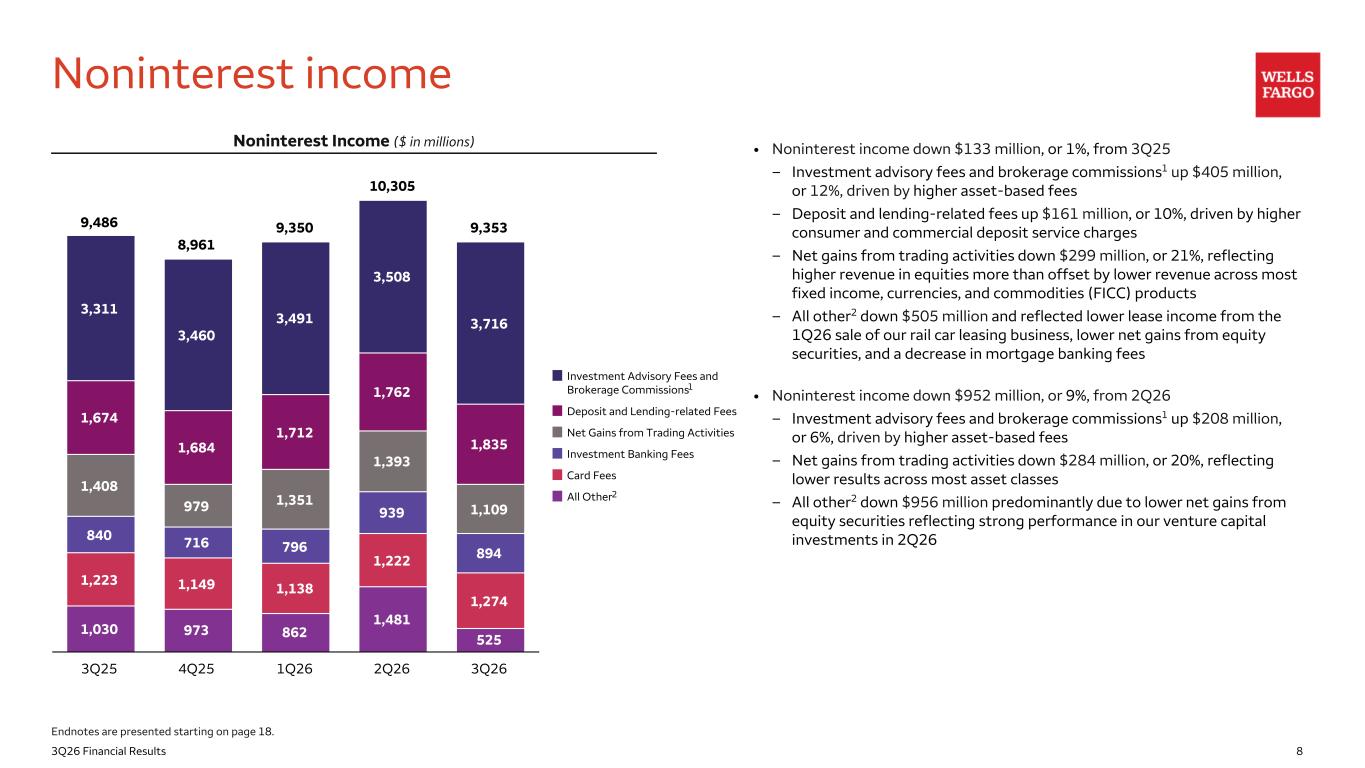
83Q26 Financial Results 9,486 8,961 9,350 10,305 9,353 1,030 973 862 1,481 525 1,223 1,149 1,138 1,222 1,274 840 716 796 939 894 1,408 979 1,351 1,393 1,109 1,674 1,684 1,712 1,762 1,835 3,311 3,460 3,491 3,508 3,716 Investment Advisory Fees and Brokerage Commissions Deposit and Lending-related Fees Net Gains from Trading Activities Investment Banking Fees Card Fees All Other 3Q25 4Q25 1Q26 2Q26 3Q26 Noninterest Income ($ in millions) • Noninterest income down $133 million, or 1%, from 3Q25 – Investment advisory fees and brokerage commissions1 up $405 million, or 12%, driven by higher asset-based fees – Deposit and lending-related fees up $161 million, or 10%, driven by higher consumer and commercial deposit service charges – Net gains from trading activities down $299 million, or 21%, reflecting higher revenue in equities more than offset by lower revenue across most fixed income, currencies, and commodities (FICC) products – All other2 down $505 million and reflected lower lease income from the 1Q26 sale of our rail car leasing business, lower net gains from equity securities, and a decrease in mortgage banking fees • Noninterest income down $952 million, or 9%, from 2Q26 – Investment advisory fees and brokerage commissions1 up $208 million, or 6%, driven by higher asset-based fees – Net gains from trading activities down $284 million, or 20%, reflecting lower results across most asset classes – All other2 down $956 million predominantly due to lower net gains from equity securities reflecting strong performance in our venture capital investments in 2Q26 Noninterest income 2 1 Endnotes are presented starting on page 18.
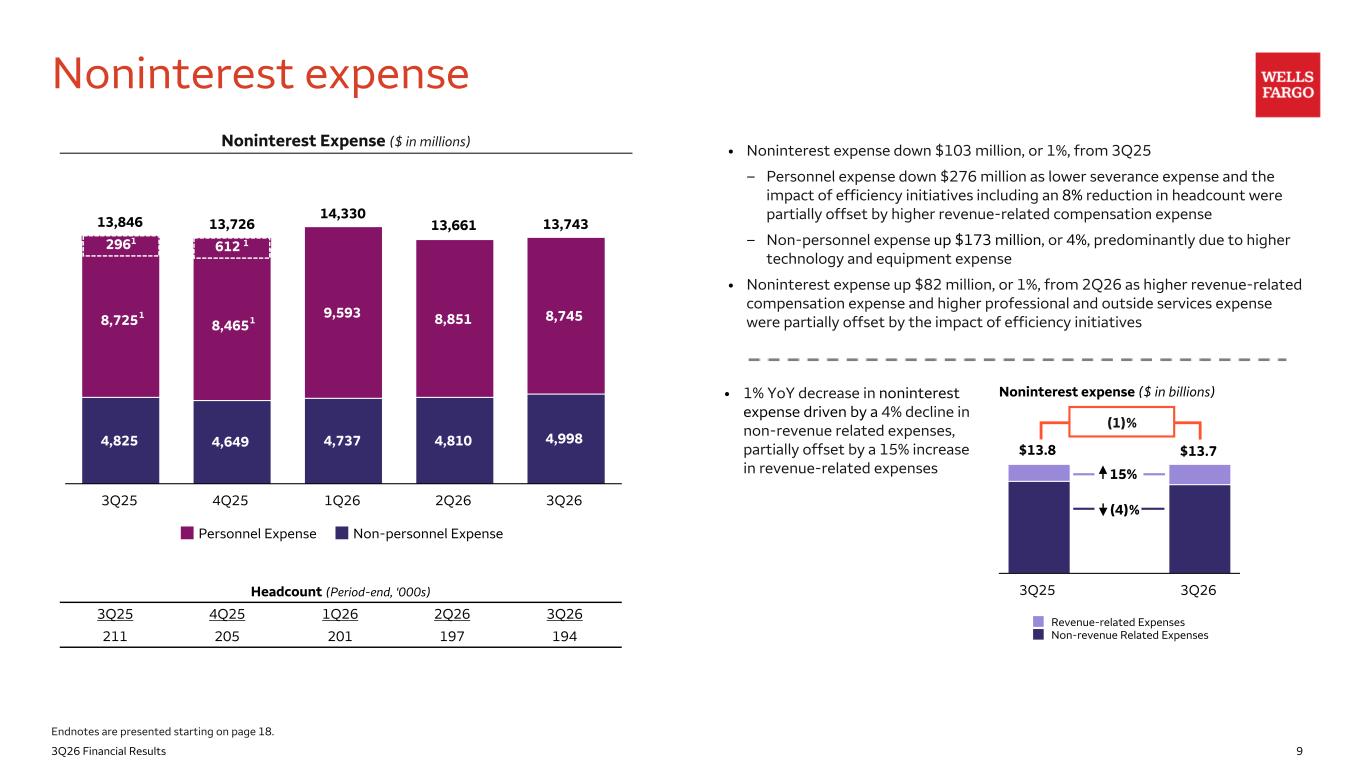
93Q26 Financial Results 13,846 13,726 14,330 13,661 13,743 4,825 4,649 4,737 4,810 4,998 8,725 8,465 9,593 8,851 8,745 Personnel Expense Non-personnel Expense 3Q25 4Q25 1Q26 2Q26 3Q26 Noninterest expense • Noninterest expense down $103 million, or 1%, from 3Q25 – Personnel expense down $276 million as lower severance expense and the impact of efficiency initiatives including an 8% reduction in headcount were partially offset by higher revenue-related compensation expense – Non-personnel expense up $173 million, or 4%, predominantly due to higher technology and equipment expense • Noninterest expense up $82 million, or 1%, from 2Q26 as higher revenue-related compensation expense and higher professional and outside services expense were partially offset by the impact of efficiency initiatives Noninterest Expense ($ in millions) Headcount (Period-end, '000s) 3Q25 4Q25 1Q26 2Q26 3Q26 211 205 201 197 194 Endnotes are presented starting on page 18. 1 612 1 1 2961 $13.8 $13.7 Revenue-related Expenses Non-revenue Related Expenses 3Q25 3Q26 (1)% (4)% 15% Noninterest expense ($ in billions)• 1% YoY decrease in noninterest expense driven by a 4% decline in non-revenue related expenses, partially offset by a 15% increase in revenue-related expenses
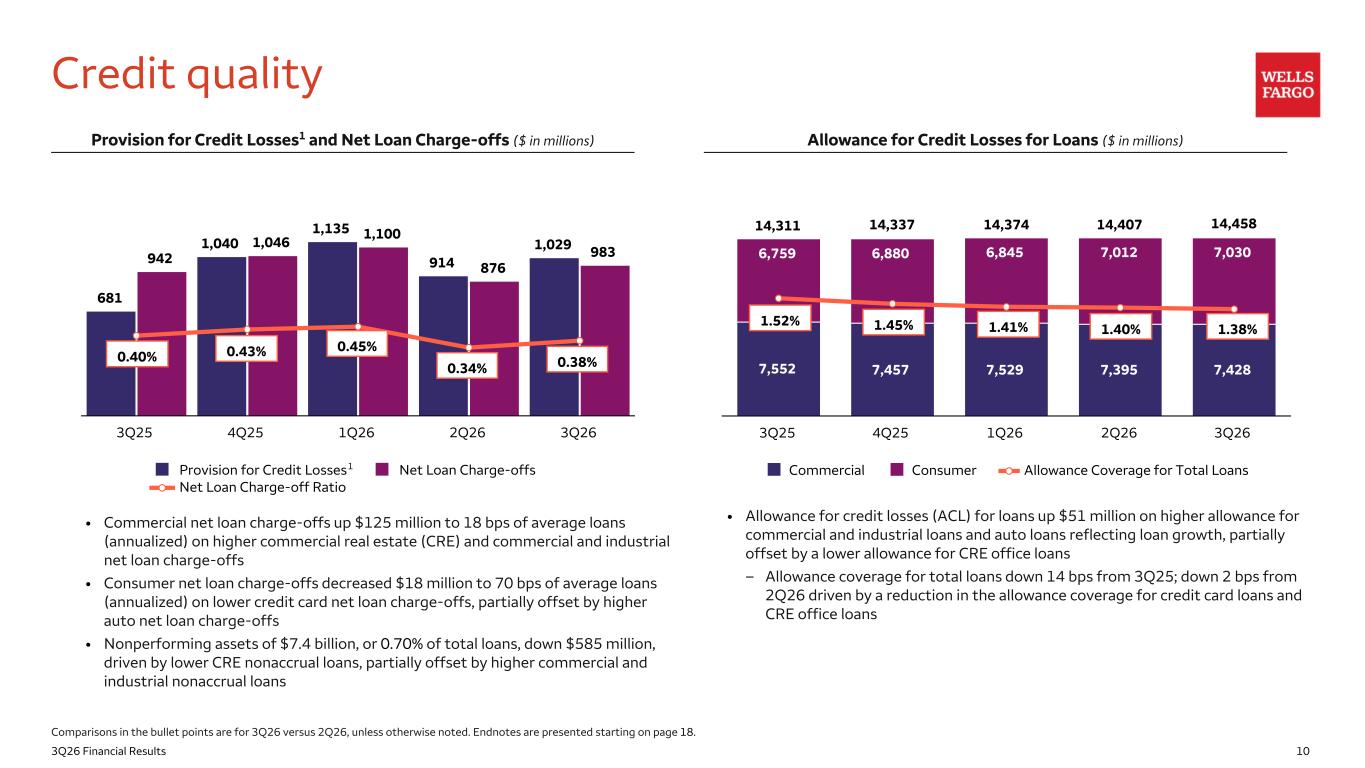
103Q26 Financial Results • Commercial net loan charge-offs up $125 million to 18 bps of average loans (annualized) on higher commercial real estate (CRE) and commercial and industrial net loan charge-offs • Consumer net loan charge-offs decreased $18 million to 70 bps of average loans (annualized) on lower credit card net loan charge-offs, partially offset by higher auto net loan charge-offs • Nonperforming assets of $7.4 billion, or 0.70% of total loans, down $585 million, driven by lower CRE nonaccrual loans, partially offset by higher commercial and industrial nonaccrual loans 681 1,040 1,135 914 1,029 942 1,046 1,100 876 983 Provision for Credit Losses Net Loan Charge-offs Net Loan Charge-off Ratio 3Q25 4Q25 1Q26 2Q26 3Q26 Credit quality Provision for Credit Losses1 and Net Loan Charge-offs ($ in millions) Comparisons in the bullet points are for 3Q26 versus 2Q26, unless otherwise noted. Endnotes are presented starting on page 18. 0.40% 0.43% 0.34% 0.45% 1 0.38% 14,311 14,337 14,374 14,407 14,458 7,552 7,457 7,529 7,395 7,428 6,759 6,880 6,845 7,012 7,030 Commercial Consumer Allowance Coverage for Total Loans 3Q25 4Q25 1Q26 2Q26 3Q26 Allowance for Credit Losses for Loans ($ in millions) • Allowance for credit losses (ACL) for loans up $51 million on higher allowance for commercial and industrial loans and auto loans reflecting loan growth, partially offset by a lower allowance for CRE office loans – Allowance coverage for total loans down 14 bps from 3Q25; down 2 bps from 2Q26 driven by a reduction in the allowance coverage for credit card loans and CRE office loans 1.45%1.52% 1.41% 1.40% 1.38%
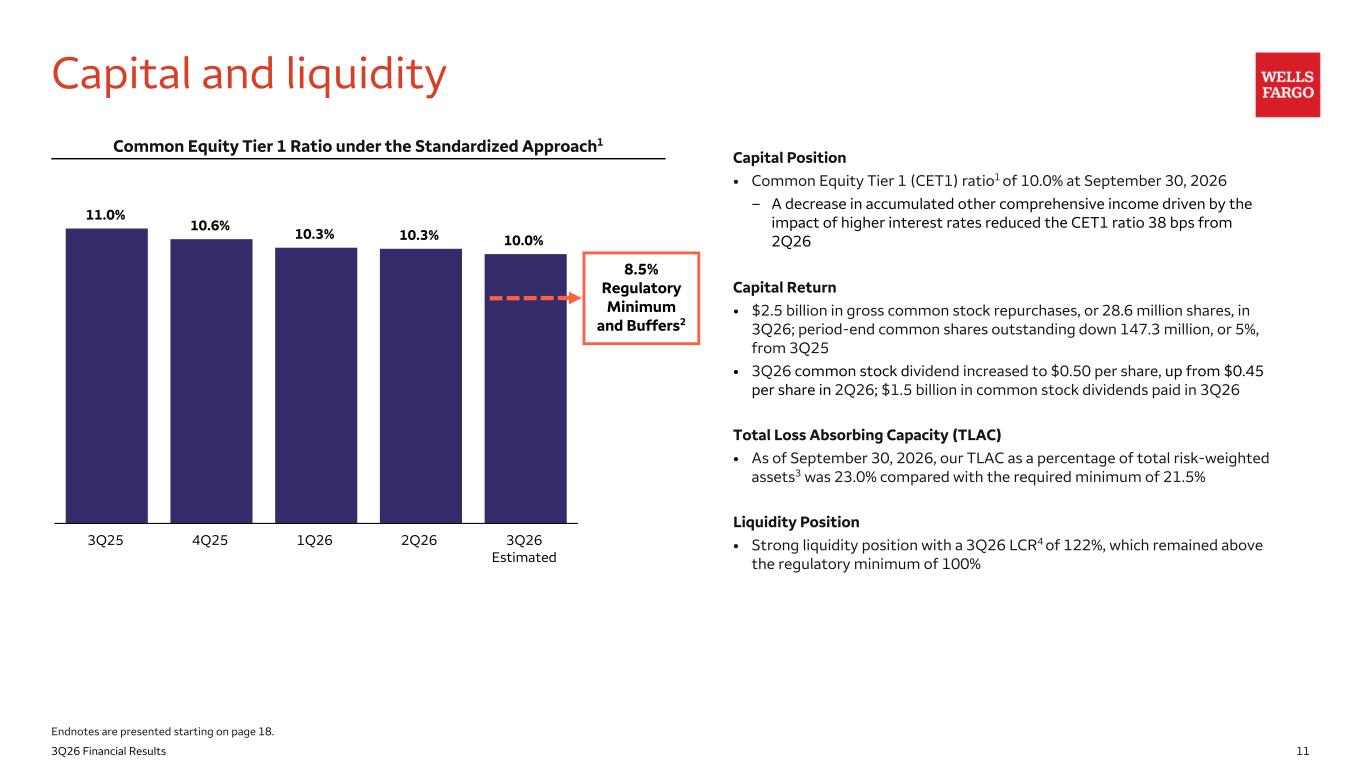
113Q26 Financial Results Capital and liquidity Capital Position • Common Equity Tier 1 (CET1) ratio1 of 10.0% at September 30, 2026 – A decrease in accumulated other comprehensive income driven by the impact of higher interest rates reduced the CET1 ratio 38 bps from 2Q26 Capital Return • $2.5 billion in gross common stock repurchases, or 28.6 million shares, in 3Q26; period-end common shares outstanding down 147.3 million, or 5%, from 3Q25 • 3Q26 common stock dividend increased to $0.50 per share, up from $0.45 per share in 2Q26; $1.5 billion in common stock dividends paid in 3Q26 Total Loss Absorbing Capacity (TLAC) • As of September 30, 2026, our TLAC as a percentage of total risk-weighted assets3 was 23.0% compared with the required minimum of 21.5% Liquidity Position • Strong liquidity position with a 3Q26 LCR4 of 122%, which remained above the regulatory minimum of 100% 11.0% 10.6% 10.3% 10.3% 10.0% 3Q25 4Q25 1Q26 2Q26 3Q26 Estimated 8.5% Regulatory Minimum and Buffers2 Common Equity Tier 1 Ratio under the Standardized Approach1 Endnotes are presented starting on page 18.
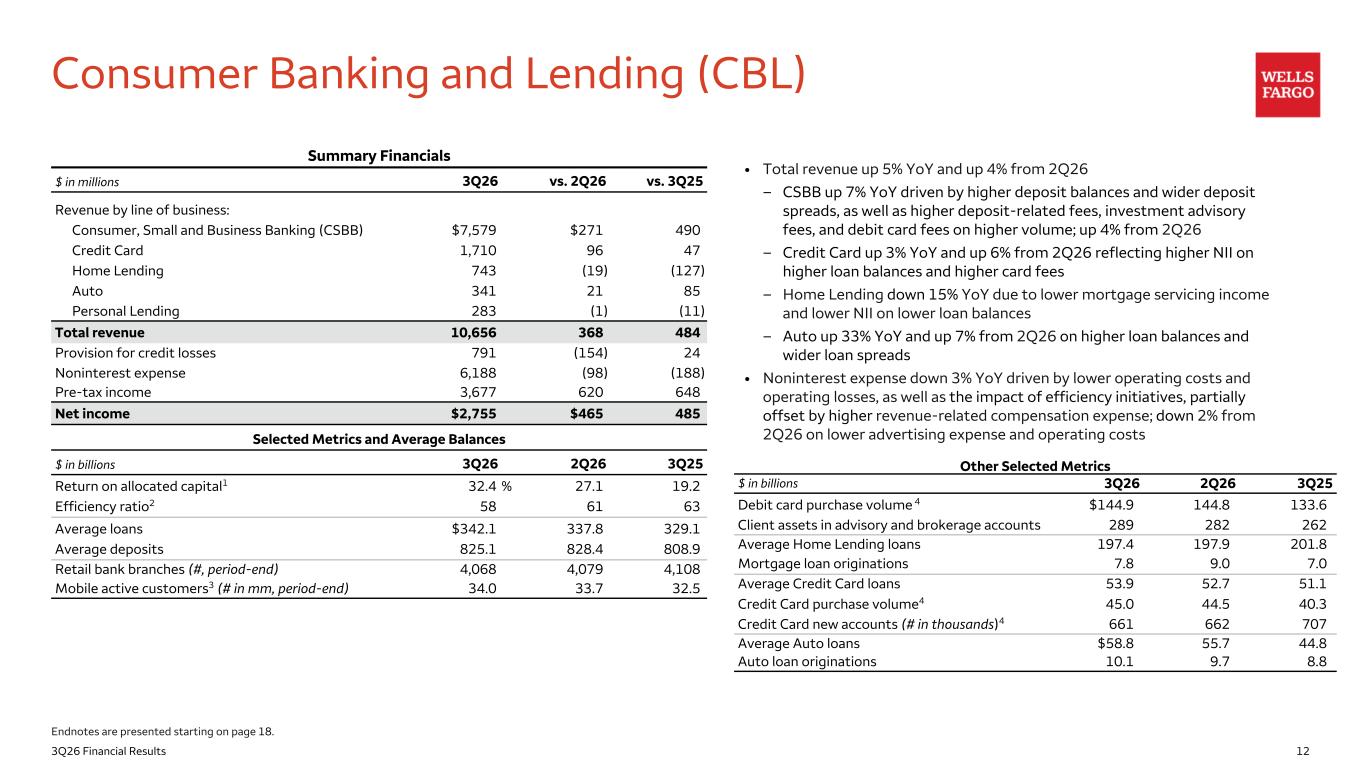
123Q26 Financial Results • Total revenue up 5% YoY and up 4% from 2Q26 – CSBB up 7% YoY driven by higher deposit balances and wider deposit spreads, as well as higher deposit-related fees, investment advisory fees, and debit card fees on higher volume; up 4% from 2Q26 – Credit Card up 3% YoY and up 6% from 2Q26 reflecting higher NII on higher loan balances and higher card fees – Home Lending down 15% YoY due to lower mortgage servicing income and lower NII on lower loan balances – Auto up 33% YoY and up 7% from 2Q26 on higher loan balances and wider loan spreads • Noninterest expense down 3% YoY driven by lower operating costs and operating losses, as well as the impact of efficiency initiatives, partially offset by higher revenue-related compensation expense; down 2% from 2Q26 on lower advertising expense and operating costs Consumer Banking and Lending (CBL) Summary Financials $ in millions 3Q26 vs. 2Q26 vs. 3Q25 Revenue by line of business: Consumer, Small and Business Banking (CSBB) $7,579 $271 490 Credit Card 1,710 96 47 Home Lending 743 (19) (127) Auto 341 21 85 Personal Lending 283 (1) (11) Total revenue 10,656 368 484 Provision for credit losses 791 (154) 24 Noninterest expense 6,188 (98) (188) Pre-tax income 3,677 620 648 Net income $2,755 $465 485 Selected Metrics and Average Balances $ in billions 3Q26 2Q26 3Q25 Return on allocated capital1 32.4 % 27.1 19.2 Efficiency ratio2 58 61 63 Average loans $342.1 337.8 329.1 Average deposits 825.1 828.4 808.9 Retail bank branches (#, period-end) 4,068 4,079 4,108 Mobile active customers3 (# in mm, period-end) 34.0 33.7 32.5 Other Selected Metrics $ in billions 3Q26 2Q26 3Q25 Debit card purchase volume 4 $144.9 144.8 133.6 Client assets in advisory and brokerage accounts 289 282 262 Average Home Lending loans 197.4 197.9 201.8 Mortgage loan originations 7.8 9.0 7.0 Average Credit Card loans 53.9 52.7 51.1 Credit Card purchase volume4 45.0 44.5 40.3 Credit Card new accounts (# in thousands)4 661 662 707 Average Auto loans $58.8 55.7 44.8 Auto loan originations 10.1 9.7 8.8 Endnotes are presented starting on page 18.
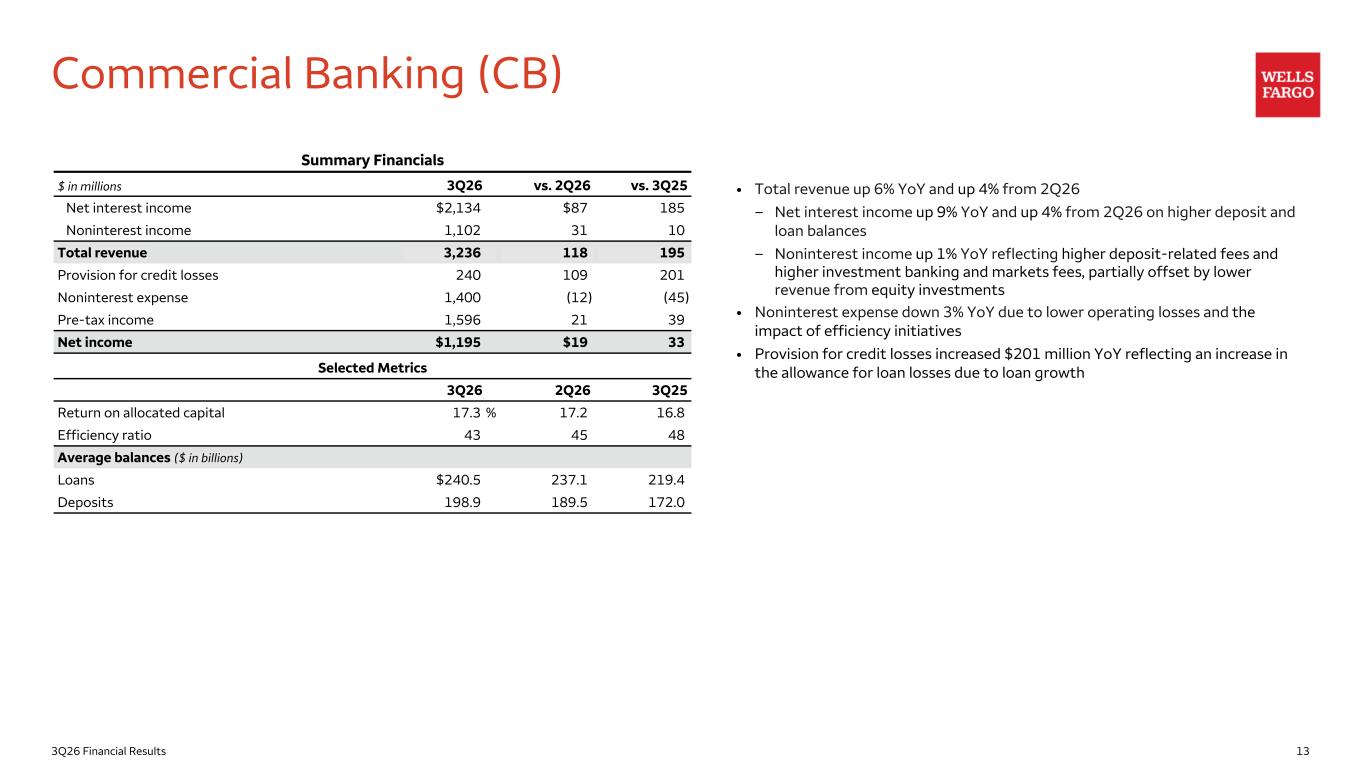
133Q26 Financial Results Commercial Banking (CB) • Total revenue up 6% YoY and up 4% from 2Q26 – Net interest income up 9% YoY and up 4% from 2Q26 on higher deposit and loan balances – Noninterest income up 1% YoY reflecting higher deposit-related fees and higher investment banking and markets fees, partially offset by lower revenue from equity investments • Noninterest expense down 3% YoY due to lower operating losses and the impact of efficiency initiatives • Provision for credit losses increased $201 million YoY reflecting an increase in the allowance for loan losses due to loan growth Summary Financials $ in millions 3Q26 vs. 2Q26 vs. 3Q25 Net interest income $2,134 $87 185 Noninterest income 1,102 31 10 Total revenue 3,236 118 195 Provision for credit losses 240 109 201 Noninterest expense 1,400 (12) (45) Pre-tax income 1,596 21 39 Net income $1,195 $19 33 Selected Metrics 3Q26 2Q26 3Q25 Return on allocated capital 17.3 % 17.2 16.8 Efficiency ratio 43 45 48 Average balances ($ in billions) Loans $240.5 237.1 219.4 Deposits 198.9 189.5 172.0
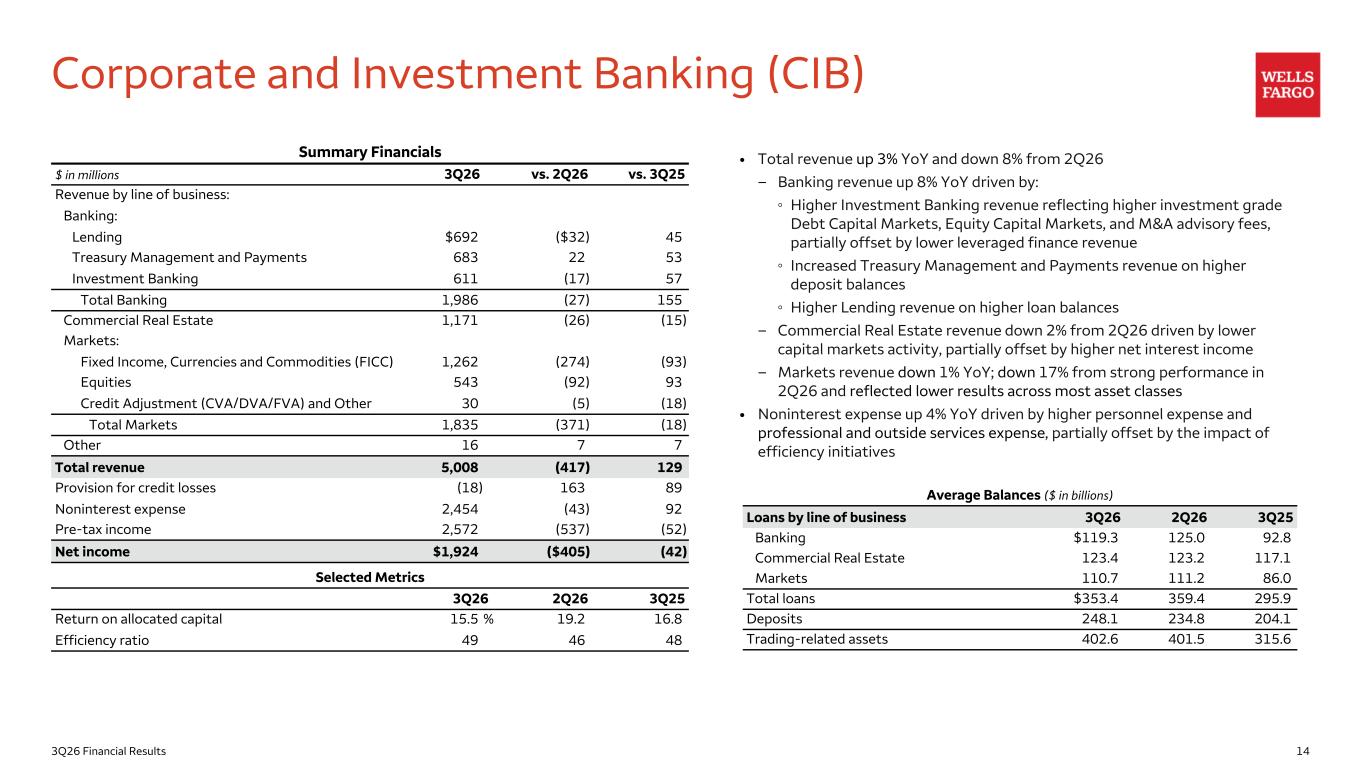
143Q26 Financial Results Corporate and Investment Banking (CIB) • Total revenue up 3% YoY and down 8% from 2Q26 – Banking revenue up 8% YoY driven by: ◦ Higher Investment Banking revenue reflecting higher investment grade Debt Capital Markets, Equity Capital Markets, and M&A advisory fees, partially offset by lower leveraged finance revenue ◦ Increased Treasury Management and Payments revenue on higher deposit balances ◦ Higher Lending revenue on higher loan balances – Commercial Real Estate revenue down 2% from 2Q26 driven by lower capital markets activity, partially offset by higher net interest income – Markets revenue down 1% YoY; down 17% from strong performance in 2Q26 and reflected lower results across most asset classes • Noninterest expense up 4% YoY driven by higher personnel expense and professional and outside services expense, partially offset by the impact of efficiency initiatives Summary Financials $ in millions 3Q26 vs. 2Q26 vs. 3Q25 Revenue by line of business: Banking: Lending $692 ($32) 45 Treasury Management and Payments 683 22 53 Investment Banking 611 (17) 57 Total Banking 1,986 (27) 155 Commercial Real Estate 1,171 (26) (15) Markets: Fixed Income, Currencies and Commodities (FICC) 1,262 (274) (93) Equities 543 (92) 93 Credit Adjustment (CVA/DVA/FVA) and Other 30 (5) (18) Total Markets 1,835 (371) (18) Other 16 7 7 Total revenue 5,008 (417) 129 Provision for credit losses (18) 163 89 Noninterest expense 2,454 (43) 92 Pre-tax income 2,572 (537) (52) Net income $1,924 ($405) (42) Selected Metrics 3Q26 2Q26 3Q25 Return on allocated capital 15.5 % 19.2 16.8 Efficiency ratio 49 46 48 Average Balances ($ in billions) Loans by line of business 3Q26 2Q26 3Q25 Banking $119.3 125.0 92.8 Commercial Real Estate 123.4 123.2 117.1 Markets 110.7 111.2 86.0 Total loans $353.4 359.4 295.9 Deposits 248.1 234.8 204.1 Trading-related assets 402.6 401.5 315.6
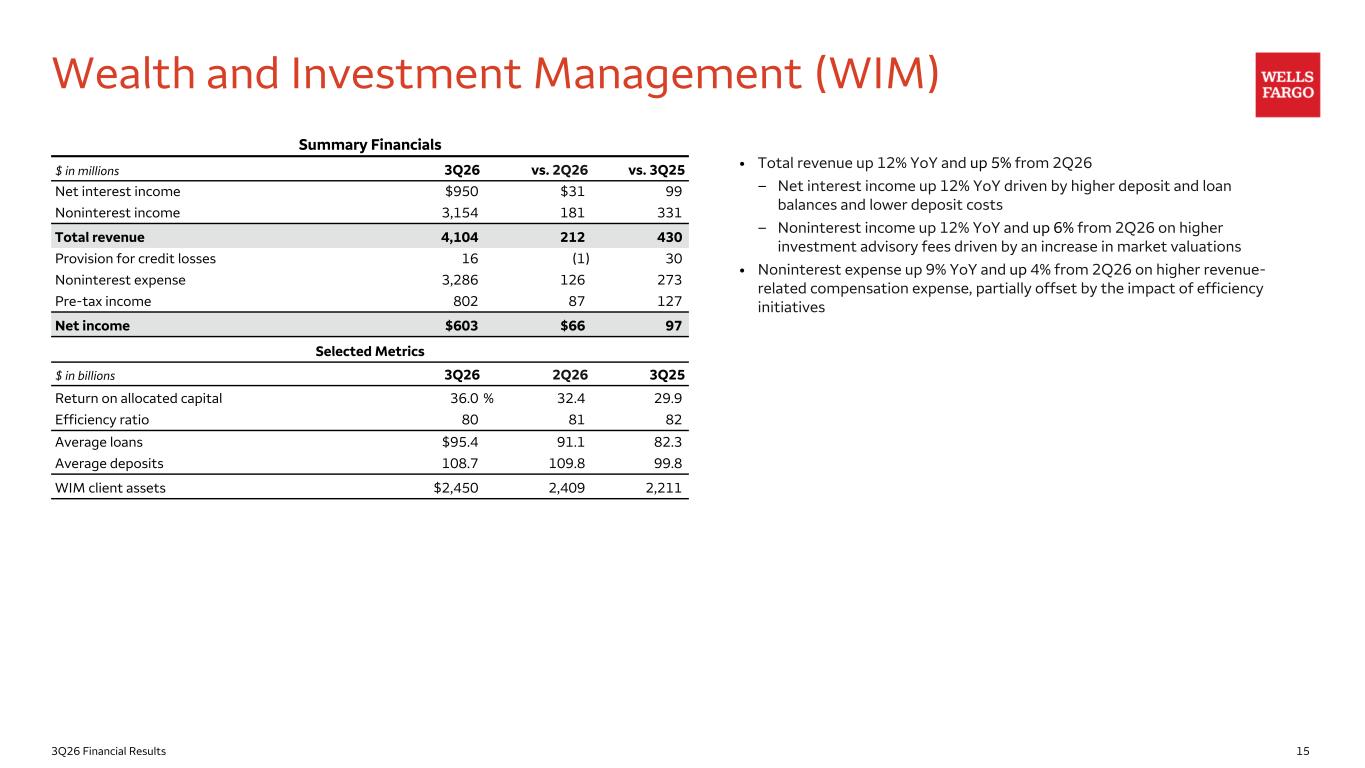
153Q26 Financial Results Wealth and Investment Management (WIM) Summary Financials $ in millions 3Q26 vs. 2Q26 vs. 3Q25 Net interest income $950 $31 99 Noninterest income 3,154 181 331 Total revenue 4,104 212 430 Provision for credit losses 16 (1) 30 Noninterest expense 3,286 126 273 Pre-tax income 802 87 127 Net income $603 $66 97 Selected Metrics $ in billions 3Q26 2Q26 3Q25 Return on allocated capital 36.0 % 32.4 29.9 Efficiency ratio 80 81 82 Average loans $95.4 91.1 82.3 Average deposits 108.7 109.8 99.8 WIM client assets $2,450 2,409 2,211 • Total revenue up 12% YoY and up 5% from 2Q26 – Net interest income up 12% YoY driven by higher deposit and loan balances and lower deposit costs – Noninterest income up 12% YoY and up 6% from 2Q26 on higher investment advisory fees driven by an increase in market valuations • Noninterest expense up 9% YoY and up 4% from 2Q26 on higher revenue- related compensation expense, partially offset by the impact of efficiency initiatives
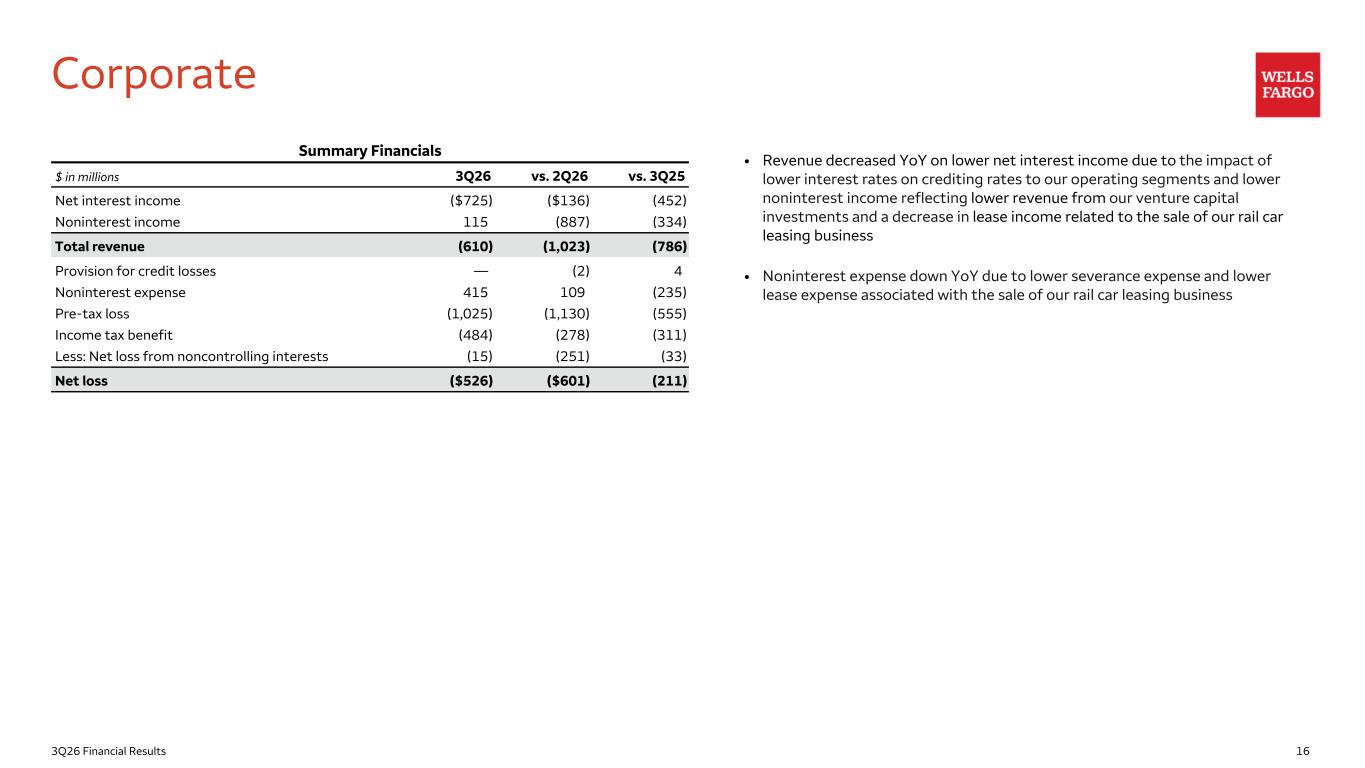
163Q26 Financial Results Corporate • Revenue decreased YoY on lower net interest income due to the impact of lower interest rates on crediting rates to our operating segments and lower noninterest income reflecting lower revenue from our venture capital investments and a decrease in lease income related to the sale of our rail car leasing business • Noninterest expense down YoY due to lower severance expense and lower lease expense associated with the sale of our rail car leasing business Summary Financials $ in millions 3Q26 vs. 2Q26 vs. 3Q25 Net interest income ($725) ($136) (452) Noninterest income 115 (887) (334) Total revenue (610) (1,023) (786) Provision for credit losses — (2) 4 Noninterest expense 415 109 (235) Pre-tax loss (1,025) (1,130) (555) Income tax benefit (484) (278) (311) Less: Net loss from noncontrolling interests (15) (251) (33) Net loss ($526) ($601) (211)
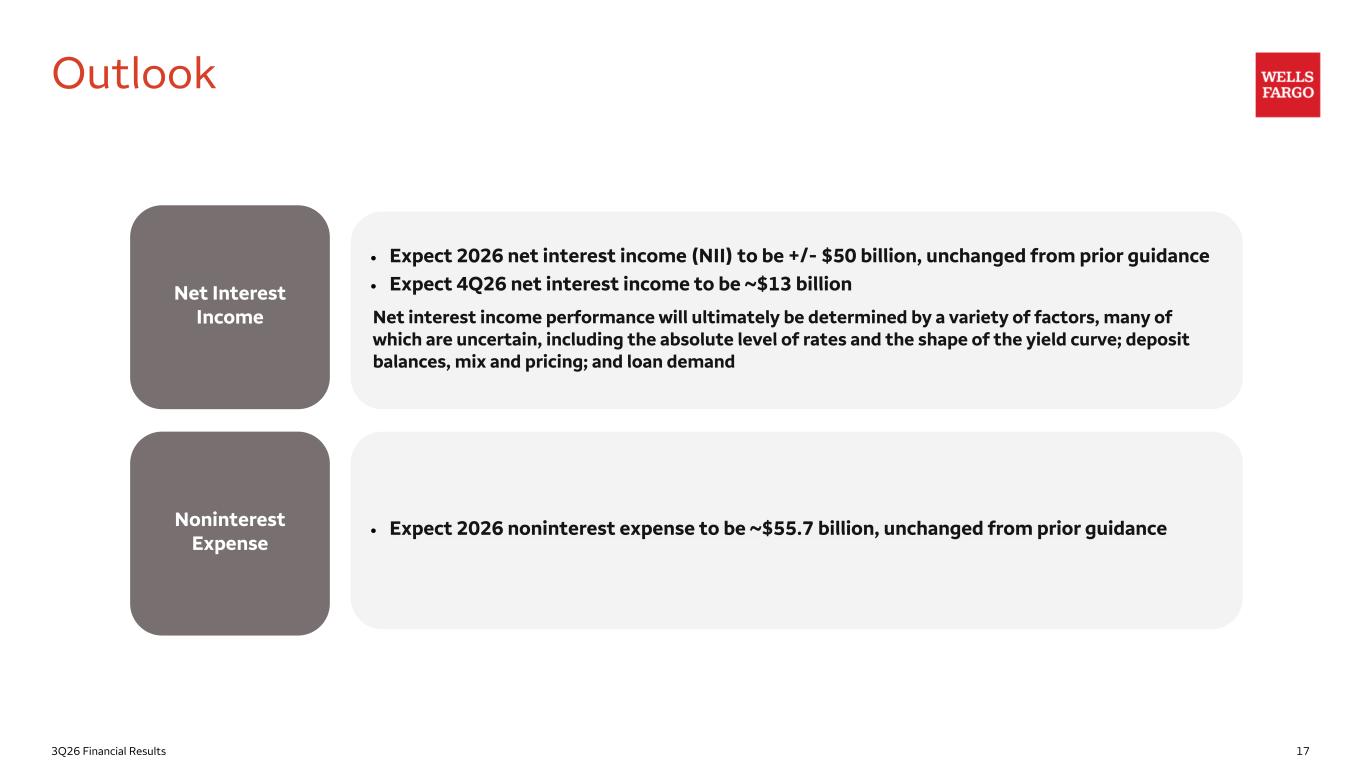
173Q26 Financial Results Outlook Net Interest Income Noninterest Expense • Expect 2026 net interest income (NII) to be +/- $50 billion, unchanged from prior guidance • Expect 4Q26 net interest income to be ~$13 billion Net interest income performance will ultimately be determined by a variety of factors, many of which are uncertain, including the absolute level of rates and the shape of the yield curve; deposit balances, mix and pricing; and loan demand • Expect 2026 noninterest expense to be ~$55.7 billion, unchanged from prior guidance
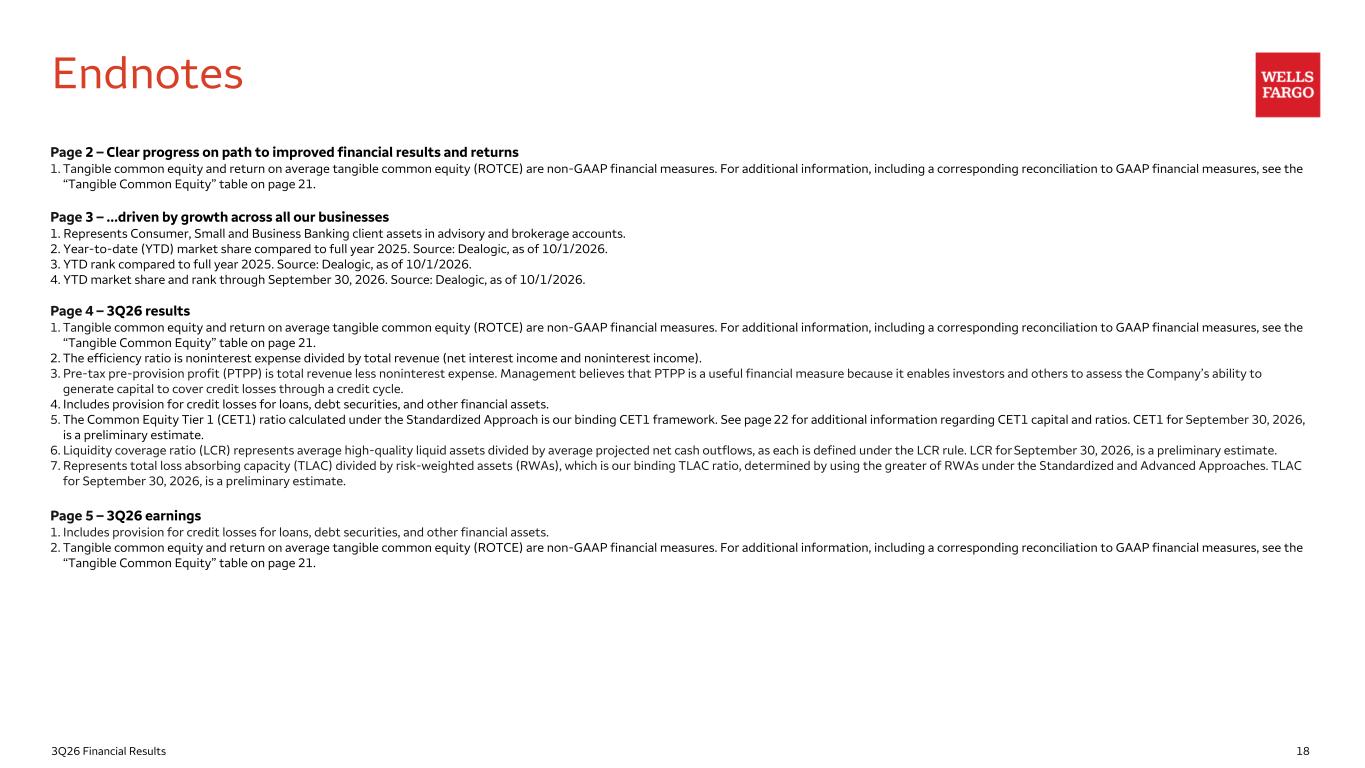
183Q26 Financial Results Endnotes Page 2 – Clear progress on path to improved financial results and returns 1. Tangible common equity and return on average tangible common equity (ROTCE) are non-GAAP financial measures. For additional information, including a corresponding reconciliation to GAAP financial measures, see the “Tangible Common Equity” table on page 21. Page 3 – ...driven by growth across all our businesses 1. Represents Consumer, Small and Business Banking client assets in advisory and brokerage accounts. 2. Year-to-date (YTD) market share compared to full year 2025. Source: Dealogic, as of 10/1/2026. 3. YTD rank compared to full year 2025. Source: Dealogic, as of 10/1/2026. 4. YTD market share and rank through September 30, 2026. Source: Dealogic, as of 10/1/2026. Page 4 – 3Q26 results 1. Tangible common equity and return on average tangible common equity (ROTCE) are non-GAAP financial measures. For additional information, including a corresponding reconciliation to GAAP financial measures, see the “Tangible Common Equity” table on page 21. 2. The efficiency ratio is noninterest expense divided by total revenue (net interest income and noninterest income). 3. Pre-tax pre-provision profit (PTPP) is total revenue less noninterest expense. Management believes that PTPP is a useful financial measure because it enables investors and others to assess the Company’s ability to generate capital to cover credit losses through a credit cycle. 4. Includes provision for credit losses for loans, debt securities, and other financial assets. 5. The Common Equity Tier 1 (CET1) ratio calculated under the Standardized Approach is our binding CET1 framework. See page 22 for additional information regarding CET1 capital and ratios. CET1 for September 30, 2026, is a preliminary estimate. 6. Liquidity coverage ratio (LCR) represents average high-quality liquid assets divided by average projected net cash outflows, as each is defined under the LCR rule. LCR for September 30, 2026, is a preliminary estimate. 7. Represents total loss absorbing capacity (TLAC) divided by risk-weighted assets (RWAs), which is our binding TLAC ratio, determined by using the greater of RWAs under the Standardized and Advanced Approaches. TLAC for September 30, 2026, is a preliminary estimate. Page 5 – 3Q26 earnings 1. Includes provision for credit losses for loans, debt securities, and other financial assets. 2. Tangible common equity and return on average tangible common equity (ROTCE) are non-GAAP financial measures. For additional information, including a corresponding reconciliation to GAAP financial measures, see the “Tangible Common Equity” table on page 21.
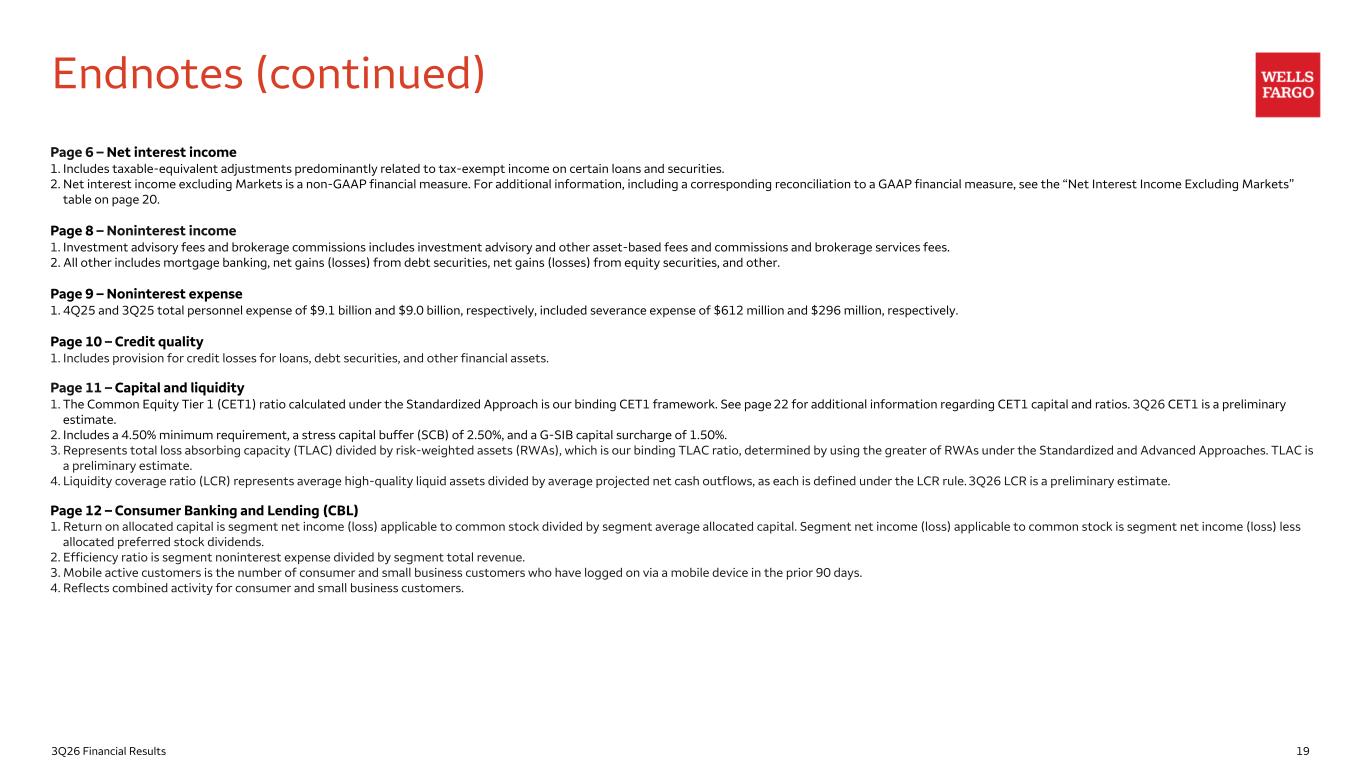
193Q26 Financial Results Page 6 – Net interest income 1. Includes taxable-equivalent adjustments predominantly related to tax-exempt income on certain loans and securities. 2. Net interest income excluding Markets is a non-GAAP financial measure. For additional information, including a corresponding reconciliation to a GAAP financial measure, see the “Net Interest Income Excluding Markets” table on page 20. Page 8 – Noninterest income 1. Investment advisory fees and brokerage commissions includes investment advisory and other asset-based fees and commissions and brokerage services fees. 2. All other includes mortgage banking, net gains (losses) from debt securities, net gains (losses) from equity securities, and other. Page 9 – Noninterest expense 1. 4Q25 and 3Q25 total personnel expense of $9.1 billion and $9.0 billion, respectively, included severance expense of $612 million and $296 million, respectively. Page 10 – Credit quality 1. Includes provision for credit losses for loans, debt securities, and other financial assets. Page 11 – Capital and liquidity 1. The Common Equity Tier 1 (CET1) ratio calculated under the Standardized Approach is our binding CET1 framework. See page 22 for additional information regarding CET1 capital and ratios. 3Q26 CET1 is a preliminary estimate. 2. Includes a 4.50% minimum requirement, a stress capital buffer (SCB) of 2.50%, and a G-SIB capital surcharge of 1.50%. 3. Represents total loss absorbing capacity (TLAC) divided by risk-weighted assets (RWAs), which is our binding TLAC ratio, determined by using the greater of RWAs under the Standardized and Advanced Approaches. TLAC is a preliminary estimate. 4. Liquidity coverage ratio (LCR) represents average high-quality liquid assets divided by average projected net cash outflows, as each is defined under the LCR rule. 3Q26 LCR is a preliminary estimate. Page 12 – Consumer Banking and Lending (CBL) 1. Return on allocated capital is segment net income (loss) applicable to common stock divided by segment average allocated capital. Segment net income (loss) applicable to common stock is segment net income (loss) less allocated preferred stock dividends. 2. Efficiency ratio is segment noninterest expense divided by segment total revenue. 3. Mobile active customers is the number of consumer and small business customers who have logged on via a mobile device in the prior 90 days. 4. Reflects combined activity for consumer and small business customers. Endnotes (continued)
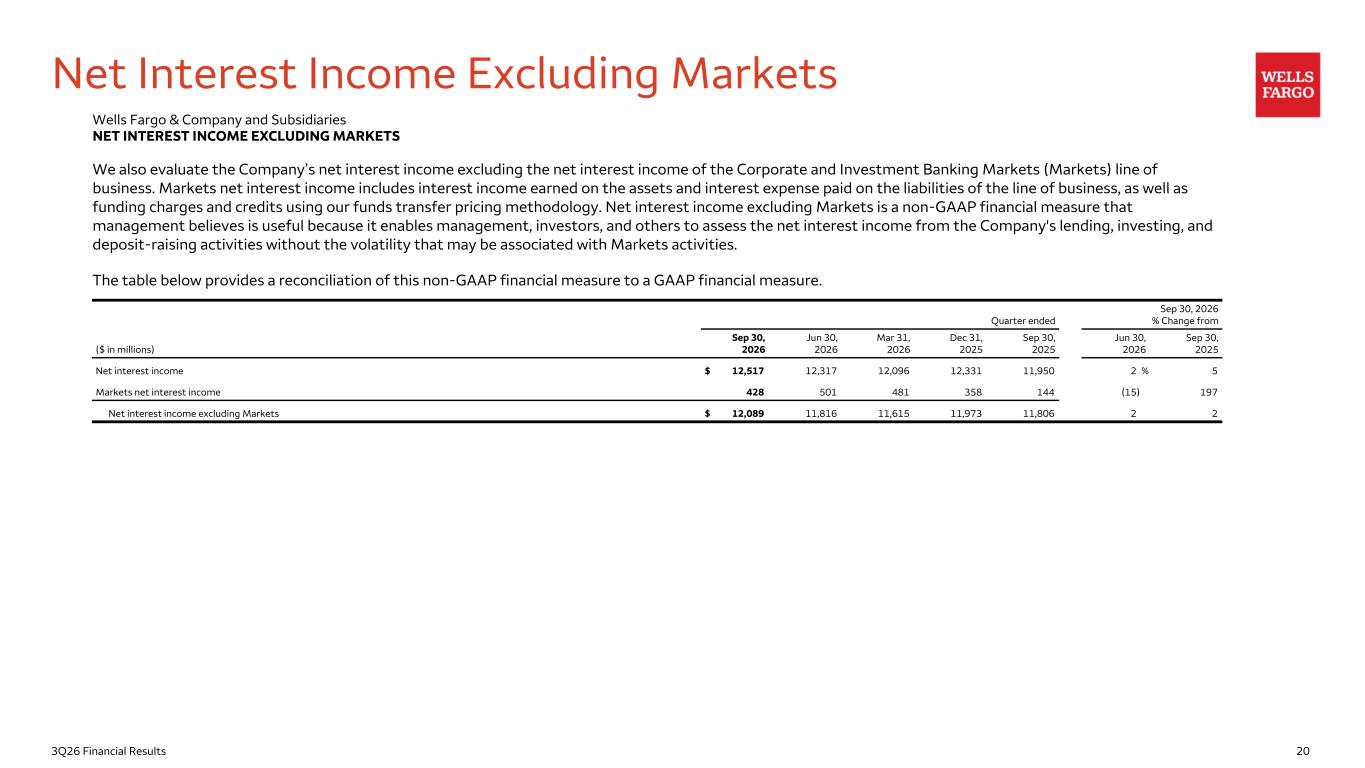
203Q26 Financial Results Net Interest Income Excluding Markets Quarter ended Sep 30, 2026 % Change from ($ in millions) Sep 30, 2026 Jun 30, 2026 Mar 31, 2026 Dec 31, 2025 Sep 30, 2025 Jun 30, 2026 Sep 30, 2025 Net interest income $ 12,517 12,317 12,096 12,331 11,950 2 % 5 Markets net interest income 428 501 481 358 144 (15) 197 Net interest income excluding Markets $ 12,089 11,816 11,615 11,973 11,806 2 2 Wells Fargo & Company and Subsidiaries NET INTEREST INCOME EXCLUDING MARKETS We also evaluate the Company’s net interest income excluding the net interest income of the Corporate and Investment Banking Markets (Markets) line of business. Markets net interest income includes interest income earned on the assets and interest expense paid on the liabilities of the line of business, as well as funding charges and credits using our funds transfer pricing methodology. Net interest income excluding Markets is a non-GAAP financial measure that management believes is useful because it enables management, investors, and others to assess the net interest income from the Company's lending, investing, and deposit-raising activities without the volatility that may be associated with Markets activities. The table below provides a reconciliation of this non-GAAP financial measure to a GAAP financial measure.
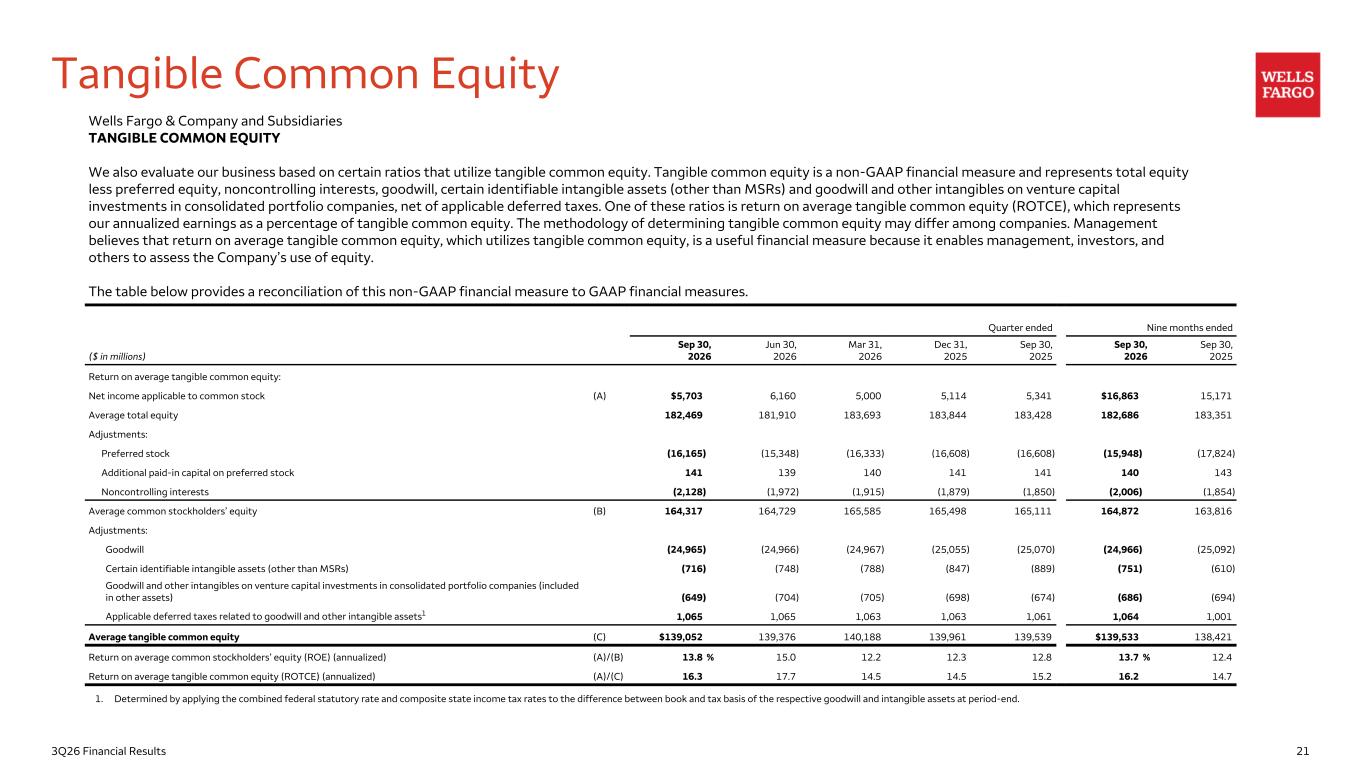
213Q26 Financial Results Tangible Common Equity Wells Fargo & Company and Subsidiaries TANGIBLE COMMON EQUITY We also evaluate our business based on certain ratios that utilize tangible common equity. Tangible common equity is a non-GAAP financial measure and represents total equity less preferred equity, noncontrolling interests, goodwill, certain identifiable intangible assets (other than MSRs) and goodwill and other intangibles on venture capital investments in consolidated portfolio companies, net of applicable deferred taxes. One of these ratios is return on average tangible common equity (ROTCE), which represents our annualized earnings as a percentage of tangible common equity. The methodology of determining tangible common equity may differ among companies. Management believes that return on average tangible common equity, which utilizes tangible common equity, is a useful financial measure because it enables management, investors, and others to assess the Company’s use of equity. The table below provides a reconciliation of this non-GAAP financial measure to GAAP financial measures. Quarter ended Nine months ended ($ in millions) Sep 30, 2026 Jun 30, 2026 Mar 31, 2026 Dec 31, 2025 Sep 30, 2025 Sep 30, 2026 Sep 30, 2025 Return on average tangible common equity: Net income applicable to common stock (A) $5,703 6,160 5,000 5,114 5,341 $16,863 15,171 Average total equity 182,469 181,910 183,693 183,844 183,428 182,686 183,351 Adjustments: Preferred stock (16,165) (15,348) (16,333) (16,608) (16,608) (15,948) (17,824) Additional paid-in capital on preferred stock 141 139 140 141 141 140 143 Noncontrolling interests (2,128) (1,972) (1,915) (1,879) (1,850) (2,006) (1,854) Average common stockholders’ equity (B) 164,317 164,729 165,585 165,498 165,111 164,872 163,816 Adjustments: Goodwill (24,965) (24,966) (24,967) (25,055) (25,070) (24,966) (25,092) Certain identifiable intangible assets (other than MSRs) (716) (748) (788) (847) (889) (751) (610) Goodwill and other intangibles on venture capital investments in consolidated portfolio companies (included in other assets) (649) (704) (705) (698) (674) (686) (694) Applicable deferred taxes related to goodwill and other intangible assets1 1,065 1,065 1,063 1,063 1,061 1,064 1,001 Average tangible common equity (C) $139,052 139,376 140,188 139,961 139,539 $139,533 138,421 Return on average common stockholders’ equity (ROE) (annualized) (A)/(B) 13.8 % 15.0 12.2 12.3 12.8 13.7 % 12.4 Return on average tangible common equity (ROTCE) (annualized) (A)/(C) 16.3 17.7 14.5 14.5 15.2 16.2 14.7 1. Determined by applying the combined federal statutory rate and composite state income tax rates to the difference between book and tax basis of the respective goodwill and intangible assets at period-end.
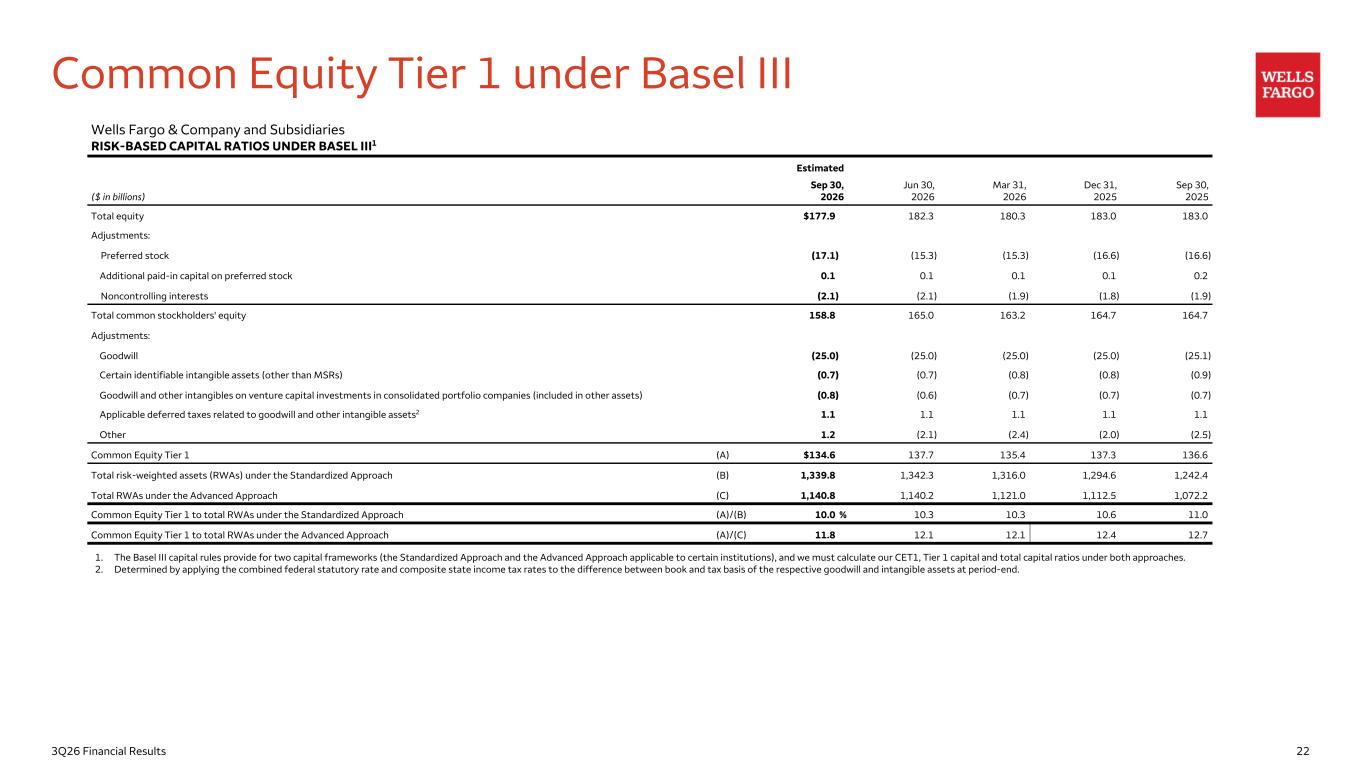
223Q26 Financial Results 1. The Basel III capital rules provide for two capital frameworks (the Standardized Approach and the Advanced Approach applicable to certain institutions), and we must calculate our CET1, Tier 1 capital and total capital ratios under both approaches. 2. Determined by applying the combined federal statutory rate and composite state income tax rates to the difference between book and tax basis of the respective goodwill and intangible assets at period-end. Common Equity Tier 1 under Basel III Wells Fargo & Company and Subsidiaries RISK-BASED CAPITAL RATIOS UNDER BASEL III1 Estimated ($ in billions) Sep 30, 2026 Jun 30, 2026 Mar 31, 2026 Dec 31, 2025 Sep 30, 2025 Total equity $177.9 182.3 180.3 183.0 183.0 Adjustments: Preferred stock (17.1) (15.3) (15.3) (16.6) (16.6) Additional paid-in capital on preferred stock 0.1 0.1 0.1 0.1 0.2 Noncontrolling interests (2.1) (2.1) (1.9) (1.8) (1.9) Total common stockholders' equity 158.8 165.0 163.2 164.7 164.7 Adjustments: Goodwill (25.0) (25.0) (25.0) (25.0) (25.1) Certain identifiable intangible assets (other than MSRs) (0.7) (0.7) (0.8) (0.8) (0.9) Goodwill and other intangibles on venture capital investments in consolidated portfolio companies (included in other assets) (0.8) (0.6) (0.7) (0.7) (0.7) Applicable deferred taxes related to goodwill and other intangible assets2 1.1 1.1 1.1 1.1 1.1 Other 1.2 (2.1) (2.4) (2.0) (2.5) Common Equity Tier 1 (A) $134.6 137.7 135.4 137.3 136.6 Total risk-weighted assets (RWAs) under the Standardized Approach (B) 1,339.8 1,342.3 1,316.0 1,294.6 1,242.4 Total RWAs under the Advanced Approach (C) 1,140.8 1,140.2 1,121.0 1,112.5 1,072.2 Common Equity Tier 1 to total RWAs under the Standardized Approach (A)/(B) 10.0 % 10.3 10.3 10.6 11.0 Common Equity Tier 1 to total RWAs under the Advanced Approach (A)/(C) 11.8 12.1 12.1 12.4 12.7
233Q26 Financial Results Disclaimer and forward-looking statements Financial results reported in this document are preliminary. Final financial results and other disclosures will be reported in our Quarterly Report on Form 10-Q for the quarter ended September 30, 2026, and may differ materially from the results and disclosures in this document due to, among other things, the completion of final review procedures, the occurrence of subsequent events, or the discovery of additional information. This document contains forward-looking statements. In addition, we may make forward-looking statements in our other documents filed or furnished with the Securities and Exchange Commission, and our management may make forward-looking statements orally to analysts, investors, representatives of the media and others. Forward-looking statements can be identified by words such as “anticipates,” “intends,” “plans,” “seeks,” “believes,” “estimates,” “expects,” “target,” “projects,” “outlook,” “forecast,” “will,” “may,” “could,” “should,” “can” and similar references to future periods. In particular, forward-looking statements include, but are not limited to, statements we make about: (i) the future operating or financial performance of the Company or any of its businesses, including our outlook for future growth; (ii) our expectations regarding noninterest expense and our efficiency ratio; (iii) future credit quality and performance, including our expectations regarding future loan losses, our allowance for credit losses, and the economic scenarios considered to develop the allowance; (iv) our expectations regarding net interest income and net interest margin; (v) loan growth or the reduction or mitigation of risk in our loan portfolios; (vi) future capital or liquidity levels, ratios or targets; (vii) the expected outcome and impact of legal, regulatory and legislative developments, as well as our expectations regarding compliance therewith; (viii) future common stock dividends, common share repurchases and other uses of capital; (ix) our targeted range for return on assets, return on equity, and return on tangible common equity; (x) expectations regarding our effective income tax rate; (xi) the outcome of contingencies, such as legal actions; (xii) sustainability and governance related goals or commitments; and (xiii) the Company’s plans, objectives and strategies. Forward-looking statements are not based on historical facts but instead represent our current expectations and assumptions regarding our business, the economy and other future conditions. Investors are urged to not unduly rely on forward-looking statements as actual results may differ materially from expectations. Forward-looking statements speak only as of the date made, and we do not undertake to update them to reflect changes or events that occur after that date. For additional information about factors that could cause actual results to differ materially from our expectations, refer to the “Forward-Looking Statements” discussion in Wells Fargo’s press release announcing our third quarter 2026 results and in our most recent Quarterly Report on Form 10-Q, as well as to Wells Fargo’s other reports filed with the Securities and Exchange Commission, including the discussion under “Risk Factors” in our Annual Report on Form 10-K for the year ended December 31, 2025.