northerntrust.com / © 2025 Northern Trust NORTHERN TRUST CORPORATION Third Quarter 2025 Quarterly Earnings Review

northerntrust.com / © 2025 Northern Trust 2 Over 135 years of strength, stability & stewardship Disciplined, client-centric strategy Highest standards of client service Product leadership & innovative services Solutions-focused technology & integrated operating platform

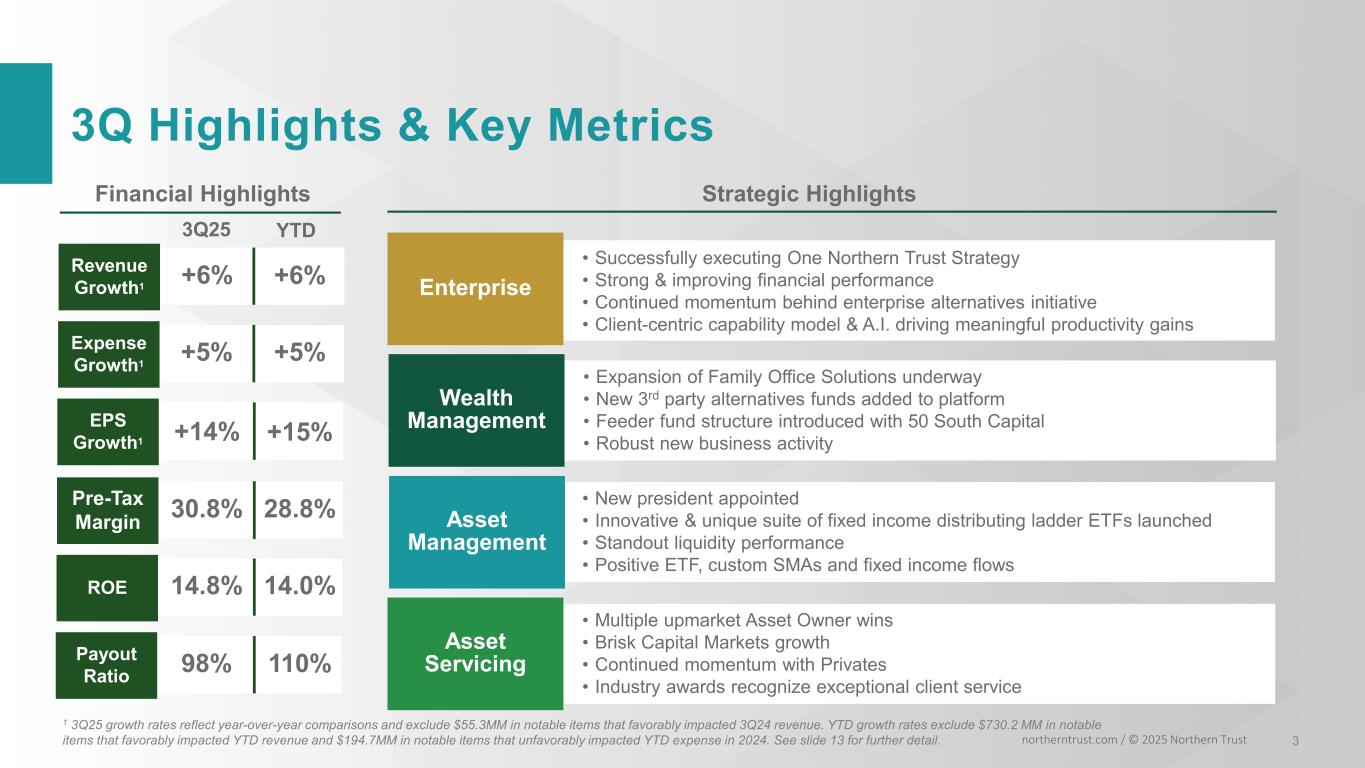
northerntrust.com / © 2025 Northern Trust 3Q25 3Q Highlights & Key Metrics 3 Revenue Growth1 • Multiple upmarket Asset Owner wins • Brisk Capital Markets growth • Continued momentum with Privates • Industry awards recognize exceptional client service Asset Servicing • New president appointed • Innovative & unique suite of fixed income distributing ladder ETFs launched • Standout liquidity performance • Positive ETF, custom SMAs and fixed income flows Asset Management • Expansion of Family Office Solutions underway • New 3rd party alternatives funds added to platform • Feeder fund structure introduced with 50 South Capital • Robust new business activity Wealth Management • Successfully executing One Northern Trust Strategy • Strong & improving financial performance • Continued momentum behind enterprise alternatives initiative • Client-centric capability model & A.I. driving meaningful productivity gains Enterprise Financial Highlights Strategic Highlights +6%+6% YTD Expense Growth1 +5% EPS Growth1 +15% +5% +14% 28.8%Pre-Tax Margin ROE 14.0% Payout Ratio 110% 30.8% 98% 14.8% 1 3Q25 growth rates reflect year-over-year comparisons and exclude $55.3MM in notable items that favorably impacted 3Q24 revenue. YTD growth rates exclude $730.2 MM in notable items that favorably impacted YTD revenue and $194.7MM in notable items that unfavorably impacted YTD expense in 2024. See slide 13 for further detail.

northerntrust.com / © 2023 Northern Trust 45 4 FINANCIAL HIGHLIGHTS

Financial Highlights & Key Metrics 5northerntrust.com / © 2025 Northern Trust RESULTS INCLUDE IMPACT OF NOTABLE ITEMS* $ in millions (except EPS and as noted) % CHANGE VS. 3Q 2025 2Q 2025 3Q 2024 Revenue (FTE¹) $ 2,030.9 1 % 3 % Noninterest Expense $ 1,422.9 — % 5 % Provision for Credit Losses (17.0) N/M N/M Net Income $ 457.6 9 % (2)% Diluted Earnings per Share $ 2.29 7 % 3 % Return on Average Common Equity² 14.8 % 14.2 % 15.4 % Profit Margin (Pre-tax)¹,² 30.8 % 28.4 % 30.8 % Expense to Trust Fee Ratio² 112 % 115 % 114 % Assets under Custody / Administration³ (AUC/A) (in billions) $ 18,247.6 1 % 5 % Assets under Custody³ (AUC) (in billions) $ 14,439.1 1 % 5 % Assets under Management³ (AUM) (in billions) $ 1,772.7 4 % 9 % Notable Items: 3Q24 Pre-tax Revenue Impacts: $55.3 million in Other Operating Income comprised of: • $68.1 million pre-tax gain related to the sale of an equity investment • ($12.8) million of mark-to- market activity on Visa Class B swaps related to litigation escrow funding¹ Revenue and profit margin (pre-tax) stated on a fully taxable equivalent (FTE) basis are non-GAAP financial measures. A reconciliation to reported revenue and reported profit margin (pre-tax) prepared in accordance with U.S. generally accepted accounting principles (GAAP) is included in the Appendix on page 12. ² Actual numbers for all periods, not % change. ³ Client assets for the current quarter are considered preliminary until the Form 10-Q is filed with the Securities and Exchange Commission. N/M - Not meaningful

northerntrust.com / © 2025 Northern Trust Wealth Management Highlights 6 % CHANGE VS. Key Indicators (in billions): 3Q 2025 2Q 2025 3Q 2024 Assets under Custody / Administration (AUC/A)1 $ 1,257.2 4 % 10 % Assets under Custody (AUC)1 $ 1,244.1 5 % 10 % Assets under Management (AUM)1 $ 492.6 5 % 11 % Average Deposits $ 25.4 — % 1 % Average Loans $ 36.1 2 % 5 % Wealth Management Trust, Investment and Other Servicing Fees ($ in millions) +5% +4% $539.3$546.7 $529.5 $541.9 $558.6 Categories may not sum due to rounding. 1 Client assets for the current quarter are considered preliminary until the Form 10-Q is filed with the Securities and Exchange Commission.

northerntrust.com / © 2025 Northern Trust +2% Asset Servicing Highlights 7Categories may not sum due to rounding. 1 Client assets for the current quarter are considered preliminary until the Form 10-Q is filed with the Securities and Exchange Commission. % CHANGE VS. Key Indicators (in billions): 3Q 2025 2Q 2025 3Q 2024 Assets under Custody / Administration (AUC/A)1 $ 16,990.4 1 % 4 % Assets under Custody (AUC)1 $ 13,195.0 1 % 4 % Assets under Management (AUM)1 $ 1,280.1 4 % 9 % Securities Lending Collateral $ 206.1 — % 17 % Average Deposits $ 90.2 (6)% 4 % Average Loans $ 5.4 (7)% (4)% Asset Servicing Trust, Investment and Other Servicing Fees ($ in millions) +6% $691.8 $671.9$675.5$667.1 $706.9

northerntrust.com / © 2025 Northern Trust $139.3 Net Interest Income and Balance Sheet Trends 8 Categories may not sum due to rounding. 1 Net interest income and net interest margin stated on an FTE basis are non-GAAP financial measures. A reconciliation of these measures to reported results prepared in accordance with U.S. GAAP is included in the Appendix on page 12. ² Other Earning Assets includes Interest-Bearing Due from and Deposits with Banks, Federal Funds Sold and Securities Purchased under Agreements to Resell, and Other Interest-Earning Assets. Average Earning Assets ($ in billions) Net Interest Income (FTE¹) ($ in millions) +3% (4)% +5% (3)% $133.7 $138.0$134.8 $145.8

Noninterest Expense 9northerntrust.com / © 2025 Northern TrustCategories may not sum due to rounding. Total Noninterest Expense ($ in millions) +5% —% Expense Highlights • Noninterest expense +4.7% year-over-year, flat relative to the prior period • Excluding the impact of currency, noninterest expense +4.4% year-over-year; flat relative to the prior period

Capital Update 10 Standardized T ier 1 Leverage northerntrust.com / © 2025 Northern Trust Capital Highlights • Robust capital and liquidity • $12.0 billion in Tier 1 capital • 63% of average deposits covered by highly liquid assets including 29% by cash and central bank deposits • Declared $154.3 million in common stock dividends and $16.2 million in preferred stock dividends in Q3 2025 • Repurchased $277.0 million of common stock in Q3 2025 • Net unrealized after-tax losses on available-for-sale securities of $436.9 million as of September 30, 2025 Northern Trust Corporation Capital Ratios 3Q 2025 CAPITAL RATIOS STANDARDIZED APPROACH ADVANCED APPROACH Common Equity T ier 1 Capital 12.4% 15.1% Tier 1 Capital 13.4% 16.2% Total Capital 15.1% 18.0% Tier 1 Leverage 8.0% 8.0% Supplementary Leverage N/A 8.9% Standardized Common Equity T ier 1 Capital ratios for the current quarter are considered preliminary until the Form 10-Q is filed with the Securities and Exchange Commission.

Appendix northerntrust.com / © 2025 Northern Trust

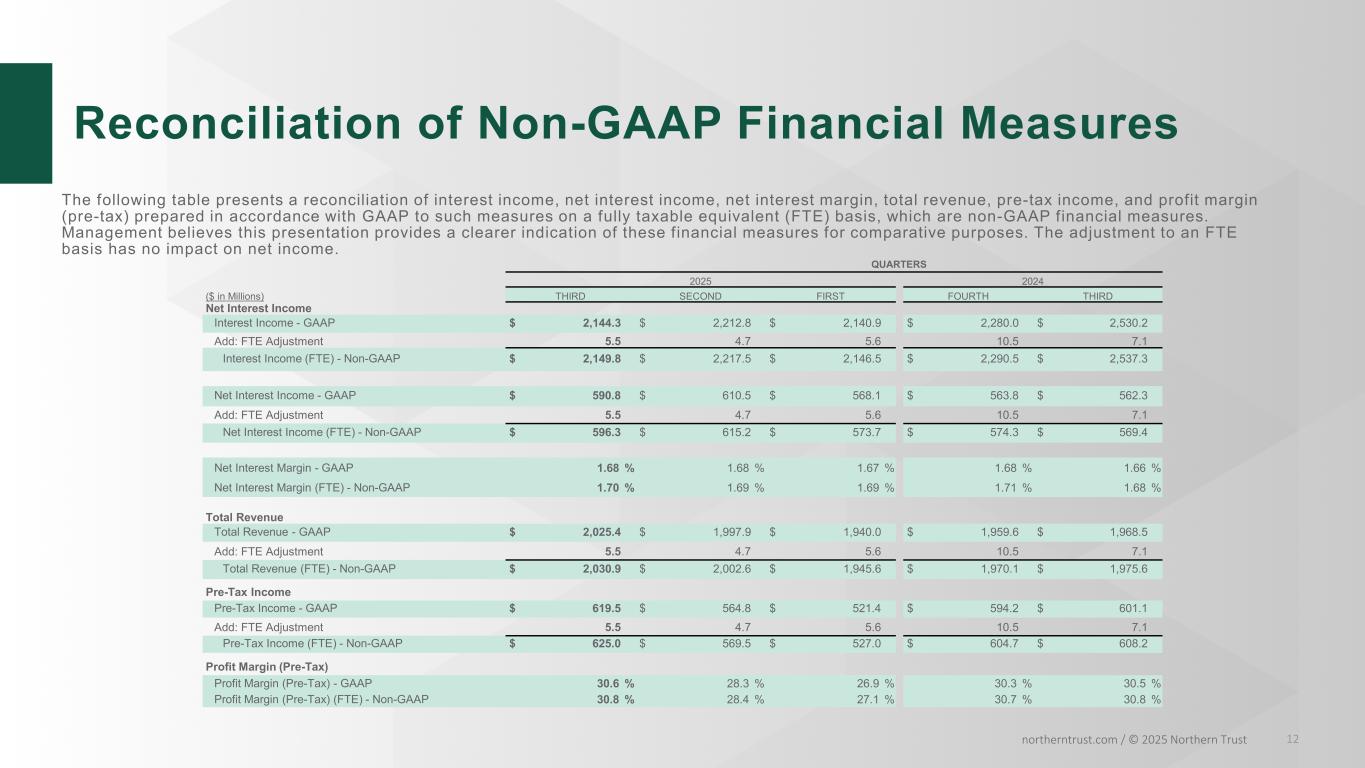
northerntrust.com / © 2025 Northern Trust Reconciliation of Non-GAAP Financial Measures 12 The following table presents a reconciliation of interest income, net interest income, net interest margin, total revenue, pre-tax income, and profit margin (pre-tax) prepared in accordance with GAAP to such measures on a fully taxable equivalent (FTE) basis, which are non-GAAP financial measures. Management believes this presentation provides a clearer indication of these financial measures for comparative purposes. The adjustment to an FTE basis has no impact on net income. QUARTERS 2025 2024 ($ in Millions) THIRD SECOND FIRST FOURTH THIRD Net Interest Income Interest Income - GAAP $ 2,144.3 $ 2,212.8 $ 2,140.9 $ 2,280.0 $ 2,530.2 Add: FTE Adjustment 5.5 4.7 5.6 10.5 7.1 Interest Income (FTE) - Non-GAAP $ 2,149.8 $ 2,217.5 $ 2,146.5 $ 2,290.5 $ 2,537.3 Net Interest Income - GAAP $ 590.8 $ 610.5 $ 568.1 $ 563.8 $ 562.3 Add: FTE Adjustment 5.5 4.7 5.6 10.5 7.1 Net Interest Income (FTE) - Non-GAAP $ 596.3 $ 615.2 $ 573.7 $ 574.3 $ 569.4 Net Interest Margin - GAAP 1.68 % 1.68 % 1.67 % 1.68 % 1.66 % Net Interest Margin (FTE) - Non-GAAP 1.70 % 1.69 % 1.69 % 1.71 % 1.68 % Total Revenue Total Revenue - GAAP $ 2,025.4 $ 1,997.9 $ 1,940.0 $ 1,959.6 $ 1,968.5 Add: FTE Adjustment 5.5 4.7 5.6 10.5 7.1 Total Revenue (FTE) - Non-GAAP $ 2,030.9 $ 2,002.6 $ 1,945.6 $ 1,970.1 $ 1,975.6 Pre-Tax Income Pre-Tax Income - GAAP $ 619.5 $ 564.8 $ 521.4 $ 594.2 $ 601.1 Add: FTE Adjustment 5.5 4.7 5.6 10.5 7.1 Pre-Tax Income (FTE) - Non-GAAP $ 625.0 $ 569.5 $ 527.0 $ 604.7 $ 608.2 Profit Margin (Pre-Tax) Profit Margin (Pre-Tax) - GAAP 30.6 % 28.3 % 26.9 % 30.3 % 30.5 % Profit Margin (Pre-Tax) (FTE) - Non-GAAP 30.8 % 28.4 % 27.1 % 30.7 % 30.8 %

northerntrust.com / © 2025 Northern Trust Notable Item Summary 13 QUARTERS 2024 2024 ($ in Millions) THIRD SECOND FIRST YTD Revenue Impacts, pre-tax Investment security loss $ (189.4) $ (189.4) Net gain related to Visa transaction 878.4 $ 878.4 Securities loss related to repositioning of supplemental pension plan (6.5) $ (6.5) Investment impairment (7.6) $ (7.6) Pre-tax gain related to the sale of an equity investment 68.1 $ 68.1 Mark-to-market activity on Visa Class B swaps related to litigation escrow funding (12.8) $ (12.8) Total Revenue Impacts, pre-tax $ 55.3 $ 864.3 $ (189.4) $ 730.2 Expense Impacts, pre-tax FDIC special assessment 12.5 $ 12.5 Severance-related charges 85.2 $ 85.2 Equipment & software accelerations and dispositions charge 16.4 $ 16.4 Contribution to Northern Trust Foundation 70.0 $ 70.0 Legal settlement charge 10.6 $ 10.6 Total Expense Impacts, pre-tax $ — $ 182.2 $ 12.5 $ 194.7

northerntrust.com / © 2025 Northern Trust Forward-looking Statements 14 This presentation may include statements which constitute “forward-looking statements” within the meaning of the safe harbor provisions of the Private Securities Litigation Reform Act of 1995. Forward-looking statements are identified typically by words or phrases such as “believe,” “expect,” “anticipate,” “intend,” “estimate,” “project,” “likely,” “plan,” “goal,” “target,” “strategy,” and similar expressions or future or conditional verbs such as “may,” “will,” “should,” “would,” and “could.” Forward-looking statements include statements, other than those related to historical facts, that relate to Northern Trust’s financial results and outlook, capital adequacy, dividend policy and share repurchase program, accounting estimates and assumptions, credit quality including allowance levels, future pension plan contributions, effective tax rate, anticipated expense levels, contingent liabilities, acquisitions, strategies, market and industry trends, and expectations regarding the impact of accounting pronouncements and legislation. These statements are based on Northern Trust’s current beliefs and expectations of future events or future results, and involve risks and uncertainties that are difficult to predict and subject to change. These statements are also based on assumptions about many important factors, including the factors discussed in Northern Trust’s most recent annual report on Form 10-K and other filings with the U.S. Securities and Exchange Commission, all of which are available on Northern Trust’s website. We caution you not to place undue reliance on any forward-looking statement as actual results may differ materially from those expressed or implied by forward-looking statements. Northern Trust assumes no obligation to update its forward-looking statements. This presentation should be reviewed together with Northern Trust Corporation’s Third Quarter 2025 earnings press release.
